Embed Size (px)
Citation preview
In this chapter:
Chapter 1
UNITED NATIONS E-GOVERNMENT SURVEY 2014
1.1. Introduction 13
1.2. Progress at a glance 14
1.2.1. Highlights of 2014 e-government rankings 15
1.2.2. National income and e-government development 19
1.3. Regional development 20
1.3.1. Africa 21
1.3.2. Americas 23
1.3.3. Asia 27
1.3.4. Europe 31
1.3.5. Oceania 36
1.4. Country groups 37
1.4.1. Small Island Developing States (SIDS) 37
1.4.2. Landlocked Developing Countries (LLDCs) 40
1.4.3. Least Developed Countries (LDCs) 42
1.5. Conclusion 44
World e-government rankings1.1. IntroductionIt has been over a decade since the United Nations started assessing the global e-government development through the initiative1 “Benchmarking E-government: Assessing the United Nations Member States” in 2001. Since then, there has been increasing evidence through public pol-icy formulation and implementation that e-government, among others, has played an effective enabling role in advancing national development. At the same time, the United Nations E-Government Survey has gained wide ac-ceptance as a global authoritative measure of how public administrations provide electronic and mobile public ser-vices. The biennial edition of the United Nations E-Gov-ernment Survey aims to exemplify successful e-govern-ment strategies, pioneering practices with a view towards administrative reform and sustainable development.
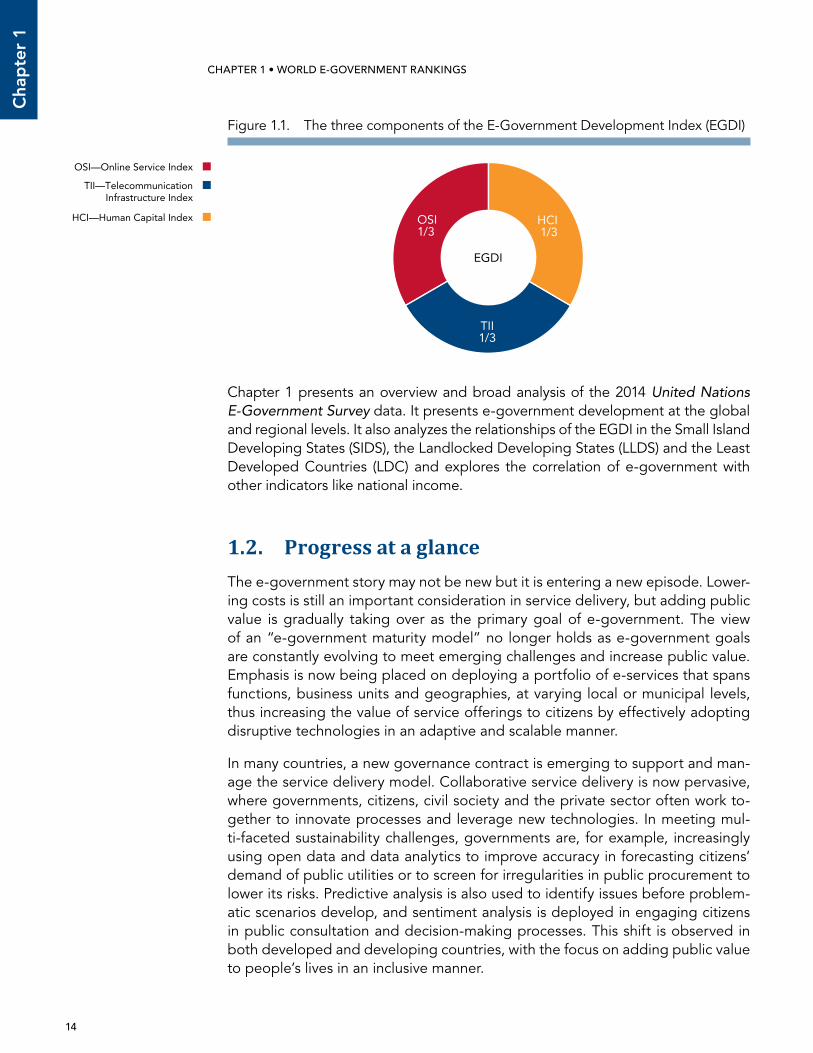
The conceptual framework of the E-Government Devel-opment Index (EGDI)2 remains unchanged since its incep-tion in 2001. Based on a holistic view of e-government de-velopment, the methodological framework has remained consistent across Survey periods, while at the same time its components are carefully adjusted to reflect evolving knowledge of best practices in e-government and chang-es in the underlying supporting ICT infrastructure, human capacity development and online service advancement, among other factors. The EGDI is a composite measure of three important dimensions of e-government, name-ly: provision of online services, telecommunication con-nectivity and human capacity, as illustrated in Figure 1.1. Each one of these sets of indices is in itself a composite measure that can be extracted and analyzed indepen-dently (see section on Survey Methodology). The global e-government ranking, as derived from the EGDI, is not designed to capture e-government development in an absolute sense; rather, it aims to give a performance rat-ing of national governments relative to one another.
14
Cha
pte
r 1
CHAPTER 1 • WORLD E-GOVERNMENT RANKINGS UNITED NATIONS E-GOVERNMENT SURVEY 2014
Chapter 1 presents an overview and broad analysis of the 2014 United Nations E-Government Survey data. It presents e-government development at the global and regional levels. It also analyzes the relationships of the EGDI in the Small Island Developing States (SIDS), the Landlocked Developing States (LLDS) and the Least Developed Countries (LDC) and explores the correlation of e-government with other indicators like national income.
1.2. Progress at a glanceThe e-government story may not be new but it is entering a new episode. Lower-ing costs is still an important consideration in service delivery, but adding public value is gradually taking over as the primary goal of e-government. The view of an “e-government maturity model” no longer holds as e-government goals are constantly evolving to meet emerging challenges and increase public value. Emphasis is now being placed on deploying a portfolio of e-services that spans functions, business units and geographies, at varying local or municipal levels, thus increasing the value of service offerings to citizens by effectively adopting disruptive technologies in an adaptive and scalable manner.
In many countries, a new governance contract is emerging to support and man-age the service delivery model. Collaborative service delivery is now pervasive, where governments, citizens, civil society and the private sector often work to-gether to innovate processes and leverage new technologies. In meeting mul-ti-faceted sustainability challenges, governments are, for example, increasingly using open data and data analytics to improve accuracy in forecasting citizens’ demand of public utilities or to screen for irregularities in public procurement to lower its risks. Predictive analysis is also used to identify issues before problem-atic scenarios develop, and sentiment analysis is deployed in engaging citizens in public consultation and decision-making processes. This shift is observed in both developed and developing countries, with the focus on adding public value to people’s lives in an inclusive manner.
Figure 1.1. The three components of the E-Government Development Index (EGDI)
OSI1/3
TII1/3
HCI1/3
EGDI
OSI—Online Service Index
TII—TelecommunicationInfrastructure Index
HCI—Human Capital Index
15
Chap
ter 1
UNITED NATIONS E-GOVERNMENT SURVEY 2014
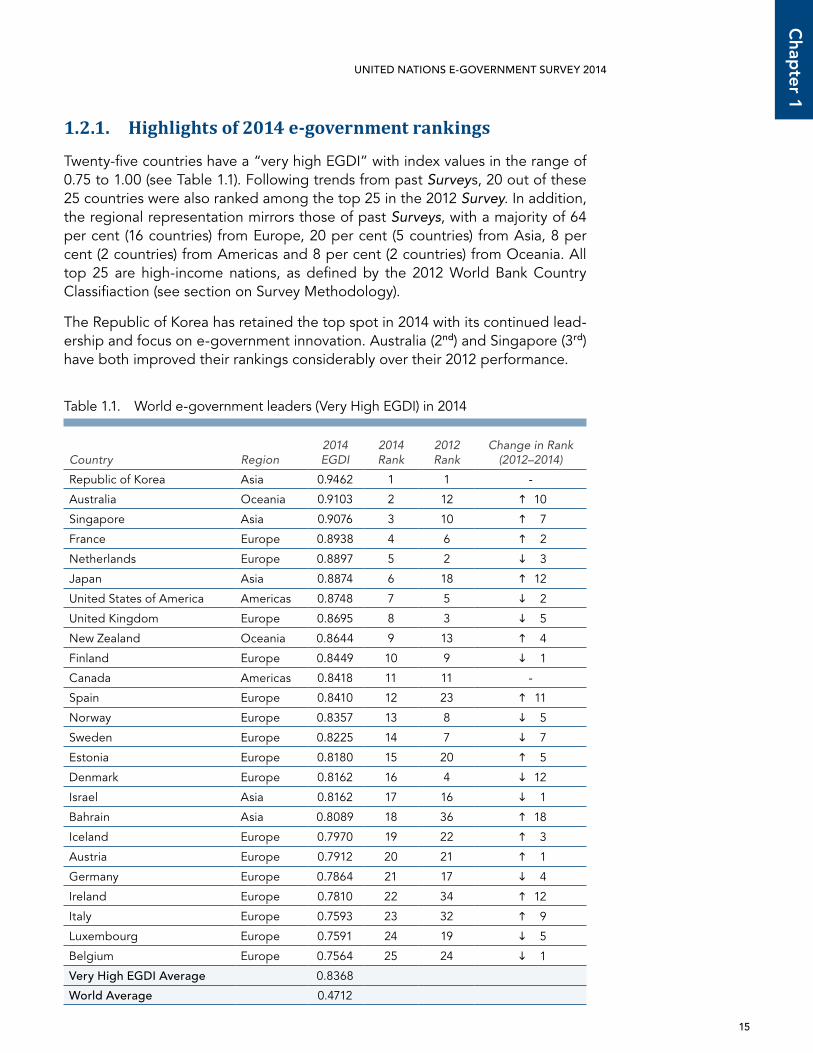
1.2.1. Highlights of 2014 e-government rankings
Twenty-five countries have a “very high EGDI” with index values in the range of 0.75 to 1.00 (see Table 1.1). Following trends from past Surveys, 20 out of these 25 countries were also ranked among the top 25 in the 2012 Survey. In addition, the regional representation mirrors those of past Surveys, with a majority of 64 per cent (16 countries) from Europe, 20 per cent (5 countries) from Asia, 8 per cent (2 countries) from Americas and 8 per cent (2 countries) from Oceania. All top 25 are high-income nations, as defined by the 2012 World Bank Country Classifiaction (see section on Survey Methodology).
The Republic of Korea has retained the top spot in 2014 with its continued lead-ership and focus on e-government innovation. Australia (2nd) and Singapore (3rd) have both improved their rankings considerably over their 2012 performance.
Table 1.1. World e-government leaders (Very High EGDI) in 2014
Country Region2014 EGDI
2014 Rank
2012 Rank
Change in Rank (2012–2014)
Republic of Korea Asia 0.9462 1 1 -
Australia Oceania 0.9103 2 12 10
Singapore Asia 0.9076 3 10 7
France Europe 0.8938 4 6 2
Netherlands Europe 0.8897 5 2 3
Japan Asia 0.8874 6 18 12
United States of America Americas 0.8748 7 5 2
United Kingdom Europe 0.8695 8 3 5
New Zealand Oceania 0.8644 9 13 4
Finland Europe 0.8449 10 9 1
Canada Americas 0.8418 11 11 -
Spain Europe 0.8410 12 23 11
Norway Europe 0.8357 13 8 5
Sweden Europe 0.8225 14 7 7
Estonia Europe 0.8180 15 20 5
Denmark Europe 0.8162 16 4 12
Israel Asia 0.8162 17 16 1
Bahrain Asia 0.8089 18 36 18
Iceland Europe 0.7970 19 22 3
Austria Europe 0.7912 20 21 1
Germany Europe 0.7864 21 17 4
Ireland Europe 0.7810 22 34 12
Italy Europe 0.7593 23 32 9
Luxembourg Europe 0.7591 24 19 5
Belgium Europe 0.7564 25 24 1
Very High EGDI Average 0.8368
world Average 0.4712
16
Cha
pte
r 1
CHAPTER 1 • WORLD E-GOVERNMENT RANKINGS UNITED NATIONS E-GOVERNMENT SURVEY 2014
With an average of 0.8368, the top 25 countries are far ahead of the rest of the world (world average of 0.4721). One of the primary factors contributing to a high level of e-government development is concurrent past and present investment in telecommunication, human capital and provision of online services.
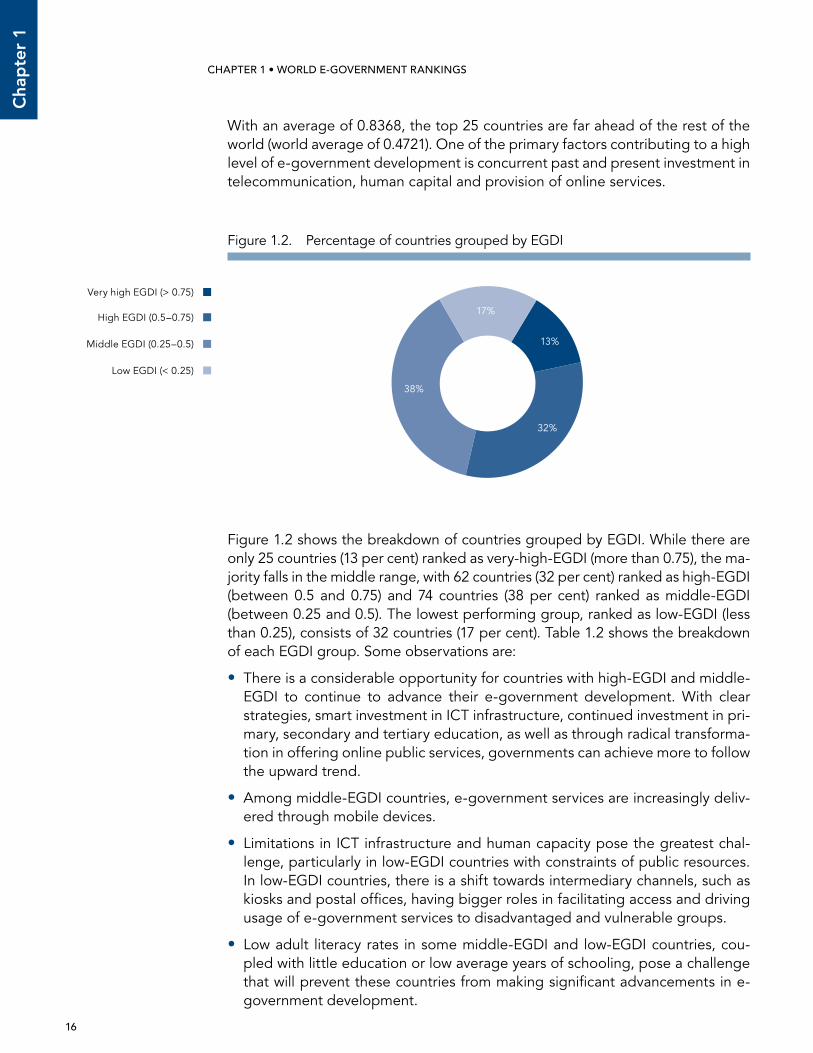
Figure 1.2. Percentage of countries grouped by EGDI
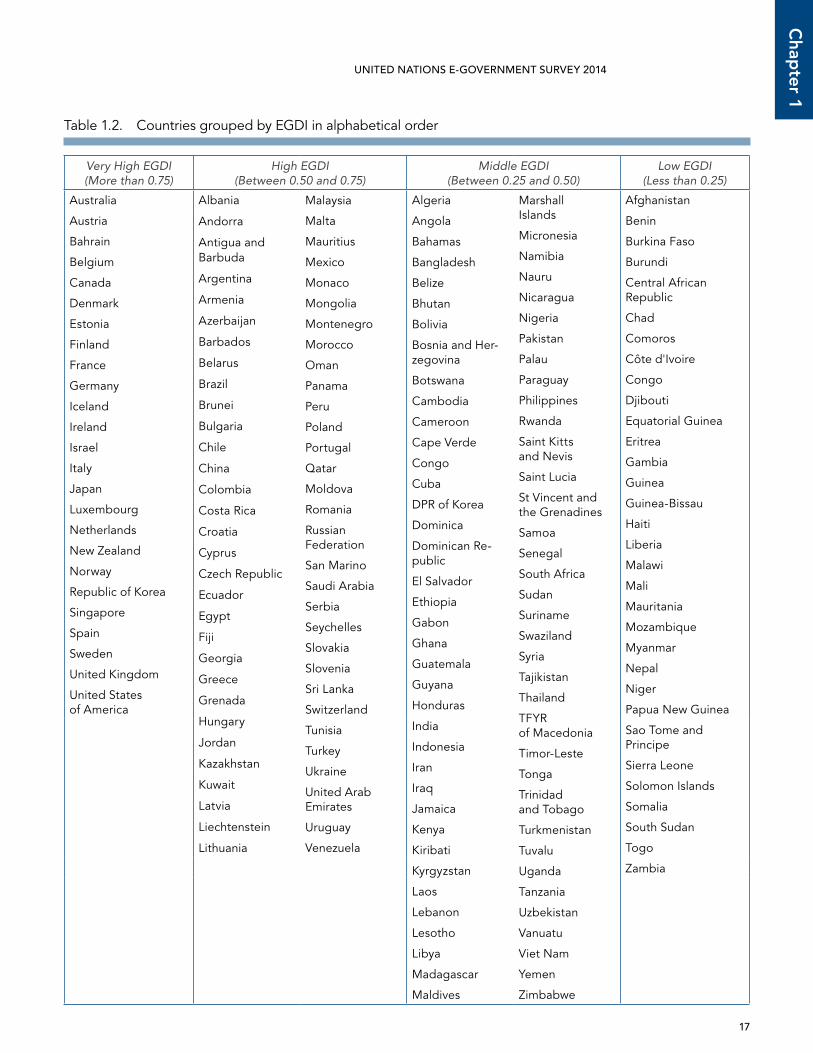
Figure 1.2 shows the breakdown of countries grouped by EGDI. While there are only 25 countries (13 per cent) ranked as very-high-EGDI (more than 0.75), the ma-jority falls in the middle range, with 62 countries (32 per cent) ranked as high-EGDI (between 0.5 and 0.75) and 74 countries (38 per cent) ranked as middle-EGDI (between 0.25 and 0.5). The lowest performing group, ranked as low-EGDI (less than 0.25), consists of 32 countries (17 per cent). Table 1.2 shows the breakdown of each EGDI group. Some observations are:
• There is a considerable opportunity for countries with high-EGDI and middle-EGDI to continue to advance their e-government development. With clear strategies, smart investment in ICT infrastructure, continued investment in pri-mary, secondary and tertiary education, as well as through radical transforma-tion in offering online public services, governments can achieve more to follow the upward trend.
• Among middle-EGDI countries, e-government services are increasingly deliv-ered through mobile devices.
• Limitations in ICT infrastructure and human capacity pose the greatest chal-lenge, particularly in low-EGDI countries with constraints of public resources. In low-EGDI countries, there is a shift towards intermediary channels, such as kiosks and postal offices, having bigger roles in facilitating access and driving usage of e-government services to disadvantaged and vulnerable groups.
• Low adult literacy rates in some middle-EGDI and low-EGDI countries, cou-pled with little education or low average years of schooling, pose a challenge that will prevent these countries from making significant advancements in e-government development.
Very high EGDI (> 0.75)
17%
13%
32%
38%
High EGDI (0.5–0.75)
Middle EGDI (0.25–0.5)
Low EGDI (< 0.25)
17
Chap
ter 1
UNITED NATIONS E-GOVERNMENT SURVEY 2014
Table 1.2. Countries grouped by EGDI in alphabetical order
Very High EGDI (More than 0.75)
High EGDI (Between 0.50 and 0.75)
Middle EGDI (Between 0.25 and 0.50)
Low EGDI (Less than 0.25)
Australia
Austria
Bahrain
Belgium
Canada
Denmark
Estonia
Finland
France
Germany
Iceland
Ireland
Israel
Italy
Japan
Luxembourg
Netherlands
New Zealand
Norway
Republic of Korea
Singapore
Spain
Sweden
United Kingdom
United States of America
Albania
Andorra
Antigua and Barbuda
Argentina
Armenia
Azerbaijan
Barbados
Belarus
Brazil
Brunei
Bulgaria
Chile
China
Colombia
Costa Rica
Croatia
Cyprus
Czech Republic
Ecuador
Egypt
Fiji
Georgia
Greece
Grenada
Hungary
Jordan
Kazakhstan
Kuwait
Latvia
Liechtenstein
Lithuania
Malaysia
Malta
Mauritius
Mexico
Monaco
Mongolia
Montenegro
Morocco
Oman
Panama
Peru
Poland
Portugal
Qatar
Moldova
Romania
Russian Federation
San Marino
Saudi Arabia
Serbia
Seychelles
Slovakia
Slovenia
Sri Lanka
Switzerland
Tunisia
Turkey
Ukraine
United Arab Emirates
Uruguay
Venezuela
Algeria
Angola
Bahamas
Bangladesh
Belize
Bhutan
Bolivia
Bosnia and Her-zegovina
Botswana
Cambodia
Cameroon
Cape Verde
Congo
Cuba
DPR of Korea
Dominica
Dominican Re-public
El Salvador
Ethiopia
Gabon
Ghana
Guatemala
Guyana
Honduras
India
Indonesia
Iran
Iraq
Jamaica
Kenya
Kiribati
Kyrgyzstan
Laos
Lebanon
Lesotho
Libya
Madagascar
Maldives
Marshall Islands
Micronesia
Namibia
Nauru
Nicaragua
Nigeria
Pakistan
Palau
Paraguay
Philippines
Rwanda
Saint Kitts and Nevis
Saint Lucia
St Vincent and the Grenadines
Samoa
Senegal
South Africa
Sudan
Suriname
Swaziland
Syria
Tajikistan
Thailand
TFYR of Macedonia
Timor-Leste
Tonga
Trinidad and Tobago
Turkmenistan
Tuvalu
Uganda
Tanzania
Uzbekistan
Vanuatu
Viet Nam
Yemen
Zimbabwe
Afghanistan
Benin
Burkina Faso
Burundi
Central African Republic
Chad
Comoros
Côte d'Ivoire
Congo
Djibouti
Equatorial Guinea
Eritrea
Gambia
Guinea
Guinea-Bissau
Haiti
Liberia
Malawi
Mali
Mauritania
Mozambique
Myanmar
Nepal
Niger
Papua New Guinea
Sao Tome and Principe
Sierra Leone
Solomon Islands
Somalia
South Sudan
Togo
Zambia
18
Cha
pte
r 1
CHAPTER 1 • WORLD E-GOVERNMENT RANKINGS UNITED NATIONS E-GOVERNMENT SURVEY 2014
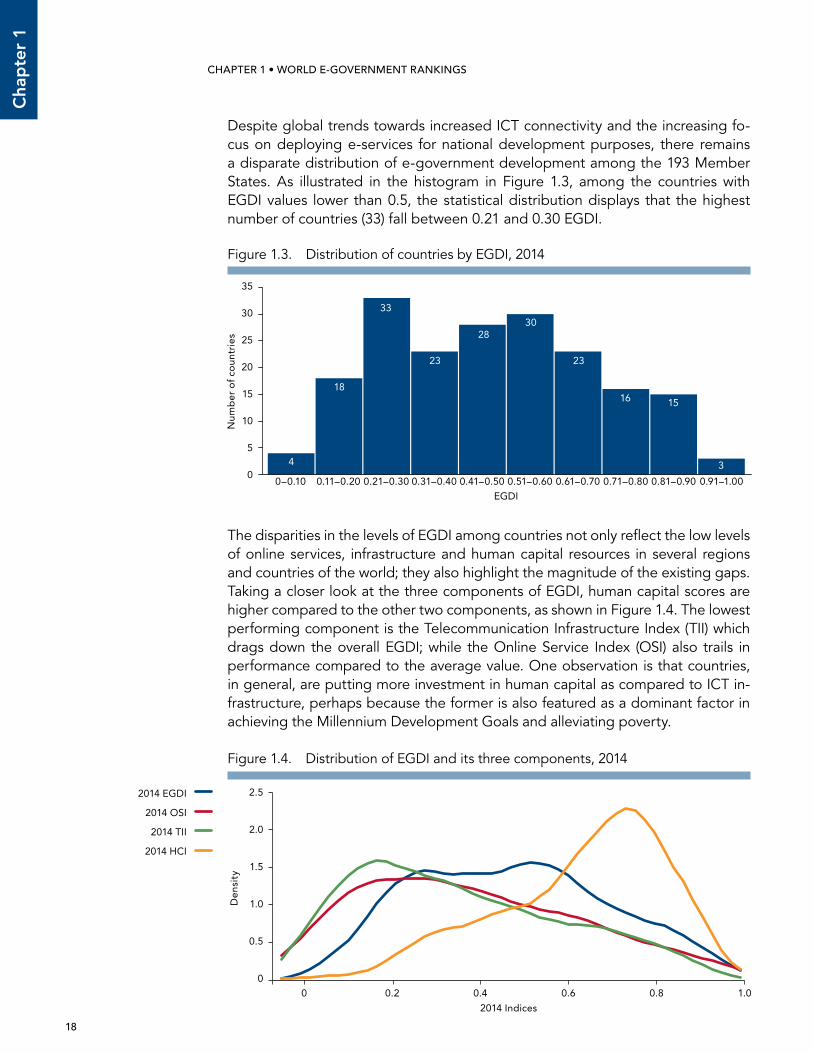
Despite global trends towards increased ICT connectivity and the increasing fo-cus on deploying e-services for national development purposes, there remains a disparate distribution of e-government development among the 193 Member States. As illustrated in the histogram in Figure 1.3, among the countries with EGDI values lower than 0.5, the statistical distribution displays that the highest number of countries (33) fall between 0.21 and 0.30 EGDI.
The disparities in the levels of EGDI among countries not only reflect the low levels of online services, infrastructure and human capital resources in several regions and countries of the world; they also highlight the magnitude of the existing gaps. Taking a closer look at the three components of EGDI, human capital scores are higher compared to the other two components, as shown in Figure 1.4. The lowest performing component is the Telecommunication Infrastructure Index (TII) which drags down the overall EGDI; while the Online Service Index (OSI) also trails in performance compared to the average value. One observation is that countries, in general, are putting more investment in human capital as compared to ICT in-frastructure, perhaps because the former is also featured as a dominant factor in achieving the Millennium Development Goals and alleviating poverty.
–0.2
0.0
0.2
0.4
0.6
0.8
1.0
1.2
2014 Ind
exe
s
Countries sorted by EGDI in ascending order
OSI 2014
TII 2014
HCI 2014
EGDI 2014
Linear (OSI 2014)
Linear (TII 2014)
Linear (HCI 2014)
Linear (EGDI 2014)
0 0.2 0.4 0.6 0.8 1.00
0.5
1.0
1.5
2.0
2.5
2014 Indices
Den
sity
2014 EGDI
2014 OSI
2014 TII
2014 HCI
Figure 1.4. Distribution of EGDI and its three components, 2014
Figure 1.3. Distribution of countries by EGDI, 2014
0
5
10
15
20
25
30
35
Num
ber
of
coun
trie
s
0.91–1.000.81–0.900.71–0.800.61–0.700.51–0.600.41–0.500.31–0.400.21–0.300.11–0.200–0.10
4
18
33
23
2830
23
16 15
3
EGDI
19
Chap
ter 1
UNITED NATIONS E-GOVERNMENT SURVEY 2014
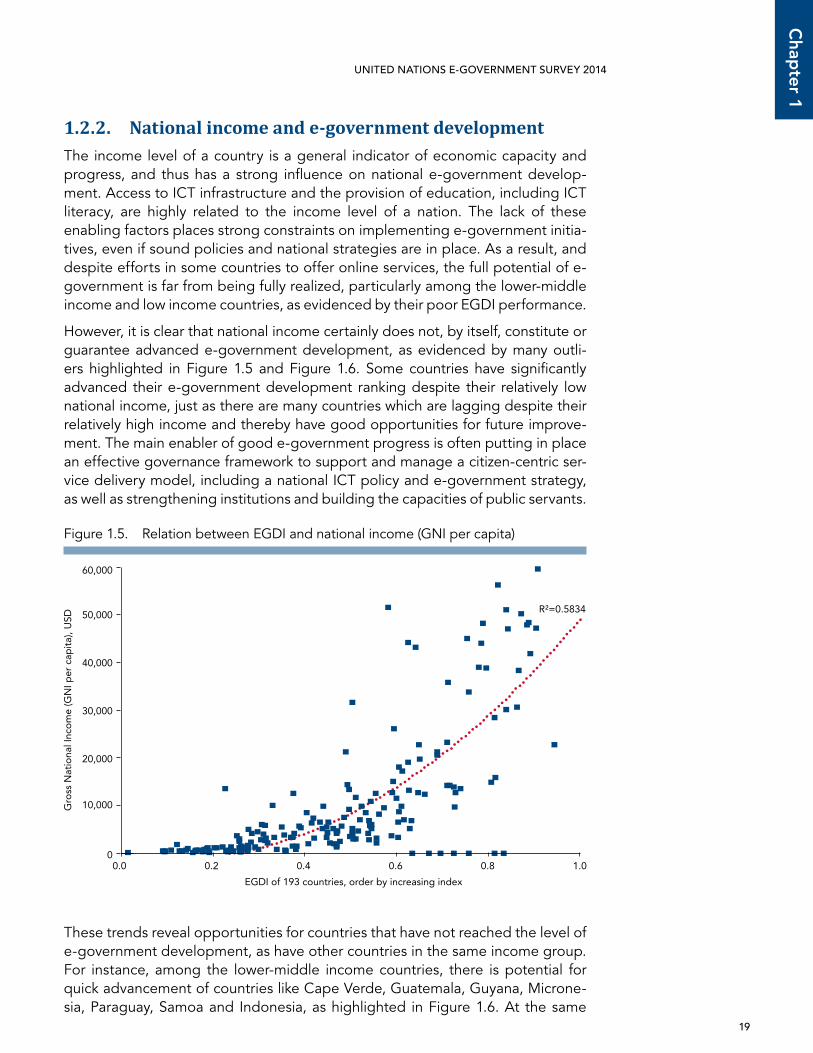
1.2.2. National income and e-government developmentThe income level of a country is a general indicator of economic capacity and progress, and thus has a strong influence on national e-government develop-ment. Access to ICT infrastructure and the provision of education, including ICT literacy, are highly related to the income level of a nation. The lack of these enabling factors places strong constraints on implementing e-government initia-tives, even if sound policies and national strategies are in place. As a result, and despite efforts in some countries to offer online services, the full potential of e-government is far from being fully realized, particularly among the lower-middle income and low income countries, as evidenced by their poor EGDI performance.
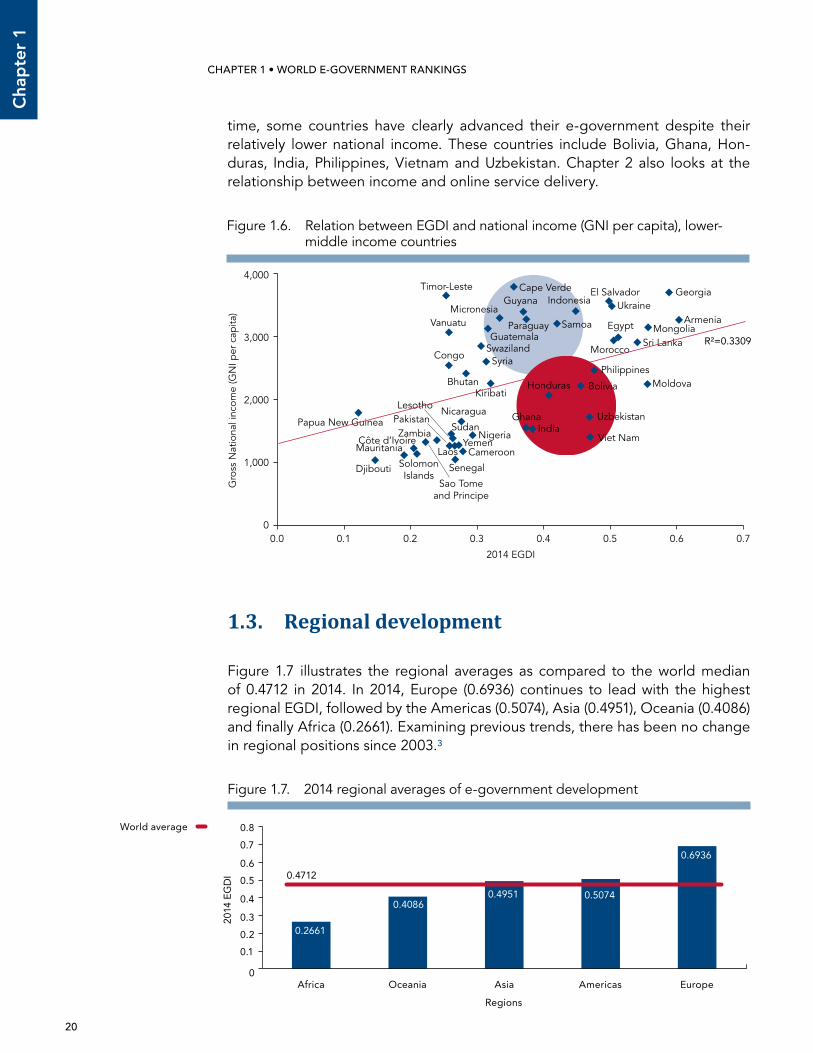
However, it is clear that national income certainly does not, by itself, constitute or guarantee advanced e-government development, as evidenced by many outli-ers highlighted in Figure 1.5 and Figure 1.6. Some countries have significantly advanced their e-government development ranking despite their relatively low national income, just as there are many countries which are lagging despite their relatively high income and thereby have good opportunities for future improve-ment. The main enabler of good e-government progress is often putting in place an effective governance framework to support and manage a citizen-centric ser-vice delivery model, including a national ICT policy and e-government strategy, as well as strengthening institutions and building the capacities of public servants.
These trends reveal opportunities for countries that have not reached the level of e-government development, as have other countries in the same income group. For instance, among the lower-middle income countries, there is potential for quick advancement of countries like Cape Verde, Guatemala, Guyana, Microne-sia, Paraguay, Samoa and Indonesia, as highlighted in Figure 1.6. At the same
0.0 0.2 0.4 0.6 0.8 1.00
20,000
40,000
50,000
60,000
Gro
ss N
atio
nal I
nco
me
(GN
I per
cap
ita)
, USD
EGDI of 193 countries, order by increasing index
30,000
10,000
R²=0.5834
Figure 1.5. Relation between EGDI and national income (GNI per capita)
20
Cha
pte
r 1
CHAPTER 1 • WORLD E-GOVERNMENT RANKINGS UNITED NATIONS E-GOVERNMENT SURVEY 2014
time, some countries have clearly advanced their e-government despite their relatively lower national income. These countries include Bolivia, Ghana, Hon-duras, India, Philippines, Vietnam and Uzbekistan. Chapter 2 also looks at the relationship between income and online service delivery.
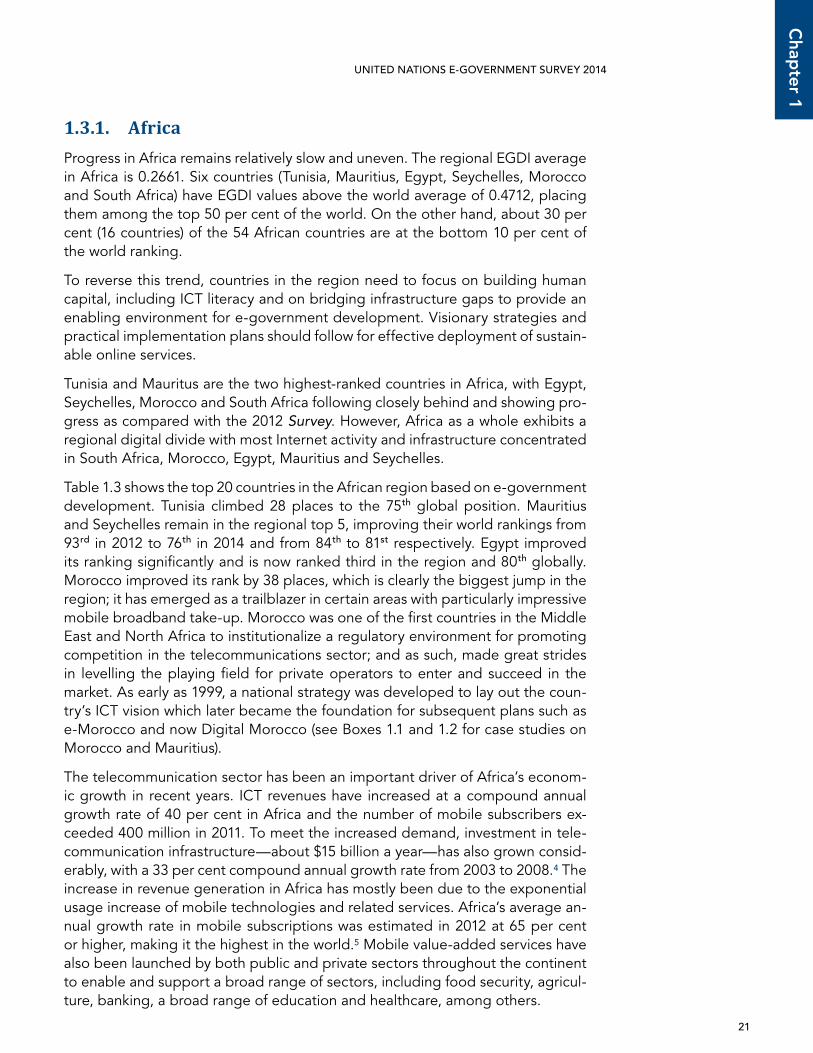
1.3. Regional development
Figure 1.7 illustrates the regional averages as compared to the world median of 0.4712 in 2014. In 2014, Europe (0.6936) continues to lead with the highest regional EGDI, followed by the Americas (0.5074), Asia (0.4951), Oceania (0.4086) and finally Africa (0.2661). Examining previous trends, there has been no change in regional positions since 2003.3
Figure 1.6. Relation between EGDI and national income (GNI per capita), lower-middle income countries
0.2661
0.40860.4951 0.5074
0.6936
0
0.1
0.2
0.4
0.5
0.6
0.7
Africa Oceania Asia Americas Europe
2014
EG
DI
Regions
0.3
0.8
0.4712
World average
Figure 1.7. 2014 regional averages of e-government development
0.0 0.1 0.2 0.3 0.4 0.5 0.6 0.70
1,000
2,000
3,000
4,000
2014 EGDI
Gro
ss N
atio
nal i
ncom
e (G
NI p
er c
apita
)
Georgia
ArmeniaMongolia
Moldova
Sri Lanka
Egypt
Morocco
UkraineEl Salvador
Philippines
Uzbekistan
Viet Nam
Bolivia
Indonesia
Samoa
Honduras
India
Paraguay
Ghana
GuyanaCape Verde
Micronesia
Guatemala
Kiribati
SyriaSwaziland
Nigeria
Bhutan
Cameroon
Nicaragua
Yemen
Senegal
Laos
Lesotho
SudanPakistan
Vanuatu
Congo
Timor-Leste
Zambia
Sao Tomeand Principe
SolomonIslands
Côte d’IvoireMauritania
Djibouti
Papua New Guinea
R²=0.3309
21
Chap
ter 1
UNITED NATIONS E-GOVERNMENT SURVEY 2014
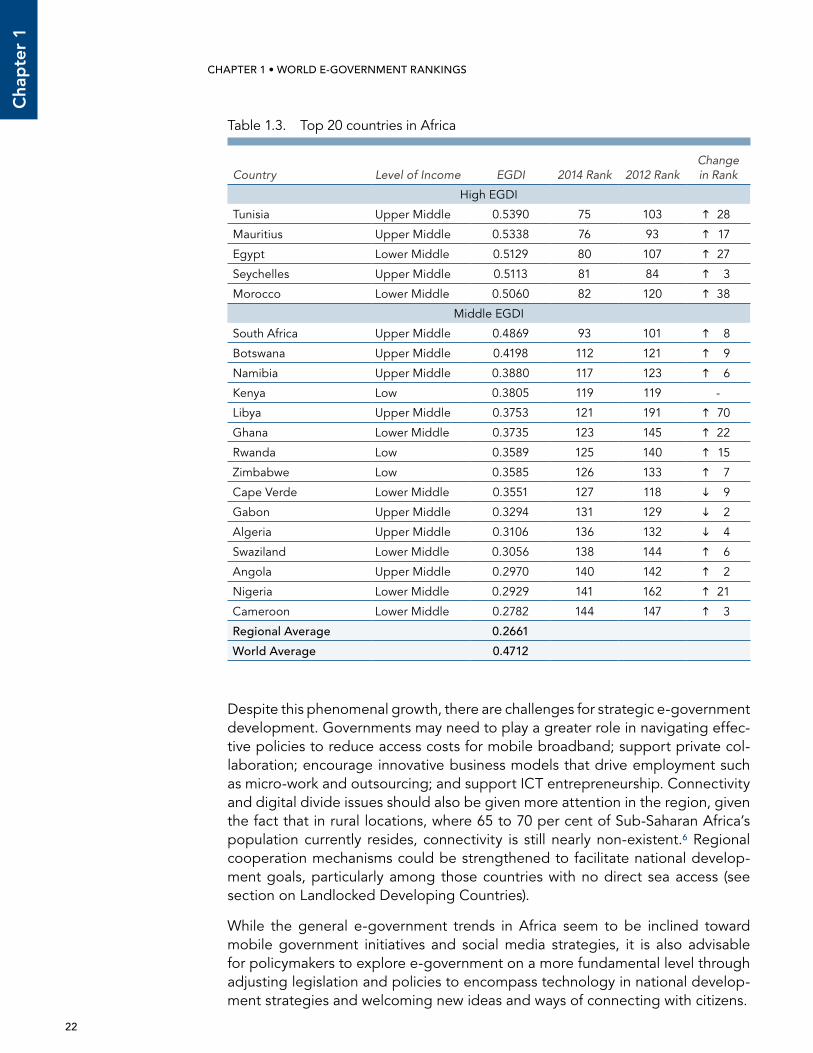
1.3.1. AfricaProgress in Africa remains relatively slow and uneven. The regional EGDI average in Africa is 0.2661. Six countries (Tunisia, Mauritius, Egypt, Seychelles, Morocco and South Africa) have EGDI values above the world average of 0.4712, placing them among the top 50 per cent of the world. On the other hand, about 30 per cent (16 countries) of the 54 African countries are at the bottom 10 per cent of the world ranking.
To reverse this trend, countries in the region need to focus on building human capital, including ICT literacy and on bridging infrastructure gaps to provide an enabling environment for e-government development. Visionary strategies and practical implementation plans should follow for effective deployment of sustain-able online services.
Tunisia and Mauritus are the two highest-ranked countries in Africa, with Egypt, Seychelles, Morocco and South Africa following closely behind and showing pro-gress as compared with the 2012 Survey. However, Africa as a whole exhibits a regional digital divide with most Internet activity and infrastructure concentrated in South Africa, Morocco, Egypt, Mauritius and Seychelles.
Table 1.3 shows the top 20 countries in the African region based on e-government development. Tunisia climbed 28 places to the 75th global position. Mauritius and Seychelles remain in the regional top 5, improving their world rankings from 93rd in 2012 to 76th in 2014 and from 84th to 81st respectively. Egypt improved its ranking significantly and is now ranked third in the region and 80th globally. Morocco improved its rank by 38 places, which is clearly the biggest jump in the region; it has emerged as a trailblazer in certain areas with particularly impressive mobile broadband take-up. Morocco was one of the first countries in the Middle East and North Africa to institutionalize a regulatory environment for promoting competition in the telecommunications sector; and as such, made great strides in levelling the playing field for private operators to enter and succeed in the market. As early as 1999, a national strategy was developed to lay out the coun-try’s ICT vision which later became the foundation for subsequent plans such as e-Morocco and now Digital Morocco (see Boxes 1.1 and 1.2 for case studies on Morocco and Mauritius).
The telecommunication sector has been an important driver of Africa’s econom-ic growth in recent years. ICT revenues have increased at a compound annual growth rate of 40 per cent in Africa and the number of mobile subscribers ex-ceeded 400 million in 2011. To meet the increased demand, investment in tele-communication infrastructure—about $15 billion a year—has also grown consid-erably, with a 33 per cent compound annual growth rate from 2003 to 2008.4 The increase in revenue generation in Africa has mostly been due to the exponential usage increase of mobile technologies and related services. Africa’s average an-nual growth rate in mobile subscriptions was estimated in 2012 at 65 per cent or higher, making it the highest in the world.5 Mobile value-added services have also been launched by both public and private sectors throughout the continent to enable and support a broad range of sectors, including food security, agricul-ture, banking, a broad range of education and healthcare, among others.
22
Cha
pte
r 1
CHAPTER 1 • WORLD E-GOVERNMENT RANKINGS UNITED NATIONS E-GOVERNMENT SURVEY 2014
Despite this phenomenal growth, there are challenges for strategic e-government development. Governments may need to play a greater role in navigating effec-tive policies to reduce access costs for mobile broadband; support private col-laboration; encourage innovative business models that drive employment such as micro-work and outsourcing; and support ICT entrepreneurship. Connectivity and digital divide issues should also be given more attention in the region, given the fact that in rural locations, where 65 to 70 per cent of Sub-Saharan Africa’s population currently resides, connectivity is still nearly non-existent.6 Regional cooperation mechanisms could be strengthened to facilitate national develop-ment goals, particularly among those countries with no direct sea access (see section on Landlocked Developing Countries).
While the general e-government trends in Africa seem to be inclined toward mobile government initiatives and social media strategies, it is also advisable for policymakers to explore e-government on a more fundamental level through adjusting legislation and policies to encompass technology in national develop-ment strategies and welcoming new ideas and ways of connecting with citizens.
Table 1.3. Top 20 countries in Africa
Country Level of Income EGDI 2014 Rank 2012 RankChange in Rank
High EGDI
Tunisia Upper Middle 0.5390 75 103 28
Mauritius Upper Middle 0.5338 76 93 17
Egypt Lower Middle 0.5129 80 107 27
Seychelles Upper Middle 0.5113 81 84 3
Morocco Lower Middle 0.5060 82 120 38
Middle EGDI
South Africa Upper Middle 0.4869 93 101 8
Botswana Upper Middle 0.4198 112 121 9
Namibia Upper Middle 0.3880 117 123 6
Kenya Low 0.3805 119 119 -
Libya Upper Middle 0.3753 121 191 70
Ghana Lower Middle 0.3735 123 145 22
Rwanda Low 0.3589 125 140 15
Zimbabwe Low 0.3585 126 133 7
Cape Verde Lower Middle 0.3551 127 118 9
Gabon Upper Middle 0.3294 131 129 2
Algeria Upper Middle 0.3106 136 132 4
Swaziland Lower Middle 0.3056 138 144 6
Angola Upper Middle 0.2970 140 142 2
Nigeria Lower Middle 0.2929 141 162 21
Cameroon Lower Middle 0.2782 144 147 3
Regional Average 0.2661
world Average 0.4712
23
Chap
ter 1
UNITED NATIONS E-GOVERNMENT SURVEY 2014
1.3.2. Americas
The top performing countries in the Americas region are the United States and Canada, both of which are also among the world leaders. Table 1.4 displays the top 20 countries in the Americas region. As in the recent past, the regional EGDI for the Americas is above the world average score, with most of its countries concentrated in the first 100 positions of the ranking. Central American and Car-ibbean countries are still located in the lower half of the ranking, however, reflect-ing the clear divide between these subregions and the rest of the Americas (see also Box 1.8 in the Small Island Developing States section.)
Since 2012, the United States of America has taken important steps to drive tech-nology towards sustainable growth and quality jobs through policies that support
box 1.1. case study on citizen consultation in Morocco
Morocco’s regional leadership can be attributed to its comprehensive gov-ernment portal. As part of the government’s effort to bring state of the art e-services to its citizens and include them in the decision making process, the government developed an e-consultation platform through the website of the Secrétariat Général du Gouvernement, where citizens can access legislative texts online, read and download them and post their comments and concerns. In this way, the government presents to its citizens a transparent, inclusive and easy channel through which they can share their concerns and make their voic-es heard; hence enriching democratic governance processes in the country.
The government also presents its responses to citizens’ comments and pro-vides feedback; showing that they track the concerns and remarks of citizens, take them into consideration and deliver a response.
Source: http://www.sgg.gov.ma
box 1.2. case study on the Small Island Developing State of Mauritius
The government of Mauritius has put effort into developing their online portal and their telecommunication infrastructure. Their website www.gov.mu offers citizens an exhaustive list of e-services segmented by target persons (139 ser-vices), by domain (59 services), by ministry (53 services), by department (13 services) and parastatally (14 services).
Even though Mauritius is one of the Small Island Developing States with a small land area and population, its economy has developed since independence from a small-scale focus based on agriculture, to a diversified middle-income economy. This increased the government’s potential to invest in infrastructure, communications and education, which raised the Human Capital Index of Mau-ritius and in turn raised its ranking in the regional EGDI.
The government portal also offers citizens a platform for e-participation through chat rooms, a media library, blogs and discussion forums.
Sources: http://www.gov.mu/English/Pages/Media.aspx, https://www.gov.mu/English/E-Services/Pages/default.aspx
24
Cha
pte
r 1
CHAPTER 1 • WORLD E-GOVERNMENT RANKINGS UNITED NATIONS E-GOVERNMENT SURVEY 2014
innovation and education. It has also customized its digital agenda to fit the new tendencies and needs of its citizens, such as cloud computing, smart mobile de-vices, tablets and high speed networks. Uruguay, widely recognized as the country in the South with the largest per capita export of software,7 has demonstrated great progress in EGDI and its components between 2012 and 2014, with online services increasing by 55 per cent and telecommunication infrastructure improv-ing by 27 per cent. Even though the country is recognized by the high quality of its tertiary education system in the areas of technology and computing, its Human Capital Index has decreased by 10 per cent. Haiti is still at the bottom of the rank-ing, but is demonstrating some improvements. In 2012, the EGDI was 0.337 points lower than the world average, whilst in 2014 the country has slightly reduced the gap with a difference of 0.2903. Haiti has faced major difficulties in the past which hinder its development, including the major earthquake in 2010.
Table 1.4. Top 20 countries in the Americas
Country Level of Income EGDI 2014 Rank 2012 RankChange in Rank
Very High EGDI
United States of America High 0.8748 7 5 2
Canada High 0.8418 11 11 -
High EGDI
Uruguay High 0.7420 26 50 24
Chile High 0.7122 33 39 6
Argentina Upper Middle 0.6306 46 56 10
Colombia Upper Middle 0.6173 50 43 7
Costa Rica Upper Middle 0.6061 54 77 23
Brazil Upper Middle 0.6008 57 59 2
Barbados High 0.5933 59 44 15
Antigua and Barbuda High 0.5927 60 49 11
Mexico Upper Middle 0.5733 63 55 8
Venezuela (Bolivarian Republic of)
Upper Middle 0.5564 67 71 4
Peru Upper Middle 0.5435 72 82 10
Panama Upper Middle 0.5242 77 66 11
Grenada Upper Middle 0.5220 78 75 3
Ecuador Upper Middle 0.5053 83 102 19
Middle EGDI
El Salvador Lower Middle 0.4989 88 74 14
Saint Kitts and Nevis High 0.4980 90 81 9
Trinidad and Tobago High 0.4932 91 67 24
Bahamas High 0.4900 92 65 27
Regional Average 0.5074
world Average 0.4712
25
Chap
ter 1
UNITED NATIONS E-GOVERNMENT SURVEY 2014
Despite rapid improvement, South America, Central America and the Carib-bean face some challenges regarding their online service delivery. Firstly, the infrastructure gap and broadband quality at the national level constrain access to online service. Countries like Costa Rica, El Salvador, Honduras and Belize have their Telecom Infrastructure Index pulling down their overall EGDI values. Mexico’s TII is very low relative to its other components, a decrease which might be partially explained by the new subcomponent (wireless broadband) added to the index. In Mexico only 9.83 inhabitants out of 100 have wireless broadband subscriptions, compared to the world average of 23.57 subscriptions per 100 in-habitants. Second, a gap in complementary assets, like IT education or computer literacy, creates deficits in human resources, business management and research and development for the telecommunications sector. The Human Capital Index for North America is much higher than the HCI for all the other sub regions: Canada and the United States of America have an average Human Capital Index of 0.9170 while in the rest of the continent this index oscillates around 0.70.
In general, institutional weaknesses in the design of policies, the organization of programs and stakeholder coordination jeopardize the long term develop-ment of e-government practices. The countries with higher rankings have al-ready overcome the process of providing clarity about the institutional setting for e-Government. The Online Service Index of Central America (0.4006) is lower than the rest of the region, however, it is still higher than the world OSI average (0.3919).
Furthermore, the region, especially South America and the Caribbean, has shown vast improvement in most economic and social indicators since the debt crisis of the early 1980s. This progress echoed a significant improvement in the living conditions of the population. However, the region now faces uncertainties of sustainable growth while overcoming constraints that characterize its produc-tive structure.8 ICT, like other general purpose technologies before it, can help modernize and revitalize traditional productive activities. Thus, governments in the region are now paying greater attention to the concept of e-government and its benefits for national sustainable development.
New ICT networks and platforms being developed by both public and private sectors are dramatically changing business models and public service delivery. Countries in the region can now take advantage of the new and growing de-mand for ICT goods and services in the public and private sectors to leverage the consolidation and emergence of better governance. In South America and the Caribbean the total ICT goods imported during the period of 2010 to 2012 grew by 3 per cent, whilst these imports grew only by 1.9 per cent for the entire world.9 Faced with sustainability issues and fast growing markets, the region may leverage the ICT sectors to provide better solutions and efficient services. The government of Trinidad and Tobago, for instance, has introduced a new online portal to facilitate business and trade, transforming national industries, business-es dynamism and competitiveness.10
The e-government development in the region has also benefited from Small and Medium Enterprises (SMEs) that represent the majority of private enterprises, ac-counting for 99 per cent of businesses and employing 67 per cent of employees
26
Cha
pte
r 1
CHAPTER 1 • WORLD E-GOVERNMENT RANKINGS UNITED NATIONS E-GOVERNMENT SURVEY 2014
box 1.3. The potential of e-Government development in latin America
a) center for Innovation on e-Government Development in colombia
The Centre for Innovation on e-Government Development was established by the Government of Colombia together with UNDESA and UNDP in 2013. The Center promotes an e-government implementation framework that goes well beyond technology. It aims at the creation of a knowledge base, identification of trends and best practices in e-government to improve the performance of public institutions at international, regional, national and local levels. The pro-ject also aims at the development and promotion of a sustainable model to be extended to broad audiences, including innovation services not only as part of an institution, but also on the web through the virtual innovation centre.
b) Agency for e-Government development in Uruguay
The Agency for e-Government development of Uruguay promotes wide ac-cess to ICT; the acquisition of skills and knowledge to achieve greater social integration and better-equipped young people for the future; provides inno-vative solutions to improve services and quality of care that is given to soci-ety, simplifies procedures and processes; and provides user support regarding consultations and initiatives related to the areas of competence of the Agency. It also strengthens links with academia, civil society and international organiza-tions with similar purposes; issues and proposes policies, rules and standards; enhances the synergy between state and businesses; and promotes the devel-opment of national software.
The Uruguayan E-Government Platform has the general goal of enabling and promoting the development of e-government services in Uruguay. The plat-form, which follows a two-pronged approach, consists of an Interoperability Platform and a set of Crosscutting Services. It implements a service-oriented architecture, leveraging the Web Services technology, to expose, use and com-bine government functionality implemented by public agencies. The platform is a key enabler for developing a joined-up e-government approach in Uruguay.
Source: DPADM, http://www.unpan.org/
Source: http://www.agesic.gub.uy/innovaportal/v/1454/1/agesic/guia_de_uso_de_la_plataforma_de_ge_del_estado_uruguayo.html; http://agesic.gub.uy/innovaportal/v/387/1/agesic/areas_de_la_agen-cia.html
in 2013.11 E-procurement opens up new opportunities for micro and small busi-nesses, and provision of open government data can greatly facilitate urban ser-vices, as the Americas region has a fast growing population with large concentra-tions in urban areas. For example, Rio de Janeiro is developing an e-government and open data project to forecast natural disasters in the city and undertake surveillance in preparation for global events such as FIFA World Cup and Olym-pic Games.
Collectively as a region, benefits can be reaped through e-government to en-hance inclusion, transparency, accountability and cross-jurisdictional efficiency and contribute to its sustainable development (see Box 1.3).
27
Chap
ter 1
UNITED NATIONS E-GOVERNMENT SURVEY 2014
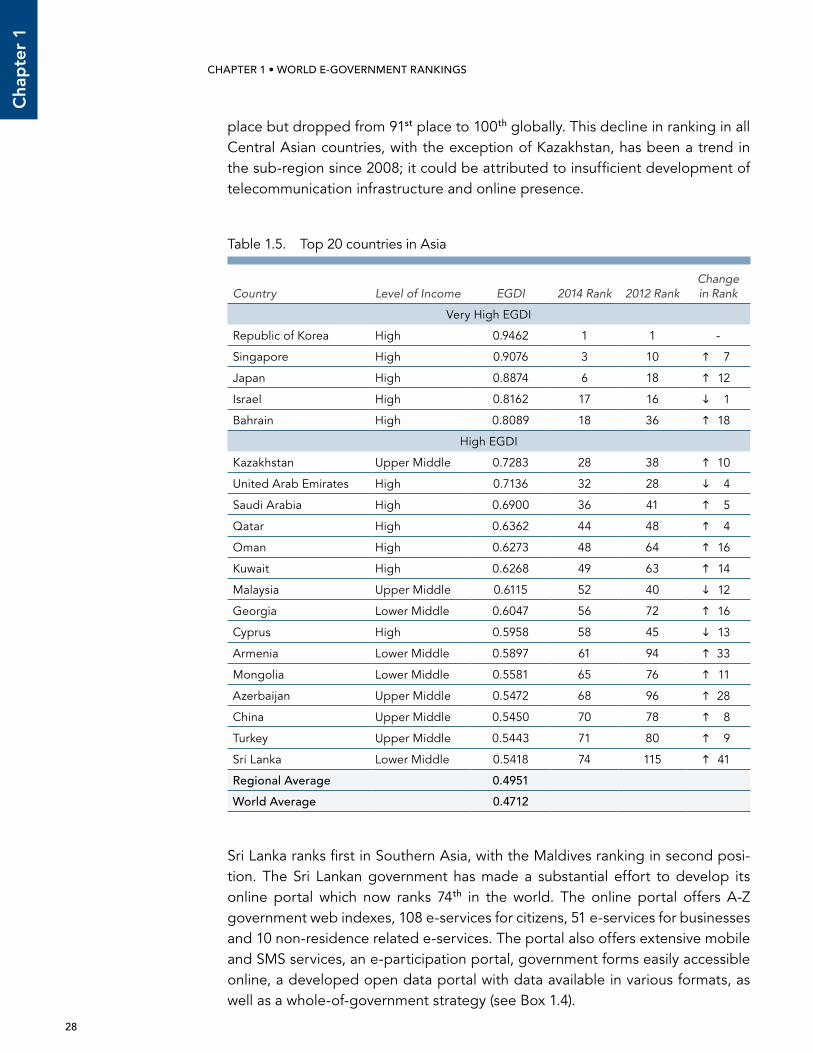
1.3.3. AsiaComprising 30 per cent of the world’s land area, with approximately 4.3 billion people, Asia is the largest continent and the most populous. With such diversity, the countries in Asia also exhibit varying levels of online presence and develop-ment; with the Republic of Korea leading the world ranking at number one in the 2014 Survey, and other countries like Afghanistan, Myanmar, Timor-Leste and Pakistan trailing among the bottom 30 countries globally.
As illustrated in Table 1.5, the Republic of Korea, with its developed telecom-munications infrastructure, strong national education policy and high GDP per capita of $22,590 US dollars in 2012,12 took the lead globally in e-government ranking for the first time in 2010 and is again the top performer in 2014 ahead of many other developed nations. The government started implementing its Ad-vancement of e-Government Strategy in 2007, reaching a fully digitized public administration with advanced Government-to-Citizen (G2C) and Government-to-Business (G2B) service delivery and multi-channel communication and transac-tions. By having an adequate and necessary infrastructure for IT development and sustainability, the Republic of Korea established a world-class transparent and efficient online presence and an equally impressive e-mobile presence, both of which serve to maintain its vanguard position and help develop more citizen-centric strategies and projects in e-governance in the future.
Singapore, which ranked second in Asia, has shown significant improvement over the last two years, jumping from 10th place globally to 3rd, followed by Japan with improvement from 18th to 6th ranking globally. Bahrain, Kazakhstan, Saudi Arabia and Oman improved in the global rankings with 18th, 28th, 36th and 48th places re-spectively. Six out of the top 10 countries in the Asian region itself are in Western Asia where most of the improvements have been witnessed; two of the top 10 countries are in Eastern Asia, one in South-Eastern Asia and one in Central Asia as Kazakhstan remained that sub-region’s leader in e-government.
Countries in Eastern Asia in general rank higher than the world average for various reasons such as e-government leadership, inclusive e-participation poli-cies, broad-ranging e-services and extensive open government data portals. The Republic of Korea and Japan have exhibited an upward trend in e-govern-ment, enabled primarily by their developed infrastructure, their high literacy rates—especially IT literacy—and their developed economies. The Government of Japan established the New IT Reform Strategy with the goal of reducing the percentage of national and local government paperwork, such as applica-tions and form submissions performed online, to at least 50 per cent by 2010. Thus, this initiative allowed almost all applications and other forms used by the national government to be submitted online, accompanied by a dissemination strategy to inform the public about such e-services. The Japanese government also expanded this strategy to include transactions between the local and na-tional governments and businesses.13
Ranked 6th in Asia in general and first in Central Asia, Kazakhstan is the only country in Central Asia to show improvements between 2012 and 2014; jumping from a global ranking of 38th in 2012, to 28th in 2014. Uzbekistan came in second
28
Cha
pte
r 1
CHAPTER 1 • WORLD E-GOVERNMENT RANKINGS UNITED NATIONS E-GOVERNMENT SURVEY 2014
place but dropped from 91st place to 100th globally. This decline in ranking in all Central Asian countries, with the exception of Kazakhstan, has been a trend in the sub-region since 2008; it could be attributed to insufficient development of telecommunication infrastructure and online presence.
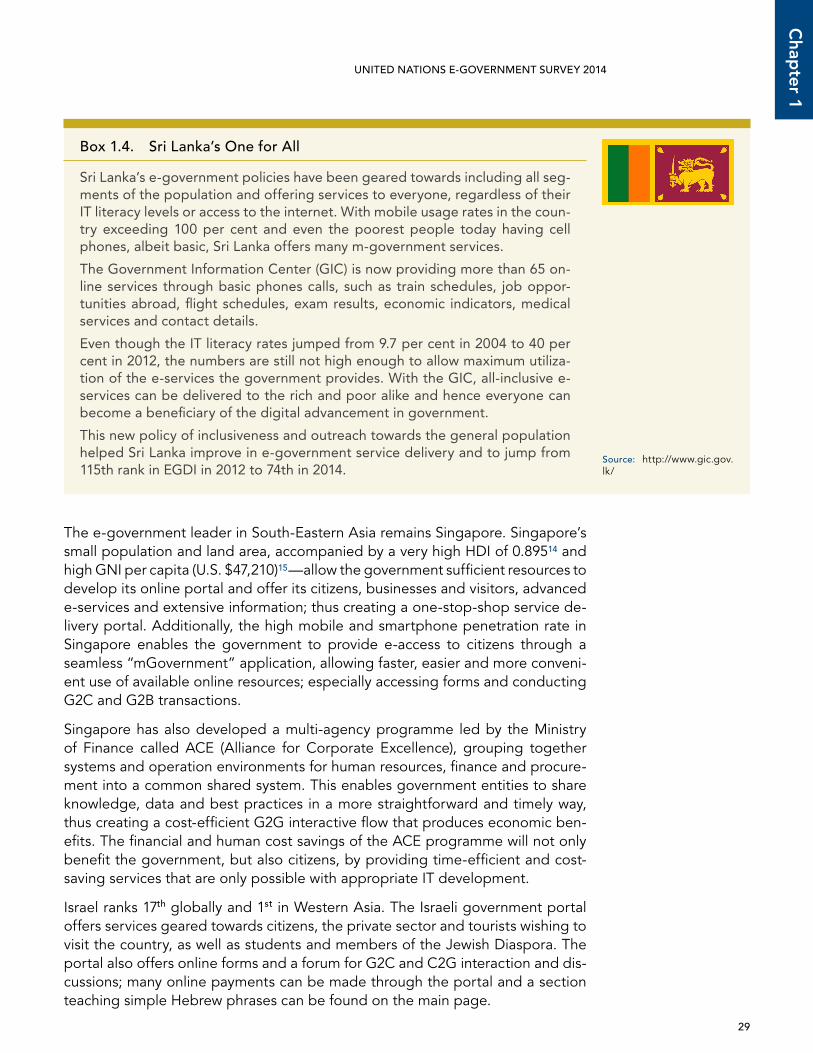
Sri Lanka ranks first in Southern Asia, with the Maldives ranking in second posi-tion. The Sri Lankan government has made a substantial effort to develop its online portal which now ranks 74th in the world. The online portal offers A-Z government web indexes, 108 e-services for citizens, 51 e-services for businesses and 10 non-residence related e-services. The portal also offers extensive mobile and SMS services, an e-participation portal, government forms easily accessible online, a developed open data portal with data available in various formats, as well as a whole-of-government strategy (see Box 1.4).
Table 1.5. Top 20 countries in Asia
Country Level of Income EGDI 2014 Rank 2012 RankChange in Rank
Very High EGDI
Republic of Korea High 0.9462 1 1 -
Singapore High 0.9076 3 10 7
Japan High 0.8874 6 18 12
Israel High 0.8162 17 16 1
Bahrain High 0.8089 18 36 18
High EGDI
Kazakhstan Upper Middle 0.7283 28 38 10
United Arab Emirates High 0.7136 32 28 4
Saudi Arabia High 0.6900 36 41 5
Qatar High 0.6362 44 48 4
Oman High 0.6273 48 64 16
Kuwait High 0.6268 49 63 14
Malaysia Upper Middle 0.6115 52 40 12
Georgia Lower Middle 0.6047 56 72 16
Cyprus High 0.5958 58 45 13
Armenia Lower Middle 0.5897 61 94 33
Mongolia Lower Middle 0.5581 65 76 11
Azerbaijan Upper Middle 0.5472 68 96 28
China Upper Middle 0.5450 70 78 8
Turkey Upper Middle 0.5443 71 80 9
Sri Lanka Lower Middle 0.5418 74 115 41
Regional Average 0.4951
world Average 0.4712
29
Chap
ter 1
UNITED NATIONS E-GOVERNMENT SURVEY 2014
The e-government leader in South-Eastern Asia remains Singapore. Singapore’s small population and land area, accompanied by a very high HDI of 0.89514 and high GNI per capita (U.S. $47,210)15—allow the government sufficient resources to develop its online portal and offer its citizens, businesses and visitors, advanced e-services and extensive information; thus creating a one-stop-shop service de-livery portal. Additionally, the high mobile and smartphone penetration rate in Singapore enables the government to provide e-access to citizens through a seamless “mGovernment” application, allowing faster, easier and more conveni-ent use of available online resources; especially accessing forms and conducting G2C and G2B transactions.
Singapore has also developed a multi-agency programme led by the Ministry of Finance called ACE (Alliance for Corporate Excellence), grouping together systems and operation environments for human resources, finance and procure-ment into a common shared system. This enables government entities to share knowledge, data and best practices in a more straightforward and timely way, thus creating a cost-efficient G2G interactive flow that produces economic ben-efits. The financial and human cost savings of the ACE programme will not only benefit the government, but also citizens, by providing time-efficient and cost-saving services that are only possible with appropriate IT development.
Israel ranks 17th globally and 1st in Western Asia. The Israeli government portal offers services geared towards citizens, the private sector and tourists wishing to visit the country, as well as students and members of the Jewish Diaspora. The portal also offers online forms and a forum for G2C and C2G interaction and dis-cussions; many online payments can be made through the portal and a section teaching simple Hebrew phrases can be found on the main page.
box 1.4. Sri lanka’s One for All
Sri Lanka’s e-government policies have been geared towards including all seg-ments of the population and offering services to everyone, regardless of their IT literacy levels or access to the internet. With mobile usage rates in the coun-try exceeding 100 per cent and even the poorest people today having cell phones, albeit basic, Sri Lanka offers many m-government services.
The Government Information Center (GIC) is now providing more than 65 on-line services through basic phones calls, such as train schedules, job oppor-tunities abroad, flight schedules, exam results, economic indicators, medical services and contact details.
Even though the IT literacy rates jumped from 9.7 per cent in 2004 to 40 per cent in 2012, the numbers are still not high enough to allow maximum utiliza-tion of the e-services the government provides. With the GIC, all-inclusive e-services can be delivered to the rich and poor alike and hence everyone can become a beneficiary of the digital advancement in government.
This new policy of inclusiveness and outreach towards the general population helped Sri Lanka improve in e-government service delivery and to jump from 115th rank in EGDI in 2012 to 74th in 2014.
Source: http://www.gic.gov.lk/
30
Cha
pte
r 1
CHAPTER 1 • WORLD E-GOVERNMENT RANKINGS UNITED NATIONS E-GOVERNMENT SURVEY 2014
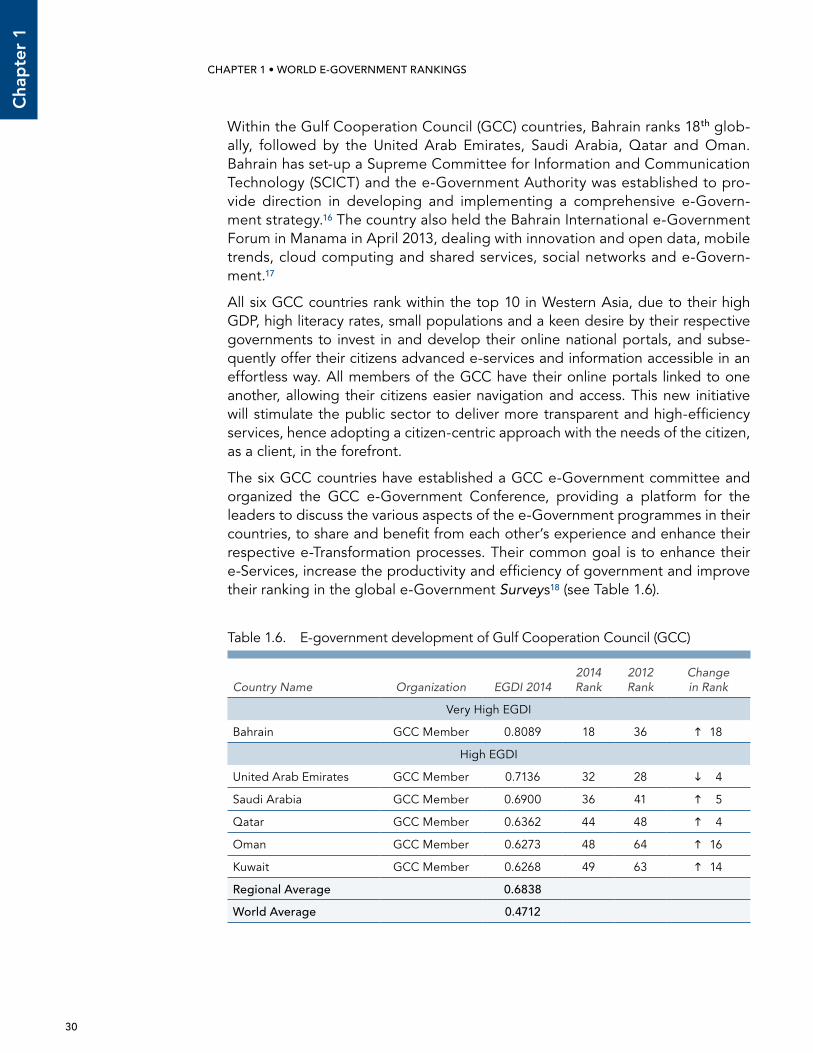
Within the Gulf Cooperation Council (GCC) countries, Bahrain ranks 18th glob-ally, followed by the United Arab Emirates, Saudi Arabia, Qatar and Oman. Bahrain has set-up a Supreme Committee for Information and Communication Technology (SCICT) and the e-Government Authority was established to pro-vide direction in developing and implementing a comprehensive e-Govern-ment strategy.16 The country also held the Bahrain International e-Government Forum in Manama in April 2013, dealing with innovation and open data, mobile trends, cloud computing and shared services, social networks and e-Govern-ment.17
All six GCC countries rank within the top 10 in Western Asia, due to their high GDP, high literacy rates, small populations and a keen desire by their respective governments to invest in and develop their online national portals, and subse-quently offer their citizens advanced e-services and information accessible in an effortless way. All members of the GCC have their online portals linked to one another, allowing their citizens easier navigation and access. This new initiative will stimulate the public sector to deliver more transparent and high-efficiency services, hence adopting a citizen-centric approach with the needs of the citizen, as a client, in the forefront.
The six GCC countries have established a GCC e-Government committee and organized the GCC e-Government Conference, providing a platform for the leaders to discuss the various aspects of the e-Government programmes in their countries, to share and benefit from each other’s experience and enhance their respective e-Transformation processes. Their common goal is to enhance their e-Services, increase the productivity and efficiency of government and improve their ranking in the global e-Government Surveys18 (see Table 1.6).
Table 1.6. E-government development of Gulf Cooperation Council (GCC)
Country Name Organization EGDI 20142014 Rank
2012 Rank
Change in Rank
Very High EGDI
Bahrain GCC Member 0.8089 18 36 18
High EGDI
United Arab Emirates GCC Member 0.7136 32 28 4
Saudi Arabia GCC Member 0.6900 36 41 5
Qatar GCC Member 0.6362 44 48 4
Oman GCC Member 0.6273 48 64 16
Kuwait GCC Member 0.6268 49 63 14
Regional Average 0.6838
world Average 0.4712
31
Chap
ter 1
UNITED NATIONS E-GOVERNMENT SURVEY 2014
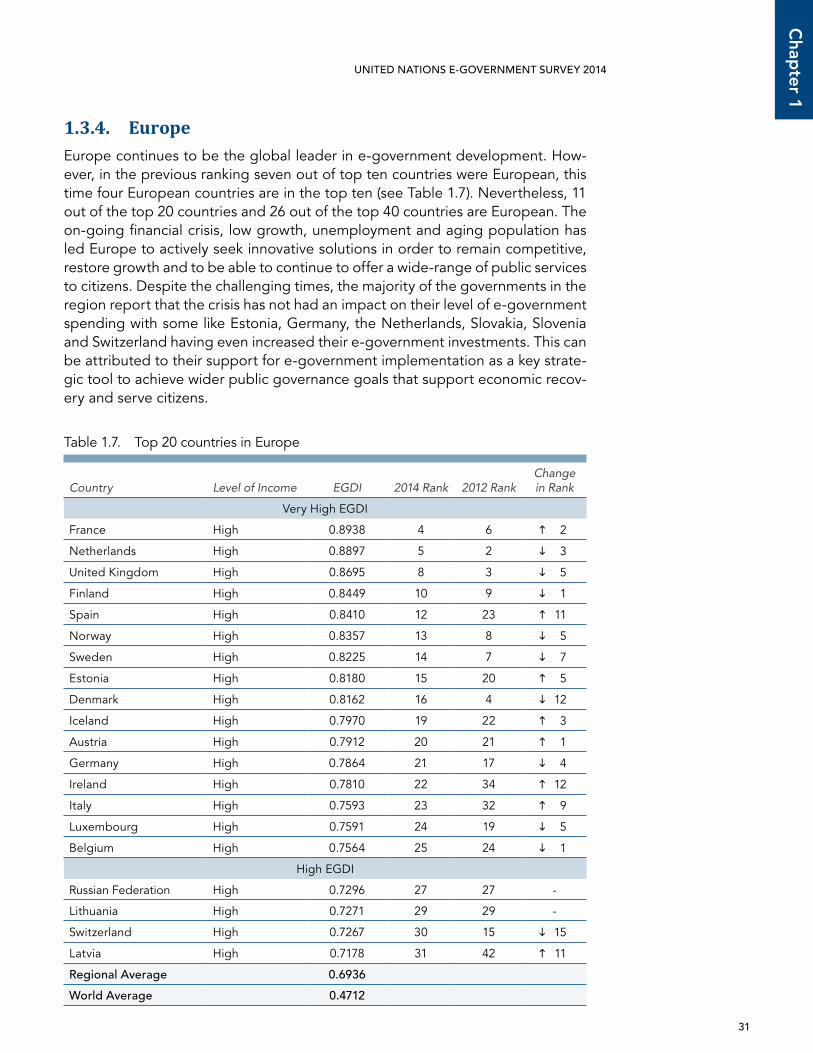
1.3.4. EuropeEurope continues to be the global leader in e-government development. How-ever, in the previous ranking seven out of top ten countries were European, this time four European countries are in the top ten (see Table 1.7). Nevertheless, 11 out of the top 20 countries and 26 out of the top 40 countries are European. The on-going financial crisis, low growth, unemployment and aging population has led Europe to actively seek innovative solutions in order to remain competitive, restore growth and to be able to continue to offer a wide-range of public services to citizens. Despite the challenging times, the majority of the governments in the region report that the crisis has not had an impact on their level of e-government spending with some like Estonia, Germany, the Netherlands, Slovakia, Slovenia and Switzerland having even increased their e-government investments. This can be attributed to their support for e-government implementation as a key strate-gic tool to achieve wider public governance goals that support economic recov-ery and serve citizens.
Table 1.7. Top 20 countries in Europe
Country Level of Income EGDI 2014 Rank 2012 RankChange in Rank
Very High EGDI
France High 0.8938 4 6 2
Netherlands High 0.8897 5 2 3
United Kingdom High 0.8695 8 3 5
Finland High 0.8449 10 9 1
Spain High 0.8410 12 23 11
Norway High 0.8357 13 8 5
Sweden High 0.8225 14 7 7
Estonia High 0.8180 15 20 5
Denmark High 0.8162 16 4 12
Iceland High 0.7970 19 22 3
Austria High 0.7912 20 21 1
Germany High 0.7864 21 17 4
Ireland High 0.7810 22 34 12
Italy High 0.7593 23 32 9
Luxembourg High 0.7591 24 19 5
Belgium High 0.7564 25 24 1
High EGDI
Russian Federation High 0.7296 27 27 -
Lithuania High 0.7271 29 29 -
Switzerland High 0.7267 30 15 15
Latvia High 0.7178 31 42 11
Regional Average 0.6936
world Average 0.4712
32
Cha
pte
r 1
CHAPTER 1 • WORLD E-GOVERNMENT RANKINGS UNITED NATIONS E-GOVERNMENT SURVEY 2014
E-government and online service delivery are increasingly seen in the region as a means to reduce costs while providing better and more user-friendly services to citizens and businesses, as well as being a part of the governments’ efforts to go green. There is a renewed focus on the impact and cost-effectiveness of e-government in the region with countries such as the United Kingdom, the Netherlands and Denmark having implemented ambitious e-government ef-ficiency and effectiveness programmes. The United Kingdom has embarked on a number of high profile initiatives to reduce the upfront expenditure on e-government whilst increasing its impact. The country makes ‘digital efficiency’ calculations and has established a Government Digital Service, a new team within the Cabinet Office tasked with transforming government digital services through an investment of US $113 million per year to be offset by multiple sav-ings, such as saving US $5.9 billion by cutting the costs of paying work and pension benefits online. The Netherlands has already met the ambitious goal it set in 2004 to reduce the country’s overall administrative costs by 25 per cent and is aiming for a further overall government saving of US $1.8 billion by 2018 through an e-government enabled whole-of-government approach. An impor-tant element of the e-government programme of the Netherlands is the Digital by Default strategy designed to move as many services to citizens and busi-nesses as possible online. The Digital by Default approach was also adopted by the United Kingdom in its Government Digital Strategy 2012 and is guided by the principle of redesigning online services to make them more direct and convenient for all citizens.19
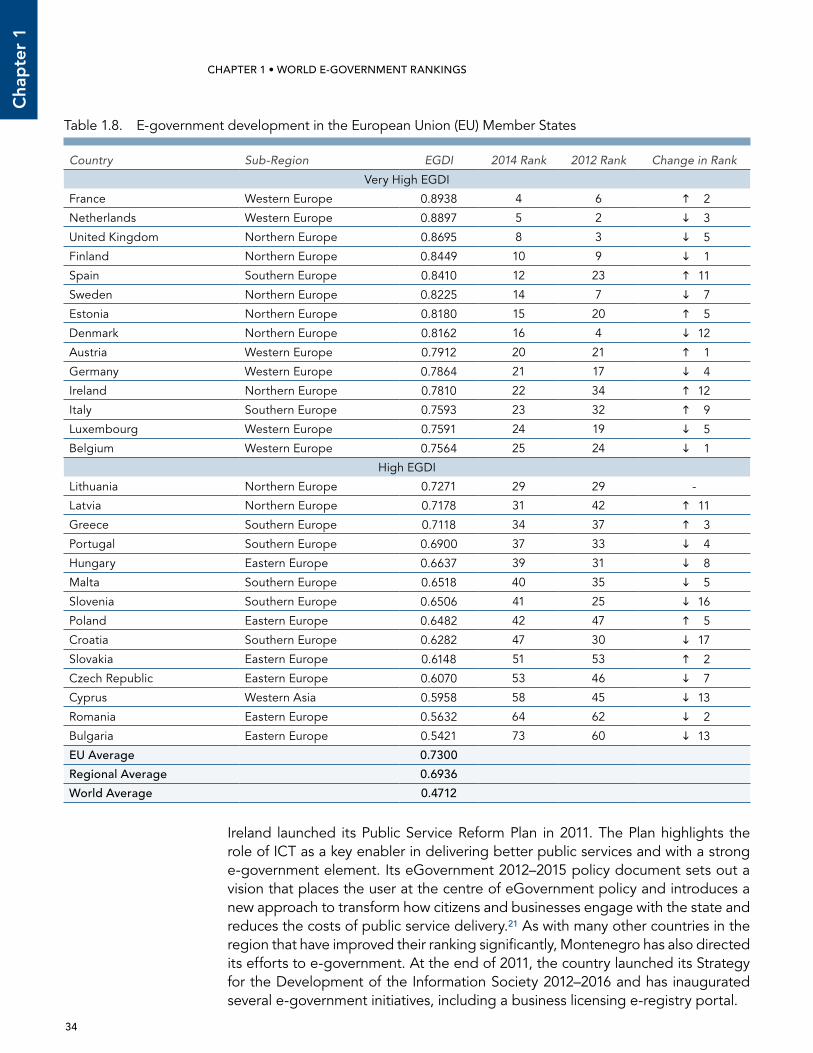
At the regional level, Europe focuses its e-government efforts to tackle the finan-cial crisis through the European Commission’s Digital Agenda for Europe (DAE) and the eGovernment Action Plan 2015. The e-government strategies of the 28 European Union (EU) Member States, as well as to some extent those of non-Member States in the region, are influenced by the DAE pillars of the digital single market, interoperability and standards, trust and security, fast and ultra-fast Internet access, research and innovation, enhancing digital literacy, skills and inclusion and ICT-enabled benefits for EU society, as well as seven additional key areas unveiled at the end of 2012. The success of the DAE and the Action Plan (see Box 1.5) can be attributed to a long-term approach to e-government devel-opment, embedding it into wider socio-economic development frameworks and not seeing e-government as a stand-alone nor primarily technical activity. Also important is the voluntary commitment of the EU countries to work together in a mutually supportive form of cooperative competition in moving towards com-mon goals through the Open Method of Coordination approach. With their fo-cused e-government efforts through the DAE and the Action Plan, the EU coun-tries rank high in the e-Government Development Index with 15 countries out of the 28 EU countries being in the global top 30 (see Table 1.8).
As a pioneer of e-government, the usage of online services in the EU is relatively high. The target for the EU as set out in the DAE is that 50 per cent of the adult population will be using e-government services by 2015. This goal is well on its way to being achieved with 46 per cent of EU citizens reporting their use of on-line public services, citing flexibility, saving time and money and simplification as the main benefits.
33
Chap
ter 1
UNITED NATIONS E-GOVERNMENT SURVEY 2014
The concerted and holistic efforts of Europe at both regional and national levels have helped to consolidate the position of Europe as the global leader in e-government. While there is some shifting in the ranking within the region, North-ern and Western Europe continue to take the lead with seven countries out of the global top 20 being from Northern Europe and two out of the global top five being from Western Europe, while countries in other sub-regions have also made significant improvements. All the five Nordic countries (Finland, Sweden, Norway, Denmark and Iceland) are in the global top 20 and seven out of the top ten regional performers are from Northern Europe. Spain has made significant gains, improving its position from 23rd to 12th in the global ranking and from 15th to 5th in the European ranking. This improvement is the result of long-term e-government planning. In 2005, the country unveiled the Plan Avanza, its first information society strategy and in 2010 Plan Avanza 2 was launched aimed at positioning Spain as a leader in the use of advanced ICT products and services.20 Other countries that made significant progress include Ireland that went up from 34th to 22nd in the global ranking, Italy from 32nd to 23rd (see Box 1.6), Latvia from 42nd to 31st, Montenegro from 57th to 45th and Belarus from 61st to 55th.
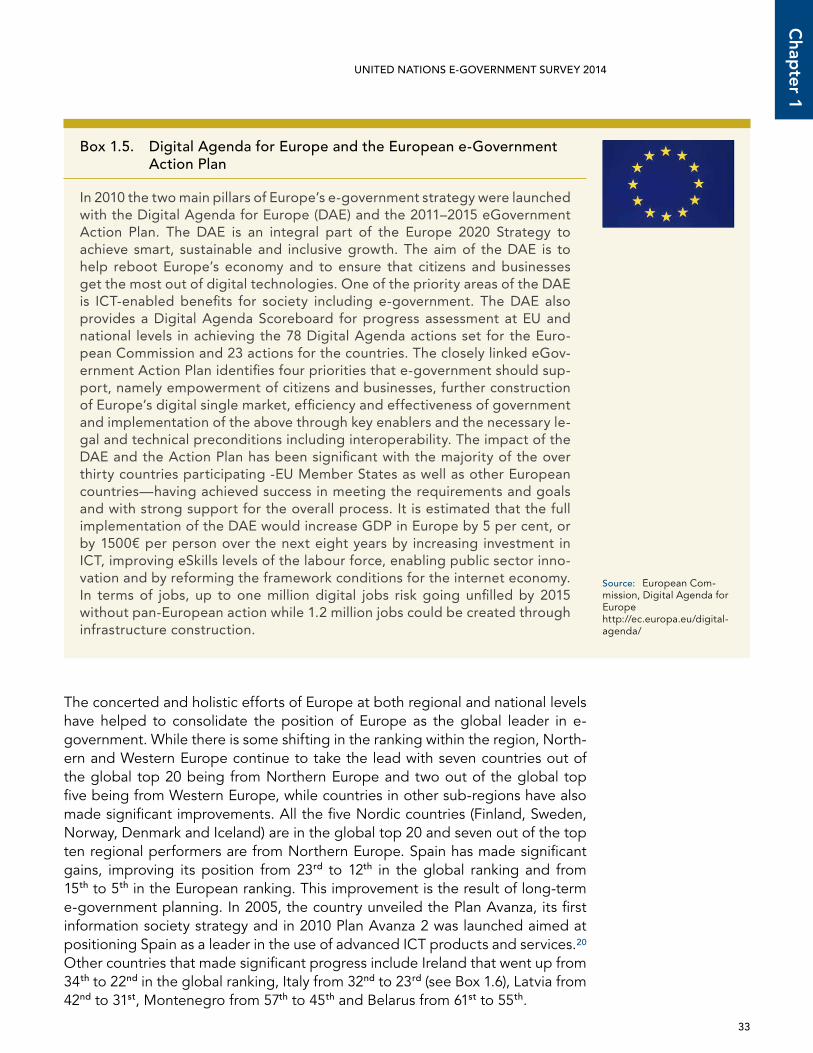
box 1.5. Digital Agenda for Europe and the European e-Government Action Plan
In 2010 the two main pillars of Europe’s e-government strategy were launched with the Digital Agenda for Europe (DAE) and the 2011–2015 eGovernment Action Plan. The DAE is an integral part of the Europe 2020 Strategy to achieve smart, sustainable and inclusive growth. The aim of the DAE is to help reboot Europe’s economy and to ensure that citizens and businesses get the most out of digital technologies. One of the priority areas of the DAE is ICT-enabled benefits for society including e-government. The DAE also provides a Digital Agenda Scoreboard for progress assessment at EU and national levels in achieving the 78 Digital Agenda actions set for the Euro-pean Commission and 23 actions for the countries. The closely linked eGov-ernment Action Plan identifies four priorities that e-government should sup-port, namely empowerment of citizens and businesses, further construction of Europe’s digital single market, efficiency and effectiveness of government and implementation of the above through key enablers and the necessary le-gal and technical preconditions including interoperability. The impact of the DAE and the Action Plan has been significant with the majority of the over thirty countries participating -EU Member States as well as other European countries—having achieved success in meeting the requirements and goals and with strong support for the overall process. It is estimated that the full implementation of the DAE would increase GDP in Europe by 5 per cent, or by 1500€ per person over the next eight years by increasing investment in ICT, improving eSkills levels of the labour force, enabling public sector inno-vation and by reforming the framework conditions for the internet economy. In terms of jobs, up to one million digital jobs risk going unfilled by 2015 without pan-European action while 1.2 million jobs could be created through infrastructure construction.
Source: European Com-mission, Digital Agenda for Europe http://ec.europa.eu/digital-agenda/
34
Cha
pte
r 1
CHAPTER 1 • WORLD E-GOVERNMENT RANKINGS UNITED NATIONS E-GOVERNMENT SURVEY 2014
Ireland launched its Public Service Reform Plan in 2011. The Plan highlights the role of ICT as a key enabler in delivering better public services and with a strong e-government element. Its eGovernment 2012–2015 policy document sets out a vision that places the user at the centre of eGovernment policy and introduces a new approach to transform how citizens and businesses engage with the state and reduces the costs of public service delivery.21 As with many other countries in the region that have improved their ranking significantly, Montenegro has also directed its efforts to e-government. At the end of 2011, the country launched its Strategy for the Development of the Information Society 2012–2016 and has inaugurated several e-government initiatives, including a business licensing e-registry portal.
Table 1.8. E-government development in the European Union (EU) Member States
Country Sub-Region EGDI 2014 Rank 2012 Rank Change in Rank
Very High EGDI
France Western Europe 0.8938 4 6 2
Netherlands Western Europe 0.8897 5 2 3
United Kingdom Northern Europe 0.8695 8 3 5
Finland Northern Europe 0.8449 10 9 1
Spain Southern Europe 0.8410 12 23 11
Sweden Northern Europe 0.8225 14 7 7
Estonia Northern Europe 0.8180 15 20 5
Denmark Northern Europe 0.8162 16 4 12
Austria Western Europe 0.7912 20 21 1
Germany Western Europe 0.7864 21 17 4
Ireland Northern Europe 0.7810 22 34 12
Italy Southern Europe 0.7593 23 32 9
Luxembourg Western Europe 0.7591 24 19 5
Belgium Western Europe 0.7564 25 24 1
High EGDI
Lithuania Northern Europe 0.7271 29 29 -
Latvia Northern Europe 0.7178 31 42 11
Greece Southern Europe 0.7118 34 37 3
Portugal Southern Europe 0.6900 37 33 4
Hungary Eastern Europe 0.6637 39 31 8
Malta Southern Europe 0.6518 40 35 5
Slovenia Southern Europe 0.6506 41 25 16
Poland Eastern Europe 0.6482 42 47 5
Croatia Southern Europe 0.6282 47 30 17
Slovakia Eastern Europe 0.6148 51 53 2
Czech Republic Eastern Europe 0.6070 53 46 7
Cyprus Western Asia 0.5958 58 45 13
Romania Eastern Europe 0.5632 64 62 2
Bulgaria Eastern Europe 0.5421 73 60 13
EU Average 0.7300
Regional Average 0.6936
world Average 0.4712
35
Chap
ter 1
UNITED NATIONS E-GOVERNMENT SURVEY 2014
A typical feature of European e-government strategies is to provide distinct por-tals on government information and on online services for citizens. Increasingly, countries in the region are also providing portals on open government data and e-participation as well as for businesses. This increases the number of ‘core’ e-government websites per country to a handful, moving beyond the idea of single ‘one-stop-shop’ portals. This approach helps to provide more targeted, while connected and user-friendly portals to different users, with the amount of infor-mation and services made available by governments increasing continuously.
Europe should continue its efforts to make online services ever more user-centric, while ensuring that those who cannot use online services are not excluded and also fully embrace the opportunities of e-participation. The experience of some of the top performing countries in the region, as well as the countries that have improved their ranking significantly, shows that long-term and holistic strategic planning in e-government brings about tangible results. The lesson that can be learnt from the region as a whole is that embedding e-government in wider so-cio-economic development frameworks is crucial to successful e-government.
1.3.5. Oceania
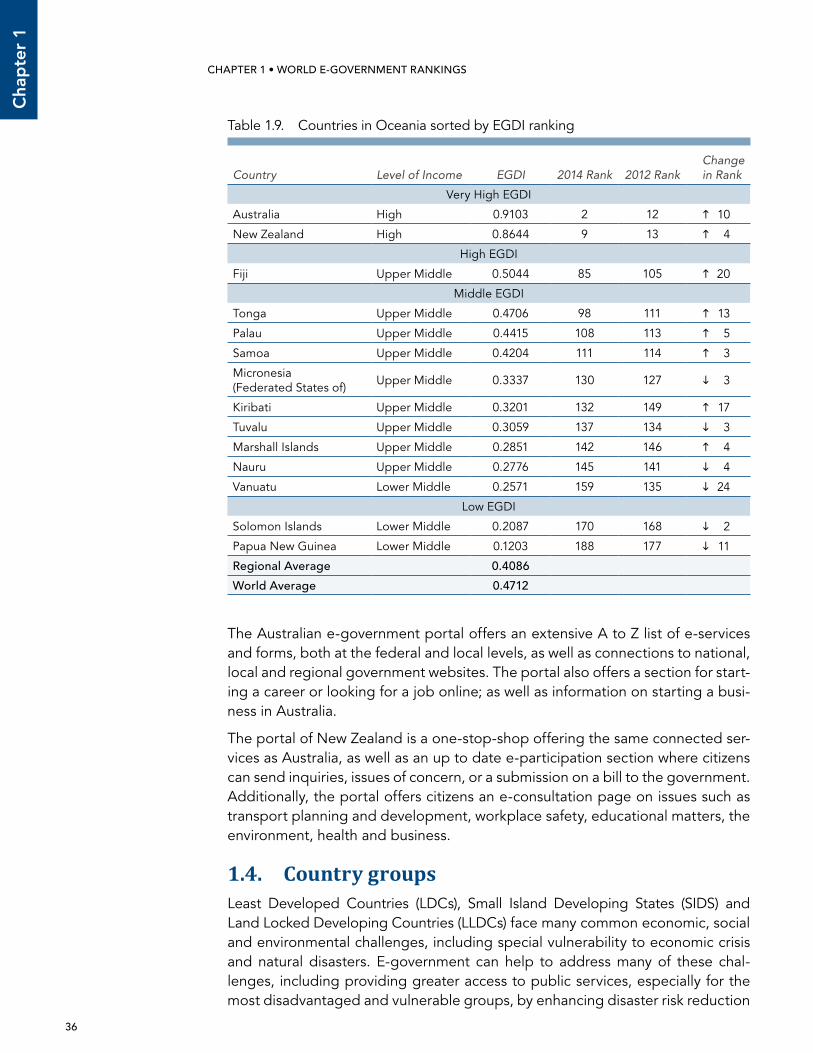
Australia and New Zealand still lead the region with high EGDI scores of 0.9103 and 0.8644 respectively. Australia and New Zealand also are more economically advanced as developed countries; whereas the rest of the islands in the region have smaller economies, populations and land mass; and thus have fewer re-sources. The majority of the other countries in the region, with the exception of Fiji and Tonga, are in the range of 108th (Palau) to 188th (Papua New Guinea) in global ranking. Australia and New Zealand also scored very high on the TII and HCI, both approaching the maximum normalized score of 1 (see Table 1.9).
box 1.6. Italy: compass of Transparency
The demand for transparency in public administration has been growing expo-nentially in Italy. Under new laws introduced since 2009, the website of every public administration is now the main vehicle of transparency. To date there are 42 typologies of different information and data that should be present by law on public administration websites (e.g. balance sheets, consultants, data about executives, performance plans, complete information about the organizational structure and the services provided to citizens). The ‘Compass of Transparency’ (La Bussola della Trasparenza), launched in 2012, is an online portal that gives the citizens the possibility to automatically analyze and monitor, in real time, the implementation of all the data and information requirements imposed by Italian law on the websites of public administrations. The core of the system is an engine that, through many software sensors and mathematic algorithms, au-tomatically analyzes the websites in real-time or periodically. The engine verifies the presence of the contents that must be legally published on the homepage and on the internal pages of more than 10,000 administration websites.
Source: Government of Ita-ly, Ministry of Public Admin-istration and Simplification, http://www.magellanopa.it/bussola/page/overview.html
36
Cha
pte
r 1
CHAPTER 1 • WORLD E-GOVERNMENT RANKINGS UNITED NATIONS E-GOVERNMENT SURVEY 2014
The Australian e-government portal offers an extensive A to Z list of e-services and forms, both at the federal and local levels, as well as connections to national, local and regional government websites. The portal also offers a section for start-ing a career or looking for a job online; as well as information on starting a busi-ness in Australia.
The portal of New Zealand is a one-stop-shop offering the same connected ser-vices as Australia, as well as an up to date e-participation section where citizens can send inquiries, issues of concern, or a submission on a bill to the government. Additionally, the portal offers citizens an e-consultation page on issues such as transport planning and development, workplace safety, educational matters, the environment, health and business.
1.4. Country groupsLeast Developed Countries (LDCs), Small Island Developing States (SIDS) and Land Locked Developing Countries (LLDCs) face many common economic, social and environmental challenges, including special vulnerability to economic crisis and natural disasters. E-government can help to address many of these chal-lenges, including providing greater access to public services, especially for the most disadvantaged and vulnerable groups, by enhancing disaster risk reduction
Table 1.9. Countries in Oceania sorted by EGDI ranking
Country Level of Income EGDI 2014 Rank 2012 RankChange in Rank
Very High EGDI
Australia High 0.9103 2 12 10
New Zealand High 0.8644 9 13 4
High EGDI
Fiji Upper Middle 0.5044 85 105 20
Middle EGDI
Tonga Upper Middle 0.4706 98 111 13
Palau Upper Middle 0.4415 108 113 5
Samoa Upper Middle 0.4204 111 114 3
Micronesia (Federated States of)
Upper Middle 0.3337 130 127 3
Kiribati Upper Middle 0.3201 132 149 17
Tuvalu Upper Middle 0.3059 137 134 3
Marshall Islands Upper Middle 0.2851 142 146 4
Nauru Upper Middle 0.2776 145 141 4
Vanuatu Lower Middle 0.2571 159 135 24
Low EGDI
Solomon Islands Lower Middle 0.2087 170 168 2
Papua New Guinea Lower Middle 0.1203 188 177 11
Regional Average 0.4086
world Average 0.4712
37
Chap
ter 1
UNITED NATIONS E-GOVERNMENT SURVEY 2014
and enabling greater government efficiency and transparency to ensure more ef-fective use of limited resources.
In general, the countries in these groups are among the lowest in the global e-government ranking, with each group’s average falling far below the global EGDI average of 0.4712. Out of the total of 92 countries in the three groups, 16 countries are both Least Developed and Land-Locked Developing Countries, and 9 are both Least Developed and Small Island Developing States. Mostly, SIDS rank highest within the three groups, with the average EGDI score of SIDS being 0.4069 compared to 0.3368 for LLDCs and just 0.2139 for LDCs.
The countries of these three groups stand to benefit from the good practices and lessons learnt from other more established e-government practices, with the pos-sibility to avoid possible costly pitfalls and to leap frog in e-government develop-ment. In order to ensure the full benefits of e-government in these three groups of countries it is essential to work towards enhanced literacy skills, a comprehensive government online presence and—most importantly—improved access, espe-cially to broadband, through both national efforts and international cooperation.
1.4.1. Small Island Developing States (SIDS)There are 38 Small Island Developing States (SIDS) among United Nations Member States,22 in Asia, the Caribbean and Oceania. The SIDS face several unique eco-nomic, social and environmental challenges due to their small size and economy, isolation and high cost of providing goods, services and infrastructure—including telecommunications—associated with small populations and geographic disper-sion. Small island states are typically comprised of several islands scattered over a wide geographic area (for example the Federal States of Micronesia are comprised of 607 islands and the Seychelles of 115 islands) which poses unique challenges for governments in coordinating and delivering services. In addition, SIDS are espe-cially vulnerable to economic crisis because of their narrow resource and export base and dependence on unreliable sectors such as tourism. They are also more exposed to the effects of climate change, such as sea-level rise and natural dis-asters.23 The challenges faced by SIDS have intensified with the natural disasters associated with climate change and the lasting negative impacts of the global fi-nancial crisis. This highlights the structural nature of the constraints of the SIDS and the lack of effective national and international response mechanisms. Several of these difficulties are amplified by the SIDS limited access to modern technologies.
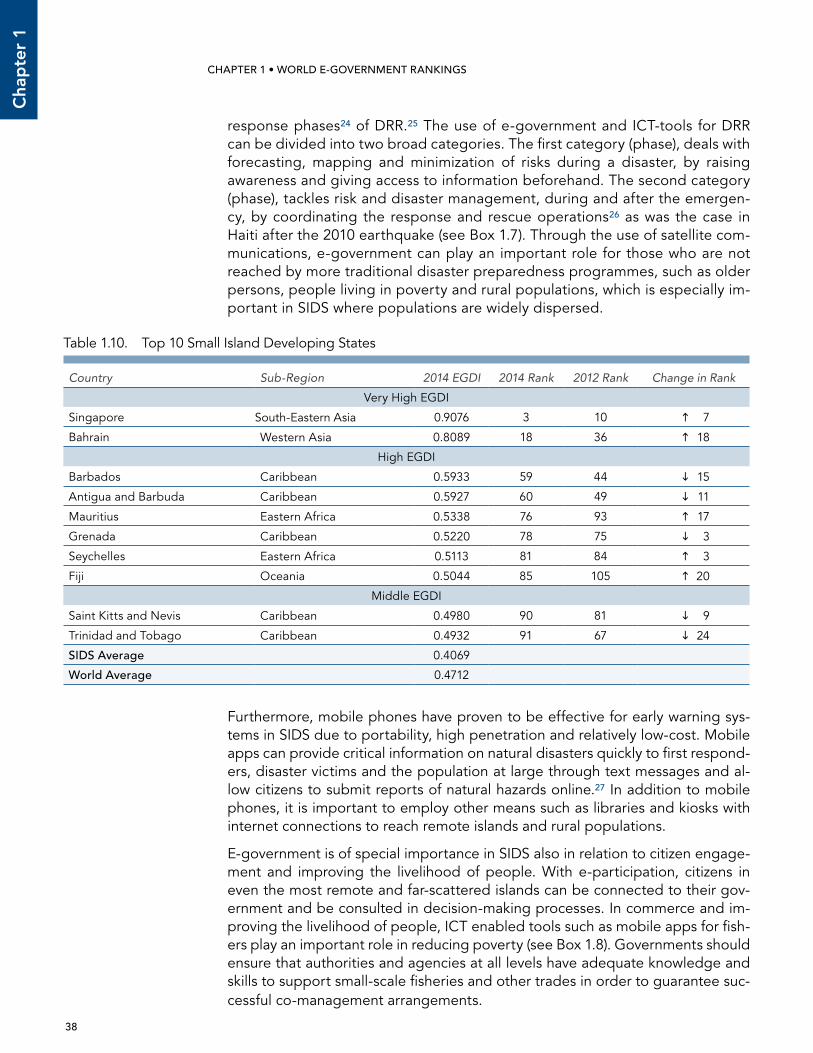
As a group, the SIDS rank low in the global EGDI. Only 13 out of the 38 SIDS rank in the global top 100. The biggest improvers in this group are Fiji (from 105th to 85th), Kiribati (from 149th to 132nd), Bahrain (from 36th to 18th) and Mauritius (from 93rd to 76th). None of the ten Least Developed Countries among the SIDS rank in the top 10 of this group (see Table 1.10).
E-government holds the potential to address several of the issues faced by SIDS, for example in relation to Disaster Risk Reduction (DRR) and improved data availability. E-government—taking advantage of mobile technology, Inter-net, social media and space-based technologies such as Geographic Informa-tion Systems (GIS)—can be used effectively especially in the preparedness and
38
Cha
pte
r 1
CHAPTER 1 • WORLD E-GOVERNMENT RANKINGS UNITED NATIONS E-GOVERNMENT SURVEY 2014
response phases24 of DRR.25 The use of e-government and ICT-tools for DRR can be divided into two broad categories. The first category (phase), deals with forecasting, mapping and minimization of risks during a disaster, by raising awareness and giving access to information beforehand. The second category (phase), tackles risk and disaster management, during and after the emergen-cy, by coordinating the response and rescue operations26 as was the case in Haiti after the 2010 earthquake (see Box 1.7). Through the use of satellite com-munications, e-government can play an important role for those who are not reached by more traditional disaster preparedness programmes, such as older persons, people living in poverty and rural populations, which is especially im-portant in SIDS where populations are widely dispersed.
Furthermore, mobile phones have proven to be effective for early warning sys-tems in SIDS due to portability, high penetration and relatively low-cost. Mobile apps can provide critical information on natural disasters quickly to first respond-ers, disaster victims and the population at large through text messages and al-low citizens to submit reports of natural hazards online.27 In addition to mobile phones, it is important to employ other means such as libraries and kiosks with internet connections to reach remote islands and rural populations.
E-government is of special importance in SIDS also in relation to citizen engage-ment and improving the livelihood of people. With e-participation, citizens in even the most remote and far-scattered islands can be connected to their gov-ernment and be consulted in decision-making processes. In commerce and im-proving the livelihood of people, ICT enabled tools such as mobile apps for fish-ers play an important role in reducing poverty (see Box 1.8). Governments should ensure that authorities and agencies at all levels have adequate knowledge and skills to support small-scale fisheries and other trades in order to guarantee suc-cessful co-management arrangements.
Table 1.10. Top 10 Small Island Developing States
Country Sub-Region 2014 EGDI 2014 Rank 2012 Rank Change in Rank
Very High EGDI
Singapore South-Eastern Asia 0.9076 3 10 7
Bahrain Western Asia 0.8089 18 36 18
High EGDI
Barbados Caribbean 0.5933 59 44 15
Antigua and Barbuda Caribbean 0.5927 60 49 11
Mauritius Eastern Africa 0.5338 76 93 17
Grenada Caribbean 0.5220 78 75 3
Seychelles Eastern Africa 0.5113 81 84 3
Fiji Oceania 0.5044 85 105 20
Middle EGDI
Saint Kitts and Nevis Caribbean 0.4980 90 81 9
Trinidad and Tobago Caribbean 0.4932 91 67 24
SIDS Average 0.4069
world Average 0.4712
39
Chap
ter 1
UNITED NATIONS E-GOVERNMENT SURVEY 2014
box 1.7. Haiti: Response and recovery with Sahana free and open disaster management system
The Sahana Disaster Management System, which provides modular, web-based disaster management applications, was developed by the open source community in the aftermath of the 2004 tsunami in Sri Lanka. Since then, Sa-hana has been deployed in several natural disasters around the world, includ-ing the Haiti earthquake in 2010. The Sahana volunteer community responded immediately to the earthquake and set up the Sahana Haiti 2010 Earthquake Disaster Response Portal to provide and share information needed for the re-lief operation. These included an organization registry to track the agencies’ relief efforts and to avoid duplication; a request management system where requests such as ‘bring water’ were made visible to the relief organizations and contained ticketing and tracking systems; an SMS service through which citizens could request assistance and information developed in partnership with the US State Department; a hospital management system; a food request portal developed in response to a request from the World Food Programme; a disaster victim identification registry; a shelter registry; a translation service; and situation mapping as well as missing persons and victim identification reg-istries developed in partnership with Google and Yahoo. The quick response and collaboration between the Sahana volunteer community, governments, international organizations, civil society and the private sector, is a good prac-tice of different actors coming together swiftly to help those in urgent need, and where the national government structures and capacities to respond to the disaster, were badly damaged.28
Source: http://wiki.sahana-foundation.org/_media/iscram_2010_sahana_haiti.pdf
box 1.8. Trinidad and Tobago: m-fisheries
The fishery sector is vital to the economy of SIDS such as Trinidad and To-bago, both in providing employment, particularly in rural communities and in enhancing the local food supply. The government of Trinidad and Tobago has prioritized development of the fishing industry due to its economic and social importance for the country with the target of making it not only competitive, profitable and sustainable but also equitable, inclusive and supportive of the local fishing communities. Barriers to fishing industry development include lack of training in natural resources management and in sea safety. Due to high mobile phone penetration in the country (86 per cent among the poor), the use of mobiles is identified as a highly effective tool to address the problems espe-cially in the small scale fishing industry. Through the mFISHERIES mobile app users can see ‘Got Fish’ posts by local fishermen, make a request via the ‘Need Fish’, get quick access to wholesale market prices, access a compass and GPS enabled location, improve their safety through the ‘Info Zone’ with sea safety information and a SOS button for emergencies that automatically alerts the coast guard about one’s position when help is needed.
Source: mFISHERIES http://cirp.org.tt/mfisheries/
40
Cha
pte
r 1
CHAPTER 1 • WORLD E-GOVERNMENT RANKINGS UNITED NATIONS E-GOVERNMENT SURVEY 2014
Due to the coastal zone concentration in a limited land area in some of the most vulnerable regions of the world, the effects of climate change and sea-level ris-ing, put the economic, social and environmental development efforts of SIDS at risk. The long-term effects of climate change can even threaten the existence of some SIDS.29 A comprehensive approach is needed to address the challenges, and e-government can play a key role. A holistic e-government strategy with strong DRR, e-participation and e-service components, such as e-health, e-edu-cation and e-commerce can enable the governments in SIDS to work and deliver as one and to advance sustainable development in all its dimensions.
1.4.2. Landlocked Developing Countries (LLDCs)A landlocked country is one that is entirely enclosed by land, or whose only coast-line lies on a closed sea. There are 48 landlocked countries among the United Na-tions Member States, 31 of which are Landlocked Developing Countries (LLDCs).30 They are widely dispersed around the globe: 15 are located in Africa, 12 in Asia, 2 in Europe and 2 in South America. The LLDCs are among the most disadvan-taged developing countries, and 16 out of the 31 LLDCs are also Least Developed Countries. The economic performance of LLDCs reflects the disadvantages of their geography with lack of access to major shipping routes, fisheries and other marine resources. The LLDCs are generally the poorest countries in their region, with the weakest growth rates and are the most dependent on export earnings.
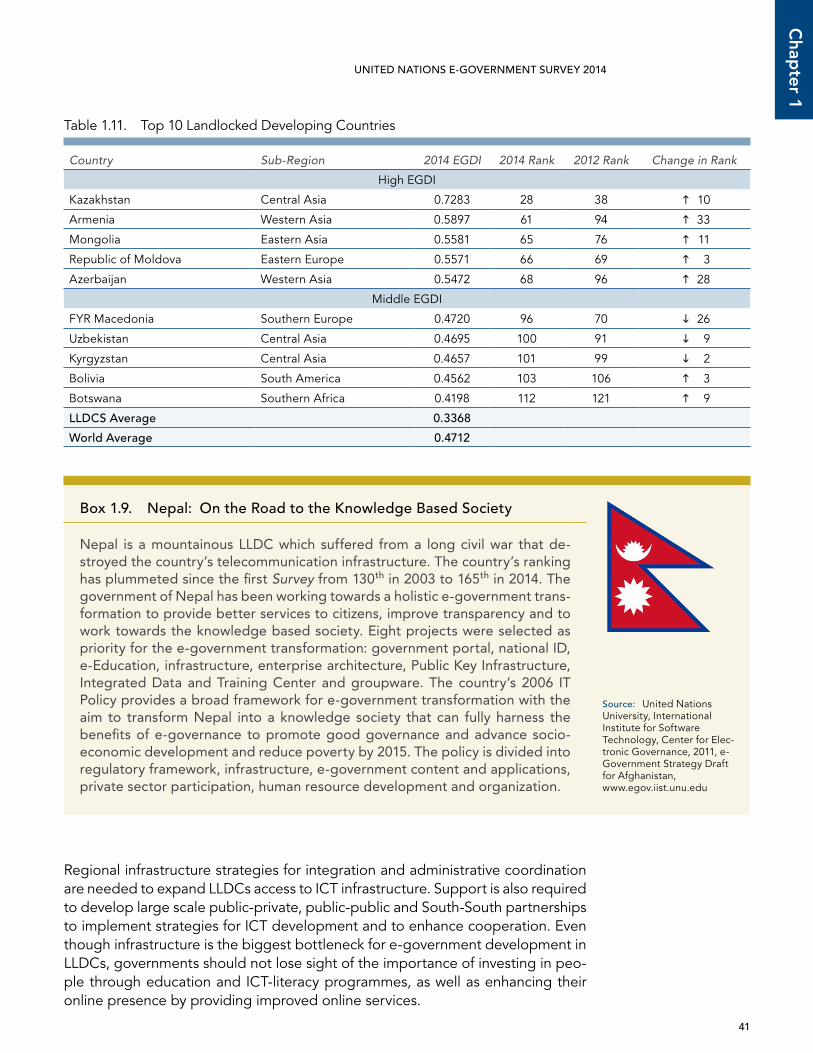
Generally, the LLDCS are positioned low in the global ranking with only seven LLDCs in the global top 100. The Asian countries dominate the list of top per-formers within the group, with Kazakhstan taking the top position and Armenia, Mongolia and Azerbaijan all being in the LLDC top five (see Table 1.11). None of the 16 Least Developed Countries among the LLDCs are in the group top ten, with Rwanda ranking 12th in the group and all the others ranking in the bottom 15 of the group. The biggest improvers among the LLDCs are Armenia (from 94th to 61st), Azerbaijan (from 96th to 68th), Ethiopia (from 172th to 157th) and Rwanda (from 140th to 125th). LLDCs have on average considerably lower e-government development rankings than Small Island Developing States, with EGDI averages of 0.3368 and 0.4069 respectively for these two groups, but higher than the Least Developed Countries which average at 0.2164.
Limited access to world markets is one of the most pressing constraints faced by LL-DCs with high transport costs and dependence on passage through sovereign tran-sit countries hampering their competitiveness. LLDCs also often rely on their neigh-bours’ telecommunication networks as accessing the international submarine fibre networks would incur high administrative and infrastructure costs. Telecommunica-tion networks are especially underdeveloped in rural areas, creating an additional barrier to the promotion of inclusive ICT strategies. Thus, it is not surprising that the Telecommunication Infrastructure Index is the weakest out of the three components of the E-Government Development Index for the majority of LLDCs. There are how-ever some encouraging examples, such as Bolivia which has been successful in de-touring its neighbours’ transit networks by building a fibre optic network across the country. Today Bolivia is able to take advantage of its central geographic location in South America and will be one of the co-owners of the fibre optic infrastructure mega project of the Union of South American Nations (UNASUR).
41
Chap
ter 1
UNITED NATIONS E-GOVERNMENT SURVEY 2014
Regional infrastructure strategies for integration and administrative coordination are needed to expand LLDCs access to ICT infrastructure. Support is also required to develop large scale public-private, public-public and South-South partnerships to implement strategies for ICT development and to enhance cooperation. Even though infrastructure is the biggest bottleneck for e-government development in LLDCs, governments should not lose sight of the importance of investing in peo-ple through education and ICT-literacy programmes, as well as enhancing their online presence by providing improved online services.
Table 1.11. Top 10 Landlocked Developing Countries
Country Sub-Region 2014 EGDI 2014 Rank 2012 Rank Change in Rank
High EGDI
Kazakhstan Central Asia 0.7283 28 38 10
Armenia Western Asia 0.5897 61 94 33
Mongolia Eastern Asia 0.5581 65 76 11
Republic of Moldova Eastern Europe 0.5571 66 69 3
Azerbaijan Western Asia 0.5472 68 96 28
Middle EGDI
FYR Macedonia Southern Europe 0.4720 96 70 26
Uzbekistan Central Asia 0.4695 100 91 9
Kyrgyzstan Central Asia 0.4657 101 99 2
Bolivia South America 0.4562 103 106 3
Botswana Southern Africa 0.4198 112 121 9
llDcS Average 0.3368
world Average 0.4712
box 1.9. Nepal: On the Road to the knowledge based Society
Nepal is a mountainous LLDC which suffered from a long civil war that de-stroyed the country’s telecommunication infrastructure. The country’s ranking has plummeted since the first Survey from 130th in 2003 to 165th in 2014. The government of Nepal has been working towards a holistic e-government trans-formation to provide better services to citizens, improve transparency and to work towards the knowledge based society. Eight projects were selected as priority for the e-government transformation: government portal, national ID, e-Education, infrastructure, enterprise architecture, Public Key Infrastructure, Integrated Data and Training Center and groupware. The country’s 2006 IT Policy provides a broad framework for e-government transformation with the aim to transform Nepal into a knowledge society that can fully harness the benefits of e-governance to promote good governance and advance socio-economic development and reduce poverty by 2015. The policy is divided into regulatory framework, infrastructure, e-government content and applications, private sector participation, human resource development and organization.
Source: United Nations University, International Institute for Software Technology, Center for Elec-tronic Governance, 2011, e-Government Strategy Draft for Afghanistan, www.egov.iist.unu.edu
42
Cha
pte
r 1
CHAPTER 1 • WORLD E-GOVERNMENT RANKINGS UNITED NATIONS E-GOVERNMENT SURVEY 2014
In LLDCs, e-government plays an instrumental role in facilitating progress in sec-tors such as trade and entrepreneurship through e-services, for example simpli-fying business licensing applications and enhancing services in education and health, as well as promoting socially inclusive growth for all.
1.4.3. Least Developed Countries (LDCs)There are 48 Least Developed Countries (LDCs) among United Nations Member States31 of which 34 are in Africa, 9 in Asia, 4 in Oceania and 1 in the Caribbean. This group of countries comprises more than 880 million people or about 12 per cent of the world population, but accounts for less than 2 per cent of the world GDP and about 1 per cent of global trade in goods.32 The lack of ICT infrastruc-ture and access to modern technologies are among the major challenges facing the LDCs. However significant progress has been made, especially with regard to mobile technology in the LDCs with almost 42 per cent of people having access to a mobile phone in 2011, up from 33 per cent in 2010. In stark contrast, only six out of 100 had access to the Internet in 2011, whilst 79 per cent did not have access to electricity.33 Due to the much higher access to mobile phones than computers, m-government services such as information and notifications by SMS, m-banking and m-health services are of special importance in the LDCs.
E-government development remains very low in the LDCs, with the LDC EGDI average being 0.2121 compared to the world average of 0.4712 and with no countries in the top 100 of the global ranking. Rwanda is the highest ranking in this group at 125th, followed by Kiribati at 132nd (see Table 1.12). The biggest improvers among the group are Kiribati, Cambodia and Yemen (see Box 1.10), improving their respective rankings from 149th to 132nd, from 155th to 139th and from 167th to 150th in the global ranking. Another significant improver is Rwanda going from 140th to 125th which is in line with the overall positive development trend in the country.
Table 1.12. Top Least Developed Countries
Country Sub-Region SIDS LLDC EGDI 2014 Rank 2012 Rank Change in Rank
Middle EGDI
Rwanda Eastern Africa x 0.3589 125 140 15
Kiribati Micronesia x 0.3201 132 149 17
Tuvalu Polynesia x 0.3059 137 134 3
Cambodia South-Eastern Asia 0.2999 139 155 16
Angola Middle Africa 0.2970 140 142 2
Bhutan Southern Asia x 0.2829 143 152 9
Tanzania Eastern Africa 0.2764 146 139 7
Bangladesh Southern Asia 0.2757 148 150 2
Yemen Western Asia 0.2720 150 167 17
llDcS Average 0.2121
world Average 0.4712
43
Chap
ter 1
UNITED NATIONS E-GOVERNMENT SURVEY 2014
The challenge for e-government development in this group is the lack of tele-communication infrastructure. The LDC Telecommunication Infrastructure Index average is 0.0929 compared with the world average of 0.3650. This hampers the ability of governments to implement e-government programmes and e-services as well as the adoption of any online services by citizens, even if available.35 While much remains to be done both in terms of e-government implementation and adoption among the LDCs, it is noteworthy that all the 49 countries have an on-line presence, whereas in the previous Survey two LDCs, Central African Republic and Guinea, had none.
Even though LDCs have improved their basic, or emerging, online presence—in most cases restricted to providing a limited amount of information and links online—they are making little or no progress in moving to the more advanced stages of e-government development, including the provision of e-services, e-participation and open government data. Without significant changes in the LDC’s e-government development, the distance of e-government development between the group and the rest of the world will increase further. The LDCs continue to face multiple severe socio-economic challenges and e-government does not top the list of the national development agenda of many of the LDCs. However, with insufficient investment in infrastructure and the lack of long-term e-government planning, these countries will lose out on the crucial benefits of e-government in making public administrations more cost-effective, efficient, citizen-centric, transparent and accountable, which play a key role in poverty elimination and promoting sustainable development. The governments in these countries should consider the benefits of e-government and online service de-livery, especially in relation to mobile services and take necessary measures to
box 1.10. Yemen: Reaping the benefits of long-term planning
In 2002, Yemen launched a 10-year e-government programme with a budget of USD 50 to 60 million which aimed to provide better access to services to disadvantaged groups, increasing access to telephone services and moving to electronic financial transactions. The Internet was introduced in Yemen in 1996 and its usage increased gradually between 2000 and 2010, with a big jump in the number of Internet users from 420,000 in 2010 to 3,691,000 in 2012 representing 14.9 per cent of the total population. Despite big improvement in Yemen’s e-services, the awareness and usage among the population is still relatively low. According to a 2013 study, 29.4 per cent of the citizens were not aware of e-government services, 47.6 per cent were aware but not using them and only 22.3 per cent reported using the services. Awareness and usage is also much higher among men than women. Countries such as Yemen that have recently made a significant investment in e-government, also need to focus on providing ICT-literacy training, as well as to raise awareness of the benefits of e-services, including through social media, to ensure high adoption and maximum benefits of e-governments services. As a result of ongoing improve-ments, Yemen’s rank increased from 167 to 150 in the global ranking, between 2012 and 2014.34
44
Cha
pte
r 1
CHAPTER 1 • WORLD E-GOVERNMENT RANKINGS UNITED NATIONS E-GOVERNMENT SURVEY 2014
establish mid and long-term e-government strategies and to improve their infra-structure. These countries should also have the full support of the international community through partnerships and knowledge sharing.
In conclusion, it is even more critical for the LDCs that face multiple challenges with limited resources, to consider smart investments in ICT infrastructure and e-government services which can bring about substantial returns on investment. This in turn will deliver multiple benefits such as better access to essential services, including to the most disadvantaged and vulnerable groups and create savings by streamlining and simplifying government processes as well as enhancing account-ability and transparency.
1.5. ConclusionPublic administration, being the cornerstone of governments’ work is essential for improving peoples’ lives. As illustrated in this chapter, amidst the economic, social and environmental challenges, e-government has continued to play an important role in enabling the delivery of quality public services that meet citizen needs and goals by transforming how the public sector works.
Considering that the EGDI is a broad relative index, caution should be taken against interpreting positional changes in rankings across similarly ranked coun-tries. ‘Higher’ rankings do not necessarily mean ‘better’ or “desirable” outcomes. As such countries must decide the level and extent of their e- government initia-tives based on their specific national development context.
Regardless of the complexity and diversity of countries in the world, some gen-eral conclusions at the global and regional levels can be made. In addition to effective planning and deployment of e-services, governments may consider en-hancing their ICT infrastructure and raise the level of human capital, including im-provement of the ICT literacy of citizens, to make use of the new technologies so as to realize the full benefits of online and mobile services. This should go hand in hand with capacity development of leadership in e-government and public servants as facilitators of online public services.
To further increase the scope and extend the use of online services, governments could provide even more citizen-centric and user-friendly services putting the needs of citizens at the core of planning and implementation of online services by engaging them (citizens) in consultative processes. Furthermore, countries may explore avenues to strengthen regional and global cooperation mechanisms with a view to facilitate national development goals, thus encouraging coherence and coordination among countries.
Nevertheless, in all regions there are outstanding stories which show countries overcoming obstacles and resource constraints to achieve improvements in lev-eraging e-government to achieve national development objectives.