Embed Size (px)
Citation preview

World Development Report 2009
Reshaping Economic
Geography
June 28, 2008 Mumbai Consultation 2
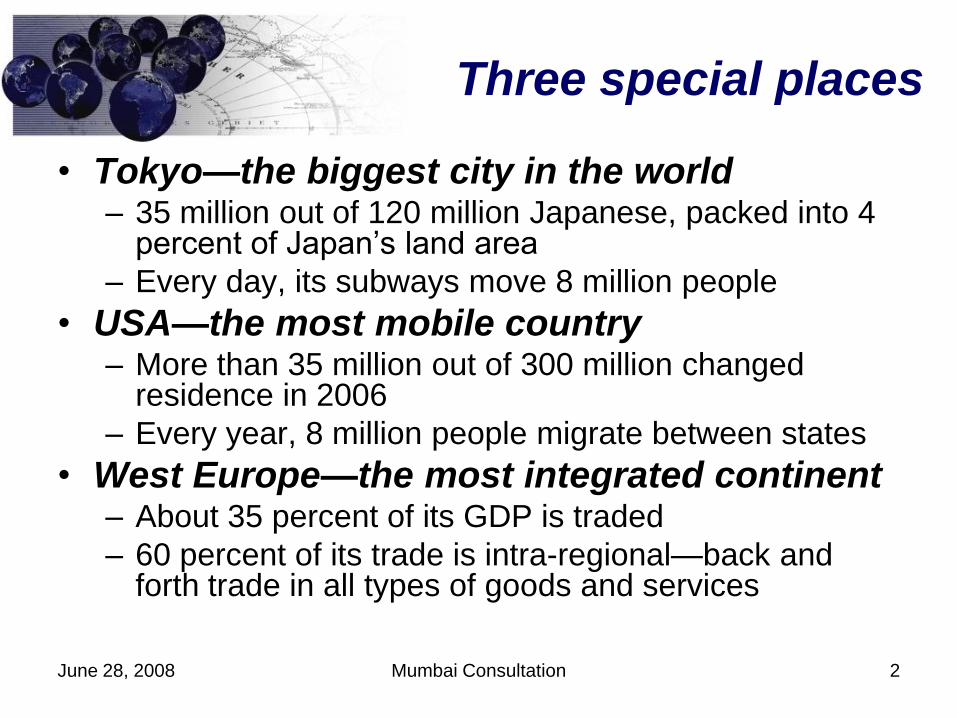
Three special places
• Tokyo—the biggest city in the world– 35 million out of 120 million Japanese, packed into 4
percent of Japan’s land area
– Every day, its subways move 8 million people
• USA—the most mobile country– More than 35 million out of 300 million changed
residence in 2006
– Every year, 8 million people migrate between states
• West Europe—the most integrated continent– About 35 percent of its GDP is traded
– 60 percent of its trade is intra-regional—back and forth trade in all types of goods and services

June 28, 2008 Mumbai Consultation 3
Crowded cities
Tokyo’s trains have been moving 8 million people every day

June 28, 2008 Mumbai Consultation 4
Packing in the subways
Tokyo’s ―trainpackers‖ crush commuters into metrorail carriages

June 28, 2008 Mumbai Consultation 5
And piling up wealth—
the fruits of proximityJapan’s economic mass is concentrated in the Tokyo-Yokohama area
June 28, 2008 Mumbai Consultation 6
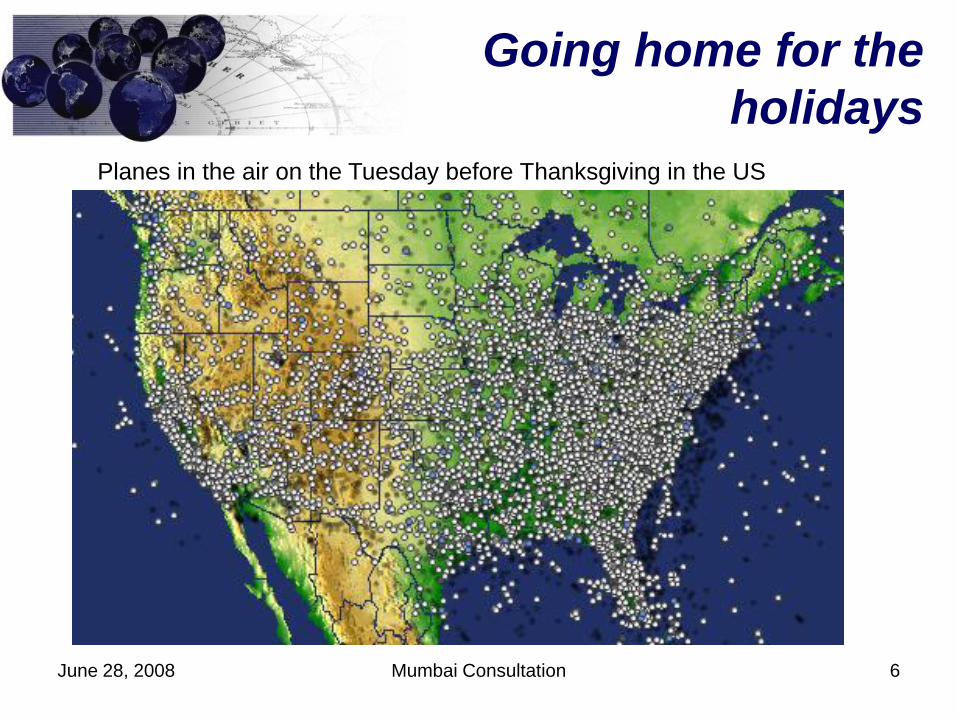
Going home for the
holidaysPlanes in the air on the Tuesday before Thanksgiving in the US

June 28, 2008 Mumbai Consultation 7
Going home for the
holidaysSome of the 35 million Thanksgiving travelers stuck in traffic jams

June 28, 2008 Mumbai Consultation 8
Going home for the
holidays?Stranded by storms before the Thanksgiving weekend

June 28, 2008 Mumbai Consultation 9
Why Americans put up
with the pain of movingEconomic mass is concentrated in a few parts of a big country

June 28, 2008 Mumbai Consultation 10
Specializing and trading
in Western Europe Airbus parts are made, moved, and assembled all over Western Europe
United States
engines
Great Britain
wings
Belgiumparts
Netherlands
parts
Germanybody
vertical stabilizer
France cockpitwheels
Toulouseassembly
Spain
horizontal stabilizer
FranceFrance
BelgiumBelgium G.B.G.B.
FranceFrance
SpainSpain
body GermanyGermany
body
wing
horizontal stabilizer
engine U.S.U.S.
vertical stabilizer
GermanyGermany

June 28, 2008 Mumbai Consultation 11
Loading and moving
Airbus parts are made, moved, and assembled all over Western Europe

June 28, 2008 Mumbai Consultation 12
Made possible by a
painful integrationSlow institutional integration in Western Europe during the last 50 years

June 28, 2008 Mumbai Consultation 13
The result?
The US, EU-15, and Japan cover much of the economic globe

June 28, 2008 Mumbai Consultation 14
Stories being repeated
now in developing Asia
• Mumbai—the most densely populated city– About 30,000 people per sq. km.; already twice the density of
Seoul, Shanghai, and Bogota
– More people keep coming
• China—the most mobile developing country– 60 million migrant workers traveled from home on the last day of
Chinese New Year holidays in 2006
– 200 million travelers were stranded due to snow storms days before Chinese New Year in 2008
• Southeast Asia—the most rapidly integrating developing region– Trade is big part of GDP
– More than 25 percent of its trade is within Southeast Asia; more than 50 percent if Northeast Asia is included

June 28, 2008 Mumbai Consultation 15
Stuffed trains in Mumbai
Mumbai’s trains move 6 million people every day

June 28, 2008 Mumbai Consultation 16
Trainpackers needed
People die every day on Mumbai’s trains

June 28, 2008 Mumbai Consultation 17
Going to work in China
Millions of Chinese workers migrated despite restrictions in the 1990s
June 28, 2008 Mumbai Consultation 18
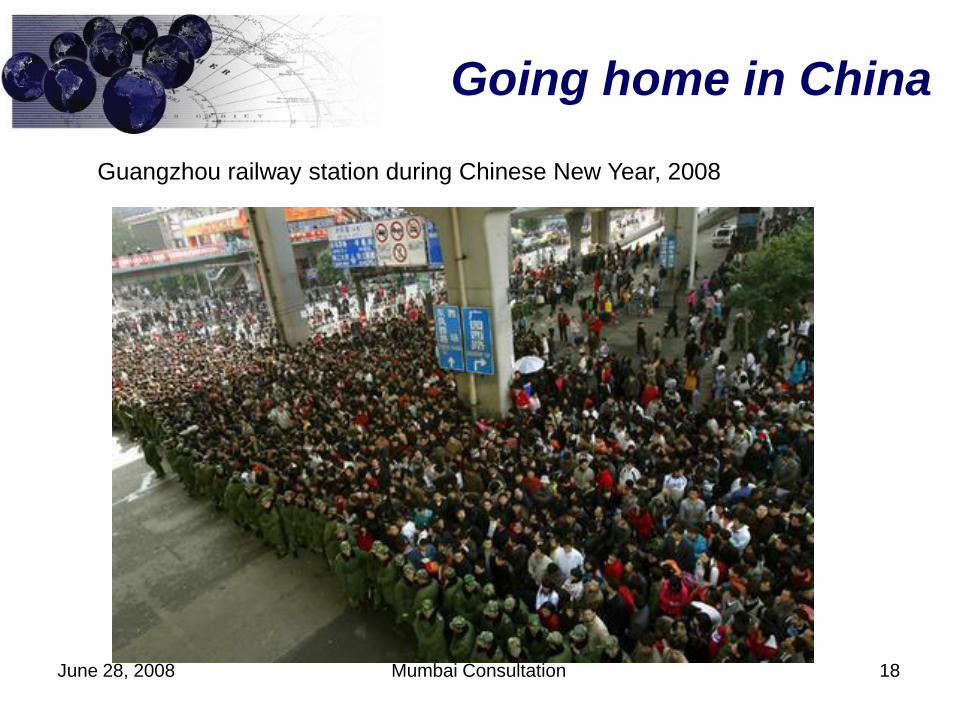
Going home in China
Guangzhou railway station during Chinese New Year, 2008
June 28, 2008 Mumbai Consultation 19
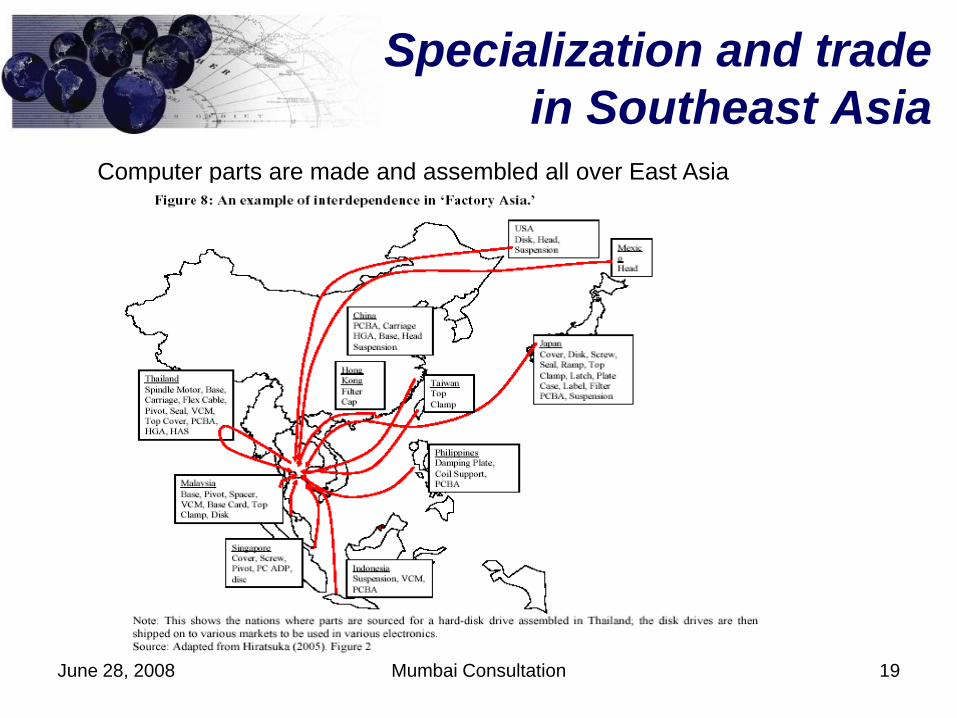
Specialization and trade
in Southeast Asia Computer parts are made and assembled all over East Asia

June 28, 2008 Mumbai Consultation 20
The result?
China, Southeast Asia, and India can again be recognized on this map

June 28, 2008 Mumbai Consultation 21
Spatial transformations
needed for progress
• Higher Densities
– No country has grown to high income without urbanizing
• Shorter Distances
– Growth seldom comes without the need to move closer to density
• Fewer Divisions
– Growth seldom comes to a place that is isolated from others

June 28, 2008 Mumbai Consultation 22
Messages
• Growth will be unbalanced
– Trying to balance growth amounts to fighting it
• Development can still be inclusive
– Persistent spatial disparities in basic living
standards are neither desirable nor inevitable
• Integration is the way to get both unbalanced
growth and inclusive development
– Report attempts to change debates from spatial
targeting to spatial integration: institutions,
infrastructure, and incentives
June 28, 2008 Mumbai Consultation 23
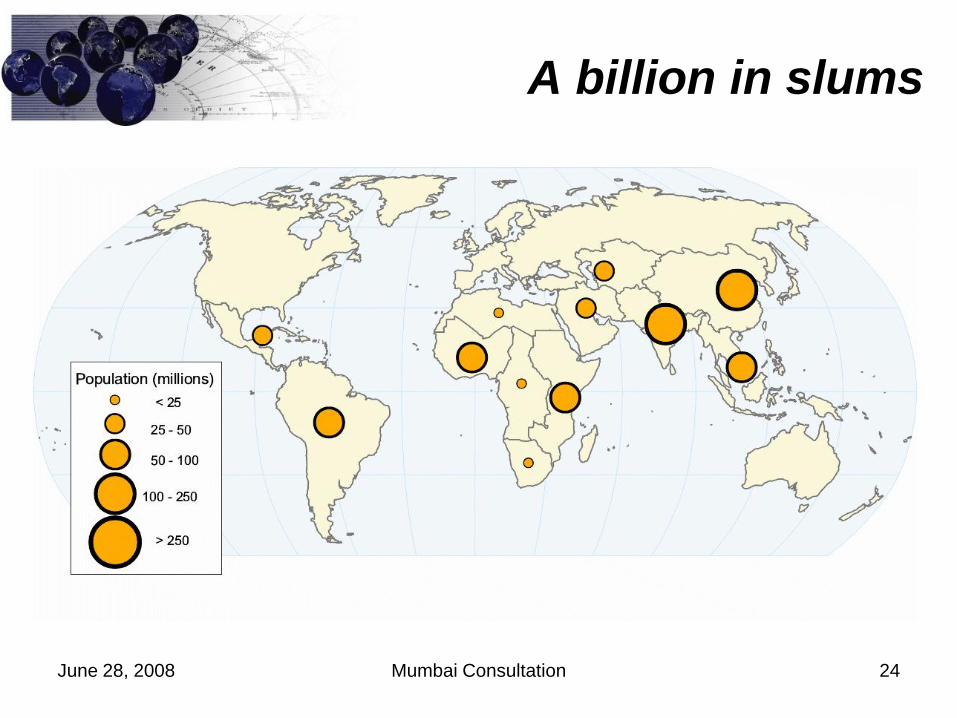
Policy concerns
• Concentration of people in cities will outstrip
concentration of economic mass
– A billion people in the world‟s slums
• Spatial disparities in living standards will
widen as economic mass concentrates in places
distant from where people are
– A billion people in remote and lagging areas
• Poor people will be trapped in isolated
countries that are not developing
– The new „Third World‟: Collier‟s “Bottom Billion”
June 28, 2008 Mumbai Consultation 24
A billion in slums

June 28, 2008 Mumbai Consultation 25
A billion in remote areas

June 28, 2008 Mumbai Consultation 26
The “bottom billion”
June 28, 2008 Mumbai Consultation 27
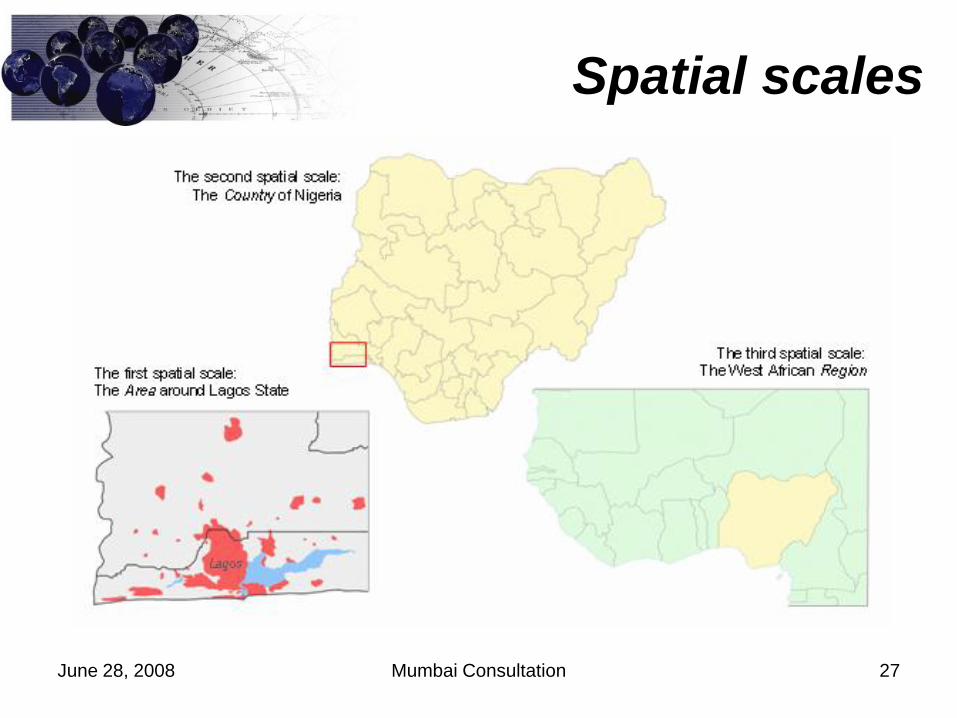
Spatial scales

June 28, 2008 Mumbai Consultation 28
Report structure
Density : Rural-Urban -
Distance : Lagging-leading -
Division : Isolated-Connected
Scale economies : Agglomeration
Factor mobility : Migration
Transport costs: Specialization and trade
Territorial development
Regional integration Urbanization
1 2 3
4 5 6
7 8 9
Part Two:
Market Forces
Part Three:
Government Policies
Part One: Stylized Facts
Spatial Scale 1:
Area
Spatial Scale 3:
Region
Spatial Scale 2:
Country

June 28, 2008 Mumbai Consultation 29
Concentration of economic activity
rises, then levels off
The richer, the denser: People concentrate in towns and cities as nations develop
Agglomeration Index, using a spatial resolution of 1 square kilometer
0
0.2
0.4
0.6
0.8
1
0 5 10 15 20 25 30 35 40
GDP per capita (thousands, PPP, 2000 constant US$)
Agg
lom
erat
ion
Inde
x
EgyptKorea
Japan
Germany
USA
Norway
India
China
South Africa
Brazil
Botswana
Belize
Ethiopia

June 28, 2008 Mumbai Consultation 30
Concentration of economic activity
rises, then levels off
0
1
2
3
4
5
6
7
8
9
10
0 10000 20000 30000 40000per cap GDP (constant 2000 US$)
conc
entr
atio
n
Brazil,1960-2004 Japan,1900-2000
USA,1960-2000
Netherlands,1850-2006
Canada,1890-2006
France,1801-1999
Spain, 1850-2000
Chile,
1976-2004

June 28, 2008 Mumbai Consultation 31
Concentration of economic activity
rises, then levels off

June 28, 2008 Mumbai Consultation 32
Divergence, then convergence, in
rural-urban gaps

June 28, 2008 Mumbai Consultation 33
0
0.1
0.2
0.3
0.4
0.5
0.6
0 2,000 4,000 6,000 8,000 10,000 12,000 14,000 16,000
per capita GDP in constant intl Geary-Khamis dollar
spatial in
equality
(coeff
of
variation o
f re
gio
nal
wages o
r in
com
e)
UK,1871-1955
USA,1840-1960
Habsburg Empire,1756-1910
Japan, 1955-1983
Sweden,1920-1961
Spain, 1860-1975
Divergence, then convergence, but
only in growing countries

June 28, 2008 Mumbai Consultation 34
Divergence, then convergence, in
basic living standardsin Malaysia

June 28, 2008 Mumbai Consultation 35
Divergence, then convergence,
but only in growing regions
Convergence in East Asia, 1950-2006 (Coefficient of variation and per capita GDP growth)

June 28, 2008 Mumbai Consultation 36
Urbanization rates not unprecedented,
but city sizes are
Average size of largest 100 cities, 1800-2000

June 28, 2008 Mumbai Consultation 37
Market size is still important, but
globalization is unprecedented
Exports as a share of world trade, 1820-2000
1
6
12
26
0
5
10
15
20
25
30
1820 1900 1950 2000
Glo
bal
Tra
de a
s S
hare
of
Glo
bal
GD
P (
Perc
en
t)

June 28, 2008 Mumbai Consultation 38
Border restrictions have precedents, but
number of borders is unprecedented
Number of international borders, 1820-2000
75
104
200
600
0
100
200
300
400
500
600
700
1820 1900 1950 2000
Nu
mb
er
of
Bo
rde
rs

June 28, 2008 Mumbai Consultation 39
Drivers
The Drivers of Spatial Transformations
Spatial Scales
Local National International
Unit Area Country Region
Examples Guangdong (178,000 sq km) Rio de Janeiro State (44,000 sq km)
Lagos State (3,600 sq km)
Greater Cairo (86,000 sq km)
China (9.6 million sq km)
Brazil (8.5 million sq km)
Nigeria (933,000 sq km)
Egypt (995,000 sq km)
East Asia (15.9 million sq km) South America (17.8 million sq km)
West Africa (6.1 million sq km)
North Africa (6.0 million sq km)
Economic force Agglomeration Speeded by migration,
capital mobility, and
trade
Migration Influenced by
agglomeration and
specialization
Specialization/Trade Aided by agglomeration
and factor mobility
Key factor of
production
Land Immobile
Labor Mobile within countries
Intermediate inputs Mobile within and
between countries
Note: Throughout the report, areas are within-country economic neighborhoods or administrative units
such as states or provinces, and regions are groupings of countries based on geographic proximity.
Source: WDR Team.
June 28, 2008 Mumbai Consultation 40
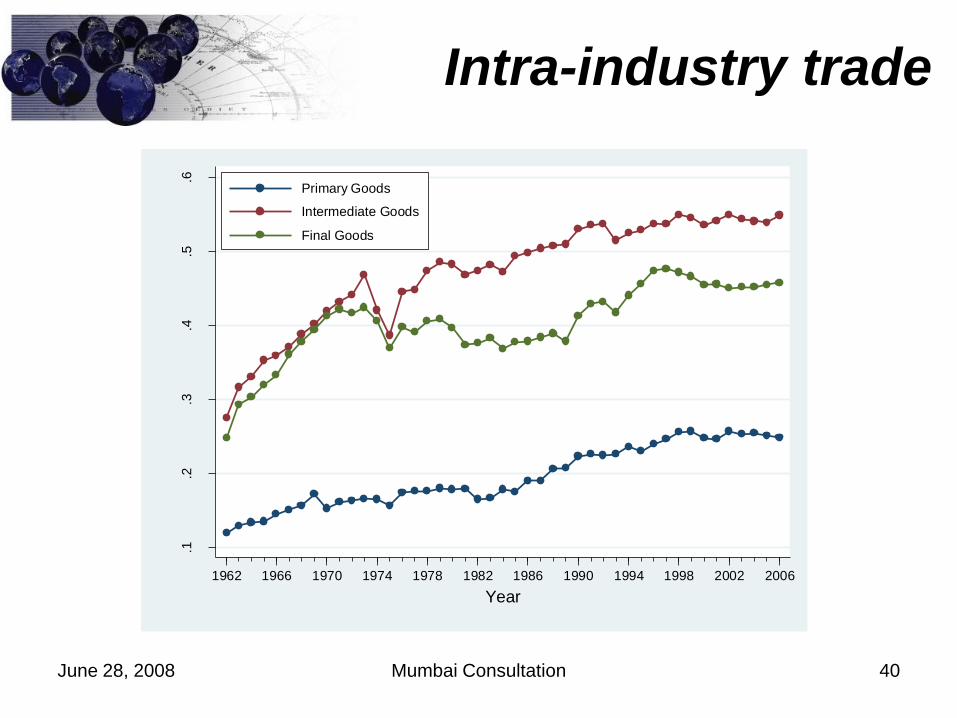
Intra-industry trade
.1.2
.3.4
.5.6
GL, 3
-dig
it
1962 1966 1970 1974 1978 1982 1986 1990 1994 1998 2002 2006
Year
Primary Goods
Intermediate Goods
Final Goods

June 28, 2008 Mumbai Consultation 41
Intra-industry trade
0.630.62
0.440.21
0.560.47
0.20
0.540.53
0.400.26
0.410.32
0.130.02
0.340.30
0.120.04
0.250.14
0.160.06
0.230.15
0.080.02
0.140.11
0.170.03
0.080.04
0.020.02
0.070.05
0.020.00
0.060.03
0.010.01
0.03
0.020.04
0.030.05
0.020.01
0.020.03
0.010.01
0.030.03
0.00
0 .2 .4 .6GL index, 3-digit, intra-group trade
North America
Australia and New Zealand
Western Europe
Southeast Asia and Pacific
Northeast Asia
Eastern Europe and Russia
South America
Central America and Caribbean
Southern Asia
Western Asia
Eastern Africa
Central Asia, Caucasus and Turkey
Northern Africa
Middle Africa
Western Africa
Southern Africa
1962 1975 1990 2006

June 28, 2008 Mumbai Consultation 42
Dimensions
Density, distance, and division are the most important dimensions at the local, national, and
international scales, respectively
Spatial Scales
Local National International
Unit Area Country Region
Most important
dimension Density Of rural and urban
settlements
Distance Between lagging and
leading areas
Division Between isolated and
connected countries
Second-most
important dimension
Distance Due to congestion
Density Of population and poverty
in lagging areas
Distance To major world markets
Third-most important
dimension
Division
Between formal and
informal settlements
Division
Between areas within
countries
Density
Absence of large country in
region
Note: Throughout the report, areas are within-country economic neighborhoods or administrative units
such as states or provinces, and regions are groupings of countries based on geographic proximity.
Source: WDR Team.

June 28, 2008 Mumbai Consultation 43
Economic density
Production is concentrated in just a few places

June 28, 2008 Mumbai Consultation 44
Economic distance
Travel time in hours and days to the nearest city of 50,000 or more people
0 1 2 3 4 6 8 12 18 24 36 2d 3d 4d 5d
Distance to density can be great even in developed countries

June 28, 2008 Mumbai Consultation 45
Economic division
Borders are thickest in the poorest regions of the world
June 28, 2008 Mumbai Consultation 46
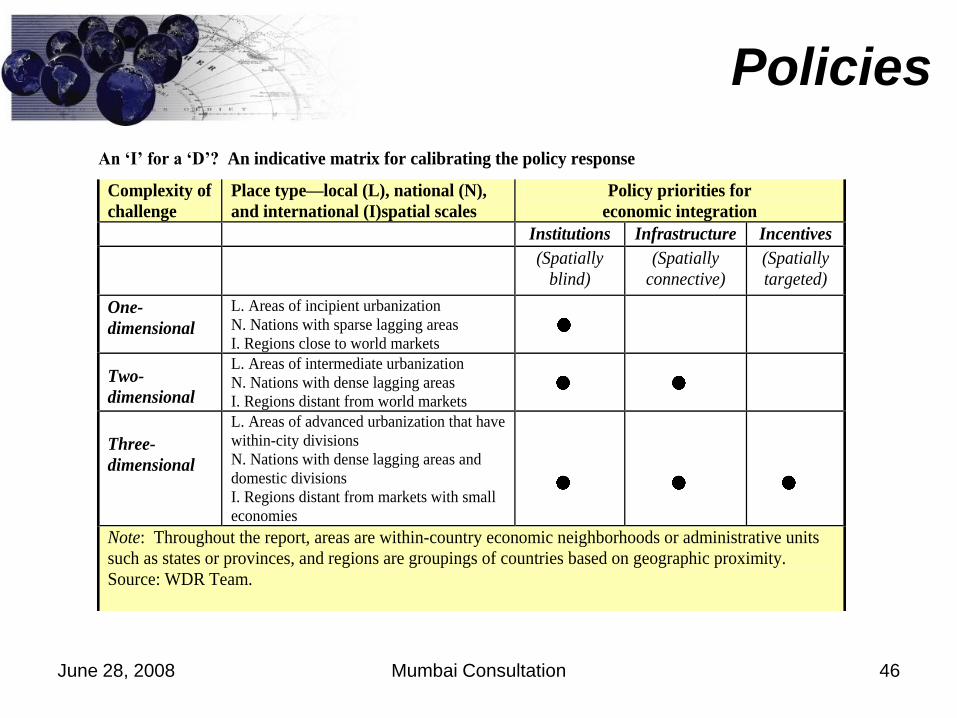
Policies
An ‘I’ for a ‘D’? An indicative matrix for calibrating the policy response
Complexity of
challenge
Place type—local (L), national (N),
and international (I)spatial scales
Policy priorities for
economic integration
Institutions Infrastructure Incentives
(Spatially
blind)
(Spatially
connective)
(Spatially
targeted)
One-
dimensional
L. Areas of incipient urbanization
N. Nations with sparse lagging areas
I. Regions close to world markets
Two-
dimensional
L. Areas of intermediate urbanization
N. Nations with dense lagging areas
I. Regions distant from world markets
Three-
dimensional
L. Areas of advanced urbanization that have
within-city divisions
N. Nations with dense lagging areas and
domestic divisions
I. Regions distant from markets with small
economies
Note: Throughout the report, areas are within-country economic neighborhoods or administrative units
such as states or provinces, and regions are groupings of countries based on geographic proximity.
Source: WDR Team.
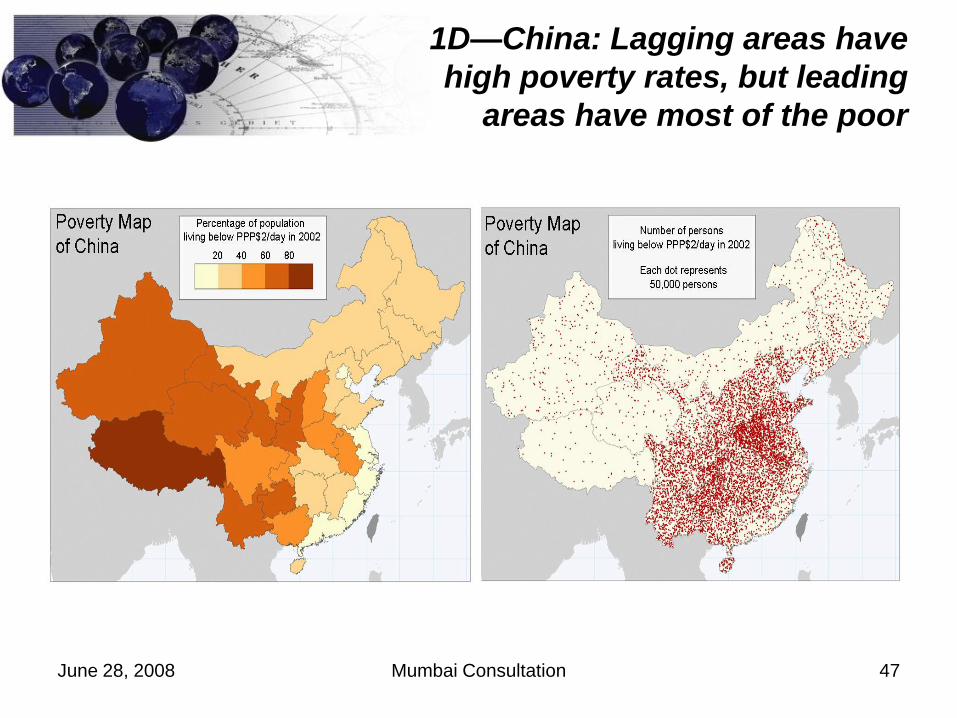
June 28, 2008 Mumbai Consultation 47
1D—China: Lagging areas have
high poverty rates, but leading
areas have most of the poor
June 28, 2008 Mumbai Consultation 48
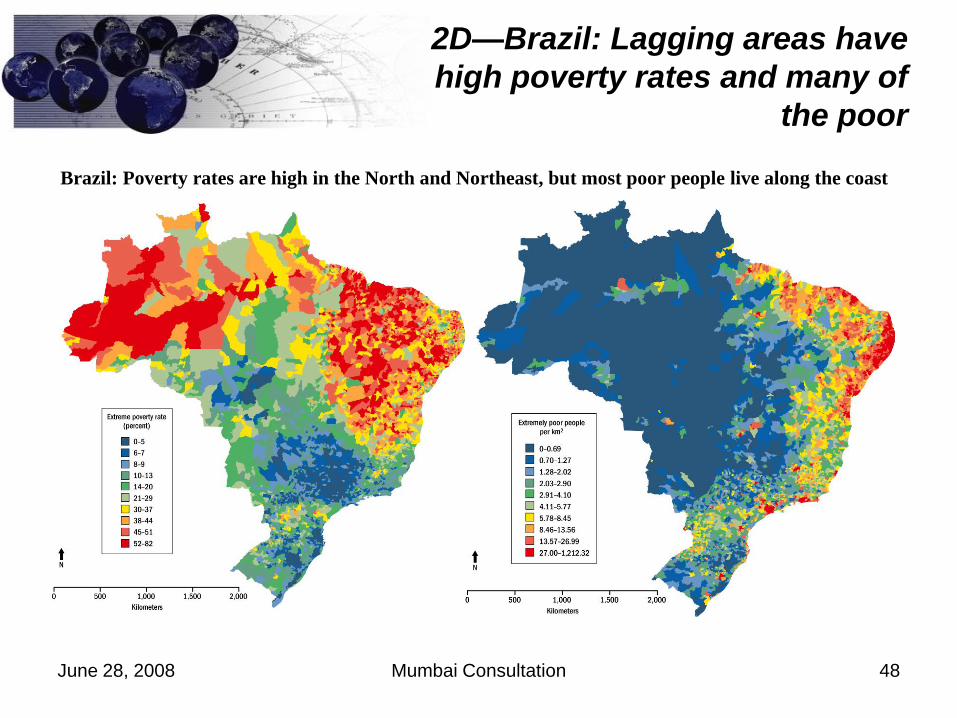
2D—Brazil: Lagging areas have
high poverty rates and many of
the poor
Brazil: Poverty rates are high in the North and Northeast, but most poor people live along the coast
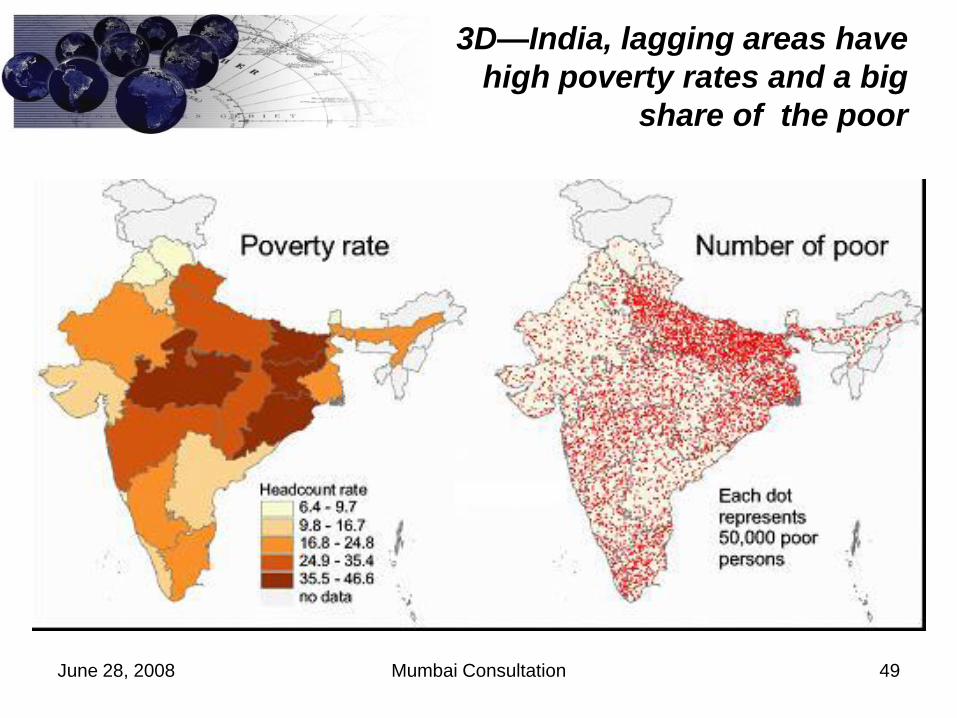
June 28, 2008 Mumbai Consultation 49
3D—India, lagging areas have
high poverty rates and a big
share of the poor

June 28, 2008 Mumbai Consultation 50
Market access measures help to
classify regionsAccess to (domestic and foreign) markets differs greatly: Real market potential in 2003
Source: Mayer (2008) for this Report.
The 3Ds suggest a simple taxonomy of the world’s neighborhoods
June 28, 2008 Mumbai Consultation 51
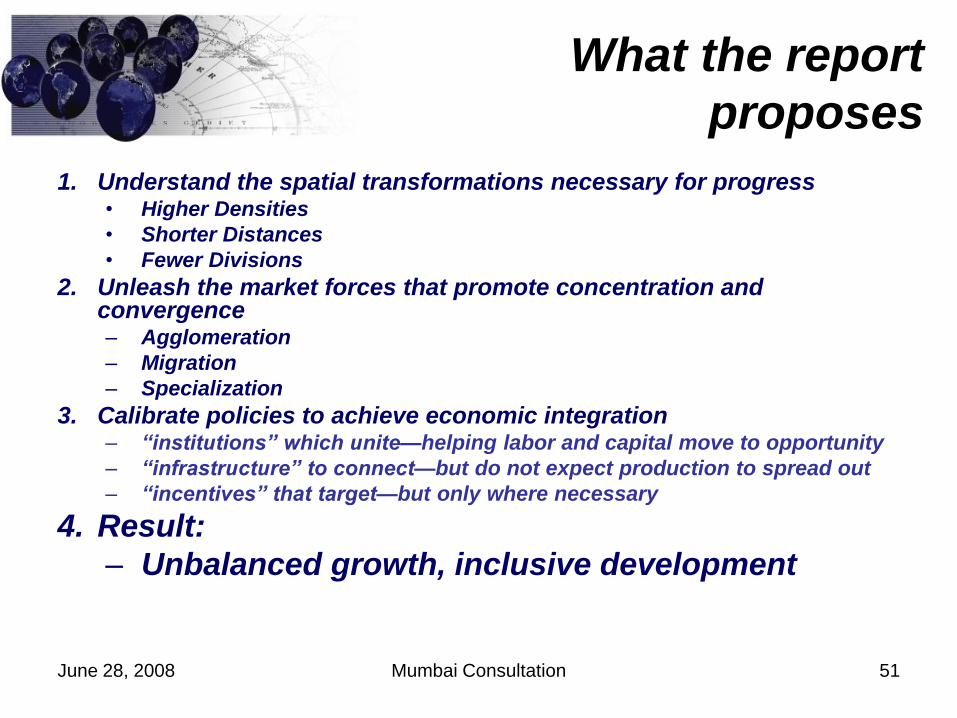
What the report
proposes
1. Understand the spatial transformations necessary for progress• Higher Densities
• Shorter Distances
• Fewer Divisions
2. Unleash the market forces that promote concentration and convergence– Agglomeration
– Migration
– Specialization
3. Calibrate policies to achieve economic integration– “institutions” which unite—helping labor and capital move to opportunity
– “infrastructure” to connect—but do not expect production to spread out
– “incentives” that target—but only where necessary
4. Result:
– Unbalanced growth, inclusive development