Embed Size (px)
Citation preview

Competitive Factors
Pulse income premium gone
Weak grains, strong oilseeds
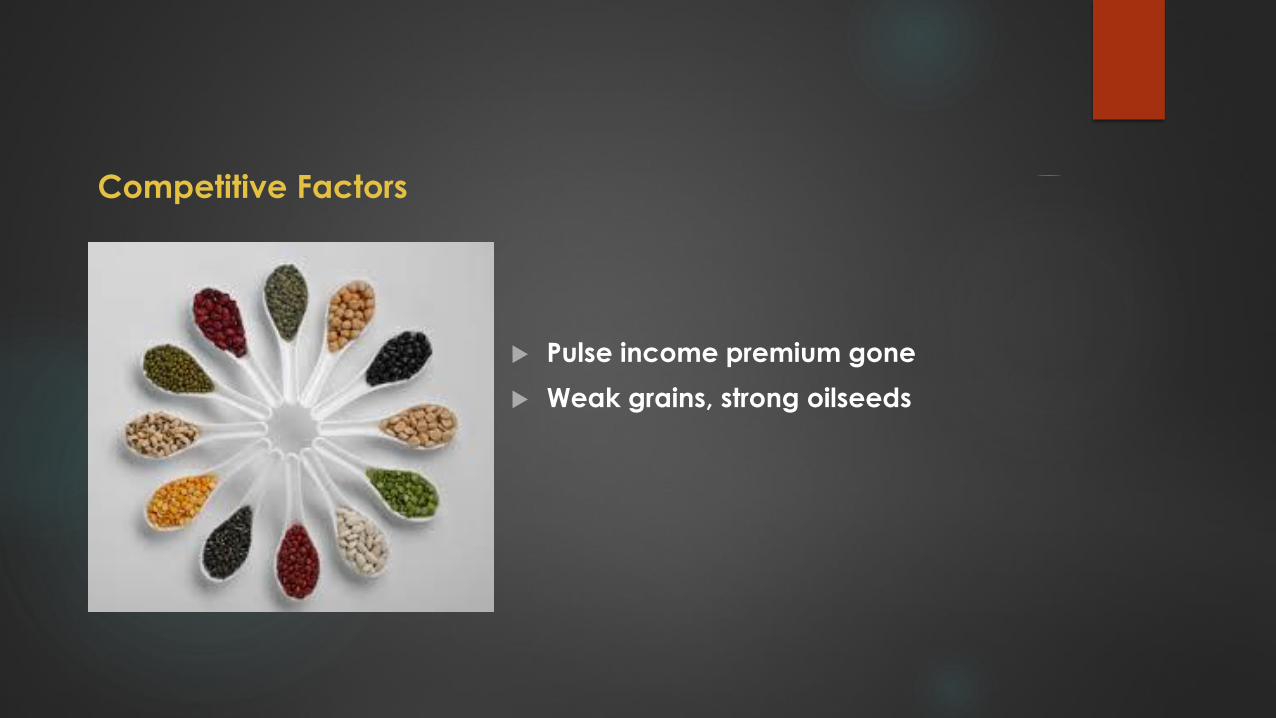
World Pulse Supply Outlook(metric tons)
5-Year 2016 2017
Peas 11,708,000 14,094,000 12,965,000
Lentils 5,186,000 6,422,000 6,340,000
Kabuli Chickpea 2,414,000 2,543,000 2,815,000
Beans 22,274,000 22,078,000 22,554,000
Faba/Broadbean 4,151,000 5,249,000 4,246,000
All Pulses 70,882,000 74,351,000 74,913,000
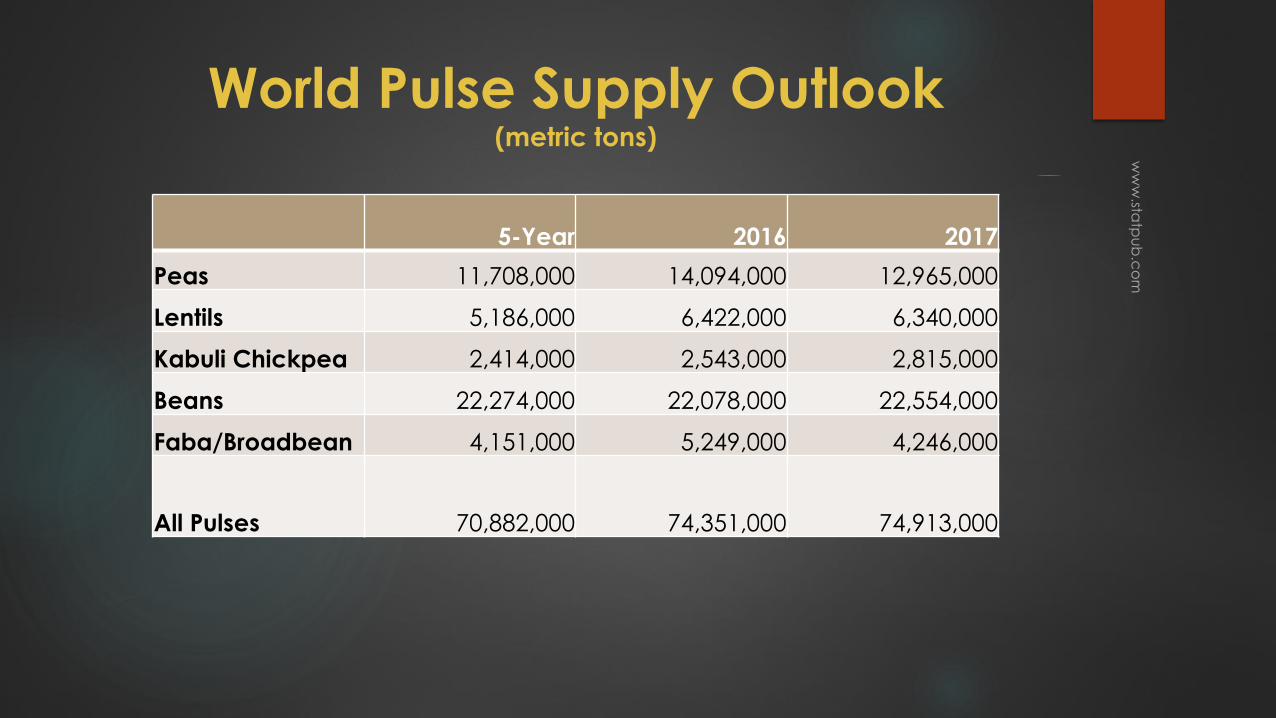
Price Index Comparison(2004 equals 100)
0.00
50.00
100.00
150.00
200.00
250.00
300.00
350.00
Oil
Grains
Oilseeds
Pulses
Pulses sliding back to
normal relationship
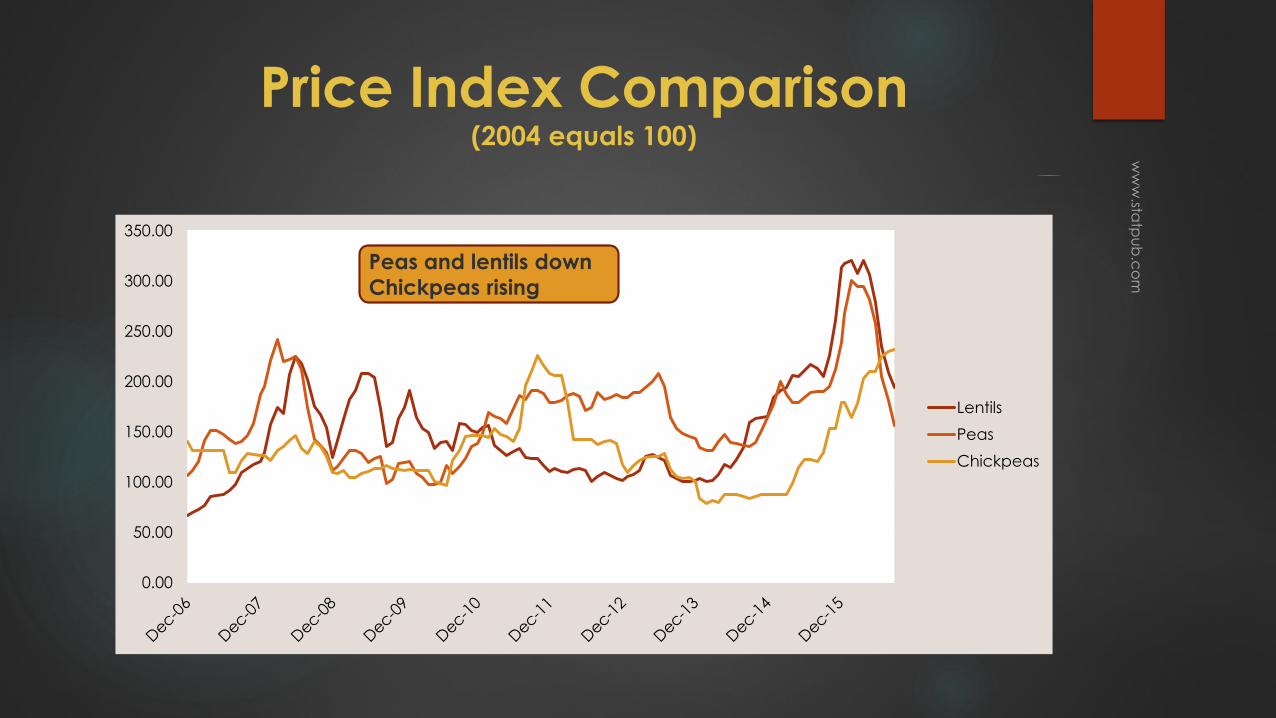
Price Index Comparison(2004 equals 100)
0.00
50.00
100.00
150.00
200.00
250.00
300.00
350.00
Lentils
Peas
Chickpeas
Peas and lentils down
Chickpeas rising
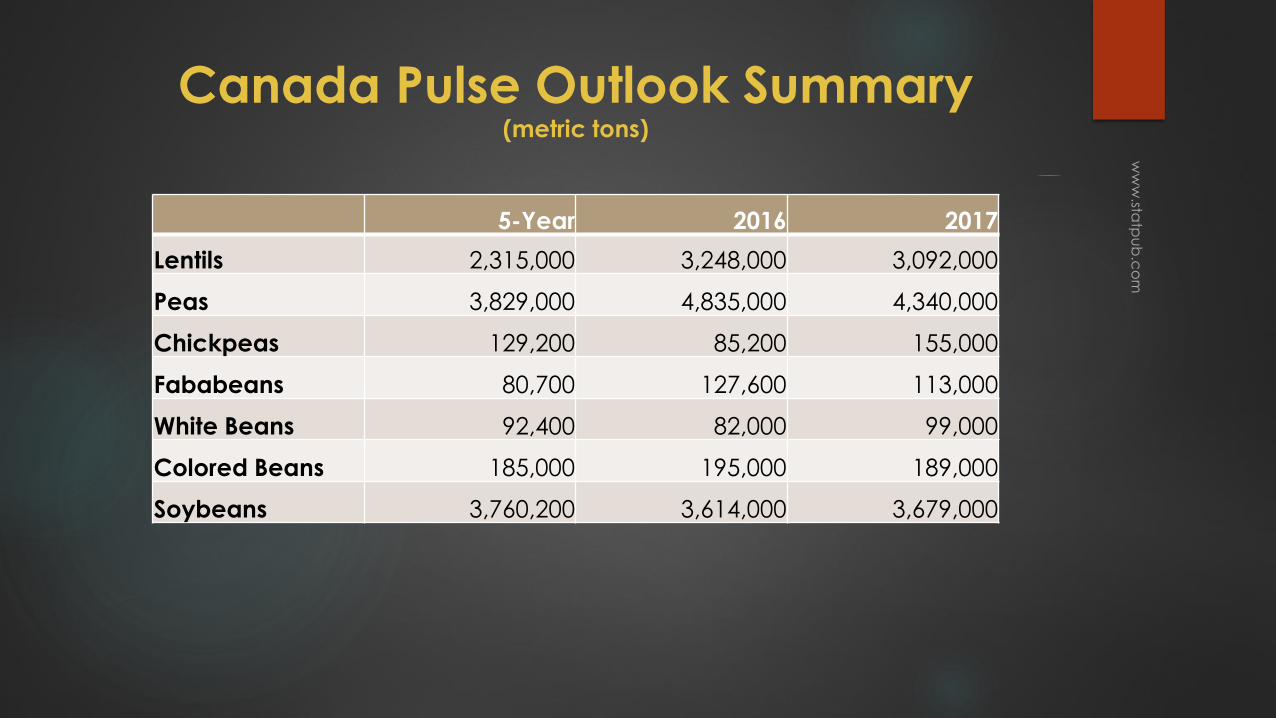
Canada Pulse Outlook Summary(metric tons)
5-Year 2016 2017
Lentils 2,315,000 3,248,000 3,092,000
Peas 3,829,000 4,835,000 4,340,000
Chickpeas 129,200 85,200 155,000
Fababeans 80,700 127,600 113,000
White Beans 92,400 82,000 99,000
Colored Beans 185,000 195,000 189,000
Soybeans 3,760,200 3,614,000 3,679,000
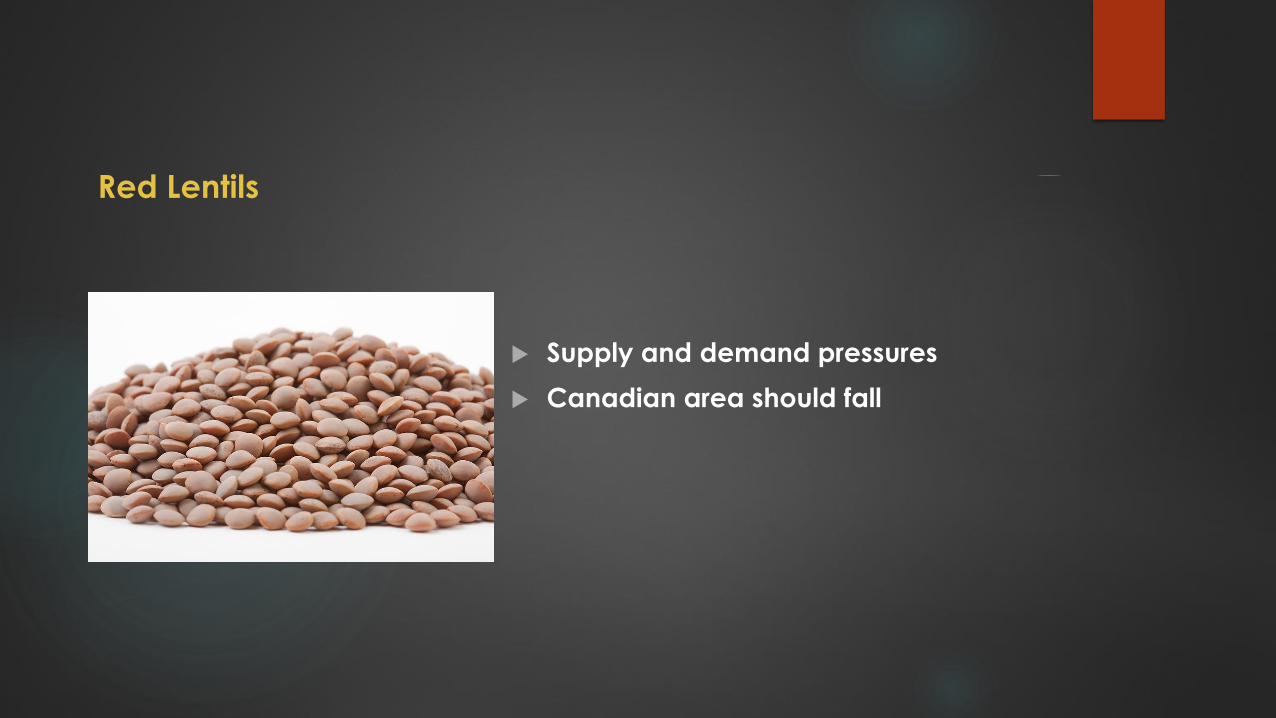
Red Lentils
Supply and demand pressures
Canadian area should fall

World Lentil Supply Demand(metric tons)
5-Year 2016-17 2017-18
Area (hectares) 4,510,000 5,564,000 5,320,000
Production 5,250,000 6,523,000 6,263,000
Carry-in 670,000 190,000 1,027,000
Supply 5,920,000 6,713,000 7,290,000
Trade 2,800,000 3,113,000 3,295,000
Inferred Use 5,270,000 5,686,000 6,183,000
Ending Stock 650,000 1,027,000 1,107,000
Stock-Use Ratio 12% 18% 18%
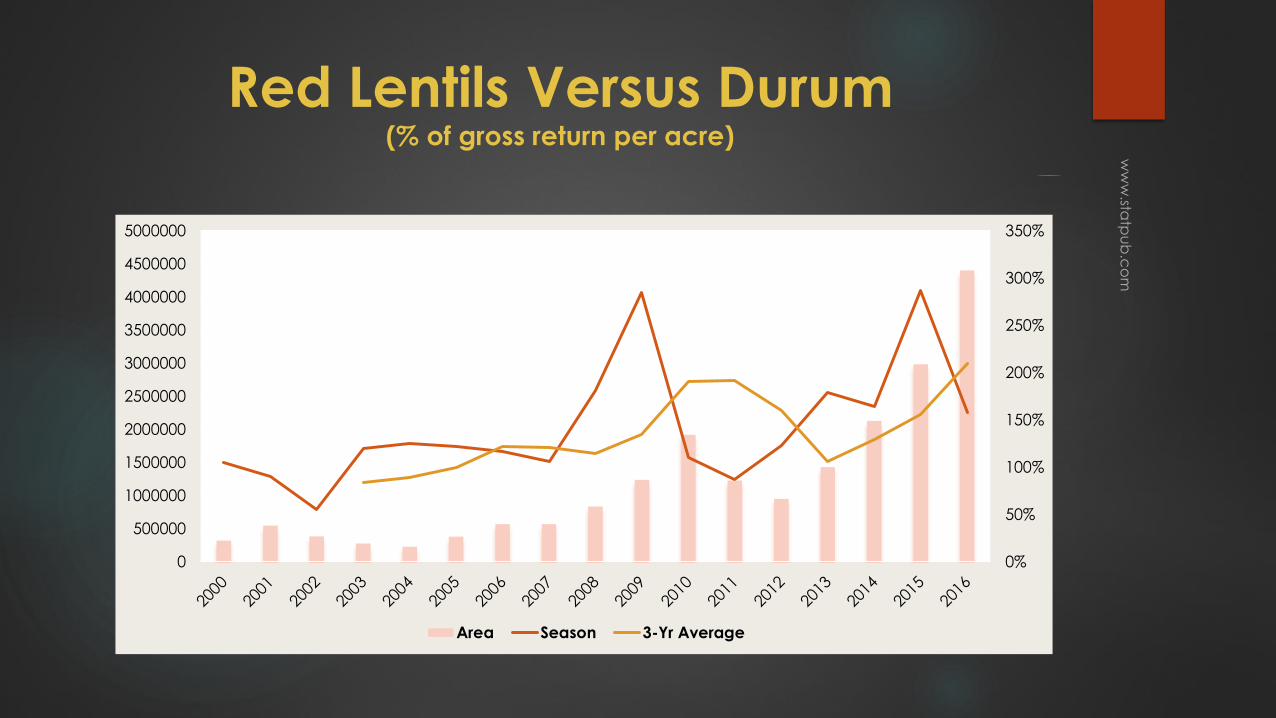
Red Lentils Versus Durum(% of gross return per acre)
0%
50%
100%
150%
200%
250%
300%
350%
0
500000
1000000
1500000
2000000
2500000
3000000
3500000
4000000
4500000
5000000
Area Season 3-Yr Average
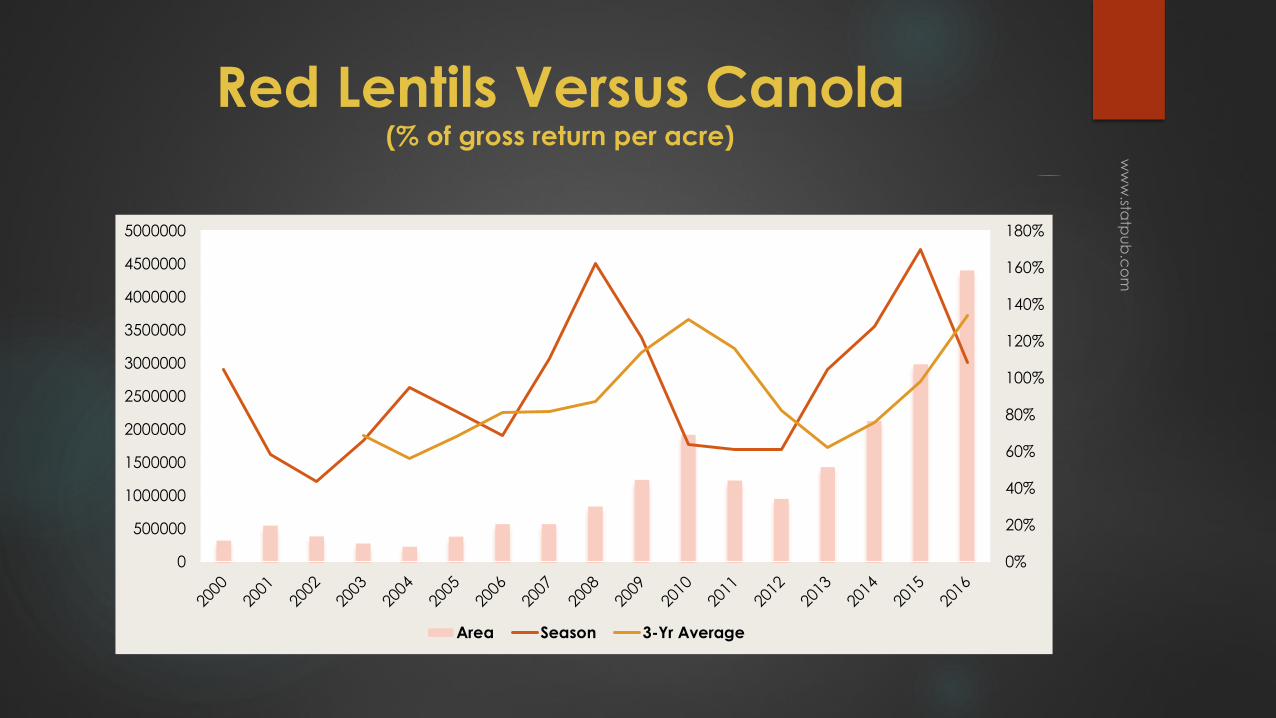
Red Lentils Versus Canola(% of gross return per acre)
0%
20%
40%
60%
80%
100%
120%
140%
160%
180%
0
500000
1000000
1500000
2000000
2500000
3000000
3500000
4000000
4500000
5000000
Area Season 3-Yr Average
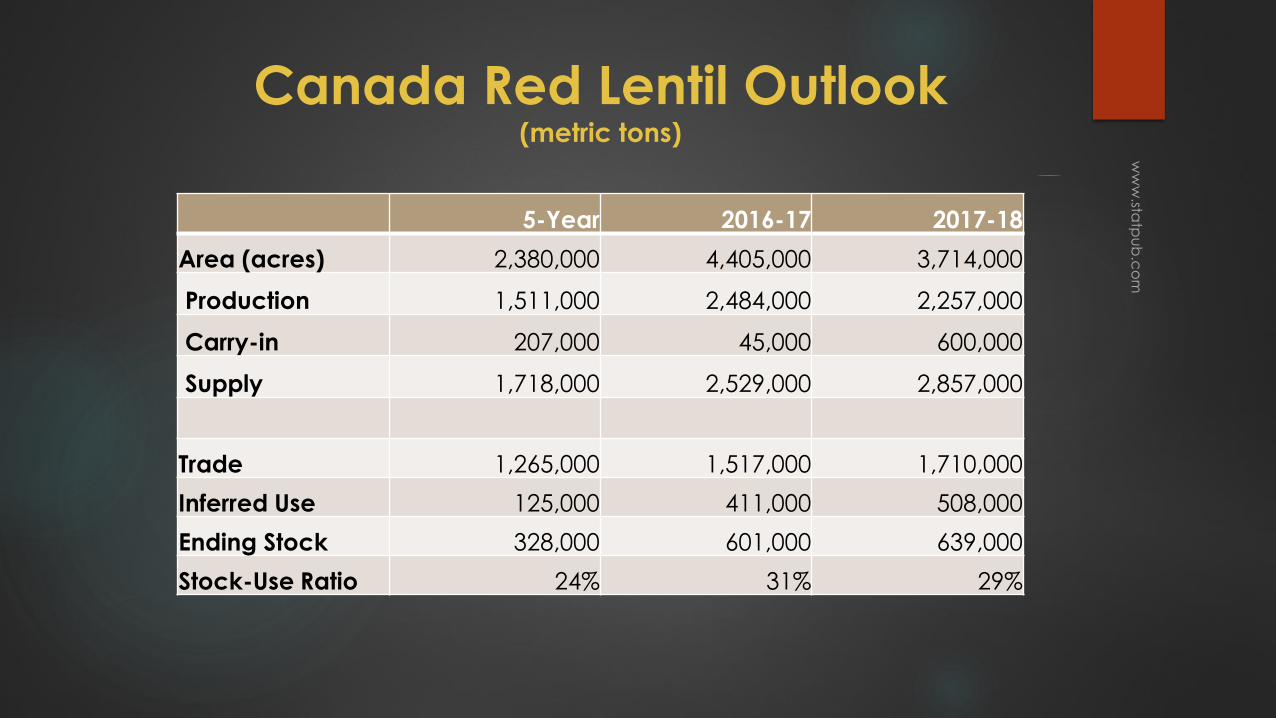
Canada Red Lentil Outlook(metric tons)
5-Year 2016-17 2017-18
Area (acres) 2,380,000 4,405,000 3,714,000
Production 1,511,000 2,484,000 2,257,000
Carry-in 207,000 45,000 600,000
Supply 1,718,000 2,529,000 2,857,000
Trade 1,265,000 1,517,000 1,710,000
Inferred Use 125,000 411,000 508,000
Ending Stock 328,000 601,000 639,000
Stock-Use Ratio 24% 31% 29%
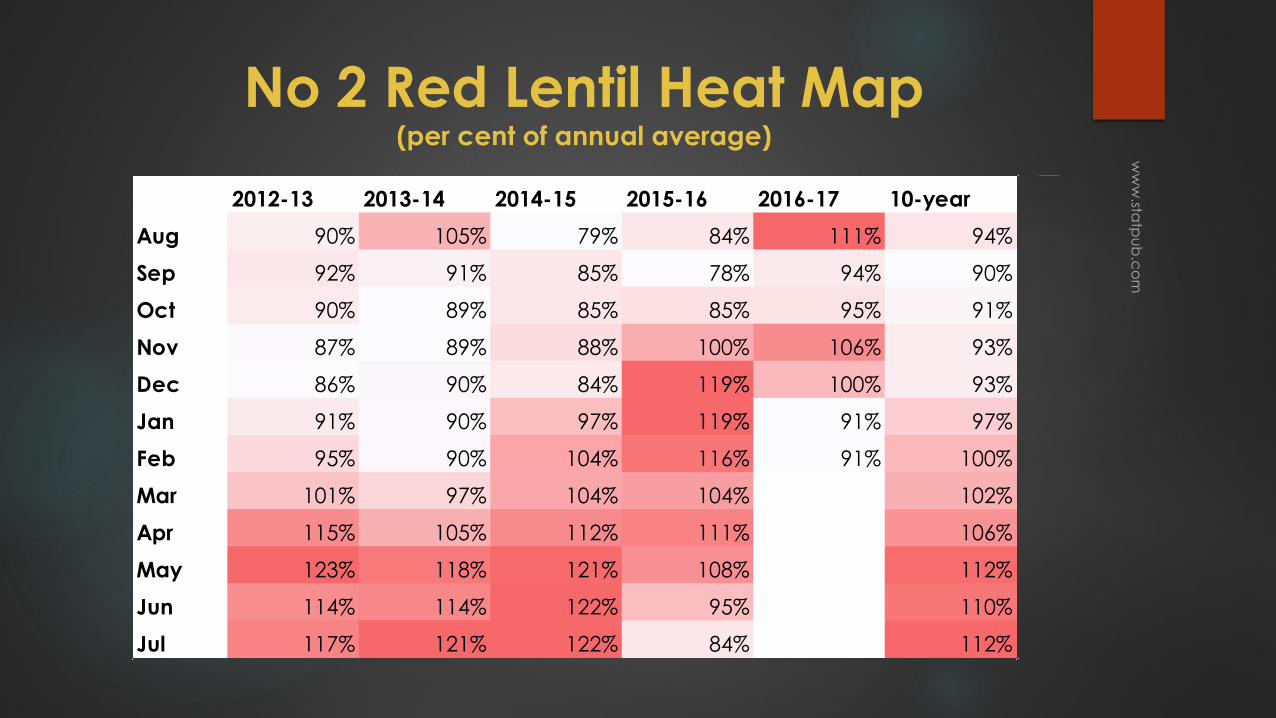
No 2 Red Lentil Heat Map (per cent of annual average)
2012-13 2013-14 2014-15 2015-16 2016-17 10-year
Aug 90% 105% 79% 84% 111% 94%
Sep 92% 91% 85% 78% 94% 90%
Oct 90% 89% 85% 85% 95% 91%
Nov 87% 89% 88% 100% 106% 93%
Dec 86% 90% 84% 119% 100% 93%
Jan 91% 90% 97% 119% 91% 97%
Feb 95% 90% 104% 116% 91% 100%
Mar 101% 97% 104% 104% 102%
Apr 115% 105% 112% 111% 106%
May 123% 118% 121% 108% 112%
Jun 114% 114% 122% 95% 110%
Jul 117% 121% 122% 84% 112%
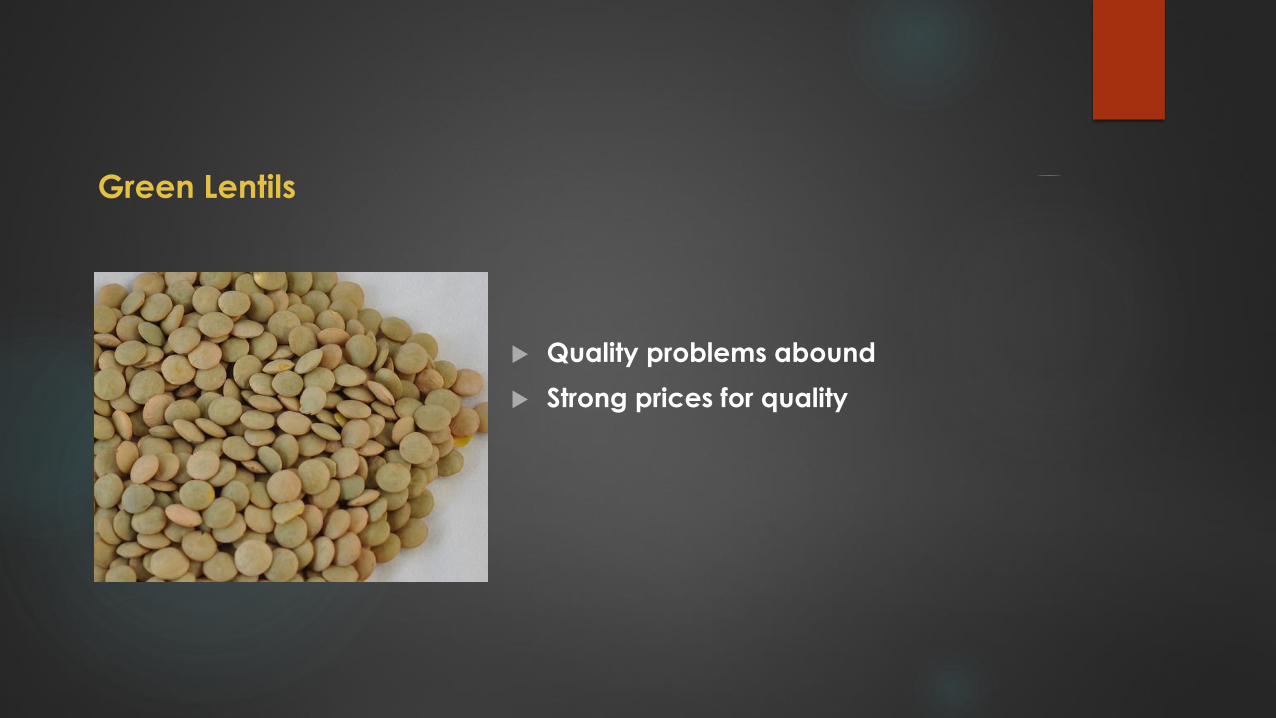
Green Lentils
Quality problems abound
Strong prices for quality
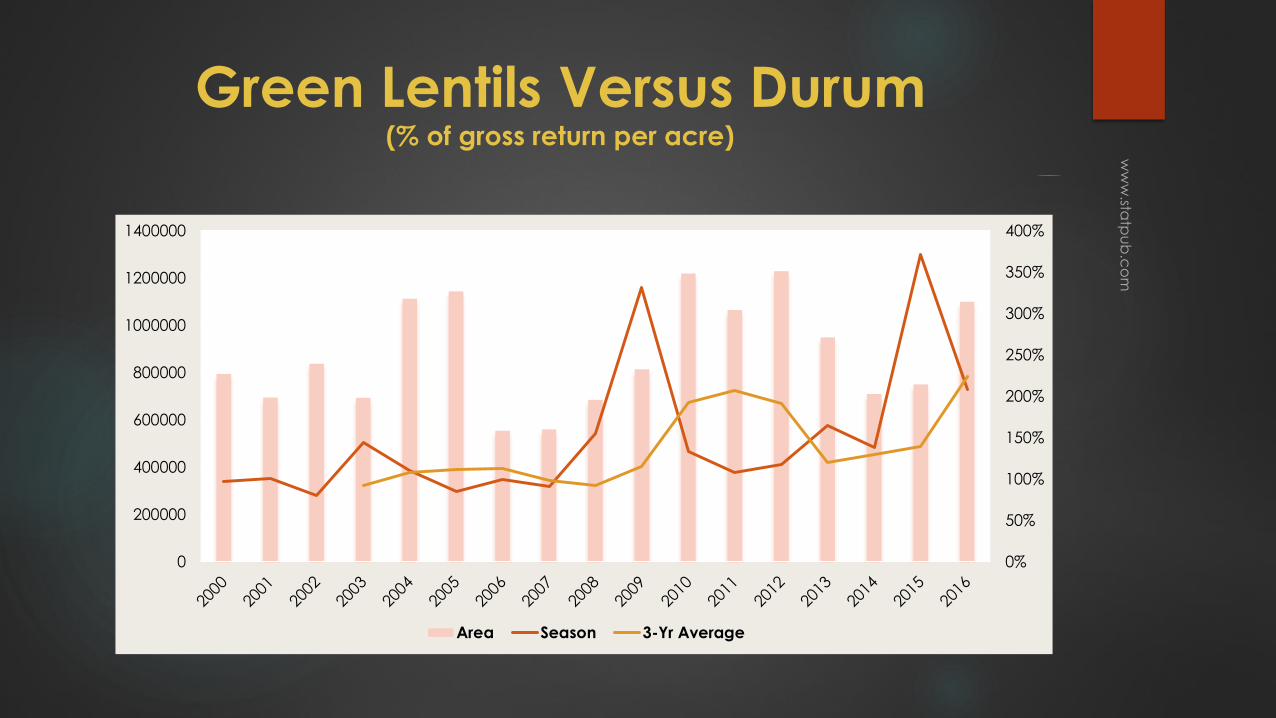
Green Lentils Versus Durum(% of gross return per acre)
0%
50%
100%
150%
200%
250%
300%
350%
400%
0
200000
400000
600000
800000
1000000
1200000
1400000
Area Season 3-Yr Average
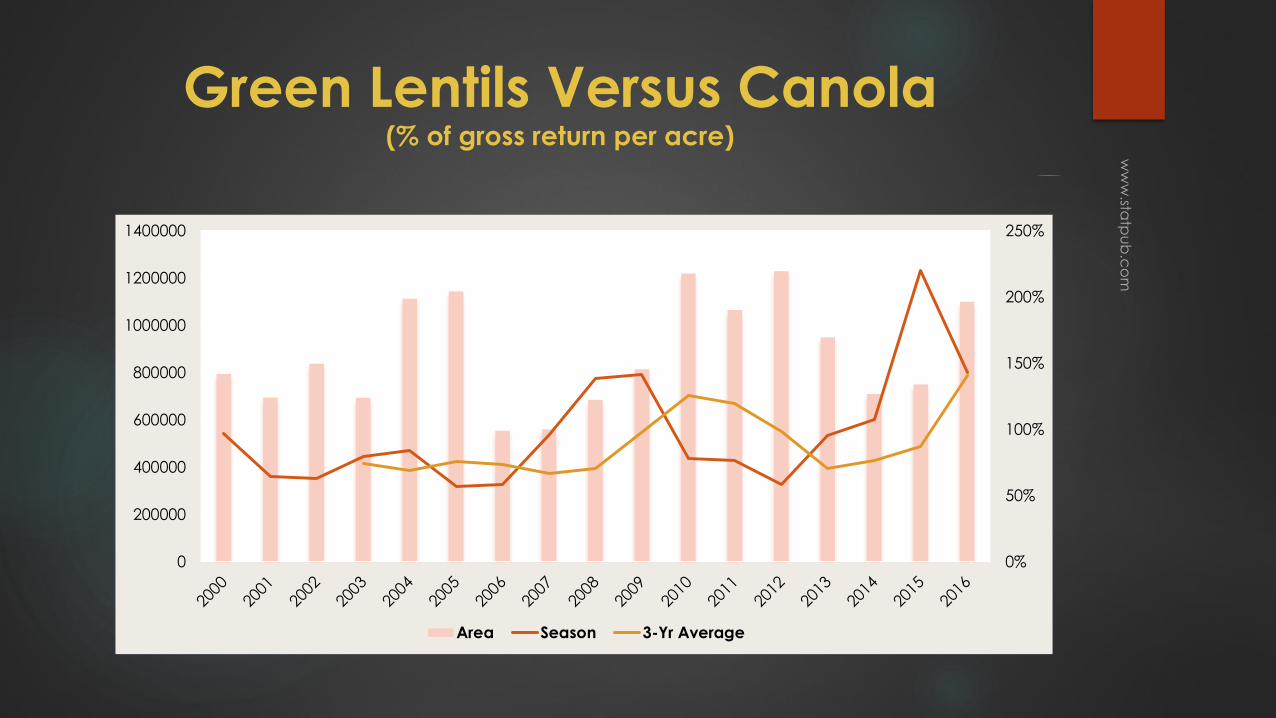
Green Lentils Versus Canola(% of gross return per acre)
0%
50%
100%
150%
200%
250%
0
200000
400000
600000
800000
1000000
1200000
1400000
Area Season 3-Yr Average
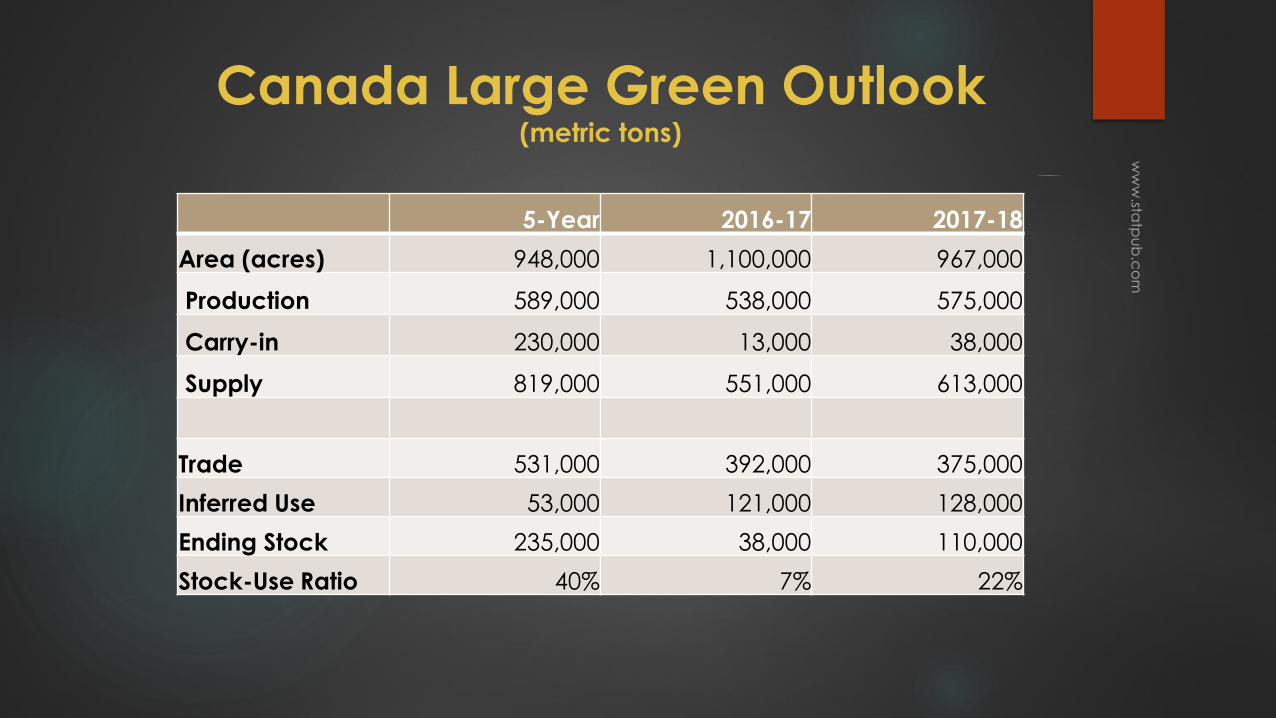
Canada Large Green Outlook(metric tons)
5-Year 2016-17 2017-18
Area (acres) 948,000 1,100,000 967,000
Production 589,000 538,000 575,000
Carry-in 230,000 13,000 38,000
Supply 819,000 551,000 613,000
Trade 531,000 392,000 375,000
Inferred Use 53,000 121,000 128,000
Ending Stock 235,000 38,000 110,000
Stock-Use Ratio 40% 7% 22%
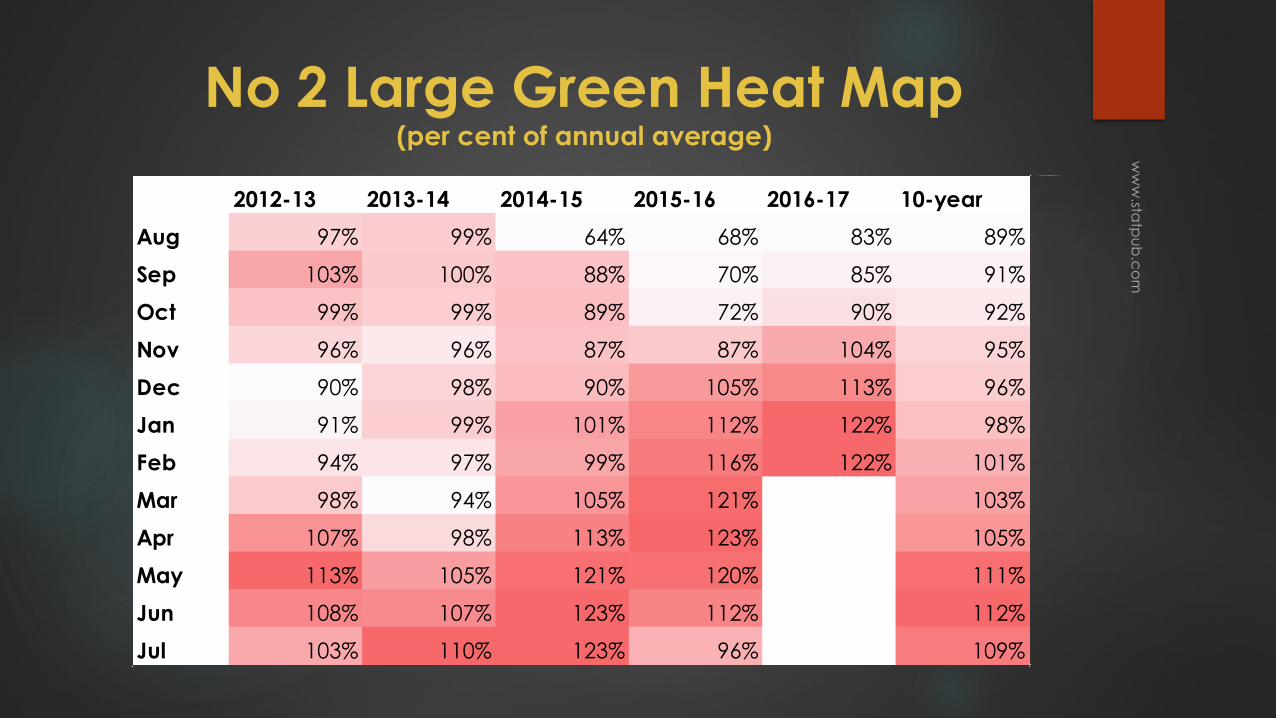
No 2 Large Green Heat Map (per cent of annual average)
2012-13 2013-14 2014-15 2015-16 2016-17 10-year
Aug 97% 99% 64% 68% 83% 89%
Sep 103% 100% 88% 70% 85% 91%
Oct 99% 99% 89% 72% 90% 92%
Nov 96% 96% 87% 87% 104% 95%
Dec 90% 98% 90% 105% 113% 96%
Jan 91% 99% 101% 112% 122% 98%
Feb 94% 97% 99% 116% 122% 101%
Mar 98% 94% 105% 121% 103%
Apr 107% 98% 113% 123% 105%
May 113% 105% 121% 120% 111%
Jun 108% 107% 123% 112% 112%
Jul 103% 110% 123% 96% 109%

Canada Small Green Outlook(metric tons)
5-Year 2016-17 2017-18
Area (acres) 264,000 305,000 318,000
Production 180,000 204,000 207,000
Carry-in 60,000 12,000 43,000
Supply 240,000 216,000 250,000
Trade 147,000 134,000 150,000
Inferred Use 16,000 39,000 41,000
Ending Stock 77,000 43,000 59,000
Stock-Use Ratio 47% 25% 31%
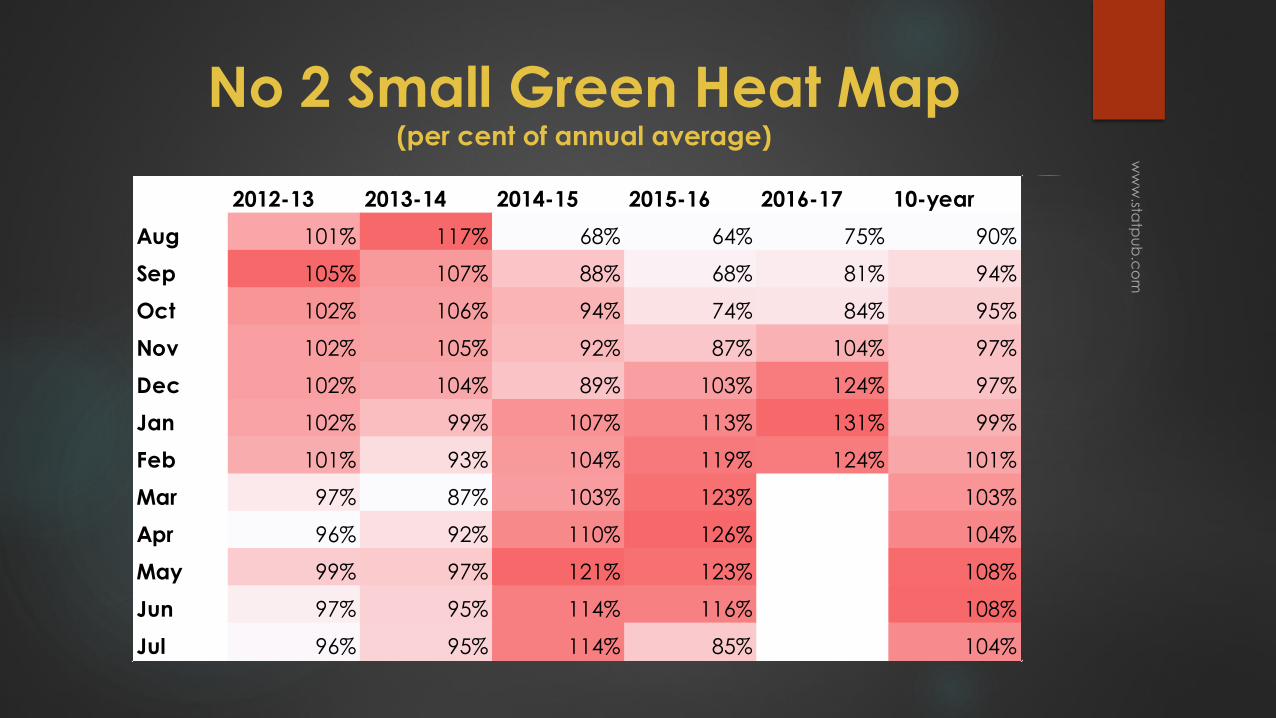
No 2 Small Green Heat Map (per cent of annual average)
2012-13 2013-14 2014-15 2015-16 2016-17 10-year
Aug 101% 117% 68% 64% 75% 90%
Sep 105% 107% 88% 68% 81% 94%
Oct 102% 106% 94% 74% 84% 95%
Nov 102% 105% 92% 87% 104% 97%
Dec 102% 104% 89% 103% 124% 97%
Jan 102% 99% 107% 113% 131% 99%
Feb 101% 93% 104% 119% 124% 101%
Mar 97% 87% 103% 123% 103%
Apr 96% 92% 110% 126% 104%
May 99% 97% 121% 123% 108%
Jun 97% 95% 114% 116% 108%
Jul 96% 95% 114% 85% 104%
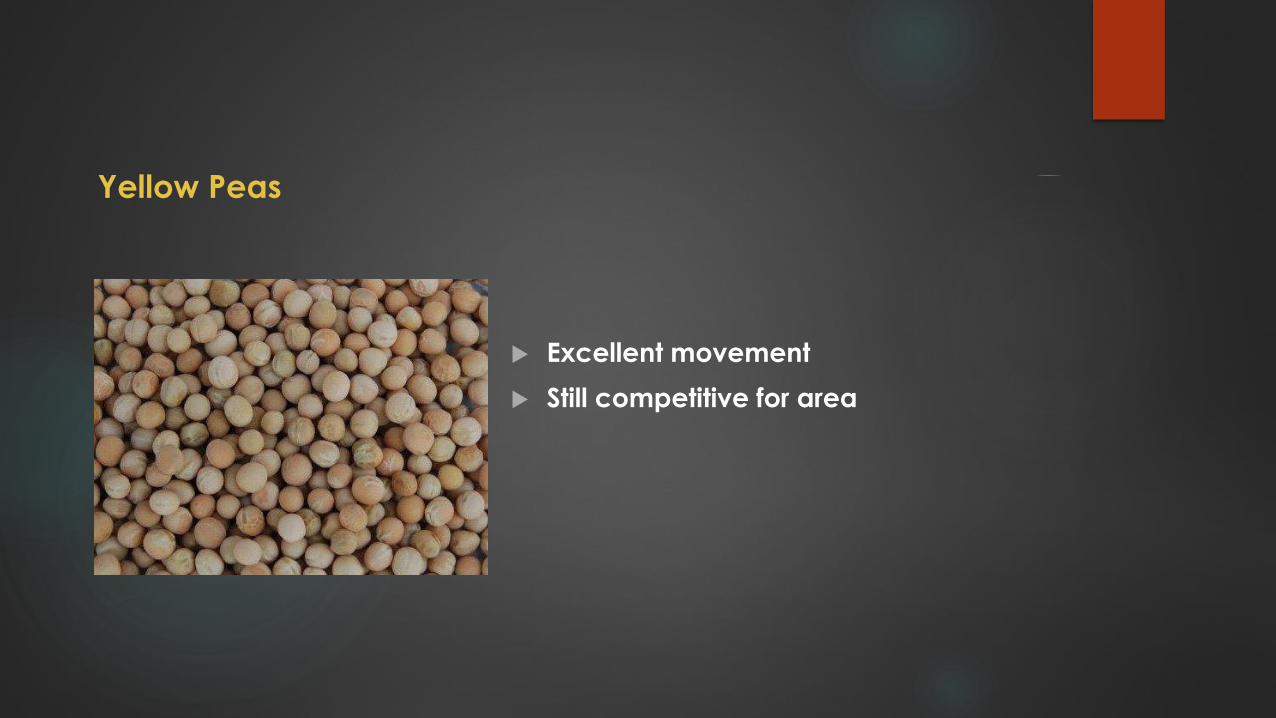
Yellow Peas
Excellent movement
Still competitive for area
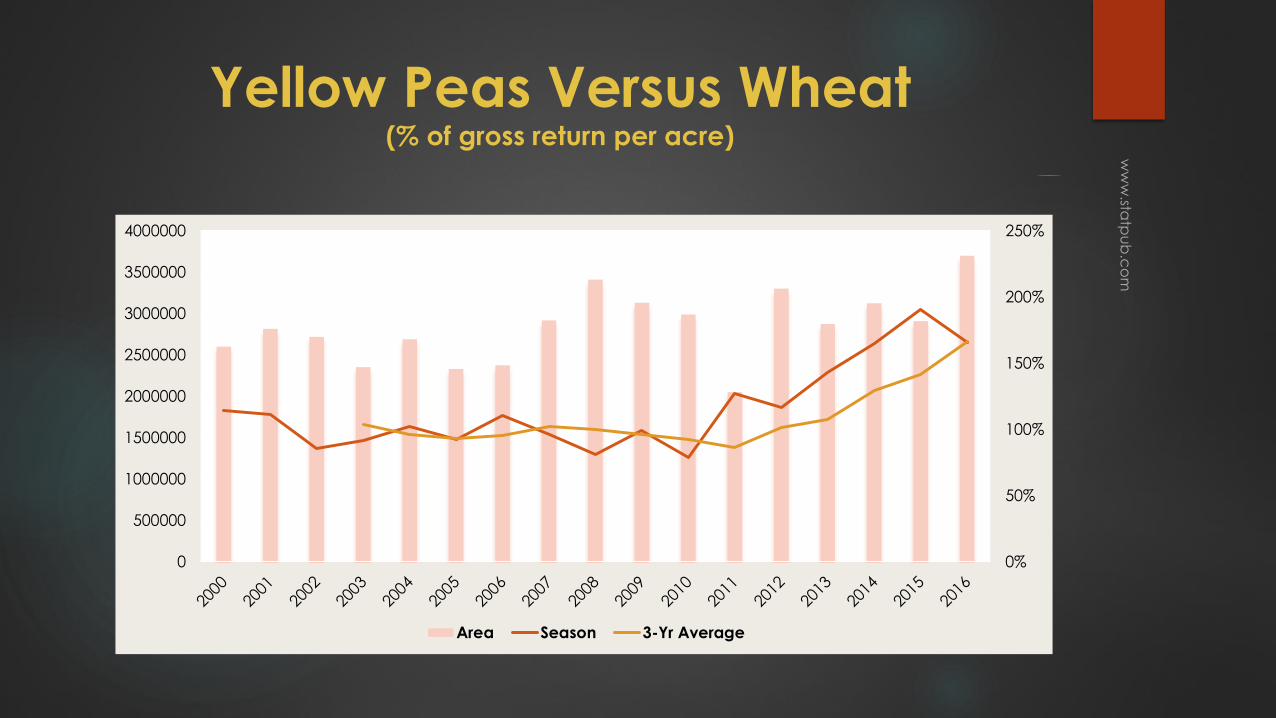
Yellow Peas Versus Wheat(% of gross return per acre)
0%
50%
100%
150%
200%
250%
0
500000
1000000
1500000
2000000
2500000
3000000
3500000
4000000
Area Season 3-Yr Average
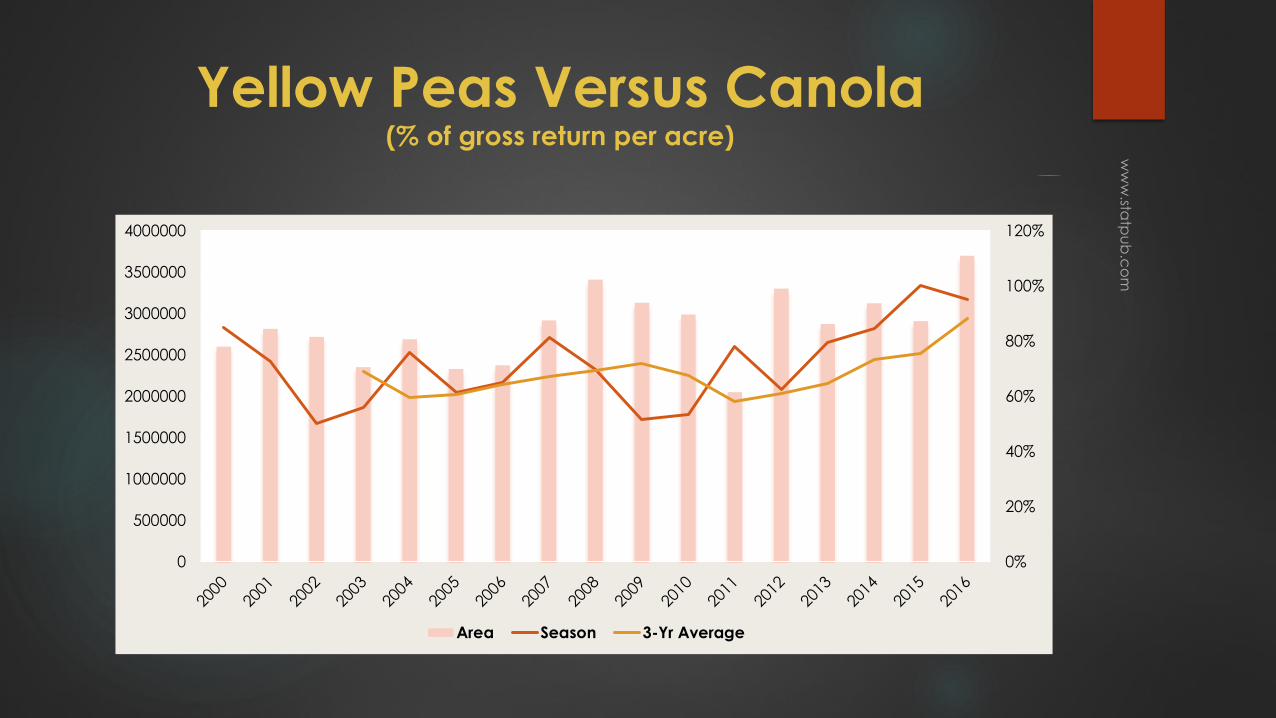
Yellow Peas Versus Canola(% of gross return per acre)
0%
20%
40%
60%
80%
100%
120%
0
500000
1000000
1500000
2000000
2500000
3000000
3500000
4000000
Area Season 3-Yr Average

Canada Yellow Pea Outlook(metric tons)
5-Year 2016-17 2017-18
Area (acres) 1,288,000 1,497,000 1,459,000
Production 3,247,000 4,169,000 3,744,000
Carry-in 267,000 115,000 729,000
Supply 3,514,000 4,284,000 4,473,000
Trade 2,483,000 2,748,000 2,326,000
Inferred Use 665,000 807,000 919,000
Ending Stock 366,000 729,000 1,228,000
Stock-Use Ratio 12% 21% 38%
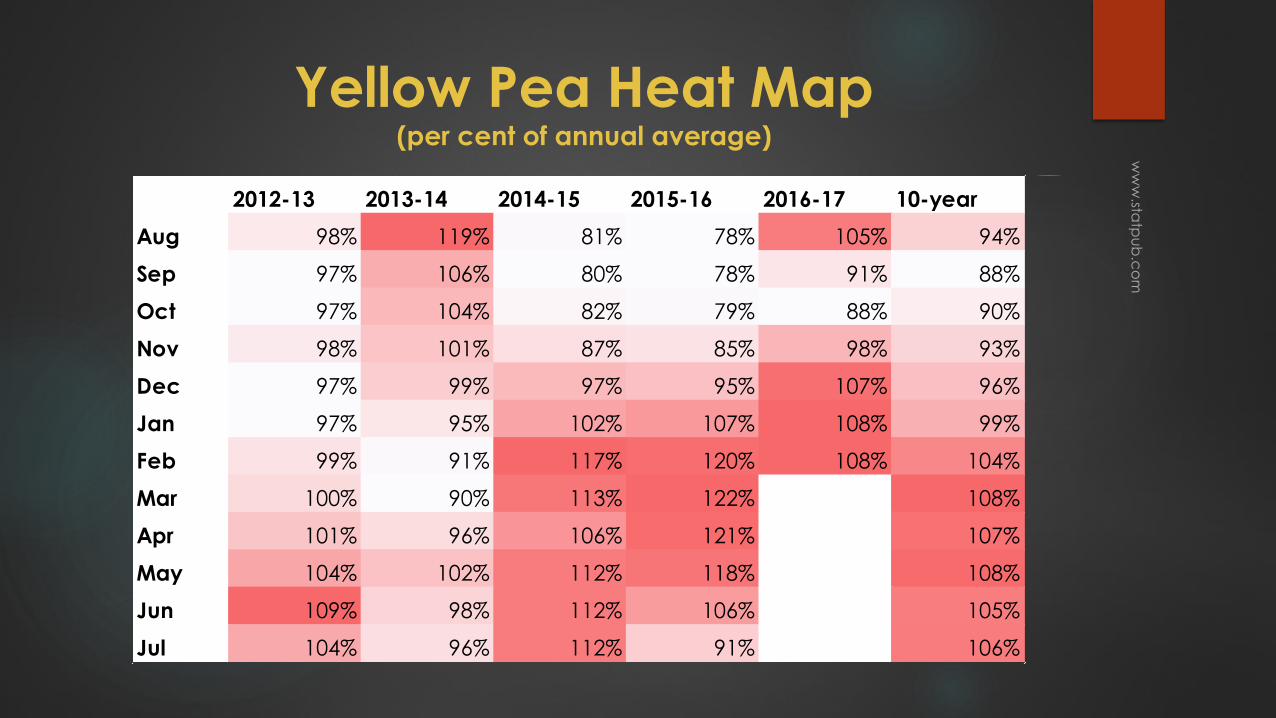
Yellow Pea Heat Map (per cent of annual average)
2012-13 2013-14 2014-15 2015-16 2016-17 10-year
Aug 98% 119% 81% 78% 105% 94%
Sep 97% 106% 80% 78% 91% 88%
Oct 97% 104% 82% 79% 88% 90%
Nov 98% 101% 87% 85% 98% 93%
Dec 97% 99% 97% 95% 107% 96%
Jan 97% 95% 102% 107% 108% 99%
Feb 99% 91% 117% 120% 108% 104%
Mar 100% 90% 113% 122% 108%
Apr 101% 96% 106% 121% 107%
May 104% 102% 112% 118% 108%
Jun 109% 98% 112% 106% 105%
Jul 104% 96% 112% 91% 106%
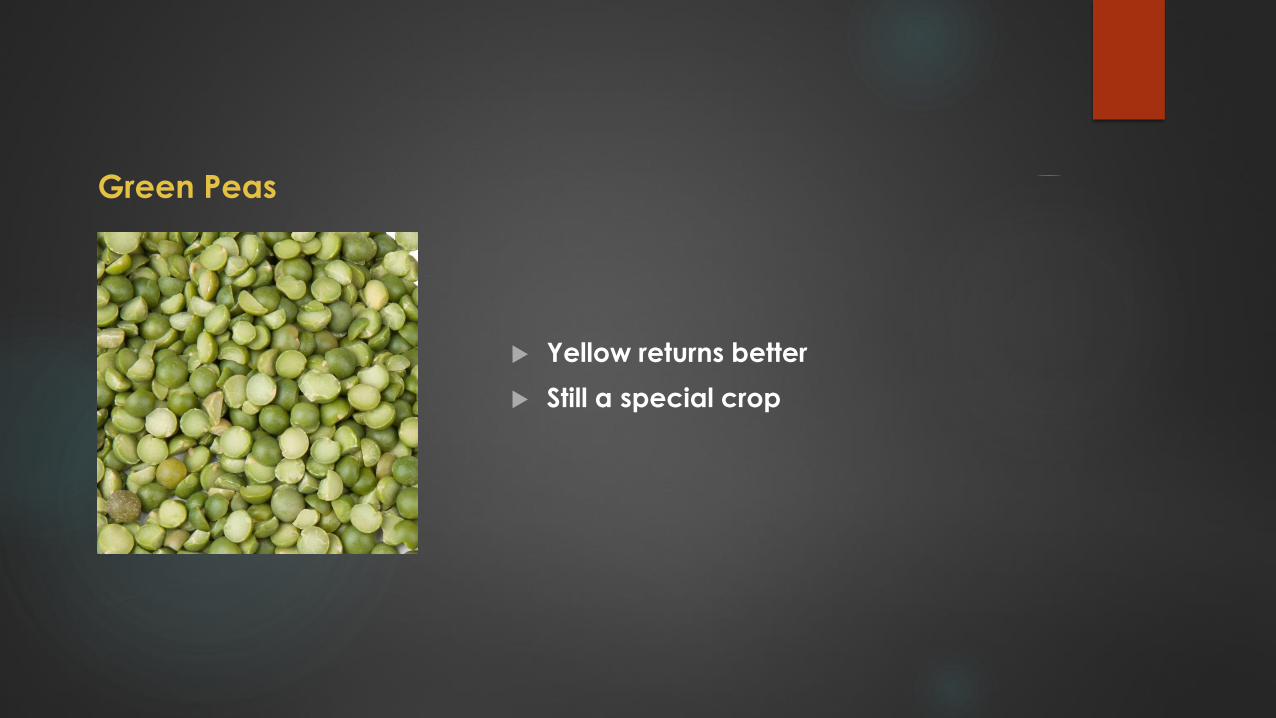
Green Peas
Yellow returns better
Still a special crop
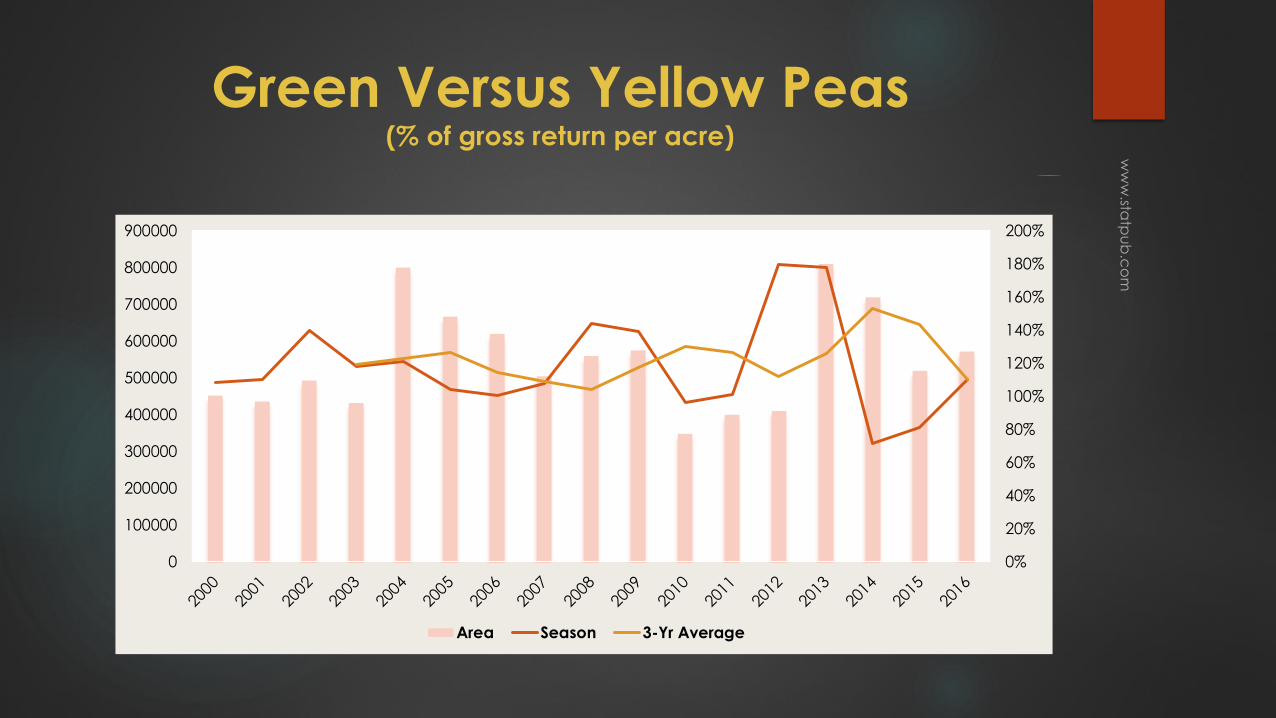
Green Versus Yellow Peas(% of gross return per acre)
0%
20%
40%
60%
80%
100%
120%
140%
160%
180%
200%
0
100000
200000
300000
400000
500000
600000
700000
800000
900000
Area Season 3-Yr Average

Canada Green Pea Outlook(metric tons)
5-Year 2016-17 2017-18
Area (acres) 231,000 210,000 231,000
Production 543,000 623,000 573,000
Carry-in 57,000 60,000 20,000
Supply 600,000 683,000 593,000
Trade 372,000 457,000 450,000
Inferred Use 174,000 206,000 123,000
Ending Stock 54,000 20,000 20,000
Stock-Use Ratio 10% 3% 3%
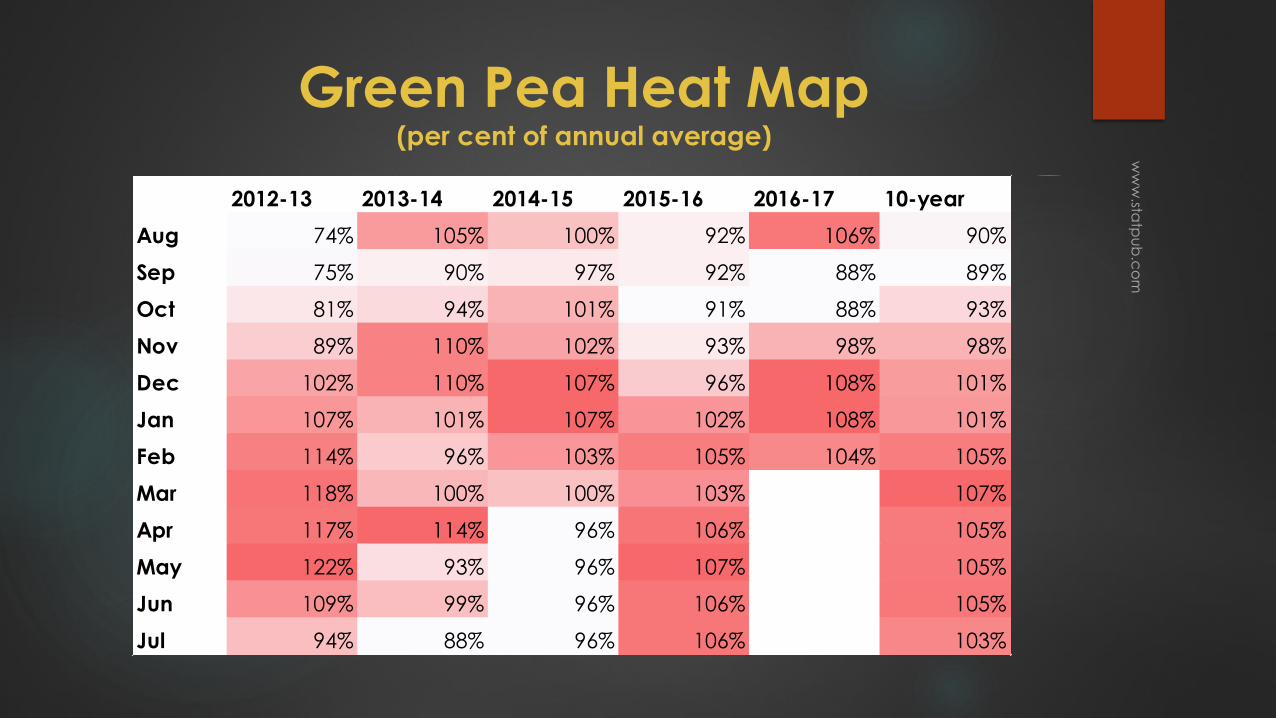
Green Pea Heat Map (per cent of annual average)
2012-13 2013-14 2014-15 2015-16 2016-17 10-year
Aug 74% 105% 100% 92% 106% 90%
Sep 75% 90% 97% 92% 88% 89%
Oct 81% 94% 101% 91% 88% 93%
Nov 89% 110% 102% 93% 98% 98%
Dec 102% 110% 107% 96% 108% 101%
Jan 107% 101% 107% 102% 108% 101%
Feb 114% 96% 103% 105% 104% 105%
Mar 118% 100% 100% 103% 107%
Apr 117% 114% 96% 106% 105%
May 122% 93% 96% 107% 105%
Jun 109% 99% 96% 106% 105%
Jul 94% 88% 96% 106% 103%
Fababeans
Egypt is only major market
The bloom is off?

Canada Fababean Outlook(metric tons)
5-Year 2016-17 2017-18
Area (acres) 64,000 97,000 86,000
Production 81,000 127,600 113,000
Carry-in 12,000 40,000 30,000
Supply 99,000 169,000 143,900
Trade 20,000 38,400 43,100
Inferred Use 81,000 138,999 138,900
Ending Stock 18,000 30,000 5,000
Stock-Use Ratio 22.2% 21.6% 3.6%
To summarize
The pulse premium has disappeared
Area in Canada should drop
Indian demand will drop in 2017

THANK YOU