Embed Size (px)
Citation preview

Regional Profile:
Southern African Development Community (SADC)
Pub
lic D
iscl
osur
e A
utho
rized
Pub
lic D
iscl
osur
e A
utho
rized
Pub
lic D
iscl
osur
e A
utho
rized
Pub
lic D
iscl
osur
e A
utho
rized
Pub
lic D
iscl
osur
e A
utho
rized
Pub
lic D
iscl
osur
e A
utho
rized
Pub
lic D
iscl
osur
e A
utho
rized
Pub
lic D
iscl
osur
e A
utho
rized
2 SOUTHERN AFRICAN DEVELOPMENT COMMUNITY (SADC) Doing Business 2014
© 2013 The International Bank for Reconstruction and Development / The World Bank 1818 H Street NW, Washington, DC 20433 Telephone: 202-473-1000; Internet: www.worldbank.org
All rights reserved. 1 2 3 4 15 14 13 12
A copublication of The World Bank and the International Finance Corporation.
This work is a product of the staff of The World Bank with external contributions. Note that The World Bank does not necessarily own each component of the content included in the work. The World Bank therefore does not warrant that the use of the content contained in the work will not infringe on the rights of third parties. The risk of claims resulting from such infringement rests solely with you.
The findings, interpretations, and conclusions expressed in this work do not necessarily reflect the views of The World Bank, its Board of Executive Directors, or the governments they represent. The World Bank does not guarantee the accuracy of the data included in this work. The boundaries, colors, denominations, and other information shown on any map in this work do not imply any judgment on the part of The World Bank concerning the legal status of any territory or the endorsement or acceptance of such boundaries.
Nothing herein shall constitute or be considered to be a limitation upon or waiver of the privileges and immunities of The World Bank, all of which are specifically reserved.
Rights and Permissions
This work is available under the Creative Commons Attribution 3.0 Unported license (CC BY 3.0) http://creativecommons.org/licenses/by/3.0. Under the Creative Commons Attribution license, you are free to copy, distribute, transmit, and adapt this work, including for commercial purposes, under the following conditions:
Attribution—Please cite the work as follows: World Bank. 2013. Doing Business 2014: Understanding Smarter Regulations for Small and Medium-Size Enterprises. Washington, DC: World Bank Group. DOI: 10.1596/978-0-8213-9615-5. License: Creative Commons Attribution CC BY 3.0
Translations—If you create a translation of this work, please add the following disclaimer along with the attribution: This translation was not created by The World Bank and should not be considered an official World Bank translation. The World Bank shall not be liable for any content or error in this translation.
All queries on rights and licenses should be addressed to the Office of the Publisher, The World Bank, 1818 H Street NW, Washington, DC 20433, USA; fax: 202-522-2625; e-mail: [email protected].
Additional copies of all 11 editions of Doing Business may be purchased at www.doingbusiness.org.
Cover design: The Word Express

3 SOUTHERN AFRICAN DEVELOPMENT COMMUNITY (SADC) Doing Business 2014
CONTENTS
Introduction .................................................................................................................................. 4
The business environment .......................................................................................................... 5
Starting a business ..................................................................................................................... 12
Dealing with construction permits ........................................................................................... 21
Getting electricity ....................................................................................................................... 28
Registering property .................................................................................................................. 35
Getting credit .............................................................................................................................. 43
Protecting investors ................................................................................................................... 48
Paying taxes ................................................................................................................................ 56
Trading across borders .............................................................................................................. 64
Enforcing contracts .................................................................................................................... 75
Resolving insolvency .................................................................................................................. 82
Data notes ................................................................................................................................... 89
Resources on the Doing Business website .............................................................................. 94

4 SOUTHERN AFRICAN DEVELOPMENT COMMUNITY (SADC) Doing Business 2014
INTRODUCTION
Doing Business sheds light on how easy or difficult it is for a local entrepreneur to open and run a small to medium-size business when complying with relevant regulations. It measures and tracks changes in regulations affecting 11 areas in the life cycle of a business: starting a business, dealing with construction permits, getting electricity, registering property, getting credit, protecting investors, paying taxes, trading across borders, enforcing contracts, resolving insolvency and employing workers.
In a series of annual reports Doing Business presents quantitative indicators on business regulations and the protection of property rights that can be compared across 189 economies, from Afghanistan to Zimbabwe, over time. The data set covers 47 economies in Sub-Saharan Africa, 33 in Latin America and the Caribbean, 25 in East Asia and the Pacific, 25 in Eastern Europe and Central Asia, 20 in the Middle East and North Africa and 8 in South Asia, as well as 31 OECD high-income economies. The indicators are used to analyze economic outcomes and identify what reforms have worked, where and why.
This regional profile presents the Doing Business indicators for economies in Southern African Development Community (SADC). It also shows the regional average, the best performance globally for each indicator and data for the following comparator regions: East Asia and the Pacific (EAP), Economic Community of West African States (ECOWAS), European Union (EU), Middle East and North Africa
(MENA) and Organization for the Harmonization of Business Law in Africa (OHADA). The data in this report are current as of June 1, 2013 (except for the paying taxes indicators, which cover the period January–December 2012).
The Doing Business methodology has limitations. Other areas important to business—such as an economy’s proximity to large markets, the quality of its infrastructure services (other than those related to trading across borders and getting electricity), the security of property from theft and looting, the transparency of government procurement, macroeconomic conditions or the underlying strength of institutions—are not directly studied by Doing Business. The indicators refer to a specific type of business, generally a local limited liability company operating in the largest business city. Because standard assumptions are used in the data collection, comparisons and benchmarks are valid across economies. The data not only highlight the extent of obstacles to doing business; they also help identify the source of those obstacles, supporting policy makers in designing regulatory reform.
More information is available in the full report. Doing Business 2014 presents the indicators, analyzes their relationship with economic outcomes and recommends regulatory reforms. The data, along with information on ordering the Doing Business 2014 report, are available on the Doing Business website at http://www.doingbusiness.org.

5 SOUTHERN AFRICAN DEVELOPMENT COMMUNITY (SADC) Doing Business 2014
THE BUSINESS ENVIRONMENT
For policy makers trying to improve their economy’s regulatory environment for business, a good place to start is to find out how it compares with the regulatory environment in other economies. Doing Business provides an aggregate ranking on the ease of doing business based on indicator sets that measure and benchmark regulations applying to domestic small to medium-size businesses through their life cycle. Economies are ranked from 1 to 189 by the ease of doing business index. For each economy the index is calculated as the ranking on the simple average of its percentile rankings on each of the 10 topics included in the index in Doing Business 2014: starting a business, dealing with construction permits, getting electricity, registering property, getting credit, protecting investors, paying taxes, trading across borders, enforcing contracts and resolving insolvency.
The ranking on each topic is the simple average of the percentile rankings on its component indicators (see the data notes for more details).
The aggregate ranking on the ease of doing business benchmarks each economy’s performance on the indicators against that of all other economies in the Doing Business sample (figure 1.1). While this ranking tells much about the business environment in an economy, it does not tell the whole story. The ranking on the ease of doing business, and the underlying indicators, do not measure all aspects of the business environment that matter to firms and investors or that affect the competitiveness of the economy. Still, a high ranking does mean that the government has created a regulatory environment conducive to operating a business.
Figure 1.1 Where economies stand in the global ranking on the ease of doing business
Source: Doing Business database.
6 SOUTHERN AFRICAN DEVELOPMENT COMMUNITY (SADC) Doing Business 2014
THE BUSINESS ENVIRONMENT
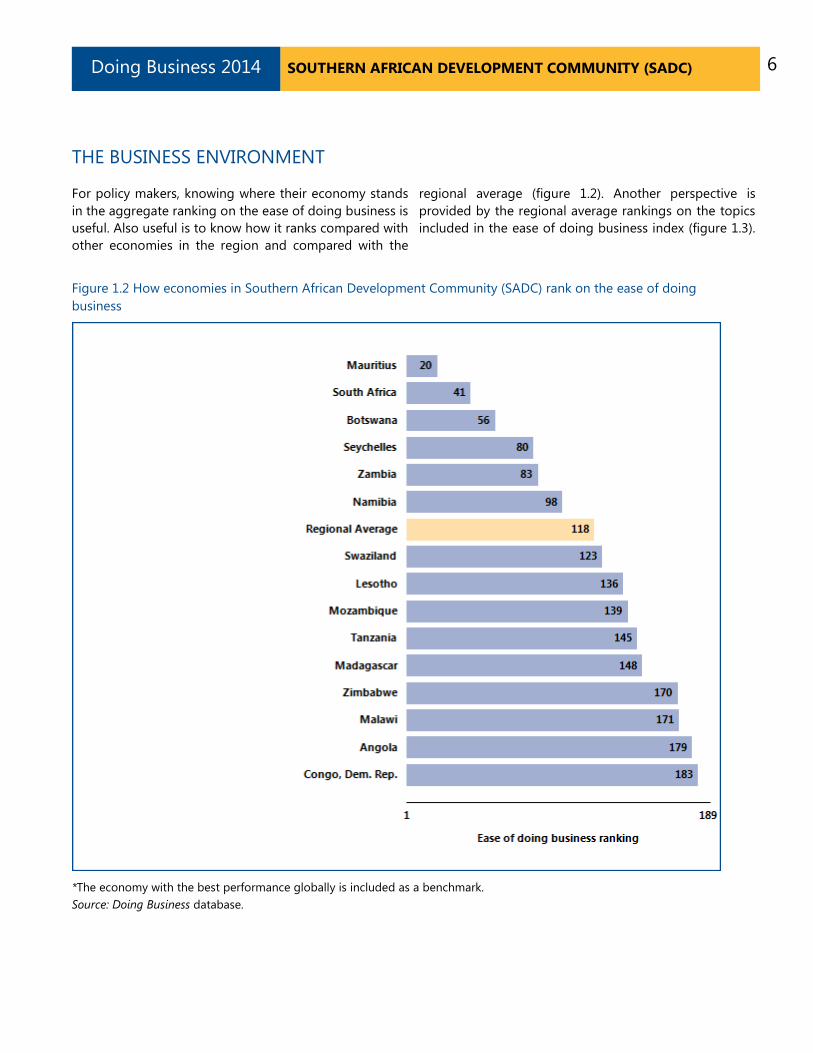
For policy makers, knowing where their economy stands in the aggregate ranking on the ease of doing business is useful. Also useful is to know how it ranks compared with other economies in the region and compared with the
regional average (figure 1.2). Another perspective is provided by the regional average rankings on the topics included in the ease of doing business index (figure 1.3).
Figure 1.2 How economies in Southern African Development Community (SADC) rank on the ease of doing business
*The economy with the best performance globally is included as a benchmark. Source: Doing Business database.

7 SOUTHERN AFRICAN DEVELOPMENT COMMUNITY (SADC) Doing Business 2014
THE BUSINESS ENVIRONMENT
Figure 1.3 How Southern African Development Community (SADC) ranks on Doing Business topics
Regional average ranking
Source: Doing Business database.
8 SOUTHERN AFRICAN DEVELOPMENT COMMUNITY (SADC) Doing Business 2014
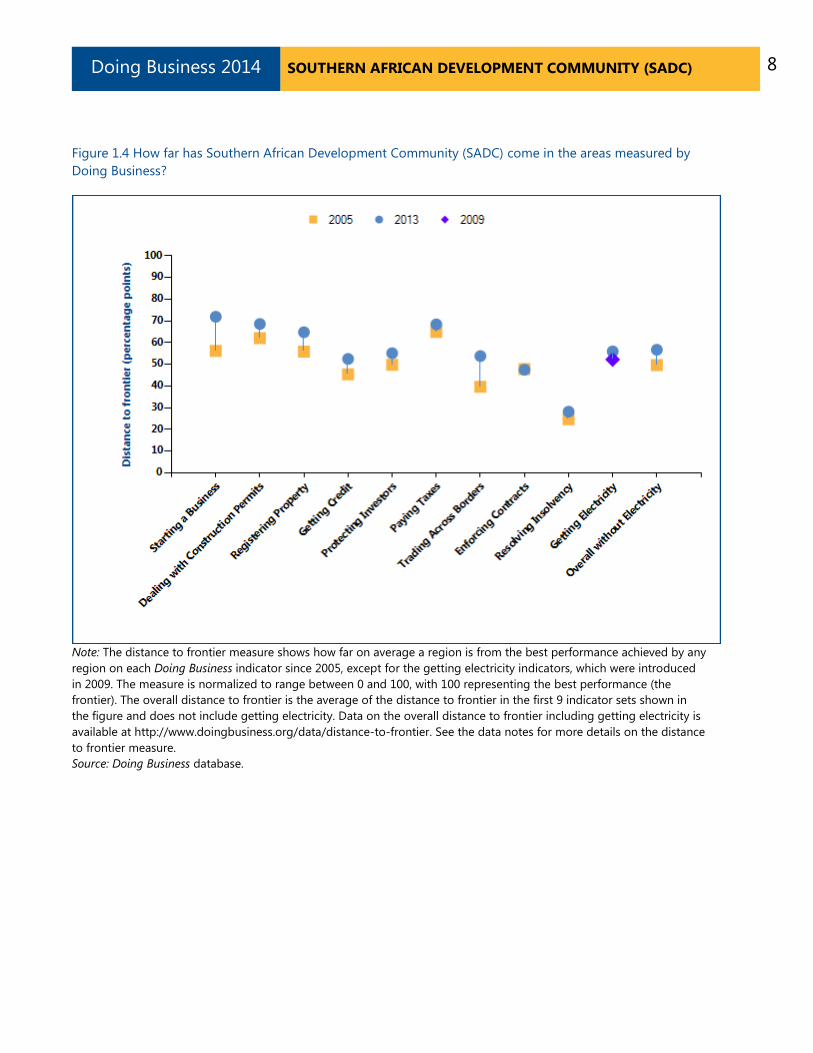
Figure 1.4 How far has Southern African Development Community (SADC) come in the areas measured by Doing Business?
Note: The distance to frontier measure shows how far on average a region is from the best performance achieved by any region on each Doing Business indicator since 2005, except for the getting electricity indicators, which were introduced in 2009. The measure is normalized to range between 0 and 100, with 100 representing the best performance (the frontier). The overall distance to frontier is the average of the distance to frontier in the first 9 indicator sets shown in the figure and does not include getting electricity. Data on the overall distance to frontier including getting electricity is available at http://www.doingbusiness.org/data/distance-to-frontier. See the data notes for more details on the distance to frontier measure. Source: Doing Business database.
9 SOUTHERN AFRICAN DEVELOPMENT COMMUNITY (SADC) Doing Business 2014
THE BUSINESS ENVIRONMENT
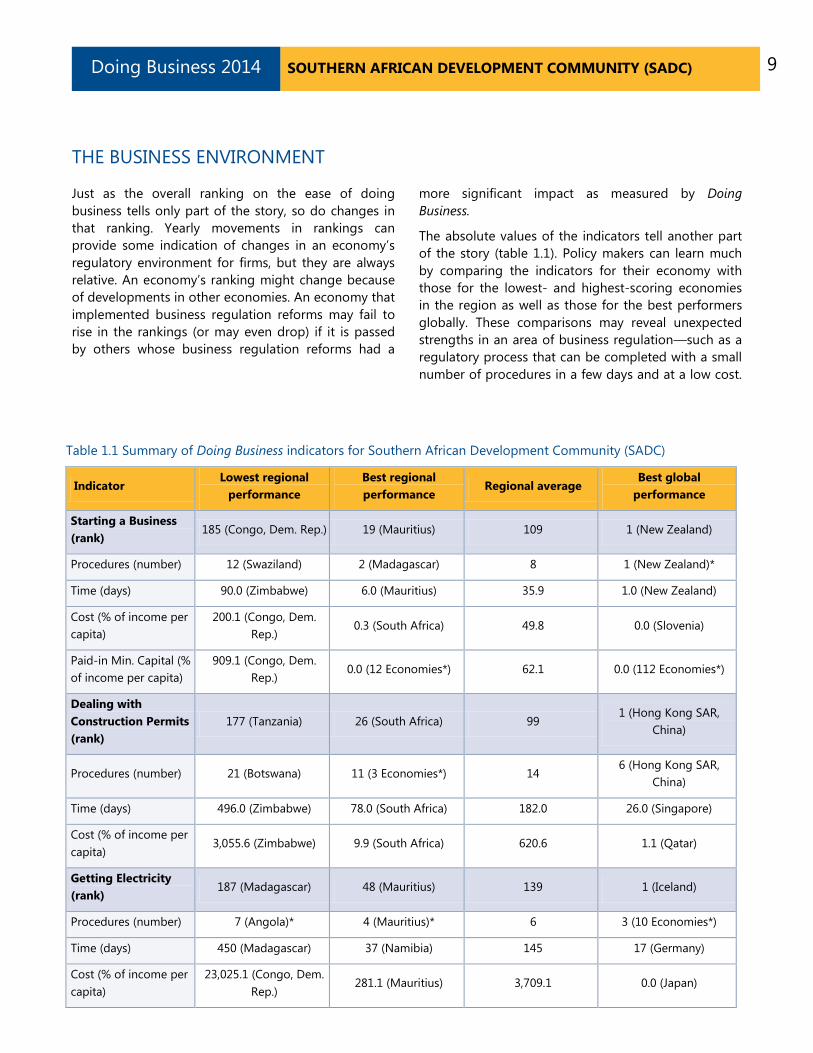
Just as the overall ranking on the ease of doing business tells only part of the story, so do changes in that ranking. Yearly movements in rankings can provide some indication of changes in an economy’s regulatory environment for firms, but they are always relative. An economy’s ranking might change because of developments in other economies. An economy that implemented business regulation reforms may fail to rise in the rankings (or may even drop) if it is passed by others whose business regulation reforms had a
more significant impact as measured by Doing Business.
The absolute values of the indicators tell another part of the story (table 1.1). Policy makers can learn much by comparing the indicators for their economy with those for the lowest- and highest-scoring economies in the region as well as those for the best performers globally. These comparisons may reveal unexpected strengths in an area of business regulation—such as a regulatory process that can be completed with a small number of procedures in a few days and at a low cost.
Table 1.1 Summary of Doing Business indicators for Southern African Development Community (SADC)
Indicator Lowest regional
performance Best regional performance
Regional average Best global
performance
Starting a Business (rank)
185 (Congo, Dem. Rep.) 19 (Mauritius) 109 1 (New Zealand)
Procedures (number) 12 (Swaziland) 2 (Madagascar) 8 1 (New Zealand)*
Time (days) 90.0 (Zimbabwe) 6.0 (Mauritius) 35.9 1.0 (New Zealand)
Cost (% of income per capita)
200.1 (Congo, Dem. Rep.)
0.3 (South Africa) 49.8 0.0 (Slovenia)
Paid-in Min. Capital (% of income per capita)
909.1 (Congo, Dem. Rep.)
0.0 (12 Economies*) 62.1 0.0 (112 Economies*)
Dealing with Construction Permits (rank)
177 (Tanzania) 26 (South Africa) 99 1 (Hong Kong SAR,
China)
Procedures (number) 21 (Botswana) 11 (3 Economies*) 14 6 (Hong Kong SAR,
China)
Time (days) 496.0 (Zimbabwe) 78.0 (South Africa) 182.0 26.0 (Singapore)
Cost (% of income per capita)
3,055.6 (Zimbabwe) 9.9 (South Africa) 620.6 1.1 (Qatar)
Getting Electricity (rank)
187 (Madagascar) 48 (Mauritius) 139 1 (Iceland)
Procedures (number) 7 (Angola)* 4 (Mauritius)* 6 3 (10 Economies*)
Time (days) 450 (Madagascar) 37 (Namibia) 145 17 (Germany)
Cost (% of income per capita)
23,025.1 (Congo, Dem. Rep.)
281.1 (Mauritius) 3,709.1 0.0 (Japan)

10 SOUTHERN AFRICAN DEVELOPMENT COMMUNITY (SADC) Doing Business 2014
Indicator Lowest regional
performance Best regional performance
Regional average Best global
performance
Registering Property (rank)
178 (Namibia) 41 (Botswana) 111 1 (Georgia)
Procedures (number) 9 (Swaziland) 4 (4 Economies*) 6 1 (4 Economies*)
Time (days) 191.0 (Angola) 15.0 (Mauritius)* 51.7 1.0 (New Zealand)*
Cost (% of property value)
13.8 (Namibia) 2.0 (Malawi) 7.3 0.0 (5 Economies*)
Getting Credit (rank) 180 (Madagascar) 13 (Zambia) 104 1 (Malaysia)*
Strength of legal rights index (0-10)
2 (Madagascar) 9 (Zambia) 6 10 (10 Economies*)
Depth of credit information index (0-6)
1 (Zimbabwe)* 6 (Mauritius)* 4 6 (31 Economies*)
Public registry coverage (% of adults)
0.2 (Madagascar) 69.2 (Mauritius) 19.0 100.0 (Portugal)*
Private bureau coverage (% of adults)
3.7 (Zimbabwe) 66.2 (Namibia) 40.0 100.0 (22 Economies*)
Protecting Investors (rank)
147 (Congo, Dem. Rep.) 10 (South Africa) 79 1 (New Zealand)
Extent of disclosure index (0-10)
2 (Swaziland) 8 (South Africa)* 5 10 (10 Economies*)
Extent of director liability index (0-10)
1 (Congo, Dem. Rep.)* 8 (4 Economies*) 5 10 (Cambodia)
Ease of shareholder suits index (0-10)
3 (Botswana) 9 (Mauritius)* 6 10 (3 Economies*)
Strength of investor protection index (0-10)
3.7 (Congo, Dem. Rep.) 8.0 (South Africa) 5.5 9.7 (New Zealand)
Paying Taxes (rank) 176 (Congo, Dem. Rep.) 13 (Mauritius) 89 1 (United Arab Emirates)
Payments (number per year)
49 (Zimbabwe) 7 (South Africa) 31 3 (Hong Kong SAR,
China)*
Time (hours per year) 348 (Congo, Dem. Rep.) 76 (Seychelles) 210 12 (United Arab
Emirates)
Trading Across Borders (rank)
176 (Malawi) 12 (Mauritius) 129 1 (Singapore)
Documents to export (number)
10 (Angola)* 4 (Mauritius) 7 2 (Ireland)*
Time to export (days) 53 (Zimbabwe) 10 (Mauritius) 28 6 (5 Economies*)
Cost to export (US$ per 3,765 (Zimbabwe) 675 (Mauritius) 1,904 450 (Malaysia)

11 SOUTHERN AFRICAN DEVELOPMENT COMMUNITY (SADC) Doing Business 2014
Indicator Lowest regional
performance Best regional performance
Regional average Best global
performance
container)
Documents to import (number)
11 (Malawi)* 5 (Mauritius)* 8 2 (Ireland)*
Time to import (days) 71 (Zimbabwe) 10 (Mauritius) 34 4 (Singapore)
Cost to import (US$ per container)
5,660 (Zimbabwe) 675 (Seychelles) 2,428 440 (Singapore)
Enforcing Contracts (rank)
187 (Angola) 42 (Tanzania) 119 1 (Luxembourg)
Time (days) 1,296 (Angola) 410 (Zimbabwe) 693 150 (Singapore)
Cost (% of claim) 147.6 (Congo, Dem.
Rep.) 14.3 (Tanzania) 56.7 0.1 (Bhutan)
Procedures (number) 46 (Angola) 28 (Botswana) 37 21 (Singapore)*
Resolving Insolvency (rank)
189 (Angola) 34 (Botswana) 112 1 (Japan)
Time (years) 5.2 (Congo, Dem. Rep.) 1.7 (Mauritius)* 2.7 0.4 (Ireland)
Cost (% of estate) 30 (Madagascar) 9 (Zambia)* 18 1 (Norway)
Recovery rate (cents on the dollar)
4.5 (Congo, Dem. Rep.) 61.9 (Botswana) 26.6 92.8 (Japan)
* Two or more economies share the top ranking on this indicator. A number shown in place of an economy’s name indicates the number of economies that share the top ranking on the indicator. For a list of these economies, see the Doing Business website (http://www.doingbusiness.org). Source: Doing Business database.
12 SOUTHERN AFRICAN DEVELOPMENT COMMUNITY (SADC) Doing Business 2014
STARTING A BUSINESS
Formal registration of companies has many immediate benefits for the companies and for business owners and employees. Legal entities outlive their founders. Resources are pooled as several shareholders join forces to start a company. Formally registered companies have access to services and institutions from courts to banks as well as to new markets. And their employees can benefit from protections provided by the law. An additional benefit comes with limited liability companies. These limit the financial liability of company owners to their investments, so personal assets of the owners are not put at risk.
Where governments make this process easy, more entrepreneurs start businesses in the formal sector, creating more good jobs and generating more revenue for the government.
What do the indicators cover?
Doing Business measures the ease of starting a business in an economy by recording all procedures officially required or commonly done in practice by an entrepreneur to start up and formally operate an industrial or commercial business—as well as the time and cost required to complete these procedures. It also records the paid-in minimum capital that companies must deposit before registration. The ranking on the ease of starting a business is the simple average of the percentile rankings on the 4 component indicators: procedures, time, cost and paid-in minimum capital requirement.
To make the data comparable across economies, Doing Business uses several assumptions about the business and the procedures. It assumes that all information is readily available to the entrepreneur and that there has been no prior contact with officials. It also assumes that the entrepreneur will pay no bribes. And it assumes that the business:
• Is a 100% domestically owned limited liability company, located in the largest business city.
• Has between 10 and 50 employees.
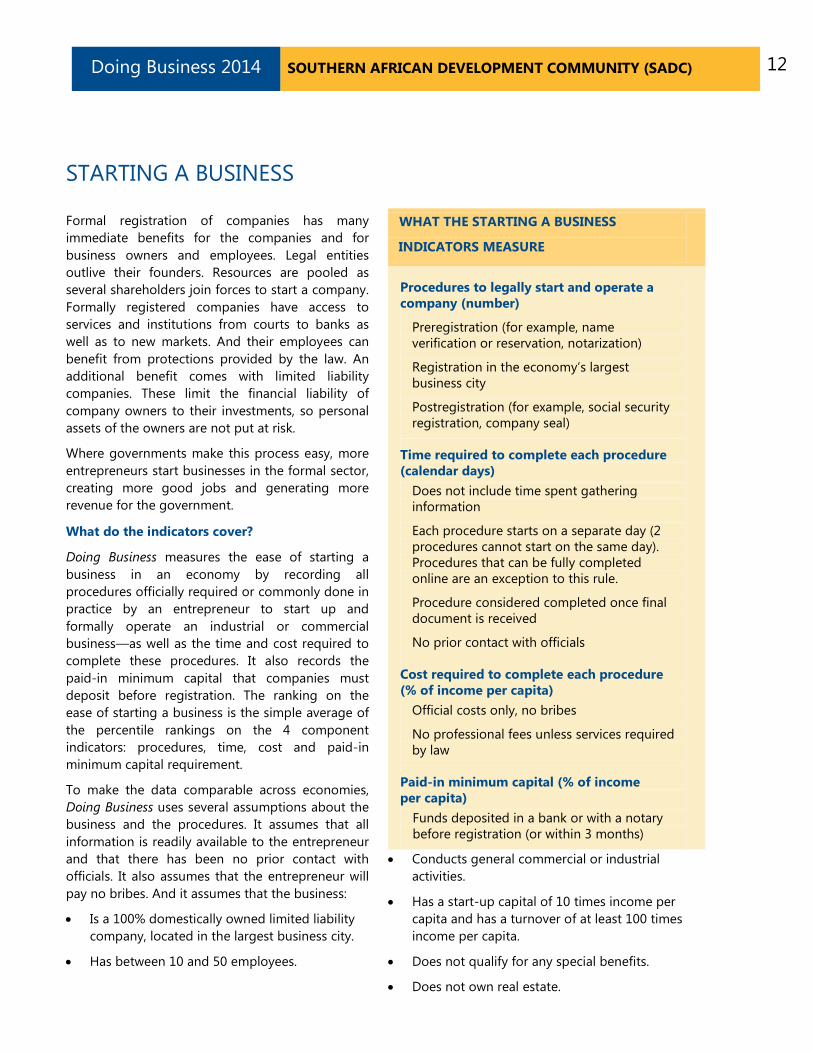
WHAT THE STARTING A BUSINESS
INDICATORS MEASURE
Procedures to legally start and operate a company (number)
Preregistration (for example, name verification or reservation, notarization)
Registration in the economy’s largest business city
Postregistration (for example, social security registration, company seal)
Time required to complete each procedure (calendar days)
Does not include time spent gathering information
Each procedure starts on a separate day (2 procedures cannot start on the same day). Procedures that can be fully completed online are an exception to this rule.
Procedure considered completed once final document is received
No prior contact with officials
Cost required to complete each procedure (% of income per capita)
Official costs only, no bribes
No professional fees unless services required by law
Paid-in minimum capital (% of income per capita)
Funds deposited in a bank or with a notary before registration (or within 3 months)
• Conducts general commercial or industrial activities.
• Has a start-up capital of 10 times income per capita and has a turnover of at least 100 times income per capita.
• Does not qualify for any special benefits.
• Does not own real estate.

13 SOUTHERN AFRICAN DEVELOPMENT COMMUNITY (SADC) Doing Business 2014
STARTING A BUSINESS
Where do the region’s economies stand today?
How easy is it for entrepreneurs in economies in Southern African Development Community (SADC) to start a business? The global rankings of these economies on the ease of starting a business suggest
an answer (figure 2.1). The average ranking of the region and comparator regions provide a useful benchmark.
Figure 2.1 How economies in Southern African Development Community (SADC) rank on the ease of starting a business
Source: Doing Business database.
14 SOUTHERN AFRICAN DEVELOPMENT COMMUNITY (SADC) Doing Business 2014
STARTING A BUSINESS
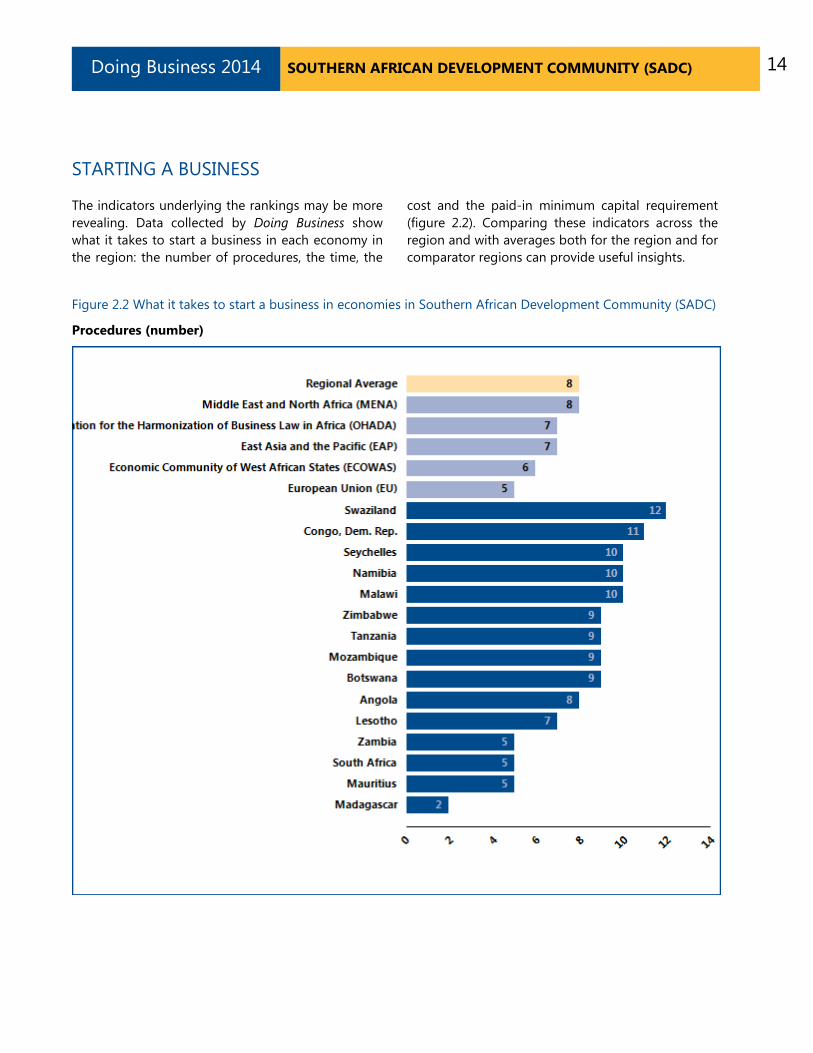
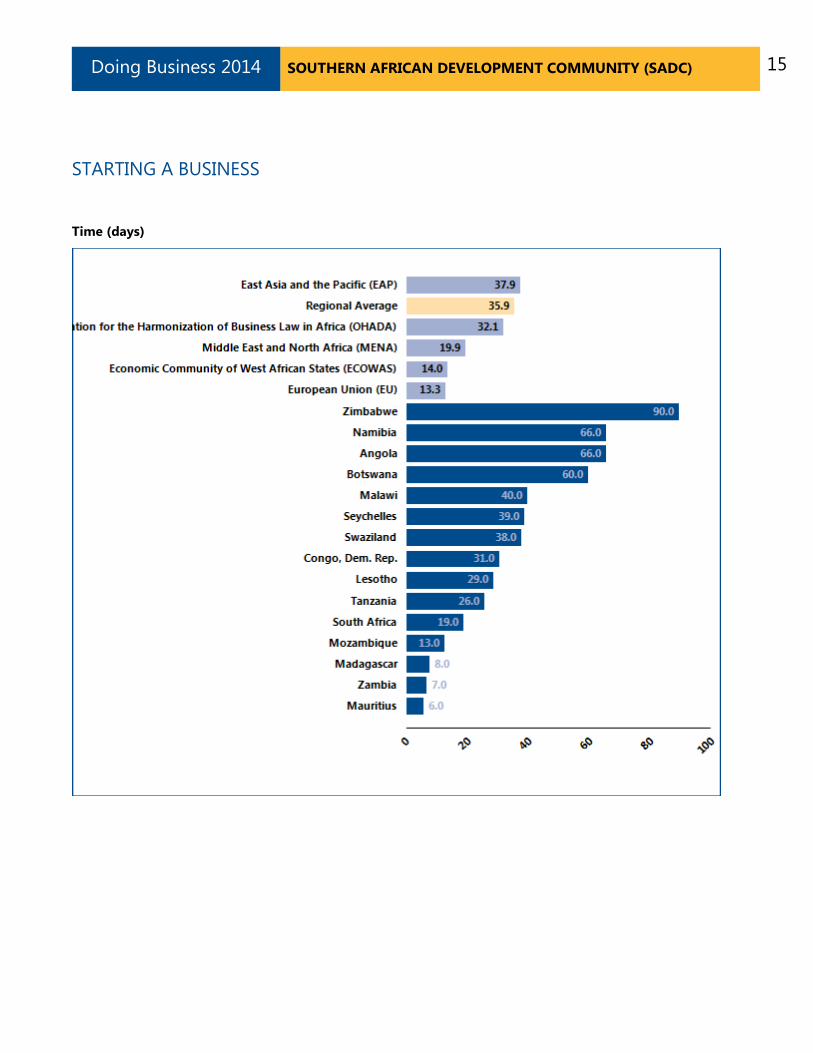
The indicators underlying the rankings may be more revealing. Data collected by Doing Business show what it takes to start a business in each economy in the region: the number of procedures, the time, the
cost and the paid-in minimum capital requirement (figure 2.2). Comparing these indicators across the region and with averages both for the region and for comparator regions can provide useful insights.
Figure 2.2 What it takes to start a business in economies in Southern African Development Community (SADC)
Procedures (number)
15 SOUTHERN AFRICAN DEVELOPMENT COMMUNITY (SADC) Doing Business 2014
STARTING A BUSINESS
Time (days)

16 SOUTHERN AFRICAN DEVELOPMENT COMMUNITY (SADC) Doing Business 2014
STARTING A BUSINESS
Cost (% of income per capita)
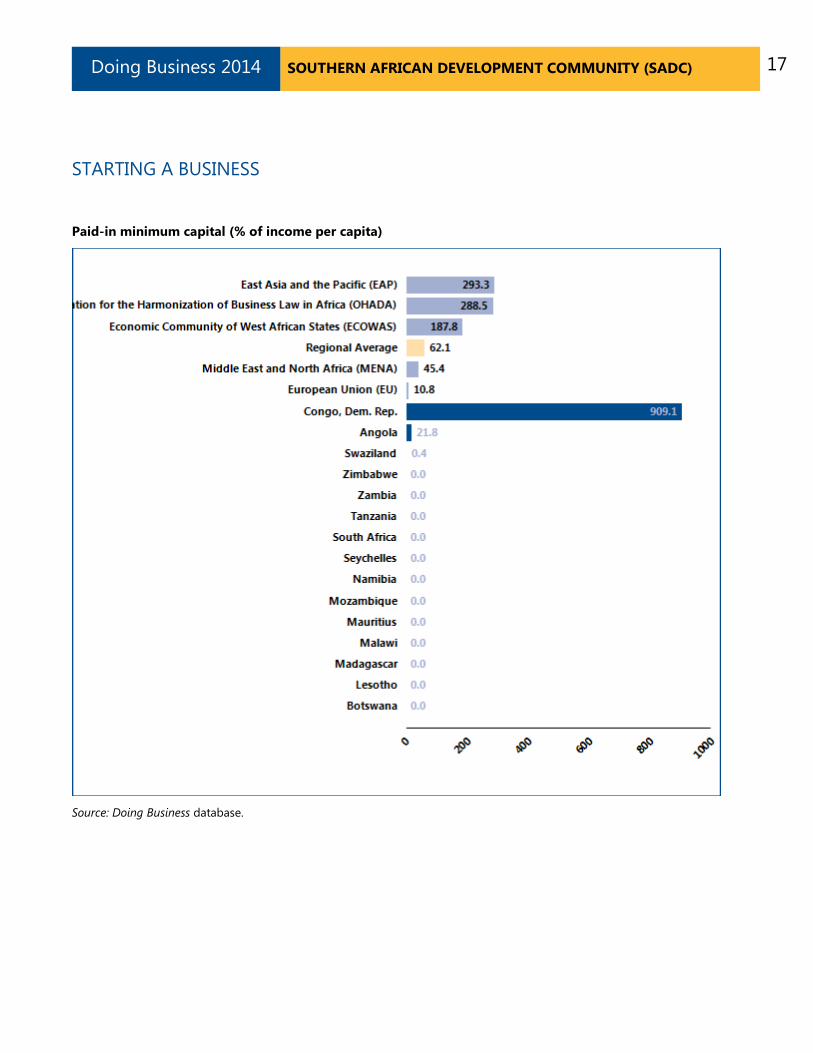
17 SOUTHERN AFRICAN DEVELOPMENT COMMUNITY (SADC) Doing Business 2014
STARTING A BUSINESS
Paid-in minimum capital (% of income per capita)
Source: Doing Business database.

18 SOUTHERN AFRICAN DEVELOPMENT COMMUNITY (SADC) Doing Business 2014
STARTING A BUSINESS What are the changes over time? Economies around the world have taken steps making it easier to start a business—streamlining procedures by setting up a one-stop shop, making procedures simpler or faster by introducing technology, and reducing or eliminating minimum capital requirements. Many have undertaken business registration reforms in stages—and often as part of a larger regulatory reform program. Among the benefits have been greater firm
satisfaction and savings and more registered businesses, financial resources and job opportunities.
What business registration reforms has Doing Business recorded in Southern African Development Community (SADC) (table 2.1)?
Table 2.1 How have economies in Southern African Development Community (SADC) made starting a business easier—or not? By Doing Business report year
DB year Economy Reform
DB2008 Madagascar Business registration was reduced to just eight days, streamlining operations at the one stop shop (GUIDE).
DB2008 Mauritius Mauritius made starting a business faster by implementing a centralized database linking the company registry with tax, social security, and local authorities.
DB2008 Mozambique
Mozambique made starting a business faster by implementing electronic publication of the company start-up and eliminating the provisional registration. In addition, Mozambique made the use of notaries optional and computerized its registry and introduced flat registration fees.
DB2008 Tanzania
Tanzania made starting a business easier by decentralizing business registration by creating a business activities registration system and business registration centers in all the local authorities. The company seal became optional.
DB2009 Angola All registration formalities can be completed at once at the Guichet Unico considerably reducing the number of procedures as well as time.
DB2009 Botswana Computerization of the registry resulted in more efficiency and substantial time reduction.
DB2009 Lesotho
One stop shop reforms consolidated and simplified business registration processes and greater efficiency at registry resulted in license reforms substantially reducing the number of days.
DB2009 Madagascar Professional tax was abolished reducing the cost and online publication cut time.
DB2009 Mauritius On-line reforms further simplified registration process and formalities were streamlined reducing the number of

19 SOUTHERN AFRICAN DEVELOPMENT COMMUNITY (SADC) Doing Business 2014
DB year Economy Reform
procedures.
DB2009 Namibia The computerization of the registry reduced the registration time tremendously.
DB2009 South Africa Amendments of the corporate law have simplified the start-up process including abolishing the need to have a lawyer, reducing cost and time.
DB2009 Zambia The revamping of the company registry and the creation of a one-stop shop resulted in tremendous time reduction.
DB2010 Botswana Botswana eased business start-up with more efficient tax registration and obtaining of business license.
DB2010 Madagascar
Madagascar simplified business start-up through the streamlining of procedures at the one stop shop, elimination of stamp duty and elimination of the minimum capital requirement.
DB2010 Mozambique Mozambique simplified business start up by eliminating the requirements of he minimum capital and bank deposit requirements .
DB2011 Congo, Dem. Rep. The Democratic Republic of Congo eased business start-up by eliminating procedures, including the company seal.
DB2011 Mozambique Mozambique eased business start-up by introducing a simplified licensing process.
DB2011 Zambia Zambia eased business start-up by eliminating the minimum capital requirement.
DB2011 Zimbabwe Zimbabwe eased business start-up by reducing registration fees and speeding up the name search process and company and tax registration.
DB2012 Congo, Dem. Rep. The Democratic Republic of Congo made business start-up faster by reducing the time required to complete company registration and obtain a national identification number.
DB2012 Madagascar
Madagascar eased the process of starting a business by eliminating the minimum capital requirement, but also made it more difficult by introducing the requirement of obtaining a tax identification number.
DB2012 South Africa
South Africa made starting a business easier by implementing its new company law, which eliminated the requirement to reserve a company name and simplified the incorporation documents.
DB2013 Congo, Dem. Rep. The Democratic Republic of Congo made starting a business easier by appointing additional public notaries.
DB2013 Lesotho Lesotho made starting a business easier by creating a one-stop shop for company incorporation and by eliminating the requirements for paid-in minimum capital and for

20 SOUTHERN AFRICAN DEVELOPMENT COMMUNITY (SADC) Doing Business 2014
DB year Economy Reform
notarization of the articles of association.
DB2013 Madagascar Madagascar made starting a business easier by allowing the one-stop shop to deal with the publication of the notice of incorporation.
DB2013 Tanzania Tanzania made starting a business easier by eliminating the requirement for inspections by health, town and land officers as a prerequisite for a business license.
DB2014 Congo, Dem. Rep.
The Democratic Republic of Congo made starting a business more complicated by increasing the minimum capital requirement. At the same time, it made the process easier by reducing the time and by eliminating the requirement to obtain a certificate confirmi
DB2014 Madagascar Madagascar made starting a business more difficult by increasing the cost to register with the National Center for Statistics.
DB2014 Swaziland Swaziland made starting a business easier by shortening the administrative processing times for registering a new business and obtaining a trading license.
DB2014 Zambia Zambia made starting a business easier by raising the threshold at which value added tax registration is required.
Note: For information on reforms in earlier years (back to DB2005), see the Doing Business reports for these years, available at http://www.doingbusiness.org. Source: Doing Business database.

21 SOUTHERN AFRICAN DEVELOPMENT COMMUNITY (SADC) Doing Business 2014
DEALING WITH CONSTRUCTION PERMITS
Regulation of construction is critical to protect the public. But it needs to be efficient, to avoid excessive constraints on a sector that plays an important part in every economy. Where complying with building regulations is excessively costly in time and money, many builders opt out. They may pay bribes to pass inspections or simply build illegally, leading to hazardous construction that puts public safety at risk. Where compliance is simple, straightforward and inexpensive, everyone is better off.
What do the indicators cover?
Doing Business records the procedures, time and cost for a business in the construction industry to obtain all the necessary approvals to build a simple commercial warehouse in the economy’s main city, connect it to basic utilities and register the property so that it can be used as collateral or transferred to another entity.
The ranking on the ease of dealing with construction permits is the simple average of the percentile rankings on its component indicators: procedures, time and cost.
To make the data comparable across economies, Doing Business uses several assumptions about the business and the warehouse, including the utility connections.
The business:
• Is a limited liability company operating in the construction business and located in the largest business city.
• Is domestically owned and operated.
• Has 60 builders and other employees.
The warehouse:
• Is a new construction (there was no previous construction on the land).
• Has complete architectural and technical plans prepared by a licensed architect or engineer.
WHAT THE DEALING WITH CONSTRUCTION
PERMITS INDICATORS MEASURE
Procedures to legally build a warehouse (number)
Submitting all relevant documents and obtaining all necessary clearances, licenses, permits and certificates
Submitting all required notifications and receiving all necessary inspections
Obtaining utility connections for water, sewerage and a land telephone line
Registering the warehouse after its completion (if required for use as collateral or for transfer of warehouse)
Time required to complete each procedure (calendar days)
Does not include time spent gathering information
Each procedure starts on a separate day. Procedures that can be fully completed online are an exception to this rule.
Procedure completed once final document is received
No prior contact with officials
Cost required to complete each procedure (% of income per capita)
Official costs only, no bribes
• Will be connected to water, sewerage (sewage system, septic tank or their equivalent) and a fixed telephone line.
• The connection to each utility network will be 10 meters (32 feet, 10 inches) long.
• Will be used for general storage, such as of books or stationery (not for goods requiring special conditions).
• Will take 30 weeks to construct (excluding all delays due to administrative and regulatory requirements).

22 SOUTHERN AFRICAN DEVELOPMENT COMMUNITY (SADC) Doing Business 2014
DEALING WITH CONSTRUCTION PERMITS
Where do the region’s economies stand today?
How easy it is for entrepreneurs in economies in Southern African Development Community (SADC) to legally build a warehouse? The global rankings of these economies on the ease of dealing with
construction permits suggest an answer (figure 3.1). The average ranking of the region and comparator regions provide a useful benchmark.
Figure 3.1 How economies in Southern African Development Community (SADC) rank on the ease of dealing with construction permits
Source: Doing Business database.

23 SOUTHERN AFRICAN DEVELOPMENT COMMUNITY (SADC) Doing Business 2014
DEALING WITH CONSTRUCTION PERMITS
The indicators underlying the rankings may be more revealing. Data collected by Doing Business show what it takes to comply with formalities to build a warehouse in each economy in the region: the number
of procedures, the time and the cost (figure 3.2). Comparing these indicators across the region and with averages both for the region and for comparator regions can provide useful insights.
Figure 3.2 What it takes to comply with formalities to build a warehouse in economies in Southern African Development Community (SADC)
Procedures (number)

24 SOUTHERN AFRICAN DEVELOPMENT COMMUNITY (SADC) Doing Business 2014
DEALING WITH CONSTRUCTION PERMITS
Time (days)

25 SOUTHERN AFRICAN DEVELOPMENT COMMUNITY (SADC) Doing Business 2014
DEALING WITH CONSTRUCTION PERMITS
Cost (% of income per capita)
* Indicates a “no practice” mark. See the data notes for details. Source: Doing Business database.

26 SOUTHERN AFRICAN DEVELOPMENT COMMUNITY (SADC) Doing Business 2014
DEALING WITH CONSTRUCTION PERMITS
What are the changes over time?
Smart regulation ensures that standards are met while making compliance easy and accessible to all. Coherent and transparent rules, efficient processes and adequate allocation of resources are especially important in sectors where safety is at stake. Construction is one of them. In an effort to ensure building safety while keeping compliance costs reasonable, governments around the world have
worked on consolidating permitting requirements. What construction permitting reforms has Doing Business recorded in Southern African Development Community (SADC) (table 3.1)?
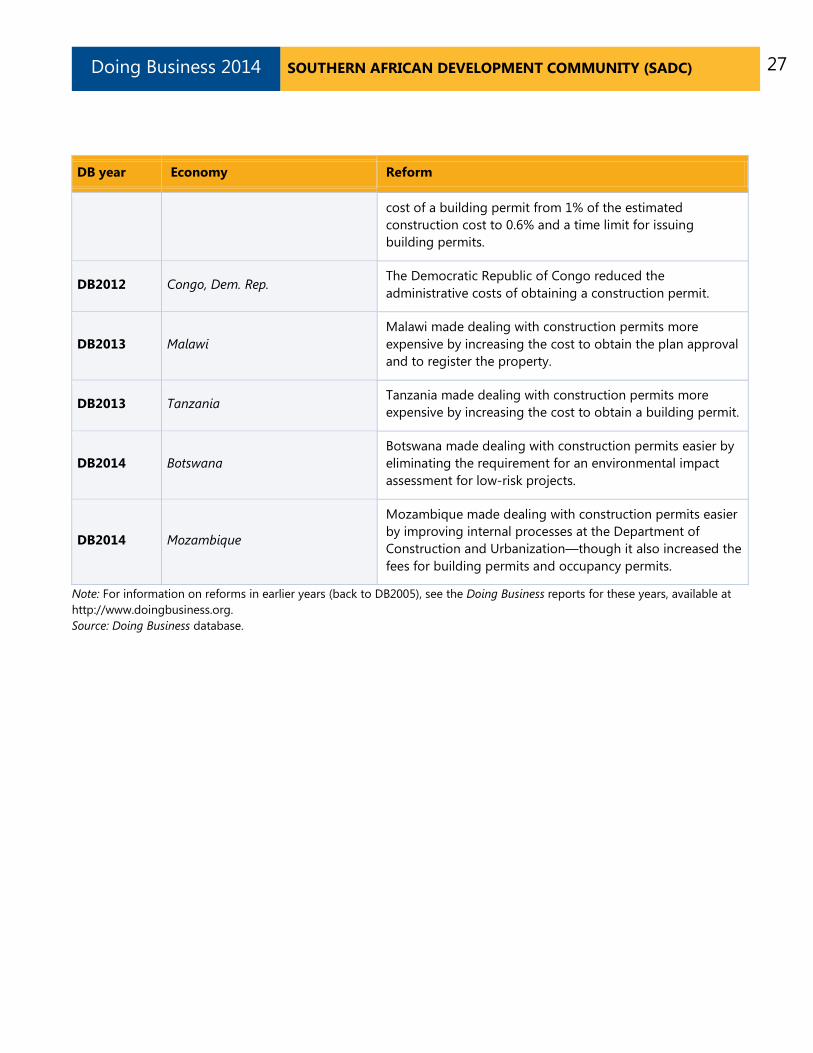
Table 3.1 How have economies in Southern African Development Community (SADC) made dealing with construction permits easier—or not? By Doing Business report year
DB year Economy Reform
DB2008 Mauritius
Mauritius made obtaining construction permits easier by combining procedures of getting development permit and building permit, and it also set up an official time frame to process the permit application.
DB2008 Zambia Zambia made dealing with construction permits easier by reducing the time to obtain utility connections
DB2008 Zimbabwe
Zimbabwe made obtaining construction permits more difficult by imposing inspections by Chief Building Inspector or Deputy Chief Inspecptor, which would take longer time. It also increased the fees due to inflation. Meanwhile, it is more time consuming to obtain water connections from local authorities.
DB2009 Angola
Angola made obtaining construction permits easier by reducing 2 procedures of getting approval from water and electricity companies, and reducing the time to deal with construction related approvals by 9 days.
DB2009 Zimbabwe Instability and severe administrative backlog led to increase of costs for all construction permit related procedures by USD 14,851.7 and delays in approvals by 474 days.
DB2010 Tanzania Tanzania introduced changes that resulted in a more difficult construction permitting process with additional procedures and cost.
DB2011 Congo, Dem. Rep. Dealing with construction permits became easier in the Democratic Republic of Congo thanks to a reduction in the
27 SOUTHERN AFRICAN DEVELOPMENT COMMUNITY (SADC) Doing Business 2014
DB year Economy Reform
cost of a building permit from 1% of the estimated construction cost to 0.6% and a time limit for issuing building permits.
DB2012 Congo, Dem. Rep. The Democratic Republic of Congo reduced the administrative costs of obtaining a construction permit.
DB2013 Malawi Malawi made dealing with construction permits more expensive by increasing the cost to obtain the plan approval and to register the property.
DB2013 Tanzania Tanzania made dealing with construction permits more expensive by increasing the cost to obtain a building permit.
DB2014 Botswana Botswana made dealing with construction permits easier by eliminating the requirement for an environmental impact assessment for low-risk projects.
DB2014 Mozambique
Mozambique made dealing with construction permits easier by improving internal processes at the Department of Construction and Urbanization—though it also increased the fees for building permits and occupancy permits.
Note: For information on reforms in earlier years (back to DB2005), see the Doing Business reports for these years, available at http://www.doingbusiness.org. Source: Doing Business database.

28 SOUTHERN AFRICAN DEVELOPMENT COMMUNITY (SADC) Doing Business 2014
GETTING ELECTRICITY
Access to reliable and affordable electricity is vital for businesses. To counter weak electricity supply, many firms in developing economies have to rely on self-supply, often at a prohibitively high cost. Whether electricity is reliably available or not, the first step for a customer is always to gain access by obtaining a connection.
What do the indicators cover?
Doing Business records all procedures required for a local business to obtain a permanent electricity connection and supply for a standardized warehouse, as well as the time and cost to complete them. These procedures include applications and contracts with electricity utilities, clearances from other agencies and the external and final connection works. The ranking on the ease of getting electricity is the simple average of the percentile rankings on its component indicators: procedures, time and cost. To make the data comparable across economies, several assumptions are used.
The warehouse:
• Is located in the economy’s largest business city, in an area where other warehouses are located.
• Is not in a special economic zone where the connection would be eligible for subsidization or faster service.
• Has road access. The connection works involve the crossing of a road or roads but are carried out on public land.
• Is a new construction being connected to electricity for the first time.
• Has 2 stories, both above ground, with a total surface of about 1,300.6 square meters (14,000 square feet), and is built on a plot of 929 square meters (10,000 square feet).
The electricity connection:
• Is a 3-phase, 4-wire Y, 140-kilovolt-ampere (kVA) (subscribed capacity) connection.
WHAT THE GETTING ELECTRICITY
INDICATORS MEASURE
Procedures to obtain an electricity connection (number)
Submitting all relevant documents and obtaining all necessary clearances and permits
Completing all required notifications and receiving all necessary inspections
Obtaining external installation works and possibly purchasing material for these works
Concluding any necessary supply contract and obtaining final supply
Time required to complete each procedure (calendar days)
Is at least 1 calendar day
Each procedure starts on a separate day
Does not include time spent gathering information
Reflects the time spent in practice, with little follow-up and no prior contact with officials
Cost required to complete each procedure (% of income per capita)
Official costs only, no bribes
Excludes value added tax
• Is 150 meters long.
• Is to either the low-voltage or the medium-voltage distribution network and either overhead or underground, whichever is more common in the economy and in the area where the warehouse is located. The length of any connection in the customer’s private domain is negligible.
• Requires crossing of a 10-meter road but all the works are carried out in a public land, so there is no crossing into other people's private property.

29 SOUTHERN AFRICAN DEVELOPMENT COMMUNITY (SADC) Doing Business 2014
• Involves installing one electricity meter. The monthly electricity consumption will be 0.07 gigawatt-hour (GWh). The internal electrical wiring has been completed.

30 SOUTHERN AFRICAN DEVELOPMENT COMMUNITY (SADC) Doing Business 2014
GETTING ELECTRICITY
Where do the region’s economies stand today?
How easy is it for entrepreneurs in economies in Southern African Development Community (SADC) to connect a warehouse to electricity? The global rankings of these economies on the ease of getting
electricity suggest an answer (figure 4.1). The average ranking of the region and comparator regions provide a useful benchmark.
Figure 4.1 How economies in Southern African Development Community (SADC) rank on the ease of getting electricity
Source: Doing Business database.

31 SOUTHERN AFRICAN DEVELOPMENT COMMUNITY (SADC) Doing Business 2014
GETTING ELECTRICITY
The indicators underlying the rankings may be more revealing. Data collected by Doing Business show what it takes to get a new electricity connection in each economy in the region: the number of procedures, the
time and the cost (figure 4.2). Comparing these indicators across the region and with averages both for the region and for comparator regions can provide useful insights.
Figure 4.2 What it takes to get an electricity connection in economies in Southern African Development Community (SADC)
Procedures (number)
32 SOUTHERN AFRICAN DEVELOPMENT COMMUNITY (SADC) Doing Business 2014
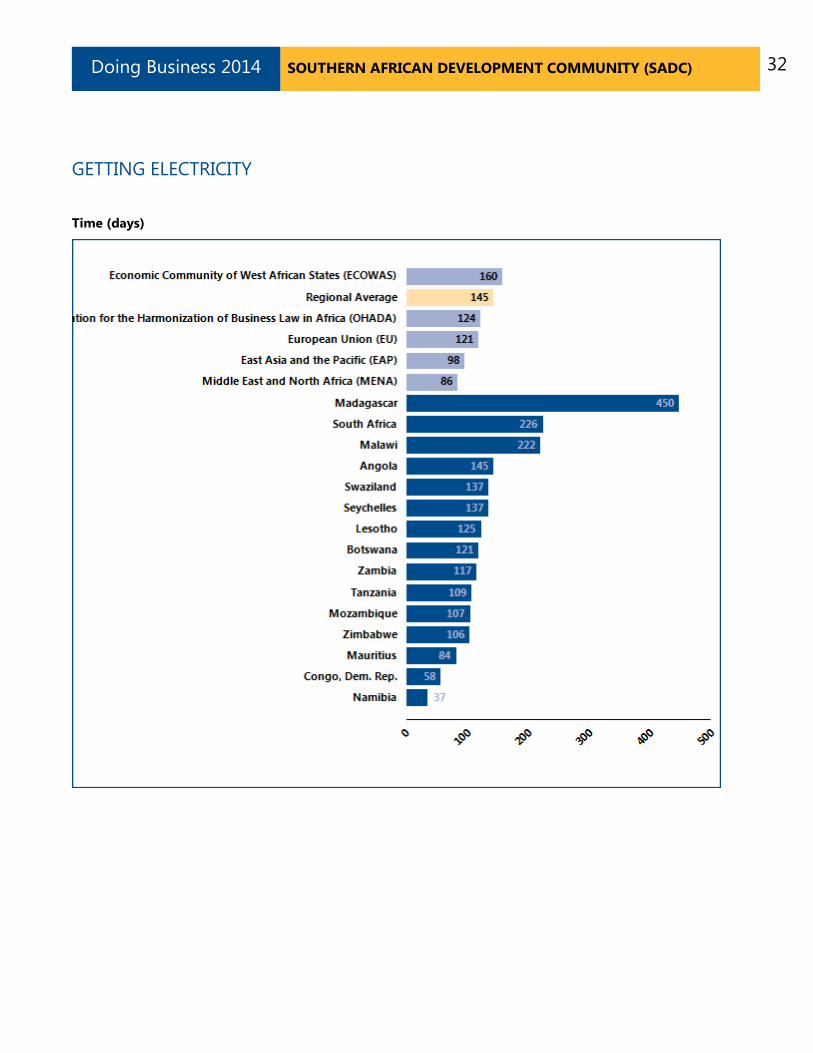
GETTING ELECTRICITY
Time (days)

33 SOUTHERN AFRICAN DEVELOPMENT COMMUNITY (SADC) Doing Business 2014
GETTING ELECTRICITY
Cost (% of income per capita)
Source: Doing Business database.

34 SOUTHERN AFRICAN DEVELOPMENT COMMUNITY (SADC) Doing Business 2014
GETTING ELECTRICITY
What are the changes over time?
Obtaining an electricity connection is essential to enable a business to conduct its most basic operations. In many economies the connection process is complicated by the multiple laws and regulations involved—covering service quality, general safety, technical standards, procurement practices and internal wiring installations. In an effort to ensure
safety in the connection process while keeping connection costs reasonable, governments around the world have worked to consolidate requirements for obtaining an electricity connection. What reforms in getting electricity has Doing Business recorded in Southern African Development Community (SADC) (table 4.1)?
Table 4.1 How have economies in Southern African Development Community (SADC) made getting electricity easier—or not? By Doing Business report year
DB year Economy Reform
DB2012 Mozambique
Mozambique made getting electricity more difficult by requiring authorization of a connection project by the Ministry of Energy and by adding an inspection of the completed external works.
DB2013 Angola
Angola made getting electricity easier by eliminating the requirement for customers applying for an electricity connection to obtain authorizations from the 2 utility companies.
DB2013 Namibia Namibia made getting electricity easier by reducing the time required to provide estimates and external connection works and by lowering the connection costs.
Source: Doing Business database.

35 SOUTHERN AFRICAN DEVELOPMENT COMMUNITY (SADC) Doing Business 2014
REGISTERING PROPERTY
Ensuring formal property rights is fundamental. Effective administration of land is part of that. If formal property transfer is too costly or complicated, formal titles might go informal again. And where property is informal or poorly administered, it has little chance of being accepted as collateral for loans—limiting access to finance.
What do the indicators cover?
Doing Business records the full sequence of procedures necessary for a business to purchase property from another business and transfer the property title to the buyer’s name. The transaction is considered complete when it is opposable to third parties and when the buyer can use the property, use it as collateral for a bank loan or resell it. The ranking on the ease of registering property is the simple average of the percentile rankings on its component indicators: procedures, time and cost.
To make the data comparable across economies, several assumptions about the parties to the transaction, the property and the procedures are used.
The parties (buyer and seller):
• Are limited liability companies, 100% domestically and privately owned.
• Are located in the periurban area of the economy’s largest business city.
• Have 50 employees each, all of whom are nationals.
• Perform general commercial activities.
The property (fully owned by the seller):
• Has a value of 50 times income per capita. The sale price equals the value.
• Is registered in the land registry or cadastre, or both, and is free of title disputes.
• Is located in a periurban commercial zone, and no rezoning is required.
WHAT THE REGISTERING PROPERTY
INDICATORS MEASURE
Procedures to legally transfer title on immovable property (number)
Preregistration procedures (for example, checking for liens, notarizing sales agreement, paying property transfer taxes)
Registration procedures in the economy’s largest business city
Postregistration procedures (for example, filing title with the municipality)
Time required to complete each procedure (calendar days)
Does not include time spent gathering information
Each procedure starts on a separate day. Procedures that can be fully completed online are an exception to this rule.
Procedure considered completed once final document is received
No prior contact with officials
Cost required to complete each procedure (% of property value)
Official costs only, no bribes
No value added or capital gains taxes included
• Has no mortgages attached and has been
under the same ownership for the past 10 years.
• Consists of 557.4 square meters (6,000 square feet) of land and a 10-year-old, 2-story warehouse of 929 square meters (10,000 square feet). The warehouse is in good condition and complies with all safety standards, building codes and legal requirements. There is no heating system. The property will be transferred in its entirety.
36 SOUTHERN AFRICAN DEVELOPMENT COMMUNITY (SADC) Doing Business 2014
REGISTERING PROPERTY
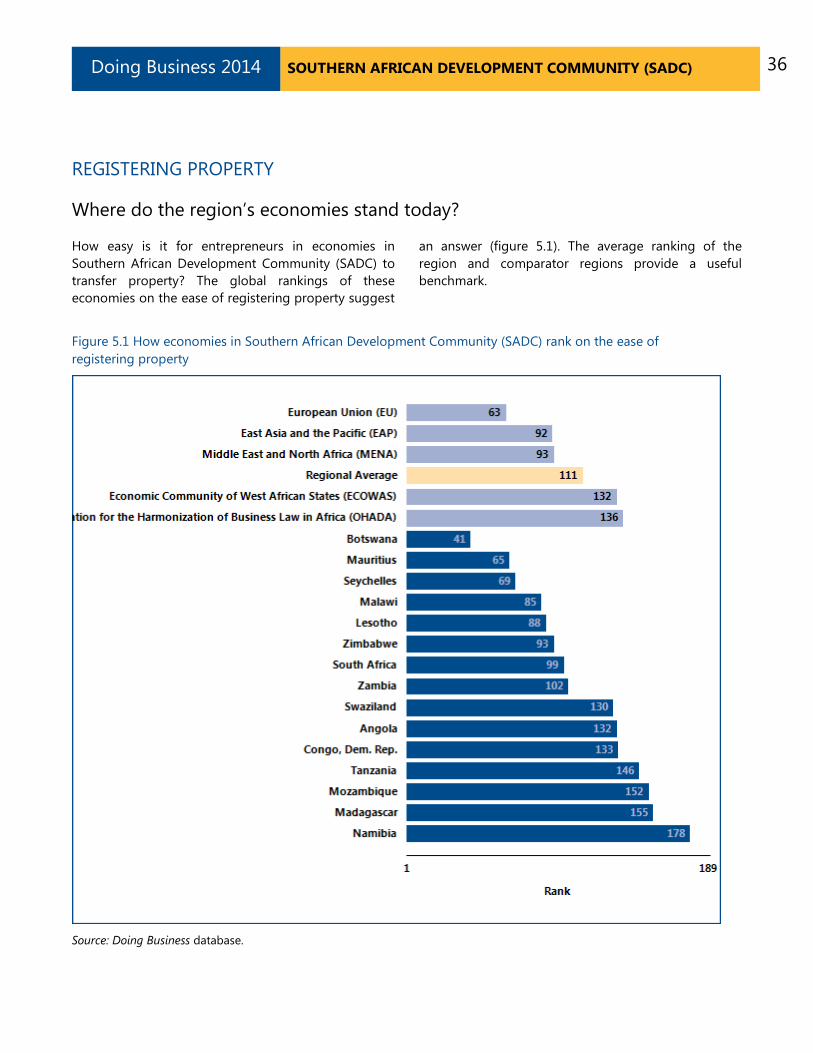
Where do the region’s economies stand today?
How easy is it for entrepreneurs in economies in Southern African Development Community (SADC) to transfer property? The global rankings of these economies on the ease of registering property suggest
an answer (figure 5.1). The average ranking of the region and comparator regions provide a useful benchmark.
Figure 5.1 How economies in Southern African Development Community (SADC) rank on the ease of registering property
Source: Doing Business database.

37 SOUTHERN AFRICAN DEVELOPMENT COMMUNITY (SADC) Doing Business 2014
REGISTERING PROPERTY
The indicators underlying the rankings may be more revealing. Data collected by Doing Business show what it takes to complete a property transfer in each economy in the region: the number of procedures,
the time and the cost (figure 5.2). Comparing these indicators across the region and with averages both for the region and for comparator regions can provide useful insights.
Figure 5.2 What it takes to register property in economies in Southern African Development Community (SADC)
Procedures (number)

38 SOUTHERN AFRICAN DEVELOPMENT COMMUNITY (SADC) Doing Business 2014
REGISTERING PROPERTY
Time (days)
39 SOUTHERN AFRICAN DEVELOPMENT COMMUNITY (SADC) Doing Business 2014
REGISTERING PROPERTY
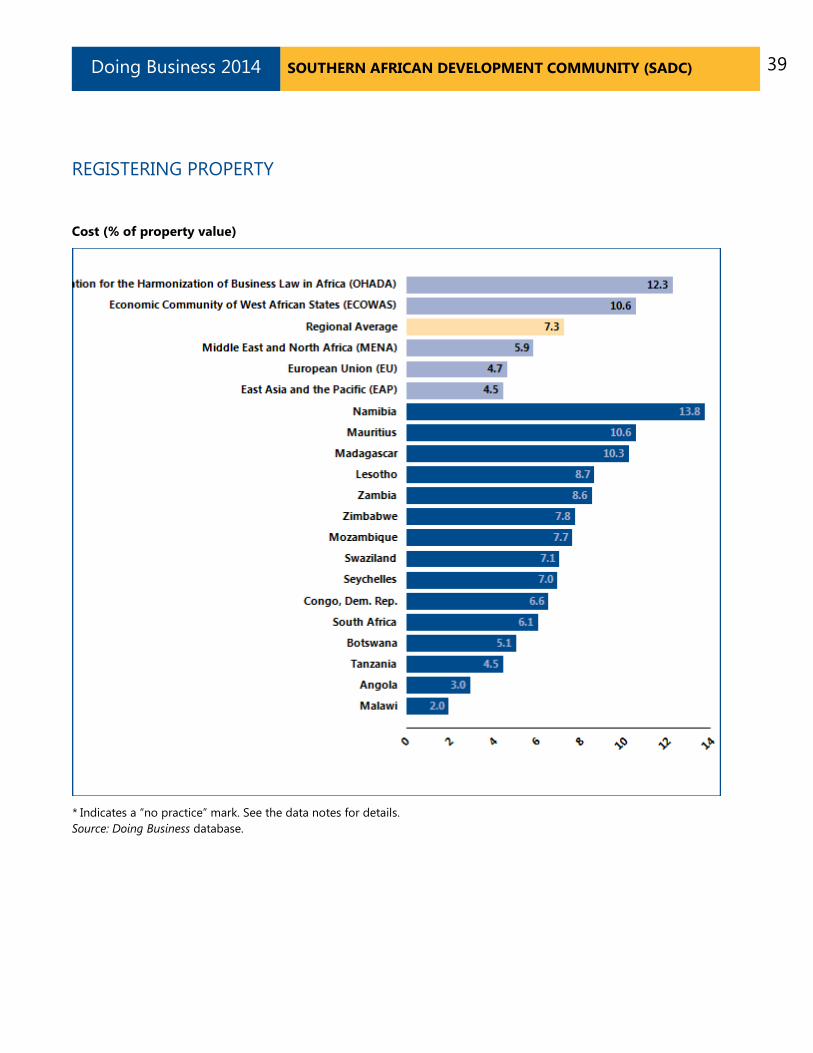
Cost (% of property value)
* Indicates a “no practice” mark. See the data notes for details. Source: Doing Business database.

40 SOUTHERN AFRICAN DEVELOPMENT COMMUNITY (SADC) Doing Business 2014
REGISTERING PROPERTY
What are the changes over time?Economies worldwide have been making it easier for entrepreneurs to register and transfer property—such as by computerizing land registries, introducing time limits for procedures and setting low fixed fees. Many have cut the time required substantially—enabling
buyers to use or mortgage their property earlier. What property registration reforms has Doing Business recorded in Southern African Development Community (SADC) (table 5.1)?
Table 5.1 How have economies in Southern African Development Community (SADC) made registering property easier—or not? By Doing Business report year
DB year Economy Reform
DB2008 Lesotho Property registration was made easier for women by allowing married women to transfer land without their husband's signature.
DB2008 Mauritius Mauritius made registering property cheaper by reducing the property registration fee.
DB2008 Zimbabwe Zimbabwe made registering property more expensive by increasing the conveyancers fees.
DB2009 Madagascar
Madagascar reformed its Land Registry, more staff was hired, more computers were added and the number of offices increased. In addition, Madagascar abolished two taxes and removed the mandatory stamps duty on documents. As a result, the number of procedures to register a property went down from 8 to 7, time was reduced by 60 days and cost by 4.04%.
DB2009 Mauritius
Mauritius abolished two procedures, the requirement to obtain clearance certificate from the Waste Water Authority and to obtain a tax clearance certificate for municipal taxes. This reform has reduced the number of procedures required to transfer property in Mauritius from 6 to 4.
DB2009 Zambia
Zambia computerized its land registry and set up a customer service center to eliminate the backlog of registration requests. As a result, the time required to register a property in Zambia is reduced from 70 to 39 days.

41 SOUTHERN AFRICAN DEVELOPMENT COMMUNITY (SADC) Doing Business 2014
DB year Economy Reform
DB2010 Angola The land registry in Angola was digitized and split into two units covering half of the land, accelerating procedures necessary to transfer property in Luanda.
DB2010 Botswana Botwana made it more difficult to register property with the addition of a procedure where the tax agency must be notified of the VAT payment
DB2010 Madagascar Madagascar made it more costly to transfer a property by introducing the mandatory use of notary for property transactions.
DB2010 Mauritius Mauritius has made it easier to register property by setting a statutory time limit of 15 days to obtain the final property title from the Land Registry
DB2010 Zimbabwe Zimbabwe has reduced the cost to transfer a property by 15% of the value of the property.
DB2011 Congo, Dem. Rep. The Democratic Republic of Congo reduced by half the property transfer tax to 3% of the property value.
DB2011 Malawi Malawi eased property transfers by cutting the wait for consents and registration of legal instruments by half.
DB2012 Angola Angola made transferring property less costly by reducing transfer taxes.
DB2012 Malawi Malawi made property registration slower by no longer sustaining last year’s time improvement in Compliance Certificate processing times at the Ministry of Lands.
DB2012 Namibia Namibia made transferring property more expensive for companies.
DB2012 South Africa South Africa made transferring property less costly and more efficient by reducing the transfer duty and introducing electronic filing.
DB2012 Swaziland Swaziland made transferring property quicker by streamlining the process at the land registry.

42 SOUTHERN AFRICAN DEVELOPMENT COMMUNITY (SADC) Doing Business 2014
DB year Economy Reform
DB2012 Zambia Zambia made registering property more costly by increasing the property transfer tax rate.
DB2013 Mauritius Mauritius made property transfers faster by implementing an electronic information management system at the Registrar-General’s Department.
DB2013 Namibia Namibia made transferring property more difficult by requiring conveyancers to obtain a building compliance certificate beforehand.
DB2014 Lesotho Lesotho made transferring property easier by streamlining procedures and increasing administrative efficiency.
DB2014 Malawi Malawi made transferring property easier by reducing the stamp duty.
DB2014 Namibia Namibia made transferring property more expensive by increasing the transfer and stamp duties.
Note: For information on reforms in earlier years (back to DB2005), see the Doing Business reports for these years, available at http://www.doingbusiness.org. Source: Doing Business database.

43 SOUTHERN AFRICAN DEVELOPMENT COMMUNITY (SADC) Doing Business 2014
GETTING CREDIT
Two types of frameworks can facilitate access to credit and improve its allocation: credit information systems and the borrowers and lenders’ rights in collateral and bankruptcy laws. Credit information systems enable lenders to view a potential borrower’s financial history (positive or negative)—valuable information to consider when assessing risk. And they permit borrowers to establish a good credit history that will allow easier access to credit. Sound collateral laws enable businesses to use their assets, especially movable property, as security to generate capital—while strong creditors’ rights have been associated with higher ratios of private sector credit to GDP.
What do the indicators cover?
Doing Business assesses the sharing of credit information and the legal rights of borrowers and lenders with respect to secured transactions through 2 sets of indicators. The depth of credit information index measures rules and practices affecting the coverage, scope and accessibility of credit information available through a public credit registry or a private credit bureau. The strength of legal rights index measures whether certain features that facilitate lending exist within the applicable collateral and bankruptcy laws. Doing Business uses case scenarios to determine the scope of the secured transactions system, involving a secured borrower and a secured lender and examining legal restrictions on the use of movable collateral. These scenarios assume that the borrower:
• Is a private, incorporated, limited liability company.
• Has its headquarters and only base of operations in the largest business city.
WHAT THE GETTING CREDIT INDICATORS
MEASURE
Strength of legal rights index (0–10)
Protection of rights of borrowers and lenders through collateral laws
Protection of secured creditors’ rights through bankruptcy laws
Depth of credit information index (0–6) Scope and accessibility of credit information distributed by public credit registries and private credit bureaus
Public credit registry coverage (% of adults) Number of individuals and firms listed in public credit registry as percentage of adult population
Private credit bureau coverage (% of adults) Number of individuals and firms listed in largest private credit bureau as percentage of adult population
• Has up to 100 employees.
• Is 100% domestically owned, as is the lender.
The ranking on the ease of getting credit is based on the percentile rankings on the sum of its component indicators: the depth of credit information index and the strength of legal rights index.
44 SOUTHERN AFRICAN DEVELOPMENT COMMUNITY (SADC) Doing Business 2014
GETTING CREDIT
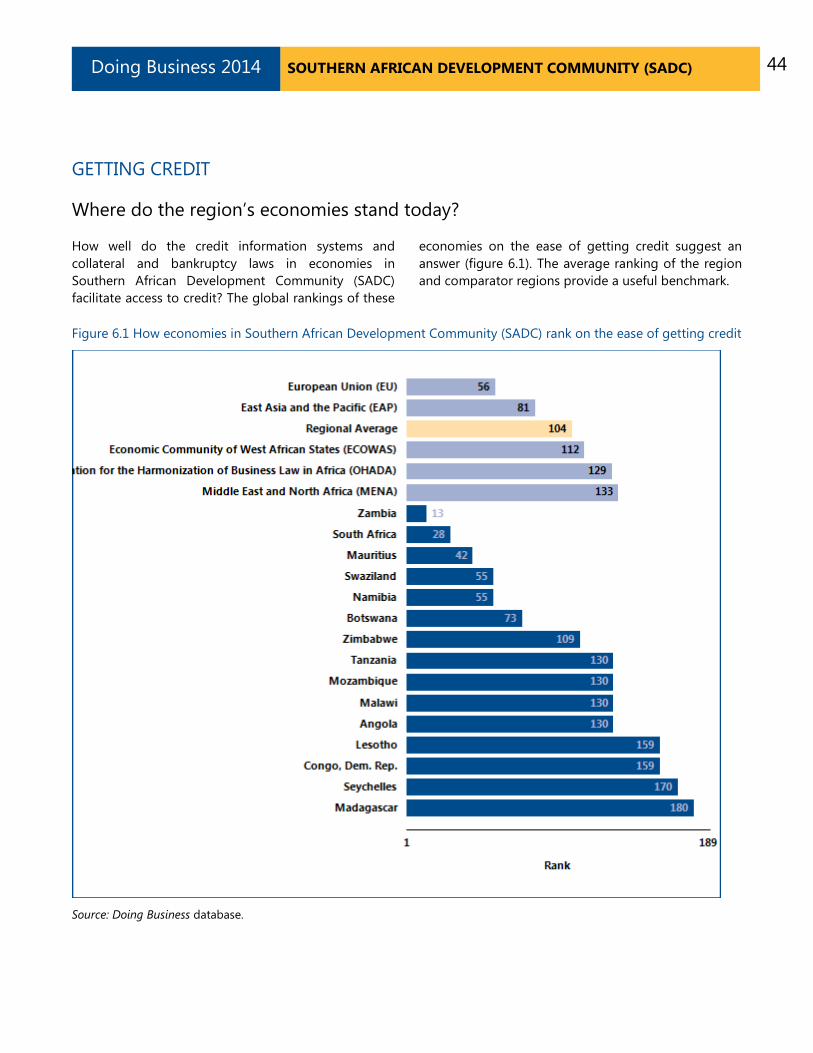
Where do the region’s economies stand today?
How well do the credit information systems and collateral and bankruptcy laws in economies in Southern African Development Community (SADC) facilitate access to credit? The global rankings of these
economies on the ease of getting credit suggest an answer (figure 6.1). The average ranking of the region and comparator regions provide a useful benchmark.
Figure 6.1 How economies in Southern African Development Community (SADC) rank on the ease of getting credit
Source: Doing Business database.

45 SOUTHERN AFRICAN DEVELOPMENT COMMUNITY (SADC) Doing Business 2014
GETTING CREDIT
Another way to assess how well regulations and institutions support lending and borrowing in the region is to look at the distribution of its economies by their scores on the getting credit indicators. Figure 6.2 shows how many economies in the region received a
particular score on the strength of legal rights index. Figure 6.3 shows the same thing for the depth of credit information index. Higher scores indicate stronger legal rights for borrowers and lenders and more credit information.
Figure 6.2 How strong are legal rights for borrowers and lenders in economies in Southern African Development Community (SADC)?
Number of economies in region with each score on strength of legal rights index (0–10)
Note: Higher scores indicate that collateral and bankruptcy laws are better designed to facilitate access to credit. Source: Doing Business database.
Figure 6.3 How extensive—and how accessible—is credit information in economies in Southern African Development Community (SADC)?
Number of economies in region with each score on depth of credit information index (0–6)
Note: Higher scores indicate the availability of more credit information, from either a credit registry or a credit bureau, to facilitate lending decisions. Source: Doing Business database.

46 SOUTHERN AFRICAN DEVELOPMENT COMMUNITY (SADC) Doing Business 2014
GETTING CREDIT
What are the changes over time?
When economies strengthen the legal rights of lenders and borrowers under collateral and bankruptcy laws, and increase the scope, coverage and accessibility of credit information, they can increase entrepreneurs’
access to credit. What credit reforms has Doing Business recorded in Southern African Development Community (SADC) (table 6.1)?
Table 6.1 How have economies in Southern African Development Community (SADC) made getting credit easier—or not? By Doing Business report year
DB year Economy Reform
DB2008 South Africa Lenders are now required to check their overall debt levels before granting loans and guarantees borrowers the right to access and challenge their credit records.
DB2009 Mauritius
The public credit registry in Mauritius eliminated the minimum loan requirement threshold to report credits in March 2007. The credit registry now captures information on all credits extended by the financial system.
DB2010 Mauritius
Mauritius has strengthened access to credit information by allowing the licensing of private credit information bureaus, and by expanding the coverge of the bureau to all credit facilities.
DB2010 Zambia
Zambia strengthened access to credit information by making it mandatory for banks and non-bank financial instituitions registered with Bank of Zambia to use credit reference reports and provide data to the Bureau.
DB2012 Angola Angola strengthened its credit information system by adopting new rules for credit bureaus and guaranteeing the right of borrowers to inspect their data.
DB2012 Madagascar
Madagascar improved its credit information system by eliminating the minimum threshold for loans included in the database and making it mandatory for banks to share credit information with the credit bureau.
DB2012 Malawi Malawi improved its credit information system by passing a new law allowing the creation of a private credit bureau.
DB2013 Mauritius Mauritius improved access to credit information by starting to collect payment information from retailers and beginning to

47 SOUTHERN AFRICAN DEVELOPMENT COMMUNITY (SADC) Doing Business 2014
DB year Economy Reform
distribute both positive and negative information.
DB2014 Congo, Dem. Rep.
The Democratic Republic of Congo strengthened its secured transactions system by adopting the OHADA (Organization for the Harmonization of Business Law in Africa) Uniform Act on Secured Transactions. The new law broadens the range of assets that can be us
DB2014 Mauritius Mauritius improved access to credit information by expanding the scope of credit information and increasing the coverage of the historical data distributed from 2 years to 3.
DB2014 Tanzania
Tanzania improved its credit information system through new regulations that provide for the licensing of credit reference bureaus and outline the functions of the credit reference data bank.
Note: For information on reforms in earlier years (back to DB2005), see the Doing Business reports for these years, available at http://www.doingbusiness.org. Source: Doing Business database.

48 SOUTHERN AFRICAN DEVELOPMENT COMMUNITY (SADC) Doing Business 2014
PROTECTING INVESTORS
Protecting investors matters for the ability of companies to raise the capital they need to grow, innovate, diversify and compete. If the laws do not protect minority shareholders, investors may be reluctant to provide funding to companies through the purchase of shares unless they become the controlling shareholders. Effective regulations define related-party transactions precisely, promote clear and efficient disclosure requirements, require shareholder participation in major decisions of the company and set detailed standards of accountability for company insiders.
What do the indicators cover?
Doing Business measures the strength of minority shareholder protections against directors’ use of corporate assets for personal gain—or self-dealing. The indicators distinguish 3 dimensions of investor protections: transparency of related-party transactions (extent of disclosure index), liability for self-dealing (extent of director liability index) and minority shareholders’ access to evidence before and during (ease of shareholder suits index). The ranking on the strength of investor protection index is the simple average of the percentile rankings on these 3 indices. To make the data comparable across economies, a case study uses several assumptions about the business and the transaction.
The business (Buyer):
• Is a publicly traded corporation listed on the economy’s most important stock exchange (or at least a large private company with multiple shareholders).
• Has a board of directors and a chief executive officer (CEO) who may legally act on behalf of Buyer where permitted, even if this is not specifically required by law.
The transaction involves the following details:
• Mr. James, a director and the majority shareholder of the company, proposes that the company purchase used trucks from another company he owns.
WHAT THE PROTECTING INVESTORS INDICATORS MEASURE
Extent of disclosure index (0–10)
Approval process for related-party transactions
Disclosure requirements in case of related-party transactions
Extent of director liability index (0–10) Ability of minority shareholders to file a direct or derivative lawsuit
Ability of minority shareholders to hold interested parties and members of the approving body liable for prejudicial related-party transactions
Available legal remedies (damages, disgorgement of profits, fines, imprisonment and rescission of the transaction)
Ease of shareholder suits index (0–10) Access to internal corporate documents (directly or through a government inspector)
Documents and information available during trial
Strength of investor protection index (0–10) Simple average of the extent of disclosure, extent of director liability and ease of shareholder suits indices
• The price is higher than the going price for used
trucks, but the transaction goes forward.
• All required approvals are obtained, and all required disclosures made, though the transaction is prejudicial to Buyer.
• Shareholders sue the interested parties and the members of the board of directors.
49 SOUTHERN AFRICAN DEVELOPMENT COMMUNITY (SADC) Doing Business 2014

50 SOUTHERN AFRICAN DEVELOPMENT COMMUNITY (SADC) Doing Business 2014
PROTECTING INVESTORS
Where do the region’s economies stand today?
How strong are investor protections against self-dealing in economies in Southern African Development Community (SADC)? The global rankings of these economies on the strength of investor protection index suggest an answer (figure 7.1). While
the indicator does not measure all aspects related to the protection of minority investors, a higher ranking does indicate that an economy’s regulations offer stronger investor protections against self-dealing in the areas measured.
Figure 7.1 How economies in Southern African Development Community (SADC) rank on the strength of investor protection index
Source: Doing Business database.
51 SOUTHERN AFRICAN DEVELOPMENT COMMUNITY (SADC) Doing Business 2014
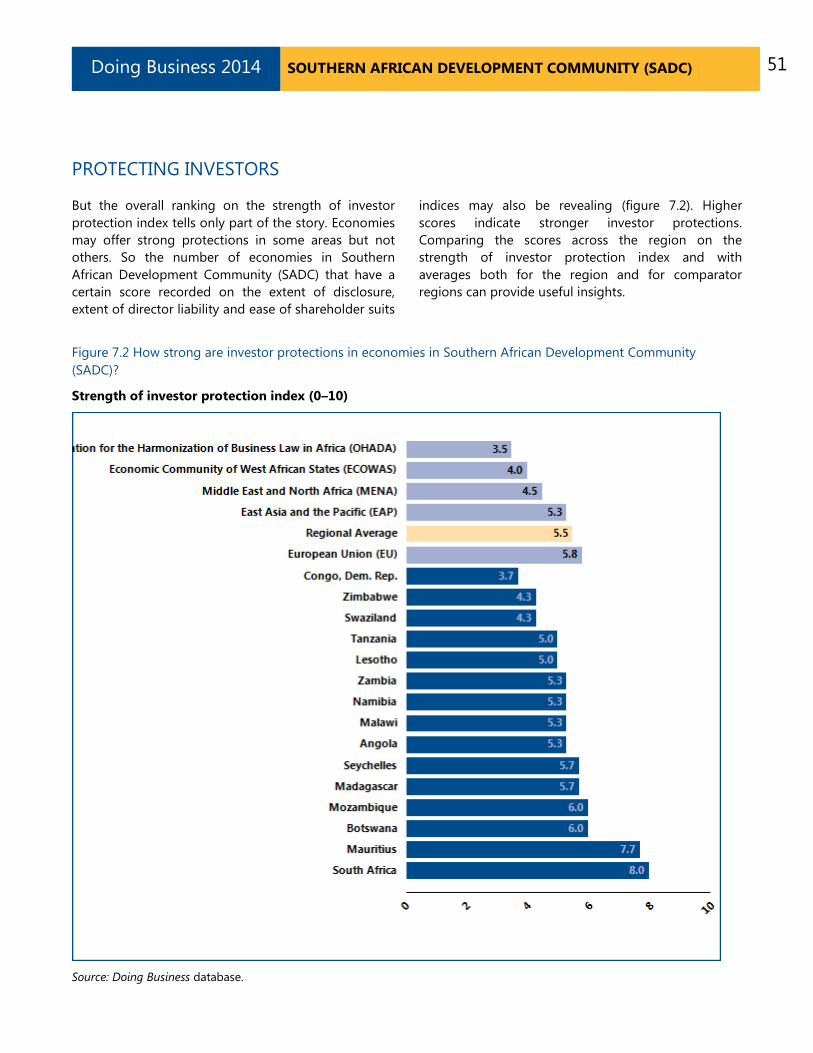
PROTECTING INVESTORS
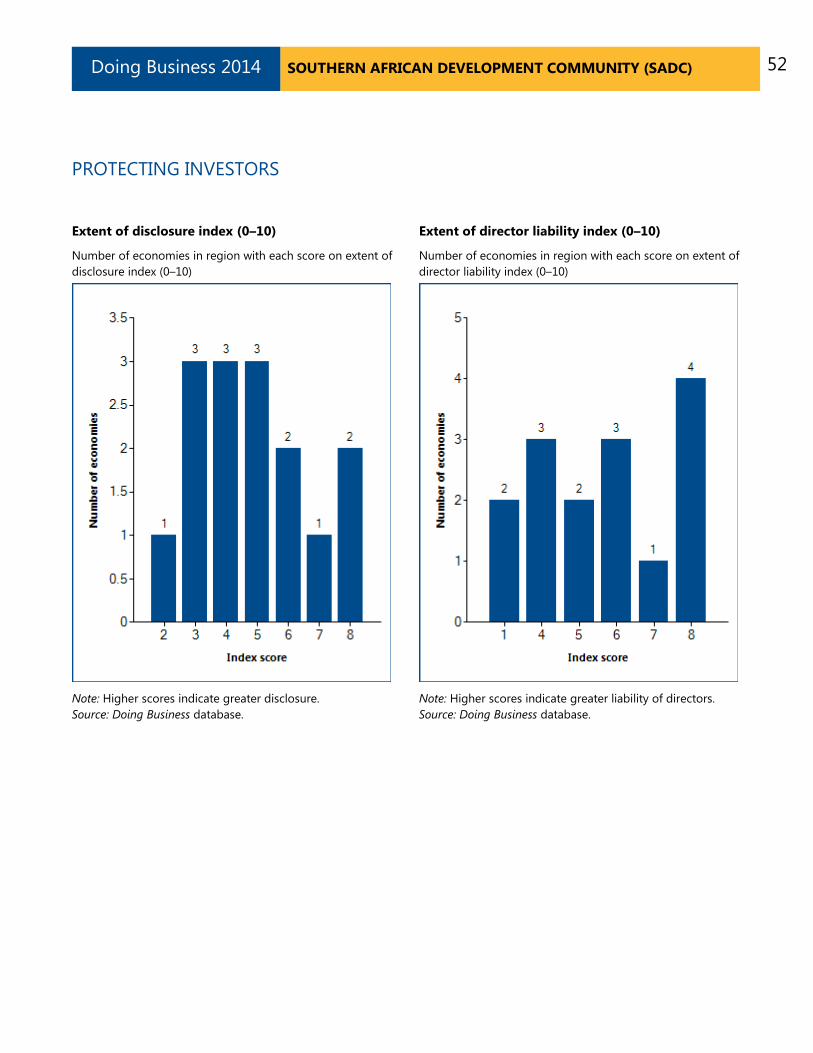
But the overall ranking on the strength of investor protection index tells only part of the story. Economies may offer strong protections in some areas but not others. So the number of economies in Southern African Development Community (SADC) that have a certain score recorded on the extent of disclosure, extent of director liability and ease of shareholder suits
indices may also be revealing (figure 7.2). Higher scores indicate stronger investor protections. Comparing the scores across the region on the strength of investor protection index and with averages both for the region and for comparator regions can provide useful insights.
Figure 7.2 How strong are investor protections in economies in Southern African Development Community (SADC)?
Strength of investor protection index (0–10)
Source: Doing Business database.
52 SOUTHERN AFRICAN DEVELOPMENT COMMUNITY (SADC) Doing Business 2014
PROTECTING INVESTORS
Extent of disclosure index (0–10)
Number of economies in region with each score on extent of disclosure index (0–10)
Note: Higher scores indicate greater disclosure. Source: Doing Business database.
Extent of director liability index (0–10)
Number of economies in region with each score on extent of director liability index (0–10)
Note: Higher scores indicate greater liability of directors. Source: Doing Business database.
53 SOUTHERN AFRICAN DEVELOPMENT COMMUNITY (SADC) Doing Business 2014
PROTECTING INVESTORS
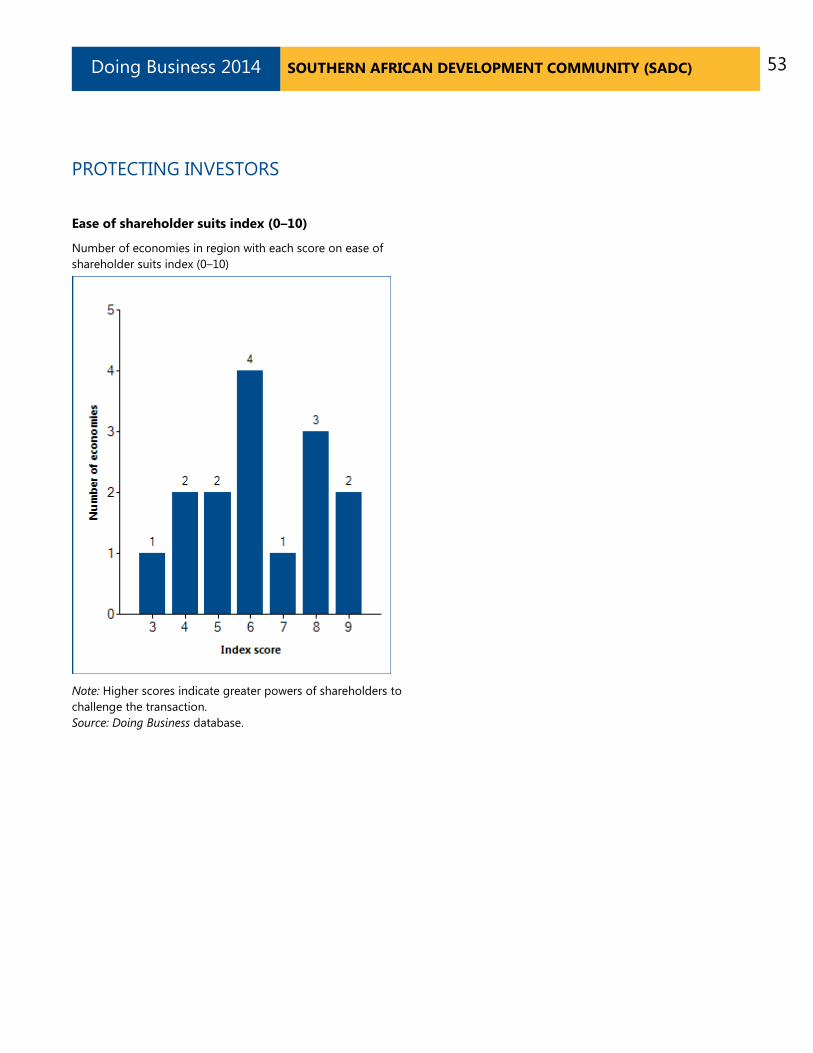
Ease of shareholder suits index (0–10)
Number of economies in region with each score on ease of shareholder suits index (0–10)
Note: Higher scores indicate greater powers of shareholders to challenge the transaction. Source: Doing Business database.

54 SOUTHERN AFRICAN DEVELOPMENT COMMUNITY (SADC) Doing Business 2014
PROTECTING INVESTORS
What are the changes over time?
Economies with the strongest protections of minority investors from self-dealing require detailed disclosure and define clear duties for directors. They also have well-functioning courts and up-to-date procedural rules that give minority shareholders the means to prove their case and obtain a judgment within a reasonable time. So reforms to strengthen investor
protections may move ahead on different fronts—such as through new or amended company laws, securities regulations or revisions to court procedures. What investor protection reforms has Doing Business recorded in Southern African Development Community (SADC) (table 7.1)?
Table 7.1 How have economies in Southern African Development Community (SADC) strengthened investor protections—or not? By Doing Business report year
DB year Economy Reform
DB2008 Mozambique
Mozambique strengthened investor protections by enacting a new Commercial Code, which allows shareholders to bring derivative suits against members of the board of directors, and which introduces detailed duties and liability for major shareholders and directors. It also expands the scope of accessible company information and the right to request the appointment of an expert to investigate the activities of the company.
DB2009 Botswana
Botswana strengthened investor protections by requiring that related-party transactions be approved by the shareholders meeting, and by allowing shareholders to sue directors and obtain the payment of damages if successful.
DB2011 Swaziland
Swaziland strengthened investor protections by requiring greater corporate disclosure, higher standards of accountability for company directors and greater access to corporate information for minority investors. Swaziland reduced the time to import by implementing an electronic data interchange system for customs at its border posts.
DB2013 Lesotho
Lesotho strengthened investor protections by increasing the disclosure requirements for related-party transactions and improving the liability regime for company directors in cases of abusive related-party transactions.

55 SOUTHERN AFRICAN DEVELOPMENT COMMUNITY (SADC) Doing Business 2014
DB year Economy Reform
DB2014 Congo, Dem. Rep.
The Democratic Republic of Congo strengthened investor protections by adopting the OHADA Uniform Act on Commercial Companies and Economic Interest Groups, which introduces additional approval and disclosure requirements for related-party transactions and
Note: For information on reforms in earlier years (back to DB2005), see the Doing Business reports for these years, available at http://www.doingbusiness.org. Source: Doing Business database.

56 SOUTHERN AFRICAN DEVELOPMENT COMMUNITY (SADC) Doing Business 2014
PAYING TAXES
Taxes are essential. They fund the public amenities, infrastructure and services that are crucial for a properly functioning economy. But the level of tax rates needs to be carefully chosen—and needless complexity in tax rules avoided. According to Doing Business data, in economies where it is more difficult and costly to pay taxes, larger shares of economic activity end up in the informal sector—where businesses pay no taxes at all.
What do the indicators cover?
Using a case scenario, Doing Business measures the taxes and mandatory contributions that a medium-size company must pay in a given year as well as the administrative burden of paying taxes and contributions. This case scenario uses a set of financial statements and assumptions about transactions made over the year. Information is also compiled on the frequency of filing and payments as well as time taken to comply with tax laws. The ranking on the ease of paying taxes is the simple average of the percentile rankings on its component indicators: number of annual payments, time and total tax rate, with a threshold being applied to the total tax rate.1 To make the data comparable across economies, several assumptions about the business and the taxes and contributions are used.
• TaxpayerCo is a medium-size business that started operations on January 1, 2011.
• The business starts from the same financial position in each economy. All the taxes and mandatory contributions paid during the second year of operation are recorded.
• Taxes and mandatory contributions are measured at all levels of government.
WHAT THE PAYING TAXES INDICATORS
MEASURE
Tax payments for a manufacturing company in 2012 (number per year adjusted for electronic or joint filing and payment)
Total number of taxes and contributions paid, including consumption taxes (value added tax, sales tax or goods and service tax)
Method and frequency of filing and payment
Time required to comply with 3 major taxes (hours per year)
Collecting information and computing the tax payable
Completing tax return forms, filing with proper agencies
Arranging payment or withholding
Preparing separate tax accounting books, if required
Total tax rate (% of profit) Profit or corporate income tax
Social contributions and labor taxes paid by the employer
Property and property transfer taxes
Dividend, capital gains and financial transactions taxes
Waste collection, vehicle, road and other taxes
• Taxes and mandatory contributions include corporate income tax, turnover tax and all labor taxes and contributions paid by the company.
• A range of standard deductions and exemptions are also recorded.
1 The threshold is defined as the highest total tax rate among the top 15% of economies in the ranking on the total tax rate. It is calculated and adjusted on a yearly basis. The threshold is not based on any economic theory of an “optimal tax rate” that minimizes distortions or maximizes efficiency in the tax system of an economy overall. Instead, it is mainly empirical in nature, set at the lower end of the distribution of tax rates levied on medium-size enterprises in the manufacturing sector as observed through the paying taxes indicators. This reduces the bias in the indicators toward economies that do not need to levy significant taxes on companies like the Doing Business standardized case study company because they raise public revenue in other ways—for example, through taxes on foreign companies, through taxes on sectors other than manufacturing or from natural resources (all of which are outside the scope of the methodology). This year’s threshold is 25.5%.

57 SOUTHERN AFRICAN DEVELOPMENT COMMUNITY (SADC) Doing Business 2014
PAYING TAXES
Where do the region’s economies stand today?
What is the administrative burden of complying with taxes in economies in Southern African Development Community (SADC)—and how much do firms pay in taxes? The global rankings of these economies on the
ease of paying taxes offer useful information for assessing the tax compliance burden for businesses (figure 8.1). The average ranking of the region and comparator regions provide a useful benchmark.
Figure 8.1 How economies in Southern African Development Community (SADC) rank on the ease of paying taxes
Note: For all economies with a total tax rate below the threshold of 25.5% applied in DB2014, the total tax rate is set at 25.5% for the purpose of calculating the ranking on the ease of paying taxes. Source: Doing Business database.

58 SOUTHERN AFRICAN DEVELOPMENT COMMUNITY (SADC) Doing Business 2014
PAYING TAXES
The indicators underlying the rankings may be more revealing. Data collected by Doing Business show what it takes to comply with tax regulations in each economy in the region—the number of payments per year and the time required to prepare and file taxes—
as well as the total tax rate (figure 8.2). Comparing these indicators across the region and with averages both for the region and for comparator regions can provide useful insights.
Figure 8.2 How easy is it to pay taxes in economies in Southern African Development Community (SADC)—and what are the total tax rates?
Payments (number per year)

59 SOUTHERN AFRICAN DEVELOPMENT COMMUNITY (SADC) Doing Business 2014
PAYING TAXES
Time (hours per year)

60 SOUTHERN AFRICAN DEVELOPMENT COMMUNITY (SADC) Doing Business 2014
PAYING TAXES
Total tax rate (% of profit)
Source: Doing Business database.

61 SOUTHERN AFRICAN DEVELOPMENT COMMUNITY (SADC) Doing Business 2014
PAYING TAXES
What are the changes over time?
Economies around the world have made paying taxes faster and easier for businesses—such as by consolidating filings, reducing the frequency of payments or offering electronic filing and payment. Many have lowered tax rates. Changes have brought
concrete results. Some economies simplifying tax payment and reducing rates have seen tax revenue rise. What tax reforms has Doing Business recorded in Southern African Development Community (SADC) (table 8.1)?
Table 8.1 How have economies in Southern African Development Community (SADC) made paying taxes easier—or not? By Doing Business report year
DB year Economy Reform
DB2008 Lesotho Lesotho reduced the tax burden for companies by reducing CIT and made it easier to pay taxes for companies by spreading the use of e-filing and e-payment
DB2008 Mauritius Mauritius reduced the tax burden for companies by reducing CIT
DB2008 Seychelles No impact on Doing Business 2008 indicators.
DB2008 South Africa South Africa eased the tax burden on business by abolishing the stamp duty.
DB2008 Zimbabwe Zimbabwe increased the tax on check transaction and introduced a new, more burdensome form for the payment of CIT
DB2009 Botswana Training levy of 0.2% introduced effective 1 January 2008.
DB2009 Madagascar
Capital gains tax was abolished effective 1 January 2008. Effective 1 January 2008, corporate income tax is reduced from 30% to 25%, and several taxes, for example proessional tax and stamp duty, have been abolished. VAT rate has been increased from 18% to 20%
DB2009 Mozambique
New Corporate Inceome Tax Code introduced, which has a simplified scheme for companies with annual revenues of up to MZM 2.5 million in the previous year (previously MZM 1.5 million). A new VAT Act effective January 2008. Its new simplified regime for smaller companies applies to taxable

62 SOUTHERN AFRICAN DEVELOPMENT COMMUNITY (SADC) Doing Business 2014
DB year Economy Reform
persons with revenues between MZM 750,000 (previously MZM 100,000) and MZM 2,500,000 (no change). Electronic tax forms introduced for social security taxes.
DB2009 South Africa Regional Establishment Levy and Regional Services Levy were abolished.
DB2009 Zambia
Effective 2008, amendments will be made to the Income Tax Act in order to update, strengthen, and remove ambiguities in these laws and to enhance the effectiveness of tax administration. The depreciation allowance for capital equipment will be reduced from 100% to 25% per annum. Ring-fencing introduced for capital expenditure on new projects, and only deductible sfter production starts. The VAT Act will be substantively amended and the rate of VAT will be reduced to between 16.5% and 15%.
DB2010 Angola Angola made it easier to pay taxes by introducing mandatory electronic filing of social security for businesses with more than 20 employees.
DB2010 Congo, Dem. Rep. Congo, Dem. Rep. has sought to increase its tax revenue by raising sales tax from 13% to 15%.
DB2010 South Africa South Africa eased the tax burden on buisness by abolishing the stamp duty.
DB2011 Madagascar Madagascar continued to reduce corporate tax rates.
DB2011 Mauritius Mauritius introduced a new corporate social responsibility tax.
DB2011 Seychelles The Seychelles removed the tax-free threshold limit and lowered corporate income tax rates.
DB2011 Zimbabwe
Zimbabwe reduced the corporate income tax rate from 30% to 25%, lowered the capital gains tax from 20% to 5% and simplified the payment of corporate income tax by allowing quarterly payment through commercial banks.
DB2012 Congo, Dem. Rep. The Democratic Republic of Congo made paying taxes easier for firms by replacing the sales tax with a value added tax.
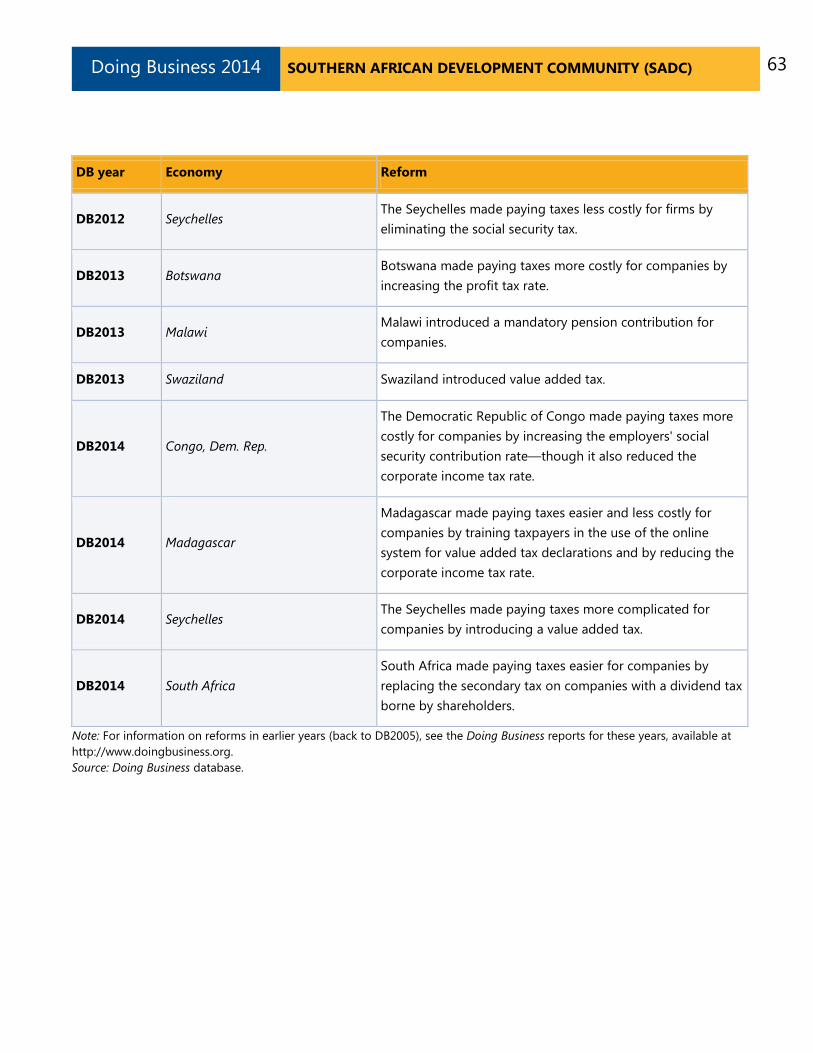
63 SOUTHERN AFRICAN DEVELOPMENT COMMUNITY (SADC) Doing Business 2014
DB year Economy Reform
DB2012 Seychelles The Seychelles made paying taxes less costly for firms by eliminating the social security tax.
DB2013 Botswana Botswana made paying taxes more costly for companies by increasing the profit tax rate.
DB2013 Malawi Malawi introduced a mandatory pension contribution for companies.
DB2013 Swaziland Swaziland introduced value added tax.
DB2014 Congo, Dem. Rep.
The Democratic Republic of Congo made paying taxes more costly for companies by increasing the employers' social security contribution rate—though it also reduced the corporate income tax rate.
DB2014 Madagascar
Madagascar made paying taxes easier and less costly for companies by training taxpayers in the use of the online system for value added tax declarations and by reducing the corporate income tax rate.
DB2014 Seychelles The Seychelles made paying taxes more complicated for companies by introducing a value added tax.
DB2014 South Africa South Africa made paying taxes easier for companies by replacing the secondary tax on companies with a dividend tax borne by shareholders.
Note: For information on reforms in earlier years (back to DB2005), see the Doing Business reports for these years, available at http://www.doingbusiness.org. Source: Doing Business database.

64 SOUTHERN AFRICAN DEVELOPMENT COMMUNITY (SADC) Doing Business 2014
TRADING ACROSS BORDERS In today’s globalized world, making trade between economies easier is increasingly important for business. Excessive document requirements, burdensome customs procedures, inefficient port operations and inadequate infrastructure all lead to extra costs and delays for exporters and importers, stifling trade potential. Research shows that exporters in developing countries gain more from a 10% drop in their trading costs than from a similar reduction in the tariffs applied to their products in global markets.
What do the indicators cover?
Doing Business measures the time and cost (excluding tariffs and the time and cost for sea transport) associated with exporting and importing a standard shipment of goods by sea transport, and the number of documents necessary to complete the transaction. The indicators cover procedural requirements such as documentation requirements and procedures at customs and other regulatory agencies as well as at the port. They also cover trade logistics, including the time and cost of inland transport to the largest business city. The ranking on the ease of trading across borders is the simple average of the percentile rankings on its component indicators: documents, time and cost to export and import.
To make the data comparable across economies, Doing Business uses several assumptions about the business and the traded goods.
The business:
• Is of medium size and employs 60 people.
• Is located in the periurban area of the economy’s largest business city.
• Is a private, limited liability company, domestically owned, formally registered and operating under commercial laws and regulations of the economy.
The traded goods:
• Are not hazardous nor do they include military items.
WHAT THE TRADING ACROSS BORDERS
INDICATORS MEASURE
Documents required to export and import (number)
Bank documents
Customs clearance documents
Port and terminal handling documents
Transport documents
Time required to export and import (days) Obtaining, filling out and submitting all the documents
Inland transport and handling
Customs clearance and inspections
Port and terminal handling
Does not include sea transport time
Cost required to export and import (US$ per container)
All documentation
Inland transport and handling
Customs clearance and inspections
Port and terminal handling
Official costs only, no bribes
• Do not require refrigeration or any other special environment.
• Do not require any special phytosanitary or environmental safety standards other than accepted international standards.
• Are one of the economy’s leading export or import products.
• Are transported in a dry-cargo, 20-foot full container load.

65 SOUTHERN AFRICAN DEVELOPMENT COMMUNITY (SADC) Doing Business 2014
TRADING ACROSS BORDERS
Where do the region’s economies stand today?
How easy it is for businesses in economies in Southern African Development Community (SADC) to export and import goods? The global rankings of these economies on the ease of trading across borders
suggest an answer (figure 9.1). The average ranking of the region and comparator regions provide a useful benchmark.
Figure 9.1 How economies in Southern African Development Community (SADC) rank on the ease of trading across borders
Source: Doing Business database.

66 SOUTHERN AFRICAN DEVELOPMENT COMMUNITY (SADC) Doing Business 2014
TRADING ACROSS BORDERS
The indicators underlying the rankings may be more revealing. Data collected by Doing Business show what it takes to export or import a standard container of goods in each economy in the region: the number of
documents, the time and the cost (figure 9.2). Comparing these indicators across the region and with averages both for the region and for comparator regions can provide useful insights.
Figure 9.2 What it takes to trade across borders in economies in Southern African Development Community (SADC)
Documents to export (number)

67 SOUTHERN AFRICAN DEVELOPMENT COMMUNITY (SADC) Doing Business 2014
TRADING ACROSS BORDERS
Time to export (days)

68 SOUTHERN AFRICAN DEVELOPMENT COMMUNITY (SADC) Doing Business 2014
TRADING ACROSS BORDERS
Cost to export (US$ per container)

69 SOUTHERN AFRICAN DEVELOPMENT COMMUNITY (SADC) Doing Business 2014
TRADING ACROSS BORDERS
Documents to import (number)

70 SOUTHERN AFRICAN DEVELOPMENT COMMUNITY (SADC) Doing Business 2014
TRADING ACROSS BORDERS
Time to import (days)

71 SOUTHERN AFRICAN DEVELOPMENT COMMUNITY (SADC) Doing Business 2014
TRADING ACROSS BORDERS
Cost to import (US$ per container)
Source: Doing Business database.

72 SOUTHERN AFRICAN DEVELOPMENT COMMUNITY (SADC) Doing Business 2014
TRADING ACROSS BORDERS
What are the changes over time?
In economies around the world, trading across borders as measured by Doing Business has become faster and easier over the years. Governments have introduced tools to facilitate trade—including single windows, risk-based inspections and electronic data interchange
systems. These changes help improve their trading environment and boost firms’ international competitiveness. What trade reforms has Doing Business recorded in Southern African Development Community (SADC) (table 9.1)?
Table 9.1 How have economies in Southern African Development Community (SADC) made trading across borders easier—or not? By Doing Business report year
DB year Economy Reform
DB2008 Madagascar Madagascar made trading across borders easier by implementing an EDI system, improving port infrastructure, and streamlining document requirements.
DB2008 Mauritius Mauritius eased trading across borders by implementing a new computerized risk management system for inspections.
DB2009 Botswana
Botswana sped up customs clearance on its border with South Africa and trained its customs officers in the use of the EDI system, resulting in quicker processing of trade documents.
DB2009 Madagascar Implementation of EDI, a single window, risk-based inspections, and improvement of port infrastructure led to a decrease in export and import time.
DB2010 Angola Angola sped the process of trading across borders with a customs improvement program that streamlined procedures and decreased the time and cost of trade.
DB2010 Congo, Dem. Rep.
In Congo Dem. Rep., the participation of private companies in the terminal handling process at the port of Matadi has improved the quality of service reducing the needed time to handle cargos.
DB2010 Malawi The implementation of a risk-based inspection regime and a post-destination clearance program for pre-approved traders has reduced the delays for clearing goods in Malawi.

73 SOUTHERN AFRICAN DEVELOPMENT COMMUNITY (SADC) Doing Business 2014
DB year Economy Reform
DB2010 Mauritius Mauritius introduced the electronic submission of the customs declaration and bill of lading without requirement of physical copies, thus speeding up trade process.
DB2010 Mozambique Administrative improvements at customs has helped reduced the time required to clear goods traded in Mozambique.
DB2011 Angola Angola reduced the time for trading across borders by making investments in port infrastructure and administration.
DB2011 Madagascar
Madagascar improved communication and coordination between customs and the terminal port operators through its single-window system (GASYNET), reducing both the time and the cost to export and import.
DB2011 Swaziland Swaziland reduced the import time of trading across borders by implementing an electronic data interchange system for customs at its border posts.
DB2011 Zambia
Zambia eased trade by implementing a one-stop border post with Zimbabwe, launching web-based submission of customs declarations and introducing scanning machines at border posts.
DB2012 Seychelles The Seychelles made trading across borders faster by introducing electronic submission of customs documents.
DB2012 Tanzania Tanzania made trading across borders faster by implementing the Pre-Arrival Declaration (PAD) system and electronic submission of customs declaration.
DB2013 Botswana
In Botswana exporting and importing became faster thanks to the introduction of a scanner by the country’s customs authority and an upgrade of South Africa’s customs declaration system, both at the Kopfontein–Tlokweng border post.
DB2013 Malawi Trading across borders in Malawi became easier thanks to improvements in customs clearance procedures and transport links between the port of Beira in Mozambique and Blantyre.
DB2013 South Africa South Africa reduced the time and documents required to

74 SOUTHERN AFRICAN DEVELOPMENT COMMUNITY (SADC) Doing Business 2014
DB year Economy Reform
export and import through its ongoing customs modernization program.
DB2013 Tanzania Tanzania made importing more difficult by introducing a requirement to obtain a certificate of conformity before the imported goods are shipped.
DB2014 Angola Angola increased documentation requirements for cross-border trade by introducing a mandatory registration for all traders and a new license for export and import transactions.
DB2014 Madagascar Madagascar made trading across borders easier by rolling out an online platform linking trade operators with government agencies involved in the trade process and customs clearance.
DB2014 Mozambique Mozambique made trading across borders easier by implementing an electronic single-window system.
DB2014 Swaziland Swaziland made trading across borders easier by streamlining the process for obtaining a certificate of origin.
Note: For information on reforms in earlier years (back to DB2005), see the Doing Business reports for these years, available at http://www.doingbusiness.org. Source: Doing Business database.

75 SOUTHERN AFRICAN DEVELOPMENT COMMUNITY (SADC) Doing Business 2014
ENFORCING CONTRACTS
Effective commercial dispute resolution has many benefits. Courts are essential for entrepreneurs because they interpret the rules of the market and protect economic rights. Efficient and transparent courts encourage new business relationships because businesses know they can rely on the courts if a new customer fails to pay. Speedy trials are essential for small enterprises, which may lack the resources to stay in business while awaiting the outcome of a long court dispute.
What do the indicators cover?
Doing Business measures the efficiency of the judicial system in resolving a commercial dispute before local courts. Following the step-by-step evolution of a standardized case study, it collects data relating to the time, cost and procedural complexity of resolving a commercial lawsuit. The ranking on the ease of enforcing contracts is the simple average of the percentile rankings on its component indicators: procedures, time and cost.
The dispute in the case study involves the breach of a sales contract between 2 domestic businesses. The case study assumes that the court hears an expert on the quality of the goods in dispute. This distinguishes the case from simple debt enforcement. To make the data comparable across economies, Doing Business uses several assumptions about the case:
• The seller and buyer are located in the economy’s largest business city.
• The buyer orders custom-made goods, then fails to pay.
• The seller sues the buyer before a competent court.
• The value of the claim is 200% of income per capita.
• The seller requests a pretrial attachment to secure the claim.
WHAT THE ENFORCING CONTRACTS
INDICATORS MEASURE
Procedures to enforce a contract through the courts (number)
Steps to file and serve the case
Steps for trial and judgment
Steps to enforce the judgment
Time required to complete procedures (calendar days)
Time to file and serve the case
Time for trial and obtaining judgment
Time to enforce the judgment
Cost required to complete procedures (% of claim)
Average attorney fees
Court costs
Enforcement costs
• The dispute on the quality of the goods
requires an expert opinion.
• The judge decides in favor of the seller; there is no appeal.
• The seller enforces the judgment through a public sale of the buyer’s movable assets.
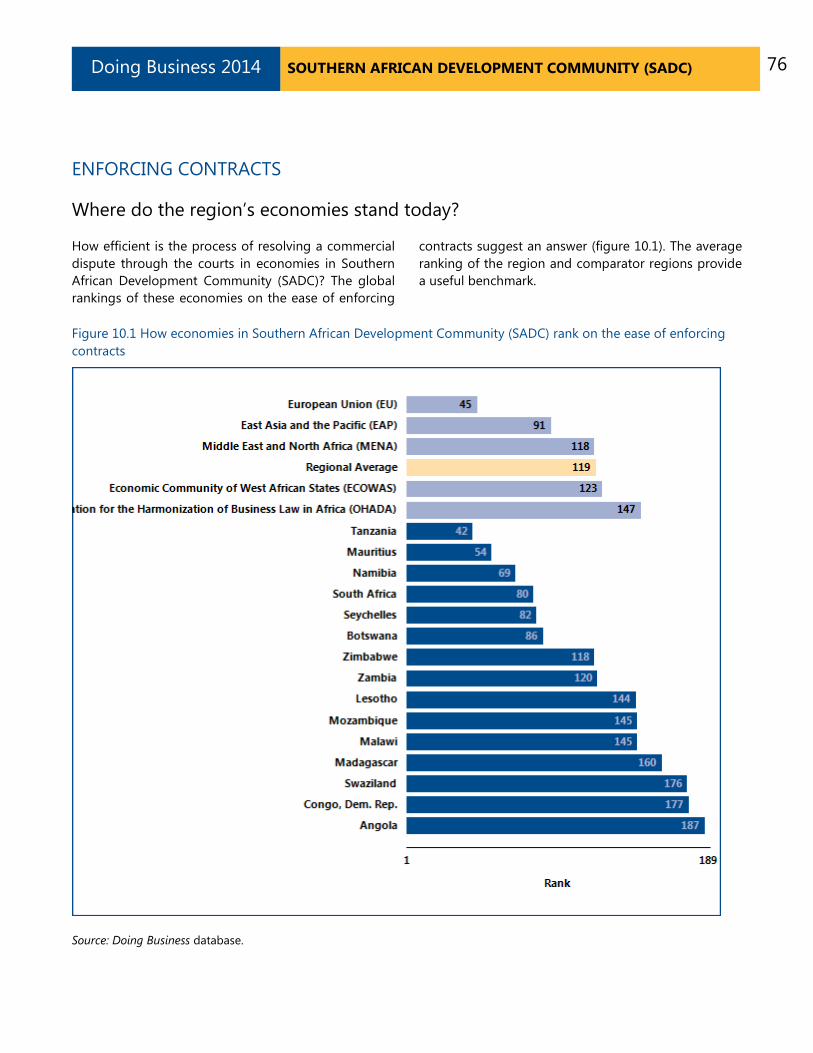
76 SOUTHERN AFRICAN DEVELOPMENT COMMUNITY (SADC) Doing Business 2014
ENFORCING CONTRACTS
Where do the region’s economies stand today?
How efficient is the process of resolving a commercial dispute through the courts in economies in Southern African Development Community (SADC)? The global rankings of these economies on the ease of enforcing
contracts suggest an answer (figure 10.1). The average ranking of the region and comparator regions provide a useful benchmark.
Figure 10.1 How economies in Southern African Development Community (SADC) rank on the ease of enforcing contracts
Source: Doing Business database.

77 SOUTHERN AFRICAN DEVELOPMENT COMMUNITY (SADC) Doing Business 2014
ENFORCING CONTRACTS
The indicators underlying the rankings may also be revealing. Data collected by Doing Business show what it takes to enforce a contract through the courts in each economy in the region: the number of
procedures, the time and the cost (figure 10.2). Comparing these indicators across the region and with averages both for the region and for comparator regions can provide useful insights.
Figure 10.2 What it takes to enforce a contract through the courts in economies in Southern African Development Community (SADC)
Procedures (number)

78 SOUTHERN AFRICAN DEVELOPMENT COMMUNITY (SADC) Doing Business 2014
ENFORCING CONTRACTS
Time (days)
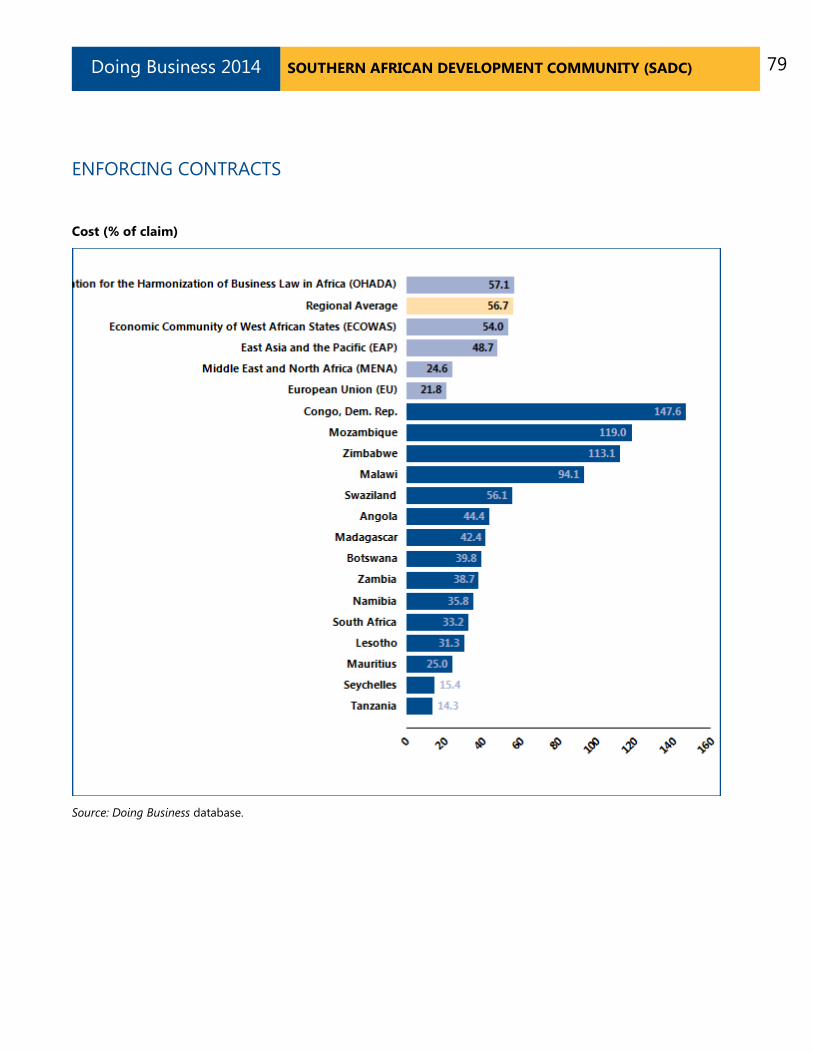
79 SOUTHERN AFRICAN DEVELOPMENT COMMUNITY (SADC) Doing Business 2014
ENFORCING CONTRACTS
Cost (% of claim)
Source: Doing Business database.

80 SOUTHERN AFRICAN DEVELOPMENT COMMUNITY (SADC) Doing Business 2014
ENFORCING CONTRACTS
What are the changes over time?
Economies in all regions have improved contract enforcement in recent years. A judiciary can be improved in different ways. Higher-income economies tend to look for ways to enhance efficiency by introducing new technology. Lower-income economies often work on reducing backlogs by introducing
periodic reviews to clear inactive cases from the docket and by making procedures faster. What reforms making it easier (or more difficult) to enforce contracts has Doing Business recorded in Southern African Development Community (SADC) (table 10.1)?
Table 10.1 How have economies in Southern African Development Community (SADC) made enforcing contracts easier—or not? By Doing Business report year
DB year Economy Reform
DB2008 Congo, Dem. Rep. In the Democratic Republic of Congo, the operation of the commercial court made commercial dispute resolution more efficient.
DB2008 Malawi Malawi has made enforcing contracts easier by opening a commercial court and hiring new judges.
DB2008 Mozambique Mozambique improved commercial dispute resolution in Maputo by hiring more specialised judges and reducing the time limits in enforcement procedures.
DB2009 Mozambique
In Mozambique more than 20 judges were added to the judiciary, all of them receiving formal training. Court administrators were introduced, alleviating the administrative burdens on the judges. At the same time the country introduced performance measurement for judges.
DB2010 Botswana The introduction of case management and improved use of information technology has contributed to more efficient resolution of commercial disputes in Botswana.
DB2010 Mauritius Mauritius set up a specialized commercial division of its Supreme Court, thus improving contract enforcement.
DB2011 Malawi Malawi simplified the enforcement of contracts by raising the ceiling for commercial claims that can be brought to the magistrates court.
DB2011 Mauritius Mauritius speeded up the resolution of commercial disputes by recruiting more judges and adding more courtrooms.
DB2011 Zambia Zambia improved contract enforcement by introducing an electronic case management system in the courts that provides electronic referencing of cases, a database of laws,

81 SOUTHERN AFRICAN DEVELOPMENT COMMUNITY (SADC) Doing Business 2014
DB year Economy Reform
real-time court reporting and public access to court records.
DB2012 Lesotho Lesotho made enforcing contracts easier by launching a specialized commercial court.
DB2012 Seychelles The Seychelles expanded the jurisdiction of the lower court, increasing the time required to enforce contracts.
DB2014 Mauritius Mauritius made enforcing contracts easier by liberalizing the profession of ushers, providing competitive options for litigants to enforce binding decisions.
Note: For information on reforms in earlier years (back to DB2005), see the Doing Business reports for these years, available at http://www.doingbusiness.org. Source: Doing Business database.

82 SOUTHERN AFRICAN DEVELOPMENT COMMUNITY (SADC) Doing Business 2014
RESOLVING INSOLVENCY
A robust bankruptcy system functions as a filter, ensuring the survival of economically efficient companies and reallocating the resources of inefficient ones. Fast and cheap insolvency proceedings result in the speedy return of businesses to normal operation and increase returns to creditors. By improving the expectations of creditors and debtors about the outcome of insolvency proceedings, well-functioning insolvency systems can facilitate access to finance, save more viable businesses and thereby improve growth and sustainability in the economy overall.
What do the indicators cover?
Doing Business studies the time, cost and outcome of insolvency proceedings involving domestic entities. It does not measure insolvency proceedings of individuals and financial institutions. The data are derived from survey responses by local insolvency practitioners and verified through a study of laws and regulations as well as public information on bankruptcy systems.
The ranking on the ease of resolving insolvency is based on the recovery rate, which is recorded as cents on the dollar recouped by creditors through reorganization, liquidation or debt enforcement (foreclosure) proceedings. The recovery rate is a function of time, cost and other factors, such as lending rate and the likelihood of the company continuing to operate.
To make the data comparable across economies, Doing Business uses several assumptions about the business and the case. It assumes that the company:
• Is a domestically owned, limited liability company operating a hotel.
• Operates in the economy’s largest business city.
• Has 201 employees, 1 main secured creditor and 50 unsecured creditors.
WHAT THE RESOLVING INSOLVENCY
INDICATORS MEASURE
Time required to recover debt (years)
Measured in calendar years
Appeals and requests for extension are included
Cost required to recover debt (% of debtor’s estate)
Measured as percentage of estate value
Court fees
Fees of insolvency administrators
Lawyers’ fees
Assessors’ and auctioneers’ fees
Other related fees
Outcome Whether business continues operating as a going concern or business assets are sold piecemeal
Recovery rate for creditors (cents on the dollar)
Measures the cents on the dollar recovered by creditors
Present value of debt recovered
Official costs of the insolvency proceedings are deducted
Depreciation of furniture is taken into account
Outcome for the business (survival or not) affects the maximum value that can be recovered
• Has a higher value as a going concern—and that the efficient outcome is either reorganization or sale as a going concern, not piecemeal liquidation.

83 SOUTHERN AFRICAN DEVELOPMENT COMMUNITY (SADC) Doing Business 2014
RESOLVING INSOLVENCY
Where do the region’s economies stand today?
How efficient are insolvency proceedings in economies in Southern African Development Community (SADC)? The global rankings of these economies on the ease of resolving insolvency suggest an answer (figure 11.1). The average ranking of the region and comparator
regions provide a useful benchmark for assessing the efficiency of insolvency proceedings. Speed, low costs and continuation of viable businesses characterize the top-performing economies.
Figure 11.1 How economies in Southern African Development Community (SADC) rank on the ease of resolving insolvency
Source: Doing Business database.

84 SOUTHERN AFRICAN DEVELOPMENT COMMUNITY (SADC) Doing Business 2014
RESOLVING INSOLVENCY
The indicators underlying the rankings may be more revealing. Data collected by Doing Business show the average time and cost required to resolve insolvency as well as the average recovery rate (figure 11.2).
Comparing these indicators across the region and with averages both for the region and for comparator regions can provide useful insights.
Figure 11.2 How efficient is the insolvency process in economies in Southern African Development Community (SADC)
Time (years)

85 SOUTHERN AFRICAN DEVELOPMENT COMMUNITY (SADC) Doing Business 2014
RESOLVING INSOLVENCY
Cost (% of estate)

86 SOUTHERN AFRICAN DEVELOPMENT COMMUNITY (SADC) Doing Business 2014
RESOLVING INSOLVENCY
Recovery rate (cents on the dollar)
* Indicates a “no practice” mark. See the data notes for details. Source: Doing Business database.

87 SOUTHERN AFRICAN DEVELOPMENT COMMUNITY (SADC) Doing Business 2014
RESOLVING INSOLVENCY
What are the changes over time?
A well-balanced bankruptcy system distinguishes companies that are financially distressed but economically viable from inefficient companies that should be liquidated. But in some insolvency systems even viable businesses are liquidated. This is starting to
change. Many recent reforms of bankruptcy laws have been aimed at helping more of the viable businesses survive. What insolvency reforms has Doing Business recorded in Southern African Development Community (SADC) (table 11.1)?
Table 11.1 How have economies in Southern African Development Community (SADC) made resolving insolvency easier—or not? By Doing Business report year
DB year Economy Reform
DB2008 Botswana
Botswana amended its Employment Act to increase the priority ranking of employee benefits to preferred status. Botswana also amended the Insolvency Act to criminalize false statements by the insolvent company which may affect a prospective buyer’s decision whether or not to purchase the company as a going concern.
DB2008 Mauritius Mauritius adopted legislation that made the process of sale of immovable property after default on a credit agreement more efficient and less susceptible to abuse by creditors.
DB2010 Malawi Malawi introduced a new law limiting the liquidator's fees during insolvency procedures.
DB2010 Mauritius
A new insolvency law in Mauritius introduces a rehabilitation procedure for companies as an alternative to winding up, and defines the rights and obligations of creditors and debtors and sanctions for those who abuse the system.
DB2012 Malawi Malawi adopted new rules providing clear procedural requirements and time frames for winding up a company.
DB2012 Namibia Namibia adopted a new company law that established clear procedures for liquidation.
DB2012 South Africa South Africa introduced a new reorganization process to facilitate the rehabilitation of financially distressed companies.
DB2013 Zambia
Zambia strengthened its insolvency process by introducing further qualification requirements for receivers and liquidators and by establishing specific duties and remuneration rules for them.
DB2014 Congo, Dem. Rep. The Democratic Republic of Congo made resolving insolvency easier by adopting the OHADA Uniform Act Organizing Collective Proceedings for Wiping Off Debts. The law allows

88 SOUTHERN AFRICAN DEVELOPMENT COMMUNITY (SADC) Doing Business 2014
DB year Economy Reform
an insolvent debtor to file for preventive settlement, legal redress or liquidation
DB2014 Mauritius
Mauritius made resolving insolvency easier by introducing guidelines for out-of-court restructuring and standardizing the process of registration, suspension and removal of insolvency practitioners.
DB2014 Tanzania
Tanzania made resolving insolvency easier through new rules clearly specifying the professional requirements and remuneration for insolvency practitioners, promoting reorganization proceedings and streamlining insolvency proceedings.
Note: For information on reforms in earlier years (back to DB2005), see the Doing Business reports for these years, available at http://www.doingbusiness.org. Source: Doing Business database.

89 SOUTHERN AFRICAN DEVELOPMENT COMMUNITY (SADC) Doing Business 2014
DATA NOTES
The indicators presented and analyzed in Doing Business measure business regulation and the protection of property rights—and their effect on businesses, especially small and medium-size domestic firms. First, the indicators document the complexity of regulation, such as the number of procedures to start a business or to register and transfer commercial property. Second, they gauge the time and cost to achieve a regulatory goal or comply with regulation, such as the time and cost to enforce a contract, go through bankruptcy or trade across borders. Third, they measure the extent of legal protections of property, for example, the protections of investors against looting by company directors or the range of assets that can be used as collateral according to secured transactions laws. Fourth, a set of indicators documents the tax burden on businesses. Finally, a set of data covers different aspects of employment regulation. The 11 sets of indicators measured in Doing Business were added over time, and the sample of economies expanded.
The data for all sets of indicators in Doing Business 2014 are for June 2013.2
Methodology The Doing Business data are collected in a standardized way. To start, the Doing Business team, with academic advisers, designs a questionnaire. The questionnaire uses a simple business case to ensure comparability across economies and over time—with assumptions about the legal form of the business, its size, its location and the nature of its operations. Questionnaires are administered to more than 10,200 local experts, including lawyers, business consultants, accountants, freight forwarders, government officials and other professionals routinely administering or advising on legal and regulatory requirements (table 21.2). These experts have several rounds of interaction with the Doing Business team, involving conference calls, written correspondence and visits by the team. For Doing Business 2014 team members visited 33 economies to verify data and recruit respondents. The data from questionnaires are subjected to numerous
2 The data for paying taxes refer to January – December 2012.
rounds of verification, leading to revisions or expansions of the information collected.
The Doing Business methodology offers several advantages. It is transparent, using factual information
ECONOMY CHARACTERISTICS
Gross national income per capita
Doing Business 2014 reports 2012 income per capita as published in the World Bank’s World Development Indicators 2013. Income is calculated using the Atlas method (current U.S. dollars). For cost indicators expressed as a percentage of income per capita, 2012 gross national income (GNI) in U.S. dollars is used as the denominator. GNI data were not available from the World Bank for Afghanistan, The Bahamas, Bahrain, Barbados, Brunei Darussalam, Djibouti, the Islamic Republic of Iran, Kuwait, Libya, Myanmar, New Zealand, Oman, San Marino, the Syrian Arab Republic, West Bank and Gaza, and the Republic of Yemen. In these cases GDP or GNP per capita data and growth rates from other sources, such as the International Monetary Fund’s World Economic Outlook database and the Economist Intelligence Unit, were used.
Region and income group
Doing Business uses the World Bank regional and income group classifications, available at http://data.worldbank.org/about/country-classifications. The World Bank does not assign regional classifications to high-income economies. For the purpose of the Doing Business report, high-income OECD economies are assigned the “regional” classification OECD high income. Figures and tables presenting regional averages include economies from all income groups (low, lower middle, upper middle and high income).
Population
Doing Business 2014 reports midyear 2012 population statistics as published in World Development Indicators 2013.

90 SOUTHERN AFRICAN DEVELOPMENT COMMUNITY (SADC) Doing Business 2014
about what laws and regulations say and allowing multiple interactions with local respondents to clarify potential misinterpretations of questions. Having representative samples of respondents is not an issue; Doing Business is not a statistical survey, and the texts of the relevant laws and regulations are collected and answers checked for accuracy. The methodology is inexpensive and easily replicable, so data can be collected in a large sample of economies. Because standard assumptions are used in the data collection, comparisons and benchmarks are valid across economies. Finally, the data not only highlight the extent of specific regulatory obstacles to business but also identify their source and point to what might be reformed. Information on the methodology for each Doing Business topic can be found on the Doing Business website at http://www.doingbusiness.org/methodology.
Limits to what is measured The Doing Business methodology has 5 limitations that should be considered when interpreting the data. First, the collected data refer to businesses in the economy’s largest business city (which in some economies differs from the capital) and may not be representative of regulation in other parts of the economy. To address this limitation, subnational Doing Business indicators were created (box 21.1). Second, the data often focus on a specific business form—generally a limited liability company (or its legal equivalent) of a specified size—and may not be representative of the regulation on other businesses, for example, sole proprietorships. Third, transactions described in a standardized case scenario refer to a specific set of issues and may not represent the full set of issues a business encounters. Fourth, the measures of time involve an element of judgment by the expert respondents. When sources indicate different estimates, the time indicators reported in Doing Business represent the median values of several responses given under the assumptions of the standardized case.
Finally, the methodology assumes that a business has full information on what is required and does not waste time when completing procedures. In practice, completing a procedure may take longer if the business lacks information or is unable to follow up promptly. Alternatively, the business may choose to disregard some burdensome procedures. For both
reasons the time delays reported in Doing Business 2014 would differ from the recollection of entrepreneurs reported in the World Bank Enterprise Surveys or other perception surveys.
This year Doing Business completed subnational studies in Colombia, Italy and the city of Hargeisa (Somaliland) and is currently updating indicators in Egypt, Mexico and Nigeria. Doing Business also published regional studies for the g7+ and the East African Community. The g7+ group is a country-owned and country-led global mechanism established in April 2010 to monitor, report and draw attention to the unique challenges faced by fragile states. The member countries included in the report are Afghanistan, Burundi, the Central African Republic, Chad, the Comoros, the Democratic Republic of Congo, Côte d’Ivoire, Guinea, Guinea-Bissau, Haiti, Liberia, Papua New Guinea, Sierra Leone, the Solomon Islands, South Sudan, Timor-Leste and Togo.
The subnational studies point to differences in business regulation and its implementation—as well as in the pace of regulatory reform—across cities in the same economy. For several economies subnational studies are now periodically updated to measure change over time or to expand geographic coverage to additional cities. This year that is the case for all the subnational studies published.
Changes in what is measured The methodology for 2 indicator sets—trading across borders and paying taxes—was updated this year. For trading across borders, documents that are required purely for purposes of preferential treatment are no longer included in the list of documents (for example, a certificate of origin if the use is only to qualify for a preferential tariff rate under trade agreements). For paying taxes, the value of fuel taxes is no longer included in the total tax rate because of the difficulty of computing these taxes in a consistent way across all economies covered. The fuel tax amounts are in most cases very small, and measuring these amounts is often complicated because they depend on fuel consumption. Fuel taxes continue to be counted in the number of payments.
In a change involving several indicator sets, the rule establishing that each procedure must take at least 1 day was removed for procedures that can be fully
91 SOUTHERN AFRICAN DEVELOPMENT COMMUNITY (SADC) Doing Business 2014
completed online in just a few hours. This change affects the time indicator for starting a business, dealing with construction permits and registering property.3 For procedures that can be fully completed online, the duration is now set at half a day rather than a full day.
The threshold for the total tax rate introduced in 2011 for the purpose of calculating the ranking on the ease of paying taxes was updated. All economies with a total tax rate below the threshold (which is calculated and adjusted on a yearly basis) receive the same ranking on the total tax rate indicator. The threshold is not based on any economic theory of an “optimal tax rate” that minimizes distortions or maximizes efficiency in the tax system of an economy overall. Instead, it is mainly empirical in nature, set at the lower end of the distribution of tax rates levied on medium-size enterprises in the manufacturing sector as observed through the paying taxes indicators. This reduces the bias in the indicators toward economies that do not need to levy significant taxes on companies like the Doing Business standardized case study company because they raise public revenue in other ways—for example, through taxes on foreign companies, through taxes on sectors other than manufacturing or from natural resources (all of which are outside the scope of the methodology). This year the threshold is 25,5%.
Data challenges and revisions Most laws and regulations underlying the Doing Business data are available on the Doing Business website at http://www.doingbusiness.org. All the sample questionnaires and the details underlying the indicators are also published on the website. Questions on the methodology and challenges to data can be submitted through the website’s “Ask a Question” function at http://www.doingbusiness.org.
Ease of doing business and distance to frontier Doing Business 2014 presents results for 2 aggregate measures: the aggregate ranking on the ease of doing 3 For getting electricity the rule that each procedure must take a minimum of 1 day still applies because in practice there are no cases in which procedures can be fully completed online in less than a day. For example, even though in some cases it is possible to apply for an electricity connection online, additional requirements mean that the process cannot be completed in less than 1 day.
business and the distance to frontier measure. The ease of doing business ranking compares economies with one another, while the distance to frontier measure benchmarks economies to the frontier in regulatory practice, measuring the absolute distance to the best performance on each indicator. Both measures can be used for comparisons over time. When compared across years, the distance to frontier measure shows how much the regulatory environment for local entrepreneurs in each economy has changed over time in absolute terms, while the ease of doing business ranking can show only relative change.
Ease of doing business
The ease of doing business index ranks economies from 1 to 189. For each economy the ranking is calculated as the simple average of the percentile rankings on each of the 10 topics included in the index in Doing Business 2014: starting a business, dealing with construction permits, getting electricity, registering property, getting credit, protecting investors, paying taxes, trading across borders, enforcing contracts, and resolving insolvency. The employing workers indicators are not included in this year’s aggregate ease of doing business ranking.
Construction of the ease of doing business index
Here is one example of how the ease of doing business index is constructed. In Denmark it takes 4 procedures, 5.5 days and 0.2% of annual income per capita in fees to open a business. The minimum capital requirement is 24% of annual income per capita. On these 4 indicators Denmark ranks in the 12th, 11th, 1st and 79th percentiles. So on average Denmark ranks in the 25th percentile on the ease of starting a business. It ranks in the 21st percentile on getting credit, 19th percentile on paying taxes, 27th percentile on enforcing contracts, 5th percentile on resolving insolvency and so on. Higher rankings indicate simpler regulation and stronger protection of property rights. The simple average of Denmark’s percentile rankings on all topics is 17th. When all economies are ordered by their average percentile rankings, Denmark stands at 5 in the aggregate ranking on the ease of doing business.
More complex aggregation methods—such as principal components and unobserved components—yield a ranking nearly identical to the simple average

92 SOUTHERN AFRICAN DEVELOPMENT COMMUNITY (SADC) Doing Business 2014
used by Doing Business.4 Thus, Doing Business uses the simplest method: weighting all topics equally and, within each topic, giving equal weight to each of the topic components.
If an economy has no laws or regulations covering a specific area—for example, insolvency—it receives a “no practice” mark. Similarly, an economy receives a “no practice” or “not possible” mark if regulation exists but is never used in practice or if a competing regulation prohibits such practice. Either way, a “no practice” mark puts the economy at the bottom of the ranking on the relevant indicator.
The ease of doing business index is limited in scope. It does not account for an economy’s proximity to large markets, the quality of its infrastructure services (other than services related to trading across borders and getting electricity), the strength of its financial system, the security of property from theft and looting, macroeconomic conditions or the strength of underlying institutions.
Variability of economies’ rankings across topics
Each indicator set measures a different aspect of the business regulatory environment. The rankings of an economy can vary, sometimes significantly, across indicator sets. The average correlation coefficient between the 10 indicator sets included in the aggregate ranking is 0.38, and the coefficients between any 2 sets of indicators range from 0.18 (between getting electricity and getting credit) to 0.58 (between trading across borders and resolving insolvency and between trading across borders and getting electricity). These correlations suggest that economies rarely score universally well or universally badly on the indicators.
Consider the example of Canada. It stands at 19 in the aggregate ranking on the ease of doing business. Its ranking is 2 on starting a business, 4 on protecting investors, and 8 on paying taxes. But its ranking is only 4 See Simeon Djankov, Darshini Manraj, Caralee McLiesh and Rita Ramalho, “Doing Business Indicators: Why Aggregate, and How to Do It” (World Bank, Washington, DC, 2005). Principal components and unobserved components methods yield a ranking nearly identical to that from the simple average method because both these methods assign roughly equal weights to the topics, since the pairwise correlations among indicators do not differ much. An alternative to the simple average method is to give different weights to the topics, depending on which are considered of more or less importance in the context of a specific economy.
58 on enforcing contracts, 116 on dealing with construction permits and 145 on getting electricity.
Variation in performance across the indicator sets is not at all unusual. It reflects differences in the degree of priority that government authorities give to particular areas of business regulation reform and the ability of different government agencies to deliver tangible results in their area of responsibility.
Distance to frontier measure
A drawback of the ease of doing business ranking is that it can measure the regulatory performance of economies only relative to the performance of others. It does not provide information on how the absolute quality of the regulatory environment is improving over time. Nor does it provide information on how large the gaps are between economies at a single point in time.
The distance to frontier measure is designed to address both shortcomings, complementing the ease of doing business ranking. This measure illustrates the distance of an economy to the “frontier,” and the change in the measure over time shows the extent to which the economy has closed this gap. The frontier is a score derived from the most efficient practice or highest score achieved on each of the component indicators in 10 Doing Business indicator sets (excluding the employing workers indicators) by any economy. In starting a business, for example, Canada and New Zealand have achieved the highest performance on the number of procedures required (1) and on the time (0.5 days), Denmark and Slovenia on the cost (0% of income per capita) and Chile, Zambia and 99 other economies on the paid-in minimum capital requirement (0% of income per capita) (table 22.2).
Calculating the distance to frontier for each economy involves 2 main steps. First, individual indicator scores are normalized to a common unit: except for the total tax rate, each of the 31 component indicators y is rescaled to (max − y)/(max − min), with the minimum value (min) representing the frontier—the highest performance on that indicator across all economies since 2003 or the first year the indicator was collected.5 For the total tax rate, consistent with the calculation of
5 Even though scores for the distance to frontier are calculated from 2005, data from as early as 2003 are used to define the frontier

93 SOUTHERN AFRICAN DEVELOPMENT COMMUNITY (SADC) Doing Business 2014
the rankings, the frontier is defined as the total tax rate at the 15th percentile of the overall distribution of total tax rates for all years. Second, for each economy the scores obtained for individual indicators are aggregated through simple averaging into one distance to frontier score, first for each topic and then across all topics. An economy’s distance to frontier is indicated on a scale from 0 to 100, where 0 represents the lowest performance and 100 the frontier.
The maximum (max) and minimum (min) observed values are computed for all economies included in the Doing Business sample since 2003 and for all years (from 2003 to 2013). To mitigate the effects of extreme outliers in the distributions of the rescaled data (very few economies need 694 days to complete the procedures to start a business, but many need 9 days), the maximum (max) is defined as the 95th percentile of the pooled data for all economies and all years for each indicator. The exceptions are the getting credit, protecting investors and resolving insolvency indicators, whose construction precludes outliers. In addition, the cost to export and cost to import for each year are divided by the GDP deflator, so as to take the general price level into account when benchmarking these absolute-cost indicators across economies with different inflation trends. The base year for the deflator is 2013 for all economies.
The difference between an economy’s distance to frontier score in any previous year and its score in 2013 illustrates the extent to which the economy has closed the gap to the frontier over time. And in any given year the score measures how far an economy is from the highest performance at that time.
Take Colombia, which has a score of 70.5 on the distance to frontier measure for 2014. This score indicates that the economy is 29.5 percentage points away from the frontier constructed from the best performances across all economies and all years. Colombia was further from the frontier in 2009, with a score of 66.2. The difference between the scores shows an improvement over time.
The distance to frontier measure can also be used for comparisons across economies in the same year, complementing the ease of doing business ranking. For example, Colombia stands at 63 this year in the ease of doing business ranking, while Peru, which is 29.3 percentage points from the frontier, stands at 42.
Economies that improved the most across 3 or more Doing Business topics in 2012/13
Doing Business 2014 uses a simple method to calculate which economies improved the most in the ease of doing business. First, it selects the economies that in 2012/13 implemented regulatory reforms making it easier to do business in 3 or more of the 10 topics included in this year’s ease of doing business ranking.6 Twenty-nine economies meet this criterion: Azerbaijan, Belarus, Burundi, Côte d’Ivoire, Croatia, Djibouti, Gabon, Guatemala, Guinea, Italy, Kosovo, Latvia, the former Yugoslav Republic of Macedonia, Malaysia, Mauritius, Mexico, Moldova, Mongolia, Morocco, Panama, the Philippines, the Republic of Congo, Romania, the Russian Federation, Rwanda, Sri Lanka, Ukraine, Uzbekistan and the United Arab Emirates. Second, Doing Business sorts these economies on the increase in their distance to frontier measure from the previous year using comparable data.
Selecting the economies that implemented regulatory reforms in at least 3 topics and improved the most in the distance to frontier measure is intended to highlight economies with ongoing, broadbased reform programs. The criterion for identifying the top improvers was changed from last year. The improvement in ease of doing business ranking is no longer used. The improvement in the distance to frontier measure is used instead because under this measure economies are sorted according to their abs-olute improvement instead of relative improvement.
6 Doing Business reforms making it more difficult to do business are subtracted from the total number of those making it easier to do business.

RESOURCES ON THE DOING BUSINESS WEBSITE
Current features News on the Doing Business project http://www.doingbusiness.org Rankings How economies rank—from 1 to 189 http://www.doingbusiness.org/rankings/ Data All the data for 189 economies—topic rankings, indicator values, lists of regulatory procedures and details underlying indicators http://www.doingbusiness.org/data/ Reports Access to Doing Business reports as well as subnational and regional reports, reform case studies and customized economy and regional profiles http://www.doingbusiness.org/reports/ Methodology The methodologies and research papers underlying Doing Business http://www.doingbusiness.org/methodology/ Research Abstracts of papers on Doing Business topics and related policy issues http://www.doingbusiness.org/research/
Business reforms Short summaries of DB2014 business reforms, lists of reforms since DB2008 and a ranking simulation tool http://www.doingbusiness.org/reforms/ Historical data Customized data sets since DB2004 http://www.doingbusiness.org/custom-query/ Law library Online collection of business laws and regulations relating to business and gender issues http://www.doingbusiness.org/law-library/ http://wbl.worldbank.org/ Contributors More than 10,200 specialists in 189 economies who participate in Doing Business http://www.doingbusiness.org/contributors/doing-business/ Entrepreneurship data Data on business density for 139 economies http://www.doingbusiness.org/data/exploretopics/entrepreneurship/ Doing Business iPhone App Doing Business at a Glance App presents the full report, rankings and highlights http://www.doingbusiness.org/specialfeatures/