Embed Size (px)
Citation preview
MENA ECONOMIC UPDATE
APRIL 2021
LIVING WITH DEBT How Institutions
Can Chart a Path to Recovery in the
Middle East and North Africa
W O R L D B A N K M I D D L E E A S T A N D N O R T H A F R I C A R E G I O N
LIVING WITH DEBT How Institutions Can Chart a Path to Recovery in the Middle East and North Africa
WORLD BANK MIDDLE EAST AND NORTH AFRICA REGION
MENA ECONOMIC UPDATE APRIL 2021
2021 International Bank for Reconstruction and Development The World Bank
1818 H Street NW Washington DC 20433
Telephone 202-473-1000 Internet wwwworldbankorg
Some rights reserved
1 2 3 4 24 23 22 21
This work is a product of the staff of The World Bank with external contributions The findings interpretations and conclusions expressed in this work do not necessarily reflect the views of The World Bank its Board of Executive Directors or the governments they represent The World Bank does not guarantee the accuracy of the data included in this work The boundaries colors denominations and other information shown on any map in this work do not imply any judgment on the part of The World Bank concerning the legal status of any territory or the endorsement or acceptance of such boundaries
Nothing herein shall constitute or be considered to be a limitation upon or waiver of the privileges and immunities of The World Bank all of which are specifically reserved
Rights and Permissions
This work is available under the Creative Commons Attribution 30 IGO license (CC BY 30 IGO) httpcreativecommonsorglicensesby30igo Under the Creative Commons Attribution license you are free to copy distribute transmit and adapt this work including for commercial purposes under the following conditions
AttributionmdashPlease cite the work as follows Gatti Roberta Lederman Daniel Nguyen Ha M Alturki Sultan Abdulaziz Fan Rachel Yuting Islam Asif M Rojas Claudio J 2021 ldquoLiving with Debt How Institutions Can Chart a Path to Recovery for the Middle East and North Africardquo Middle East and North Africa Economic Update (April) Washington DC World Bank Doi 101596978-1-4648-1699-4 License Creative Commons Attribution CC BY 30 IGO
TranslationsmdashIf you create a translation of this work please add the following disclaimer along with the attribution This translation was not created by The World Bank and should not be considered an official World Bank translation The World Bank shall not be liable for any content or error in this translation
AdaptationsmdashIf you create an adaptation of this work please add the following disclaimer along with the attribution This is an adaptation of an original work by The World Bank Views and opinions expressed in the adaptation are the sole responsibility of the author or authors of the adaptation and are not endorsed by The World Bank
Third-party contentmdashThe World Bank does not necessarily own each component of the content contained within the work The World Bank therefore does not warrant that the use of any third-party-owned individual component or part contained in the work will not infringe on the rights of those third parties The risk of claims resulting from such infringement rests solely with you If you wish to re-use a component of the work it is your responsibility to determine whether permission is needed for that re-use and to obtain permission from the copyright owner Examples of components can include but are not limited to tables figures or images
All queries on rights and licenses should be addressed to World Bank Publications The World Bank Group 1818 H Street NW Washington DC 20433 USA e-mail pubrightsworldbankorg
ISBN (electronic) 978-1-4648-1699-4
DOI 101596978-1-4648-1699-4
Cover photo credit Royalty-free Shutterstockcom Illustration ID 98788745 by Lightspring
Contents
Acknowledgements iv
Abbreviations v
Preface vi
Overview 2
CHAPTER I A Continuing Crisis 6
I1 The Ongoing Pandemic in MENA 6
I2 Economic Consequences of the Pandemic 9
Macroeconomic Impact 9
Poverty Distributional and Long-Term Impacts 12
Fiscal Balances and Public Debt 15
Chapter II How Institutions Can Chart a Path to Recovery for the Middle East and North Africa 21
II1 Tensions between Short-run Needs and Long-run Costs of Debt-financed Spending 21
The Short-run Needs 21
The Long-Run Costs 24
II2 The Role of Institutions in Shaping the Tradeoff 28
Prioritizing Spending during the Pandemic - Transparency and Surveillance 29
The Effectiveness of Public Investment Depends on Governance 30
Mitigating the Costs of Public Debt after the Pandemic with Transparency and Governance 32
II3 How Institutions Shape the Recovery 38
References 39
Appendix 46
Appendix A1 Debt and Output Growth After Natural Disasters 46
Appendix A2 Oil Shocks and MENArsquos Creditworthiness 48
Appendix A3 Debt and Output Growth Around Restructurings 50
Data Appendix 53
List of Tables
Chapter I A Continuing Crisis
Table I1 Covid-19 Cases and Tests per Million People in MENA Countries 7
Table I2 Covid-19 Vaccination Programs in MENA 8
Chapter II How Institutions Can Chart a Path to Recovery for the Middle East and North Africa
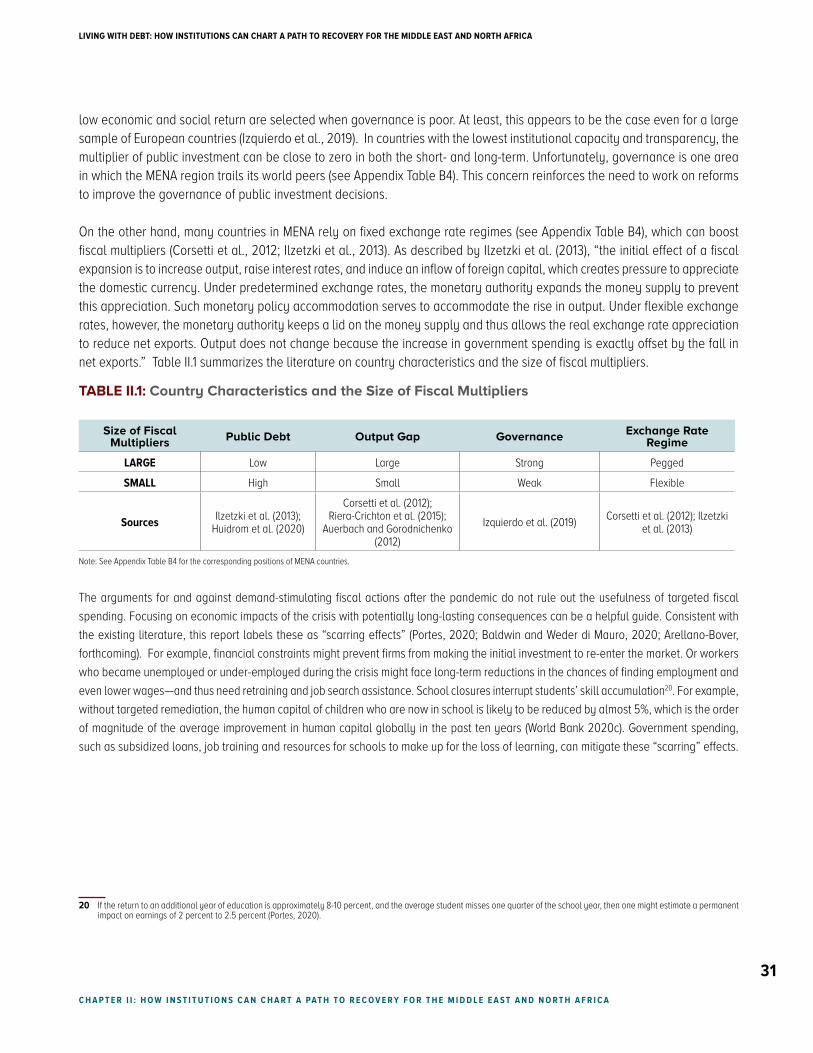
Table II1 Country Characteristics and the Size of Fiscal Multipliers 31
Appendix
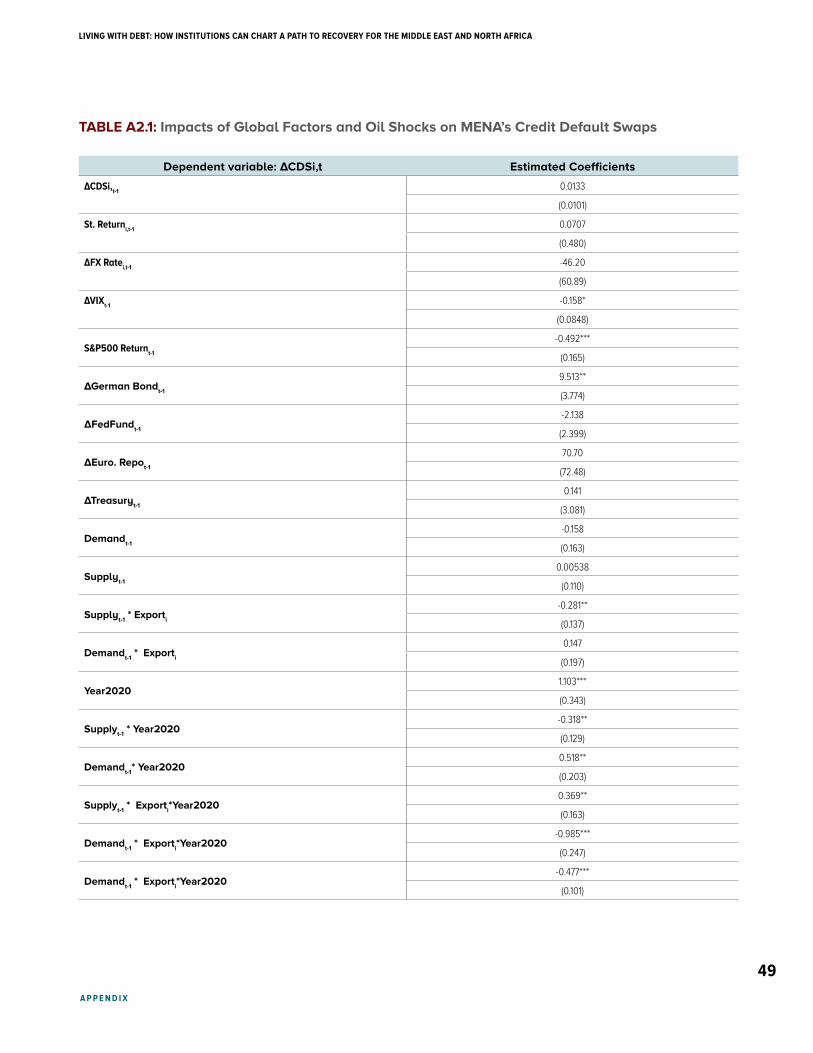
Table A21 Impacts of Global Factors and Oil Shocks on MENArsquos Credit Default Swaps 49
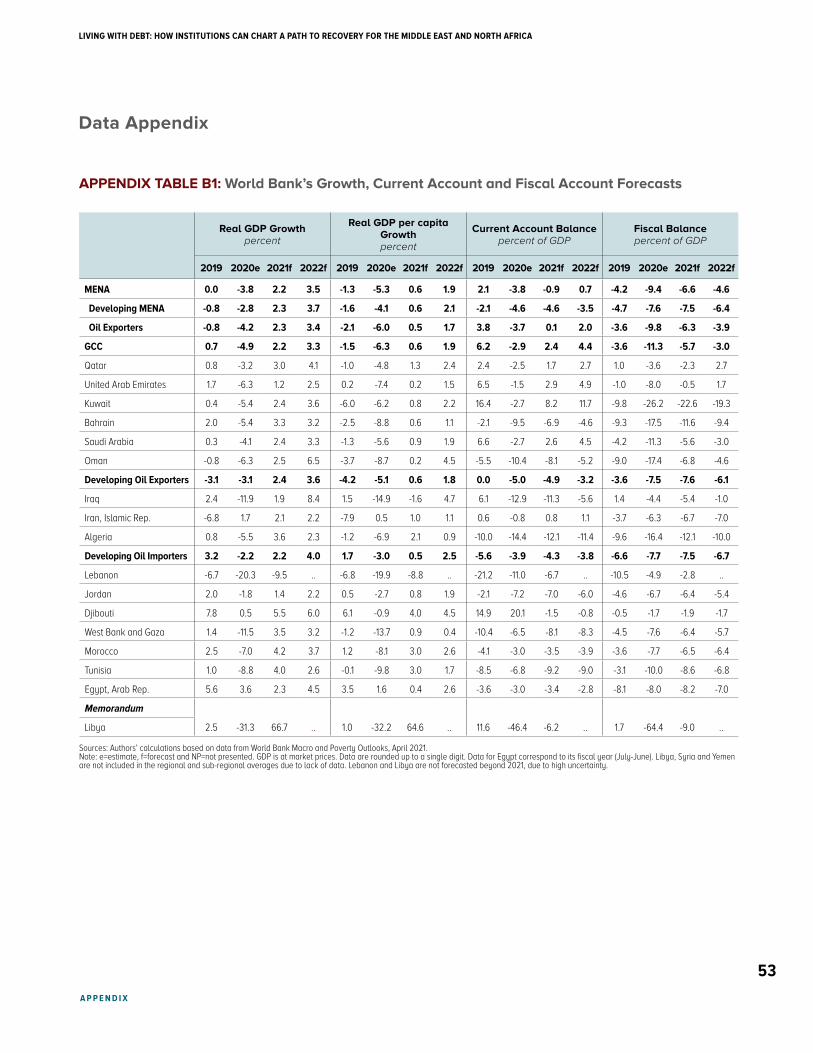
Appendix Table B1 World Bankrsquos Growth Current Account and Fiscal Account Forecasts 53
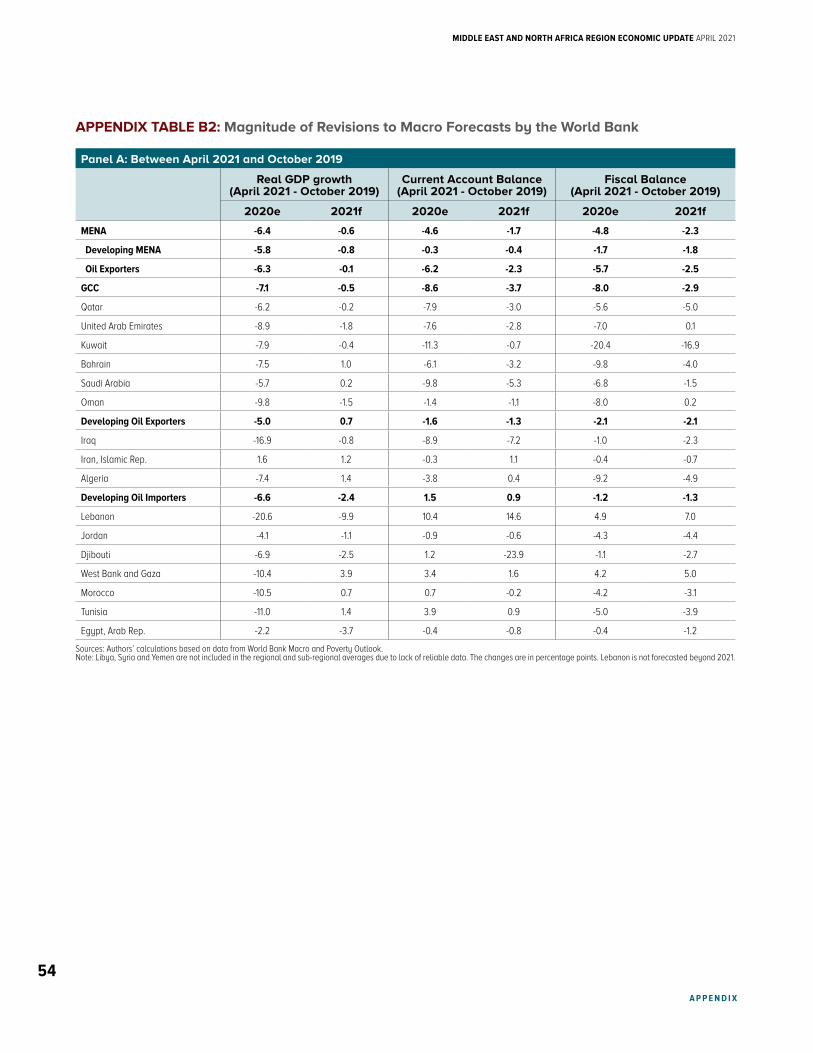
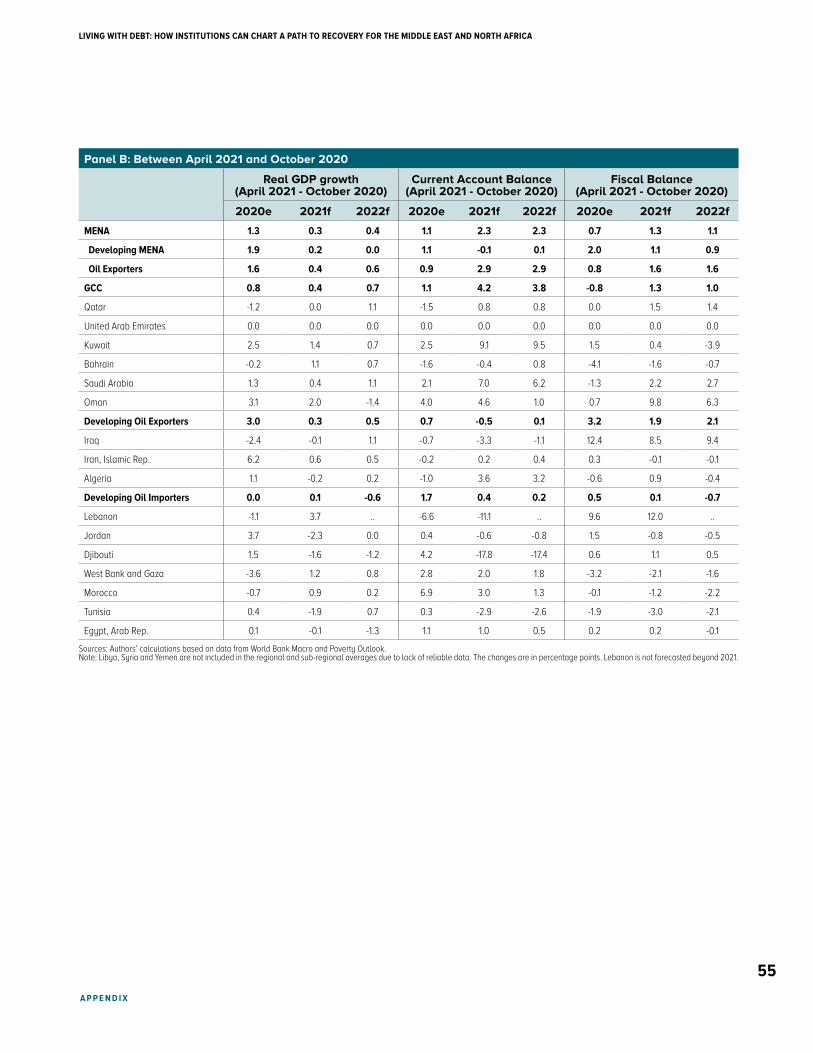
Appendix Table B2 Magnitude of Revisions to Macro Forecasts by the World Bank 54
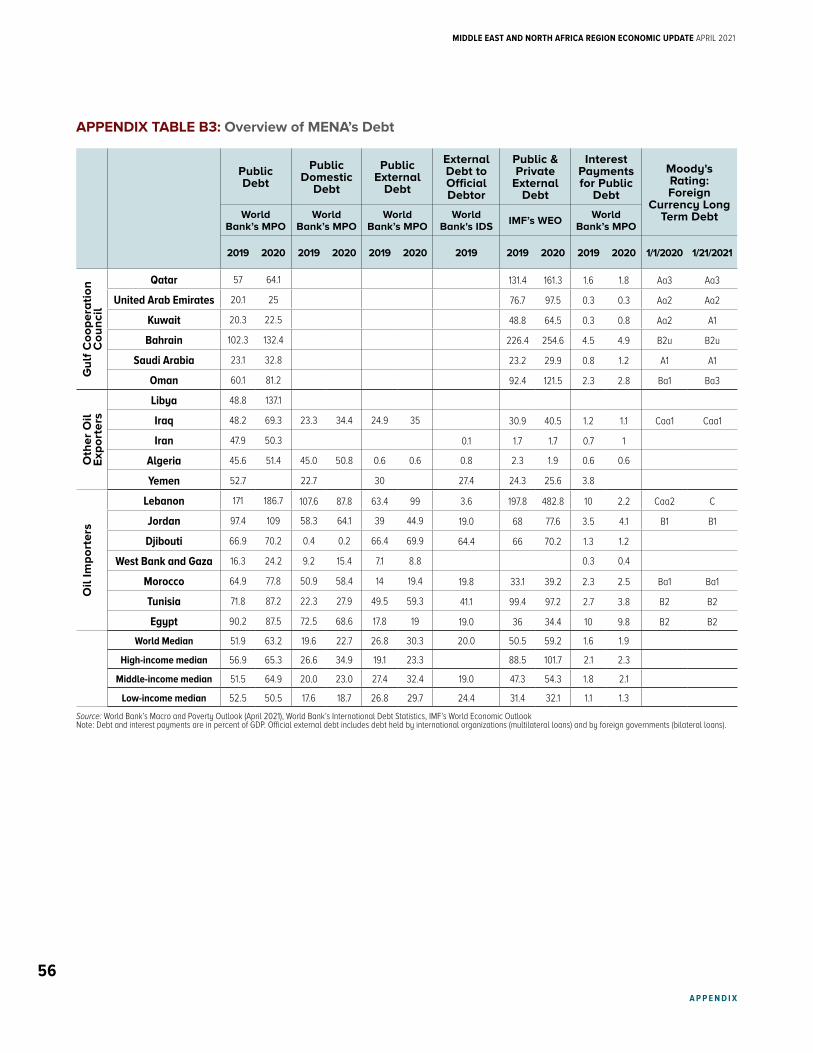
Appendix Table B3 Overview of MENArsquos Debt 56
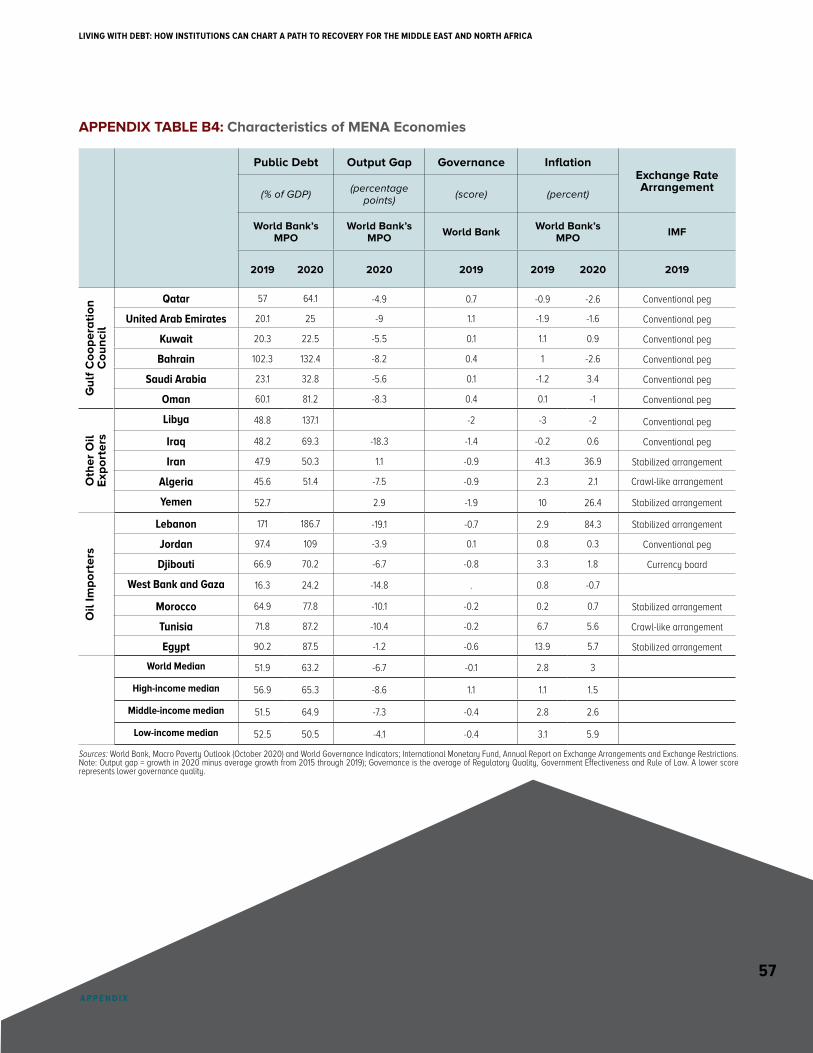
Appendix Table B4 Characteristics of MENA Economies 57
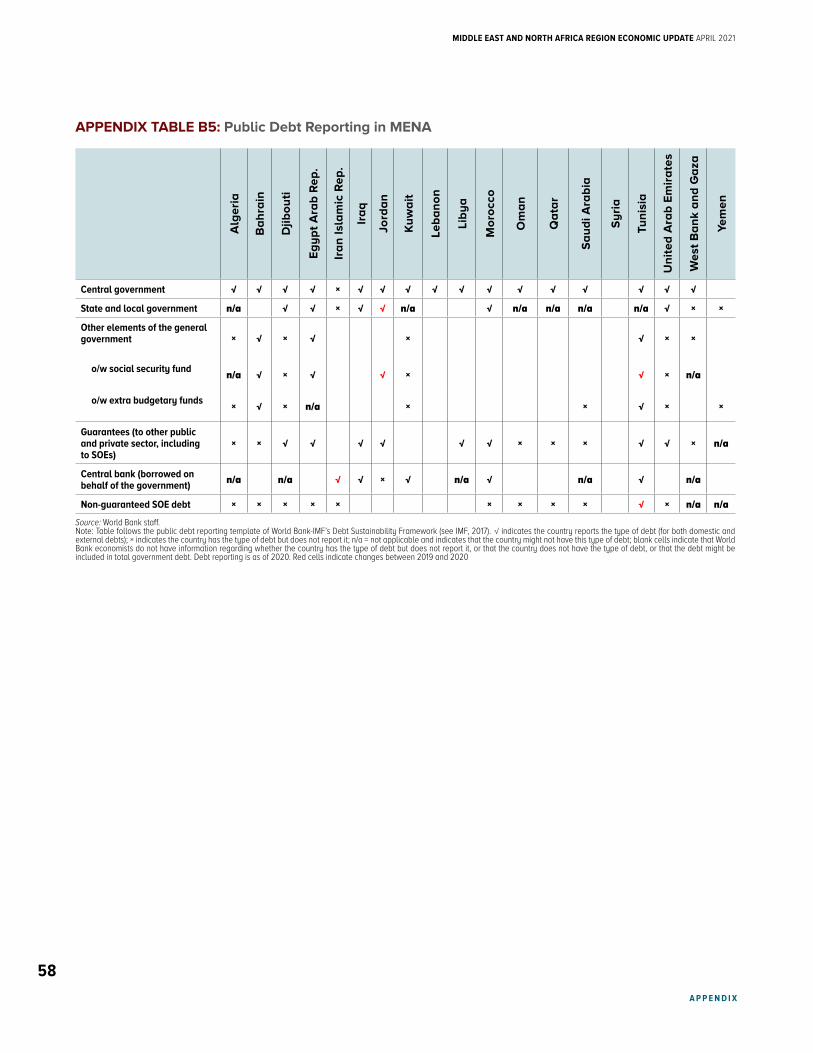
Appendix Table B5 Public Debt Reporting in MENA 58
List of Figures
Chapter I A Continuing Crisis
Figure I1 Purchasing Managersrsquo Index 10
Figure I2 GDP Level Forecasts 11
Figure I3 Test positivity Rates and Growth Downgrades 12
Figure I4 Distributional Effects of Covid-19 14
Figure I5 Changes in Real Government Revenue and Expenditure in 2020 16
Figure I6 Median Public Debt by Country Group 16
Figure I7 Decomposition of Changes in Public Debt in MENA 2020 and 2021 17
Figure I8 Credit Default Swaps for Available MENA Countries 18
Figure I9 Expected Oil Production and Consumption 20
Chapter II How Institutions Can Chart a Path to Recovery for the Middle East and North Africa
Figure II1 Public Debt and Output Growth around Natural Disasters 22
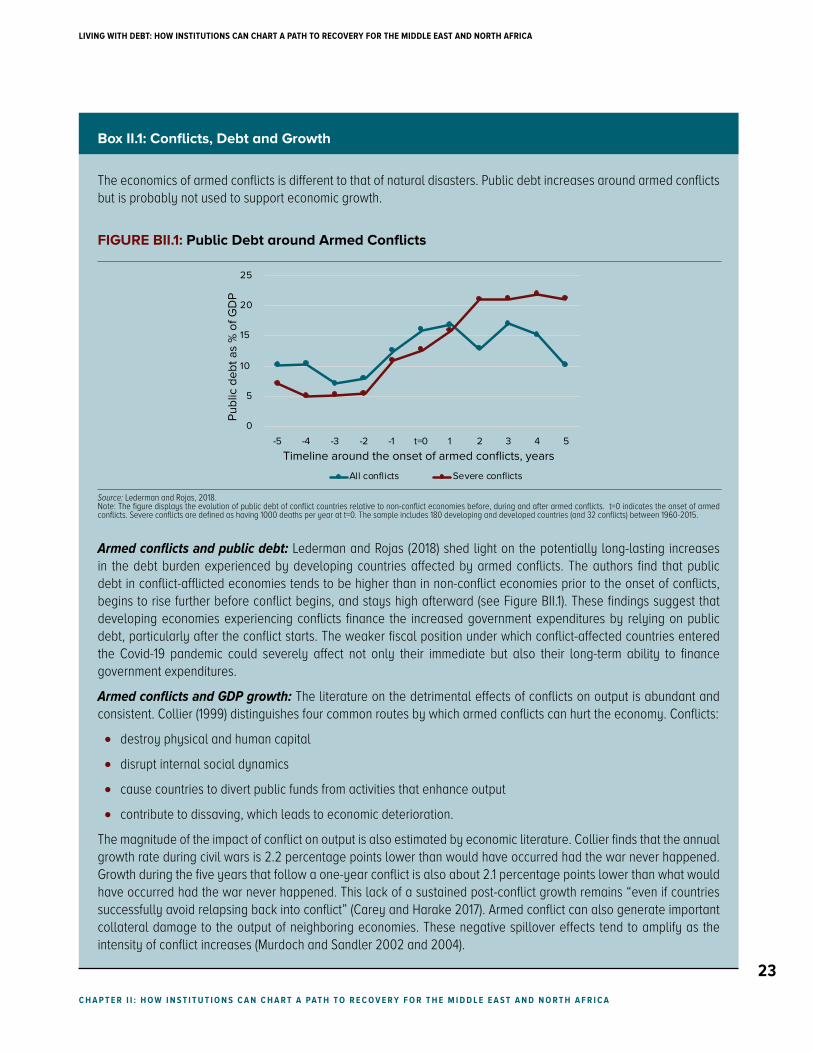
Figure BII1 Public Debt around Armed Conflicts 23
Figure II2 Correlations between Public Debt Interest Payments and Private Investment 25
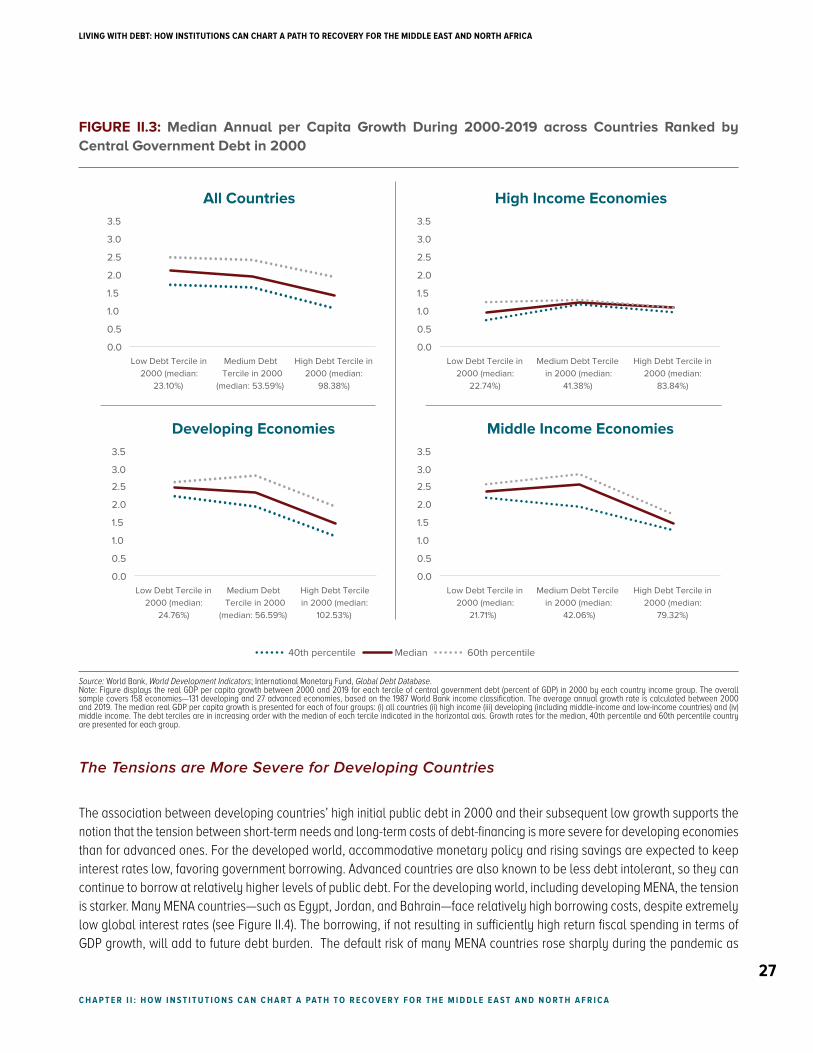
Figure II3 Median Annual per Capita Growth During 2000-2019 across Countries Ranked by Central Government Debt in 2000 27
Figure II4 Coupon Rates of US Dollar-denominated Debt Issuances during the Pandemic by Maturity for MENA countries Chile and Brazil 28
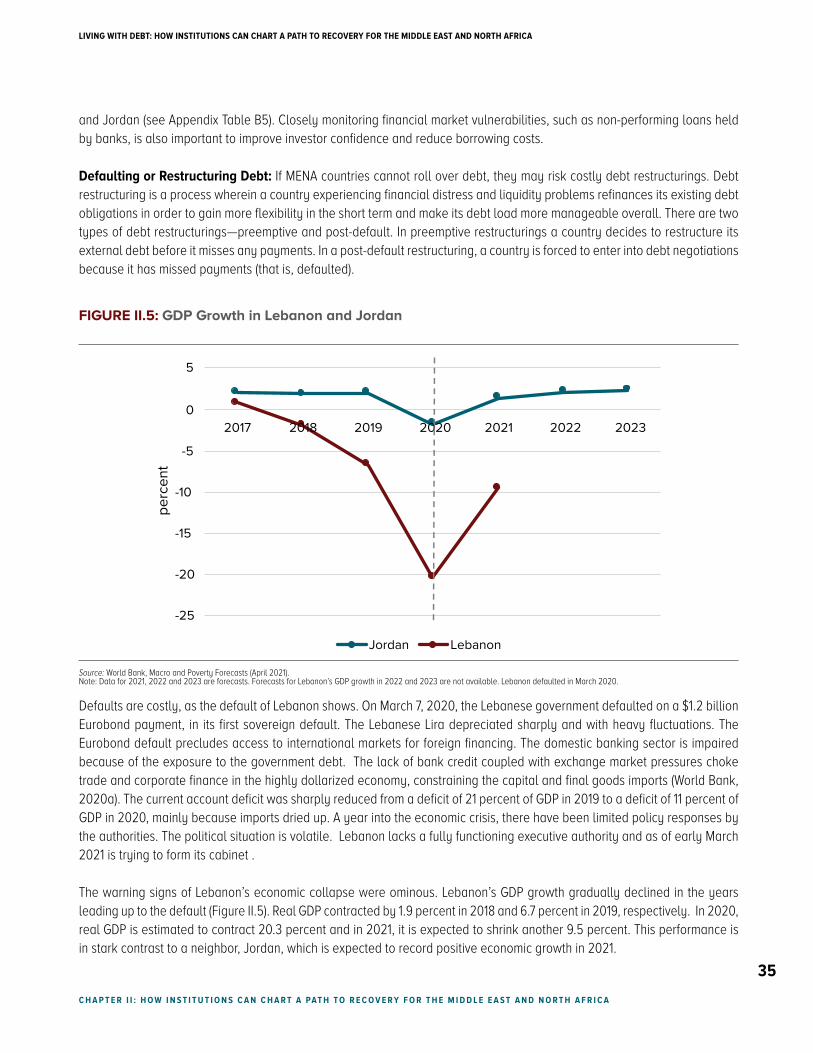
Figure II5 GDP Growth in Lebanon and Jordan 35
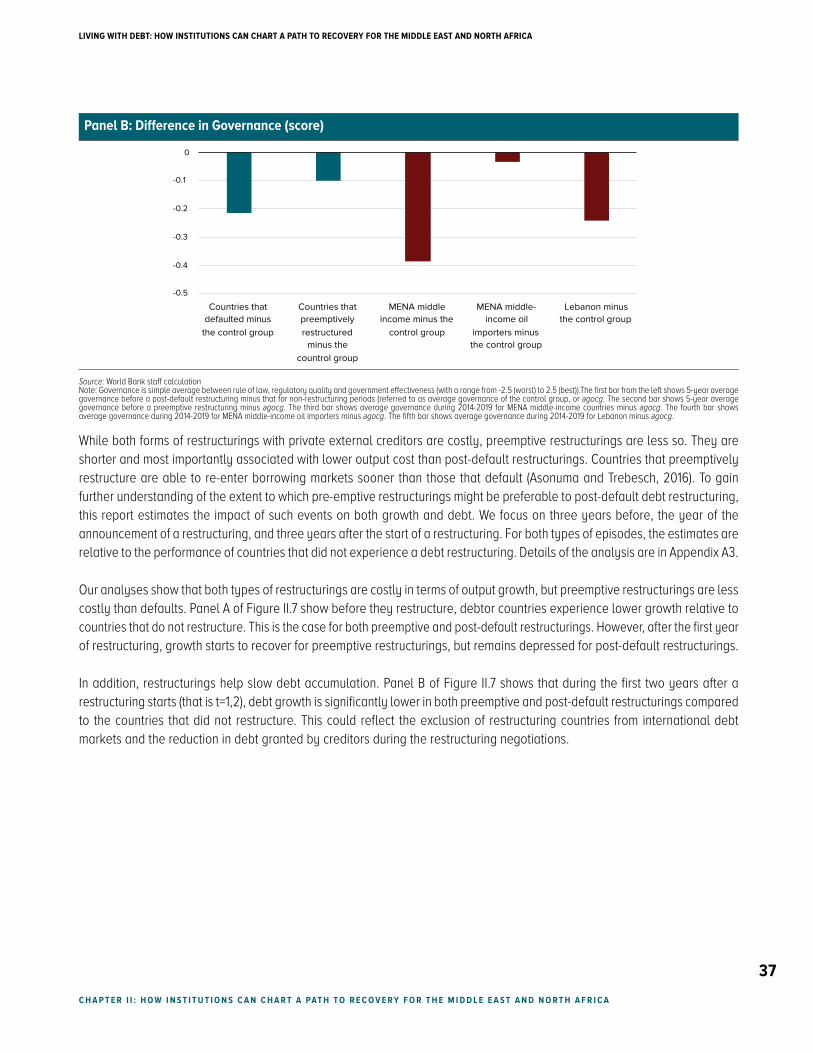
Figure II6 Growth and Governance before Restructurings 36
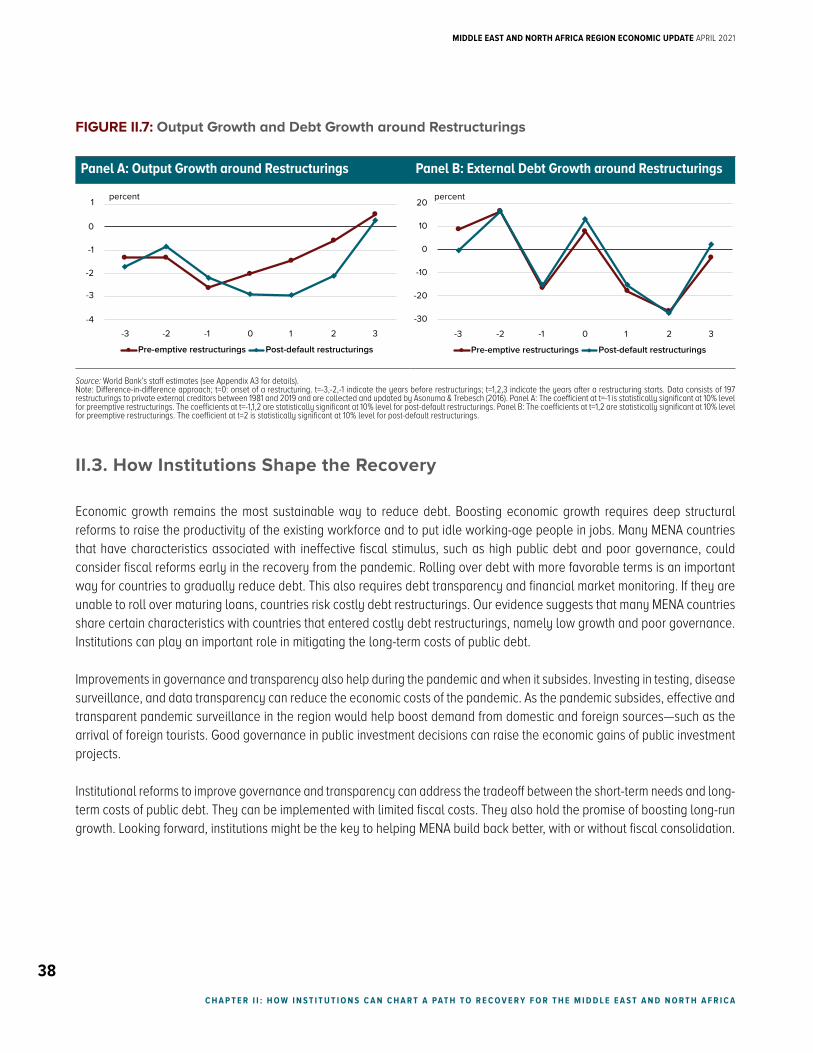
Figure II7 Output Growth and Debt Growth around Restructurings 38
Appendix
Figure A11 Natural Disasters 1900-2020 46
List of Boxes
Chapter II How Institutions Can Chart a Path to Recovery for the Middle East and North Africa
Box II1 Conflicts Debt and Growth 23
Box II2 The Debt Service Suspension Initiative (DSSI) 32
Acknowledgements
The MENA Economic Update is a product of the Chief Economist Office of the Middle East and North Africa Region (MNACE) of the World Bank The report was written by Roberta Gatti (Regional Chief Economist) Daniel Lederman (Deputy Chief Economist) Ha M Nguyen (Team Lead) Sultan Abdulaziz Alturki Rachel Yuting Fan Asif M Islam and Claudio J Rojas
Helpful guidance and comments were provided by Ferid Belhaj (Regional Vice President) Carmen Reinhart (Vice President and Chief Economist of the World Bank Group) Eric Le Borgne Kevin Carey Nancy Lozano Gracia Jesko S Hentschel Djibrilla Issa Graciela Kaminsky Stefan G Koeberle Nadir Mohammed Steven Pennings Ismail Radwan Sergio Schmukler Ayat Soliman and Marina Wes
Inputs from Mark Ahern Dalia Al Kadi Khaled Alhmoud Sara B Alnashar Amir Mokhtar Althibah Jaime de Pinies Bianchi Javier Diaz Cassou Damir Cosic Emmanuel F Cuvillier Cyril Desponts Romeo Jacky Gansey Michael Geiger Ugo Gentilini Alexander Haider Naji Mohamad Abou Hamde Mouna Hamden Wissam Harake Johannes G Hoogeveen Sahar Sajjad Hussain Rick Emery Tsouck Ibounde Amina Iraqi Robert Bou Jaoude Anastasia Janzer-Araji Majid Kazemi Naoko C Kojo Shireen Mahdi Wael Mansour Ashwaq Natiq Maseeh Minh Cong Nguyen Harun Onder Aminur Rahman Nate Rawlings Saadia Refaqat Christina Wood and Marwane Zouaidi are much appreciated
We thank James L Rowe Jr for editing the manuscript Help from Translation and Printing amp Multimedia Unit from The World Bankrsquos Global Corporate Solutions is acknowledged Stellar administrative support was provided by Swati Raychaudhuri
A C k N O w L E D g E M E N T S
MIDDLE EAST AND NORTH AFRICA REgION ECONOMIC UPDATE APRIL 2021
iv
Abbreviations
CDC Centers for Disease Control and Prevention
CDS Credit Default Swaps
COVAX COVID-19 Vaccines Global Access
COVID-19 Coronavirus Disease 2019
DSA Debt Sustainability Analysis
DSSI Debt Service Suspension Initiative
EM-DAT Emergency Events Database
FDI Foreign Direct Investment
FOMC Federal Open Market Committee
g20 Group of 20 Advanced Economies
gCC Gulf Cooperation Council
gDD Global Debt Database
gDP Gross Domestic Product
gHS Global Health Security
IDS International Debt Statistics
IMF International Monetary Fund
MENA Middle East and North Africa
MPO Macro and Poverty Outlook
NPR National Public Radio
OECD Organization for Economic Cooperation and Development
PMI Purchasing Managersrsquo Index
RHS Right-hand side
SOE State-Owned Enterprises
UAE United Arab Emirates
UNCTAD United Nations Conference on Trade and Development
USEIA US Energy Information Administration
VIX Chicago Board Options Exchange Volatility Index
wEO World Economic Outlook
wHO World Health Organization
A B B R E V I AT I O N S
LIVINg wITH DEBT HOw INSTITUTIONS CAN CHART A PATH TO RECOVERY FOR THE MIDDLE EAST AND NORTH AFRICA
v
Preface
One year ago the first cases of a new coronavirus appeared in the Middle East and North Africa (MENA) region and the pandemic that followed has been wreaking havoc ever since Nearly every country in MENA has been overwhelmed by a surge of deadly infections accompanied by collapsing economies that threw millions of people out of work and pushed many more into poverty
The pandemic hit MENA countries at a bad time Many countries in the region entered 2020 with chronic low growth persistent macroeconomic imbalances and governance challenges including a deficit in transparency Public health systems in developing MENA countries were unprepared to face the pandemic
Today the MENA region like the rest of the world remains in crisis But we can see hopeful signs of light through the tunnel Vaccines to fight COVID-19 the disease caused by the coronavirus are being produced and in some countries rapidly deployed Shortages of medical supplies are abating There is evidence that the lockdowns and social distancing that caused the economic distress have also helped tamp down the spread of the virus And after a sharp contraction in GDP a recovery of sorts is forecast for the global economy and for the MENA region in 2021
But that recovery is unlikely to be strong enough to get the MENA regionrsquos output back to pre-pandemic levels And the substantial borrowing that MENA governments had to incur to finance essential health and social protection measures boosted government debt dramatically The average public debt in MENA countries is expected to rise 8 percentage points from about 46 percent of gross domestic product (GDP) in 2019 to 54 percent in 2021 Notably debt among MENA oil importers is expected to average about 93 percent of GDP in 2021 And the need to keep spendingmdashand keep borrowingmdashwill remain strong for the immediate future
The tension between short-term needs and long-term consequences is stark for countries in the MENA region For many debt repayments are large and growing Moreover although global interest rates are at an all-time low some MENA countries do not have access to markets because they are not considered creditworthy while some others must pay high rates Poor governance and lackluster growth prospects prevent them from taking advantage of favorable global credit conditions Consequently most MENA countries may find themselves in a post-pandemic world stuck with a debt service bill sucking up resources that otherwise could be devoted to economic development
This report examines both the regionrsquos economic challenges and the uncomfortable tradeoffs governments will have to make in the coming years They have no option but to continue spending on health and income transfers as long as the pandemic continues That will improve the health and help maintain the financial stability of their citizens But it will also add to already high debt burdens which spell complicated policy decisions after the pandemic recedes Should MENA governments then immediately turn their attention to providing fiscal stimulus to stumbling economies Will they need to Pent-up demandmdashespecially from tourism and other travelmdashcould provide enough spark to invigorate economies Eventually MENA countries will have to deal with accumulated debt and its costs and will have to bring debt down to a more sustainable level
The report discusses policy options available for MENA countries One significant takeaway is the important role of strong efficient and transparent institutions in addressing the tradeoffs between short-term needs and long-term costs of public debt Good governance could increase the effectiveness of fiscal spending Improving debt transparency could lower borrowing costs when countries try to roll over their debt Even in the short term improvements in governance and transparency will help
P R E F A C E
MIDDLE EAST AND NORTH AFRICA REgION ECONOMIC UPDATE APRIL 2021
vi
during the pandemic Investing in testing disease surveillance and data transparency can reduce the economic costs of the pandemic As the crisis subsides effective transparent and credible pandemic surveillance in the region would help boost demand from domestic and foreign sourcesmdashsuch as the arrival of foreign tourists
Strong institutions are one crucial dimension to helping MENA build back stronger and more resilient economies As needed they can be reformed and strengthened with limited fiscal costs and can thus help boost the regionrsquos long-run growth As MENA emerges from this dark time the World Bank stands ready to help the region not only to meet the short-term needs of disaster relief but also to enhance institutions that will help usher in brighter years ahead
Ferid Belhaj Vice President Middle East and North Africa Region The World Bank
P R E F A C E
LIVINg wITH DEBT HOw INSTITUTIONS CAN CHART A PATH TO RECOVERY FOR THE MIDDLE EAST AND NORTH AFRICA
1
Overview
The Middle East and North Africa (MENA) region like the rest of the world remains in a pandemic-spawned crisis In 2020 the regionrsquos real output contracted by 38 percent The rebound in 2021 is unlikely to be strong enough to allow the region to regain the level of economic activity it had in 2019 and certainly not the level the World Bank had forecasted before the pandemic
The regionrsquos inflation-adjusted government revenues dropped by 24 percent in 2020 The disaster relief demanded by the pandemic combined with the decline in revenues led to further accumulation of debt in a region that already had high public debt The World Bank expects the regionrsquos public debt to rise from 46 percent of its GDP in 2019 to 54 percent by the end of 2021 This increase would be MENArsquos fastest accumulation of public debt as a share of output in the 21st century Among MENA country groups MENA oil importers have the highest levels of debt which will hover around 93 percent of GDP in 2021
As the pandemic subsides tensions will inevitably emerge between the potential short-run gains and the potential long-run costs of debt-financed public spending
In the short-term fiscal spending is needed to mitigate the effects of the pandemic including income transfers to support consumption of hardest hit families and health spending on testing treatment and vaccination As the pandemic subsides fiscal authorities will have to decide whether additional fiscal stimulus is warranted to raise aggregate demand to accelerate the post-pandemic economic recovery
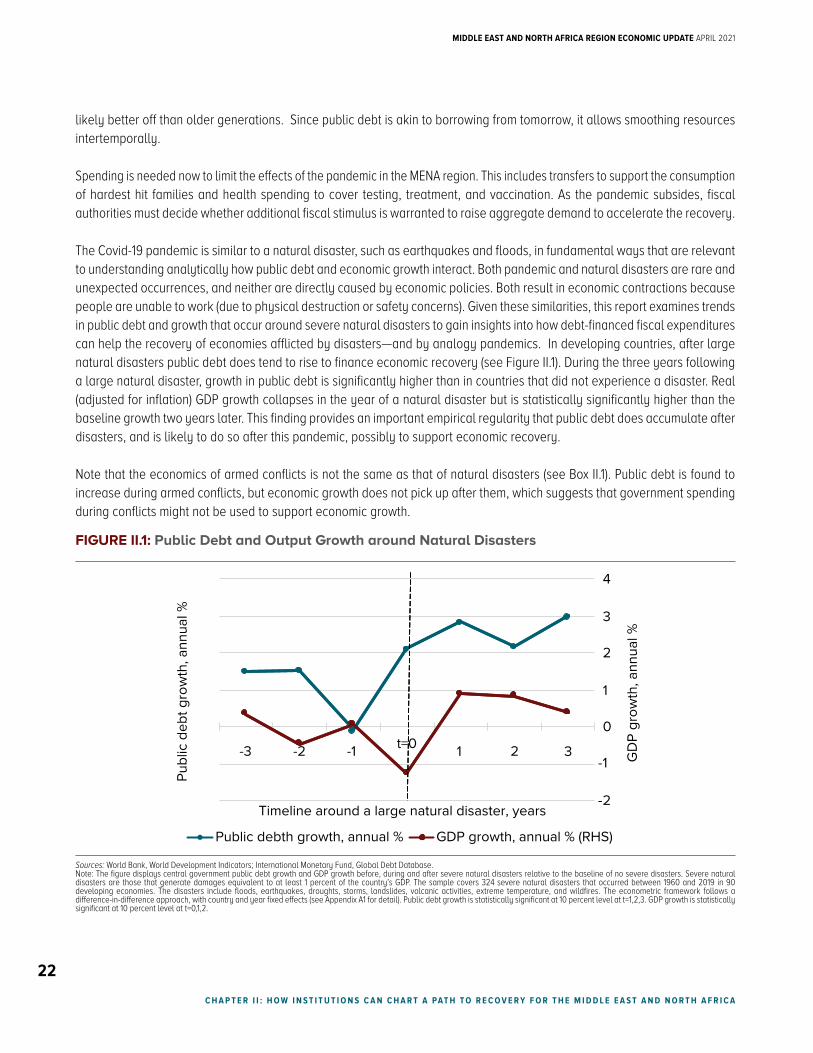
Because the pandemic shares many traits with natural disasters this report examines trends in public debt and output growth around natural disasters to illustrate how debt-financed fiscal expenditures can help the recovery The evidence indicates that growth in both public debt and output tends to rise faster after disasters than it does in economies without disasters thus illustrating how debt-financed fiscal expansions can help economic reconstruction
However in the longer run debt might be costly especially for developing economies When governments borrow they may crowd out private sector investment because rising interest rates increase the cost of capital for the private sector In fact the correlation between private investment and public debt was negative for MENArsquos developing countries1 during the past two decades In addition high levels of debt may be accompanied by costly debt-interest payments that gradually reduce the space for other growth-enhancing public investment priorities For example a few countries in the MENA region already have interest payments equivalent to about 10 percent of GDP and account for more than 30 percent of total public expenditures
Maintaining high debt could also be risky in the long term threatening economiesrsquo credit worthiness and their ability to refinance (or roll over) maturing debt in the future These risks if they materialize can result in economic pain characterized by currency devaluations run-away inflation capital flight and ultimately costly debt crises Lebanonrsquos debt default in March 2020 and the ongoing crisis is a painful example
The report provides suggestive evidence that atypically high debt levels relative to GDP can dampen long-term growth prospects Countries that entered the 21st century with high debt- to- GDP ratios tended to grow more slowly over the next two decades than countries with lower debt burdens For developing countries the data are striking Economies in the top tercile of countries in terms of debt-to-GDP ratios in 2000 typically experienced a GDP-per-capita growth rates about 1 percentage point per year lower than the rest of the developing countries over the next 20 years
1 Throughout the report the term ldquoMENArsquos developing countriesrdquo refers to low- and middle-income MENA countries
O V E R V I E w
MIDDLE EAST AND NORTH AFRICA REgION ECONOMIC UPDATE APRIL 2021
2
The tension between short-term needs and long-term costs of debt-financing seems more severe for developing economies than for high-income ones In advanced economies accommodative monetary policy and rising savings are expected to combine to keep interest rates low favoring government borrowing that could help finance growth-enhancing activities In general academic literature suggests that advanced economies are less ldquodebt intolerantrdquo than developing and emerging economies (Reinhart et al 2003) That is they can continue to borrow when debt levels are high without risking major growth slowdowns The data collected for this report is consistent with this hypothesis
For developing economies however including those in MENA the tension between debt and growth is apparent During the pandemic many MENA countries face borrowing costs higher than other economies even though global interest rates are at historically low levels Default risk indicators for many MENA countries rose sharply during 2020 and some have not returned to pre-pandemic levels This is probably because many MENA countries entered 2020 with high debt and chronic low growth relative to world peers while also facing notable institutional challenges such as poor transparency and governance These pre-existing vulnerabilities might have heightened the long-term costs of public debt accumulation
What can MENA countries do to resolve the tensions between short-term objectives and long-term risks of rising public debt
Chapter 2 tackles this question by discussing policy options during three distinct phases of economic recovery
expenditure priorities during the pandemic
fiscal stimulus as the pandemic subsides
mitigating the potential costs of debt overhang in the medium term
Governance and transparency issues emerge as central protagonists across all three phases
Prioritizing spending during the pandemic
While the pandemic is still ongoing fiscal spending is probably best used to protect the welfare of vulnerable families and to invest in public health The pandemic is having disproportionate impacts on poor households because they are less healthy and less likely to be able to social distance Supporting the consumption of the hardest hit households is an essential objective for fiscal spending at this time MENA countries have taken unprecedented actions to support the most vulnerable The good news is that cash transfers are reasonably well-targeted although there is room to improve Evidence from phone surveys in the region suggests that a higher percentage of the poorest households are beneficiaries than those at the top of the distribution Using fiscal spending to stimulate aggregate demand is likely to be difficult as long as the risk of Covid-19 exposure remains ndash for the very reason that social distancing and limited mobility continue to be key to overcoming the pandemic
Public health investment as a short-term response to the pandemic could also bring long-term gains As vaccines become available it is important to plan and roll out effective vaccination campaigns Proper investment in vaccination would not only reduce the risk of a prolonged crisis and speed up economic recovery but also would reinforce the infrastructure for long-term public health Rough calculations of the costs and benefits of investing in vaccination programs which need to be interpreted with a grain of salt indicate that the benefit-cost ratio could be large around 781 if MENA vaccinates 20 percent of its population at current prices proposed by COVAX the multilateral effort to channel Covid-19 vaccines to poor and lower-middle income countries
O V E R V I E w
LIVINg wITH DEBT HOw INSTITUTIONS CAN CHART A PATH TO RECOVERY FOR THE MIDDLE EAST AND NORTH AFRICA
3
Investing in testing and public surveillance of the outbreak also appears to reduce the economic costs of the pandemic Preliminary evidence suggests that countries with higher test-positivity rates suffered larger growth downgrades A high test-positivity rate indicates a relatively uncontrolled pandemic and might reflect a slow or ineffective public health surveillance strategy Unfortunately many MENA countries have either high positivity rates (above the 5 percent benchmark set by the World Health Organization) or do not reliably report test data Notably however several high-income countries in MENA have been at the global forefront of using testing for disease surveillance and in rolling out vaccination programs
Fiscal stimulus as the pandemic subsides
MENA policymakers will soon decide whether additional fiscal stimulus is warranted after the public health emergency abates Embarking on additional stimulus at that time is not without risks
First economic growth might rebound without fiscal stimulus Consumer and business spending might rise quickly after it becomes clear that the health risks have subsided (Krugman 2020 Lee 2020) This phenomenon is referred to in the current debate as ldquopent-up demandrdquo In MENA the extent of such a pent-up demand rebound especially from external sources of demand such as tourism is likely to depend on the effectiveness and transparency of governmentsrsquo pandemic surveillance
Second fiscal stimulus can be ineffective or even counterproductive in economies with elevated debt such as many MENA oil importers Published refereed research indicates that when public debt is high the so-called fiscal multiplier -- the effect on GDP from additional spending -- can be zero (Huidrom et al 2020) Consequently the short-term costs of fiscal consolidation could also be negligible and thoughtful consolidation could be a preferred policy stance in economies with very high public debt ratios
Third while public investment such as infrastructure projects can be a tool of choice studies have cautioned that delayed implementation can result in a limited short-term multiplier More importantly the economic gains from public investment projects can be hindered by poor governance which reduces the efficiency of public investment This appears to be the case for a large sample of European countries (Izquierdo et al 2019) Therefore in countries with the lowest institutional capacity and transparency the multiplier of public investment can be close to zero in both the short- and long-terms which reinforces the need to work on reforms to improve the governance of public investment decisions
Instead targeted fiscal spending can help heal the economic scars of the crisis In times of limited fiscal revenues and competing social demands for government assistance it is best to focus on scars with potentially long-lasting consequences For example financial constraints might prevent firms from making necessary investment to re-enter a market Likewise workers who became unemployed or under-employed during the crisis might face long-term reductions in employment probabilities and wages In these situations targeted government spending such as subsidized loans and job training might help heal the economic scars from the pandemic that can obstruct long term development Similarly investment in education that might help disadvantaged children recoup the lost learning during the pandemic might avert costly long-term losses in human capital
O V E R V I E w
MIDDLE EAST AND NORTH AFRICA REgION ECONOMIC UPDATE APRIL 2021
4
Mitigating the costs of debt after the pandemic
The costs of elevated debt are likely to manifest themselves eventually perhaps even in the short term Countries in the region may have to take action to reduce debt to GDP ratios soon after the pandemic even if output is below its potential
As mentioned highly indebted MENA countries can consider taking an approach to reduced debt and debt accumulation that combines prioritizing the most effective spending items and improving governance of investment decisions In highly indebted countries thoughtful fiscal consolidation could be welcomed by the private sector
MENA countries can also aim to roll over debt on more favorable terms To do so they would have to enhance their long-term growth prospects Perhaps more importantly transparency could also aid MENA countries by improving debt reporting and monitoring financial market vulnerabilities Published research indicates that such measures can lower borrowing costs (Cady 2005 Choi and Hashimoto 2018)
If rolling over debt is not an option highly indebted MENA countries will have to risk costly debt restructurings Evidence presented in this report suggests that pre-emptive restructurings in which a country decides to enter negotiations with external creditors before it misses any payments are less costly than post-default restructurings Unfortunately the evidence presented in this report also suggests that highly indebted countries are more likely to enter either preemptive or post-default restructurings with low growth and weak governance Several MENA oil importers entered 2020 with low growth and weak governance relative to countries that have not experienced episodes of debt distress
In sum economic growth is the most sustainable way to reduce public debt but is also the most challenging in the MENA region because it requires structural reforms to raise productivity and put people to work Many MENA countries have characteristics that would render post-pandemic fiscal stimulus ineffective In such situations policymakers may want to consider fiscal reforms early in the recovery phase Perhaps most importantly key institutional reforms that help improve debt transparency and the quality of public investment can be implemented immediately with limited fiscal costs They also hold the promise of boosting long-run growth Institutions then might help chart a path to lasting recovery for the Middle East and North Africa
O V E R V I E w
LIVINg wITH DEBT HOw INSTITUTIONS CAN CHART A PATH TO RECOVERY FOR THE MIDDLE EAST AND NORTH AFRICA
5
C H A P T E R I A C O N T I N U I N g C R I S I S
CHAPTER I A Continuing Crisis
CHAPTER I TAKEAWAYS
bull Economies in the Middle East and North Africa (MENA) remain in crisis The World Bank estimates that
MENArsquos GDP contracted 38 percent in 2020 and expects it to rebound by only 22 percent in 2021
bull Declining government revenue combined with the need to support vulnerable families and other policy
responses to the Covid-19 pandemic led to increases in public debt across the region The World Bank
expects the regionrsquos public debt burden to rise from 46 percent of GDP in 2019 to 54 percent of GDP by
2021 and debt of oil-importing developing countries to reach 93 percent
bull Having entered the crisis with chronic low growth high debt and poor governance the regionrsquos developing
economies are facing difficult tradeoffs associated with the accumulation of debt Institutional reforms
and transparency can help chart a solid path to recovery
I1 The Ongoing Pandemic in MENA
The Covid-19 pandemic has plunged the world into a crisis The virus has infected hundreds of millions of people caused millions of deaths and disrupted economies the world over The MENA region had more than 5 million recorded cases of Covid-19 by the end of February 2021
In the absence of a vaccine countries have experimented with various non-therapeutic interventions including lockdowns widespread use of masks and social distancing Early containment successes also relied on widespread use of testing contact tracing and isolating (TTI) symptomatic and asymptomatic cases An emerging literature has stressed the benefits of testing to save lives and livelihoods (Reed et al 2021 de Walque et al 2020) The ability to deploy testing and contact tracing on a large scale in turn depended on the strength of public health surveillance and clear and transparent communication from governments Transparent and credible data release on the virus spread allowed citizens to adapt their behavior to decrease the chance of contagion The availability of vaccines now offers hope that herd immunity can be achieved thus averting additional deaths restoring economic activity and staving off the risks of future pandemics A rapid scale up of vaccination however depends on the transparency and organizational capabilities of public health systems
Yet public health systems tend to be relatively weak in MENA Countries in the region fare poorly in the Global Health Security (GHS) Index which measures preparedness for epidemics and pandemics2 As of 2019 MENA ranked last among the worldrsquos regions in two components of the index that are critical to fighting a pandemic ldquoepidemiology workforcerdquo and ldquoemergency preparedness and response planningrdquo Many countries have had limited public health financing for decades According to data from the World Health Organization (WHO) countries such as Egypt and Iraq spent 5 percent or less of their government budget on health as of 20173
2 The index was jointly developed by the Nuclear Threat Initiative the Johns Hopkins Center for Health Security and the Economist Intelligence Unit Data were released in 2019 The index consists of six categories prevention detection and reporting rapid response health system compliance with international norms and risk environment
3 WHO Global Health Expenditure Database httpsappswhointnhadatabaseViewDataIndicatorsen
MIDDLE EAST AND NORTH AFRICA REgION ECONOMIC UPDATE APRIL 2021
6
C H A P T E R I A C O N T I N U I N g C R I S I S
Nevertheless some MENA health systems were well prepared especially those in the Gulf Cooperation Council (GCC)mdashBahrain Kuwait Oman Qatar Saudi Arabia and the United Arab Emirates (UAE) Bahrain and UAE rank among countries with highest testing per capita world-wide The GCC countries plus Lebanon and Jordan have done more testing per capita than the rest of the MENA region (see Table I1) Unfortunately many MENA countries have either high positivity rates (when more than 5 percent of tests for Covid-19 come back positive according to the WHO) or do not even have reliable testing or fail to report it (see Table I1) In conflict economies such as Syria and Yemen weak testing capacity leads to unreported testing statistics and fewer reported positive cases which paints a potentially misleading picture of low spread This said evidence from randomized anti-body testing high-income and developing countries indicate that the spread of Covid-19 is generally much higher than suggested by the official testing data due to unreported cases4
TABLE I1 Covid-19 Cases and Tests per Million People in MENA Countries
Country TestsMillion CasesMillion CasesTests ()
Gu
lf C
oo
pe
rati
on
C
ou
nci
l
Qatar 593580 61866 1042
United Arab Emirates 3547569 44141 124
kuwait 455811 50772 1114
Bahrain 1958570 77991 398
Saudi Arabia 415389 10937 263
Oman 298120 29004 973
Oth
er
Oil
Exp
ort
ers Libya 117877 21850 1854
Iraq 187298 19426 1037
Iran 143463 21248 1481
Algeria - 2615 -
Syrian Arab Republic - 978 -
Yemen - 113 -
Oil
Imp
ort
ers
Lebanon 498091 64610 1297
Jordan 533072 52108 977
Djibouti 123188 6599 536
west Bank and gaza 262956 43123 1640
Morocco 157616 13209 838
Tunisia 89342 20635 2310
Egypt - 1884 -
Source MENA Crisis Tracker based on data from Worldometer (httpswwwworldometersinfocoronavirus) Note Data are as of March 21 2021 ldquo-ldquo indicates that the country does not publicly report testing data Data do not necessarily match official statistics reported by the governments
Countries in the MENA region face mixed prospects of a vaccine rollout GCC countries gained access to vaccines earlier than most with the UAE and Bahrain leading the way As of March 21 2021 74 percent of people in the UAE and 38 percent of the population in Bahrain had been vaccinated with the rest of the region trailing behind (see Table I2) GCC countries have also been leveraging technology to facilitate their vaccination programs such as apps to book mobile vaccination units in Bahrain Some middle- and low-income MENA countries relied on international cooperation and support from global vaccine programs (such as COVAX)5 Although the majority of developing MENA countries have signed contracts with vaccine providers only Morocco has embarked on a vaccination program for a significant portion of population (see Table I2)
4 See MENA Crisis Tracker and related literature5 Covid-19 Vaccines Global Access or COVAX is a multilateral initiative to give poorer countries access to Covid-19 vaccines Among the groups in COVAX are the Global Alliance for
Vaccines and Immunization the World Health Organization and the Coalition for Epidemic Preparedness Innovations
LIVINg wITH DEBT HOw INSTITUTIONS CAN CHART A PATH TO RECOVERY FOR THE MIDDLE EAST AND NORTH AFRICA
7
C H A P T E R I A C O N T I N U I N g C R I S I S
Vaccinations are expected to help a country control the spread of Covid-19 paving the way for an economic recovery Preliminary evidence suggests a very large benefit from widespread vaccination Rough calculations indicate that in addition to the benefits in terms of lives saved there is a roughly 781 benefit-to-cost ratio if MENA countries vaccinate 20 percent of their population at current COVAX prices (Ahuja et al 2021) These calculations however are not flawless The benefits are computed as the decline in expected GDP growth rates for 2020 and 2021 relative to pre-pandemic forecasts Going forward since non-trivial shares of the population have already been infected the expected economic gains from vaccinations are probably slightly lower than implied by these calculations Still the benefits of effective vaccination campaigns relative to the costs of not vaccinating are probably huge
TABLE I2 Covid-19 Vaccination Programs in MENA
Country of population
Cumulative Covid-19
vaccination doses administered
Vaccine Contracts
Vaccine clinical trial participation
(YN)
Vaccine imports through COVAX
Facility (YN)
Gu
lf C
oo
pe
rati
on
Co
un
cil Qatar 2064 594613 by March 14
Pfizer-BioNTech and Moderna N Y
United Arab Emirates 7380 73 million by March 14 Sinopharm and Pfizer Y Y
kuwait 843 360000 by March 8 1m doses Pfizer-BioNTech AstraZeneca N Y
Bahrain 3839 653236 by March 17 Pfizer-BioNTech Sinopharm AstraZeneca Y N
Saudi Arabia 916 319 million by March 18 Pfizer-BioNTech Y Y
Oman 215 109844 by March 17 370000 Pfizer-BioNTech doses N N
Oth
er
Oil
Exp
ort
ers
Libya - - $96 million of vaccines contracted with WHO N N
Iraq- -
15m doses Pfizer-BioNTech 1m Sputnik
Sinopharm N Y
Iran 015 124193 by March 19 Sputnik V N N
Algeria 060 280000 by March 14 Sputnik V AstraZeneca and Sinopharm N Y
Syrian Arab Republic - - 5000 doses received N Y
Yemen - - 23 million doses with COVAX N Y
Oil
Imp
ort
ers
Lebanon 203 138420 by March 20 21m Pfizer-BioNTech N Y
Jordan 267 272648 by March 14 3m doses Pfizer-BioNTech Y Y
Djibouti - - Sputnik V N Y
west Bank and gaza
- -
37440 Pfizer-BioNTech and 24000 AstraZeneca
delivered through COVAX
N Y
Morocco 1812 669 million by March 20
65 million - Sinopharm and AstraZeneca Y Y
Tunisia lt001 12496 by March 12 2m doses Pfizer-BioNTech 1m Sputnik N Y
Egypt lt001 1315 by Jan 30 40m from Sinopharm AstraZeneca Y Y
Source World Bank MENA Crisis Tracker based on data on vaccination from Our World in Data (httpsourworldindataorgcovid-vaccinations) Data for Algeria are from WHO Note Data are as of March 21 2021 Data do not necessarily match official statistics reported by the governments
MIDDLE EAST AND NORTH AFRICA REgION ECONOMIC UPDATE APRIL 2021
8
C H A P T E R I A C O N T I N U I N g C R I S I S
I2 Economic Consequences of the Pandemic
The virus not only claims lives Its spread has had severe economic consequences MENA countries have experienced negative supply and demand shocks (Arezki et al 2020c) The negative supply shock came first from a reduction in labor supply mdashdirectly because workers get sick with Covid-19 and indirectly from travel restrictions quarantine efforts and workers staying home to take care of children or sick family members Supply was also affected by a reduction in the supply of materials capital and intermediate inputs due to disruptions in transport and businesses in MENA countries The negative demand shock was both global and regional Economic difficulties around the world and the disruption of global value chains reduced demand for the regionrsquos goods and servicesmdashmost notably oil and tourism Regional demand also declined as a result of the abrupt reduction in regional business activity and concerns about infectionmdashboth of which reduced travel In addition uncertainty about the spread of the virus and the level of aggregate demand impeded the regionrsquos investment and consumption Collapsing oil prices in 2020 further depressed demand in MENA where oil and gas comprise the most important sector in many economies As a consequence the Covid-19 pandemic severely affected virtually all aspects of the regional economies Output in 2020 contracted sharply The expected rebound in 2021 is unlikely to bring the region back to the level of economic activity it had in 2019 and certainly not to the level the World Bank had expected before the pandemic
Macroeconomic Impact
The pandemic and the associated collapse of oil prices severely hit MENA oil exporters The benchmark Brent oil price fell from about $65-a barrel before the pandemic to close to $20-a-barrel in April 2020 Since then it has only gradually climbed back to pre-pandemic levels Revenue from oil exports the main source of income for many oil producers in the region was expected to contract 38 percent in 2020 (IMFrsquos World Economic Outlook (WEO)- October 2020) This has been the trend notwithstanding a recent jump in oil prices associated with conflict in the region6
The pandemic was felt in all sectors not just energy MENA firms were severely affected (see Apedo-Amah et al (2020) for an analysis on early impact and Mohammed et al (2021) for a recent update) Overall exports from the MENA region fell sharply and have only partially recovered After dropping 44 percent year-on-year in the second quarter of 2020 goods exports from the region continued year-on-year declines of 17 percent in the third quarter and 10 percent in the fourth quarter (UNCTAD 2020 2021) Sectors such as autos in Morocco Tunisia and Iran and textiles in Jordan and Egypt have been hard hit by the pandemic and weakening global trade Covid-19 transport and travel restrictions directly affect the services trade including tourism which is an important source of income for many MENA countries For example it was the equivalent of 25 percent of exports in Egypt and 41 percent in Jordan in 2018 (World Development Indicators) Available high-frequency data indicate that tourism and air traffic in the region completely collapsed in April 2020 They have slightly recovered since then but for the four countries with available data (Morocco Tunisia Egypt and Saudi Arabia) tourism and air traffic were still 60 percent to 80 percent lower in February 2021 compared to February 2020 Data on Purchasing Managersrsquo Index (PMI) available for a few MENA countries also paint a picture of an uneven and difficult recovery A PMI above 50 represents an expansion over the previous month while a PMI below 50 represents a contraction PMIs for UAE and Egypt have hovered around 50 since July suggesting the two economies have not rebounded from the trough in April 2020 PMIs for Qatar and Saudi Arabia are above 50 as of February 2021 indicating a slight rebound Lebanonrsquos PMI is below 45 as of February 2021 indicating a continuing economic contraction (see Figure I1)
6 CNBC 2021
LIVINg wITH DEBT HOw INSTITUTIONS CAN CHART A PATH TO RECOVERY FOR THE MIDDLE EAST AND NORTH AFRICA
9
C H A P T E R I A C O N T I N U I N g C R I S I S
FIGURE I1 Purchasing Managersrsquo Index
25
30
35
40
45
50
55
60
65
Novem
ber 2019
Decem
ber 2019
Januar
y 2020
Februar
y 2020
March 2020
April 2020
May 2020
June 2020
July
2020
August 2020
September 2
020
October 2020
Novem
ber 2020
Decem
ber 2020
Januar
y 2021
Februar
y 2021
Egypt Lebanon Saudi Arabia UAE Qatar
Source Bloomberg LPNote Markit PMI is for the whole economy seasonally adjusted A PMI above 50 represents an expansion over the previous month A PMI reading under 50 represents a contraction
World Bank economists estimate that the regionrsquos real output contracted 38 percent in 2020 (see Appendix Table B1 for country-specific estimates) This estimate is a 13 percentage point upgrade compared to the forecast released in October 2020 (see Panel B Appendix Table B2) The upward adjustment in World Bank estimates for 2020 can be attributed mostly to a change in Iranrsquos GDP growth which was raised from a contraction of 45 percent in October 2020 forecasts to modest growth of 17 percent Nevertheless this regional growth estimate is 64 percentage points lower than the pre-pandemic growth forecast published in October 2019 (see Panel A Appendix Table B2) The downgrade is arguably a measure of the cost of the pandemic in 2020 because it was the dominant development since October 2019 This amounts to 202 billion dollars
World Bank economists forecast the regionrsquos real output to grow at a modest 22 percent in 2021 This is 03 percent higher than the forecast released in October 2020 (see Panel B of Appendix Table B2) on the back of a faster than expected recovery in oil prices7
Nevertheless the accumulated GDP losses due to the pandemic are substantial By 2021 the regional economy is forecast to be 72 percent below the no-pandemic counterfactual GDP level equivalent to 227 billion dollars (see Figure I2)
GDP per capita is arguably a more precise statistic of the regionrsquos standard of living than GDP The regionrsquos average real GDP per capita is estimated to decline 53 percent in 2020 The regionrsquos average real GDP per capita is forecast to increase by a meagre 06 percent in 2021 All in all the regionrsquos real GDP per capita in 2021 would be 47 percent below the level in 2019
Heavy GDP losses are observed across all MENA country groups The GDP level in 2021 for developing oil importers is forecast to be 93 percent below the counterfactual GDP level without the pandemic (see Figure I2) The counterfactual decline for
7 In October 2020 World Bank economists forecast the regionrsquos economic growth in 2021 at 19 percent
MIDDLE EAST AND NORTH AFRICA REgION ECONOMIC UPDATE APRIL 2021
10
C H A P T E R I A C O N T I N U I N g C R I S I S
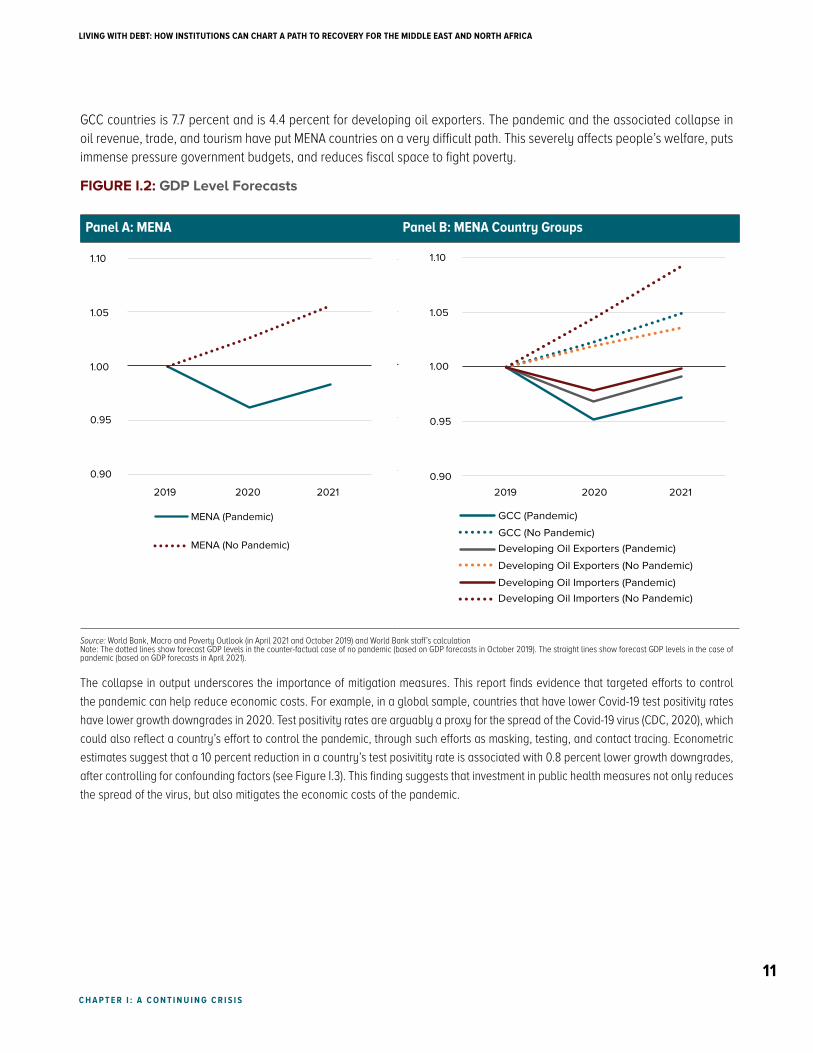
GCC countries is 77 percent and is 44 percent for developing oil exporters The pandemic and the associated collapse in oil revenue trade and tourism have put MENA countries on a very difficult path This severely affects peoplersquos welfare puts immense pressure government budgets and reduces fiscal space to fight poverty
FIGURE I2 GDP Level Forecasts
Panel A MENA Panel B MENA Country groups
090
095
100
105
110
2019 2020 2021
GCC (Pandemic)
GCC (No Pandemic)Developing Oil Exporters (Pandemic)
Developing Oil Exporters (No Pandemic)
Developing Oil Importers (Pandemic)Developing Oil Importers (No Pandemic)
090
095
100
105
110
2019 2020 2021
MENA (Pandemic)
MENA (No Pandemic)
090
095
100
105
110
2019 2020 2021
GCC (Pandemic)
GCC (No Pandemic)Developing Oil Exporters (Pandemic)
Developing Oil Exporters (No Pandemic)
Developing Oil Importers (Pandemic)Developing Oil Importers (No Pandemic)
090
095
100
105
110
2019 2020 2021
MENA (Pandemic)
MENA (No Pandemic)
Source World Bank Macro and Poverty Outlook (in April 2021 and October 2019) and World Bank staffrsquos calculationNote The dotted lines show forecast GDP levels in the counter-factual case of no pandemic (based on GDP forecasts in October 2019) The straight lines show forecast GDP levels in the case of pandemic (based on GDP forecasts in April 2021)
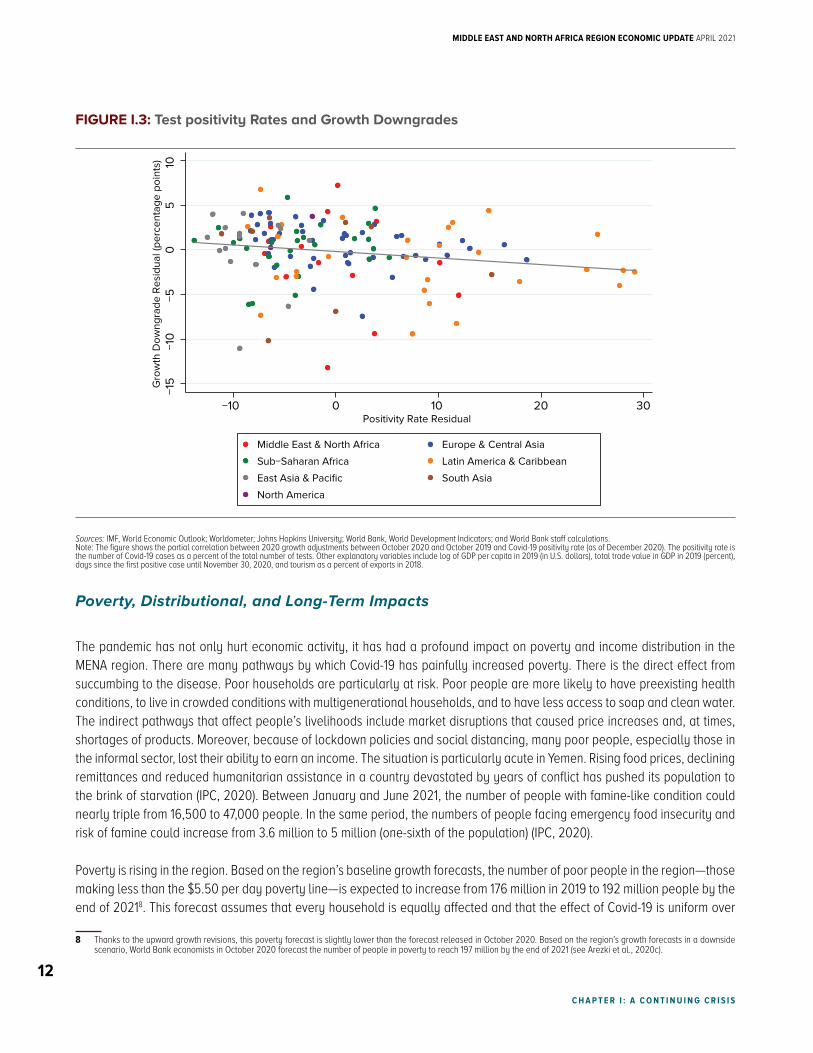
The collapse in output underscores the importance of mitigation measures This report finds evidence that targeted efforts to control
the pandemic can help reduce economic costs For example in a global sample countries that have lower Covid-19 test positivity rates
have lower growth downgrades in 2020 Test positivity rates are arguably a proxy for the spread of the Covid-19 virus (CDC 2020) which
could also reflect a countryrsquos effort to control the pandemic through such efforts as masking testing and contact tracing Econometric
estimates suggest that a 10 percent reduction in a countryrsquos test posivitity rate is associated with 08 percent lower growth downgrades
after controlling for confounding factors (see Figure I3) This finding suggests that investment in public health measures not only reduces
the spread of the virus but also mitigates the economic costs of the pandemic
LIVINg wITH DEBT HOw INSTITUTIONS CAN CHART A PATH TO RECOVERY FOR THE MIDDLE EAST AND NORTH AFRICA
11
C H A P T E R I A C O N T I N U I N g C R I S I S
FIGURE I3 Test positivity Rates and Growth Downgrades
minus15
minus10
minus50
510
Gro
wth
Dow
ngra
de R
esid
ual (
perc
enta
ge p
oint
s)
minus10 0 10 20 30Positivity Rate Residual
Middle East amp North Africa Europe amp Central Asia
SubminusSaharan Africa Latin America amp Caribbean
East Asia amp Pacific South Asia
North America
Sources IMF World Economic Outlook Worldometer Johns Hopkins University World Bank World Development Indicators and World Bank staff calculationsNote The figure shows the partial correlation between 2020 growth adjustments between October 2020 and October 2019 and Covid-19 positivity rate (as of December 2020) The positivity rate is the number of Covid-19 cases as a percent of the total number of tests Other explanatory variables include log of GDP per capita in 2019 (in US dollars) total trade value in GDP in 2019 (percent) days since the first positive case until November 30 2020 and tourism as a percent of exports in 2018
Poverty Distributional and Long-Term Impacts
The pandemic has not only hurt economic activity it has had a profound impact on poverty and income distribution in the MENA region There are many pathways by which Covid-19 has painfully increased poverty There is the direct effect from succumbing to the disease Poor households are particularly at risk Poor people are more likely to have preexisting health conditions to live in crowded conditions with multigenerational households and to have less access to soap and clean water The indirect pathways that affect peoplersquos livelihoods include market disruptions that caused price increases and at times shortages of products Moreover because of lockdown policies and social distancing many poor people especially those in the informal sector lost their ability to earn an income The situation is particularly acute in Yemen Rising food prices declining remittances and reduced humanitarian assistance in a country devastated by years of conflict has pushed its population to the brink of starvation (IPC 2020) Between January and June 2021 the number of people with famine-like condition could nearly triple from 16500 to 47000 people In the same period the numbers of people facing emergency food insecurity and risk of famine could increase from 36 million to 5 million (one-sixth of the population) (IPC 2020)
Poverty is rising in the region Based on the regionrsquos baseline growth forecasts the number of poor people in the regionmdashthose making less than the $550 per day poverty linemdashis expected to increase from 176 million in 2019 to 192 million people by the end of 20218 This forecast assumes that every household is equally affected and that the effect of Covid-19 is uniform over
8 Thanks to the upward growth revisions this poverty forecast is slightly lower than the forecast released in October 2020 Based on the regionrsquos growth forecasts in a downside scenario World Bank economists in October 2020 forecast the number of people in poverty to reach 197 million by the end of 2021 (see Arezki et al 2020c)
MIDDLE EAST AND NORTH AFRICA REgION ECONOMIC UPDATE APRIL 2021
12
time In reality evidence from phone surveys in the first half of 2020 reported in Arezki et al (2020c) strongly suggests that the poor were hit harder They are more likely to have stopped working to have lost income and to have reduced consumption Furthermore in countries with high food-price inflation such as in Yemen but also in Lebanon the distributional impacts have been even more severe because food inflation is regressive It is likely then that far more than the forecasted 192 million people will be in poverty
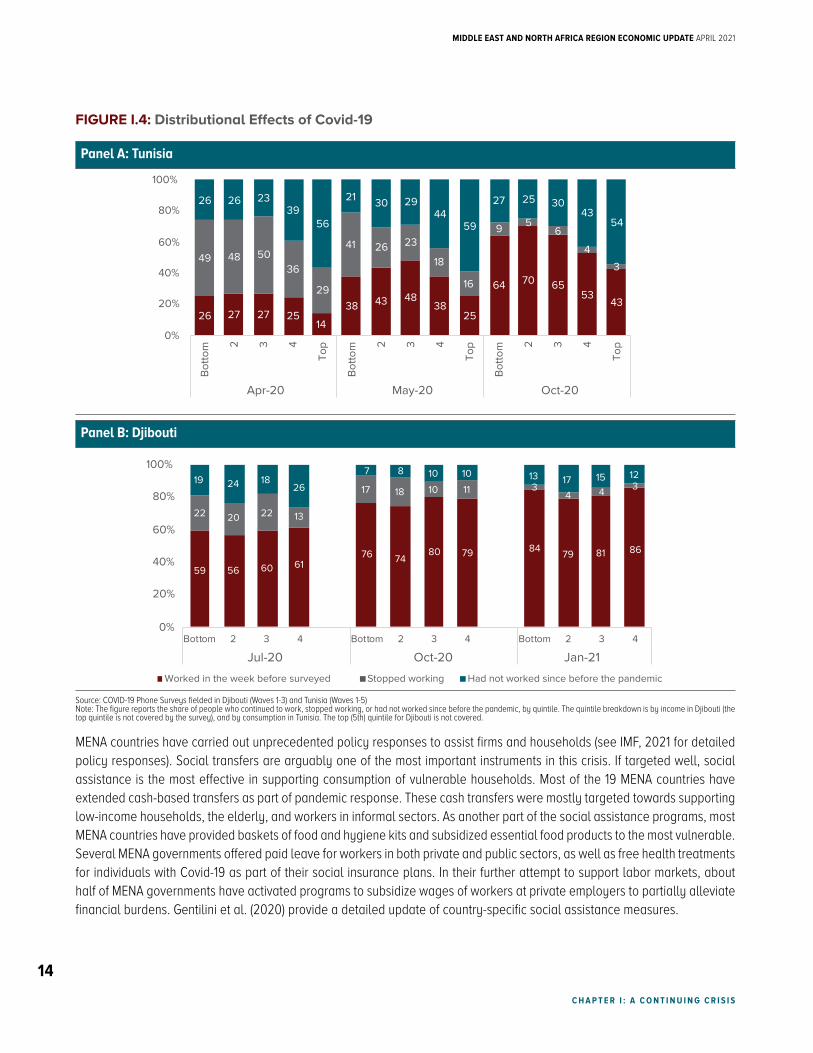
Several rounds of phone surveys conducted recently in Tunisia and Djibouti allow us to observe the recovery of the labor market after the initial months of the pandemic In both countries the impact of the pandemic was dramatic during the first surveys but was more moderate during subsequent ones (see Figure I4) In the first wave of the survey (in April 2020 for Tunisia and July 2020 for Djibouti) a large share of respondents in both countries reported that they had stopped working Poor households were more likely to lose jobs than less-poor households This is clearer in Tunisia where 49 percent of the bottom quintile reportedly stopped working while only 29 percent of the top quintile did so In subsequent surveys the percentage of respondents reportedly without work gradually declined In the most recent surveys (in October 2020 for Tunisia and Jan 2021 for Djibouti) the fraction of people that reported having stopped working was smaller than during the first surveys
Nonetheless it is probably premature to conclude that a labor market recovery is well underway First even in the latest surveys in Tunisia and Djibouti there is evidence of lingering job losses Second the epidemic is still raging and thus it is difficult to conclude that any job gains relative to earlier in 2020 will be long lasting It is possible that if the spread of Covid-19 continues in these countries job losses could continue to accumulate Third the available evidence is silent with respect to wages or income Hence some jobs might have temporarily come back but we do not know for how long or at what income level
Regardless of the timing of the recovery much of the impact of the pandemic unfortunately could be felt for decades to come Disruption in core health services drops in household income school closures and persistent unemployment will likely carry long term costs in terms of slower human capital accumulation (Corral and Gatti 2020) Simulations conducted with the Human Capital Index indicated that without concerted remediation school closures alone which at the height of the pandemic affected 16bn children worldwide (Azevedo et al 2020) are likely to be associated with a drop in human capital for the cohort of children currently in school by 5 This is the same order of magnitude of the average global gains in human capital in the past decade (World Bank 2020c)
C H A P T E R I A C O N T I N U I N g C R I S I S
LIVINg wITH DEBT HOw INSTITUTIONS CAN CHART A PATH TO RECOVERY FOR THE MIDDLE EAST AND NORTH AFRICA
13
C H A P T E R I A C O N T I N U I N g C R I S I S
FIGURE I4 Distributional Effects of Covid-19
Panel A Tunisia
0
20
40
60
80
100
Bot
tom 2 3 4
Top
Bot
tom 2 3 4
Top
Bot
tom 2 3 4
Top
Apr-20 May-20 Oct-20
Bottom 2 3 4 Bottom 2 3 4 Bottom 2 3 4
Jul-20 Oct-20 Jan-21
Worked in the week before surveyed Stopped working Had not worked since before the pandemic
0
20
40
60
80
100
26 27 27 2514
38 43 4838
25
64 70 6553
43
49 48 5036
29
41 26 23
18
16
9 56
4
3
26 26 2339
56
21 30 2944
59
27 25 3043
54
59 56 60 6176 74
80 79 84 79 81 86
22 20 22 13
17 18 10 11 34 4 3
19 24 1826
7 8 10 10 13 17 15 12Panel B Djibouti
0
20
40
60
80
100B
otto
m 2 3 4
Top
Bot
tom 2 3 4
Top
Bot
tom 2 3 4
Top
Apr-20 May-20 Oct-20
Bottom 2 3 4 Bottom 2 3 4 Bottom 2 3 4
Jul-20 Oct-20 Jan-21
Worked in the week before surveyed Stopped working Had not worked since before the pandemic
0
20
40
60
80
100
26 27 27 2514
38 43 4838
25
64 70 6553
43
49 48 5036
29
41 26 23
18
16
9 56
4
3
26 26 2339
56
21 30 2944
59
27 25 3043
54
59 56 60 6176 74
80 79 84 79 81 86
22 20 22 13
17 18 10 11 34 4 3
19 24 1826
7 8 10 10 13 17 15 12
Source COVID-19 Phone Surveys fielded in Djibouti (Waves 1-3) and Tunisia (Waves 1-5)Note The figure reports the share of people who continued to work stopped working or had not worked since before the pandemic by quintile The quintile breakdown is by income in Djibouti (the top quintile is not covered by the survey) and by consumption in Tunisia The top (5th) quintile for Djibouti is not covered
MENA countries have carried out unprecedented policy responses to assist firms and households (see IMF 2021 for detailed policy responses) Social transfers are arguably one of the most important instruments in this crisis If targeted well social assistance is the most effective in supporting consumption of vulnerable households Most of the 19 MENA countries have extended cash-based transfers as part of pandemic response These cash transfers were mostly targeted towards supporting low-income households the elderly and workers in informal sectors As another part of the social assistance programs most MENA countries have provided baskets of food and hygiene kits and subsidized essential food products to the most vulnerable Several MENA governments offered paid leave for workers in both private and public sectors as well as free health treatments for individuals with Covid-19 as part of their social insurance plans In their further attempt to support labor markets about half of MENA governments have activated programs to subsidize wages of workers at private employers to partially alleviate financial burdens Gentilini et al (2020) provide a detailed update of country-specific social assistance measures
MIDDLE EAST AND NORTH AFRICA REgION ECONOMIC UPDATE APRIL 2021
14
C H A P T E R I A C O N T I N U I N g C R I S I S
Available data from early MENA phone surveys suggest that cash transfers are reasonably well targeted with much larger fractions of the poorest households being recipients than of households at the top of the distribution Nevertheless most of the poor households were not reached (Arezki et al 2020c) Targeted cash transfers even when targeting is imperfect tend to be ldquoprogressiverdquo that is they disproportionately benefit the poor (see Joumard et al (2012) for evidence in the OECD) This is because targeted cash transfers are more likely to reach poorer households and because the same amount of cash is more meaningful to poorer recipients than those that are better off In times of crisis imperfect targeting is expected because many countries in the region did not have in place well tested mechanisms that could ensure that benefits went to the intended recipients In the medium term refining targeting mechanisms including through strengthened social registries will remain an important element of the regional development policy agenda Morocco has made good progress in setting up a digital registry with World Bank support (World Bank 2016) Without a good transfer targeting mechanism in place countries may have to resort to less targeted measures such as subsidizing fuel or increasing public wages Caution is warranted against subsidizing fuel or increasing public wages as a temporary support to households These measures may end up supporting more well-off households incur substantial budget costs and in the case of fuel subsidies increase environmental costs9
Fiscal Balances and Public Debt
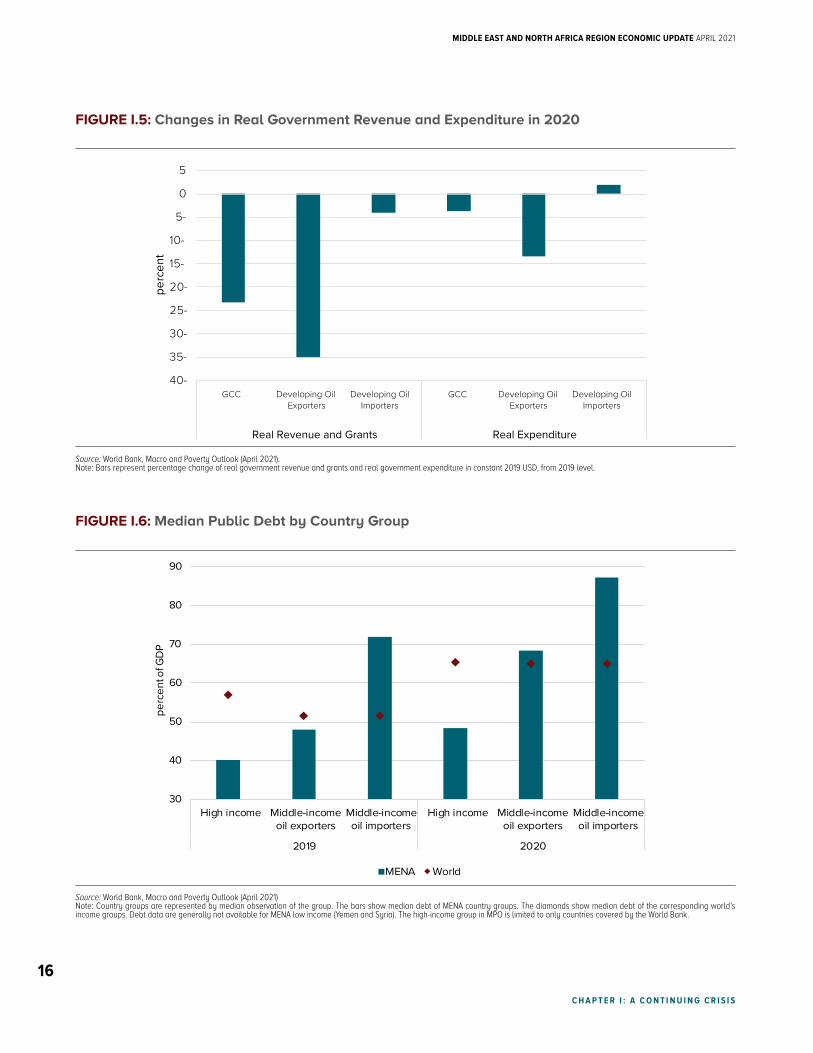
This section is dedicated to the analyses of fiscal balance and public debt the focus of the report The MENA region entered the Covid-19 crisis with chronic low growth macroeconomic imbalances (Arezki et al 2019) and weak governance especially when it comes to transparency (Arezki et al 2020b) The pandemic has put tremendous pressure on government fiscal positions Real government revenue in 2020 is 24 percent less than in 2019 The sharpest declines were among the GCC and developing oil exporters not surprising given the oil price collapse (see Figure I5) Squeezed by declining revenue government expenditure in the MENA also dropped compared to pre-pandemic expectations The expenditure decline is smaller than the revenue fall-off which reflects pressing demands to spend on policy responses to the pandemic As a consequence the regionrsquos average fiscal deficit in 2020 is estimated to be around 94 percent of GDP (see Appendix Table B1) compared to the pre-pandemic forecast deficit of 46 percent MENA countries have had to borrow to finance the deficits The pandemic is estimated to increase the regionrsquos public debt to about 54 percent of GDP in 2020 accelerating the rise in public debt during the past decade The increases are observed across MENA country groups (see Figure I6)
9 Targeted cash transfers are arguably more progressive than previous tools used to assist the poor Fuel subsidies for example tend to disproportionately benefit richer households given their substantial fuel consumption (see Del Granado et al 2012 for a cross-country study and World Bank (2019) for a detailed study on Egypt)
LIVINg wITH DEBT HOw INSTITUTIONS CAN CHART A PATH TO RECOVERY FOR THE MIDDLE EAST AND NORTH AFRICA
15
C H A P T E R I A C O N T I N U I N g C R I S I S
FIGURE I5 Changes in Real Government Revenue and Expenditure in 2020
40-
35-
30-
25-
20-
15-
10-
5-
0
5pe
rcen
t
GCC Developing OilExporters
Developing OilImporters
GCC Developing OilExporters
Developing OilImporters
Real Revenue and Grants Real Expenditure
Source World Bank Macro and Poverty Outlook (April 2021)Note Bars represent percentage change of real government revenue and grants and real government expenditure in constant 2019 USD from 2019 level
FIGURE I6 Median Public Debt by Country Group
30
40
50
60
70
80
90
High income Middle-incomeoil exporters
Middle-incomeoil importers
High income Middle-incomeoil exporters
Middle-incomeoil importers
2019 2020
perc
ent o
f GD
P
WorldMENA
Source World Bank Macro and Poverty Outlook (April 2021)Note Country groups are represented by median observation of the group The bars show median debt of MENA country groups The diamonds show median debt of the corresponding worldrsquos income groups Debt data are generally not available for MENA low income (Yemen and Syria) The high-income group in MPO is limited to only countries covered by the World Bank
MIDDLE EAST AND NORTH AFRICA REgION ECONOMIC UPDATE APRIL 2021
16
C H A P T E R I A C O N T I N U I N g C R I S I S
Before the pandemic many MENA countries had large public debt positions relative to peers in the same income groups outside the region (see Figure I6 for country group medians and Appendix Table B3 for country-specific debt data) Many of them are oil importers although GCC countries Bahrain and Oman are two notable high-income oil exporters with a large stock of public debt
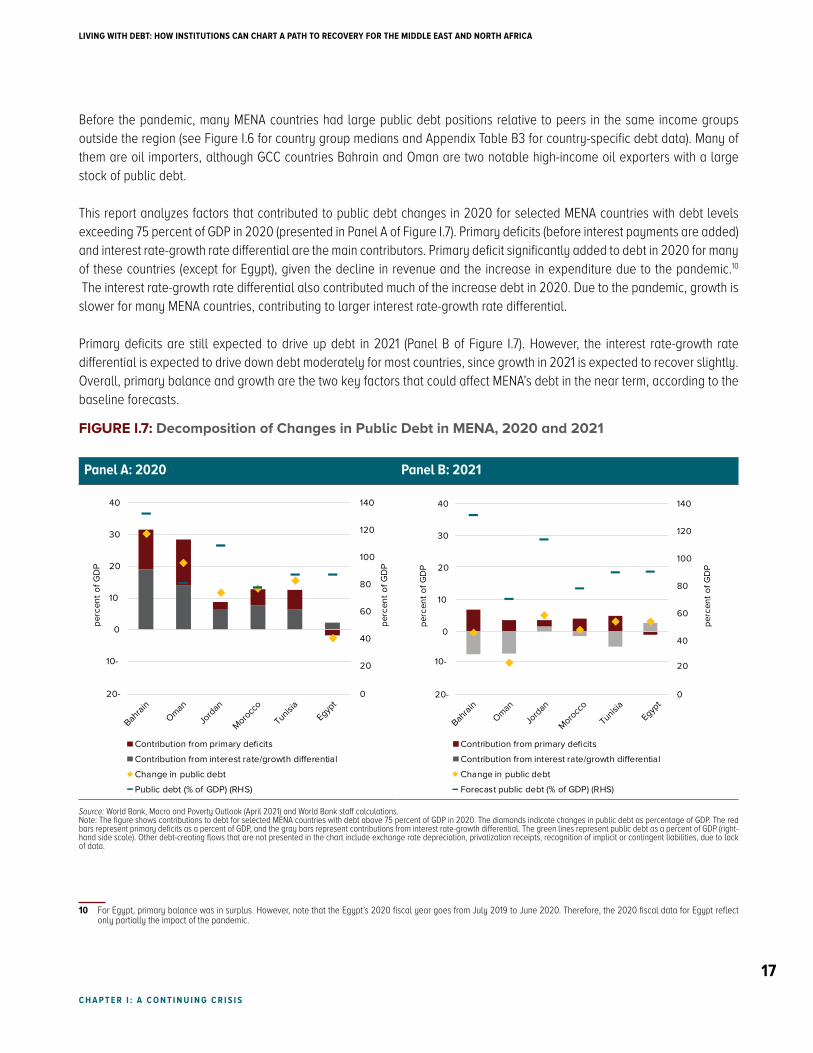
This report analyzes factors that contributed to public debt changes in 2020 for selected MENA countries with debt levels exceeding 75 percent of GDP in 2020 (presented in Panel A of Figure I7) Primary deficits (before interest payments are added) and interest rate-growth rate differential are the main contributors Primary deficit significantly added to debt in 2020 for many of these countries (except for Egypt) given the decline in revenue and the increase in expenditure due to the pandemic10
The interest rate-growth rate differential also contributed much of the increase debt in 2020 Due to the pandemic growth is slower for many MENA countries contributing to larger interest rate-growth rate differential
Primary deficits are still expected to drive up debt in 2021 (Panel B of Figure I7) However the interest rate-growth rate differential is expected to drive down debt moderately for most countries since growth in 2021 is expected to recover slightly Overall primary balance and growth are the two key factors that could affect MENArsquos debt in the near term according to the baseline forecasts
FIGURE I7 Decomposition of Changes in Public Debt in MENA 2020 and 2021
Panel A 2020 Panel B 2021
0
20
40
60
80
100
120
140
20-
10-
0
10
20
30
40
Contribution from primary deficits
Contribution from interest rategrowth dierential
Change in public debt
Public debt ( of GDP) (RHS)
perc
ent o
f GD
P
0
20
40
60
80
100
120
140
20-
10-
0
10
20
30
40
Contribution from primary deficits
Contribution from interest rategrowth dierential
Change in public debt
Forecast public debt ( of GDP) (RHS)
perc
ent o
f GD
P
perc
ent o
f GD
P
perc
ent o
f GD
P
Bahrai
nOman
Jord
an
Morocc
o
Tunisia
Egypt
Bahrai
nOman
Jord
an
Morocc
o
Tunisia
Egypt
0
20
40
60
80
100
120
140
20-
10-
0
10
20
30
40
Contribution from primary deficits
Contribution from interest rategrowth dierential
Change in public debt
Public debt ( of GDP) (RHS)
perc
ent o
f GD
P
0
20
40
60
80
100
120
140
20-
10-
0
10
20
30
40
Contribution from primary deficits
Contribution from interest rategrowth dierential
Change in public debt
Forecast public debt ( of GDP) (RHS)
perc
ent o
f GD
P
perc
ent o
f GD
P
perc
ent o
f GD
P
Bahrai
nOman
Jord
an
Morocc
o
Tunisia
Egypt
Bahrai
nOman
Jord
an
Morocc
o
Tunisia
Egypt
Source World Bank Macro and Poverty Outlook (April 2021) and World Bank staff calculationsNote The figure shows contributions to debt for selected MENA countries with debt above 75 percent of GDP in 2020 The diamonds indicate changes in public debt as percentage of GDP The red bars represent primary deficits as a percent of GDP and the gray bars represent contributions from interest rate-growth differential The green lines represent public debt as a percent of GDP (right-hand side scale) Other debt-creating flows that are not presented in the chart include exchange rate depreciation privatization receipts recognition of implicit or contingent liabilities due to lack of data
10 For Egypt primary balance was in surplus However note that the Egyptrsquos 2020 fiscal year goes from July 2019 to June 2020 Therefore the 2020 fiscal data for Egypt reflect only partially the impact of the pandemic
LIVINg wITH DEBT HOw INSTITUTIONS CAN CHART A PATH TO RECOVERY FOR THE MIDDLE EAST AND NORTH AFRICA
17
C H A P T E R I A C O N T I N U I N g C R I S I S
MENArsquos Creditworthiness
Given the debt trends described above it is worth asking if a rebound in the global price of oil will help MENA countries This is an important question due to the salient role played by oil prices for both oil-exporters and importers The regions creditworthiness could be affected by oil-price fluctuations And creditworthiness matters for debt First lenders would factor the probability of default into their computation of interest rates Therefore a deterioration in creditworthiness could contribute to rising interest rates and as a result increase the debt-to-GDP ratio In turn high and increasing debt could jeopardize creditworthiness especially in turbulent times creating a vicious cycle between countryrsquos creditworthiness and its debt level
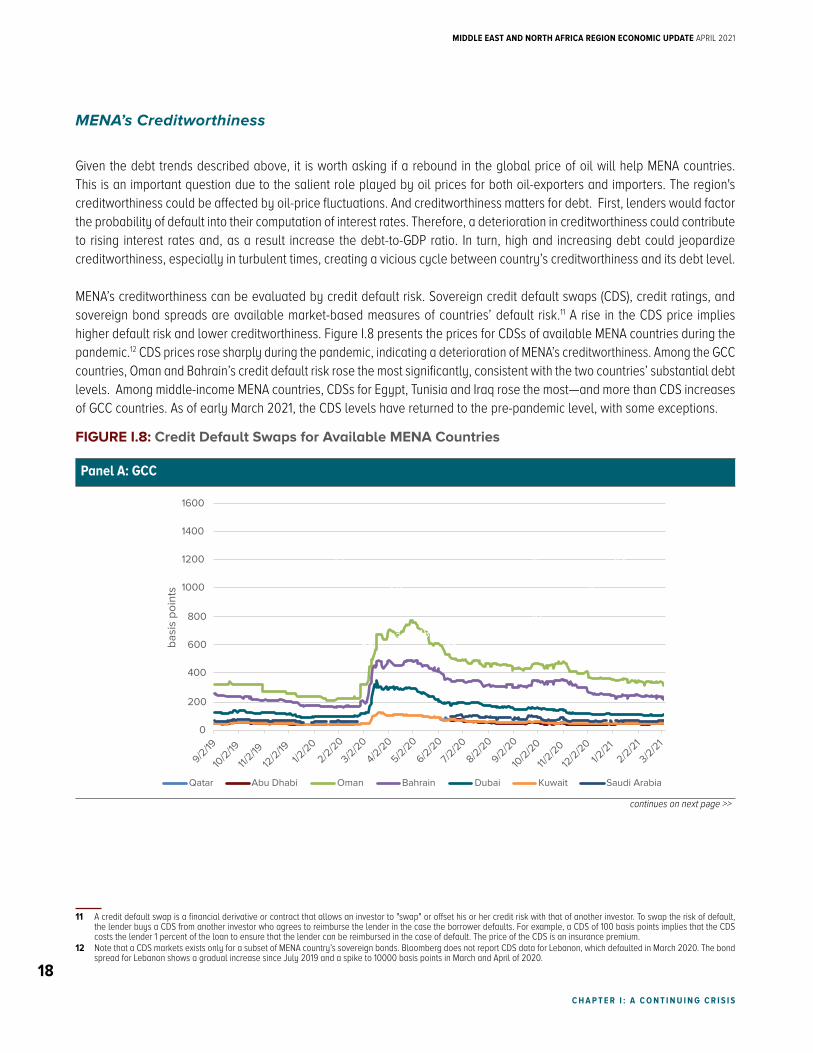
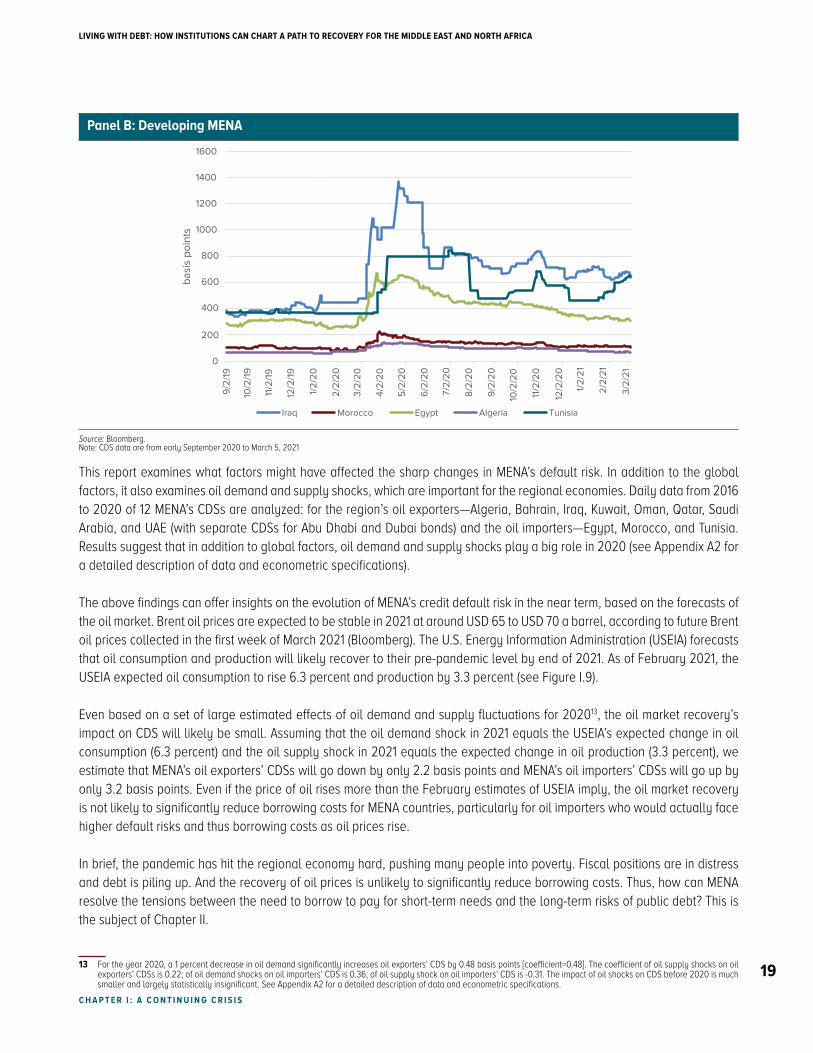
MENArsquos creditworthiness can be evaluated by credit default risk Sovereign credit default swaps (CDS) credit ratings and sovereign bond spreads are available market-based measures of countriesrsquo default risk11 A rise in the CDS price implies higher default risk and lower creditworthiness Figure I8 presents the prices for CDSs of available MENA countries during the pandemic12 CDS prices rose sharply during the pandemic indicating a deterioration of MENArsquos creditworthiness Among the GCC countries Oman and Bahrainrsquos credit default risk rose the most significantly consistent with the two countriesrsquo substantial debt levels Among middle-income MENA countries CDSs for Egypt Tunisia and Iraq rose the mostmdashand more than CDS increases of GCC countries As of early March 2021 the CDS levels have returned to the pre-pandemic level with some exceptions
FIGURE I8 Credit Default Swaps for Available MENA Countries
Panel A gCC
0
200
400
600
800
1000
1200
1400
1600
9219
102
19
11219
122
1912
20
222
0
322
0
422
0
522
0
622
0
722
0
822
0
922
0
102
20
1122
0
122
20
122
1
222
1
322
1
basi
s po
ints
Qatar Abu Dhabi Oman Bahrain Dubai Kuwait Saudi Arabia
0
200
400
600
800
1000
1200
1400
1600
92
19
102
19
112
19
122
19
12
20
22
20
32
20
42
20
52
20
62
20
72
20
82
20
92
20
102
20
112
20
122
20
12
21
22
21
32
21
basi
s po
ints
Iraq Morocco Egypt Algeria Tunisia
26 27 27 2514
38 43 4838
25
64 70 6553
43
49 48 5036
29
41 26 23
18
16
9 56
4
3
26 26 2339
56
21 30 2944
59
27 25 3043
54
59 56 60 6176 74 80 79 84 79 81 86
22 20 22 13
17 18 10 11 3 4 4 319 24 18 267 8 10 10 13 17 15 12
11 A credit default swap is a financial derivative or contract that allows an investor to swap or offset his or her credit risk with that of another investor To swap the risk of default the lender buys a CDS from another investor who agrees to reimburse the lender in the case the borrower defaults For example a CDS of 100 basis points implies that the CDS costs the lender 1 percent of the loan to ensure that the lender can be reimbursed in the case of default The price of the CDS is an insurance premium
12 Note that a CDS markets exists only for a subset of MENA countryrsquos sovereign bonds Bloomberg does not report CDS data for Lebanon which defaulted in March 2020 The bond spread for Lebanon shows a gradual increase since July 2019 and a spike to 10000 basis points in March and April of 2020
continues on next page gtgt
MIDDLE EAST AND NORTH AFRICA REgION ECONOMIC UPDATE APRIL 2021
18
C H A P T E R I A C O N T I N U I N g C R I S I S
Panel B Developing MENA
0
200
400
600
800
1000
1200
1400
1600
9219
102
19
11219
122
1912
20
222
0
322
0
422
0
522
0
622
0
722
0
822
0
922
0
102
20
1122
0
122
20
122
1
222
1
322
1
basi
s po
ints
Qatar Abu Dhabi Oman Bahrain Dubai Kuwait Saudi Arabia
0
200
400
600
800
1000
1200
1400
1600
92
19
102
19
112
19
122
19
12
20
22
20
32
20
42
20
52
20
62
20
72
20
82
20
92
20
102
20
112
20
122
20
12
21
22
21
32
21
basi
s po
ints
Iraq Morocco Egypt Algeria Tunisia
26 27 27 2514
38 43 4838
25
64 70 6553
43
49 48 5036
29
41 26 23
18
16
9 56
4
3
26 26 2339
56
21 30 2944
59
27 25 3043
54
59 56 60 6176 74 80 79 84 79 81 86
22 20 22 13
17 18 10 11 3 4 4 319 24 18 267 8 10 10 13 17 15 12
Source Bloomberg Note CDS data are from early September 2020 to March 5 2021
This report examines what factors might have affected the sharp changes in MENArsquos default risk In addition to the global factors it also examines oil demand and supply shocks which are important for the regional economies Daily data from 2016 to 2020 of 12 MENArsquos CDSs are analyzed for the regionrsquos oil exportersmdashAlgeria Bahrain Iraq Kuwait Oman Qatar Saudi Arabia and UAE (with separate CDSs for Abu Dhabi and Dubai bonds) and the oil importersmdashEgypt Morocco and Tunisia Results suggest that in addition to global factors oil demand and supply shocks play a big role in 2020 (see Appendix A2 for a detailed description of data and econometric specifications)
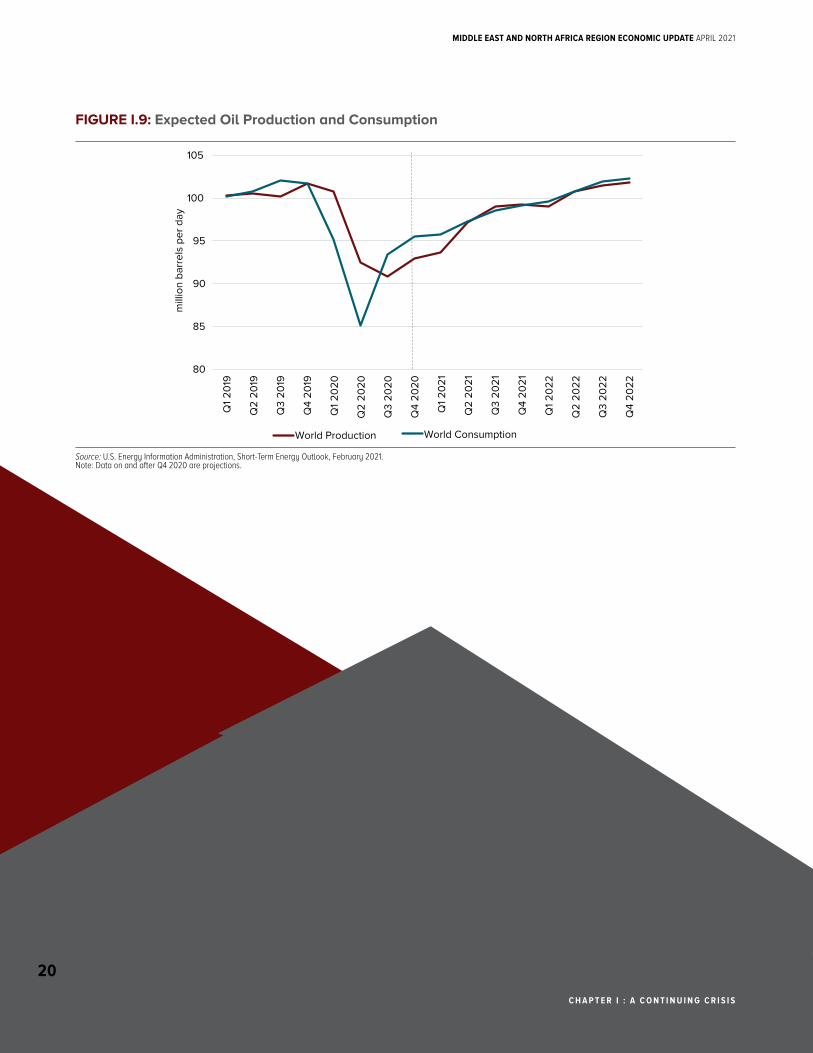
The above findings can offer insights on the evolution of MENArsquos credit default risk in the near term based on the forecasts of the oil market Brent oil prices are expected to be stable in 2021 at around USD 65 to USD 70 a barrel according to future Brent oil prices collected in the first week of March 2021 (Bloomberg) The US Energy Information Administration (USEIA) forecasts that oil consumption and production will likely recover to their pre-pandemic level by end of 2021 As of February 2021 the USEIA expected oil consumption to rise 63 percent and production by 33 percent (see Figure I9)
Even based on a set of large estimated effects of oil demand and supply fluctuations for 202013 the oil market recoveryrsquos impact on CDS will likely be small Assuming that the oil demand shock in 2021 equals the USEIArsquos expected change in oil consumption (63 percent) and the oil supply shock in 2021 equals the expected change in oil production (33 percent) we estimate that MENArsquos oil exportersrsquo CDSs will go down by only 22 basis points and MENArsquos oil importersrsquo CDSs will go up by only 32 basis points Even if the price of oil rises more than the February estimates of USEIA imply the oil market recovery is not likely to significantly reduce borrowing costs for MENA countries particularly for oil importers who would actually face higher default risks and thus borrowing costs as oil prices rise
In brief the pandemic has hit the regional economy hard pushing many people into poverty Fiscal positions are in distress and debt is piling up And the recovery of oil prices is unlikely to significantly reduce borrowing costs Thus how can MENA resolve the tensions between the need to borrow to pay for short-term needs and the long-term risks of public debt This is the subject of Chapter II
13 For the year 2020 a 1 percent decrease in oil demand significantly increases oil exportersrsquo CDS by 048 basis points [coefficient=048] The coefficient of oil supply shocks on oil exportersrsquo CDSs is 022 of oil demand shocks on oil importersrsquo CDS is 036 of oil supply shock on oil importersrsquo CDS is -031 The impact of oil shocks on CDS before 2020 is much smaller and largely statistically insignificant See Appendix A2 for a detailed description of data and econometric specifications
LIVINg wITH DEBT HOw INSTITUTIONS CAN CHART A PATH TO RECOVERY FOR THE MIDDLE EAST AND NORTH AFRICA
19
C H A P T E R I I H O w I N S T I T U T I O N S C A N C H A R T A PAT H T O R E C O V E R Y F O R T H E M I D D L E E A S T A N D N O R T H A F R I C A
FIGURE I9 Expected Oil Production and Consumption
80
85
90
95
100
105
Q1
2019
Q2
2019
Q3
2019
Q4
2019
Q1
2020
Q2
2020
Q3
2020
Q4
2020
Q1
2021
Q2
2021
Q3
2021
Q4
2021
Q1
2022
Q2
2022
Q3
2022
Q4
2022
mill
ion
barr
els
per d
ay
World Production World Consumption
Source US Energy Information Administration Short-Term Energy Outlook February 2021Note Data on and after Q4 2020 are projections
C H A P T E R I A C O N T I N U I N g C R I S I S
MIDDLE EAST AND NORTH AFRICA REgION ECONOMIC UPDATE APRIL 2021
20
C H A P T E R I I H O w I N S T I T U T I O N S C A N C H A R T A PAT H T O R E C O V E R Y F O R T H E M I D D L E E A S T A N D N O R T H A F R I C A
CHAPTER II How Institutions Can Chart a Path to Recovery for the Middle East and North Africa
CHAPTER II TAKEAWAYS
bull As MENA suffers the economic consequences of the pandemic most countries will face tensions between
short-term needs and the long-term risks of debt-financed government spending
bull During the pandemic fiscal spending is best used to support vulnerable families and invest in public
healthmdashsuch as disease surveillance data transparency and vaccinations
bull As the pandemic subsides some MENA countries with characteristics associated with ineffective fiscal
stimulus can consider thoughtful consolidation early during the recovery such as identifying and reducing
low-return spending items
bull Governance and transparency can help during and immediately after the pandemic as well as in the
longer term by reducing borrowing costs and accelerating growth
The pandemic is forcing economies in the MENA region to borrow a lot While addressing the immediate concerns of the pandemic is paramount prudence requires economies in the region to assess the consequences of building up debt This chapter takes stock of recent research and debates in the economics profession about debt and debt accumulation and applies it to the latest data available for the region
II1 Tensions between Short-run Needs and Long-run Costs of Debt-financed Spending
The Short-run Needs
Public debt can alleviate short-run financial constraints allowing governments to increase or maintain public consumption and investment14 Governments especially in developing countries have many pressing spending options with potentially high returns but may lack the resources to finance these activities Public debt provides those financial resources Theoretically if the economic social and environmental return on government spending exceeds the interest rate paid on the debt it makes sense for governments to finance spending through debt15 In principle governments via taxation can collect a portion of the total social return to pay back the debt that helps finance spending As productivity increases over time future generations are
14 Taxes are generally not a substitute for public debt Only in a world of perfect foresight perfect capital markets and economic agents with infinite horizons (called Ricardian-Equivalence by economists) can debt-financing and tax-financing of government spending have equivalent economic effects (Barro 1974) That is because in such a world people recognize that the debt will have to be repaid and set aside funds for future taxes In reality the proposition of perfect Ricardian equivalence is generally rejected (see Poterba and Summers 1987) Therefore debt-financed government spending can be more effective than tax-financed government spending because people do not fully consider the associated future tax liabilities of current borrowing In addition taxes are distortionary which provides another rationale for relying on borrowing it keeps tax rates constant (Barro 1979)
15 For examples investing in early education and in reducing air pollution have been shown to have very large benefit-cost ratios (see Heckman et al 2010 and USEPA 2011)
LIVINg wITH DEBT HOw INSTITUTIONS CAN CHART A PATH TO RECOVERY FOR THE MIDDLE EAST AND NORTH AFRICA
21
C H A P T E R I I H O w I N S T I T U T I O N S C A N C H A R T A PAT H T O R E C O V E R Y F O R T H E M I D D L E E A S T A N D N O R T H A F R I C A
likely better off than older generations Since public debt is akin to borrowing from tomorrow it allows smoothing resources intertemporally
Spending is needed now to limit the effects of the pandemic in the MENA region This includes transfers to support the consumption of hardest hit families and health spending to cover testing treatment and vaccination As the pandemic subsides fiscal authorities must decide whether additional fiscal stimulus is warranted to raise aggregate demand to accelerate the recovery
The Covid-19 pandemic is similar to a natural disaster such as earthquakes and floods in fundamental ways that are relevant to understanding analytically how public debt and economic growth interact Both pandemic and natural disasters are rare and unexpected occurrences and neither are directly caused by economic policies Both result in economic contractions because people are unable to work (due to physical destruction or safety concerns) Given these similarities this report examines trends in public debt and growth that occur around severe natural disasters to gain insights into how debt-financed fiscal expenditures can help the recovery of economies afflicted by disastersmdashand by analogy pandemics In developing countries after large natural disasters public debt does tend to rise to finance economic recovery (see Figure II1) During the three years following a large natural disaster growth in public debt is significantly higher than in countries that did not experience a disaster Real (adjusted for inflation) GDP growth collapses in the year of a natural disaster but is statistically significantly higher than the baseline growth two years later This finding provides an important empirical regularity that public debt does accumulate after disasters and is likely to do so after this pandemic possibly to support economic recovery
Note that the economics of armed conflicts is not the same as that of natural disasters (see Box II1) Public debt is found to increase during armed conflicts but economic growth does not pick up after them which suggests that government spending during conflicts might not be used to support economic growth
FIGURE II1 Public Debt and Output Growth around Natural Disasters
-2
-1
0
1
2
3
4
-3 -2 -1 t=0 1 2 3 GD
P gr
owth
ann
ual
Publ
ic d
ebt g
row
th a
nnua
l
Timeline around a large natural disaster years
Public debth growth annual GDP growth annual (RHS)
Sources World Bank World Development Indicators International Monetary Fund Global Debt DatabaseNote The figure displays central government public debt growth and GDP growth before during and after severe natural disasters relative to the baseline of no severe disasters Severe natural disasters are those that generate damages equivalent to at least 1 percent of the countryrsquos GDP The sample covers 324 severe natural disasters that occurred between 1960 and 2019 in 90 developing economies The disasters include floods earthquakes droughts storms landslides volcanic activities extreme temperature and wildfires The econometric framework follows a difference-in-difference approach with country and year fixed effects (see Appendix A1 for detail) Public debt growth is statistically significant at 10 percent level at t=123 GDP growth is statistically significant at 10 percent level at t=012
MIDDLE EAST AND NORTH AFRICA REgION ECONOMIC UPDATE APRIL 2021
22
C H A P T E R I I H O w I N S T I T U T I O N S C A N C H A R T A PAT H T O R E C O V E R Y F O R T H E M I D D L E E A S T A N D N O R T H A F R I C A
Box II1 Conflicts Debt and Growth
The economics of armed conflicts is different to that of natural disasters Public debt increases around armed conflicts but is probably not used to support economic growth
FIGURE BII1 Public Debt around Armed Conflicts
0
5
10
15
20
25
-5 -4 -3 -2 -1 t=0 1 2 3 4 5
Publ
ic d
ebt a
s
of G
DP
Timeline around the onset of armed conflicts years
All conflicts Severe conflicts
Source Lederman and Rojas 2018Note The figure displays the evolution of public debt of conflict countries relative to non-conflict economies before during and after armed conflicts t=0 indicates the onset of armed conflicts Severe conflicts are defined as having 1000 deaths per year at t=0 The sample includes 180 developing and developed countries (and 32 conflicts) between 1960-2015
Armed conflicts and public debt Lederman and Rojas (2018) shed light on the potentially long-lasting increases in the debt burden experienced by developing countries affected by armed conflicts The authors find that public debt in conflict-afflicted economies tends to be higher than in non-conflict economies prior to the onset of conflicts begins to rise further before conflict begins and stays high afterward (see Figure BII1) These findings suggest that developing economies experiencing conflicts finance the increased government expenditures by relying on public debt particularly after the conflict starts The weaker fiscal position under which conflict-affected countries entered the Covid-19 pandemic could severely affect not only their immediate but also their long-term ability to finance government expenditures
Armed conflicts and GDP growth The literature on the detrimental effects of conflicts on output is abundant and consistent Collier (1999) distinguishes four common routes by which armed conflicts can hurt the economy Conflicts
bull destroy physical and human capital
bull disrupt internal social dynamics
bull cause countries to divert public funds from activities that enhance output
bull contribute to dissaving which leads to economic deterioration
The magnitude of the impact of conflict on output is also estimated by economic literature Collier finds that the annual growth rate during civil wars is 22 percentage points lower than would have occurred had the war never happened Growth during the five years that follow a one-year conflict is also about 21 percentage points lower than what would have occurred had the war never happened This lack of a sustained post-conflict growth remains ldquoeven if countries successfully avoid relapsing back into conflictrdquo (Carey and Harake 2017) Armed conflict can also generate important collateral damage to the output of neighboring economies These negative spillover effects tend to amplify as the intensity of conflict increases (Murdoch and Sandler 2002 and 2004)
LIVINg wITH DEBT HOw INSTITUTIONS CAN CHART A PATH TO RECOVERY FOR THE MIDDLE EAST AND NORTH AFRICA
23
C H A P T E R I I H O w I N S T I T U T I O N S C A N C H A R T A PAT H T O R E C O V E R Y F O R T H E M I D D L E E A S T A N D N O R T H A F R I C A
The Long-Run Costs
Although public debt has an important role it also carries risks Public debt can be problematical if is used for unproductive ends More precisely if the economic and social returns to fiscal spending are lower than the realized interest rates paid for debt the debt burden relative to national income will tend to grow over time In many instances governments can be overly optimistic in their estimates of the returns to fiscal spending16 Negative shocks (such as an unexpected recession) can reduce the returns to public investment and increase realized interest rates For example the social return of infrastructure projects can be dampened in recessions when the projectsrsquo utilization declines In addition currency depreciations in bad times would inflate debt if external debt is denominated in foreign currencies In other instances governments may enact permanent spending programs based on a revenue windfall that is only temporary (Veacutegh Lederman and Bennet 2017) forcing them to continue the spending even after interest rates rise Kaminsky et al (2004) show that fiscal policy was procyclical for many developing countries although it has become more countercyclical for some of them in recent years (Frankel et al 2013)
Even when the economic and social return of fiscal spending exceeds the interest rate on debt used to finance it governments still need to be cautious about borrowing more when debt is already high As governments borrow more they may soak up available funds needed for private investment (Reinhart et al 2012) Interest rates may also rise which increases the cost of capital for the private sector Effectively the public sector may crowd out the private sector Furthermore there is also the prospect at least in the short run that an increase in debt raises expectations of future increases in tax rates to repay it which dampens present consumption and investment undermining any stimulative effect from debt-financed spending (Barro 1974)
Empirically public debt which includes both public domestic and public external debt is negatively correlated with private investment This appears to be true across MENA as shown in Figure II2 as well as for typical developing and middle-income countries This is consistent with the crowding out effects described above Note that the correlation between public debt and private investment is more negative in most MENA countries than in a typical developing country implying that the crowding out effect appears to be more severe in MENA Of course this does not mean that public debt can never reinforce private investment in some contexts In fact economic theory argues that public investment can in some instances raise private investment when it enhances the provision of public goods resulting in higher overall income in the long run
16 Frankel (2011) examines growth forecasts made by 33 official government agencies and finds that optimism bias contributes to excessive deficits More recently Beaudry and Willems (2018) find that in a sample of 189 countries optimism in real GDP growth forecasts increases the likelihood of future recessions and fiscal crises
MIDDLE EAST AND NORTH AFRICA REgION ECONOMIC UPDATE APRIL 2021
24
C H A P T E R I I H O w I N S T I T U T I O N S C A N C H A R T A PAT H T O R E C O V E R Y F O R T H E M I D D L E E A S T A N D N O R T H A F R I C A
FIGURE II2 Correlations between Public Debt Interest Payments and Private Investment
-10
-05
00
05
10
Leban
onIra
n
Jord
an
Algeria
Tunisia
Egypt
Djibouti
Developing C
ountries
Middle-Inco
me Countri
es
Correlation between public debt and private investment
Correlation between public debt and interest payments
Source World Bank Macro and Poverty Outlook (October 2020)Note Correlations are derived from public debt (percent of GDP) private fixed investment (percent of GDP) and interest payments (percent of GDP) Data are from 2000-2020 for most countries Country groups are represented by the median observation
As interest payments rise with the stock of debt they tend to increase their share in a governmentrsquos fiscal outlays Figure II2 also shows that public debt and interest payments are positively correlated for MENA countries and for a typical developing or middle-income country In two MENA countries Egypt and Lebanon interest payments have already reached around 10 percent of GDP and over 30 percent of total public expenditures in recent years (see Appendix Table B3) Such repayments may limit a governmentrsquos ability to spend on important items such as infrastructure and human capital which lowers growth prospects (Mahdavi 2004)
Elevated debt can increase vulnerability to macroeconomic volatility for several reasons As debt rises it creates fear that governments will be unable to repay resulting in a higher risk premia and therefore higher long-term real interest rates (Reinhart et al 2012) The tools at the disposal of governments such as counter-cyclical fiscal policy is also severely weakened Elevated debt reduces credit worthiness restricting access to further financing and curbing the ability of economies to roll over (that is refinance maturing) debt High levels of debt may be monetized leading to inflation currency depreciation capital flight and possibly debt or financial crises (Boskin 2020) The ongoing economic and social crisis of Lebanon after the country defaulted in March 2020 can be interpreted as a vivid example of this type of situation
At the extreme are economies that serially default Such economies may achieve a status of debt intolerance which means they are unable to take on even normal ranges of debt (Reinhart et al 2003 Reinhart and Rogoff 2009) The costs of defaulting on debt are significant for a countryrsquos trade investment flows and growth (Borensztein and Panizza 2009 Asonuma and Trebesch 2016) Defaulting on debt severely damages a countryrsquos financial systems (Reinhart et al 2003)
LIVINg wITH DEBT HOw INSTITUTIONS CAN CHART A PATH TO RECOVERY FOR THE MIDDLE EAST AND NORTH AFRICA
25
C H A P T E R I I H O w I N S T I T U T I O N S C A N C H A R T A PAT H T O R E C O V E R Y F O R T H E M I D D L E E A S T A N D N O R T H A F R I C A
Debt and Growth during 2000-2019 Evidence of Long-run Costs
Because public debt carries both costs and benefits how public debt affects economic growth is an empirical question There seem to be conceptual reasons to caution against elevated debt levels as discussed above The issue is the level of public debt that is considered ldquoelevatedrdquo Is there a common threshold across countries above which public debt accumulation hurts growth Starting from the seminal contribution of Reinhart and Rogoff (2010) many studies have investigated this relationship attempting to identify to what extent debt accumulation has a detrimental effect on GDP growth The literature seems to refute the idea of a common threshold across countries (Eberhardt and Presbitero 2015 Chudik et al 2017) But the literature does not rule out the possibility of country-specific debt thresholdsmdashincluding ones in debt intolerant countries that result in ldquoextreme duressrdquo if crossed (Reinhart et al 2003 and Reinhart and Rogoff 2009) This threshold varies by country depending on a countryrsquos default and inflation history and in debt intolerant countries may be well below a level easily managed by an advanced economy
Data suggest that countries with higher initial public debt levels in 2000 experienced lower long-run growth in GDP per capita in the following two decades (see Figure II3) The top-left panel shows that in a sample of 158 countries a median country with very high initial public debt in 2000 (that is in the high debt tercile) on average grew slower than a median country with lower initial public debt levels (in the low and medium debt terciles) in the next two decades Countries in the medium debt tercile have roughly similar average long-run growth as do countries in the low debt tercile This suggests a non-linear role of debt Nevertheless there is a great variation in average growth within each tercile For high-income economies very high initial public debt in 2000 does not seem associated with lower long-run growth which suggests that they are debt tolerant For developing and middle-income economies (the bottom panels) the association between high initial public debt in 2000 and subsequent low growth is more striking Developing economies in the top tercile of debt-to-GDP in 2000 typically grew about 1 percentage point per year lower in the following 20 years than those in the first and second debt terciles17
17 A similar finding is obtained when considering the relationship between initial debt in 1980 and subsequent long-run growth in 1980-1999 Developing economies in the lowest tercile of debt-to-GDP in 1980 typically grew 08 percentage points per year lower in the next two decades than those in the second and the highest terciles Developing economies in the middle debt tercile also had as low long-run growth as countries in the top debt tercile did This might reflect a volatile environment during 1980-1999 with relatively high interest rates and more default episodes
MIDDLE EAST AND NORTH AFRICA REgION ECONOMIC UPDATE APRIL 2021
26
C H A P T E R I I H O w I N S T I T U T I O N S C A N C H A R T A PAT H T O R E C O V E R Y F O R T H E M I D D L E E A S T A N D N O R T H A F R I C A
FIGURE II3 Median Annual per Capita Growth During 2000-2019 across Countries Ranked by Central Government Debt in 2000
Low Debt Tercile in2000 (median
2310)
Medium DebtTercile in 2000
(median 5359)
High Debt Tercile in2000 (median
9838)
All Countries
40th percentile Median 60th percentile
Low Debt Tercile in2000 (median
2476)
Medium DebtTercile in 2000
(median 5659)
High Debt Tercilein 2000 (median
10253)
Developing Economies
00
05
10
15
20
25
30
35
Low Debt Tercile in2000 (median
2171)
Medium Debt Tercilein 2000 (median
4206)
High Debt Tercile in2000 (median
7932)
Middle Income Economies
00
05
10
15
20
25
30
35
Low Debt Tercile in2000 (median
2274)
Medium Debt Tercilein 2000 (median
4138)
High Debt Tercile in2000 (median
8384)
High Income Economies
00
05
10
15
20
25
30
35
00
05
10
15
20
25
30
35
Source World Bank World Development Indicators International Monetary Fund Global Debt DatabaseNote Figure displays the real GDP per capita growth between 2000 and 2019 for each tercile of central government debt (percent of GDP) in 2000 by each country income group The overall sample covers 158 economiesmdash131 developing and 27 advanced economies based on the 1987 World Bank income classification The average annual growth rate is calculated between 2000 and 2019 The median real GDP per capita growth is presented for each of four groups (i) all countries (ii) high income (iii) developing (including middle-income and low-income countries) and (iv) middle income The debt terciles are in increasing order with the median of each tercile indicated in the horizontal axis Growth rates for the median 40th percentile and 60th percentile country are presented for each group
The Tensions are More Severe for Developing Countries
The association between developing countriesrsquo high initial public debt in 2000 and their subsequent low growth supports the notion that the tension between short-term needs and long-term costs of debt-financing is more severe for developing economies than for advanced ones For the developed world accommodative monetary policy and rising savings are expected to keep interest rates low favoring government borrowing Advanced countries are also known to be less debt intolerant so they can continue to borrow at relatively higher levels of public debt For the developing world including developing MENA the tension is starker Many MENA countriesmdashsuch as Egypt Jordan and Bahrainmdashface relatively high borrowing costs despite extremely low global interest rates (see Figure II4) The borrowing if not resulting in sufficiently high return fiscal spending in terms of GDP growth will add to future debt burden The default risk of many MENA countries rose sharply during the pandemic as
LIVINg wITH DEBT HOw INSTITUTIONS CAN CHART A PATH TO RECOVERY FOR THE MIDDLE EAST AND NORTH AFRICA
27
C H A P T E R I I H O w I N S T I T U T I O N S C A N C H A R T A PAT H T O R E C O V E R Y F O R T H E M I D D L E E A S T A N D N O R T H A F R I C A
shown in Figure I8 in Chapter I This is probably because many MENA countries entered the pandemic with high debt chronic low growth and weak governancemdashespecially when it came to transparency These existing vulnerabilities heighten the costs of their debt accumulation It is noteworthy that historically the probability of defaults andor current account reversals in developing MENA was abnormally low despite chronic low growth and persistent macroeconomic imbalances This was possible because of the support of high-income GCC countries via FDI and official assistance (Arezki et al 2019) However secular oil price declines driven by technological changes in the energy sector have significantly reduced the GCCrsquos willingness to continue to serve as a lender thus changing market expectations about debt vulnerability in developing MENA
FIGURE II4 Coupon Rates of US Dollar-denominated Debt Issuances during the Pandemic by Maturity for MENA countries Chile and Brazil
Bahrain
Bahrain
Bahrain Bahrain
Bahrain
Bahrain
Egypt
Egypt
Egypt
Egypt Egypt
Egypt
Egypt
Jordan
Jordan
Morocco
Morocco
MoroccoQatar
Qatar
Qatar
Saudi ArabiaSaudi Arabia
Saudi Arabia
Saudi Arabia
Saudi Arabia
Saudi ArabiaChile
Chile
Chile
Brazil
Brazil
24
68
10C
oupo
n R
ate
()
2020 2030 2040 2050 2060 2070Maturity
Source CbondscomNote Data are from the beginning of 2020 to February 27 2021 For comparability only coupon rates of US dollar-denominated debt issuances are displayed Coupon rates of EURO-denominated debt issuances from the region are not displayed but the overall finding remains the same
II2 The Role of Institutions in Shaping the Tradeoff
What can MENA countries do to navigate the tensions between short-term objectives and long-term risks of rising public debt
MENA countries can develop a transparent and credible multi-year fiscal and debt strategy to reduce the costs of public debt to bring debt-to-GDP ratio to sustainable levels and to reduce uncertainty for creditors and other economic agents18 This section tackles this question by discussing policy options during three different phases of an economic recovery from the pandemic
18 A fiscal rule is an example of a transparent and credible plan that applies in short-term and long-term in which a government provides clarity about when and to what extent it would conduct debt-financing fiscal spending (see Vegh et al 2017)
MIDDLE EAST AND NORTH AFRICA REgION ECONOMIC UPDATE APRIL 2021
28
C H A P T E R I I H O w I N S T I T U T I O N S C A N C H A R T A PAT H T O R E C O V E R Y F O R T H E M I D D L E E A S T A N D N O R T H A F R I C A
expenditure priorities during the pandemic
fiscal stimulus immediately as the pandemic subsides
mitigating the potential costs of debt overhang in the medium term
Prioritizing Spending during the Pandemic - Transparency and Surveillance
Conventional wisdom advocates a strong counter-cyclical role of fiscal expenditure Early studies suggest that fiscal multipliers are generally larger during bad times (Corsetti et al 2012 Riera-Crichton et al 2015 Auerbach and Gorodnichenko 2012) although recent research casts doubt on this wisdom (Ramey 2019) Nevertheless it is important to note that unlike in previous recessions fiscal policies are not designed primarily to boost aggregate demand during the Covid-19 pandemic because the collapse in aggregate demand in the pandemic was mainly driven by health concerns associated with the exposure to Covid-19 and not by underlying economic issues Social distancing has been shown to take place whether or not a government imposes restrictions such as lockdowns to slow the spread of the virus (Maloney and Taskin 2020 Gupta et al 2020) The collapse in demand is concentrated in sectors that require travel and face-to-face interactionsmdashsuch as airlines tourism hotel and restaurants brick-and-mortar retail and personal services19 As long as the risk of Covid-19 exposure remains stimulating aggregate demand is likely to be elusive
There are two main roles of fiscal spending during the pandemic to protect the welfare of vulnerable families and to invest in public health As Chapter I discusses poorer households in MENA have been disproportionately hurt Supporting the consumption of the hardest hit households is an essential objective for fiscal spending MENA countries have taken unprecedented actions to support the most vulnerable The good news is that cash transfers are reasonably well-targeted A bigger portion of the poorest households are beneficiaries than those at the top of the distribution evidence from phone surveys in the region suggests Yet there is room to improve since social transfers have been able to reach only a small portion of the families most in need
Public health investment as a short-term response to the pandemic could bring large long-term social returns such as better access to healthcare for the poor To contain the pandemic authorities could boost health spendingmdashto produce or acquire personal protective equipment testing kits and contact tracing systems and to mobilize and pay health workers Scaling up testing and contact tracing for Covid-19 as well as improving data transparency are especially important because these steps enable authorities to determine the dimensions of the infection to detect and isolate cases and to encourage the population to take appropriate social distancing measures The Gulf Cooperation Council (GCC) countriesmdashBahrain Kuwait Oman Qatar Saudi Arabia and the United Arab Emiratesmdashhave relatively high testing per capita As vaccines become available health spending can be allocated toward an immunization infrastructuremdashincluding among other things procurement of vaccines clear and effective communication to generate awareness of and demand for vaccination and building networks of local vaccination providers An effective vaccination campaign can both speed up the roll-out of vaccines which would pave the way for economic recovery and reinforce the foundation of public health infrastructure Simple calculations of the costs and benefits of investing in vaccination programs indicate that the benefit-cost ratio is very large around 781 if MENA vaccinates 20 percent of its population at the current prices envisioned by COVAX the multilateral initiative to make Covid-19 vaccines available to low- and middle-income countries (Ahuja et al 2021)
Investing in testing and public surveillance of the outbreak also appears to reduce the economic costs of the pandemic Preliminary evidence suggests that countries with a high level of tests coming back positive (a high test-positivity rate) suffered larger growth downgrades (see Figure I3 in Chapter I) A high test-positivity rate reflects a relatively uncontrolled pandemic
19 For example see Georgetown Universityrsquos job tracker httpscewgeorgetowneducew-reportsjobtracker for sectoral job losses in the United States
LIVINg wITH DEBT HOw INSTITUTIONS CAN CHART A PATH TO RECOVERY FOR THE MIDDLE EAST AND NORTH AFRICA
29
C H A P T E R I I H O w I N S T I T U T I O N S C A N C H A R T A PAT H T O R E C O V E R Y F O R T H E M I D D L E E A S T A N D N O R T H A F R I C A
which might reflect a limited outreach of testing as a public health surveillance tool Unfortunately many MENA countries have either high positivity rates (above the 5 percent benchmark set by the World Health Organization) or do not report reliable test results But some high-income countries in the MENA region have been at the global forefront of using testing for disease surveillance and rolling out vaccination programs (see Table I2 in Chapter I)
The Effectiveness of Public Investment Depends on Governance
MENA countries will have to decide whether additional fiscal stimulus is warranted after the public health emergency
On the one hand certain factors caution against embarking on additional stimulus in MENA First fiscal stimulus might not be needed because the recovery could be aided by rebound growth from demand for goods and services that could not be satisfied during the health emergency Because of this pent-up demand consumer and business spending will rise after it becomes clear that health risks have subsided (Krugman 2020 Lee 2020) The pent-up demand rebound depends on the duration of the crisis The longer the crisis goes the more likely firm liquidity constraints will result in solvency issues which might limit the upside of the recovery This scenario again underscores the importance of a rapid rollout of vaccines Moreover the extent of this pent-up demand rebound for the MENA regionmdashespecially from important external sources of demand such as tourismmdashdepends on the effectiveness and transparency of pandemic surveillance People will not likely resume traveling or spending on personal services if uncertainty regarding Covid-19 persists
Second fiscal stimulus can be ineffective or even counterproductive in MENA countries with elevated debt such as many oil importers (see Appendix Table B4) Published research indicates that in an environment of high public debt the so-called fiscal multiplier from additional spending can be zero (Ilzetzki et al 2013) Huidrom et al (2020) estimate that two-year fiscal multipliers can range from zero when government debt is high (in the 90th percentile of their sample that is above 92 percent of GDP) to 06 when government debt is low (in the 10th percentile or less than 17 percent of GDP) Two channels could cause negligible response to fiscal stimulus in economies with high public debt In one households reduce consumption when the fiscal stimulus is implemented in anticipation of future fiscal adjustments (such as tax increases or fiscal austerity) to finance the stimulus This is referred to as the Ricardian equivalence channel after Robert Barrorsquos seminal research in 1974 In the second called the interest rate channel concerns about sovereign credit risk raise interest rates and hence reduce aggregate demand (Huidrom et al 2020)
Third even though public investment can bring short and long run gains caution is warranted in countries with poor governance Public investment such as infrastructure projects is usually understood to have larger long-run effects than public consumption and social transfers (Auerbach and Gorodnichenko 2012 Veacutegh et al 2018) Unlike government consumption public investment directly improves the economyrsquos productive capacity by increasing the marginal product of private capital and labor As time progresses this generates positive effects both on private investment and private consumption (Leduc and Wilson 2013) In addition countries with a low initial stock of public capital (as a proportion of GDP) have significantly higher public investment multipliers than countries with a high initial stock of public capital (Izquierdo et al 2019) Eden and Kraay (2014) report that in low-income countries on average an extra dollar of government investment raises private investment by roughly two dollars and output by 15 dollars Nevertheless public investment may have a more limited short-term multiplier because of delayed implementation (Ramey 2020) More important the economic gains from public investment projects can be hindered by poor governance which reduces the efficiency of public investment For example public projects with
MIDDLE EAST AND NORTH AFRICA REgION ECONOMIC UPDATE APRIL 2021
30
C H A P T E R I I H O w I N S T I T U T I O N S C A N C H A R T A PAT H T O R E C O V E R Y F O R T H E M I D D L E E A S T A N D N O R T H A F R I C A
low economic and social return are selected when governance is poor At least this appears to be the case even for a large sample of European countries (Izquierdo et al 2019) In countries with the lowest institutional capacity and transparency the multiplier of public investment can be close to zero in both the short- and long-term Unfortunately governance is one area in which the MENA region trails its world peers (see Appendix Table B4) This concern reinforces the need to work on reforms to improve the governance of public investment decisions
On the other hand many countries in MENA rely on fixed exchange rate regimes (see Appendix Table B4) which can boost fiscal multipliers (Corsetti et al 2012 Ilzetzki et al 2013) As described by Ilzetzki et al (2013) ldquothe initial effect of a fiscal expansion is to increase output raise interest rates and induce an inflow of foreign capital which creates pressure to appreciate the domestic currency Under predetermined exchange rates the monetary authority expands the money supply to prevent this appreciation Such monetary policy accommodation serves to accommodate the rise in output Under flexible exchange rates however the monetary authority keeps a lid on the money supply and thus allows the real exchange rate appreciation to reduce net exports Output does not change because the increase in government spending is exactly offset by the fall in net exportsrdquo Table II1 summarizes the literature on country characteristics and the size of fiscal multipliers
TABLE II1 Country Characteristics and the Size of Fiscal Multipliers
Size of Fiscal Multipliers Public Debt Output Gap Governance Exchange Rate
Regime
LARgE Low Large Strong Pegged
SMALL High Small Weak Flexible
Sources Ilzetzki et al (2013) Huidrom et al (2020)
Corsetti et al (2012) Riera-Crichton et al (2015)
Auerbach and Gorodnichenko (2012)
Izquierdo et al (2019)Corsetti et al (2012) Ilzetzki
et al (2013)
Note See Appendix Table B4 for the corresponding positions of MENA countries
The arguments for and against demand-stimulating fiscal actions after the pandemic do not rule out the usefulness of targeted fiscal
spending Focusing on economic impacts of the crisis with potentially long-lasting consequences can be a helpful guide Consistent with
the existing literature this report labels these as ldquoscarring effectsrdquo (Portes 2020 Baldwin and Weder di Mauro 2020 Arellano-Bover
forthcoming) For example financial constraints might prevent firms from making the initial investment to re-enter the market Or workers
who became unemployed or under-employed during the crisis might face long-term reductions in the chances of finding employment and
even lower wagesmdashand thus need retraining and job search assistance School closures interrupt studentsrsquo skill accumulation20 For example
without targeted remediation the human capital of children who are now in school is likely to be reduced by almost 5 which is the order
of magnitude of the average improvement in human capital globally in the past ten years (World Bank 2020c) Government spending
such as subsidized loans job training and resources for schools to make up for the loss of learning can mitigate these ldquoscarringrdquo effects
20 If the return to an additional year of education is approximately 8-10 percent and the average student misses one quarter of the school year then one might estimate a permanent impact on earnings of 2 percent to 25 percent (Portes 2020)
LIVINg wITH DEBT HOw INSTITUTIONS CAN CHART A PATH TO RECOVERY FOR THE MIDDLE EAST AND NORTH AFRICA
31
C H A P T E R I I H O w I N S T I T U T I O N S C A N C H A R T A PAT H T O R E C O V E R Y F O R T H E M I D D L E E A S T A N D N O R T H A F R I C A
Mitigating the Costs of Public Debt after the Pandemic with Transparency and Governance
The costs of elevated debt are likely to manifest themselves eventually perhaps even in the short term To help in April 2020 the so-called Group of 20 advanced economies initiated a Debt Service Suspension Initiative (DSSI) which suspended interest and principal payments for the poorest countries from May 1 through December 31 2020 It was later extended to June 30 2021 While this is a helpful respite DSSI does not reduce debt value (see Box II2)
Box II2 The Debt Service Suspension Initiative (DSSI)
With the support of the World Bank Group and the International Monetary Fund (IMF) the so-called Group of 20 advanced economies (G20) is allowing 73 low- and lower-middle-income countries to temporarily suspend debt service paymentsmdashboth interest and principalmdashowed to their official bilateral creditors The suspension is designed to temporarily ease the debt pressure on poorer countries and free up resources that can be used to fight the pandemic and support vulnerable people The G20 has also called on private creditors to participate in the initiative on comparable terms The Debt Service Suspension Initiative (DSSI) originally was to run from May 1 2020 through December 31 2020 but was extended through the end of June 2021 (World Bank 2020b)
Two MENA countries are eligible from the DSSImdashDjibouti and Yemen In the latest Debt Sustainability Analysis (DSA) conducted in May 2020 by the World Bank and the IMF Djibouti is considered to be at high risk of external debt distress and at high risk of overall debt distress because of the impact of the Covid-19 on macroeconomic prospects (World Bank and IMF 2020) The government of Djibouti has participated in the DSSI Potential DSSI savings for Djibouti amounts to 17 percent of GDP during May-December 2020 and 2 percent of GDP during January-June 2021 (World Bank 2020b) Yemen is also participating in the DSSI However because of external arrears Yemenrsquos benefit from the DSSI is notional
The DSSI is helping poorest countries by allowing payment delay The initiative does not reduce the debt stock nor the total amount that the debtors are expected to pay to the creditors The DSSI also does not restructure debt Restructurings encompasses actions that reduce the debt stock andor extend maturities andor reduce interest rates
Soon after the pandemic countries in the region may have to take action to reduce the share debt represents of GDP even when economic output remains below potential To do so governments can
Raise economic growth
Undertake thoughtful fiscal consolidation
Use inflation to erode the value of domestic debt
Refinance (roll over) maturing debt on more favorable terms
Default or restructure debt
Some options are more beneficial and feasible than others with transparency and governance playing a key role
MIDDLE EAST AND NORTH AFRICA REgION ECONOMIC UPDATE APRIL 2021
32
C H A P T E R I I H O w I N S T I T U T I O N S C A N C H A R T A PAT H T O R E C O V E R Y F O R T H E M I D D L E E A S T A N D N O R T H A F R I C A
Raising economic growth increasing economic output remains the most sustainable way to reduce debt Boosting economic growth in MENA requires much-needed deep structural reforms to raise the productivity of the existing workforce and put idle working-age people in jobs Unemployment in the MENA region is high and is concentrated in young people and the educated The regionrsquos female labor force participation rate is the lowest in the world A powerful way to put more people to work and enhance the productivity of the current workforce is to promote fair competition (Arezki et al 2020a) and adopt digital technologymdashespecially in finance and telecommunication These enhancements would be especially important to the informal sector which would gain access to services and markets previously accessible only to the privileged few and to state-owned enterprises In some countries where the both telecommunication and digital payment infrastructure are underdeveloped removing barriers to entering and leaving markets is important
Undertake thoughtful fiscal consolidation After the pandemic steps to reduce fiscal deficits (called fiscal consolidation) can also be considered by MENA countries that have such conditions as high debt and weak governance that impedes the effectiveness of fiscal stimulus Fiscal consolidation does not mean indiscriminate spending reduction Rather this can be achieved by prioritizing the most effective spending items coupled with improved spending decisions In highly indebted countries thoughtful fiscal consolidation such as reducing low-return spending items might have a small negative impact or could even be welcomed by private sector This is consistent with the finding that the fiscal multiplier is close to zero or negative in such countries (Ilzetzki et al 2013 Huidrom et al 2020) Over the medium term MENA countries can aim to gradually reduce heavy subsidies and expand the formal private sector to increase the tax base MENArsquos labor market currently consists of a large informal sector that gives workers virtually no social protections and produces little tax in tax revenue (World Bank 2014 Gatti et al 2014)
Using inflation to erode domestic debt Although historically inflationary episodes have reduced the value of domestic debt inflation is unlikely to be a deliberate policy tool to reduce debt High inflation is well-known to be very costlymdashhurting long-run economic growth (Bruno and Easterly 1998) and putting depreciation pressure on exchange rates High inflation also has important distributional costs as it disproportionately hurts the poor (Easterly and Fischer 2001 Bulir 2001) and people living on fixed income such as retirees Unlike most poor people the rich have access to real and financial instruments and can protect themselves against inflation Inflation can also cause social unrest Anecdotal evidence suggests that inflation especially in food and fuel prices can trigger protests (NPR 2011 Washington Post 2015) Arezki and Bruckner (2011) systematically find that increases in food prices cause anti-government demonstrations and riots in poor countries In sum inflation is not likely a policy tool Rather it is usually a sign of difficult economic conditions as demonstrated by two MENA countries with high inflationmdashLebanon and Iran
An alternative approach financial repression can only work to gradually reduce public debt over time and carries costs Financial repression consists of controlled domestic interest rates captive domestic lenders that provide credit to the government and positive inflation rates (McKinnon 1973 and Reinhart and Sbrancia 2015) These factors can generate negative real interest rates and gradually reduce existing domestic public debt Financial repression was an important factor in the debt reduction of advanced countries in the decades after World War II21 The early literature found that because of government interventions in pricing and funding allocation financial repression hurts financial development (Demetriades and Luintel 1997) and long-run growth (Roubini and Sala-i-Martin 1992) In addition to their downsides financial repression policies take time to substantially reduce the debt-to-GDP ratio
21 For example for the United States and the United Kingdom the annual liquidation of debt via negative real interest rates amounted on average to 2 and 3 percent of GDP a year during the post-war period (Reinhart and Sbrancia 2015)
LIVINg wITH DEBT HOw INSTITUTIONS CAN CHART A PATH TO RECOVERY FOR THE MIDDLE EAST AND NORTH AFRICA
33
C H A P T E R I I H O w I N S T I T U T I O N S C A N C H A R T A PAT H T O R E C O V E R Y F O R T H E M I D D L E E A S T A N D N O R T H A F R I C A
Rolling over debt with more favorable terms To reduce debt MENA countries can also aim to refinance maturing debt on more favorable terms The good news is that global interest rates are expected to remain low The US Federal Reserve has set its policy interest rate goal at or near zero to achieve maximum employment and will allow inflation to moderately go above the 2 percent target rate for some time (Federal Reserve FOMC Statement December 2020)22 The Federal Reserve forecasts that interest rates will remain near zero at least through 2023 (Federal Reserve Economic Projections December 2020)23 The European Central Bankrsquos overnight deposit rate has been negative and declining since 2014 (European Central Bank 2021) Given these monetary policy goals for two of the worldrsquos most important central banks global interest rates are likely to remain low for some time although that could change due to pent-up demand
However interest rates for MENArsquos new debt will not necessarily be low given the regionrsquos high debt and low growth The coupon rates paid by many MENA countriesmdashsuch as Egypt Jordan and Bahrainmdashwere high during the pandemic for debt issuances denominated in hard currencies even when interest rates were extremely low globally (see Figure II4) But MENA countries with low levels of public external debt (such as Qatar Saudi Arabia and Morocco) could issue debt with lower coupon rates In addition it is not certain that after the pandemic interest rates will remain so low Partly because of favorable global liquidity conditions fostered by central banks in advanced markets private capital outflows have been moderate and many middle-income countries were able to continue borrowing in global capital markets After the pandemic the unprecedented liquidity support by advanced countriesrsquo central banks will probably stop Many emerging markets with synchronized rises in debt levels might have to compete for liquidity to roll over their debt A less liquid global scenario added to the high debt reduced oil prices chronic low growth and the external imbalances that beset many MENA countries means that the region might face considerable challenges competing for liquidity
To access more favorable terms MENA countries need to enhance their growth prospects Economic growth can directly reduce debt as a share of GDP and help MENA countries roll over existing debt on good terms If MENA countries are to be able to roll over their debt and gradually get on a sustainable debt dynamic it is crucial that they achieve the stable macroeconomic conditions necessary for growth
MENA countries can work to enhance debt reporting transparency and monitor financial market vulnerabilities Such measures can lower rollover costs Studies have shown that greater data transparency can lower the costs of external borrowing (Cady 2005 Choi and Hashimoto 2018) This is probably because when investors are unsure about a countryrsquos debt profile they demand a higher risk premium More broadly studies have found positive correlations between data transparency and governance (Islam 2006 and Williams 2009) and growth (Arezki et al 2020b) MENA countries can improve public debt reporting including debt borrowed from China24 Improving debt reporting is important because hidden public debt such as debt of SOEs can become exposed usually in distressed times and is added to the total tally of public debt precisely at the moments public debt needs to be brought under the control the most (Reinhart 2015) A potential mechanism to mitigate hidden debt is to develop a secondary market for private debt including non-performing loans
This report updates MENArsquos public debt reporting first documented in Arezki et al (2020b) providing an overall reporting of different categories of public debt such as state and local government extra budgetary funds and SOE liabilities The transparency of public debt reporting is largely unchanged between 2019 and 2020 with notable improvements in Tunisia
22 httpswwwfederalreservegovnewseventspressreleasesmonetary20201216ahtm23 httpswwwfederalreservegovmonetarypolicyfomcprojtabl20201216htm24 Horn and others (2020) find that 50 of Chinarsquos lending to developing countries is not reported to the IMF or World Bank These ldquohidden debtsrdquo distort policy surveillance risk
pricing and debt sustainability analyses
MIDDLE EAST AND NORTH AFRICA REgION ECONOMIC UPDATE APRIL 2021
34
C H A P T E R I I H O w I N S T I T U T I O N S C A N C H A R T A PAT H T O R E C O V E R Y F O R T H E M I D D L E E A S T A N D N O R T H A F R I C A
and Jordan (see Appendix Table B5) Closely monitoring financial market vulnerabilities such as non-performing loans held by banks is also important to improve investor confidence and reduce borrowing costs
Defaulting or Restructuring Debt If MENA countries cannot roll over debt they may risk costly debt restructurings Debt restructuring is a process wherein a country experiencing financial distress and liquidity problems refinances its existing debt obligations in order to gain more flexibility in the short term and make its debt load more manageable overall There are two types of debt restructuringsmdashpreemptive and post-default In preemptive restructurings a country decides to restructure its external debt before it misses any payments In a post-default restructuring a country is forced to enter into debt negotiations because it has missed payments (that is defaulted)
FIGURE II5 GDP Growth in Lebanon and Jordan
-25
-20
-15
-10
-5
0
5
2017 2018 2019 2020 2021 2022 2023
perc
ent
Jordan Lebanon
Source World Bank Macro and Poverty Forecasts (April 2021)Note Data for 2021 2022 and 2023 are forecasts Forecasts for Lebanonrsquos GDP growth in 2022 and 2023 are not available Lebanon defaulted in March 2020
Defaults are costly as the default of Lebanon shows On March 7 2020 the Lebanese government defaulted on a $12 billion Eurobond payment in its first sovereign default The Lebanese Lira depreciated sharply and with heavy fluctuations The Eurobond default precludes access to international markets for foreign financing The domestic banking sector is impaired because of the exposure to the government debt The lack of bank credit coupled with exchange market pressures choke trade and corporate finance in the highly dollarized economy constraining the capital and final goods imports (World Bank 2020a) The current account deficit was sharply reduced from a deficit of 21 percent of GDP in 2019 to a deficit of 11 percent of GDP in 2020 mainly because imports dried up A year into the economic crisis there have been limited policy responses by the authorities The political situation is volatile Lebanon lacks a fully functioning executive authority and as of early March 2021 is trying to form its cabinet
The warning signs of Lebanonrsquos economic collapse were ominous Lebanonrsquos GDP growth gradually declined in the years leading up to the default (Figure II5) Real GDP contracted by 19 percent in 2018 and 67 percent in 2019 respectively In 2020 real GDP is estimated to contract 203 percent and in 2021 it is expected to shrink another 95 percent This performance is in stark contrast to a neighbor Jordan which is expected to record positive economic growth in 2021
LIVINg wITH DEBT HOw INSTITUTIONS CAN CHART A PATH TO RECOVERY FOR THE MIDDLE EAST AND NORTH AFRICA
35
C H A P T E R I I H O w I N S T I T U T I O N S C A N C H A R T A PAT H T O R E C O V E R Y F O R T H E M I D D L E E A S T A N D N O R T H A F R I C A
To systematically understand restructurings we study the evolution of growth external debt and governance around restructurings for developing countries using the restructuring dataset constructed and maintained by Asonuma and Trebesch (2016) The dataset provides information on the occurrence and duration of restructurings with private external creditors from 1978 (see Appendix A3 for detail)25 The cases are differentiated into two categories preemptive restructurings and post-default restructurings
Highly indebted countries are more likely to enter either type of debt restructuring when they experience low growth and weak governance In Figure II6 the blue bars show that countries that default or preemptively restructure have lower growth and weaker governance quality in the five years preceding the event than do countries with no restructurings Several MENA countries entered 2020 with deficits in both dimensions as shown in the red bars The deficits are most striking for Lebanon which defaulted in 2020 and to a lesser extent for MENA middle-income countries The good news for MENA middle-income oil importers the group of countries with relatively high public debt is that the gaps in growth and governance are more modest than those in other MENA middle-income countries
In addition there seems to be a systematic difference in governance quality between countries that default and countries that preemptively restructure In the five years before the event countries that default have governance scores than average 02 points lower than countries that do not restructure while countries that preemptively restructure have an average governance score 01 points lowermdashsuggesting that institutions play a role in restructuring decisions
FIGURE II6 Growth and Governance before Restructurings
Panel A Difference in gDP growth (percentage)
-5
-4
-3
-2
-1
0
Countries thatdefaulted minus
the control group
MENA middleincome minus the
control group
MENA middle-income oil
importers minusthe control group
Lebanon minus thecontrol group
-05
-04
-03
-02
-01
0
Countries thatdefaulted minus
the control group
Countries thatpreemptivelyrestructured
minus thecountrol group
Countries thatpreemptivelyrestructured
minus thecountrol group
MENA middleincome minus the
control group
MENA middle-income oil
importers minusthe control group
Lebanon minusthe control group
Source World Bank staff calculationNote The first bar from the left shows 5-year average annual GDP growth before a post-default restructuring minus that before non-restructuring periods (referred to as average growth of the control group or agcg) The second bar shows 5-year average annual GDP growth before a preemptive restructuring minus agcg The third bar shows the average annual GDP growth during 2014-2019 for MENA middle-income countries minus agcg The fourth bar shows the average annual GDP growth during 2014-2019 for MENA middle income oil importers minus agcg The fifth bar shows the average annual GDP growth during 2014-2019 for Lebanon minus agcg
25 See Schlegl et al (2019) for a study on restructurings of debts owed by foreign governments Multilateral institutions such as the IMF the World Bank and other regional banks are the most ldquoseniorrdquo creditors meaning their loans get repaid first
continues on next page gtgt
MIDDLE EAST AND NORTH AFRICA REgION ECONOMIC UPDATE APRIL 2021
36
C H A P T E R I I H O w I N S T I T U T I O N S C A N C H A R T A PAT H T O R E C O V E R Y F O R T H E M I D D L E E A S T A N D N O R T H A F R I C A
Panel B Difference in governance (score)
-5
-4
-3
-2
-1
0
Countries thatdefaulted minus
the control group
MENA middleincome minus the
control group
MENA middle-income oil
importers minusthe control group
Lebanon minus thecontrol group
-05
-04
-03
-02
-01
0
Countries thatdefaulted minus
the control group
Countries thatpreemptivelyrestructured
minus thecountrol group
Countries thatpreemptivelyrestructured
minus thecountrol group
MENA middleincome minus the
control group
MENA middle-income oil
importers minusthe control group
Lebanon minusthe control group
Source World Bank staff calculationNote Governance is simple average between rule of law regulatory quality and government effectiveness (with a range from -25 (worst) to 25 (best))The first bar from the left shows 5-year average governance before a post-default restructuring minus that for non-restructuring periods (referred to as average governance of the control group or agocg The second bar shows 5-year average governance before a preemptive restructuring minus agocg The third bar shows average governance during 2014-2019 for MENA middle-income countries minus agocg The fourth bar shows average governance during 2014-2019 for MENA middle-income oil importers minus agocg The fifth bar shows average governance during 2014-2019 for Lebanon minus agocg
While both forms of restructurings with private external creditors are costly preemptive restructurings are less so They are shorter and most importantly associated with lower output cost than post-default restructurings Countries that preemptively restructure are able to re-enter borrowing markets sooner than those that default (Asonuma and Trebesch 2016) To gain further understanding of the extent to which pre-emptive restructurings might be preferable to post-default debt restructuring this report estimates the impact of such events on both growth and debt We focus on three years before the year of the announcement of a restructuring and three years after the start of a restructuring For both types of episodes the estimates are relative to the performance of countries that did not experience a debt restructuring Details of the analysis are in Appendix A3
Our analyses show that both types of restructurings are costly in terms of output growth but preemptive restructurings are less costly than defaults Panel A of Figure II7 show before they restructure debtor countries experience lower growth relative to countries that do not restructure This is the case for both preemptive and post-default restructurings However after the first year of restructuring growth starts to recover for preemptive restructurings but remains depressed for post-default restructurings
In addition restructurings help slow debt accumulation Panel B of Figure II7 shows that during the first two years after a restructuring starts (that is t=12) debt growth is significantly lower in both preemptive and post-default restructurings compared to the countries that did not restructure This could reflect the exclusion of restructuring countries from international debt markets and the reduction in debt granted by creditors during the restructuring negotiations
LIVINg wITH DEBT HOw INSTITUTIONS CAN CHART A PATH TO RECOVERY FOR THE MIDDLE EAST AND NORTH AFRICA
37
C H A P T E R I I H O w I N S T I T U T I O N S C A N C H A R T A PAT H T O R E C O V E R Y F O R T H E M I D D L E E A S T A N D N O R T H A F R I C A
FIGURE II7 Output Growth and Debt Growth around Restructurings
Panel A Output growth around Restructurings Panel B External Debt growth around Restructurings
-4
-3
-2
-1
0
1
-2 -1 0 1 2 3
percent
-30
-20
-10
0
10
20
-3 -2 -1 0 1 2 3
Pre-emptive restructurings Post-default restructurings
percent
-3
Pre-emptive restructurings Post-default restructurings
Source World Bankrsquos staff estimates (see Appendix A3 for details)Note Difference-in-difference approach t=0 onset of a restructuring t=-3-2-1 indicate the years before restructurings t=123 indicate the years after a restructuring starts Data consists of 197 restructurings to private external creditors between 1981 and 2019 and are collected and updated by Asonuma amp Trebesch (2016) Panel A The coefficient at t=-1 is statistically significant at 10 level for preemptive restructurings The coefficients at t=-112 are statistically significant at 10 level for post-default restructurings Panel B The coefficients at t=12 are statistically significant at 10 level for preemptive restructurings The coefficient at t=2 is statistically significant at 10 level for post-default restructurings
II3 How Institutions Shape the Recovery
Economic growth remains the most sustainable way to reduce debt Boosting economic growth requires deep structural reforms to raise the productivity of the existing workforce and to put idle working-age people in jobs Many MENA countries that have characteristics associated with ineffective fiscal stimulus such as high public debt and poor governance could consider fiscal reforms early in the recovery from the pandemic Rolling over debt with more favorable terms is an important way for countries to gradually reduce debt This also requires debt transparency and financial market monitoring If they are unable to roll over maturing loans countries risk costly debt restructurings Our evidence suggests that many MENA countries share certain characteristics with countries that entered costly debt restructurings namely low growth and poor governance Institutions can play an important role in mitigating the long-term costs of public debt
Improvements in governance and transparency also help during the pandemic and when it subsides Investing in testing disease surveillance and data transparency can reduce the economic costs of the pandemic As the pandemic subsides effective and transparent pandemic surveillance in the region would help boost demand from domestic and foreign sourcesmdashsuch as the arrival of foreign tourists Good governance in public investment decisions can raise the economic gains of public investment projects
Institutional reforms to improve governance and transparency can address the tradeoff between the short-term needs and long-term costs of public debt They can be implemented with limited fiscal costs They also hold the promise of boosting long-run growth Looking forward institutions might be the key to helping MENA build back better with or without fiscal consolidation
-4
-3
-2
-1
0
1
-2 -1 0 1 2 3
percent
-30
-20
-10
0
10
20
-3 -2 -1 0 1 2 3
Pre-emptive restructurings Post-default restructurings
percent
-3
Pre-emptive restructurings Post-default restructurings
MIDDLE EAST AND NORTH AFRICA REgION ECONOMIC UPDATE APRIL 2021
38
References
Ahuja Amrita Juan Camilo Castillo Michael Kremer Greg Larson and Jean Lee 2021 ldquoPurchasing Covid-19 Vaccines Analysis of Costs and Benefits for Africardquo mimeo
Apedo-Amah Marie Christine Besart Avdiu Xavier Cirera Marcio Cruz Elwyn Davies Arti Grover Leonardo Iacovone Umut Kilinc Denis Medvedev Franklin Okechukwu Maduko Stavros Poupakis Jesica Torres Trang Thu Tran 2020 ldquoUnmasking the Impact of COVID-19 on Businesses Firm Level Evidence from Across the Worldrdquo Policy Research Working Paper No 9434
Arellano-Bover Jaime Forthcoming ldquoThe Effect of Labor Market Conditions at Entry on Workersrsquo Long-Term Skillsrdquo The Review of Economics and Statistics
Arezki Rabah and Markus Bruckner 2011 Food prices and political instability IMF Working Papers 1-22
Arezki Rabah Lederman Daniel Harb Amani Abou Fan Rachel Yuting Nguyen Ha 2019 ldquoReforms and External Imbalances The Labor-Productivity Connection in the Middle East and North Africardquo Middle East and North Africa Economic Update (April) World Bank Washington DC
Arezki Rabah Ait Ali Slimane Meriem Barone Andrea Decker Klaus Detter Dag Fan Rachel Yuting Nguyen Ha Miralles Murciego Graciela Senbet Lemma 2020a ldquoReaching New Heights Promoting Fair Competition in the Middle East and North Africardquo Middle East and North Africa Economic Update (October) Washington DC World Bank
Arezki Rabah Lederman Daniel Abou Harb Amani El-Mallakh Nelly Fan Rachel Yuting Islam Asif Nguyen Ha Zouaidi Marwane 2020b ldquoHow Transparency Can Help the Middle East and North Africardquo Middle East and North Africa Economic Update (April) Washington DC World Bank
Arezki Rabah Moreno-Dodson Blanca Yuting Fan Rachel Gansey Romeo Nguyen Ha Cong Nguyen Minh Mottaghi Lili Tsakas Constantin Wood Christina 2020c Trading Together Reviving Middle East and North Africa Regional Integration in the Post-Covid Era Middle East and North Africa Economic Update October 2020
Asonuma Tamon and Christoph Trebesch 2016 Sovereign Debt Restructurings Preemptive or Post-default Journal of the European Economic Association 141 175-214
Auerbach Alan and Yuriy Gorodnichenko 2012 ldquoFiscal Multipliers in Recession and Expansionrdquo In Fiscal Policy after the Financial Crisis (pp 63-98) University of Chicago press
Azevedo Joao Pedro Amer Hasan Diana Goldemberg Syedah Aroob Iqbal and Koen Geven 2020 ldquoSimulating the Potential Impacts of COVID-19 School Closures on Schooling and Learning Outcomes A Set of Global Estimatesrdquo Policy Research Working Paper No 9284 World Bank Washington DC
Barro Robert 1974 Are Government Bonds Net Wealth Journal of Political Economy NovemberDecember 83 1095-117
R E F E R E N C E S
LIVINg wITH DEBT HOw INSTITUTIONS CAN CHART A PATH TO RECOVERY FOR THE MIDDLE EAST AND NORTH AFRICA
39
Barro Robert 1979 On the Determination of the Public Debt Journal of Political Economy 87(5) 940-971
Baldwin Richard and B Weder di Mauro 2020 ldquoMitigating the Covid Economic Crisis Act Fast and Do Whatever It Takesrdquo Voxeuorg eBook CEPR Press
Beaudry Paul and Tim Willems 2018 ldquoOn the Macroeconomic Consequences of Over Optimismrdquo NBER Working Paper No 24685 Cambridge MA National Bureau of Economic Research
Borensztein Eduardo and Ugo Panizza 2009 The costs of sovereign default IMF Staff Papers 564 683-741
Boskin Michael 2020 ldquoAre Large Deficits and Debt Dangerousrdquo AEA Papers and Proceedings 110 145-148
Bruno Michael and William Easterly 1998 ldquoInflation Crises and Long-run Growthrdquo Journal of Monetary Economics 41(1) pp 3-26
Bulir Aleš 2001 Income Inequality Does Inflation Matter IMF Staff papers 48 no 1 (2001) 139-159
Cady John 2005 Does SDDS Subscription Reduce Borrowing Costs for Emerging Market Economies IMF Staff Papers 52(3) 1-6
Carey Kevin and Wissam Harake 2017 ldquoUnited NationsmdashWorld Bank Prevention Study Chapter 7 Input Macroeconomic Environment and Policiesrdquo The World Bank
Cashin Paul Kamiar Mohaddes Maziar Raissi and Mehdi Raissi 2014 ldquoThe Differential Effects of Oil Demand and Supply Shocks on the Global Economyrdquo Energy Economics 44 113ndash134
Centers for Disease Control and Prevention ndash CDC 2020 Frequently Asked Questions Calculating Severe Acute Respiratory Syndrome Coronavirus 2 (SARS-CoV-2) RT-PCR Laboratory Test Percent Positivity
Choi Sangyup and Yuko Hashimoto 2018 Does Transparency Pay Evidence from IMF Data Transparency Policy Reforms and Emerging Market Sovereign Bond Spreads Journal of International Money and Finance vol 88(C) pages 171-190
Chudik Alexander Kamiar Mohaddes M Hashem Pesaran and Mehdi Raissi 2017 Is There a Debt-threshold effect on Output Growth Review of Economics and Statistics 99 (1) 135-150
Collier Paul 1999 ldquoOn the economic consequences of civil warrdquo Oxford Economic Papers 51(1) 168-183
Corral Paul amp Roberta Gatti 2020 Accumulation interrupted COVID-19 and human capital among the young Vox eBook Chapters in Simeon Djankov amp Ugo Panizza (ed) COVID-19 in Developing Economies edition 1 volume 1 chapter 1 pages 286-302 Centre for Economic Policy Research
Corsetti Giancarlo Andre Meier and Gernot J Muumlller 2012 ldquoWhat Determines Government Spending Multipliersrdquo Economic Policy 27(72) 521-565
CNBC 2021 Oil slides reversing early gains that pushed prices to highest level in more than a year March 7 2021 httpswwwcnbccom20210308brent-breaks-70-after-houthis-attack-saudi-arabias-oil-facilitieshtml
r
R E F E R E N C E S
MIDDLE EAST AND NORTH AFRICA REgION ECONOMIC UPDATE APRIL 2021
40
De Walque Damien Fred Friedman Roberta Gatti Aaditya Mattoo 2020 How Two Tests Can Help Contain COVID-19 and Revive the Economy Research amp Policy Briefs no 29 Washington DC
Del Granado Francisco Javier Arze David Coady and Robert Gillingham 2012 The Unequal Benefits of Fuel Subsidies A Review of Evidence for Developing Countries World Development 4011 (2012) 2234-2248
Devarajan Shantayanan Vinaya Swaroop and Heng-fu Zou 1996 ldquoThe Composition of Public Expenditure and Economic Growthrdquo Journal of Monetary Economics 37(2) 313-344
Demetriades Panicos and Kul B Luintel 1997 The Direct Costs of Financial Repression Evidence from India Review of Economics and Statistics 792 311-320
Easterly William and Stanley Fischer 2001 Inflation and the Poor Journal of Money Credit and Banking pp 160-178
Eberhardt Markus and Andrea F Presbitero 2015 Public debt and growth Heterogeneity and non-linearity Journal of International Economics 97 (1) 45-58
Eden Maya and Aart Kraay 2014 ldquoCrowding inrdquo and the Returns to Government Investment in Low-Income Countriesrdquo Policy Research Working Paper No 6781 The World Bank
European Central Bank 2021 Key ECB interest rates httpswwwecbeuropaeustatspolicy_and_exchange_rateskey_ecb_interest_rateshtmlindexenhtml
Fomby Thomas Yuki Ikeda and Norman V Loayza 2013 The Growth Aftermath of Natural Disasters Journal of Applied Econometrics 28 (3) 412-434
Frankel Jeffrey 2011 ldquoOver-optimism in Forecasts by Official Budget Agencies and Its Implicationsrdquo NBER Working Paper No 17239
Frankel Jeffrey Carlos A Veacutegh and Guillermo Vuletin 2013 On Graduation from Fiscal Procyclicality Journal of Development Economics 100 (1) 32-47
Gatti Roberta Diego Angel-Urdinola Joana Silva and Andraacutes Bodor 2014 ldquoStriving for Better Jobs The Challenge of Informality in the Middle East and North Africardquo Washington DC World Bank
Gentilini Ugo Mohamed Almenfi and Pamela Dale 2020 ldquoSocial Protection and Jobs Responses to Covid-19 A Real-Time Review of Country Measuresrdquo ldquoLiving paperrdquo version 14 (December 11 2020) The World Bank
Gupta Sumedha Kosali I Simon and Coady Wing 2020 Mandated and Voluntary Social Distancing During The Covid-19 Epidemic A Review NBER Working Papers 28139
Hall Robert 1978 Stochastic Implications of the Life Cycle-Permanent Income Hypothesis Theory and Evidence Journal of Political Economy 866 971-987
R E F E R E N C E S
LIVINg wITH DEBT HOw INSTITUTIONS CAN CHART A PATH TO RECOVERY FOR THE MIDDLE EAST AND NORTH AFRICA
41
Heckman James J Seong Hyeok Moon Rodrigo Pinto Peter A Savelyev and Adam Yavitz 2010 The rate of return to the HighScope Perry Preschool Program Journal of Public Economics 94 no 1-2 114-128
Horn Sebastian Carmen M Reinhart and Christoph Trebesch 2019 Chinarsquos overseas lending National Bureau of Economic Research Working Paper w26050
Huidrom Raju M Ayhan Kose James Lim and Franziska L Ohnsorge 2020 Why do Fiscal Multipliers depend on Fiscal Positions Journal of Monetary Economics Elsevier vol 114(C) pages 109-125
Ilzetzki Ethan Enrique Mendoza and Carlos Veacutegh 2013 ldquoHow Big (Small) Are Fiscal Multipliersrdquo Journal of Monetary Economics 60(2) 239-254
Integrated Food Security Phase Classification (IPC) 2020 Yemen Integrated Food Insecurity Phase Classification Snapshot- October 2020- June 2021
International Monetary Fund (IMF) 2013 ldquoStaff Guidance Note for Public Debt Sustainability Analysis in Market-Access Countriesrdquo
mdashmdashmdash2017 ldquoGuidance note on the Bank-Fund Debt Sustainability Framework for Low Income Countriesrdquo
mdashmdashmdash2021 ldquoPolicy Responses to Covid-19rdquo httpswwwimforgenTopicsimf-and-covid19Policy-Responses-to-COVID-19
Islam Roumeen 2006 ldquoDoes More Transparency Go along with Better Governancerdquo Economics and Politics 18 (2)121ndash67
Izquierdo Alejandro Ruy E Lama Juan Pablo Medina Jorge P Puig Daniel Riera-Crichton Carlos A Veacutegh and Guillermo Vuletin 2019 ldquoIs the Public Investment Multiplier Higher in Developing Countries An Empirical Investigationrdquo NBER Working Paper No 26478
Joumard Isabelle Mauro Pisu and Debbie Bloch 2012 ldquoTackling income inequality The role of taxes and transfersrdquo OECD Journal Economic Studies
Kaminsky Graciela L Carmen Reinhart and Carlos Veacutegh 2004 When It Rains It Pours Procyclical Capital Flows and Macroeconomic Policies NBER Macroeconomics Annual 19 11-53
Krugman Paul 2020 ldquoThings Will Get Better Seriouslyrdquo New York Times December 31 2020
Kubota Megumi and Albert Zeufack 2020 ldquoAssessing the Returns on Investment in Data Openness and Transparencyrdquo Policy Research Working Paper WPS 9136 Washington DC World Bank Group
Lederman Daniel and Claudio Rojas 2018 ldquoThree Macroeconomic Trends Around the Onset of Armed Conflict in Developing Economiesrdquo Policy Research Working Paper No WPS 8647 The World Bank
Leduc Sylvain and Daniel Wilson 2013 Roads to Prosperity or Bridges to Nowhere Theory and Evidence on the Impact of Public Infrastructure Investment NBER Macroeconomics Annual 27 no 1 89-142
R E F E R E N C E S
MIDDLE EAST AND NORTH AFRICA REgION ECONOMIC UPDATE APRIL 2021
42
Lee Don 2020 Vaccinesrsquo Rollout and Pent-up Consumer Demand Brighten US Economic Outlook December 16 2020 httpswwwlatimescompoliticsstory2020-12-16rollout-of-vaccines-and-pent-up-demand-brighten-u-s-economic-outlook
Mahdavi Saeid 2004 ldquoShifts in the Composition of Government Spending in Response to External Debt Burdenrdquo World Development 32(7) 1139-1157
McKinnon Ronald I 1973 Money and Capital in Economic Development Brooking Institution Press
Maloney William and Temel Taskin 2020 ldquoDeterminants of Social Distancing and Economic Activity during Covid-19 A Global Viewrdquo Policy Research Working Paper No 9242 World Bank Washington DC
Mohammed Nadir Djibrilla Issa and Aminur Rahman 2021 ldquoWhy the COVID-19 impact on Firms in MENA differ from other regionsrdquo Asharq Bloomberg
Murdoch James and Todd Sandler 2002 ldquoEconomic Growth Civil Wars and Spatial Spilloversrdquo Journal of Conflict Resolution 46(1) 91-110
Murdoch James and Todd Sandler 2004 Civil Wars and Economic Growth Spatial Dispersion American Journal of Political Science 48 (1) 138-151
National Public Radio (NPR) 2011 ldquoThe Impact of Rising Food Prices on Arab Unrestrdquo February 18 2011
Obstfeld Maurice and Kenneth Rogoff 1995 The Intertemporal Approach to the Current Account Handbook of International Economics 3 1731-1799
Poterba James M and Lawrence H Summers 1987 Finite Lifetimes and the Effects of Budget Deficits on National Saving Journal of Monetary Economics 202 369-391
Portes Jonathan 2020 ldquoThe Lasting Scars of the Covid-19 Crisis Channels and Impactsrdquo VoxEU Blog httpsvoxeuorgarticlelasting-scars-covid-19-crisis
Psacharopoulos George and Harry Anthony Patrinos 2018 ldquoReturns to Investment in Education A Decennial Review of the Global Literaturerdquo Education Economics 265 445-458
Rafiq Shudhasattwa Pasquale Sgro and Nicholas Apergis 2016 Asymmetric Oil Shocks and External Balances of Major Oil Exporting and Importing Countries Energy Economics 56 42ndash50
Ramey Valerie 2011 ldquoIdentifying Government Spending Shocks Its All in the Timingrdquo The Quarterly Journal of Economics 126(1) 1-50
Ramey Valerie 2019 Ten Years after the Financial Crisis What Have We Learned from the Renaissance in Fiscal Research Journal of Economic Perspectives 332 89-114
R E F E R E N C E SR E F E R E N C E S
LIVINg wITH DEBT HOw INSTITUTIONS CAN CHART A PATH TO RECOVERY FOR THE MIDDLE EAST AND NORTH AFRICA
43
Ramey Valerie 2020 ldquoThe Macroeconomic Consequences of Infrastructure Investmentrdquo National Bureau of Economic Research Working Paper 27625
Ready Robert 2018 ldquoOil Prices and the Stock Marketrdquo Review of Finance 155ndash176
Reed Tristan William Waites David Manheim Damien de Walque Chiara Vallini Roberta Gatti Timothy Hallett 2021 ldquoFive Ways that COVID-19 Diagnostics Can Save Lives Prioritizing Uses of Tests to Maximize Cost-Effectivenessrdquo Research and Policy Brief No 43 World Bank Washington DC
Reinhart Carmen 2015 The Hidden Debt Burden of Emerging Markets Project Syndicate October 9 2015
Reinhart Carmen M and Kenneth S Rogoff 2010 Growth in a Time of Debt American Economic Review Papers and Proceedings 1002 573-78
Reinhart Carmen Vincent Reinhart and Kenneth Rogoff 2012 ldquoPublic Debt Overhangs Advanced Economy Episodes Since 1800rdquo Journal of Economic Perspectives 26(3) 69-86
Reinhart Carmen and Kenneth Rogoff 2009 This Time is Different Eight Centuries of Financial Folly Princeton University Press
Reinhart Carmen and Belen Sbrancia 2015 The Liquidation of Government Debt Economic Policy 3082 291-333
Reinhart Carmen Kenneth S Rogoff and Miguel A Savastano 2003 ldquoDebt Intolerancerdquo Brookings Papers on Economic Activity 11-62
Riera-Crichton Daniel Carlos A Vegh and Guillermo Vuletin 2015 ldquoProcyclical and Countercyclical Fiscal Multipliers Evidence from OECD countriesrdquo Journal of International Money and Finance 52 15-31
Romer Cristina D and David H Romer 2010 ldquoThe Macroeconomic Effects of Tax Changes Estimates Based on a New Measure of Fiscal Shocksrdquo American Economic Review 100(3) 763-801
Roubini Nouriel and Xavier Sala-i-Martin 1992 Financial Repression and Economic Growth Journal of Development Economics 391 (1992) 5-30
Schlegl Matthias Christoph Trebesch and Mark LJ Wright 2019 The Seniority Structure of Sovereign Debt NBER Working Papers 25793 National Bureau of Economic Research Inc
United Nations Conference on Trade and Development - UNCTAD 2020 Global Trade Update October 2020
mdashmdashmdash 2021 Global Trade Update February 2021
United States Environmental Protection Agency- USEPA 2011 The Benefits and Costs of the Clean Air Act from 1990 to 2020
Veacutegh Carlos Daniel Lederman and Federico Bennet 2017 ldquoLeaning against the Wind Fiscal Policy in Latin America and the Caribbean in a Historical Perspectiverdquo LAC Semiannual Report (April) Washington DC World Bank
R E F E R E N C E S
MIDDLE EAST AND NORTH AFRICA REgION ECONOMIC UPDATE APRIL 2021
44
Veacutegh Carlos Guillermo Vuletin Daniel Riera-Crichton Diego Friedheim Luis Morano and Joseacute Andreacutee Camarena 2018 ldquoFiscal Adjustment in Latin America and the Caribbean Short-Run Pain Long-Run Gainrdquo LAC Semiannual Report (April) World Bank Washington DC
Washington Post 2015 ldquoWhere and Why Food Prices Lead to Social Upheavalrdquo February 22 2015
Williams Andrew 2009 ldquoOn the Release of Information by Governments Causes and Consequencesrdquo Journal of Development Economics 89 124ndash38
World Bank 2016 MoroccomdashIdentity and Targeting for Social Protection Project (English) Washington DCWorld Bank Group httpdocumentsworldbankorgcurateden298251489370445157Morocco-Identity-and-Targeting-for-Social-Protection-Project
mdashmdashmdash 2014 Unlocking the Employment Potential in the Middle East and North Africa
mdashmdashmdash2019 Understanding Poverty and Inequality in Egypt World Bank Washington DC
mdashmdashmdash 2020a Lebanon Economic Monitor Fall 2020 The Deliberate Depression World Bank Washington DC
mdashmdashmdash2020b Covid-19 Debt Service Suspension Initiative httpswwwworldbankorgentopicdebtbriefcovid-19-debt-service-suspension-initiative
World Bank 2020c The Human Capital Index 2020 Update Human Capital in the Time of COVID-19 World Bank Washington DC
mdashmdashmdashand IMF 2020 Djibouti Joint World Bank-IMF Debt Sustainability Analysis httpdocuments1worldbankorgcurateden649601596487780040pdfDjibouti-Joint-World-Bank-IMF-Debt-Sustainability-Analysispdf
R E F E R E N C E S
LIVINg wITH DEBT HOw INSTITUTIONS CAN CHART A PATH TO RECOVERY FOR THE MIDDLE EAST AND NORTH AFRICA
45
R E F E R E N C E S
Appendix
Appendix A1 Debt and Output Growth After Natural Disasters
Epidemics are not new to modern societies According to the Centre for Research on the Epidemiology of Disasters and its Emergency Events Database (EM-DAT) between 1900 and 2020 the world has had 15563 natural disasters of which 1492 were epidemics making them the fourth most common natural disaster after floods storms and earthquakes (see Figure A11)26 Our objective is to estimate the impact that natural disasters of large magnitude like the Covid-19 pandemic have on public debt and GDP growth in developing economies27 To achieve this our empirical strategy is based on a difference-in-difference estimator
Data
Data on natural disasters are from EM-DAT The pool of natural disasters included in EM-DAT fulfils at least one of the following outcomes in the country affected 10 or more people dead or 100 or more people affected or a declaration of a state of emergency or a call for international assistance
Since we are interested in analyzing macroeconomic trends in developing countries all developed countries (identified by the World Bankrsquos Historical Income Classification in 1987) have been excluded from the analysis If a country was created after 1987 its classification is based on the income classification the year it was created The final sample has 142 countries
Not all disasters generate damages large enough to change the macroeconomic dynamics of a country To filter events with discernable macroeconomic effects our research weights the magnitude of the damages produced by a disaster by the overall size of the economy of the affected country More specifically our econometric analysis focuses on natural disasters of high intensity that generated damages that are equivalent to at least 1 percent of the GDP of the country affected that year (based on the total estimated damages reported by EM-DAT28) Using those filters we end up with 324 natural disasters that occurred in 90 developing countries between 1960 and 2019 They include flood earthquake droughts storm landslide volcanic activity extreme temperature and wildfire
We rely on two macroeconomic indicators The first GDP annual growth comes from the World Bankrsquos World Development Indicators The second comes from the IMFrsquos Global Debt Database (GDD) Central Government Debt
26 According to the EM-DAT database from the 691 catastrophes registered for Middle East and North Africa Region between 1900 and 2020 the most common natural disasters are floods (323 episodes 467 percent of the total) earthquakes (167 episodes 242 percent) storms (72 episodes 104 percent) and epidemics (39 episodes 56 percent)
27 Our question is close to Fomby and others (2013) although their study does not examine debt28 According to EM-DAT this is a value of all damages and economic losses directly or indirectly related to the disaster
FIGURE A11 Natural Disasters 1900-2020
Flood34
Storm28
Earthquake10
Epidemic9
Landslide5
Drought5
Others2
Wildfire3
Ext Temp4
Source World Banks staff calculations based on EM-DAT database
A P P E N D I X
MIDDLE EAST AND NORTH AFRICA REgION ECONOMIC UPDATE APRIL 2021
46
Econometric strategy
Results
1
To systematically analyze the macroeconomic impacts of natural disasters in developing economies we rely on a
difference-in-difference estimator This method estimates the effect of a treatment (the onset of a natural disaster)
on an outcome (GDP growth and public debt accumulation) This is done by comparing the average change over
time of these variables for the treatment group (economies affected by a natural disaster) with the average change
over time for the control group (non-affected economies)
The econometric strategy that aims to identify these potential effects is the following difference-in-difference
estimator
= $ +micro + micro + amp(amp + )(++-012134 + 5
The subscripts c and t denote countries and event years respectively represents the macroeconomic variable
of interest (GDP growth annual percent Debt growth annual percent) The inclusion of country fixed effects (micro) along with time fixed effects (micro) implies that we will be comparing within-country macroeconomic trends of
affected economies and non-affected economies during each year in the sample
(amp is a dummy variable that identifies the year of the onset of a disaster $ represents the constant term and 5 is the error term is the coefficient of interest to be estimated which we allow to vary over the course of the
episodes of natural disasters The subscript n denotes the duration of each episode covering as mentioned above
seven years around the onset of disasters Therefore n ranges from -3 to +3 This setup implies that we are tracing
pre-disaster trends as well as post-onset trends which allows for inferences about whether the differential trends
if any predate the onset of a natural disaster Additional controls in the regression include -012134 which
is a control for the number of natural disasters during the previous six years that cause damages that cost more
than 1 percent of GDP and in the regression for public debt (+ which is the annual change in GDP We
clustered the errors at the country level
Results
Figure II1 plots the coefficients for the estimated mean differences between countries affected by natural disasters
that generated damages of at least 1 percent of their GDP and the contemporaneous control group of non-affected
countries for public debt and GDP growth The double asterisks highlight the coefficient estimates that are
statistically significant at the 10 percent level Both figures analyze the same 324 natural disasters
Debt growth significantly increases in countries affected by natural disasters that generated damages of at least 1
percent of their GDP relative to those countries who did not experience such natural disasters (see Figure II1) GDP
growth is higher in the post-disaster period in countries affected by large natural disasters relative to those
countries who did not experience them In the year of the disaster GDP growth in affected economies is significantly
lower relative to the control group But GDP growth is 09 higher in the first year after the onset of a high intensity
natural disaster and 083 percentage points higher in the second year in affected counties relative to non-affected
countries In sum although natural disasters that generated damages of at least 1 percent of a countryrsquos GDP cause
a strong economic contraction in the year they occur GDP tends to bounce back the three years following the
event reaching a rate of growth that is on average almost one percentage point higher than in non-affected
economies
1
To systematically analyze the macroeconomic impacts of natural disasters in developing economies we rely on a
difference-in-difference estimator This method estimates the effect of a treatment (the onset of a natural disaster)
on an outcome (GDP growth and public debt accumulation) This is done by comparing the average change over
time of these variables for the treatment group (economies affected by a natural disaster) with the average change
over time for the control group (non-affected economies)
The econometric strategy that aims to identify these potential effects is the following difference-in-difference
estimator
= $ +micro + micro + amp(amp + )(++-012134 + 5
The subscripts c and t denote countries and event years respectively represents the macroeconomic variable
of interest (GDP growth annual percent Debt growth annual percent) The inclusion of country fixed effects (micro) along with time fixed effects (micro) implies that we will be comparing within-country macroeconomic trends of
affected economies and non-affected economies during each year in the sample
(amp is a dummy variable that identifies the year of the onset of a disaster $ represents the constant term and 5 is the error term is the coefficient of interest to be estimated which we allow to vary over the course of the
episodes of natural disasters The subscript n denotes the duration of each episode covering as mentioned above
seven years around the onset of disasters Therefore n ranges from -3 to +3 This setup implies that we are tracing
pre-disaster trends as well as post-onset trends which allows for inferences about whether the differential trends
if any predate the onset of a natural disaster Additional controls in the regression include -012134 which
is a control for the number of natural disasters during the previous six years that cause damages that cost more
than 1 percent of GDP and in the regression for public debt (+ which is the annual change in GDP We
clustered the errors at the country level
Results
Figure II1 plots the coefficients for the estimated mean differences between countries affected by natural disasters
that generated damages of at least 1 percent of their GDP and the contemporaneous control group of non-affected
countries for public debt and GDP growth The double asterisks highlight the coefficient estimates that are
statistically significant at the 10 percent level Both figures analyze the same 324 natural disasters
Debt growth significantly increases in countries affected by natural disasters that generated damages of at least 1
percent of their GDP relative to those countries who did not experience such natural disasters (see Figure II1) GDP
growth is higher in the post-disaster period in countries affected by large natural disasters relative to those
countries who did not experience them In the year of the disaster GDP growth in affected economies is significantly
lower relative to the control group But GDP growth is 09 higher in the first year after the onset of a high intensity
natural disaster and 083 percentage points higher in the second year in affected counties relative to non-affected
countries In sum although natural disasters that generated damages of at least 1 percent of a countryrsquos GDP cause
a strong economic contraction in the year they occur GDP tends to bounce back the three years following the
event reaching a rate of growth that is on average almost one percentage point higher than in non-affected
economies A P P E N D I X
LIVINg wITH DEBT HOw INSTITUTIONS CAN CHART A PATH TO RECOVERY FOR THE MIDDLE EAST AND NORTH AFRICA
47
Appendix A2 Oil Shocks and MENArsquos Creditworthiness
1
To systematically analyze the macroeconomic impacts of natural disasters in developing economies we rely on a
difference-in-difference estimator This method estimates the effect of a treatment (the onset of a natural disaster)
on an outcome (GDP growth and public debt accumulation) This is done by comparing the average change over
time of these variables for the treatment group (economies affected by a natural disaster) with the average change
over time for the control group (non-affected economies)
The econometric strategy that aims to identify these potential effects is the following difference-in-difference
estimator
= $ +micro + micro + amp(amp + )(++-012134 + 5
The subscripts c and t denote countries and event years respectively represents the macroeconomic variable
of interest (GDP growth annual percent Debt growth annual percent) The inclusion of country fixed effects (micro) along with time fixed effects (micro) implies that we will be comparing within-country macroeconomic trends of
affected economies and non-affected economies during each year in the sample
(amp is a dummy variable that identifies the year of the onset of a disaster $ represents the constant term and 5 is the error term is the coefficient of interest to be estimated which we allow to vary over the course of the
episodes of natural disasters The subscript n denotes the duration of each episode covering as mentioned above
seven years around the onset of disasters Therefore n ranges from -3 to +3 This setup implies that we are tracing
pre-disaster trends as well as post-onset trends which allows for inferences about whether the differential trends
if any predate the onset of a natural disaster Additional controls in the regression include -012134 which
is a control for the number of natural disasters during the previous six years that cause damages that cost more
than 1 percent of GDP and in the regression for public debt (+ which is the annual change in GDP We
clustered the errors at the country level
Results
Figure II1 plots the coefficients for the estimated mean differences between countries affected by natural disasters
that generated damages of at least 1 percent of their GDP and the contemporaneous control group of non-affected
countries for public debt and GDP growth The double asterisks highlight the coefficient estimates that are
statistically significant at the 10 percent level Both figures analyze the same 324 natural disasters
Debt growth significantly increases in countries affected by natural disasters that generated damages of at least 1
percent of their GDP relative to those countries who did not experience such natural disasters (see Figure II1) GDP
growth is higher in the post-disaster period in countries affected by large natural disasters relative to those
countries who did not experience them In the year of the disaster GDP growth in affected economies is significantly
lower relative to the control group But GDP growth is 09 higher in the first year after the onset of a high intensity
natural disaster and 083 percentage points higher in the second year in affected counties relative to non-affected
countries In sum although natural disasters that generated damages of at least 1 percent of a countryrsquos GDP cause
a strong economic contraction in the year they occur GDP tends to bounce back the three years following the
event reaching a rate of growth that is on average almost one percentage point higher than in non-affected
economies
2
Appendix A2 Oil Shocks and MENArsquos Creditworthiness
We adopt the methodology followed by Ready (2018) to decompose oil shocks into supply and demand shocks
This decomposition allows us to examine the impact of both oil supply and demand shocks at daily frequency
Ready (2018) classifies and decomposes three types of oil shocks
Demand shocks the residuals of a contemporaneous regression where returns on the global index of oil producing
firms are regressed against unexpected changes in the log of VIX index (that is the uncertainty index)
Supply shocks the residuals of a contemporaneous regression where changes in oil prices are regressed against
demand shocks and unexpected changes in the VIX index
Risk shocks After obtaining oil supply and demand shocks we adopt a conventual model setup in the literature
to examine the impact of oil shocks on sovereign default risk measured by credit default swaps (CDS)
∆-(8 =$ + (∆-(8( +9)(lt8=gt-( +9+A(
-(+
amp
-(
B(30CD( +)8EFF( +G
where ΔCDSit is the daily change in sovereign CDS spread of countries denoted by i over days denoted by t
DOMESTICjit-1 contains the set of domestic control variables the daily return on each countryrsquos stock market (St
Return) and the daily change in the exchange rate of each countryrsquos currency against the US dollar (ΔFX Rate)
GLOBALjt-1 is the set of global control variables the daily change in the Chicago Board Options Exchange volatility
index (ΔVIX ) the daily SampP 500 index return (SampP500 Return) the daily change in the German 10-year Bond yield
(ΔGerman Bond) the daily change in the effective Federal Funds rate (ΔFedFund) the daily change in the European
Repo rate (ΔEuro Repo) and the daily change in the 10-year US Treasury yield (ΔTreasury) Demandt-1 is the one-
day lagged shock to the demand side of oil and Supplyt-1 is the one-day lagged shock to the supply side of oil
both shocks constructed as in Ready (2018) Exporti is an invariant dummy variable that takes the value of 1 if a
country is net oil-exporter at the beginning of the sample period and 0 otherwise Year2020 is a dummy variable
that takes the value one in days of year 2020 and zero otherwise The sample period is from January 2016 to
October 2020 Countries included in the analysis are MENA oil exporters Algeria Bahrain Iraq Kuwait Oman
Qatar Saudi Arabia and United Arab Emirates (Abu Dhabi and Dubai) and oil importers Egypt Morocco and
Tunisia The impact of oil shocks may differ based on the energy status of a country (Cashin et al 2014 Rafiq et
al 2016) Table A21 shows the baseline results for our analysis
Appendix A3 Debt and Output Growth Around Restructurings
To understand the impact of restructurings on external debt and GDP growth in developing economies we
studied the restructuring dataset constructed first by Asonuma and Trebesch (2016)
Data on restructurings
Asonuma and Trebesch (2016) provide information on the occurrence and duration of 204 restructurings globally
starting in 1978 197 of which have been completed The cases are further differentiated into two categories
preemptive restructurings and post-default restructurings In preemptive restructurings governments renegotiate
A P P E N D I X
MIDDLE EAST AND NORTH AFRICA REgION ECONOMIC UPDATE APRIL 2021
48
TABLE A21 Impacts of Global Factors and Oil Shocks on MENArsquos Credit Default Swaps
Dependent variable ΔCDSit Estimated Coefficients
ΔCDSit-1
00133
(00101)
St Returnit-1
00707
(0480)
ΔFX Rateit-1
-4620
(6089)
ΔVIXt-1
-0158
(00848)
SampP500 Returnt-1
-0492
(0165)
ΔGerman Bondt-1
9513
(3774)
ΔFedFundt-1
-2138
(2399)
ΔEuro Repot-1
7070
(7248)
ΔTreasuryt-1
0141
(3081)
Demandt-1
-0158
(0163)
Supplyt-1
000538
(0110)
Supplyt-1
Exporti
-0281
(0137)
Demandt-1
Exporti
0147
(0197)
Year20201103
(0343)
Supplyt-1
Year2020-0318
(0129)
Demandt-1
Year20200518
(0203)
Supplyt-1
ExportiYear2020
0369
(0163)
Demandt-1
ExportiYear2020
-0985
(0247)
Demandt-1
ExportiYear2020
-0477
(0101)
A P P E N D I X
LIVINg wITH DEBT HOw INSTITUTIONS CAN CHART A PATH TO RECOVERY FOR THE MIDDLE EAST AND NORTH AFRICA
49
Demandt-1
Exporti
-0010
(0123)
Supplyt-1 Export
iYear2020
-0224
(056)
Supplyt-1
Exporti
-0276
(0083)
Demandt-1
ImportiYear20200360
(0129)
Demandt-1
ImportiYear2020-0312
(0068)
Constant-0183
(0253)
Country Effects Yes
Year Effects Yes
Observations 9999
R-squared 0012
Number of Countries 12
Appendix A3 Debt and Output Growth Around Restructurings
Data on restructurings
2
Appendix A2 Oil Shocks and MENArsquos Creditworthiness
We adopt the methodology followed by Ready (2018) to decompose oil shocks into supply and demand shocks
This decomposition allows us to examine the impact of both oil supply and demand shocks at daily frequency
Ready (2018) classifies and decomposes three types of oil shocks
Demand shocks the residuals of a contemporaneous regression where returns on the global index of oil producing
firms are regressed against unexpected changes in the log of VIX index (that is the uncertainty index)
Supply shocks the residuals of a contemporaneous regression where changes in oil prices are regressed against
demand shocks and unexpected changes in the VIX index
Risk shocks After obtaining oil supply and demand shocks we adopt a conventual model setup in the literature
to examine the impact of oil shocks on sovereign default risk measured by credit default swaps (CDS)
∆-(8 =$ + (∆-(8( +9)(lt8=gt-( +9+A(
-(+
amp
-(
B(30CD( +)8EFF( +G
where ΔCDSit is the daily change in sovereign CDS spread of countries denoted by i over days denoted by t
DOMESTICjit-1 contains the set of domestic control variables the daily return on each countryrsquos stock market (St
Return) and the daily change in the exchange rate of each countryrsquos currency against the US dollar (ΔFX Rate)
GLOBALjt-1 is the set of global control variables the daily change in the Chicago Board Options Exchange volatility
index (ΔVIX ) the daily SampP 500 index return (SampP500 Return) the daily change in the German 10-year Bond yield
(ΔGerman Bond) the daily change in the effective Federal Funds rate (ΔFedFund) the daily change in the European
Repo rate (ΔEuro Repo) and the daily change in the 10-year US Treasury yield (ΔTreasury) Demandt-1 is the one-
day lagged shock to the demand side of oil and Supplyt-1 is the one-day lagged shock to the supply side of oil
both shocks constructed as in Ready (2018) Exporti is an invariant dummy variable that takes the value of 1 if a
country is net oil-exporter at the beginning of the sample period and 0 otherwise Year2020 is a dummy variable
that takes the value one in days of year 2020 and zero otherwise The sample period is from January 2016 to
October 2020 Countries included in the analysis are MENA oil exporters Algeria Bahrain Iraq Kuwait Oman
Qatar Saudi Arabia and United Arab Emirates (Abu Dhabi and Dubai) and oil importers Egypt Morocco and
Tunisia The impact of oil shocks may differ based on the energy status of a country (Cashin et al 2014 Rafiq et
al 2016) Table A21 shows the baseline results for our analysis
Appendix A3 Debt and Output Growth Around Restructurings
To understand the impact of restructurings on external debt and GDP growth in developing economies we
studied the restructuring dataset constructed first by Asonuma and Trebesch (2016)
Data on restructurings
Asonuma and Trebesch (2016) provide information on the occurrence and duration of 204 restructurings globally
starting in 1978 197 of which have been completed The cases are further differentiated into two categories
preemptive restructurings and post-default restructurings In preemptive restructurings governments renegotiate
3
with lenders while they are still current on their loan payments In post-default restructurings governments
unilaterally default then start to renegotiate their debt Among the 197 finished restructurings 81 were
preemptive and 116 were post-default Many countries have multiple restructurings Among 74 countries that had
completed restructurings five are from MENA region
To analyze the macroeconomic impact of restructurings before during and after the restructurings started we
apply an event study approach transforming calendar years into event years We focus on the three years before
the year of the onset and the three years after a restructuring (analyzing seven years in total) In this new timeline
year zero corresponds to the year a restructuring began As in Appendix A1 our sample is all countries not classified
as a high-Income in 1987 in the World Bankrsquos Historical Income Classification dataset
Data on GDP growth and external debt
The two outcome variables are annual growth in real GDP and the annual growth rate of the external debt in US
dollars Both are from the IMFrsquos World Economic Outlook (October 2020) with data starting from 1981 By
focusing on the change of external debt level the difference-in-difference estimator can show the differential
level of acceleration of debt accumulation between affected and non-affected countries in the years before
during and after restructuring started
Econometric strategy
To systematically analyze the macroeconomic impacts of restructurings in developing economies we rely on a
difference-in-difference estimator (similar to the approach Appendix A1) The baseline econometric strategy that
aims to identify these potential effects is the following difference-in-difference estimator
= $ + H + H + I + 9 ampamp
(
amp-++ 9 A +
+
-(5
where represents the macroeconomic variable of interest (annual growth of real GDP and annual growth of
debt level) of country c at year t H is the country fixed effects H is year fixed effects I is a dummy variable
that takes the value of 1 for the onset of restructuring years that is the first year of the restructuring and 0
otherwise n is the number of years before the first year of restructuring (going from 3 years before the default (-
3-2-1) amp is a dummy variable that takes a value of 1 if it is n year before the restructuring and 0 otherwise m
is the number of years after the first year of restructuring (going from 1 to 3 years after the first year of
restructuring (123) A is a dummy variable that takes a value of 1 if it is m years after the onset of restructuring
and 0 otherwise The coefficients of interests are (what happens when restructuring starts) β (n=1 to 3) what
happens 3 years before the restructuring (m=1 to 3) what happens after restructuring starts
To control for overlapping events we have added frequency indicators in all regressions For each of the seven
years on the timeline there are three different counts (1) how many windows of three years before a restructuring
overlap with that specific year (2) how many events starts on the same year and (3) how many windows of three
years after a restructuring overlap with that specific year These construct three counts for each year on the
timeline of an event resulting in a total of 21 variables
In an extension to see if the macroeconomics respond differently to preemptive restructurings and post-default
restructurings we extended the baseline regression with a different set of dummies between the two categories
A P P E N D I X
MIDDLE EAST AND NORTH AFRICA REgION ECONOMIC UPDATE APRIL 2021
50
Data on GDP growth and external debt
Econometric strategy
3
with lenders while they are still current on their loan payments In post-default restructurings governments
unilaterally default then start to renegotiate their debt Among the 197 finished restructurings 81 were
preemptive and 116 were post-default Many countries have multiple restructurings Among 74 countries that had
completed restructurings five are from MENA region
To analyze the macroeconomic impact of restructurings before during and after the restructurings started we
apply an event study approach transforming calendar years into event years We focus on the three years before
the year of the onset and the three years after a restructuring (analyzing seven years in total) In this new timeline
year zero corresponds to the year a restructuring began As in Appendix A1 our sample is all countries not classified
as a high-Income in 1987 in the World Bankrsquos Historical Income Classification dataset
Data on GDP growth and external debt
The two outcome variables are annual growth in real GDP and the annual growth rate of the external debt in US
dollars Both are from the IMFrsquos World Economic Outlook (October 2020) with data starting from 1981 By
focusing on the change of external debt level the difference-in-difference estimator can show the differential
level of acceleration of debt accumulation between affected and non-affected countries in the years before
during and after restructuring started
Econometric strategy
To systematically analyze the macroeconomic impacts of restructurings in developing economies we rely on a
difference-in-difference estimator (similar to the approach Appendix A1) The baseline econometric strategy that
aims to identify these potential effects is the following difference-in-difference estimator
= $ + H + H + I + 9 ampamp
(
amp-++ 9 A +
+
-(5
where represents the macroeconomic variable of interest (annual growth of real GDP and annual growth of
debt level) of country c at year t H is the country fixed effects H is year fixed effects I is a dummy variable
that takes the value of 1 for the onset of restructuring years that is the first year of the restructuring and 0
otherwise n is the number of years before the first year of restructuring (going from 3 years before the default (-
3-2-1) amp is a dummy variable that takes a value of 1 if it is n year before the restructuring and 0 otherwise m
is the number of years after the first year of restructuring (going from 1 to 3 years after the first year of
restructuring (123) A is a dummy variable that takes a value of 1 if it is m years after the onset of restructuring
and 0 otherwise The coefficients of interests are (what happens when restructuring starts) β (n=1 to 3) what
happens 3 years before the restructuring (m=1 to 3) what happens after restructuring starts
To control for overlapping events we have added frequency indicators in all regressions For each of the seven
years on the timeline there are three different counts (1) how many windows of three years before a restructuring
overlap with that specific year (2) how many events starts on the same year and (3) how many windows of three
years after a restructuring overlap with that specific year These construct three counts for each year on the
timeline of an event resulting in a total of 21 variables
In an extension to see if the macroeconomics respond differently to preemptive restructurings and post-default
restructurings we extended the baseline regression with a different set of dummies between the two categories
A P P E N D I X
LIVINg wITH DEBT HOw INSTITUTIONS CAN CHART A PATH TO RECOVERY FOR THE MIDDLE EAST AND NORTH AFRICA
51
Results
4
= $ + H + H + I + 9 ampamp(
amp-++ 9 A +
+
-(0( + 9 amp0amp0
(
amp-++ 9 0A0 +
+
-(5
I is a dummy that takes 1 if a preemptive restructuring starts ( is a dummy that takes 1 if a post-default
restructuring happens amp is a dummy that takes 1 if n years before a preemptive restructuring amp0 is a dummy
that takes 1 if n years before a post-default restructuring Aamp is a dummy that takes 1 if n years after the start of a
preemptive restructuring Aamp0 is a dummy that takes 1 in n years after a default starts The seven in the first set
will trace macroeconomic trend for preemptive restructurings while the seven in the second set will trace
macroeconomic trend for post-default restructurings
Results
Restructurings are costly to output growth and even costlier in post-default restructurings In addition
restructurings seem to slow debt growth Panel A of Figure II7 shows that countries experience lower growth
relative to the baseline in the years preceding restructuringsmdashwhether preemptive or post-default However after
the first year of restructuring growth starts to recover for preemptive restructuring but remains depressed for
post-default restructurings Panel B of Figure II7 shows that during the first two years after the restructuring
starts debt growth is significantly lower in both preemptive and post-default cases relative to countries without
restructurings This could reflect the defaulting countriesrsquo exclusion from the international debt market and the
reduction in debt granted by creditors during restructuring negotiations
A P P E N D I X
MIDDLE EAST AND NORTH AFRICA REgION ECONOMIC UPDATE APRIL 2021
52
APPENDIX TABLE B1 World Bankrsquos Growth Current Account and Fiscal Account Forecasts
Real GDP Growthpercent
Real GDP per capita Growthpercent
Current Account Balancepercent of GDP
Fiscal Balancepercent of GDP
2019 2020e 2021f 2022f 2019 2020e 2021f 2022f 2019 2020e 2021f 2022f 2019 2020e 2021f 2022f
MENA 00 -38 22 35 -13 -53 06 19 21 -38 -09 07 -42 -94 -66 -46
Developing MENA -08 -28 23 37 -16 -41 06 21 -21 -46 -46 -35 -47 -76 -75 -64
Oil Exporters -08 -42 23 34 -21 -60 05 17 38 -37 01 20 -36 -98 -63 -39
gCC 07 -49 22 33 -15 -63 06 19 62 -29 24 44 -36 -113 -57 -30
Qatar 08 -32 30 41 -10 -48 13 24 24 -25 17 27 10 -36 -23 27
United Arab Emirates 17 -63 12 25 02 -74 02 15 65 -15 29 49 -10 -80 -05 17
Kuwait 04 -54 24 36 -60 -62 08 22 164 -27 82 117 -98 -262 -226 -193
Bahrain 20 -54 33 32 -25 -88 06 11 -21 -95 -69 -46 -93 -175 -116 -94
Saudi Arabia 03 -41 24 33 -13 -56 09 19 66 -27 26 45 -42 -113 -56 -30
Oman -08 -63 25 65 -37 -87 02 45 -55 -104 -81 -52 -90 -174 -68 -46
Developing Oil Exporters -31 -31 24 36 -42 -51 06 18 00 -50 -49 -32 -36 -75 -76 -61
Iraq 24 -119 19 84 15 -149 -16 47 61 -129 -113 -56 14 -44 -54 -10
Iran Islamic Rep -68 17 21 22 -79 05 10 11 06 -08 08 11 -37 -63 -67 -70
Algeria 08 -55 36 23 -12 -69 21 09 -100 -144 -121 -114 -96 -164 -121 -100
Developing Oil Importers 32 -22 22 40 17 -30 05 25 -56 -39 -43 -38 -66 -77 -75 -67
Lebanon -67 -203 -95 -68 -199 -88 -212 -110 -67 -105 -49 -28
Jordan 20 -18 14 22 05 -27 08 19 -21 -72 -70 -60 -46 -67 -64 -54
Djibouti 78 05 55 60 61 -09 40 45 149 201 -15 -08 -05 -17 -19 -17
West Bank and Gaza 14 -115 35 32 -12 -137 09 04 -104 -65 -81 -83 -45 -76 -64 -57
Morocco 25 -70 42 37 12 -81 30 26 -41 -30 -35 -39 -36 -77 -65 -64
Tunisia 10 -88 40 26 -01 -98 30 17 -85 -68 -92 -90 -31 -100 -86 -68
Egypt Arab Rep 56 36 23 45 35 16 04 26 -36 -30 -34 -28 -81 -80 -82 -70
Memorandum
Libya 25 -313 667 10 -322 646 116 -464 -62 17 -644 -90
Sources Authorsrsquo calculations based on data from World Bank Macro and Poverty Outlooks April 2021Note e=estimate f=forecast and NP=not presented GDP is at market prices Data are rounded up to a single digit Data for Egypt correspond to its fiscal year (July-June) Libya Syria and Yemen are not included in the regional and sub-regional averages due to lack of data Lebanon and Libya are not forecasted beyond 2021 due to high uncertainty
Data Appendix
A P P E N D I X
LIVINg wITH DEBT HOw INSTITUTIONS CAN CHART A PATH TO RECOVERY FOR THE MIDDLE EAST AND NORTH AFRICA
53
APPENDIX TABLE B2 Magnitude of Revisions to Macro Forecasts by the World Bank
Panel A Between April 2021 and October 2019
Real GDP growth(April 2021 - October 2019)
Current Account Balance(April 2021 - October 2019)
Fiscal Balance(April 2021 - October 2019)
2020e 2021f 2020e 2021f 2020e 2021f
MENA -64 -06 -46 -17 -48 -23
Developing MENA -58 -08 -03 -04 -17 -18
Oil Exporters -63 -01 -62 -23 -57 -25
gCC -71 -05 -86 -37 -80 -29
Qatar -62 -02 -79 -30 -56 -50
United Arab Emirates -89 -18 -76 -28 -70 01
Kuwait -79 -04 -113 -07 -204 -169
Bahrain -75 10 -61 -32 -98 -40
Saudi Arabia -57 02 -98 -53 -68 -15
Oman -98 -15 -14 -11 -80 02
Developing Oil Exporters -50 07 -16 -13 -21 -21
Iraq -169 -08 -89 -72 -10 -23
Iran Islamic Rep 16 12 -03 11 -04 -07
Algeria -74 14 -38 04 -92 -49
Developing Oil Importers -66 -24 15 09 -12 -13
Lebanon -206 -99 104 146 49 70
Jordan -41 -11 -09 -06 -43 -44
Djibouti -69 -25 12 -239 -11 -27
West Bank and Gaza -104 39 34 16 42 50
Morocco -105 07 07 -02 -42 -31
Tunisia -110 14 39 09 -50 -39
Egypt Arab Rep -22 -37 -04 -08 -04 -12
Sources Authorsrsquo calculations based on data from World Bank Macro and Poverty Outlook Note Libya Syria and Yemen are not included in the regional and sub-regional averages due to lack of reliable data The changes are in percentage points Lebanon is not forecasted beyond 2021
A P P E N D I X
MIDDLE EAST AND NORTH AFRICA REgION ECONOMIC UPDATE APRIL 2021
54
Panel B Between April 2021 and October 2020
Real GDP growth(April 2021 - October 2020)
Current Account Balance(April 2021 - October 2020)
Fiscal Balance(April 2021 - October 2020)
2020e 2021f 2022f 2020e 2021f 2022f 2020e 2021f 2022f
MENA 13 03 04 11 23 23 07 13 11
Developing MENA 19 02 00 11 -01 01 20 11 09
Oil Exporters 16 04 06 09 29 29 08 16 16
gCC 08 04 07 11 42 38 -08 13 10
Qatar -12 00 11 -15 08 08 00 15 14
United Arab Emirates 00 00 00 00 00 00 00 00 00
Kuwait 25 14 07 25 91 95 15 04 -39
Bahrain -02 11 07 -16 -04 08 -41 -16 -07
Saudi Arabia 13 04 11 21 70 62 -13 22 27
Oman 31 20 -14 40 46 10 07 98 63
Developing Oil Exporters 30 03 05 07 -05 01 32 19 21
Iraq -24 -01 11 -07 -33 -11 124 85 94
Iran Islamic Rep 62 06 05 -02 02 04 03 -01 -01
Algeria 11 -02 02 -10 36 32 -06 09 -04
Developing Oil Importers 00 01 -06 17 04 02 05 01 -07
Lebanon -11 37 -66 -111 96 120
Jordan 37 -23 00 04 -06 -08 15 -08 -05
Djibouti 15 -16 -12 42 -178 -174 06 11 05
West Bank and Gaza -36 12 08 28 20 18 -32 -21 -16
Morocco -07 09 02 69 30 13 -01 -12 -22
Tunisia 04 -19 07 03 -29 -26 -19 -30 -21
Egypt Arab Rep 01 -01 -13 11 10 05 02 02 -01
Sources Authorsrsquo calculations based on data from World Bank Macro and Poverty Outlook Note Libya Syria and Yemen are not included in the regional and sub-regional averages due to lack of reliable data The changes are in percentage points Lebanon is not forecasted beyond 2021
A P P E N D I X
LIVINg wITH DEBT HOw INSTITUTIONS CAN CHART A PATH TO RECOVERY FOR THE MIDDLE EAST AND NORTH AFRICA
55
APPENDIX TABLE B3 Overview of MENArsquos Debt
Public Debt
Public Domestic
Debt
Public External
Debt
External Debt to Official Debtor
Public amp Private
External Debt
Interest Payments for Public
Debt
Moodys Rating Foreign
Currency Long Term DebtWorld
Bankrsquos MPOWorld
Bankrsquos MPOWorld
Bankrsquos MPOWorld
Banks IDSIMFrsquos WEO
World Bankrsquos MPO
2019 2020 2019 2020 2019 2020 2019 2019 2020 2019 2020 112020 1212021
Gu
lf C
oo
pe
rati
on
C
ou
nci
l
Qatar 57 641 1314 1613 16 18 Aa3 Aa3
United Arab Emirates 201 25 767 975 03 03 Aa2 Aa2
kuwait 203 225 488 645 03 08 Aa2 A1
Bahrain 1023 1324 2264 2546 45 49 B2u B2u
Saudi Arabia 231 328 232 299 08 12 A1 A1
Oman 601 812 924 1215 23 28 Ba1 Ba3
Oth
er
Oil
E
xpo
rte
rs
Libya 488 1371
Iraq 482 693 233 344 249 35 309 405 12 11 Caa1 Caa1
Iran 479 503 01 17 17 07 1
Algeria 456 514 450 508 06 06 08 23 19 06 06
Yemen 527 227 30 274 243 256 38
Oil
Imp
ort
ers
Lebanon 171 1867 1076 878 634 99 36 1978 4828 10 22 Caa2 C
Jordan 974 109 583 641 39 449 190 68 776 35 41 B1 B1
Djibouti 669 702 04 02 664 699 644 66 702 13 12
west Bank and gaza 163 242 92 154 71 88 03 04
Morocco 649 778 509 584 14 194 198 331 392 23 25 Ba1 Ba1
Tunisia 718 872 223 279 495 593 411 994 972 27 38 B2 B2
Egypt 902 875 725 686 178 19 190 36 344 10 98 B2 B2
world Median 519 632 196 227 268 303 200 505 592 16 19
High-income median 569 653 266 349 191 233 885 1017 21 23
Middle-income median 515 649 200 230 274 324 190 473 543 18 21
Low-income median 525 505 176 187 268 297 244 314 321 11 13
Source World Bankrsquos Macro and Poverty Outlook (April 2021) World Bankrsquos International Debt Statistics IMFrsquos World Economic OutlookNote Debt and interest payments are in percent of GDP Official external debt includes debt held by international organizations (multilateral loans) and by foreign governments (bilateral loans)
A P P E N D I X
MIDDLE EAST AND NORTH AFRICA REgION ECONOMIC UPDATE APRIL 2021
56
APPENDIX TABLE B4 Characteristics of MENA Economies
Public Debt Output Gap Governance InflationExchange Rate Arrangement
( of GDP) (percentage points) (score) (percent)
World Bankrsquos MPO
World Bankrsquos MPO
World BankWorld Bankrsquos
MPOIMF
2019 2020 2020 2019 2019 2020 2019
Gu
lf C
oo
pe
rati
on
C
ou
nci
l
Qatar 57 641 -49 07 -09 -26 Conventional peg
United Arab Emirates 201 25 -9 11 -19 -16 Conventional peg
kuwait 203 225 -55 01 11 09 Conventional peg
Bahrain 1023 1324 -82 04 1 -26 Conventional peg
Saudi Arabia 231 328 -56 01 -12 34 Conventional peg
Oman 601 812 -83 04 01 -1 Conventional peg
Oth
er
Oil
E
xpo
rte
rs
Libya 488 1371 -2 -3 -2 Conventional peg
Iraq 482 693 -183 -14 -02 06 Conventional peg
Iran 479 503 11 -09 413 369 Stabilized arrangement
Algeria 456 514 -75 -09 23 21 Crawl-like arrangement
Yemen 527 29 -19 10 264 Stabilized arrangement
Oil
Imp
ort
ers
Lebanon 171 1867 -191 -07 29 843 Stabilized arrangement
Jordan 974 109 -39 01 08 03 Conventional peg
Djibouti 669 702 -67 -08 33 18 Currency board
west Bank and gaza 163 242 -148 08 -07
Morocco 649 778 -101 -02 02 07 Stabilized arrangement
Tunisia 718 872 -104 -02 67 56 Crawl-like arrangement
Egypt 902 875 -12 -06 139 57 Stabilized arrangement
world Median 519 632 -67 -01 28 3
High-income median 569 653 -86 11 11 15
Middle-income median 515 649 -73 -04 28 26
Low-income median 525 505 -41 -04 31 59
Sources World Bank Macro Poverty Outlook (October 2020) and World Governance Indicators International Monetary Fund Annual Report on Exchange Arrangements and Exchange RestrictionsNote Output gap = growth in 2020 minus average growth from 2015 through 2019) Governance is the average of Regulatory Quality Government Effectiveness and Rule of Law A lower score represents lower governance quality
A P P E N D I X
LIVINg wITH DEBT HOw INSTITUTIONS CAN CHART A PATH TO RECOVERY FOR THE MIDDLE EAST AND NORTH AFRICA
57
APPENDIX TABLE B5 Public Debt Reporting in MENA
Alg
eri
a
Ba
hra
in
Djib
ou
ti
Eg
yp
t A
rab
Re
p
Ira
n I
sla
mic
Re
p
Ira
q
Jord
an
Ku
wa
it
Leb
an
on
Lib
ya
Mo
rocc
o
Om
an
Qa
tar
Sa
ud
i Ara
bia
Sy
ria
Tun
isia
Un
ite
d A
rab
Em
ira
tes
We
st B
an
k a
nd
Ga
za
Yem
en
Central government radic radic radic radic times radic radic radic radic radic radic radic radic radic radic radic radic
State and local government na radic radic times radic radic na radic na na na na radic times times
Other elements of the general government times radic times radic times radic times times
ow social security fundna radic times radic radic times radic times na
ow extra budgetary fundstimes radic times na times times radic times times
guarantees (to other public and private sector including to SOEs)
times times radic radic radic radic radic radic times times times radic radic times na
Central bank (borrowed on behalf of the government) na na radic radic times radic na radic na radic na
Non-guaranteed SOE debt times times times times times times times times times radic times na na
Source World Bank staffNote Table follows the public debt reporting template of World Bank-IMFrsquos Debt Sustainability Framework (see IMF 2017) radic indicates the country reports the type of debt (for both domestic and external debts) times indicates the country has the type of debt but does not report it na = not applicable and indicates that the country might not have this type of debt blank cells indicate that World Bank economists do not have information regarding whether the country has the type of debt but does not report it or that the country does not have the type of debt or that the debt might be included in total government debt Debt reporting is as of 2020 Red cells indicate changes between 2019 and 2020
A P P E N D I X
MIDDLE EAST AND NORTH AFRICA REgION ECONOMIC UPDATE APRIL 2021
58
W O R L D B A N K M I D D L E E A S T A N D N O R T H A F R I C A R E G I O NMENA ECONOMIC UPDATE APRIL 2021
P R E F A C E

LIVING WITH DEBT How Institutions Can Chart a Path to Recovery in the Middle East and North Africa
WORLD BANK MIDDLE EAST AND NORTH AFRICA REGION
MENA ECONOMIC UPDATE APRIL 2021
2021 International Bank for Reconstruction and Development The World Bank
1818 H Street NW Washington DC 20433
Telephone 202-473-1000 Internet wwwworldbankorg
Some rights reserved
1 2 3 4 24 23 22 21
This work is a product of the staff of The World Bank with external contributions The findings interpretations and conclusions expressed in this work do not necessarily reflect the views of The World Bank its Board of Executive Directors or the governments they represent The World Bank does not guarantee the accuracy of the data included in this work The boundaries colors denominations and other information shown on any map in this work do not imply any judgment on the part of The World Bank concerning the legal status of any territory or the endorsement or acceptance of such boundaries
Nothing herein shall constitute or be considered to be a limitation upon or waiver of the privileges and immunities of The World Bank all of which are specifically reserved
Rights and Permissions
This work is available under the Creative Commons Attribution 30 IGO license (CC BY 30 IGO) httpcreativecommonsorglicensesby30igo Under the Creative Commons Attribution license you are free to copy distribute transmit and adapt this work including for commercial purposes under the following conditions
AttributionmdashPlease cite the work as follows Gatti Roberta Lederman Daniel Nguyen Ha M Alturki Sultan Abdulaziz Fan Rachel Yuting Islam Asif M Rojas Claudio J 2021 ldquoLiving with Debt How Institutions Can Chart a Path to Recovery for the Middle East and North Africardquo Middle East and North Africa Economic Update (April) Washington DC World Bank Doi 101596978-1-4648-1699-4 License Creative Commons Attribution CC BY 30 IGO
TranslationsmdashIf you create a translation of this work please add the following disclaimer along with the attribution This translation was not created by The World Bank and should not be considered an official World Bank translation The World Bank shall not be liable for any content or error in this translation
AdaptationsmdashIf you create an adaptation of this work please add the following disclaimer along with the attribution This is an adaptation of an original work by The World Bank Views and opinions expressed in the adaptation are the sole responsibility of the author or authors of the adaptation and are not endorsed by The World Bank
Third-party contentmdashThe World Bank does not necessarily own each component of the content contained within the work The World Bank therefore does not warrant that the use of any third-party-owned individual component or part contained in the work will not infringe on the rights of those third parties The risk of claims resulting from such infringement rests solely with you If you wish to re-use a component of the work it is your responsibility to determine whether permission is needed for that re-use and to obtain permission from the copyright owner Examples of components can include but are not limited to tables figures or images
All queries on rights and licenses should be addressed to World Bank Publications The World Bank Group 1818 H Street NW Washington DC 20433 USA e-mail pubrightsworldbankorg
ISBN (electronic) 978-1-4648-1699-4
DOI 101596978-1-4648-1699-4
Cover photo credit Royalty-free Shutterstockcom Illustration ID 98788745 by Lightspring
Contents
Acknowledgements iv
Abbreviations v
Preface vi
Overview 2
CHAPTER I A Continuing Crisis 6
I1 The Ongoing Pandemic in MENA 6
I2 Economic Consequences of the Pandemic 9
Macroeconomic Impact 9
Poverty Distributional and Long-Term Impacts 12
Fiscal Balances and Public Debt 15
Chapter II How Institutions Can Chart a Path to Recovery for the Middle East and North Africa 21
II1 Tensions between Short-run Needs and Long-run Costs of Debt-financed Spending 21
The Short-run Needs 21
The Long-Run Costs 24
II2 The Role of Institutions in Shaping the Tradeoff 28
Prioritizing Spending during the Pandemic - Transparency and Surveillance 29
The Effectiveness of Public Investment Depends on Governance 30
Mitigating the Costs of Public Debt after the Pandemic with Transparency and Governance 32
II3 How Institutions Shape the Recovery 38
References 39
Appendix 46
Appendix A1 Debt and Output Growth After Natural Disasters 46
Appendix A2 Oil Shocks and MENArsquos Creditworthiness 48
Appendix A3 Debt and Output Growth Around Restructurings 50
Data Appendix 53
List of Tables
Chapter I A Continuing Crisis
Table I1 Covid-19 Cases and Tests per Million People in MENA Countries 7
Table I2 Covid-19 Vaccination Programs in MENA 8
Chapter II How Institutions Can Chart a Path to Recovery for the Middle East and North Africa
Table II1 Country Characteristics and the Size of Fiscal Multipliers 31
Appendix
Table A21 Impacts of Global Factors and Oil Shocks on MENArsquos Credit Default Swaps 49
Appendix Table B1 World Bankrsquos Growth Current Account and Fiscal Account Forecasts 53
Appendix Table B2 Magnitude of Revisions to Macro Forecasts by the World Bank 54
Appendix Table B3 Overview of MENArsquos Debt 56
Appendix Table B4 Characteristics of MENA Economies 57
Appendix Table B5 Public Debt Reporting in MENA 58
List of Figures
Chapter I A Continuing Crisis
Figure I1 Purchasing Managersrsquo Index 10
Figure I2 GDP Level Forecasts 11
Figure I3 Test positivity Rates and Growth Downgrades 12
Figure I4 Distributional Effects of Covid-19 14
Figure I5 Changes in Real Government Revenue and Expenditure in 2020 16
Figure I6 Median Public Debt by Country Group 16
Figure I7 Decomposition of Changes in Public Debt in MENA 2020 and 2021 17
Figure I8 Credit Default Swaps for Available MENA Countries 18
Figure I9 Expected Oil Production and Consumption 20
Chapter II How Institutions Can Chart a Path to Recovery for the Middle East and North Africa
Figure II1 Public Debt and Output Growth around Natural Disasters 22
Figure BII1 Public Debt around Armed Conflicts 23
Figure II2 Correlations between Public Debt Interest Payments and Private Investment 25
Figure II3 Median Annual per Capita Growth During 2000-2019 across Countries Ranked by Central Government Debt in 2000 27
Figure II4 Coupon Rates of US Dollar-denominated Debt Issuances during the Pandemic by Maturity for MENA countries Chile and Brazil 28
Figure II5 GDP Growth in Lebanon and Jordan 35
Figure II6 Growth and Governance before Restructurings 36
Figure II7 Output Growth and Debt Growth around Restructurings 38
Appendix
Figure A11 Natural Disasters 1900-2020 46
List of Boxes
Chapter II How Institutions Can Chart a Path to Recovery for the Middle East and North Africa
Box II1 Conflicts Debt and Growth 23
Box II2 The Debt Service Suspension Initiative (DSSI) 32
Acknowledgements
The MENA Economic Update is a product of the Chief Economist Office of the Middle East and North Africa Region (MNACE) of the World Bank The report was written by Roberta Gatti (Regional Chief Economist) Daniel Lederman (Deputy Chief Economist) Ha M Nguyen (Team Lead) Sultan Abdulaziz Alturki Rachel Yuting Fan Asif M Islam and Claudio J Rojas
Helpful guidance and comments were provided by Ferid Belhaj (Regional Vice President) Carmen Reinhart (Vice President and Chief Economist of the World Bank Group) Eric Le Borgne Kevin Carey Nancy Lozano Gracia Jesko S Hentschel Djibrilla Issa Graciela Kaminsky Stefan G Koeberle Nadir Mohammed Steven Pennings Ismail Radwan Sergio Schmukler Ayat Soliman and Marina Wes
Inputs from Mark Ahern Dalia Al Kadi Khaled Alhmoud Sara B Alnashar Amir Mokhtar Althibah Jaime de Pinies Bianchi Javier Diaz Cassou Damir Cosic Emmanuel F Cuvillier Cyril Desponts Romeo Jacky Gansey Michael Geiger Ugo Gentilini Alexander Haider Naji Mohamad Abou Hamde Mouna Hamden Wissam Harake Johannes G Hoogeveen Sahar Sajjad Hussain Rick Emery Tsouck Ibounde Amina Iraqi Robert Bou Jaoude Anastasia Janzer-Araji Majid Kazemi Naoko C Kojo Shireen Mahdi Wael Mansour Ashwaq Natiq Maseeh Minh Cong Nguyen Harun Onder Aminur Rahman Nate Rawlings Saadia Refaqat Christina Wood and Marwane Zouaidi are much appreciated
We thank James L Rowe Jr for editing the manuscript Help from Translation and Printing amp Multimedia Unit from The World Bankrsquos Global Corporate Solutions is acknowledged Stellar administrative support was provided by Swati Raychaudhuri
A C k N O w L E D g E M E N T S
MIDDLE EAST AND NORTH AFRICA REgION ECONOMIC UPDATE APRIL 2021
iv
Abbreviations
CDC Centers for Disease Control and Prevention
CDS Credit Default Swaps
COVAX COVID-19 Vaccines Global Access
COVID-19 Coronavirus Disease 2019
DSA Debt Sustainability Analysis
DSSI Debt Service Suspension Initiative
EM-DAT Emergency Events Database
FDI Foreign Direct Investment
FOMC Federal Open Market Committee
g20 Group of 20 Advanced Economies
gCC Gulf Cooperation Council
gDD Global Debt Database
gDP Gross Domestic Product
gHS Global Health Security
IDS International Debt Statistics
IMF International Monetary Fund
MENA Middle East and North Africa
MPO Macro and Poverty Outlook
NPR National Public Radio
OECD Organization for Economic Cooperation and Development
PMI Purchasing Managersrsquo Index
RHS Right-hand side
SOE State-Owned Enterprises
UAE United Arab Emirates
UNCTAD United Nations Conference on Trade and Development
USEIA US Energy Information Administration
VIX Chicago Board Options Exchange Volatility Index
wEO World Economic Outlook
wHO World Health Organization
A B B R E V I AT I O N S
LIVINg wITH DEBT HOw INSTITUTIONS CAN CHART A PATH TO RECOVERY FOR THE MIDDLE EAST AND NORTH AFRICA
v
Preface
One year ago the first cases of a new coronavirus appeared in the Middle East and North Africa (MENA) region and the pandemic that followed has been wreaking havoc ever since Nearly every country in MENA has been overwhelmed by a surge of deadly infections accompanied by collapsing economies that threw millions of people out of work and pushed many more into poverty
The pandemic hit MENA countries at a bad time Many countries in the region entered 2020 with chronic low growth persistent macroeconomic imbalances and governance challenges including a deficit in transparency Public health systems in developing MENA countries were unprepared to face the pandemic
Today the MENA region like the rest of the world remains in crisis But we can see hopeful signs of light through the tunnel Vaccines to fight COVID-19 the disease caused by the coronavirus are being produced and in some countries rapidly deployed Shortages of medical supplies are abating There is evidence that the lockdowns and social distancing that caused the economic distress have also helped tamp down the spread of the virus And after a sharp contraction in GDP a recovery of sorts is forecast for the global economy and for the MENA region in 2021
But that recovery is unlikely to be strong enough to get the MENA regionrsquos output back to pre-pandemic levels And the substantial borrowing that MENA governments had to incur to finance essential health and social protection measures boosted government debt dramatically The average public debt in MENA countries is expected to rise 8 percentage points from about 46 percent of gross domestic product (GDP) in 2019 to 54 percent in 2021 Notably debt among MENA oil importers is expected to average about 93 percent of GDP in 2021 And the need to keep spendingmdashand keep borrowingmdashwill remain strong for the immediate future
The tension between short-term needs and long-term consequences is stark for countries in the MENA region For many debt repayments are large and growing Moreover although global interest rates are at an all-time low some MENA countries do not have access to markets because they are not considered creditworthy while some others must pay high rates Poor governance and lackluster growth prospects prevent them from taking advantage of favorable global credit conditions Consequently most MENA countries may find themselves in a post-pandemic world stuck with a debt service bill sucking up resources that otherwise could be devoted to economic development
This report examines both the regionrsquos economic challenges and the uncomfortable tradeoffs governments will have to make in the coming years They have no option but to continue spending on health and income transfers as long as the pandemic continues That will improve the health and help maintain the financial stability of their citizens But it will also add to already high debt burdens which spell complicated policy decisions after the pandemic recedes Should MENA governments then immediately turn their attention to providing fiscal stimulus to stumbling economies Will they need to Pent-up demandmdashespecially from tourism and other travelmdashcould provide enough spark to invigorate economies Eventually MENA countries will have to deal with accumulated debt and its costs and will have to bring debt down to a more sustainable level
The report discusses policy options available for MENA countries One significant takeaway is the important role of strong efficient and transparent institutions in addressing the tradeoffs between short-term needs and long-term costs of public debt Good governance could increase the effectiveness of fiscal spending Improving debt transparency could lower borrowing costs when countries try to roll over their debt Even in the short term improvements in governance and transparency will help
P R E F A C E
MIDDLE EAST AND NORTH AFRICA REgION ECONOMIC UPDATE APRIL 2021
vi
during the pandemic Investing in testing disease surveillance and data transparency can reduce the economic costs of the pandemic As the crisis subsides effective transparent and credible pandemic surveillance in the region would help boost demand from domestic and foreign sourcesmdashsuch as the arrival of foreign tourists
Strong institutions are one crucial dimension to helping MENA build back stronger and more resilient economies As needed they can be reformed and strengthened with limited fiscal costs and can thus help boost the regionrsquos long-run growth As MENA emerges from this dark time the World Bank stands ready to help the region not only to meet the short-term needs of disaster relief but also to enhance institutions that will help usher in brighter years ahead
Ferid Belhaj Vice President Middle East and North Africa Region The World Bank
P R E F A C E
LIVINg wITH DEBT HOw INSTITUTIONS CAN CHART A PATH TO RECOVERY FOR THE MIDDLE EAST AND NORTH AFRICA
1
Overview
The Middle East and North Africa (MENA) region like the rest of the world remains in a pandemic-spawned crisis In 2020 the regionrsquos real output contracted by 38 percent The rebound in 2021 is unlikely to be strong enough to allow the region to regain the level of economic activity it had in 2019 and certainly not the level the World Bank had forecasted before the pandemic
The regionrsquos inflation-adjusted government revenues dropped by 24 percent in 2020 The disaster relief demanded by the pandemic combined with the decline in revenues led to further accumulation of debt in a region that already had high public debt The World Bank expects the regionrsquos public debt to rise from 46 percent of its GDP in 2019 to 54 percent by the end of 2021 This increase would be MENArsquos fastest accumulation of public debt as a share of output in the 21st century Among MENA country groups MENA oil importers have the highest levels of debt which will hover around 93 percent of GDP in 2021
As the pandemic subsides tensions will inevitably emerge between the potential short-run gains and the potential long-run costs of debt-financed public spending
In the short-term fiscal spending is needed to mitigate the effects of the pandemic including income transfers to support consumption of hardest hit families and health spending on testing treatment and vaccination As the pandemic subsides fiscal authorities will have to decide whether additional fiscal stimulus is warranted to raise aggregate demand to accelerate the post-pandemic economic recovery
Because the pandemic shares many traits with natural disasters this report examines trends in public debt and output growth around natural disasters to illustrate how debt-financed fiscal expenditures can help the recovery The evidence indicates that growth in both public debt and output tends to rise faster after disasters than it does in economies without disasters thus illustrating how debt-financed fiscal expansions can help economic reconstruction
However in the longer run debt might be costly especially for developing economies When governments borrow they may crowd out private sector investment because rising interest rates increase the cost of capital for the private sector In fact the correlation between private investment and public debt was negative for MENArsquos developing countries1 during the past two decades In addition high levels of debt may be accompanied by costly debt-interest payments that gradually reduce the space for other growth-enhancing public investment priorities For example a few countries in the MENA region already have interest payments equivalent to about 10 percent of GDP and account for more than 30 percent of total public expenditures
Maintaining high debt could also be risky in the long term threatening economiesrsquo credit worthiness and their ability to refinance (or roll over) maturing debt in the future These risks if they materialize can result in economic pain characterized by currency devaluations run-away inflation capital flight and ultimately costly debt crises Lebanonrsquos debt default in March 2020 and the ongoing crisis is a painful example
The report provides suggestive evidence that atypically high debt levels relative to GDP can dampen long-term growth prospects Countries that entered the 21st century with high debt- to- GDP ratios tended to grow more slowly over the next two decades than countries with lower debt burdens For developing countries the data are striking Economies in the top tercile of countries in terms of debt-to-GDP ratios in 2000 typically experienced a GDP-per-capita growth rates about 1 percentage point per year lower than the rest of the developing countries over the next 20 years
1 Throughout the report the term ldquoMENArsquos developing countriesrdquo refers to low- and middle-income MENA countries
O V E R V I E w
MIDDLE EAST AND NORTH AFRICA REgION ECONOMIC UPDATE APRIL 2021
2
The tension between short-term needs and long-term costs of debt-financing seems more severe for developing economies than for high-income ones In advanced economies accommodative monetary policy and rising savings are expected to combine to keep interest rates low favoring government borrowing that could help finance growth-enhancing activities In general academic literature suggests that advanced economies are less ldquodebt intolerantrdquo than developing and emerging economies (Reinhart et al 2003) That is they can continue to borrow when debt levels are high without risking major growth slowdowns The data collected for this report is consistent with this hypothesis
For developing economies however including those in MENA the tension between debt and growth is apparent During the pandemic many MENA countries face borrowing costs higher than other economies even though global interest rates are at historically low levels Default risk indicators for many MENA countries rose sharply during 2020 and some have not returned to pre-pandemic levels This is probably because many MENA countries entered 2020 with high debt and chronic low growth relative to world peers while also facing notable institutional challenges such as poor transparency and governance These pre-existing vulnerabilities might have heightened the long-term costs of public debt accumulation
What can MENA countries do to resolve the tensions between short-term objectives and long-term risks of rising public debt
Chapter 2 tackles this question by discussing policy options during three distinct phases of economic recovery
expenditure priorities during the pandemic
fiscal stimulus as the pandemic subsides
mitigating the potential costs of debt overhang in the medium term
Governance and transparency issues emerge as central protagonists across all three phases
Prioritizing spending during the pandemic
While the pandemic is still ongoing fiscal spending is probably best used to protect the welfare of vulnerable families and to invest in public health The pandemic is having disproportionate impacts on poor households because they are less healthy and less likely to be able to social distance Supporting the consumption of the hardest hit households is an essential objective for fiscal spending at this time MENA countries have taken unprecedented actions to support the most vulnerable The good news is that cash transfers are reasonably well-targeted although there is room to improve Evidence from phone surveys in the region suggests that a higher percentage of the poorest households are beneficiaries than those at the top of the distribution Using fiscal spending to stimulate aggregate demand is likely to be difficult as long as the risk of Covid-19 exposure remains ndash for the very reason that social distancing and limited mobility continue to be key to overcoming the pandemic
Public health investment as a short-term response to the pandemic could also bring long-term gains As vaccines become available it is important to plan and roll out effective vaccination campaigns Proper investment in vaccination would not only reduce the risk of a prolonged crisis and speed up economic recovery but also would reinforce the infrastructure for long-term public health Rough calculations of the costs and benefits of investing in vaccination programs which need to be interpreted with a grain of salt indicate that the benefit-cost ratio could be large around 781 if MENA vaccinates 20 percent of its population at current prices proposed by COVAX the multilateral effort to channel Covid-19 vaccines to poor and lower-middle income countries
O V E R V I E w
LIVINg wITH DEBT HOw INSTITUTIONS CAN CHART A PATH TO RECOVERY FOR THE MIDDLE EAST AND NORTH AFRICA
3
Investing in testing and public surveillance of the outbreak also appears to reduce the economic costs of the pandemic Preliminary evidence suggests that countries with higher test-positivity rates suffered larger growth downgrades A high test-positivity rate indicates a relatively uncontrolled pandemic and might reflect a slow or ineffective public health surveillance strategy Unfortunately many MENA countries have either high positivity rates (above the 5 percent benchmark set by the World Health Organization) or do not reliably report test data Notably however several high-income countries in MENA have been at the global forefront of using testing for disease surveillance and in rolling out vaccination programs
Fiscal stimulus as the pandemic subsides
MENA policymakers will soon decide whether additional fiscal stimulus is warranted after the public health emergency abates Embarking on additional stimulus at that time is not without risks
First economic growth might rebound without fiscal stimulus Consumer and business spending might rise quickly after it becomes clear that the health risks have subsided (Krugman 2020 Lee 2020) This phenomenon is referred to in the current debate as ldquopent-up demandrdquo In MENA the extent of such a pent-up demand rebound especially from external sources of demand such as tourism is likely to depend on the effectiveness and transparency of governmentsrsquo pandemic surveillance
Second fiscal stimulus can be ineffective or even counterproductive in economies with elevated debt such as many MENA oil importers Published refereed research indicates that when public debt is high the so-called fiscal multiplier -- the effect on GDP from additional spending -- can be zero (Huidrom et al 2020) Consequently the short-term costs of fiscal consolidation could also be negligible and thoughtful consolidation could be a preferred policy stance in economies with very high public debt ratios
Third while public investment such as infrastructure projects can be a tool of choice studies have cautioned that delayed implementation can result in a limited short-term multiplier More importantly the economic gains from public investment projects can be hindered by poor governance which reduces the efficiency of public investment This appears to be the case for a large sample of European countries (Izquierdo et al 2019) Therefore in countries with the lowest institutional capacity and transparency the multiplier of public investment can be close to zero in both the short- and long-terms which reinforces the need to work on reforms to improve the governance of public investment decisions
Instead targeted fiscal spending can help heal the economic scars of the crisis In times of limited fiscal revenues and competing social demands for government assistance it is best to focus on scars with potentially long-lasting consequences For example financial constraints might prevent firms from making necessary investment to re-enter a market Likewise workers who became unemployed or under-employed during the crisis might face long-term reductions in employment probabilities and wages In these situations targeted government spending such as subsidized loans and job training might help heal the economic scars from the pandemic that can obstruct long term development Similarly investment in education that might help disadvantaged children recoup the lost learning during the pandemic might avert costly long-term losses in human capital
O V E R V I E w
MIDDLE EAST AND NORTH AFRICA REgION ECONOMIC UPDATE APRIL 2021
4
Mitigating the costs of debt after the pandemic
The costs of elevated debt are likely to manifest themselves eventually perhaps even in the short term Countries in the region may have to take action to reduce debt to GDP ratios soon after the pandemic even if output is below its potential
As mentioned highly indebted MENA countries can consider taking an approach to reduced debt and debt accumulation that combines prioritizing the most effective spending items and improving governance of investment decisions In highly indebted countries thoughtful fiscal consolidation could be welcomed by the private sector
MENA countries can also aim to roll over debt on more favorable terms To do so they would have to enhance their long-term growth prospects Perhaps more importantly transparency could also aid MENA countries by improving debt reporting and monitoring financial market vulnerabilities Published research indicates that such measures can lower borrowing costs (Cady 2005 Choi and Hashimoto 2018)
If rolling over debt is not an option highly indebted MENA countries will have to risk costly debt restructurings Evidence presented in this report suggests that pre-emptive restructurings in which a country decides to enter negotiations with external creditors before it misses any payments are less costly than post-default restructurings Unfortunately the evidence presented in this report also suggests that highly indebted countries are more likely to enter either preemptive or post-default restructurings with low growth and weak governance Several MENA oil importers entered 2020 with low growth and weak governance relative to countries that have not experienced episodes of debt distress
In sum economic growth is the most sustainable way to reduce public debt but is also the most challenging in the MENA region because it requires structural reforms to raise productivity and put people to work Many MENA countries have characteristics that would render post-pandemic fiscal stimulus ineffective In such situations policymakers may want to consider fiscal reforms early in the recovery phase Perhaps most importantly key institutional reforms that help improve debt transparency and the quality of public investment can be implemented immediately with limited fiscal costs They also hold the promise of boosting long-run growth Institutions then might help chart a path to lasting recovery for the Middle East and North Africa
O V E R V I E w
LIVINg wITH DEBT HOw INSTITUTIONS CAN CHART A PATH TO RECOVERY FOR THE MIDDLE EAST AND NORTH AFRICA
5
C H A P T E R I A C O N T I N U I N g C R I S I S
CHAPTER I A Continuing Crisis
CHAPTER I TAKEAWAYS
bull Economies in the Middle East and North Africa (MENA) remain in crisis The World Bank estimates that
MENArsquos GDP contracted 38 percent in 2020 and expects it to rebound by only 22 percent in 2021
bull Declining government revenue combined with the need to support vulnerable families and other policy
responses to the Covid-19 pandemic led to increases in public debt across the region The World Bank
expects the regionrsquos public debt burden to rise from 46 percent of GDP in 2019 to 54 percent of GDP by
2021 and debt of oil-importing developing countries to reach 93 percent
bull Having entered the crisis with chronic low growth high debt and poor governance the regionrsquos developing
economies are facing difficult tradeoffs associated with the accumulation of debt Institutional reforms
and transparency can help chart a solid path to recovery
I1 The Ongoing Pandemic in MENA
The Covid-19 pandemic has plunged the world into a crisis The virus has infected hundreds of millions of people caused millions of deaths and disrupted economies the world over The MENA region had more than 5 million recorded cases of Covid-19 by the end of February 2021
In the absence of a vaccine countries have experimented with various non-therapeutic interventions including lockdowns widespread use of masks and social distancing Early containment successes also relied on widespread use of testing contact tracing and isolating (TTI) symptomatic and asymptomatic cases An emerging literature has stressed the benefits of testing to save lives and livelihoods (Reed et al 2021 de Walque et al 2020) The ability to deploy testing and contact tracing on a large scale in turn depended on the strength of public health surveillance and clear and transparent communication from governments Transparent and credible data release on the virus spread allowed citizens to adapt their behavior to decrease the chance of contagion The availability of vaccines now offers hope that herd immunity can be achieved thus averting additional deaths restoring economic activity and staving off the risks of future pandemics A rapid scale up of vaccination however depends on the transparency and organizational capabilities of public health systems
Yet public health systems tend to be relatively weak in MENA Countries in the region fare poorly in the Global Health Security (GHS) Index which measures preparedness for epidemics and pandemics2 As of 2019 MENA ranked last among the worldrsquos regions in two components of the index that are critical to fighting a pandemic ldquoepidemiology workforcerdquo and ldquoemergency preparedness and response planningrdquo Many countries have had limited public health financing for decades According to data from the World Health Organization (WHO) countries such as Egypt and Iraq spent 5 percent or less of their government budget on health as of 20173
2 The index was jointly developed by the Nuclear Threat Initiative the Johns Hopkins Center for Health Security and the Economist Intelligence Unit Data were released in 2019 The index consists of six categories prevention detection and reporting rapid response health system compliance with international norms and risk environment
3 WHO Global Health Expenditure Database httpsappswhointnhadatabaseViewDataIndicatorsen
MIDDLE EAST AND NORTH AFRICA REgION ECONOMIC UPDATE APRIL 2021
6
C H A P T E R I A C O N T I N U I N g C R I S I S
Nevertheless some MENA health systems were well prepared especially those in the Gulf Cooperation Council (GCC)mdashBahrain Kuwait Oman Qatar Saudi Arabia and the United Arab Emirates (UAE) Bahrain and UAE rank among countries with highest testing per capita world-wide The GCC countries plus Lebanon and Jordan have done more testing per capita than the rest of the MENA region (see Table I1) Unfortunately many MENA countries have either high positivity rates (when more than 5 percent of tests for Covid-19 come back positive according to the WHO) or do not even have reliable testing or fail to report it (see Table I1) In conflict economies such as Syria and Yemen weak testing capacity leads to unreported testing statistics and fewer reported positive cases which paints a potentially misleading picture of low spread This said evidence from randomized anti-body testing high-income and developing countries indicate that the spread of Covid-19 is generally much higher than suggested by the official testing data due to unreported cases4
TABLE I1 Covid-19 Cases and Tests per Million People in MENA Countries
Country TestsMillion CasesMillion CasesTests ()
Gu
lf C
oo
pe
rati
on
C
ou
nci
l
Qatar 593580 61866 1042
United Arab Emirates 3547569 44141 124
kuwait 455811 50772 1114
Bahrain 1958570 77991 398
Saudi Arabia 415389 10937 263
Oman 298120 29004 973
Oth
er
Oil
Exp
ort
ers Libya 117877 21850 1854
Iraq 187298 19426 1037
Iran 143463 21248 1481
Algeria - 2615 -
Syrian Arab Republic - 978 -
Yemen - 113 -
Oil
Imp
ort
ers
Lebanon 498091 64610 1297
Jordan 533072 52108 977
Djibouti 123188 6599 536
west Bank and gaza 262956 43123 1640
Morocco 157616 13209 838
Tunisia 89342 20635 2310
Egypt - 1884 -
Source MENA Crisis Tracker based on data from Worldometer (httpswwwworldometersinfocoronavirus) Note Data are as of March 21 2021 ldquo-ldquo indicates that the country does not publicly report testing data Data do not necessarily match official statistics reported by the governments
Countries in the MENA region face mixed prospects of a vaccine rollout GCC countries gained access to vaccines earlier than most with the UAE and Bahrain leading the way As of March 21 2021 74 percent of people in the UAE and 38 percent of the population in Bahrain had been vaccinated with the rest of the region trailing behind (see Table I2) GCC countries have also been leveraging technology to facilitate their vaccination programs such as apps to book mobile vaccination units in Bahrain Some middle- and low-income MENA countries relied on international cooperation and support from global vaccine programs (such as COVAX)5 Although the majority of developing MENA countries have signed contracts with vaccine providers only Morocco has embarked on a vaccination program for a significant portion of population (see Table I2)
4 See MENA Crisis Tracker and related literature5 Covid-19 Vaccines Global Access or COVAX is a multilateral initiative to give poorer countries access to Covid-19 vaccines Among the groups in COVAX are the Global Alliance for
Vaccines and Immunization the World Health Organization and the Coalition for Epidemic Preparedness Innovations
LIVINg wITH DEBT HOw INSTITUTIONS CAN CHART A PATH TO RECOVERY FOR THE MIDDLE EAST AND NORTH AFRICA
7
C H A P T E R I A C O N T I N U I N g C R I S I S
Vaccinations are expected to help a country control the spread of Covid-19 paving the way for an economic recovery Preliminary evidence suggests a very large benefit from widespread vaccination Rough calculations indicate that in addition to the benefits in terms of lives saved there is a roughly 781 benefit-to-cost ratio if MENA countries vaccinate 20 percent of their population at current COVAX prices (Ahuja et al 2021) These calculations however are not flawless The benefits are computed as the decline in expected GDP growth rates for 2020 and 2021 relative to pre-pandemic forecasts Going forward since non-trivial shares of the population have already been infected the expected economic gains from vaccinations are probably slightly lower than implied by these calculations Still the benefits of effective vaccination campaigns relative to the costs of not vaccinating are probably huge
TABLE I2 Covid-19 Vaccination Programs in MENA
Country of population
Cumulative Covid-19
vaccination doses administered
Vaccine Contracts
Vaccine clinical trial participation
(YN)
Vaccine imports through COVAX
Facility (YN)
Gu
lf C
oo
pe
rati
on
Co
un
cil Qatar 2064 594613 by March 14
Pfizer-BioNTech and Moderna N Y
United Arab Emirates 7380 73 million by March 14 Sinopharm and Pfizer Y Y
kuwait 843 360000 by March 8 1m doses Pfizer-BioNTech AstraZeneca N Y
Bahrain 3839 653236 by March 17 Pfizer-BioNTech Sinopharm AstraZeneca Y N
Saudi Arabia 916 319 million by March 18 Pfizer-BioNTech Y Y
Oman 215 109844 by March 17 370000 Pfizer-BioNTech doses N N
Oth
er
Oil
Exp
ort
ers
Libya - - $96 million of vaccines contracted with WHO N N
Iraq- -
15m doses Pfizer-BioNTech 1m Sputnik
Sinopharm N Y
Iran 015 124193 by March 19 Sputnik V N N
Algeria 060 280000 by March 14 Sputnik V AstraZeneca and Sinopharm N Y
Syrian Arab Republic - - 5000 doses received N Y
Yemen - - 23 million doses with COVAX N Y
Oil
Imp
ort
ers
Lebanon 203 138420 by March 20 21m Pfizer-BioNTech N Y
Jordan 267 272648 by March 14 3m doses Pfizer-BioNTech Y Y
Djibouti - - Sputnik V N Y
west Bank and gaza
- -
37440 Pfizer-BioNTech and 24000 AstraZeneca
delivered through COVAX
N Y
Morocco 1812 669 million by March 20
65 million - Sinopharm and AstraZeneca Y Y
Tunisia lt001 12496 by March 12 2m doses Pfizer-BioNTech 1m Sputnik N Y
Egypt lt001 1315 by Jan 30 40m from Sinopharm AstraZeneca Y Y
Source World Bank MENA Crisis Tracker based on data on vaccination from Our World in Data (httpsourworldindataorgcovid-vaccinations) Data for Algeria are from WHO Note Data are as of March 21 2021 Data do not necessarily match official statistics reported by the governments
MIDDLE EAST AND NORTH AFRICA REgION ECONOMIC UPDATE APRIL 2021
8
C H A P T E R I A C O N T I N U I N g C R I S I S
I2 Economic Consequences of the Pandemic
The virus not only claims lives Its spread has had severe economic consequences MENA countries have experienced negative supply and demand shocks (Arezki et al 2020c) The negative supply shock came first from a reduction in labor supply mdashdirectly because workers get sick with Covid-19 and indirectly from travel restrictions quarantine efforts and workers staying home to take care of children or sick family members Supply was also affected by a reduction in the supply of materials capital and intermediate inputs due to disruptions in transport and businesses in MENA countries The negative demand shock was both global and regional Economic difficulties around the world and the disruption of global value chains reduced demand for the regionrsquos goods and servicesmdashmost notably oil and tourism Regional demand also declined as a result of the abrupt reduction in regional business activity and concerns about infectionmdashboth of which reduced travel In addition uncertainty about the spread of the virus and the level of aggregate demand impeded the regionrsquos investment and consumption Collapsing oil prices in 2020 further depressed demand in MENA where oil and gas comprise the most important sector in many economies As a consequence the Covid-19 pandemic severely affected virtually all aspects of the regional economies Output in 2020 contracted sharply The expected rebound in 2021 is unlikely to bring the region back to the level of economic activity it had in 2019 and certainly not to the level the World Bank had expected before the pandemic
Macroeconomic Impact
The pandemic and the associated collapse of oil prices severely hit MENA oil exporters The benchmark Brent oil price fell from about $65-a barrel before the pandemic to close to $20-a-barrel in April 2020 Since then it has only gradually climbed back to pre-pandemic levels Revenue from oil exports the main source of income for many oil producers in the region was expected to contract 38 percent in 2020 (IMFrsquos World Economic Outlook (WEO)- October 2020) This has been the trend notwithstanding a recent jump in oil prices associated with conflict in the region6
The pandemic was felt in all sectors not just energy MENA firms were severely affected (see Apedo-Amah et al (2020) for an analysis on early impact and Mohammed et al (2021) for a recent update) Overall exports from the MENA region fell sharply and have only partially recovered After dropping 44 percent year-on-year in the second quarter of 2020 goods exports from the region continued year-on-year declines of 17 percent in the third quarter and 10 percent in the fourth quarter (UNCTAD 2020 2021) Sectors such as autos in Morocco Tunisia and Iran and textiles in Jordan and Egypt have been hard hit by the pandemic and weakening global trade Covid-19 transport and travel restrictions directly affect the services trade including tourism which is an important source of income for many MENA countries For example it was the equivalent of 25 percent of exports in Egypt and 41 percent in Jordan in 2018 (World Development Indicators) Available high-frequency data indicate that tourism and air traffic in the region completely collapsed in April 2020 They have slightly recovered since then but for the four countries with available data (Morocco Tunisia Egypt and Saudi Arabia) tourism and air traffic were still 60 percent to 80 percent lower in February 2021 compared to February 2020 Data on Purchasing Managersrsquo Index (PMI) available for a few MENA countries also paint a picture of an uneven and difficult recovery A PMI above 50 represents an expansion over the previous month while a PMI below 50 represents a contraction PMIs for UAE and Egypt have hovered around 50 since July suggesting the two economies have not rebounded from the trough in April 2020 PMIs for Qatar and Saudi Arabia are above 50 as of February 2021 indicating a slight rebound Lebanonrsquos PMI is below 45 as of February 2021 indicating a continuing economic contraction (see Figure I1)
6 CNBC 2021
LIVINg wITH DEBT HOw INSTITUTIONS CAN CHART A PATH TO RECOVERY FOR THE MIDDLE EAST AND NORTH AFRICA
9
C H A P T E R I A C O N T I N U I N g C R I S I S
FIGURE I1 Purchasing Managersrsquo Index
25
30
35
40
45
50
55
60
65
Novem
ber 2019
Decem
ber 2019
Januar
y 2020
Februar
y 2020
March 2020
April 2020
May 2020
June 2020
July
2020
August 2020
September 2
020
October 2020
Novem
ber 2020
Decem
ber 2020
Januar
y 2021
Februar
y 2021
Egypt Lebanon Saudi Arabia UAE Qatar
Source Bloomberg LPNote Markit PMI is for the whole economy seasonally adjusted A PMI above 50 represents an expansion over the previous month A PMI reading under 50 represents a contraction
World Bank economists estimate that the regionrsquos real output contracted 38 percent in 2020 (see Appendix Table B1 for country-specific estimates) This estimate is a 13 percentage point upgrade compared to the forecast released in October 2020 (see Panel B Appendix Table B2) The upward adjustment in World Bank estimates for 2020 can be attributed mostly to a change in Iranrsquos GDP growth which was raised from a contraction of 45 percent in October 2020 forecasts to modest growth of 17 percent Nevertheless this regional growth estimate is 64 percentage points lower than the pre-pandemic growth forecast published in October 2019 (see Panel A Appendix Table B2) The downgrade is arguably a measure of the cost of the pandemic in 2020 because it was the dominant development since October 2019 This amounts to 202 billion dollars
World Bank economists forecast the regionrsquos real output to grow at a modest 22 percent in 2021 This is 03 percent higher than the forecast released in October 2020 (see Panel B of Appendix Table B2) on the back of a faster than expected recovery in oil prices7
Nevertheless the accumulated GDP losses due to the pandemic are substantial By 2021 the regional economy is forecast to be 72 percent below the no-pandemic counterfactual GDP level equivalent to 227 billion dollars (see Figure I2)
GDP per capita is arguably a more precise statistic of the regionrsquos standard of living than GDP The regionrsquos average real GDP per capita is estimated to decline 53 percent in 2020 The regionrsquos average real GDP per capita is forecast to increase by a meagre 06 percent in 2021 All in all the regionrsquos real GDP per capita in 2021 would be 47 percent below the level in 2019
Heavy GDP losses are observed across all MENA country groups The GDP level in 2021 for developing oil importers is forecast to be 93 percent below the counterfactual GDP level without the pandemic (see Figure I2) The counterfactual decline for
7 In October 2020 World Bank economists forecast the regionrsquos economic growth in 2021 at 19 percent
MIDDLE EAST AND NORTH AFRICA REgION ECONOMIC UPDATE APRIL 2021
10
C H A P T E R I A C O N T I N U I N g C R I S I S
GCC countries is 77 percent and is 44 percent for developing oil exporters The pandemic and the associated collapse in oil revenue trade and tourism have put MENA countries on a very difficult path This severely affects peoplersquos welfare puts immense pressure government budgets and reduces fiscal space to fight poverty
FIGURE I2 GDP Level Forecasts
Panel A MENA Panel B MENA Country groups
090
095
100
105
110
2019 2020 2021
GCC (Pandemic)
GCC (No Pandemic)Developing Oil Exporters (Pandemic)
Developing Oil Exporters (No Pandemic)
Developing Oil Importers (Pandemic)Developing Oil Importers (No Pandemic)
090
095
100
105
110
2019 2020 2021
MENA (Pandemic)
MENA (No Pandemic)
090
095
100
105
110
2019 2020 2021
GCC (Pandemic)
GCC (No Pandemic)Developing Oil Exporters (Pandemic)
Developing Oil Exporters (No Pandemic)
Developing Oil Importers (Pandemic)Developing Oil Importers (No Pandemic)
090
095
100
105
110
2019 2020 2021
MENA (Pandemic)
MENA (No Pandemic)
Source World Bank Macro and Poverty Outlook (in April 2021 and October 2019) and World Bank staffrsquos calculationNote The dotted lines show forecast GDP levels in the counter-factual case of no pandemic (based on GDP forecasts in October 2019) The straight lines show forecast GDP levels in the case of pandemic (based on GDP forecasts in April 2021)
The collapse in output underscores the importance of mitigation measures This report finds evidence that targeted efforts to control
the pandemic can help reduce economic costs For example in a global sample countries that have lower Covid-19 test positivity rates
have lower growth downgrades in 2020 Test positivity rates are arguably a proxy for the spread of the Covid-19 virus (CDC 2020) which
could also reflect a countryrsquos effort to control the pandemic through such efforts as masking testing and contact tracing Econometric
estimates suggest that a 10 percent reduction in a countryrsquos test posivitity rate is associated with 08 percent lower growth downgrades
after controlling for confounding factors (see Figure I3) This finding suggests that investment in public health measures not only reduces
the spread of the virus but also mitigates the economic costs of the pandemic
LIVINg wITH DEBT HOw INSTITUTIONS CAN CHART A PATH TO RECOVERY FOR THE MIDDLE EAST AND NORTH AFRICA
11
C H A P T E R I A C O N T I N U I N g C R I S I S
FIGURE I3 Test positivity Rates and Growth Downgrades
minus15
minus10
minus50
510
Gro
wth
Dow
ngra
de R
esid
ual (
perc
enta
ge p
oint
s)
minus10 0 10 20 30Positivity Rate Residual
Middle East amp North Africa Europe amp Central Asia
SubminusSaharan Africa Latin America amp Caribbean
East Asia amp Pacific South Asia
North America
Sources IMF World Economic Outlook Worldometer Johns Hopkins University World Bank World Development Indicators and World Bank staff calculationsNote The figure shows the partial correlation between 2020 growth adjustments between October 2020 and October 2019 and Covid-19 positivity rate (as of December 2020) The positivity rate is the number of Covid-19 cases as a percent of the total number of tests Other explanatory variables include log of GDP per capita in 2019 (in US dollars) total trade value in GDP in 2019 (percent) days since the first positive case until November 30 2020 and tourism as a percent of exports in 2018
Poverty Distributional and Long-Term Impacts
The pandemic has not only hurt economic activity it has had a profound impact on poverty and income distribution in the MENA region There are many pathways by which Covid-19 has painfully increased poverty There is the direct effect from succumbing to the disease Poor households are particularly at risk Poor people are more likely to have preexisting health conditions to live in crowded conditions with multigenerational households and to have less access to soap and clean water The indirect pathways that affect peoplersquos livelihoods include market disruptions that caused price increases and at times shortages of products Moreover because of lockdown policies and social distancing many poor people especially those in the informal sector lost their ability to earn an income The situation is particularly acute in Yemen Rising food prices declining remittances and reduced humanitarian assistance in a country devastated by years of conflict has pushed its population to the brink of starvation (IPC 2020) Between January and June 2021 the number of people with famine-like condition could nearly triple from 16500 to 47000 people In the same period the numbers of people facing emergency food insecurity and risk of famine could increase from 36 million to 5 million (one-sixth of the population) (IPC 2020)
Poverty is rising in the region Based on the regionrsquos baseline growth forecasts the number of poor people in the regionmdashthose making less than the $550 per day poverty linemdashis expected to increase from 176 million in 2019 to 192 million people by the end of 20218 This forecast assumes that every household is equally affected and that the effect of Covid-19 is uniform over
8 Thanks to the upward growth revisions this poverty forecast is slightly lower than the forecast released in October 2020 Based on the regionrsquos growth forecasts in a downside scenario World Bank economists in October 2020 forecast the number of people in poverty to reach 197 million by the end of 2021 (see Arezki et al 2020c)
MIDDLE EAST AND NORTH AFRICA REgION ECONOMIC UPDATE APRIL 2021
12
time In reality evidence from phone surveys in the first half of 2020 reported in Arezki et al (2020c) strongly suggests that the poor were hit harder They are more likely to have stopped working to have lost income and to have reduced consumption Furthermore in countries with high food-price inflation such as in Yemen but also in Lebanon the distributional impacts have been even more severe because food inflation is regressive It is likely then that far more than the forecasted 192 million people will be in poverty
Several rounds of phone surveys conducted recently in Tunisia and Djibouti allow us to observe the recovery of the labor market after the initial months of the pandemic In both countries the impact of the pandemic was dramatic during the first surveys but was more moderate during subsequent ones (see Figure I4) In the first wave of the survey (in April 2020 for Tunisia and July 2020 for Djibouti) a large share of respondents in both countries reported that they had stopped working Poor households were more likely to lose jobs than less-poor households This is clearer in Tunisia where 49 percent of the bottom quintile reportedly stopped working while only 29 percent of the top quintile did so In subsequent surveys the percentage of respondents reportedly without work gradually declined In the most recent surveys (in October 2020 for Tunisia and Jan 2021 for Djibouti) the fraction of people that reported having stopped working was smaller than during the first surveys
Nonetheless it is probably premature to conclude that a labor market recovery is well underway First even in the latest surveys in Tunisia and Djibouti there is evidence of lingering job losses Second the epidemic is still raging and thus it is difficult to conclude that any job gains relative to earlier in 2020 will be long lasting It is possible that if the spread of Covid-19 continues in these countries job losses could continue to accumulate Third the available evidence is silent with respect to wages or income Hence some jobs might have temporarily come back but we do not know for how long or at what income level
Regardless of the timing of the recovery much of the impact of the pandemic unfortunately could be felt for decades to come Disruption in core health services drops in household income school closures and persistent unemployment will likely carry long term costs in terms of slower human capital accumulation (Corral and Gatti 2020) Simulations conducted with the Human Capital Index indicated that without concerted remediation school closures alone which at the height of the pandemic affected 16bn children worldwide (Azevedo et al 2020) are likely to be associated with a drop in human capital for the cohort of children currently in school by 5 This is the same order of magnitude of the average global gains in human capital in the past decade (World Bank 2020c)
C H A P T E R I A C O N T I N U I N g C R I S I S
LIVINg wITH DEBT HOw INSTITUTIONS CAN CHART A PATH TO RECOVERY FOR THE MIDDLE EAST AND NORTH AFRICA
13
C H A P T E R I A C O N T I N U I N g C R I S I S
FIGURE I4 Distributional Effects of Covid-19
Panel A Tunisia
0
20
40
60
80
100
Bot
tom 2 3 4
Top
Bot
tom 2 3 4
Top
Bot
tom 2 3 4
Top
Apr-20 May-20 Oct-20
Bottom 2 3 4 Bottom 2 3 4 Bottom 2 3 4
Jul-20 Oct-20 Jan-21
Worked in the week before surveyed Stopped working Had not worked since before the pandemic
0
20
40
60
80
100
26 27 27 2514
38 43 4838
25
64 70 6553
43
49 48 5036
29
41 26 23
18
16
9 56
4
3
26 26 2339
56
21 30 2944
59
27 25 3043
54
59 56 60 6176 74
80 79 84 79 81 86
22 20 22 13
17 18 10 11 34 4 3
19 24 1826
7 8 10 10 13 17 15 12Panel B Djibouti
0
20
40
60
80
100B
otto
m 2 3 4
Top
Bot
tom 2 3 4
Top
Bot
tom 2 3 4
Top
Apr-20 May-20 Oct-20
Bottom 2 3 4 Bottom 2 3 4 Bottom 2 3 4
Jul-20 Oct-20 Jan-21
Worked in the week before surveyed Stopped working Had not worked since before the pandemic
0
20
40
60
80
100
26 27 27 2514
38 43 4838
25
64 70 6553
43
49 48 5036
29
41 26 23
18
16
9 56
4
3
26 26 2339
56
21 30 2944
59
27 25 3043
54
59 56 60 6176 74
80 79 84 79 81 86
22 20 22 13
17 18 10 11 34 4 3
19 24 1826
7 8 10 10 13 17 15 12
Source COVID-19 Phone Surveys fielded in Djibouti (Waves 1-3) and Tunisia (Waves 1-5)Note The figure reports the share of people who continued to work stopped working or had not worked since before the pandemic by quintile The quintile breakdown is by income in Djibouti (the top quintile is not covered by the survey) and by consumption in Tunisia The top (5th) quintile for Djibouti is not covered
MENA countries have carried out unprecedented policy responses to assist firms and households (see IMF 2021 for detailed policy responses) Social transfers are arguably one of the most important instruments in this crisis If targeted well social assistance is the most effective in supporting consumption of vulnerable households Most of the 19 MENA countries have extended cash-based transfers as part of pandemic response These cash transfers were mostly targeted towards supporting low-income households the elderly and workers in informal sectors As another part of the social assistance programs most MENA countries have provided baskets of food and hygiene kits and subsidized essential food products to the most vulnerable Several MENA governments offered paid leave for workers in both private and public sectors as well as free health treatments for individuals with Covid-19 as part of their social insurance plans In their further attempt to support labor markets about half of MENA governments have activated programs to subsidize wages of workers at private employers to partially alleviate financial burdens Gentilini et al (2020) provide a detailed update of country-specific social assistance measures
MIDDLE EAST AND NORTH AFRICA REgION ECONOMIC UPDATE APRIL 2021
14
C H A P T E R I A C O N T I N U I N g C R I S I S
Available data from early MENA phone surveys suggest that cash transfers are reasonably well targeted with much larger fractions of the poorest households being recipients than of households at the top of the distribution Nevertheless most of the poor households were not reached (Arezki et al 2020c) Targeted cash transfers even when targeting is imperfect tend to be ldquoprogressiverdquo that is they disproportionately benefit the poor (see Joumard et al (2012) for evidence in the OECD) This is because targeted cash transfers are more likely to reach poorer households and because the same amount of cash is more meaningful to poorer recipients than those that are better off In times of crisis imperfect targeting is expected because many countries in the region did not have in place well tested mechanisms that could ensure that benefits went to the intended recipients In the medium term refining targeting mechanisms including through strengthened social registries will remain an important element of the regional development policy agenda Morocco has made good progress in setting up a digital registry with World Bank support (World Bank 2016) Without a good transfer targeting mechanism in place countries may have to resort to less targeted measures such as subsidizing fuel or increasing public wages Caution is warranted against subsidizing fuel or increasing public wages as a temporary support to households These measures may end up supporting more well-off households incur substantial budget costs and in the case of fuel subsidies increase environmental costs9
Fiscal Balances and Public Debt
This section is dedicated to the analyses of fiscal balance and public debt the focus of the report The MENA region entered the Covid-19 crisis with chronic low growth macroeconomic imbalances (Arezki et al 2019) and weak governance especially when it comes to transparency (Arezki et al 2020b) The pandemic has put tremendous pressure on government fiscal positions Real government revenue in 2020 is 24 percent less than in 2019 The sharpest declines were among the GCC and developing oil exporters not surprising given the oil price collapse (see Figure I5) Squeezed by declining revenue government expenditure in the MENA also dropped compared to pre-pandemic expectations The expenditure decline is smaller than the revenue fall-off which reflects pressing demands to spend on policy responses to the pandemic As a consequence the regionrsquos average fiscal deficit in 2020 is estimated to be around 94 percent of GDP (see Appendix Table B1) compared to the pre-pandemic forecast deficit of 46 percent MENA countries have had to borrow to finance the deficits The pandemic is estimated to increase the regionrsquos public debt to about 54 percent of GDP in 2020 accelerating the rise in public debt during the past decade The increases are observed across MENA country groups (see Figure I6)
9 Targeted cash transfers are arguably more progressive than previous tools used to assist the poor Fuel subsidies for example tend to disproportionately benefit richer households given their substantial fuel consumption (see Del Granado et al 2012 for a cross-country study and World Bank (2019) for a detailed study on Egypt)
LIVINg wITH DEBT HOw INSTITUTIONS CAN CHART A PATH TO RECOVERY FOR THE MIDDLE EAST AND NORTH AFRICA
15
C H A P T E R I A C O N T I N U I N g C R I S I S
FIGURE I5 Changes in Real Government Revenue and Expenditure in 2020
40-
35-
30-
25-
20-
15-
10-
5-
0
5pe
rcen
t
GCC Developing OilExporters
Developing OilImporters
GCC Developing OilExporters
Developing OilImporters
Real Revenue and Grants Real Expenditure
Source World Bank Macro and Poverty Outlook (April 2021)Note Bars represent percentage change of real government revenue and grants and real government expenditure in constant 2019 USD from 2019 level
FIGURE I6 Median Public Debt by Country Group
30
40
50
60
70
80
90
High income Middle-incomeoil exporters
Middle-incomeoil importers
High income Middle-incomeoil exporters
Middle-incomeoil importers
2019 2020
perc
ent o
f GD
P
WorldMENA
Source World Bank Macro and Poverty Outlook (April 2021)Note Country groups are represented by median observation of the group The bars show median debt of MENA country groups The diamonds show median debt of the corresponding worldrsquos income groups Debt data are generally not available for MENA low income (Yemen and Syria) The high-income group in MPO is limited to only countries covered by the World Bank
MIDDLE EAST AND NORTH AFRICA REgION ECONOMIC UPDATE APRIL 2021
16
C H A P T E R I A C O N T I N U I N g C R I S I S
Before the pandemic many MENA countries had large public debt positions relative to peers in the same income groups outside the region (see Figure I6 for country group medians and Appendix Table B3 for country-specific debt data) Many of them are oil importers although GCC countries Bahrain and Oman are two notable high-income oil exporters with a large stock of public debt
This report analyzes factors that contributed to public debt changes in 2020 for selected MENA countries with debt levels exceeding 75 percent of GDP in 2020 (presented in Panel A of Figure I7) Primary deficits (before interest payments are added) and interest rate-growth rate differential are the main contributors Primary deficit significantly added to debt in 2020 for many of these countries (except for Egypt) given the decline in revenue and the increase in expenditure due to the pandemic10
The interest rate-growth rate differential also contributed much of the increase debt in 2020 Due to the pandemic growth is slower for many MENA countries contributing to larger interest rate-growth rate differential
Primary deficits are still expected to drive up debt in 2021 (Panel B of Figure I7) However the interest rate-growth rate differential is expected to drive down debt moderately for most countries since growth in 2021 is expected to recover slightly Overall primary balance and growth are the two key factors that could affect MENArsquos debt in the near term according to the baseline forecasts
FIGURE I7 Decomposition of Changes in Public Debt in MENA 2020 and 2021
Panel A 2020 Panel B 2021
0
20
40
60
80
100
120
140
20-
10-
0
10
20
30
40
Contribution from primary deficits
Contribution from interest rategrowth dierential
Change in public debt
Public debt ( of GDP) (RHS)
perc
ent o
f GD
P
0
20
40
60
80
100
120
140
20-
10-
0
10
20
30
40
Contribution from primary deficits
Contribution from interest rategrowth dierential
Change in public debt
Forecast public debt ( of GDP) (RHS)
perc
ent o
f GD
P
perc
ent o
f GD
P
perc
ent o
f GD
P
Bahrai
nOman
Jord
an
Morocc
o
Tunisia
Egypt
Bahrai
nOman
Jord
an
Morocc
o
Tunisia
Egypt
0
20
40
60
80
100
120
140
20-
10-
0
10
20
30
40
Contribution from primary deficits
Contribution from interest rategrowth dierential
Change in public debt
Public debt ( of GDP) (RHS)
perc
ent o
f GD
P
0
20
40
60
80
100
120
140
20-
10-
0
10
20
30
40
Contribution from primary deficits
Contribution from interest rategrowth dierential
Change in public debt
Forecast public debt ( of GDP) (RHS)
perc
ent o
f GD
P
perc
ent o
f GD
P
perc
ent o
f GD
P
Bahrai
nOman
Jord
an
Morocc
o
Tunisia
Egypt
Bahrai
nOman
Jord
an
Morocc
o
Tunisia
Egypt
Source World Bank Macro and Poverty Outlook (April 2021) and World Bank staff calculationsNote The figure shows contributions to debt for selected MENA countries with debt above 75 percent of GDP in 2020 The diamonds indicate changes in public debt as percentage of GDP The red bars represent primary deficits as a percent of GDP and the gray bars represent contributions from interest rate-growth differential The green lines represent public debt as a percent of GDP (right-hand side scale) Other debt-creating flows that are not presented in the chart include exchange rate depreciation privatization receipts recognition of implicit or contingent liabilities due to lack of data
10 For Egypt primary balance was in surplus However note that the Egyptrsquos 2020 fiscal year goes from July 2019 to June 2020 Therefore the 2020 fiscal data for Egypt reflect only partially the impact of the pandemic
LIVINg wITH DEBT HOw INSTITUTIONS CAN CHART A PATH TO RECOVERY FOR THE MIDDLE EAST AND NORTH AFRICA
17
C H A P T E R I A C O N T I N U I N g C R I S I S
MENArsquos Creditworthiness
Given the debt trends described above it is worth asking if a rebound in the global price of oil will help MENA countries This is an important question due to the salient role played by oil prices for both oil-exporters and importers The regions creditworthiness could be affected by oil-price fluctuations And creditworthiness matters for debt First lenders would factor the probability of default into their computation of interest rates Therefore a deterioration in creditworthiness could contribute to rising interest rates and as a result increase the debt-to-GDP ratio In turn high and increasing debt could jeopardize creditworthiness especially in turbulent times creating a vicious cycle between countryrsquos creditworthiness and its debt level
MENArsquos creditworthiness can be evaluated by credit default risk Sovereign credit default swaps (CDS) credit ratings and sovereign bond spreads are available market-based measures of countriesrsquo default risk11 A rise in the CDS price implies higher default risk and lower creditworthiness Figure I8 presents the prices for CDSs of available MENA countries during the pandemic12 CDS prices rose sharply during the pandemic indicating a deterioration of MENArsquos creditworthiness Among the GCC countries Oman and Bahrainrsquos credit default risk rose the most significantly consistent with the two countriesrsquo substantial debt levels Among middle-income MENA countries CDSs for Egypt Tunisia and Iraq rose the mostmdashand more than CDS increases of GCC countries As of early March 2021 the CDS levels have returned to the pre-pandemic level with some exceptions
FIGURE I8 Credit Default Swaps for Available MENA Countries
Panel A gCC
0
200
400
600
800
1000
1200
1400
1600
9219
102
19
11219
122
1912
20
222
0
322
0
422
0
522
0
622
0
722
0
822
0
922
0
102
20
1122
0
122
20
122
1
222
1
322
1
basi
s po
ints
Qatar Abu Dhabi Oman Bahrain Dubai Kuwait Saudi Arabia
0
200
400
600
800
1000
1200
1400
1600
92
19
102
19
112
19
122
19
12
20
22
20
32
20
42
20
52
20
62
20
72
20
82
20
92
20
102
20
112
20
122
20
12
21
22
21
32
21
basi
s po
ints
Iraq Morocco Egypt Algeria Tunisia
26 27 27 2514
38 43 4838
25
64 70 6553
43
49 48 5036
29
41 26 23
18
16
9 56
4
3
26 26 2339
56
21 30 2944
59
27 25 3043
54
59 56 60 6176 74 80 79 84 79 81 86
22 20 22 13
17 18 10 11 3 4 4 319 24 18 267 8 10 10 13 17 15 12
11 A credit default swap is a financial derivative or contract that allows an investor to swap or offset his or her credit risk with that of another investor To swap the risk of default the lender buys a CDS from another investor who agrees to reimburse the lender in the case the borrower defaults For example a CDS of 100 basis points implies that the CDS costs the lender 1 percent of the loan to ensure that the lender can be reimbursed in the case of default The price of the CDS is an insurance premium
12 Note that a CDS markets exists only for a subset of MENA countryrsquos sovereign bonds Bloomberg does not report CDS data for Lebanon which defaulted in March 2020 The bond spread for Lebanon shows a gradual increase since July 2019 and a spike to 10000 basis points in March and April of 2020
continues on next page gtgt
MIDDLE EAST AND NORTH AFRICA REgION ECONOMIC UPDATE APRIL 2021
18
C H A P T E R I A C O N T I N U I N g C R I S I S
Panel B Developing MENA
0
200
400
600
800
1000
1200
1400
1600
9219
102
19
11219
122
1912
20
222
0
322
0
422
0
522
0
622
0
722
0
822
0
922
0
102
20
1122
0
122
20
122
1
222
1
322
1
basi
s po
ints
Qatar Abu Dhabi Oman Bahrain Dubai Kuwait Saudi Arabia
0
200
400
600
800
1000
1200
1400
1600
92
19
102
19
112
19
122
19
12
20
22
20
32
20
42
20
52
20
62
20
72
20
82
20
92
20
102
20
112
20
122
20
12
21
22
21
32
21
basi
s po
ints
Iraq Morocco Egypt Algeria Tunisia
26 27 27 2514
38 43 4838
25
64 70 6553
43
49 48 5036
29
41 26 23
18
16
9 56
4
3
26 26 2339
56
21 30 2944
59
27 25 3043
54
59 56 60 6176 74 80 79 84 79 81 86
22 20 22 13
17 18 10 11 3 4 4 319 24 18 267 8 10 10 13 17 15 12
Source Bloomberg Note CDS data are from early September 2020 to March 5 2021
This report examines what factors might have affected the sharp changes in MENArsquos default risk In addition to the global factors it also examines oil demand and supply shocks which are important for the regional economies Daily data from 2016 to 2020 of 12 MENArsquos CDSs are analyzed for the regionrsquos oil exportersmdashAlgeria Bahrain Iraq Kuwait Oman Qatar Saudi Arabia and UAE (with separate CDSs for Abu Dhabi and Dubai bonds) and the oil importersmdashEgypt Morocco and Tunisia Results suggest that in addition to global factors oil demand and supply shocks play a big role in 2020 (see Appendix A2 for a detailed description of data and econometric specifications)
The above findings can offer insights on the evolution of MENArsquos credit default risk in the near term based on the forecasts of the oil market Brent oil prices are expected to be stable in 2021 at around USD 65 to USD 70 a barrel according to future Brent oil prices collected in the first week of March 2021 (Bloomberg) The US Energy Information Administration (USEIA) forecasts that oil consumption and production will likely recover to their pre-pandemic level by end of 2021 As of February 2021 the USEIA expected oil consumption to rise 63 percent and production by 33 percent (see Figure I9)
Even based on a set of large estimated effects of oil demand and supply fluctuations for 202013 the oil market recoveryrsquos impact on CDS will likely be small Assuming that the oil demand shock in 2021 equals the USEIArsquos expected change in oil consumption (63 percent) and the oil supply shock in 2021 equals the expected change in oil production (33 percent) we estimate that MENArsquos oil exportersrsquo CDSs will go down by only 22 basis points and MENArsquos oil importersrsquo CDSs will go up by only 32 basis points Even if the price of oil rises more than the February estimates of USEIA imply the oil market recovery is not likely to significantly reduce borrowing costs for MENA countries particularly for oil importers who would actually face higher default risks and thus borrowing costs as oil prices rise
In brief the pandemic has hit the regional economy hard pushing many people into poverty Fiscal positions are in distress and debt is piling up And the recovery of oil prices is unlikely to significantly reduce borrowing costs Thus how can MENA resolve the tensions between the need to borrow to pay for short-term needs and the long-term risks of public debt This is the subject of Chapter II
13 For the year 2020 a 1 percent decrease in oil demand significantly increases oil exportersrsquo CDS by 048 basis points [coefficient=048] The coefficient of oil supply shocks on oil exportersrsquo CDSs is 022 of oil demand shocks on oil importersrsquo CDS is 036 of oil supply shock on oil importersrsquo CDS is -031 The impact of oil shocks on CDS before 2020 is much smaller and largely statistically insignificant See Appendix A2 for a detailed description of data and econometric specifications
LIVINg wITH DEBT HOw INSTITUTIONS CAN CHART A PATH TO RECOVERY FOR THE MIDDLE EAST AND NORTH AFRICA
19
C H A P T E R I I H O w I N S T I T U T I O N S C A N C H A R T A PAT H T O R E C O V E R Y F O R T H E M I D D L E E A S T A N D N O R T H A F R I C A
FIGURE I9 Expected Oil Production and Consumption
80
85
90
95
100
105
Q1
2019
Q2
2019
Q3
2019
Q4
2019
Q1
2020
Q2
2020
Q3
2020
Q4
2020
Q1
2021
Q2
2021
Q3
2021
Q4
2021
Q1
2022
Q2
2022
Q3
2022
Q4
2022
mill
ion
barr
els
per d
ay
World Production World Consumption
Source US Energy Information Administration Short-Term Energy Outlook February 2021Note Data on and after Q4 2020 are projections
C H A P T E R I A C O N T I N U I N g C R I S I S
MIDDLE EAST AND NORTH AFRICA REgION ECONOMIC UPDATE APRIL 2021
20
C H A P T E R I I H O w I N S T I T U T I O N S C A N C H A R T A PAT H T O R E C O V E R Y F O R T H E M I D D L E E A S T A N D N O R T H A F R I C A
CHAPTER II How Institutions Can Chart a Path to Recovery for the Middle East and North Africa
CHAPTER II TAKEAWAYS
bull As MENA suffers the economic consequences of the pandemic most countries will face tensions between
short-term needs and the long-term risks of debt-financed government spending
bull During the pandemic fiscal spending is best used to support vulnerable families and invest in public
healthmdashsuch as disease surveillance data transparency and vaccinations
bull As the pandemic subsides some MENA countries with characteristics associated with ineffective fiscal
stimulus can consider thoughtful consolidation early during the recovery such as identifying and reducing
low-return spending items
bull Governance and transparency can help during and immediately after the pandemic as well as in the
longer term by reducing borrowing costs and accelerating growth
The pandemic is forcing economies in the MENA region to borrow a lot While addressing the immediate concerns of the pandemic is paramount prudence requires economies in the region to assess the consequences of building up debt This chapter takes stock of recent research and debates in the economics profession about debt and debt accumulation and applies it to the latest data available for the region
II1 Tensions between Short-run Needs and Long-run Costs of Debt-financed Spending
The Short-run Needs
Public debt can alleviate short-run financial constraints allowing governments to increase or maintain public consumption and investment14 Governments especially in developing countries have many pressing spending options with potentially high returns but may lack the resources to finance these activities Public debt provides those financial resources Theoretically if the economic social and environmental return on government spending exceeds the interest rate paid on the debt it makes sense for governments to finance spending through debt15 In principle governments via taxation can collect a portion of the total social return to pay back the debt that helps finance spending As productivity increases over time future generations are
14 Taxes are generally not a substitute for public debt Only in a world of perfect foresight perfect capital markets and economic agents with infinite horizons (called Ricardian-Equivalence by economists) can debt-financing and tax-financing of government spending have equivalent economic effects (Barro 1974) That is because in such a world people recognize that the debt will have to be repaid and set aside funds for future taxes In reality the proposition of perfect Ricardian equivalence is generally rejected (see Poterba and Summers 1987) Therefore debt-financed government spending can be more effective than tax-financed government spending because people do not fully consider the associated future tax liabilities of current borrowing In addition taxes are distortionary which provides another rationale for relying on borrowing it keeps tax rates constant (Barro 1979)
15 For examples investing in early education and in reducing air pollution have been shown to have very large benefit-cost ratios (see Heckman et al 2010 and USEPA 2011)
LIVINg wITH DEBT HOw INSTITUTIONS CAN CHART A PATH TO RECOVERY FOR THE MIDDLE EAST AND NORTH AFRICA
21
C H A P T E R I I H O w I N S T I T U T I O N S C A N C H A R T A PAT H T O R E C O V E R Y F O R T H E M I D D L E E A S T A N D N O R T H A F R I C A
likely better off than older generations Since public debt is akin to borrowing from tomorrow it allows smoothing resources intertemporally
Spending is needed now to limit the effects of the pandemic in the MENA region This includes transfers to support the consumption of hardest hit families and health spending to cover testing treatment and vaccination As the pandemic subsides fiscal authorities must decide whether additional fiscal stimulus is warranted to raise aggregate demand to accelerate the recovery
The Covid-19 pandemic is similar to a natural disaster such as earthquakes and floods in fundamental ways that are relevant to understanding analytically how public debt and economic growth interact Both pandemic and natural disasters are rare and unexpected occurrences and neither are directly caused by economic policies Both result in economic contractions because people are unable to work (due to physical destruction or safety concerns) Given these similarities this report examines trends in public debt and growth that occur around severe natural disasters to gain insights into how debt-financed fiscal expenditures can help the recovery of economies afflicted by disastersmdashand by analogy pandemics In developing countries after large natural disasters public debt does tend to rise to finance economic recovery (see Figure II1) During the three years following a large natural disaster growth in public debt is significantly higher than in countries that did not experience a disaster Real (adjusted for inflation) GDP growth collapses in the year of a natural disaster but is statistically significantly higher than the baseline growth two years later This finding provides an important empirical regularity that public debt does accumulate after disasters and is likely to do so after this pandemic possibly to support economic recovery
Note that the economics of armed conflicts is not the same as that of natural disasters (see Box II1) Public debt is found to increase during armed conflicts but economic growth does not pick up after them which suggests that government spending during conflicts might not be used to support economic growth
FIGURE II1 Public Debt and Output Growth around Natural Disasters
-2
-1
0
1
2
3
4
-3 -2 -1 t=0 1 2 3 GD
P gr
owth
ann
ual
Publ
ic d
ebt g
row
th a
nnua
l
Timeline around a large natural disaster years
Public debth growth annual GDP growth annual (RHS)
Sources World Bank World Development Indicators International Monetary Fund Global Debt DatabaseNote The figure displays central government public debt growth and GDP growth before during and after severe natural disasters relative to the baseline of no severe disasters Severe natural disasters are those that generate damages equivalent to at least 1 percent of the countryrsquos GDP The sample covers 324 severe natural disasters that occurred between 1960 and 2019 in 90 developing economies The disasters include floods earthquakes droughts storms landslides volcanic activities extreme temperature and wildfires The econometric framework follows a difference-in-difference approach with country and year fixed effects (see Appendix A1 for detail) Public debt growth is statistically significant at 10 percent level at t=123 GDP growth is statistically significant at 10 percent level at t=012
MIDDLE EAST AND NORTH AFRICA REgION ECONOMIC UPDATE APRIL 2021
22
C H A P T E R I I H O w I N S T I T U T I O N S C A N C H A R T A PAT H T O R E C O V E R Y F O R T H E M I D D L E E A S T A N D N O R T H A F R I C A
Box II1 Conflicts Debt and Growth
The economics of armed conflicts is different to that of natural disasters Public debt increases around armed conflicts but is probably not used to support economic growth
FIGURE BII1 Public Debt around Armed Conflicts
0
5
10
15
20
25
-5 -4 -3 -2 -1 t=0 1 2 3 4 5
Publ
ic d
ebt a
s
of G
DP
Timeline around the onset of armed conflicts years
All conflicts Severe conflicts
Source Lederman and Rojas 2018Note The figure displays the evolution of public debt of conflict countries relative to non-conflict economies before during and after armed conflicts t=0 indicates the onset of armed conflicts Severe conflicts are defined as having 1000 deaths per year at t=0 The sample includes 180 developing and developed countries (and 32 conflicts) between 1960-2015
Armed conflicts and public debt Lederman and Rojas (2018) shed light on the potentially long-lasting increases in the debt burden experienced by developing countries affected by armed conflicts The authors find that public debt in conflict-afflicted economies tends to be higher than in non-conflict economies prior to the onset of conflicts begins to rise further before conflict begins and stays high afterward (see Figure BII1) These findings suggest that developing economies experiencing conflicts finance the increased government expenditures by relying on public debt particularly after the conflict starts The weaker fiscal position under which conflict-affected countries entered the Covid-19 pandemic could severely affect not only their immediate but also their long-term ability to finance government expenditures
Armed conflicts and GDP growth The literature on the detrimental effects of conflicts on output is abundant and consistent Collier (1999) distinguishes four common routes by which armed conflicts can hurt the economy Conflicts
bull destroy physical and human capital
bull disrupt internal social dynamics
bull cause countries to divert public funds from activities that enhance output
bull contribute to dissaving which leads to economic deterioration
The magnitude of the impact of conflict on output is also estimated by economic literature Collier finds that the annual growth rate during civil wars is 22 percentage points lower than would have occurred had the war never happened Growth during the five years that follow a one-year conflict is also about 21 percentage points lower than what would have occurred had the war never happened This lack of a sustained post-conflict growth remains ldquoeven if countries successfully avoid relapsing back into conflictrdquo (Carey and Harake 2017) Armed conflict can also generate important collateral damage to the output of neighboring economies These negative spillover effects tend to amplify as the intensity of conflict increases (Murdoch and Sandler 2002 and 2004)
LIVINg wITH DEBT HOw INSTITUTIONS CAN CHART A PATH TO RECOVERY FOR THE MIDDLE EAST AND NORTH AFRICA
23
C H A P T E R I I H O w I N S T I T U T I O N S C A N C H A R T A PAT H T O R E C O V E R Y F O R T H E M I D D L E E A S T A N D N O R T H A F R I C A
The Long-Run Costs
Although public debt has an important role it also carries risks Public debt can be problematical if is used for unproductive ends More precisely if the economic and social returns to fiscal spending are lower than the realized interest rates paid for debt the debt burden relative to national income will tend to grow over time In many instances governments can be overly optimistic in their estimates of the returns to fiscal spending16 Negative shocks (such as an unexpected recession) can reduce the returns to public investment and increase realized interest rates For example the social return of infrastructure projects can be dampened in recessions when the projectsrsquo utilization declines In addition currency depreciations in bad times would inflate debt if external debt is denominated in foreign currencies In other instances governments may enact permanent spending programs based on a revenue windfall that is only temporary (Veacutegh Lederman and Bennet 2017) forcing them to continue the spending even after interest rates rise Kaminsky et al (2004) show that fiscal policy was procyclical for many developing countries although it has become more countercyclical for some of them in recent years (Frankel et al 2013)
Even when the economic and social return of fiscal spending exceeds the interest rate on debt used to finance it governments still need to be cautious about borrowing more when debt is already high As governments borrow more they may soak up available funds needed for private investment (Reinhart et al 2012) Interest rates may also rise which increases the cost of capital for the private sector Effectively the public sector may crowd out the private sector Furthermore there is also the prospect at least in the short run that an increase in debt raises expectations of future increases in tax rates to repay it which dampens present consumption and investment undermining any stimulative effect from debt-financed spending (Barro 1974)
Empirically public debt which includes both public domestic and public external debt is negatively correlated with private investment This appears to be true across MENA as shown in Figure II2 as well as for typical developing and middle-income countries This is consistent with the crowding out effects described above Note that the correlation between public debt and private investment is more negative in most MENA countries than in a typical developing country implying that the crowding out effect appears to be more severe in MENA Of course this does not mean that public debt can never reinforce private investment in some contexts In fact economic theory argues that public investment can in some instances raise private investment when it enhances the provision of public goods resulting in higher overall income in the long run
16 Frankel (2011) examines growth forecasts made by 33 official government agencies and finds that optimism bias contributes to excessive deficits More recently Beaudry and Willems (2018) find that in a sample of 189 countries optimism in real GDP growth forecasts increases the likelihood of future recessions and fiscal crises
MIDDLE EAST AND NORTH AFRICA REgION ECONOMIC UPDATE APRIL 2021
24
C H A P T E R I I H O w I N S T I T U T I O N S C A N C H A R T A PAT H T O R E C O V E R Y F O R T H E M I D D L E E A S T A N D N O R T H A F R I C A
FIGURE II2 Correlations between Public Debt Interest Payments and Private Investment
-10
-05
00
05
10
Leban
onIra
n
Jord
an
Algeria
Tunisia
Egypt
Djibouti
Developing C
ountries
Middle-Inco
me Countri
es
Correlation between public debt and private investment
Correlation between public debt and interest payments
Source World Bank Macro and Poverty Outlook (October 2020)Note Correlations are derived from public debt (percent of GDP) private fixed investment (percent of GDP) and interest payments (percent of GDP) Data are from 2000-2020 for most countries Country groups are represented by the median observation
As interest payments rise with the stock of debt they tend to increase their share in a governmentrsquos fiscal outlays Figure II2 also shows that public debt and interest payments are positively correlated for MENA countries and for a typical developing or middle-income country In two MENA countries Egypt and Lebanon interest payments have already reached around 10 percent of GDP and over 30 percent of total public expenditures in recent years (see Appendix Table B3) Such repayments may limit a governmentrsquos ability to spend on important items such as infrastructure and human capital which lowers growth prospects (Mahdavi 2004)
Elevated debt can increase vulnerability to macroeconomic volatility for several reasons As debt rises it creates fear that governments will be unable to repay resulting in a higher risk premia and therefore higher long-term real interest rates (Reinhart et al 2012) The tools at the disposal of governments such as counter-cyclical fiscal policy is also severely weakened Elevated debt reduces credit worthiness restricting access to further financing and curbing the ability of economies to roll over (that is refinance maturing) debt High levels of debt may be monetized leading to inflation currency depreciation capital flight and possibly debt or financial crises (Boskin 2020) The ongoing economic and social crisis of Lebanon after the country defaulted in March 2020 can be interpreted as a vivid example of this type of situation
At the extreme are economies that serially default Such economies may achieve a status of debt intolerance which means they are unable to take on even normal ranges of debt (Reinhart et al 2003 Reinhart and Rogoff 2009) The costs of defaulting on debt are significant for a countryrsquos trade investment flows and growth (Borensztein and Panizza 2009 Asonuma and Trebesch 2016) Defaulting on debt severely damages a countryrsquos financial systems (Reinhart et al 2003)
LIVINg wITH DEBT HOw INSTITUTIONS CAN CHART A PATH TO RECOVERY FOR THE MIDDLE EAST AND NORTH AFRICA
25
C H A P T E R I I H O w I N S T I T U T I O N S C A N C H A R T A PAT H T O R E C O V E R Y F O R T H E M I D D L E E A S T A N D N O R T H A F R I C A
Debt and Growth during 2000-2019 Evidence of Long-run Costs
Because public debt carries both costs and benefits how public debt affects economic growth is an empirical question There seem to be conceptual reasons to caution against elevated debt levels as discussed above The issue is the level of public debt that is considered ldquoelevatedrdquo Is there a common threshold across countries above which public debt accumulation hurts growth Starting from the seminal contribution of Reinhart and Rogoff (2010) many studies have investigated this relationship attempting to identify to what extent debt accumulation has a detrimental effect on GDP growth The literature seems to refute the idea of a common threshold across countries (Eberhardt and Presbitero 2015 Chudik et al 2017) But the literature does not rule out the possibility of country-specific debt thresholdsmdashincluding ones in debt intolerant countries that result in ldquoextreme duressrdquo if crossed (Reinhart et al 2003 and Reinhart and Rogoff 2009) This threshold varies by country depending on a countryrsquos default and inflation history and in debt intolerant countries may be well below a level easily managed by an advanced economy
Data suggest that countries with higher initial public debt levels in 2000 experienced lower long-run growth in GDP per capita in the following two decades (see Figure II3) The top-left panel shows that in a sample of 158 countries a median country with very high initial public debt in 2000 (that is in the high debt tercile) on average grew slower than a median country with lower initial public debt levels (in the low and medium debt terciles) in the next two decades Countries in the medium debt tercile have roughly similar average long-run growth as do countries in the low debt tercile This suggests a non-linear role of debt Nevertheless there is a great variation in average growth within each tercile For high-income economies very high initial public debt in 2000 does not seem associated with lower long-run growth which suggests that they are debt tolerant For developing and middle-income economies (the bottom panels) the association between high initial public debt in 2000 and subsequent low growth is more striking Developing economies in the top tercile of debt-to-GDP in 2000 typically grew about 1 percentage point per year lower in the following 20 years than those in the first and second debt terciles17
17 A similar finding is obtained when considering the relationship between initial debt in 1980 and subsequent long-run growth in 1980-1999 Developing economies in the lowest tercile of debt-to-GDP in 1980 typically grew 08 percentage points per year lower in the next two decades than those in the second and the highest terciles Developing economies in the middle debt tercile also had as low long-run growth as countries in the top debt tercile did This might reflect a volatile environment during 1980-1999 with relatively high interest rates and more default episodes
MIDDLE EAST AND NORTH AFRICA REgION ECONOMIC UPDATE APRIL 2021
26
C H A P T E R I I H O w I N S T I T U T I O N S C A N C H A R T A PAT H T O R E C O V E R Y F O R T H E M I D D L E E A S T A N D N O R T H A F R I C A
FIGURE II3 Median Annual per Capita Growth During 2000-2019 across Countries Ranked by Central Government Debt in 2000
Low Debt Tercile in2000 (median
2310)
Medium DebtTercile in 2000
(median 5359)
High Debt Tercile in2000 (median
9838)
All Countries
40th percentile Median 60th percentile
Low Debt Tercile in2000 (median
2476)
Medium DebtTercile in 2000
(median 5659)
High Debt Tercilein 2000 (median
10253)
Developing Economies
00
05
10
15
20
25
30
35
Low Debt Tercile in2000 (median
2171)
Medium Debt Tercilein 2000 (median
4206)
High Debt Tercile in2000 (median
7932)
Middle Income Economies
00
05
10
15
20
25
30
35
Low Debt Tercile in2000 (median
2274)
Medium Debt Tercilein 2000 (median
4138)
High Debt Tercile in2000 (median
8384)
High Income Economies
00
05
10
15
20
25
30
35
00
05
10
15
20
25
30
35
Source World Bank World Development Indicators International Monetary Fund Global Debt DatabaseNote Figure displays the real GDP per capita growth between 2000 and 2019 for each tercile of central government debt (percent of GDP) in 2000 by each country income group The overall sample covers 158 economiesmdash131 developing and 27 advanced economies based on the 1987 World Bank income classification The average annual growth rate is calculated between 2000 and 2019 The median real GDP per capita growth is presented for each of four groups (i) all countries (ii) high income (iii) developing (including middle-income and low-income countries) and (iv) middle income The debt terciles are in increasing order with the median of each tercile indicated in the horizontal axis Growth rates for the median 40th percentile and 60th percentile country are presented for each group
The Tensions are More Severe for Developing Countries
The association between developing countriesrsquo high initial public debt in 2000 and their subsequent low growth supports the notion that the tension between short-term needs and long-term costs of debt-financing is more severe for developing economies than for advanced ones For the developed world accommodative monetary policy and rising savings are expected to keep interest rates low favoring government borrowing Advanced countries are also known to be less debt intolerant so they can continue to borrow at relatively higher levels of public debt For the developing world including developing MENA the tension is starker Many MENA countriesmdashsuch as Egypt Jordan and Bahrainmdashface relatively high borrowing costs despite extremely low global interest rates (see Figure II4) The borrowing if not resulting in sufficiently high return fiscal spending in terms of GDP growth will add to future debt burden The default risk of many MENA countries rose sharply during the pandemic as
LIVINg wITH DEBT HOw INSTITUTIONS CAN CHART A PATH TO RECOVERY FOR THE MIDDLE EAST AND NORTH AFRICA
27
C H A P T E R I I H O w I N S T I T U T I O N S C A N C H A R T A PAT H T O R E C O V E R Y F O R T H E M I D D L E E A S T A N D N O R T H A F R I C A
shown in Figure I8 in Chapter I This is probably because many MENA countries entered the pandemic with high debt chronic low growth and weak governancemdashespecially when it came to transparency These existing vulnerabilities heighten the costs of their debt accumulation It is noteworthy that historically the probability of defaults andor current account reversals in developing MENA was abnormally low despite chronic low growth and persistent macroeconomic imbalances This was possible because of the support of high-income GCC countries via FDI and official assistance (Arezki et al 2019) However secular oil price declines driven by technological changes in the energy sector have significantly reduced the GCCrsquos willingness to continue to serve as a lender thus changing market expectations about debt vulnerability in developing MENA
FIGURE II4 Coupon Rates of US Dollar-denominated Debt Issuances during the Pandemic by Maturity for MENA countries Chile and Brazil
Bahrain
Bahrain
Bahrain Bahrain
Bahrain
Bahrain
Egypt
Egypt
Egypt
Egypt Egypt
Egypt
Egypt
Jordan
Jordan
Morocco
Morocco
MoroccoQatar
Qatar
Qatar
Saudi ArabiaSaudi Arabia
Saudi Arabia
Saudi Arabia
Saudi Arabia
Saudi ArabiaChile
Chile
Chile
Brazil
Brazil
24
68
10C
oupo
n R
ate
()
2020 2030 2040 2050 2060 2070Maturity
Source CbondscomNote Data are from the beginning of 2020 to February 27 2021 For comparability only coupon rates of US dollar-denominated debt issuances are displayed Coupon rates of EURO-denominated debt issuances from the region are not displayed but the overall finding remains the same
II2 The Role of Institutions in Shaping the Tradeoff
What can MENA countries do to navigate the tensions between short-term objectives and long-term risks of rising public debt
MENA countries can develop a transparent and credible multi-year fiscal and debt strategy to reduce the costs of public debt to bring debt-to-GDP ratio to sustainable levels and to reduce uncertainty for creditors and other economic agents18 This section tackles this question by discussing policy options during three different phases of an economic recovery from the pandemic
18 A fiscal rule is an example of a transparent and credible plan that applies in short-term and long-term in which a government provides clarity about when and to what extent it would conduct debt-financing fiscal spending (see Vegh et al 2017)
MIDDLE EAST AND NORTH AFRICA REgION ECONOMIC UPDATE APRIL 2021
28
C H A P T E R I I H O w I N S T I T U T I O N S C A N C H A R T A PAT H T O R E C O V E R Y F O R T H E M I D D L E E A S T A N D N O R T H A F R I C A
expenditure priorities during the pandemic
fiscal stimulus immediately as the pandemic subsides
mitigating the potential costs of debt overhang in the medium term
Prioritizing Spending during the Pandemic - Transparency and Surveillance
Conventional wisdom advocates a strong counter-cyclical role of fiscal expenditure Early studies suggest that fiscal multipliers are generally larger during bad times (Corsetti et al 2012 Riera-Crichton et al 2015 Auerbach and Gorodnichenko 2012) although recent research casts doubt on this wisdom (Ramey 2019) Nevertheless it is important to note that unlike in previous recessions fiscal policies are not designed primarily to boost aggregate demand during the Covid-19 pandemic because the collapse in aggregate demand in the pandemic was mainly driven by health concerns associated with the exposure to Covid-19 and not by underlying economic issues Social distancing has been shown to take place whether or not a government imposes restrictions such as lockdowns to slow the spread of the virus (Maloney and Taskin 2020 Gupta et al 2020) The collapse in demand is concentrated in sectors that require travel and face-to-face interactionsmdashsuch as airlines tourism hotel and restaurants brick-and-mortar retail and personal services19 As long as the risk of Covid-19 exposure remains stimulating aggregate demand is likely to be elusive
There are two main roles of fiscal spending during the pandemic to protect the welfare of vulnerable families and to invest in public health As Chapter I discusses poorer households in MENA have been disproportionately hurt Supporting the consumption of the hardest hit households is an essential objective for fiscal spending MENA countries have taken unprecedented actions to support the most vulnerable The good news is that cash transfers are reasonably well-targeted A bigger portion of the poorest households are beneficiaries than those at the top of the distribution evidence from phone surveys in the region suggests Yet there is room to improve since social transfers have been able to reach only a small portion of the families most in need
Public health investment as a short-term response to the pandemic could bring large long-term social returns such as better access to healthcare for the poor To contain the pandemic authorities could boost health spendingmdashto produce or acquire personal protective equipment testing kits and contact tracing systems and to mobilize and pay health workers Scaling up testing and contact tracing for Covid-19 as well as improving data transparency are especially important because these steps enable authorities to determine the dimensions of the infection to detect and isolate cases and to encourage the population to take appropriate social distancing measures The Gulf Cooperation Council (GCC) countriesmdashBahrain Kuwait Oman Qatar Saudi Arabia and the United Arab Emiratesmdashhave relatively high testing per capita As vaccines become available health spending can be allocated toward an immunization infrastructuremdashincluding among other things procurement of vaccines clear and effective communication to generate awareness of and demand for vaccination and building networks of local vaccination providers An effective vaccination campaign can both speed up the roll-out of vaccines which would pave the way for economic recovery and reinforce the foundation of public health infrastructure Simple calculations of the costs and benefits of investing in vaccination programs indicate that the benefit-cost ratio is very large around 781 if MENA vaccinates 20 percent of its population at the current prices envisioned by COVAX the multilateral initiative to make Covid-19 vaccines available to low- and middle-income countries (Ahuja et al 2021)
Investing in testing and public surveillance of the outbreak also appears to reduce the economic costs of the pandemic Preliminary evidence suggests that countries with a high level of tests coming back positive (a high test-positivity rate) suffered larger growth downgrades (see Figure I3 in Chapter I) A high test-positivity rate reflects a relatively uncontrolled pandemic
19 For example see Georgetown Universityrsquos job tracker httpscewgeorgetowneducew-reportsjobtracker for sectoral job losses in the United States
LIVINg wITH DEBT HOw INSTITUTIONS CAN CHART A PATH TO RECOVERY FOR THE MIDDLE EAST AND NORTH AFRICA
29
C H A P T E R I I H O w I N S T I T U T I O N S C A N C H A R T A PAT H T O R E C O V E R Y F O R T H E M I D D L E E A S T A N D N O R T H A F R I C A
which might reflect a limited outreach of testing as a public health surveillance tool Unfortunately many MENA countries have either high positivity rates (above the 5 percent benchmark set by the World Health Organization) or do not report reliable test results But some high-income countries in the MENA region have been at the global forefront of using testing for disease surveillance and rolling out vaccination programs (see Table I2 in Chapter I)
The Effectiveness of Public Investment Depends on Governance
MENA countries will have to decide whether additional fiscal stimulus is warranted after the public health emergency
On the one hand certain factors caution against embarking on additional stimulus in MENA First fiscal stimulus might not be needed because the recovery could be aided by rebound growth from demand for goods and services that could not be satisfied during the health emergency Because of this pent-up demand consumer and business spending will rise after it becomes clear that health risks have subsided (Krugman 2020 Lee 2020) The pent-up demand rebound depends on the duration of the crisis The longer the crisis goes the more likely firm liquidity constraints will result in solvency issues which might limit the upside of the recovery This scenario again underscores the importance of a rapid rollout of vaccines Moreover the extent of this pent-up demand rebound for the MENA regionmdashespecially from important external sources of demand such as tourismmdashdepends on the effectiveness and transparency of pandemic surveillance People will not likely resume traveling or spending on personal services if uncertainty regarding Covid-19 persists
Second fiscal stimulus can be ineffective or even counterproductive in MENA countries with elevated debt such as many oil importers (see Appendix Table B4) Published research indicates that in an environment of high public debt the so-called fiscal multiplier from additional spending can be zero (Ilzetzki et al 2013) Huidrom et al (2020) estimate that two-year fiscal multipliers can range from zero when government debt is high (in the 90th percentile of their sample that is above 92 percent of GDP) to 06 when government debt is low (in the 10th percentile or less than 17 percent of GDP) Two channels could cause negligible response to fiscal stimulus in economies with high public debt In one households reduce consumption when the fiscal stimulus is implemented in anticipation of future fiscal adjustments (such as tax increases or fiscal austerity) to finance the stimulus This is referred to as the Ricardian equivalence channel after Robert Barrorsquos seminal research in 1974 In the second called the interest rate channel concerns about sovereign credit risk raise interest rates and hence reduce aggregate demand (Huidrom et al 2020)
Third even though public investment can bring short and long run gains caution is warranted in countries with poor governance Public investment such as infrastructure projects is usually understood to have larger long-run effects than public consumption and social transfers (Auerbach and Gorodnichenko 2012 Veacutegh et al 2018) Unlike government consumption public investment directly improves the economyrsquos productive capacity by increasing the marginal product of private capital and labor As time progresses this generates positive effects both on private investment and private consumption (Leduc and Wilson 2013) In addition countries with a low initial stock of public capital (as a proportion of GDP) have significantly higher public investment multipliers than countries with a high initial stock of public capital (Izquierdo et al 2019) Eden and Kraay (2014) report that in low-income countries on average an extra dollar of government investment raises private investment by roughly two dollars and output by 15 dollars Nevertheless public investment may have a more limited short-term multiplier because of delayed implementation (Ramey 2020) More important the economic gains from public investment projects can be hindered by poor governance which reduces the efficiency of public investment For example public projects with
MIDDLE EAST AND NORTH AFRICA REgION ECONOMIC UPDATE APRIL 2021
30
C H A P T E R I I H O w I N S T I T U T I O N S C A N C H A R T A PAT H T O R E C O V E R Y F O R T H E M I D D L E E A S T A N D N O R T H A F R I C A
low economic and social return are selected when governance is poor At least this appears to be the case even for a large sample of European countries (Izquierdo et al 2019) In countries with the lowest institutional capacity and transparency the multiplier of public investment can be close to zero in both the short- and long-term Unfortunately governance is one area in which the MENA region trails its world peers (see Appendix Table B4) This concern reinforces the need to work on reforms to improve the governance of public investment decisions
On the other hand many countries in MENA rely on fixed exchange rate regimes (see Appendix Table B4) which can boost fiscal multipliers (Corsetti et al 2012 Ilzetzki et al 2013) As described by Ilzetzki et al (2013) ldquothe initial effect of a fiscal expansion is to increase output raise interest rates and induce an inflow of foreign capital which creates pressure to appreciate the domestic currency Under predetermined exchange rates the monetary authority expands the money supply to prevent this appreciation Such monetary policy accommodation serves to accommodate the rise in output Under flexible exchange rates however the monetary authority keeps a lid on the money supply and thus allows the real exchange rate appreciation to reduce net exports Output does not change because the increase in government spending is exactly offset by the fall in net exportsrdquo Table II1 summarizes the literature on country characteristics and the size of fiscal multipliers
TABLE II1 Country Characteristics and the Size of Fiscal Multipliers
Size of Fiscal Multipliers Public Debt Output Gap Governance Exchange Rate
Regime
LARgE Low Large Strong Pegged
SMALL High Small Weak Flexible
Sources Ilzetzki et al (2013) Huidrom et al (2020)
Corsetti et al (2012) Riera-Crichton et al (2015)
Auerbach and Gorodnichenko (2012)
Izquierdo et al (2019)Corsetti et al (2012) Ilzetzki
et al (2013)
Note See Appendix Table B4 for the corresponding positions of MENA countries
The arguments for and against demand-stimulating fiscal actions after the pandemic do not rule out the usefulness of targeted fiscal
spending Focusing on economic impacts of the crisis with potentially long-lasting consequences can be a helpful guide Consistent with
the existing literature this report labels these as ldquoscarring effectsrdquo (Portes 2020 Baldwin and Weder di Mauro 2020 Arellano-Bover
forthcoming) For example financial constraints might prevent firms from making the initial investment to re-enter the market Or workers
who became unemployed or under-employed during the crisis might face long-term reductions in the chances of finding employment and
even lower wagesmdashand thus need retraining and job search assistance School closures interrupt studentsrsquo skill accumulation20 For example
without targeted remediation the human capital of children who are now in school is likely to be reduced by almost 5 which is the order
of magnitude of the average improvement in human capital globally in the past ten years (World Bank 2020c) Government spending
such as subsidized loans job training and resources for schools to make up for the loss of learning can mitigate these ldquoscarringrdquo effects
20 If the return to an additional year of education is approximately 8-10 percent and the average student misses one quarter of the school year then one might estimate a permanent impact on earnings of 2 percent to 25 percent (Portes 2020)
LIVINg wITH DEBT HOw INSTITUTIONS CAN CHART A PATH TO RECOVERY FOR THE MIDDLE EAST AND NORTH AFRICA
31
C H A P T E R I I H O w I N S T I T U T I O N S C A N C H A R T A PAT H T O R E C O V E R Y F O R T H E M I D D L E E A S T A N D N O R T H A F R I C A
Mitigating the Costs of Public Debt after the Pandemic with Transparency and Governance
The costs of elevated debt are likely to manifest themselves eventually perhaps even in the short term To help in April 2020 the so-called Group of 20 advanced economies initiated a Debt Service Suspension Initiative (DSSI) which suspended interest and principal payments for the poorest countries from May 1 through December 31 2020 It was later extended to June 30 2021 While this is a helpful respite DSSI does not reduce debt value (see Box II2)
Box II2 The Debt Service Suspension Initiative (DSSI)
With the support of the World Bank Group and the International Monetary Fund (IMF) the so-called Group of 20 advanced economies (G20) is allowing 73 low- and lower-middle-income countries to temporarily suspend debt service paymentsmdashboth interest and principalmdashowed to their official bilateral creditors The suspension is designed to temporarily ease the debt pressure on poorer countries and free up resources that can be used to fight the pandemic and support vulnerable people The G20 has also called on private creditors to participate in the initiative on comparable terms The Debt Service Suspension Initiative (DSSI) originally was to run from May 1 2020 through December 31 2020 but was extended through the end of June 2021 (World Bank 2020b)
Two MENA countries are eligible from the DSSImdashDjibouti and Yemen In the latest Debt Sustainability Analysis (DSA) conducted in May 2020 by the World Bank and the IMF Djibouti is considered to be at high risk of external debt distress and at high risk of overall debt distress because of the impact of the Covid-19 on macroeconomic prospects (World Bank and IMF 2020) The government of Djibouti has participated in the DSSI Potential DSSI savings for Djibouti amounts to 17 percent of GDP during May-December 2020 and 2 percent of GDP during January-June 2021 (World Bank 2020b) Yemen is also participating in the DSSI However because of external arrears Yemenrsquos benefit from the DSSI is notional
The DSSI is helping poorest countries by allowing payment delay The initiative does not reduce the debt stock nor the total amount that the debtors are expected to pay to the creditors The DSSI also does not restructure debt Restructurings encompasses actions that reduce the debt stock andor extend maturities andor reduce interest rates
Soon after the pandemic countries in the region may have to take action to reduce the share debt represents of GDP even when economic output remains below potential To do so governments can
Raise economic growth
Undertake thoughtful fiscal consolidation
Use inflation to erode the value of domestic debt
Refinance (roll over) maturing debt on more favorable terms
Default or restructure debt
Some options are more beneficial and feasible than others with transparency and governance playing a key role
MIDDLE EAST AND NORTH AFRICA REgION ECONOMIC UPDATE APRIL 2021
32
C H A P T E R I I H O w I N S T I T U T I O N S C A N C H A R T A PAT H T O R E C O V E R Y F O R T H E M I D D L E E A S T A N D N O R T H A F R I C A
Raising economic growth increasing economic output remains the most sustainable way to reduce debt Boosting economic growth in MENA requires much-needed deep structural reforms to raise the productivity of the existing workforce and put idle working-age people in jobs Unemployment in the MENA region is high and is concentrated in young people and the educated The regionrsquos female labor force participation rate is the lowest in the world A powerful way to put more people to work and enhance the productivity of the current workforce is to promote fair competition (Arezki et al 2020a) and adopt digital technologymdashespecially in finance and telecommunication These enhancements would be especially important to the informal sector which would gain access to services and markets previously accessible only to the privileged few and to state-owned enterprises In some countries where the both telecommunication and digital payment infrastructure are underdeveloped removing barriers to entering and leaving markets is important
Undertake thoughtful fiscal consolidation After the pandemic steps to reduce fiscal deficits (called fiscal consolidation) can also be considered by MENA countries that have such conditions as high debt and weak governance that impedes the effectiveness of fiscal stimulus Fiscal consolidation does not mean indiscriminate spending reduction Rather this can be achieved by prioritizing the most effective spending items coupled with improved spending decisions In highly indebted countries thoughtful fiscal consolidation such as reducing low-return spending items might have a small negative impact or could even be welcomed by private sector This is consistent with the finding that the fiscal multiplier is close to zero or negative in such countries (Ilzetzki et al 2013 Huidrom et al 2020) Over the medium term MENA countries can aim to gradually reduce heavy subsidies and expand the formal private sector to increase the tax base MENArsquos labor market currently consists of a large informal sector that gives workers virtually no social protections and produces little tax in tax revenue (World Bank 2014 Gatti et al 2014)
Using inflation to erode domestic debt Although historically inflationary episodes have reduced the value of domestic debt inflation is unlikely to be a deliberate policy tool to reduce debt High inflation is well-known to be very costlymdashhurting long-run economic growth (Bruno and Easterly 1998) and putting depreciation pressure on exchange rates High inflation also has important distributional costs as it disproportionately hurts the poor (Easterly and Fischer 2001 Bulir 2001) and people living on fixed income such as retirees Unlike most poor people the rich have access to real and financial instruments and can protect themselves against inflation Inflation can also cause social unrest Anecdotal evidence suggests that inflation especially in food and fuel prices can trigger protests (NPR 2011 Washington Post 2015) Arezki and Bruckner (2011) systematically find that increases in food prices cause anti-government demonstrations and riots in poor countries In sum inflation is not likely a policy tool Rather it is usually a sign of difficult economic conditions as demonstrated by two MENA countries with high inflationmdashLebanon and Iran
An alternative approach financial repression can only work to gradually reduce public debt over time and carries costs Financial repression consists of controlled domestic interest rates captive domestic lenders that provide credit to the government and positive inflation rates (McKinnon 1973 and Reinhart and Sbrancia 2015) These factors can generate negative real interest rates and gradually reduce existing domestic public debt Financial repression was an important factor in the debt reduction of advanced countries in the decades after World War II21 The early literature found that because of government interventions in pricing and funding allocation financial repression hurts financial development (Demetriades and Luintel 1997) and long-run growth (Roubini and Sala-i-Martin 1992) In addition to their downsides financial repression policies take time to substantially reduce the debt-to-GDP ratio
21 For example for the United States and the United Kingdom the annual liquidation of debt via negative real interest rates amounted on average to 2 and 3 percent of GDP a year during the post-war period (Reinhart and Sbrancia 2015)
LIVINg wITH DEBT HOw INSTITUTIONS CAN CHART A PATH TO RECOVERY FOR THE MIDDLE EAST AND NORTH AFRICA
33
C H A P T E R I I H O w I N S T I T U T I O N S C A N C H A R T A PAT H T O R E C O V E R Y F O R T H E M I D D L E E A S T A N D N O R T H A F R I C A
Rolling over debt with more favorable terms To reduce debt MENA countries can also aim to refinance maturing debt on more favorable terms The good news is that global interest rates are expected to remain low The US Federal Reserve has set its policy interest rate goal at or near zero to achieve maximum employment and will allow inflation to moderately go above the 2 percent target rate for some time (Federal Reserve FOMC Statement December 2020)22 The Federal Reserve forecasts that interest rates will remain near zero at least through 2023 (Federal Reserve Economic Projections December 2020)23 The European Central Bankrsquos overnight deposit rate has been negative and declining since 2014 (European Central Bank 2021) Given these monetary policy goals for two of the worldrsquos most important central banks global interest rates are likely to remain low for some time although that could change due to pent-up demand
However interest rates for MENArsquos new debt will not necessarily be low given the regionrsquos high debt and low growth The coupon rates paid by many MENA countriesmdashsuch as Egypt Jordan and Bahrainmdashwere high during the pandemic for debt issuances denominated in hard currencies even when interest rates were extremely low globally (see Figure II4) But MENA countries with low levels of public external debt (such as Qatar Saudi Arabia and Morocco) could issue debt with lower coupon rates In addition it is not certain that after the pandemic interest rates will remain so low Partly because of favorable global liquidity conditions fostered by central banks in advanced markets private capital outflows have been moderate and many middle-income countries were able to continue borrowing in global capital markets After the pandemic the unprecedented liquidity support by advanced countriesrsquo central banks will probably stop Many emerging markets with synchronized rises in debt levels might have to compete for liquidity to roll over their debt A less liquid global scenario added to the high debt reduced oil prices chronic low growth and the external imbalances that beset many MENA countries means that the region might face considerable challenges competing for liquidity
To access more favorable terms MENA countries need to enhance their growth prospects Economic growth can directly reduce debt as a share of GDP and help MENA countries roll over existing debt on good terms If MENA countries are to be able to roll over their debt and gradually get on a sustainable debt dynamic it is crucial that they achieve the stable macroeconomic conditions necessary for growth
MENA countries can work to enhance debt reporting transparency and monitor financial market vulnerabilities Such measures can lower rollover costs Studies have shown that greater data transparency can lower the costs of external borrowing (Cady 2005 Choi and Hashimoto 2018) This is probably because when investors are unsure about a countryrsquos debt profile they demand a higher risk premium More broadly studies have found positive correlations between data transparency and governance (Islam 2006 and Williams 2009) and growth (Arezki et al 2020b) MENA countries can improve public debt reporting including debt borrowed from China24 Improving debt reporting is important because hidden public debt such as debt of SOEs can become exposed usually in distressed times and is added to the total tally of public debt precisely at the moments public debt needs to be brought under the control the most (Reinhart 2015) A potential mechanism to mitigate hidden debt is to develop a secondary market for private debt including non-performing loans
This report updates MENArsquos public debt reporting first documented in Arezki et al (2020b) providing an overall reporting of different categories of public debt such as state and local government extra budgetary funds and SOE liabilities The transparency of public debt reporting is largely unchanged between 2019 and 2020 with notable improvements in Tunisia
22 httpswwwfederalreservegovnewseventspressreleasesmonetary20201216ahtm23 httpswwwfederalreservegovmonetarypolicyfomcprojtabl20201216htm24 Horn and others (2020) find that 50 of Chinarsquos lending to developing countries is not reported to the IMF or World Bank These ldquohidden debtsrdquo distort policy surveillance risk
pricing and debt sustainability analyses
MIDDLE EAST AND NORTH AFRICA REgION ECONOMIC UPDATE APRIL 2021
34
C H A P T E R I I H O w I N S T I T U T I O N S C A N C H A R T A PAT H T O R E C O V E R Y F O R T H E M I D D L E E A S T A N D N O R T H A F R I C A
and Jordan (see Appendix Table B5) Closely monitoring financial market vulnerabilities such as non-performing loans held by banks is also important to improve investor confidence and reduce borrowing costs
Defaulting or Restructuring Debt If MENA countries cannot roll over debt they may risk costly debt restructurings Debt restructuring is a process wherein a country experiencing financial distress and liquidity problems refinances its existing debt obligations in order to gain more flexibility in the short term and make its debt load more manageable overall There are two types of debt restructuringsmdashpreemptive and post-default In preemptive restructurings a country decides to restructure its external debt before it misses any payments In a post-default restructuring a country is forced to enter into debt negotiations because it has missed payments (that is defaulted)
FIGURE II5 GDP Growth in Lebanon and Jordan
-25
-20
-15
-10
-5
0
5
2017 2018 2019 2020 2021 2022 2023
perc
ent
Jordan Lebanon
Source World Bank Macro and Poverty Forecasts (April 2021)Note Data for 2021 2022 and 2023 are forecasts Forecasts for Lebanonrsquos GDP growth in 2022 and 2023 are not available Lebanon defaulted in March 2020
Defaults are costly as the default of Lebanon shows On March 7 2020 the Lebanese government defaulted on a $12 billion Eurobond payment in its first sovereign default The Lebanese Lira depreciated sharply and with heavy fluctuations The Eurobond default precludes access to international markets for foreign financing The domestic banking sector is impaired because of the exposure to the government debt The lack of bank credit coupled with exchange market pressures choke trade and corporate finance in the highly dollarized economy constraining the capital and final goods imports (World Bank 2020a) The current account deficit was sharply reduced from a deficit of 21 percent of GDP in 2019 to a deficit of 11 percent of GDP in 2020 mainly because imports dried up A year into the economic crisis there have been limited policy responses by the authorities The political situation is volatile Lebanon lacks a fully functioning executive authority and as of early March 2021 is trying to form its cabinet
The warning signs of Lebanonrsquos economic collapse were ominous Lebanonrsquos GDP growth gradually declined in the years leading up to the default (Figure II5) Real GDP contracted by 19 percent in 2018 and 67 percent in 2019 respectively In 2020 real GDP is estimated to contract 203 percent and in 2021 it is expected to shrink another 95 percent This performance is in stark contrast to a neighbor Jordan which is expected to record positive economic growth in 2021
LIVINg wITH DEBT HOw INSTITUTIONS CAN CHART A PATH TO RECOVERY FOR THE MIDDLE EAST AND NORTH AFRICA
35
C H A P T E R I I H O w I N S T I T U T I O N S C A N C H A R T A PAT H T O R E C O V E R Y F O R T H E M I D D L E E A S T A N D N O R T H A F R I C A
To systematically understand restructurings we study the evolution of growth external debt and governance around restructurings for developing countries using the restructuring dataset constructed and maintained by Asonuma and Trebesch (2016) The dataset provides information on the occurrence and duration of restructurings with private external creditors from 1978 (see Appendix A3 for detail)25 The cases are differentiated into two categories preemptive restructurings and post-default restructurings
Highly indebted countries are more likely to enter either type of debt restructuring when they experience low growth and weak governance In Figure II6 the blue bars show that countries that default or preemptively restructure have lower growth and weaker governance quality in the five years preceding the event than do countries with no restructurings Several MENA countries entered 2020 with deficits in both dimensions as shown in the red bars The deficits are most striking for Lebanon which defaulted in 2020 and to a lesser extent for MENA middle-income countries The good news for MENA middle-income oil importers the group of countries with relatively high public debt is that the gaps in growth and governance are more modest than those in other MENA middle-income countries
In addition there seems to be a systematic difference in governance quality between countries that default and countries that preemptively restructure In the five years before the event countries that default have governance scores than average 02 points lower than countries that do not restructure while countries that preemptively restructure have an average governance score 01 points lowermdashsuggesting that institutions play a role in restructuring decisions
FIGURE II6 Growth and Governance before Restructurings
Panel A Difference in gDP growth (percentage)
-5
-4
-3
-2
-1
0
Countries thatdefaulted minus
the control group
MENA middleincome minus the
control group
MENA middle-income oil
importers minusthe control group
Lebanon minus thecontrol group
-05
-04
-03
-02
-01
0
Countries thatdefaulted minus
the control group
Countries thatpreemptivelyrestructured
minus thecountrol group
Countries thatpreemptivelyrestructured
minus thecountrol group
MENA middleincome minus the
control group
MENA middle-income oil
importers minusthe control group
Lebanon minusthe control group
Source World Bank staff calculationNote The first bar from the left shows 5-year average annual GDP growth before a post-default restructuring minus that before non-restructuring periods (referred to as average growth of the control group or agcg) The second bar shows 5-year average annual GDP growth before a preemptive restructuring minus agcg The third bar shows the average annual GDP growth during 2014-2019 for MENA middle-income countries minus agcg The fourth bar shows the average annual GDP growth during 2014-2019 for MENA middle income oil importers minus agcg The fifth bar shows the average annual GDP growth during 2014-2019 for Lebanon minus agcg
25 See Schlegl et al (2019) for a study on restructurings of debts owed by foreign governments Multilateral institutions such as the IMF the World Bank and other regional banks are the most ldquoseniorrdquo creditors meaning their loans get repaid first
continues on next page gtgt
MIDDLE EAST AND NORTH AFRICA REgION ECONOMIC UPDATE APRIL 2021
36
C H A P T E R I I H O w I N S T I T U T I O N S C A N C H A R T A PAT H T O R E C O V E R Y F O R T H E M I D D L E E A S T A N D N O R T H A F R I C A
Panel B Difference in governance (score)
-5
-4
-3
-2
-1
0
Countries thatdefaulted minus
the control group
MENA middleincome minus the
control group
MENA middle-income oil
importers minusthe control group
Lebanon minus thecontrol group
-05
-04
-03
-02
-01
0
Countries thatdefaulted minus
the control group
Countries thatpreemptivelyrestructured
minus thecountrol group
Countries thatpreemptivelyrestructured
minus thecountrol group
MENA middleincome minus the
control group
MENA middle-income oil
importers minusthe control group
Lebanon minusthe control group
Source World Bank staff calculationNote Governance is simple average between rule of law regulatory quality and government effectiveness (with a range from -25 (worst) to 25 (best))The first bar from the left shows 5-year average governance before a post-default restructuring minus that for non-restructuring periods (referred to as average governance of the control group or agocg The second bar shows 5-year average governance before a preemptive restructuring minus agocg The third bar shows average governance during 2014-2019 for MENA middle-income countries minus agocg The fourth bar shows average governance during 2014-2019 for MENA middle-income oil importers minus agocg The fifth bar shows average governance during 2014-2019 for Lebanon minus agocg
While both forms of restructurings with private external creditors are costly preemptive restructurings are less so They are shorter and most importantly associated with lower output cost than post-default restructurings Countries that preemptively restructure are able to re-enter borrowing markets sooner than those that default (Asonuma and Trebesch 2016) To gain further understanding of the extent to which pre-emptive restructurings might be preferable to post-default debt restructuring this report estimates the impact of such events on both growth and debt We focus on three years before the year of the announcement of a restructuring and three years after the start of a restructuring For both types of episodes the estimates are relative to the performance of countries that did not experience a debt restructuring Details of the analysis are in Appendix A3
Our analyses show that both types of restructurings are costly in terms of output growth but preemptive restructurings are less costly than defaults Panel A of Figure II7 show before they restructure debtor countries experience lower growth relative to countries that do not restructure This is the case for both preemptive and post-default restructurings However after the first year of restructuring growth starts to recover for preemptive restructurings but remains depressed for post-default restructurings
In addition restructurings help slow debt accumulation Panel B of Figure II7 shows that during the first two years after a restructuring starts (that is t=12) debt growth is significantly lower in both preemptive and post-default restructurings compared to the countries that did not restructure This could reflect the exclusion of restructuring countries from international debt markets and the reduction in debt granted by creditors during the restructuring negotiations
LIVINg wITH DEBT HOw INSTITUTIONS CAN CHART A PATH TO RECOVERY FOR THE MIDDLE EAST AND NORTH AFRICA
37
C H A P T E R I I H O w I N S T I T U T I O N S C A N C H A R T A PAT H T O R E C O V E R Y F O R T H E M I D D L E E A S T A N D N O R T H A F R I C A
FIGURE II7 Output Growth and Debt Growth around Restructurings
Panel A Output growth around Restructurings Panel B External Debt growth around Restructurings
-4
-3
-2
-1
0
1
-2 -1 0 1 2 3
percent
-30
-20
-10
0
10
20
-3 -2 -1 0 1 2 3
Pre-emptive restructurings Post-default restructurings
percent
-3
Pre-emptive restructurings Post-default restructurings
Source World Bankrsquos staff estimates (see Appendix A3 for details)Note Difference-in-difference approach t=0 onset of a restructuring t=-3-2-1 indicate the years before restructurings t=123 indicate the years after a restructuring starts Data consists of 197 restructurings to private external creditors between 1981 and 2019 and are collected and updated by Asonuma amp Trebesch (2016) Panel A The coefficient at t=-1 is statistically significant at 10 level for preemptive restructurings The coefficients at t=-112 are statistically significant at 10 level for post-default restructurings Panel B The coefficients at t=12 are statistically significant at 10 level for preemptive restructurings The coefficient at t=2 is statistically significant at 10 level for post-default restructurings
II3 How Institutions Shape the Recovery
Economic growth remains the most sustainable way to reduce debt Boosting economic growth requires deep structural reforms to raise the productivity of the existing workforce and to put idle working-age people in jobs Many MENA countries that have characteristics associated with ineffective fiscal stimulus such as high public debt and poor governance could consider fiscal reforms early in the recovery from the pandemic Rolling over debt with more favorable terms is an important way for countries to gradually reduce debt This also requires debt transparency and financial market monitoring If they are unable to roll over maturing loans countries risk costly debt restructurings Our evidence suggests that many MENA countries share certain characteristics with countries that entered costly debt restructurings namely low growth and poor governance Institutions can play an important role in mitigating the long-term costs of public debt
Improvements in governance and transparency also help during the pandemic and when it subsides Investing in testing disease surveillance and data transparency can reduce the economic costs of the pandemic As the pandemic subsides effective and transparent pandemic surveillance in the region would help boost demand from domestic and foreign sourcesmdashsuch as the arrival of foreign tourists Good governance in public investment decisions can raise the economic gains of public investment projects
Institutional reforms to improve governance and transparency can address the tradeoff between the short-term needs and long-term costs of public debt They can be implemented with limited fiscal costs They also hold the promise of boosting long-run growth Looking forward institutions might be the key to helping MENA build back better with or without fiscal consolidation
-4
-3
-2
-1
0
1
-2 -1 0 1 2 3
percent
-30
-20
-10
0
10
20
-3 -2 -1 0 1 2 3
Pre-emptive restructurings Post-default restructurings
percent
-3
Pre-emptive restructurings Post-default restructurings
MIDDLE EAST AND NORTH AFRICA REgION ECONOMIC UPDATE APRIL 2021
38
References
Ahuja Amrita Juan Camilo Castillo Michael Kremer Greg Larson and Jean Lee 2021 ldquoPurchasing Covid-19 Vaccines Analysis of Costs and Benefits for Africardquo mimeo
Apedo-Amah Marie Christine Besart Avdiu Xavier Cirera Marcio Cruz Elwyn Davies Arti Grover Leonardo Iacovone Umut Kilinc Denis Medvedev Franklin Okechukwu Maduko Stavros Poupakis Jesica Torres Trang Thu Tran 2020 ldquoUnmasking the Impact of COVID-19 on Businesses Firm Level Evidence from Across the Worldrdquo Policy Research Working Paper No 9434
Arellano-Bover Jaime Forthcoming ldquoThe Effect of Labor Market Conditions at Entry on Workersrsquo Long-Term Skillsrdquo The Review of Economics and Statistics
Arezki Rabah and Markus Bruckner 2011 Food prices and political instability IMF Working Papers 1-22
Arezki Rabah Lederman Daniel Harb Amani Abou Fan Rachel Yuting Nguyen Ha 2019 ldquoReforms and External Imbalances The Labor-Productivity Connection in the Middle East and North Africardquo Middle East and North Africa Economic Update (April) World Bank Washington DC
Arezki Rabah Ait Ali Slimane Meriem Barone Andrea Decker Klaus Detter Dag Fan Rachel Yuting Nguyen Ha Miralles Murciego Graciela Senbet Lemma 2020a ldquoReaching New Heights Promoting Fair Competition in the Middle East and North Africardquo Middle East and North Africa Economic Update (October) Washington DC World Bank
Arezki Rabah Lederman Daniel Abou Harb Amani El-Mallakh Nelly Fan Rachel Yuting Islam Asif Nguyen Ha Zouaidi Marwane 2020b ldquoHow Transparency Can Help the Middle East and North Africardquo Middle East and North Africa Economic Update (April) Washington DC World Bank
Arezki Rabah Moreno-Dodson Blanca Yuting Fan Rachel Gansey Romeo Nguyen Ha Cong Nguyen Minh Mottaghi Lili Tsakas Constantin Wood Christina 2020c Trading Together Reviving Middle East and North Africa Regional Integration in the Post-Covid Era Middle East and North Africa Economic Update October 2020
Asonuma Tamon and Christoph Trebesch 2016 Sovereign Debt Restructurings Preemptive or Post-default Journal of the European Economic Association 141 175-214
Auerbach Alan and Yuriy Gorodnichenko 2012 ldquoFiscal Multipliers in Recession and Expansionrdquo In Fiscal Policy after the Financial Crisis (pp 63-98) University of Chicago press
Azevedo Joao Pedro Amer Hasan Diana Goldemberg Syedah Aroob Iqbal and Koen Geven 2020 ldquoSimulating the Potential Impacts of COVID-19 School Closures on Schooling and Learning Outcomes A Set of Global Estimatesrdquo Policy Research Working Paper No 9284 World Bank Washington DC
Barro Robert 1974 Are Government Bonds Net Wealth Journal of Political Economy NovemberDecember 83 1095-117
R E F E R E N C E S
LIVINg wITH DEBT HOw INSTITUTIONS CAN CHART A PATH TO RECOVERY FOR THE MIDDLE EAST AND NORTH AFRICA
39
Barro Robert 1979 On the Determination of the Public Debt Journal of Political Economy 87(5) 940-971
Baldwin Richard and B Weder di Mauro 2020 ldquoMitigating the Covid Economic Crisis Act Fast and Do Whatever It Takesrdquo Voxeuorg eBook CEPR Press
Beaudry Paul and Tim Willems 2018 ldquoOn the Macroeconomic Consequences of Over Optimismrdquo NBER Working Paper No 24685 Cambridge MA National Bureau of Economic Research
Borensztein Eduardo and Ugo Panizza 2009 The costs of sovereign default IMF Staff Papers 564 683-741
Boskin Michael 2020 ldquoAre Large Deficits and Debt Dangerousrdquo AEA Papers and Proceedings 110 145-148
Bruno Michael and William Easterly 1998 ldquoInflation Crises and Long-run Growthrdquo Journal of Monetary Economics 41(1) pp 3-26
Bulir Aleš 2001 Income Inequality Does Inflation Matter IMF Staff papers 48 no 1 (2001) 139-159
Cady John 2005 Does SDDS Subscription Reduce Borrowing Costs for Emerging Market Economies IMF Staff Papers 52(3) 1-6
Carey Kevin and Wissam Harake 2017 ldquoUnited NationsmdashWorld Bank Prevention Study Chapter 7 Input Macroeconomic Environment and Policiesrdquo The World Bank
Cashin Paul Kamiar Mohaddes Maziar Raissi and Mehdi Raissi 2014 ldquoThe Differential Effects of Oil Demand and Supply Shocks on the Global Economyrdquo Energy Economics 44 113ndash134
Centers for Disease Control and Prevention ndash CDC 2020 Frequently Asked Questions Calculating Severe Acute Respiratory Syndrome Coronavirus 2 (SARS-CoV-2) RT-PCR Laboratory Test Percent Positivity
Choi Sangyup and Yuko Hashimoto 2018 Does Transparency Pay Evidence from IMF Data Transparency Policy Reforms and Emerging Market Sovereign Bond Spreads Journal of International Money and Finance vol 88(C) pages 171-190
Chudik Alexander Kamiar Mohaddes M Hashem Pesaran and Mehdi Raissi 2017 Is There a Debt-threshold effect on Output Growth Review of Economics and Statistics 99 (1) 135-150
Collier Paul 1999 ldquoOn the economic consequences of civil warrdquo Oxford Economic Papers 51(1) 168-183
Corral Paul amp Roberta Gatti 2020 Accumulation interrupted COVID-19 and human capital among the young Vox eBook Chapters in Simeon Djankov amp Ugo Panizza (ed) COVID-19 in Developing Economies edition 1 volume 1 chapter 1 pages 286-302 Centre for Economic Policy Research
Corsetti Giancarlo Andre Meier and Gernot J Muumlller 2012 ldquoWhat Determines Government Spending Multipliersrdquo Economic Policy 27(72) 521-565
CNBC 2021 Oil slides reversing early gains that pushed prices to highest level in more than a year March 7 2021 httpswwwcnbccom20210308brent-breaks-70-after-houthis-attack-saudi-arabias-oil-facilitieshtml
r
R E F E R E N C E S
MIDDLE EAST AND NORTH AFRICA REgION ECONOMIC UPDATE APRIL 2021
40
De Walque Damien Fred Friedman Roberta Gatti Aaditya Mattoo 2020 How Two Tests Can Help Contain COVID-19 and Revive the Economy Research amp Policy Briefs no 29 Washington DC
Del Granado Francisco Javier Arze David Coady and Robert Gillingham 2012 The Unequal Benefits of Fuel Subsidies A Review of Evidence for Developing Countries World Development 4011 (2012) 2234-2248
Devarajan Shantayanan Vinaya Swaroop and Heng-fu Zou 1996 ldquoThe Composition of Public Expenditure and Economic Growthrdquo Journal of Monetary Economics 37(2) 313-344
Demetriades Panicos and Kul B Luintel 1997 The Direct Costs of Financial Repression Evidence from India Review of Economics and Statistics 792 311-320
Easterly William and Stanley Fischer 2001 Inflation and the Poor Journal of Money Credit and Banking pp 160-178
Eberhardt Markus and Andrea F Presbitero 2015 Public debt and growth Heterogeneity and non-linearity Journal of International Economics 97 (1) 45-58
Eden Maya and Aart Kraay 2014 ldquoCrowding inrdquo and the Returns to Government Investment in Low-Income Countriesrdquo Policy Research Working Paper No 6781 The World Bank
European Central Bank 2021 Key ECB interest rates httpswwwecbeuropaeustatspolicy_and_exchange_rateskey_ecb_interest_rateshtmlindexenhtml
Fomby Thomas Yuki Ikeda and Norman V Loayza 2013 The Growth Aftermath of Natural Disasters Journal of Applied Econometrics 28 (3) 412-434
Frankel Jeffrey 2011 ldquoOver-optimism in Forecasts by Official Budget Agencies and Its Implicationsrdquo NBER Working Paper No 17239
Frankel Jeffrey Carlos A Veacutegh and Guillermo Vuletin 2013 On Graduation from Fiscal Procyclicality Journal of Development Economics 100 (1) 32-47
Gatti Roberta Diego Angel-Urdinola Joana Silva and Andraacutes Bodor 2014 ldquoStriving for Better Jobs The Challenge of Informality in the Middle East and North Africardquo Washington DC World Bank
Gentilini Ugo Mohamed Almenfi and Pamela Dale 2020 ldquoSocial Protection and Jobs Responses to Covid-19 A Real-Time Review of Country Measuresrdquo ldquoLiving paperrdquo version 14 (December 11 2020) The World Bank
Gupta Sumedha Kosali I Simon and Coady Wing 2020 Mandated and Voluntary Social Distancing During The Covid-19 Epidemic A Review NBER Working Papers 28139
Hall Robert 1978 Stochastic Implications of the Life Cycle-Permanent Income Hypothesis Theory and Evidence Journal of Political Economy 866 971-987
R E F E R E N C E S
LIVINg wITH DEBT HOw INSTITUTIONS CAN CHART A PATH TO RECOVERY FOR THE MIDDLE EAST AND NORTH AFRICA
41
Heckman James J Seong Hyeok Moon Rodrigo Pinto Peter A Savelyev and Adam Yavitz 2010 The rate of return to the HighScope Perry Preschool Program Journal of Public Economics 94 no 1-2 114-128
Horn Sebastian Carmen M Reinhart and Christoph Trebesch 2019 Chinarsquos overseas lending National Bureau of Economic Research Working Paper w26050
Huidrom Raju M Ayhan Kose James Lim and Franziska L Ohnsorge 2020 Why do Fiscal Multipliers depend on Fiscal Positions Journal of Monetary Economics Elsevier vol 114(C) pages 109-125
Ilzetzki Ethan Enrique Mendoza and Carlos Veacutegh 2013 ldquoHow Big (Small) Are Fiscal Multipliersrdquo Journal of Monetary Economics 60(2) 239-254
Integrated Food Security Phase Classification (IPC) 2020 Yemen Integrated Food Insecurity Phase Classification Snapshot- October 2020- June 2021
International Monetary Fund (IMF) 2013 ldquoStaff Guidance Note for Public Debt Sustainability Analysis in Market-Access Countriesrdquo
mdashmdashmdash2017 ldquoGuidance note on the Bank-Fund Debt Sustainability Framework for Low Income Countriesrdquo
mdashmdashmdash2021 ldquoPolicy Responses to Covid-19rdquo httpswwwimforgenTopicsimf-and-covid19Policy-Responses-to-COVID-19
Islam Roumeen 2006 ldquoDoes More Transparency Go along with Better Governancerdquo Economics and Politics 18 (2)121ndash67
Izquierdo Alejandro Ruy E Lama Juan Pablo Medina Jorge P Puig Daniel Riera-Crichton Carlos A Veacutegh and Guillermo Vuletin 2019 ldquoIs the Public Investment Multiplier Higher in Developing Countries An Empirical Investigationrdquo NBER Working Paper No 26478
Joumard Isabelle Mauro Pisu and Debbie Bloch 2012 ldquoTackling income inequality The role of taxes and transfersrdquo OECD Journal Economic Studies
Kaminsky Graciela L Carmen Reinhart and Carlos Veacutegh 2004 When It Rains It Pours Procyclical Capital Flows and Macroeconomic Policies NBER Macroeconomics Annual 19 11-53
Krugman Paul 2020 ldquoThings Will Get Better Seriouslyrdquo New York Times December 31 2020
Kubota Megumi and Albert Zeufack 2020 ldquoAssessing the Returns on Investment in Data Openness and Transparencyrdquo Policy Research Working Paper WPS 9136 Washington DC World Bank Group
Lederman Daniel and Claudio Rojas 2018 ldquoThree Macroeconomic Trends Around the Onset of Armed Conflict in Developing Economiesrdquo Policy Research Working Paper No WPS 8647 The World Bank
Leduc Sylvain and Daniel Wilson 2013 Roads to Prosperity or Bridges to Nowhere Theory and Evidence on the Impact of Public Infrastructure Investment NBER Macroeconomics Annual 27 no 1 89-142
R E F E R E N C E S
MIDDLE EAST AND NORTH AFRICA REgION ECONOMIC UPDATE APRIL 2021
42
Lee Don 2020 Vaccinesrsquo Rollout and Pent-up Consumer Demand Brighten US Economic Outlook December 16 2020 httpswwwlatimescompoliticsstory2020-12-16rollout-of-vaccines-and-pent-up-demand-brighten-u-s-economic-outlook
Mahdavi Saeid 2004 ldquoShifts in the Composition of Government Spending in Response to External Debt Burdenrdquo World Development 32(7) 1139-1157
McKinnon Ronald I 1973 Money and Capital in Economic Development Brooking Institution Press
Maloney William and Temel Taskin 2020 ldquoDeterminants of Social Distancing and Economic Activity during Covid-19 A Global Viewrdquo Policy Research Working Paper No 9242 World Bank Washington DC
Mohammed Nadir Djibrilla Issa and Aminur Rahman 2021 ldquoWhy the COVID-19 impact on Firms in MENA differ from other regionsrdquo Asharq Bloomberg
Murdoch James and Todd Sandler 2002 ldquoEconomic Growth Civil Wars and Spatial Spilloversrdquo Journal of Conflict Resolution 46(1) 91-110
Murdoch James and Todd Sandler 2004 Civil Wars and Economic Growth Spatial Dispersion American Journal of Political Science 48 (1) 138-151
National Public Radio (NPR) 2011 ldquoThe Impact of Rising Food Prices on Arab Unrestrdquo February 18 2011
Obstfeld Maurice and Kenneth Rogoff 1995 The Intertemporal Approach to the Current Account Handbook of International Economics 3 1731-1799
Poterba James M and Lawrence H Summers 1987 Finite Lifetimes and the Effects of Budget Deficits on National Saving Journal of Monetary Economics 202 369-391
Portes Jonathan 2020 ldquoThe Lasting Scars of the Covid-19 Crisis Channels and Impactsrdquo VoxEU Blog httpsvoxeuorgarticlelasting-scars-covid-19-crisis
Psacharopoulos George and Harry Anthony Patrinos 2018 ldquoReturns to Investment in Education A Decennial Review of the Global Literaturerdquo Education Economics 265 445-458
Rafiq Shudhasattwa Pasquale Sgro and Nicholas Apergis 2016 Asymmetric Oil Shocks and External Balances of Major Oil Exporting and Importing Countries Energy Economics 56 42ndash50
Ramey Valerie 2011 ldquoIdentifying Government Spending Shocks Its All in the Timingrdquo The Quarterly Journal of Economics 126(1) 1-50
Ramey Valerie 2019 Ten Years after the Financial Crisis What Have We Learned from the Renaissance in Fiscal Research Journal of Economic Perspectives 332 89-114
R E F E R E N C E SR E F E R E N C E S
LIVINg wITH DEBT HOw INSTITUTIONS CAN CHART A PATH TO RECOVERY FOR THE MIDDLE EAST AND NORTH AFRICA
43
Ramey Valerie 2020 ldquoThe Macroeconomic Consequences of Infrastructure Investmentrdquo National Bureau of Economic Research Working Paper 27625
Ready Robert 2018 ldquoOil Prices and the Stock Marketrdquo Review of Finance 155ndash176
Reed Tristan William Waites David Manheim Damien de Walque Chiara Vallini Roberta Gatti Timothy Hallett 2021 ldquoFive Ways that COVID-19 Diagnostics Can Save Lives Prioritizing Uses of Tests to Maximize Cost-Effectivenessrdquo Research and Policy Brief No 43 World Bank Washington DC
Reinhart Carmen 2015 The Hidden Debt Burden of Emerging Markets Project Syndicate October 9 2015
Reinhart Carmen M and Kenneth S Rogoff 2010 Growth in a Time of Debt American Economic Review Papers and Proceedings 1002 573-78
Reinhart Carmen Vincent Reinhart and Kenneth Rogoff 2012 ldquoPublic Debt Overhangs Advanced Economy Episodes Since 1800rdquo Journal of Economic Perspectives 26(3) 69-86
Reinhart Carmen and Kenneth Rogoff 2009 This Time is Different Eight Centuries of Financial Folly Princeton University Press
Reinhart Carmen and Belen Sbrancia 2015 The Liquidation of Government Debt Economic Policy 3082 291-333
Reinhart Carmen Kenneth S Rogoff and Miguel A Savastano 2003 ldquoDebt Intolerancerdquo Brookings Papers on Economic Activity 11-62
Riera-Crichton Daniel Carlos A Vegh and Guillermo Vuletin 2015 ldquoProcyclical and Countercyclical Fiscal Multipliers Evidence from OECD countriesrdquo Journal of International Money and Finance 52 15-31
Romer Cristina D and David H Romer 2010 ldquoThe Macroeconomic Effects of Tax Changes Estimates Based on a New Measure of Fiscal Shocksrdquo American Economic Review 100(3) 763-801
Roubini Nouriel and Xavier Sala-i-Martin 1992 Financial Repression and Economic Growth Journal of Development Economics 391 (1992) 5-30
Schlegl Matthias Christoph Trebesch and Mark LJ Wright 2019 The Seniority Structure of Sovereign Debt NBER Working Papers 25793 National Bureau of Economic Research Inc
United Nations Conference on Trade and Development - UNCTAD 2020 Global Trade Update October 2020
mdashmdashmdash 2021 Global Trade Update February 2021
United States Environmental Protection Agency- USEPA 2011 The Benefits and Costs of the Clean Air Act from 1990 to 2020
Veacutegh Carlos Daniel Lederman and Federico Bennet 2017 ldquoLeaning against the Wind Fiscal Policy in Latin America and the Caribbean in a Historical Perspectiverdquo LAC Semiannual Report (April) Washington DC World Bank
R E F E R E N C E S
MIDDLE EAST AND NORTH AFRICA REgION ECONOMIC UPDATE APRIL 2021
44
Veacutegh Carlos Guillermo Vuletin Daniel Riera-Crichton Diego Friedheim Luis Morano and Joseacute Andreacutee Camarena 2018 ldquoFiscal Adjustment in Latin America and the Caribbean Short-Run Pain Long-Run Gainrdquo LAC Semiannual Report (April) World Bank Washington DC
Washington Post 2015 ldquoWhere and Why Food Prices Lead to Social Upheavalrdquo February 22 2015
Williams Andrew 2009 ldquoOn the Release of Information by Governments Causes and Consequencesrdquo Journal of Development Economics 89 124ndash38
World Bank 2016 MoroccomdashIdentity and Targeting for Social Protection Project (English) Washington DCWorld Bank Group httpdocumentsworldbankorgcurateden298251489370445157Morocco-Identity-and-Targeting-for-Social-Protection-Project
mdashmdashmdash 2014 Unlocking the Employment Potential in the Middle East and North Africa
mdashmdashmdash2019 Understanding Poverty and Inequality in Egypt World Bank Washington DC
mdashmdashmdash 2020a Lebanon Economic Monitor Fall 2020 The Deliberate Depression World Bank Washington DC
mdashmdashmdash2020b Covid-19 Debt Service Suspension Initiative httpswwwworldbankorgentopicdebtbriefcovid-19-debt-service-suspension-initiative
World Bank 2020c The Human Capital Index 2020 Update Human Capital in the Time of COVID-19 World Bank Washington DC
mdashmdashmdashand IMF 2020 Djibouti Joint World Bank-IMF Debt Sustainability Analysis httpdocuments1worldbankorgcurateden649601596487780040pdfDjibouti-Joint-World-Bank-IMF-Debt-Sustainability-Analysispdf
R E F E R E N C E S
LIVINg wITH DEBT HOw INSTITUTIONS CAN CHART A PATH TO RECOVERY FOR THE MIDDLE EAST AND NORTH AFRICA
45
R E F E R E N C E S
Appendix
Appendix A1 Debt and Output Growth After Natural Disasters
Epidemics are not new to modern societies According to the Centre for Research on the Epidemiology of Disasters and its Emergency Events Database (EM-DAT) between 1900 and 2020 the world has had 15563 natural disasters of which 1492 were epidemics making them the fourth most common natural disaster after floods storms and earthquakes (see Figure A11)26 Our objective is to estimate the impact that natural disasters of large magnitude like the Covid-19 pandemic have on public debt and GDP growth in developing economies27 To achieve this our empirical strategy is based on a difference-in-difference estimator
Data
Data on natural disasters are from EM-DAT The pool of natural disasters included in EM-DAT fulfils at least one of the following outcomes in the country affected 10 or more people dead or 100 or more people affected or a declaration of a state of emergency or a call for international assistance
Since we are interested in analyzing macroeconomic trends in developing countries all developed countries (identified by the World Bankrsquos Historical Income Classification in 1987) have been excluded from the analysis If a country was created after 1987 its classification is based on the income classification the year it was created The final sample has 142 countries
Not all disasters generate damages large enough to change the macroeconomic dynamics of a country To filter events with discernable macroeconomic effects our research weights the magnitude of the damages produced by a disaster by the overall size of the economy of the affected country More specifically our econometric analysis focuses on natural disasters of high intensity that generated damages that are equivalent to at least 1 percent of the GDP of the country affected that year (based on the total estimated damages reported by EM-DAT28) Using those filters we end up with 324 natural disasters that occurred in 90 developing countries between 1960 and 2019 They include flood earthquake droughts storm landslide volcanic activity extreme temperature and wildfire
We rely on two macroeconomic indicators The first GDP annual growth comes from the World Bankrsquos World Development Indicators The second comes from the IMFrsquos Global Debt Database (GDD) Central Government Debt
26 According to the EM-DAT database from the 691 catastrophes registered for Middle East and North Africa Region between 1900 and 2020 the most common natural disasters are floods (323 episodes 467 percent of the total) earthquakes (167 episodes 242 percent) storms (72 episodes 104 percent) and epidemics (39 episodes 56 percent)
27 Our question is close to Fomby and others (2013) although their study does not examine debt28 According to EM-DAT this is a value of all damages and economic losses directly or indirectly related to the disaster
FIGURE A11 Natural Disasters 1900-2020
Flood34
Storm28
Earthquake10
Epidemic9
Landslide5
Drought5
Others2
Wildfire3
Ext Temp4
Source World Banks staff calculations based on EM-DAT database
A P P E N D I X
MIDDLE EAST AND NORTH AFRICA REgION ECONOMIC UPDATE APRIL 2021
46
Econometric strategy
Results
1
To systematically analyze the macroeconomic impacts of natural disasters in developing economies we rely on a
difference-in-difference estimator This method estimates the effect of a treatment (the onset of a natural disaster)
on an outcome (GDP growth and public debt accumulation) This is done by comparing the average change over
time of these variables for the treatment group (economies affected by a natural disaster) with the average change
over time for the control group (non-affected economies)
The econometric strategy that aims to identify these potential effects is the following difference-in-difference
estimator
= $ +micro + micro + amp(amp + )(++-012134 + 5
The subscripts c and t denote countries and event years respectively represents the macroeconomic variable
of interest (GDP growth annual percent Debt growth annual percent) The inclusion of country fixed effects (micro) along with time fixed effects (micro) implies that we will be comparing within-country macroeconomic trends of
affected economies and non-affected economies during each year in the sample
(amp is a dummy variable that identifies the year of the onset of a disaster $ represents the constant term and 5 is the error term is the coefficient of interest to be estimated which we allow to vary over the course of the
episodes of natural disasters The subscript n denotes the duration of each episode covering as mentioned above
seven years around the onset of disasters Therefore n ranges from -3 to +3 This setup implies that we are tracing
pre-disaster trends as well as post-onset trends which allows for inferences about whether the differential trends
if any predate the onset of a natural disaster Additional controls in the regression include -012134 which
is a control for the number of natural disasters during the previous six years that cause damages that cost more
than 1 percent of GDP and in the regression for public debt (+ which is the annual change in GDP We
clustered the errors at the country level
Results
Figure II1 plots the coefficients for the estimated mean differences between countries affected by natural disasters
that generated damages of at least 1 percent of their GDP and the contemporaneous control group of non-affected
countries for public debt and GDP growth The double asterisks highlight the coefficient estimates that are
statistically significant at the 10 percent level Both figures analyze the same 324 natural disasters
Debt growth significantly increases in countries affected by natural disasters that generated damages of at least 1
percent of their GDP relative to those countries who did not experience such natural disasters (see Figure II1) GDP
growth is higher in the post-disaster period in countries affected by large natural disasters relative to those
countries who did not experience them In the year of the disaster GDP growth in affected economies is significantly
lower relative to the control group But GDP growth is 09 higher in the first year after the onset of a high intensity
natural disaster and 083 percentage points higher in the second year in affected counties relative to non-affected
countries In sum although natural disasters that generated damages of at least 1 percent of a countryrsquos GDP cause
a strong economic contraction in the year they occur GDP tends to bounce back the three years following the
event reaching a rate of growth that is on average almost one percentage point higher than in non-affected
economies
1
To systematically analyze the macroeconomic impacts of natural disasters in developing economies we rely on a
difference-in-difference estimator This method estimates the effect of a treatment (the onset of a natural disaster)
on an outcome (GDP growth and public debt accumulation) This is done by comparing the average change over
time of these variables for the treatment group (economies affected by a natural disaster) with the average change
over time for the control group (non-affected economies)
The econometric strategy that aims to identify these potential effects is the following difference-in-difference
estimator
= $ +micro + micro + amp(amp + )(++-012134 + 5
The subscripts c and t denote countries and event years respectively represents the macroeconomic variable
of interest (GDP growth annual percent Debt growth annual percent) The inclusion of country fixed effects (micro) along with time fixed effects (micro) implies that we will be comparing within-country macroeconomic trends of
affected economies and non-affected economies during each year in the sample
(amp is a dummy variable that identifies the year of the onset of a disaster $ represents the constant term and 5 is the error term is the coefficient of interest to be estimated which we allow to vary over the course of the
episodes of natural disasters The subscript n denotes the duration of each episode covering as mentioned above
seven years around the onset of disasters Therefore n ranges from -3 to +3 This setup implies that we are tracing
pre-disaster trends as well as post-onset trends which allows for inferences about whether the differential trends
if any predate the onset of a natural disaster Additional controls in the regression include -012134 which
is a control for the number of natural disasters during the previous six years that cause damages that cost more
than 1 percent of GDP and in the regression for public debt (+ which is the annual change in GDP We
clustered the errors at the country level
Results
Figure II1 plots the coefficients for the estimated mean differences between countries affected by natural disasters
that generated damages of at least 1 percent of their GDP and the contemporaneous control group of non-affected
countries for public debt and GDP growth The double asterisks highlight the coefficient estimates that are
statistically significant at the 10 percent level Both figures analyze the same 324 natural disasters
Debt growth significantly increases in countries affected by natural disasters that generated damages of at least 1
percent of their GDP relative to those countries who did not experience such natural disasters (see Figure II1) GDP
growth is higher in the post-disaster period in countries affected by large natural disasters relative to those
countries who did not experience them In the year of the disaster GDP growth in affected economies is significantly
lower relative to the control group But GDP growth is 09 higher in the first year after the onset of a high intensity
natural disaster and 083 percentage points higher in the second year in affected counties relative to non-affected
countries In sum although natural disasters that generated damages of at least 1 percent of a countryrsquos GDP cause
a strong economic contraction in the year they occur GDP tends to bounce back the three years following the
event reaching a rate of growth that is on average almost one percentage point higher than in non-affected
economies A P P E N D I X
LIVINg wITH DEBT HOw INSTITUTIONS CAN CHART A PATH TO RECOVERY FOR THE MIDDLE EAST AND NORTH AFRICA
47
Appendix A2 Oil Shocks and MENArsquos Creditworthiness
1
To systematically analyze the macroeconomic impacts of natural disasters in developing economies we rely on a
difference-in-difference estimator This method estimates the effect of a treatment (the onset of a natural disaster)
on an outcome (GDP growth and public debt accumulation) This is done by comparing the average change over
time of these variables for the treatment group (economies affected by a natural disaster) with the average change
over time for the control group (non-affected economies)
The econometric strategy that aims to identify these potential effects is the following difference-in-difference
estimator
= $ +micro + micro + amp(amp + )(++-012134 + 5
The subscripts c and t denote countries and event years respectively represents the macroeconomic variable
of interest (GDP growth annual percent Debt growth annual percent) The inclusion of country fixed effects (micro) along with time fixed effects (micro) implies that we will be comparing within-country macroeconomic trends of
affected economies and non-affected economies during each year in the sample
(amp is a dummy variable that identifies the year of the onset of a disaster $ represents the constant term and 5 is the error term is the coefficient of interest to be estimated which we allow to vary over the course of the
episodes of natural disasters The subscript n denotes the duration of each episode covering as mentioned above
seven years around the onset of disasters Therefore n ranges from -3 to +3 This setup implies that we are tracing
pre-disaster trends as well as post-onset trends which allows for inferences about whether the differential trends
if any predate the onset of a natural disaster Additional controls in the regression include -012134 which
is a control for the number of natural disasters during the previous six years that cause damages that cost more
than 1 percent of GDP and in the regression for public debt (+ which is the annual change in GDP We
clustered the errors at the country level
Results
Figure II1 plots the coefficients for the estimated mean differences between countries affected by natural disasters
that generated damages of at least 1 percent of their GDP and the contemporaneous control group of non-affected
countries for public debt and GDP growth The double asterisks highlight the coefficient estimates that are
statistically significant at the 10 percent level Both figures analyze the same 324 natural disasters
Debt growth significantly increases in countries affected by natural disasters that generated damages of at least 1
percent of their GDP relative to those countries who did not experience such natural disasters (see Figure II1) GDP
growth is higher in the post-disaster period in countries affected by large natural disasters relative to those
countries who did not experience them In the year of the disaster GDP growth in affected economies is significantly
lower relative to the control group But GDP growth is 09 higher in the first year after the onset of a high intensity
natural disaster and 083 percentage points higher in the second year in affected counties relative to non-affected
countries In sum although natural disasters that generated damages of at least 1 percent of a countryrsquos GDP cause
a strong economic contraction in the year they occur GDP tends to bounce back the three years following the
event reaching a rate of growth that is on average almost one percentage point higher than in non-affected
economies
2
Appendix A2 Oil Shocks and MENArsquos Creditworthiness
We adopt the methodology followed by Ready (2018) to decompose oil shocks into supply and demand shocks
This decomposition allows us to examine the impact of both oil supply and demand shocks at daily frequency
Ready (2018) classifies and decomposes three types of oil shocks
Demand shocks the residuals of a contemporaneous regression where returns on the global index of oil producing
firms are regressed against unexpected changes in the log of VIX index (that is the uncertainty index)
Supply shocks the residuals of a contemporaneous regression where changes in oil prices are regressed against
demand shocks and unexpected changes in the VIX index
Risk shocks After obtaining oil supply and demand shocks we adopt a conventual model setup in the literature
to examine the impact of oil shocks on sovereign default risk measured by credit default swaps (CDS)
∆-(8 =$ + (∆-(8( +9)(lt8=gt-( +9+A(
-(+
amp
-(
B(30CD( +)8EFF( +G
where ΔCDSit is the daily change in sovereign CDS spread of countries denoted by i over days denoted by t
DOMESTICjit-1 contains the set of domestic control variables the daily return on each countryrsquos stock market (St
Return) and the daily change in the exchange rate of each countryrsquos currency against the US dollar (ΔFX Rate)
GLOBALjt-1 is the set of global control variables the daily change in the Chicago Board Options Exchange volatility
index (ΔVIX ) the daily SampP 500 index return (SampP500 Return) the daily change in the German 10-year Bond yield
(ΔGerman Bond) the daily change in the effective Federal Funds rate (ΔFedFund) the daily change in the European
Repo rate (ΔEuro Repo) and the daily change in the 10-year US Treasury yield (ΔTreasury) Demandt-1 is the one-
day lagged shock to the demand side of oil and Supplyt-1 is the one-day lagged shock to the supply side of oil
both shocks constructed as in Ready (2018) Exporti is an invariant dummy variable that takes the value of 1 if a
country is net oil-exporter at the beginning of the sample period and 0 otherwise Year2020 is a dummy variable
that takes the value one in days of year 2020 and zero otherwise The sample period is from January 2016 to
October 2020 Countries included in the analysis are MENA oil exporters Algeria Bahrain Iraq Kuwait Oman
Qatar Saudi Arabia and United Arab Emirates (Abu Dhabi and Dubai) and oil importers Egypt Morocco and
Tunisia The impact of oil shocks may differ based on the energy status of a country (Cashin et al 2014 Rafiq et
al 2016) Table A21 shows the baseline results for our analysis
Appendix A3 Debt and Output Growth Around Restructurings
To understand the impact of restructurings on external debt and GDP growth in developing economies we
studied the restructuring dataset constructed first by Asonuma and Trebesch (2016)
Data on restructurings
Asonuma and Trebesch (2016) provide information on the occurrence and duration of 204 restructurings globally
starting in 1978 197 of which have been completed The cases are further differentiated into two categories
preemptive restructurings and post-default restructurings In preemptive restructurings governments renegotiate
A P P E N D I X
MIDDLE EAST AND NORTH AFRICA REgION ECONOMIC UPDATE APRIL 2021
48
TABLE A21 Impacts of Global Factors and Oil Shocks on MENArsquos Credit Default Swaps
Dependent variable ΔCDSit Estimated Coefficients
ΔCDSit-1
00133
(00101)
St Returnit-1
00707
(0480)
ΔFX Rateit-1
-4620
(6089)
ΔVIXt-1
-0158
(00848)
SampP500 Returnt-1
-0492
(0165)
ΔGerman Bondt-1
9513
(3774)
ΔFedFundt-1
-2138
(2399)
ΔEuro Repot-1
7070
(7248)
ΔTreasuryt-1
0141
(3081)
Demandt-1
-0158
(0163)
Supplyt-1
000538
(0110)
Supplyt-1
Exporti
-0281
(0137)
Demandt-1
Exporti
0147
(0197)
Year20201103
(0343)
Supplyt-1
Year2020-0318
(0129)
Demandt-1
Year20200518
(0203)
Supplyt-1
ExportiYear2020
0369
(0163)
Demandt-1
ExportiYear2020
-0985
(0247)
Demandt-1
ExportiYear2020
-0477
(0101)
A P P E N D I X
LIVINg wITH DEBT HOw INSTITUTIONS CAN CHART A PATH TO RECOVERY FOR THE MIDDLE EAST AND NORTH AFRICA
49
Demandt-1
Exporti
-0010
(0123)
Supplyt-1 Export
iYear2020
-0224
(056)
Supplyt-1
Exporti
-0276
(0083)
Demandt-1
ImportiYear20200360
(0129)
Demandt-1
ImportiYear2020-0312
(0068)
Constant-0183
(0253)
Country Effects Yes
Year Effects Yes
Observations 9999
R-squared 0012
Number of Countries 12
Appendix A3 Debt and Output Growth Around Restructurings
Data on restructurings
2
Appendix A2 Oil Shocks and MENArsquos Creditworthiness
We adopt the methodology followed by Ready (2018) to decompose oil shocks into supply and demand shocks
This decomposition allows us to examine the impact of both oil supply and demand shocks at daily frequency
Ready (2018) classifies and decomposes three types of oil shocks
Demand shocks the residuals of a contemporaneous regression where returns on the global index of oil producing
firms are regressed against unexpected changes in the log of VIX index (that is the uncertainty index)
Supply shocks the residuals of a contemporaneous regression where changes in oil prices are regressed against
demand shocks and unexpected changes in the VIX index
Risk shocks After obtaining oil supply and demand shocks we adopt a conventual model setup in the literature
to examine the impact of oil shocks on sovereign default risk measured by credit default swaps (CDS)
∆-(8 =$ + (∆-(8( +9)(lt8=gt-( +9+A(
-(+
amp
-(
B(30CD( +)8EFF( +G
where ΔCDSit is the daily change in sovereign CDS spread of countries denoted by i over days denoted by t
DOMESTICjit-1 contains the set of domestic control variables the daily return on each countryrsquos stock market (St
Return) and the daily change in the exchange rate of each countryrsquos currency against the US dollar (ΔFX Rate)
GLOBALjt-1 is the set of global control variables the daily change in the Chicago Board Options Exchange volatility
index (ΔVIX ) the daily SampP 500 index return (SampP500 Return) the daily change in the German 10-year Bond yield
(ΔGerman Bond) the daily change in the effective Federal Funds rate (ΔFedFund) the daily change in the European
Repo rate (ΔEuro Repo) and the daily change in the 10-year US Treasury yield (ΔTreasury) Demandt-1 is the one-
day lagged shock to the demand side of oil and Supplyt-1 is the one-day lagged shock to the supply side of oil
both shocks constructed as in Ready (2018) Exporti is an invariant dummy variable that takes the value of 1 if a
country is net oil-exporter at the beginning of the sample period and 0 otherwise Year2020 is a dummy variable
that takes the value one in days of year 2020 and zero otherwise The sample period is from January 2016 to
October 2020 Countries included in the analysis are MENA oil exporters Algeria Bahrain Iraq Kuwait Oman
Qatar Saudi Arabia and United Arab Emirates (Abu Dhabi and Dubai) and oil importers Egypt Morocco and
Tunisia The impact of oil shocks may differ based on the energy status of a country (Cashin et al 2014 Rafiq et
al 2016) Table A21 shows the baseline results for our analysis
Appendix A3 Debt and Output Growth Around Restructurings
To understand the impact of restructurings on external debt and GDP growth in developing economies we
studied the restructuring dataset constructed first by Asonuma and Trebesch (2016)
Data on restructurings
Asonuma and Trebesch (2016) provide information on the occurrence and duration of 204 restructurings globally
starting in 1978 197 of which have been completed The cases are further differentiated into two categories
preemptive restructurings and post-default restructurings In preemptive restructurings governments renegotiate
2
Appendix A2 Oil Shocks and MENArsquos Creditworthiness
We adopt the methodology followed by Ready (2018) to decompose oil shocks into supply and demand shocks
This decomposition allows us to examine the impact of both oil supply and demand shocks at daily frequency
Ready (2018) classifies and decomposes three types of oil shocks
Demand shocks the residuals of a contemporaneous regression where returns on the global index of oil producing
firms are regressed against unexpected changes in the log of VIX index (that is the uncertainty index)
Supply shocks the residuals of a contemporaneous regression where changes in oil prices are regressed against
demand shocks and unexpected changes in the VIX index
Risk shocks After obtaining oil supply and demand shocks we adopt a conventual model setup in the literature
to examine the impact of oil shocks on sovereign default risk measured by credit default swaps (CDS)
∆-(8 =$ + (∆-(8( +9)(lt8=gt-( +9+A(
-(+
amp
-(
B(30CD( +)8EFF( +G
where ΔCDSit is the daily change in sovereign CDS spread of countries denoted by i over days denoted by t
DOMESTICjit-1 contains the set of domestic control variables the daily return on each countryrsquos stock market (St
Return) and the daily change in the exchange rate of each countryrsquos currency against the US dollar (ΔFX Rate)
GLOBALjt-1 is the set of global control variables the daily change in the Chicago Board Options Exchange volatility
index (ΔVIX ) the daily SampP 500 index return (SampP500 Return) the daily change in the German 10-year Bond yield
(ΔGerman Bond) the daily change in the effective Federal Funds rate (ΔFedFund) the daily change in the European
Repo rate (ΔEuro Repo) and the daily change in the 10-year US Treasury yield (ΔTreasury) Demandt-1 is the one-
day lagged shock to the demand side of oil and Supplyt-1 is the one-day lagged shock to the supply side of oil
both shocks constructed as in Ready (2018) Exporti is an invariant dummy variable that takes the value of 1 if a
country is net oil-exporter at the beginning of the sample period and 0 otherwise Year2020 is a dummy variable
that takes the value one in days of year 2020 and zero otherwise The sample period is from January 2016 to
October 2020 Countries included in the analysis are MENA oil exporters Algeria Bahrain Iraq Kuwait Oman
Qatar Saudi Arabia and United Arab Emirates (Abu Dhabi and Dubai) and oil importers Egypt Morocco and
Tunisia The impact of oil shocks may differ based on the energy status of a country (Cashin et al 2014 Rafiq et
al 2016) Table A21 shows the baseline results for our analysis
Appendix A3 Debt and Output Growth Around Restructurings
To understand the impact of restructurings on external debt and GDP growth in developing economies we
studied the restructuring dataset constructed first by Asonuma and Trebesch (2016)
Data on restructurings
Asonuma and Trebesch (2016) provide information on the occurrence and duration of 204 restructurings globally
starting in 1978 197 of which have been completed The cases are further differentiated into two categories
preemptive restructurings and post-default restructurings In preemptive restructurings governments renegotiate
3
with lenders while they are still current on their loan payments In post-default restructurings governments
unilaterally default then start to renegotiate their debt Among the 197 finished restructurings 81 were
preemptive and 116 were post-default Many countries have multiple restructurings Among 74 countries that had
completed restructurings five are from MENA region
To analyze the macroeconomic impact of restructurings before during and after the restructurings started we
apply an event study approach transforming calendar years into event years We focus on the three years before
the year of the onset and the three years after a restructuring (analyzing seven years in total) In this new timeline
year zero corresponds to the year a restructuring began As in Appendix A1 our sample is all countries not classified
as a high-Income in 1987 in the World Bankrsquos Historical Income Classification dataset
Data on GDP growth and external debt
The two outcome variables are annual growth in real GDP and the annual growth rate of the external debt in US
dollars Both are from the IMFrsquos World Economic Outlook (October 2020) with data starting from 1981 By
focusing on the change of external debt level the difference-in-difference estimator can show the differential
level of acceleration of debt accumulation between affected and non-affected countries in the years before
during and after restructuring started
Econometric strategy
To systematically analyze the macroeconomic impacts of restructurings in developing economies we rely on a
difference-in-difference estimator (similar to the approach Appendix A1) The baseline econometric strategy that
aims to identify these potential effects is the following difference-in-difference estimator
= $ + H + H + I + 9 ampamp
(
amp-++ 9 A +
+
-(5
where represents the macroeconomic variable of interest (annual growth of real GDP and annual growth of
debt level) of country c at year t H is the country fixed effects H is year fixed effects I is a dummy variable
that takes the value of 1 for the onset of restructuring years that is the first year of the restructuring and 0
otherwise n is the number of years before the first year of restructuring (going from 3 years before the default (-
3-2-1) amp is a dummy variable that takes a value of 1 if it is n year before the restructuring and 0 otherwise m
is the number of years after the first year of restructuring (going from 1 to 3 years after the first year of
restructuring (123) A is a dummy variable that takes a value of 1 if it is m years after the onset of restructuring
and 0 otherwise The coefficients of interests are (what happens when restructuring starts) β (n=1 to 3) what
happens 3 years before the restructuring (m=1 to 3) what happens after restructuring starts
To control for overlapping events we have added frequency indicators in all regressions For each of the seven
years on the timeline there are three different counts (1) how many windows of three years before a restructuring
overlap with that specific year (2) how many events starts on the same year and (3) how many windows of three
years after a restructuring overlap with that specific year These construct three counts for each year on the
timeline of an event resulting in a total of 21 variables
In an extension to see if the macroeconomics respond differently to preemptive restructurings and post-default
restructurings we extended the baseline regression with a different set of dummies between the two categories
A P P E N D I X
MIDDLE EAST AND NORTH AFRICA REgION ECONOMIC UPDATE APRIL 2021
50
Data on GDP growth and external debt
Econometric strategy
3
with lenders while they are still current on their loan payments In post-default restructurings governments
unilaterally default then start to renegotiate their debt Among the 197 finished restructurings 81 were
preemptive and 116 were post-default Many countries have multiple restructurings Among 74 countries that had
completed restructurings five are from MENA region
To analyze the macroeconomic impact of restructurings before during and after the restructurings started we
apply an event study approach transforming calendar years into event years We focus on the three years before
the year of the onset and the three years after a restructuring (analyzing seven years in total) In this new timeline
year zero corresponds to the year a restructuring began As in Appendix A1 our sample is all countries not classified
as a high-Income in 1987 in the World Bankrsquos Historical Income Classification dataset
Data on GDP growth and external debt
The two outcome variables are annual growth in real GDP and the annual growth rate of the external debt in US
dollars Both are from the IMFrsquos World Economic Outlook (October 2020) with data starting from 1981 By
focusing on the change of external debt level the difference-in-difference estimator can show the differential
level of acceleration of debt accumulation between affected and non-affected countries in the years before
during and after restructuring started
Econometric strategy
To systematically analyze the macroeconomic impacts of restructurings in developing economies we rely on a
difference-in-difference estimator (similar to the approach Appendix A1) The baseline econometric strategy that
aims to identify these potential effects is the following difference-in-difference estimator
= $ + H + H + I + 9 ampamp
(
amp-++ 9 A +
+
-(5
where represents the macroeconomic variable of interest (annual growth of real GDP and annual growth of
debt level) of country c at year t H is the country fixed effects H is year fixed effects I is a dummy variable
that takes the value of 1 for the onset of restructuring years that is the first year of the restructuring and 0
otherwise n is the number of years before the first year of restructuring (going from 3 years before the default (-
3-2-1) amp is a dummy variable that takes a value of 1 if it is n year before the restructuring and 0 otherwise m
is the number of years after the first year of restructuring (going from 1 to 3 years after the first year of
restructuring (123) A is a dummy variable that takes a value of 1 if it is m years after the onset of restructuring
and 0 otherwise The coefficients of interests are (what happens when restructuring starts) β (n=1 to 3) what
happens 3 years before the restructuring (m=1 to 3) what happens after restructuring starts
To control for overlapping events we have added frequency indicators in all regressions For each of the seven
years on the timeline there are three different counts (1) how many windows of three years before a restructuring
overlap with that specific year (2) how many events starts on the same year and (3) how many windows of three
years after a restructuring overlap with that specific year These construct three counts for each year on the
timeline of an event resulting in a total of 21 variables
In an extension to see if the macroeconomics respond differently to preemptive restructurings and post-default
restructurings we extended the baseline regression with a different set of dummies between the two categories
3
with lenders while they are still current on their loan payments In post-default restructurings governments
unilaterally default then start to renegotiate their debt Among the 197 finished restructurings 81 were
preemptive and 116 were post-default Many countries have multiple restructurings Among 74 countries that had
completed restructurings five are from MENA region
To analyze the macroeconomic impact of restructurings before during and after the restructurings started we
apply an event study approach transforming calendar years into event years We focus on the three years before
the year of the onset and the three years after a restructuring (analyzing seven years in total) In this new timeline
year zero corresponds to the year a restructuring began As in Appendix A1 our sample is all countries not classified
as a high-Income in 1987 in the World Bankrsquos Historical Income Classification dataset
Data on GDP growth and external debt
The two outcome variables are annual growth in real GDP and the annual growth rate of the external debt in US
dollars Both are from the IMFrsquos World Economic Outlook (October 2020) with data starting from 1981 By
focusing on the change of external debt level the difference-in-difference estimator can show the differential
level of acceleration of debt accumulation between affected and non-affected countries in the years before
during and after restructuring started
Econometric strategy
To systematically analyze the macroeconomic impacts of restructurings in developing economies we rely on a
difference-in-difference estimator (similar to the approach Appendix A1) The baseline econometric strategy that
aims to identify these potential effects is the following difference-in-difference estimator
= $ + H + H + I + 9 ampamp
(
amp-++ 9 A +
+
-(5
where represents the macroeconomic variable of interest (annual growth of real GDP and annual growth of
debt level) of country c at year t H is the country fixed effects H is year fixed effects I is a dummy variable
that takes the value of 1 for the onset of restructuring years that is the first year of the restructuring and 0
otherwise n is the number of years before the first year of restructuring (going from 3 years before the default (-
3-2-1) amp is a dummy variable that takes a value of 1 if it is n year before the restructuring and 0 otherwise m
is the number of years after the first year of restructuring (going from 1 to 3 years after the first year of
restructuring (123) A is a dummy variable that takes a value of 1 if it is m years after the onset of restructuring
and 0 otherwise The coefficients of interests are (what happens when restructuring starts) β (n=1 to 3) what
happens 3 years before the restructuring (m=1 to 3) what happens after restructuring starts
To control for overlapping events we have added frequency indicators in all regressions For each of the seven
years on the timeline there are three different counts (1) how many windows of three years before a restructuring
overlap with that specific year (2) how many events starts on the same year and (3) how many windows of three
years after a restructuring overlap with that specific year These construct three counts for each year on the
timeline of an event resulting in a total of 21 variables
In an extension to see if the macroeconomics respond differently to preemptive restructurings and post-default
restructurings we extended the baseline regression with a different set of dummies between the two categories
A P P E N D I X
LIVINg wITH DEBT HOw INSTITUTIONS CAN CHART A PATH TO RECOVERY FOR THE MIDDLE EAST AND NORTH AFRICA
51
Results
4
= $ + H + H + I + 9 ampamp(
amp-++ 9 A +
+
-(0( + 9 amp0amp0
(
amp-++ 9 0A0 +
+
-(5
I is a dummy that takes 1 if a preemptive restructuring starts ( is a dummy that takes 1 if a post-default
restructuring happens amp is a dummy that takes 1 if n years before a preemptive restructuring amp0 is a dummy
that takes 1 if n years before a post-default restructuring Aamp is a dummy that takes 1 if n years after the start of a
preemptive restructuring Aamp0 is a dummy that takes 1 in n years after a default starts The seven in the first set
will trace macroeconomic trend for preemptive restructurings while the seven in the second set will trace
macroeconomic trend for post-default restructurings
Results
Restructurings are costly to output growth and even costlier in post-default restructurings In addition
restructurings seem to slow debt growth Panel A of Figure II7 shows that countries experience lower growth
relative to the baseline in the years preceding restructuringsmdashwhether preemptive or post-default However after
the first year of restructuring growth starts to recover for preemptive restructuring but remains depressed for
post-default restructurings Panel B of Figure II7 shows that during the first two years after the restructuring
starts debt growth is significantly lower in both preemptive and post-default cases relative to countries without
restructurings This could reflect the defaulting countriesrsquo exclusion from the international debt market and the
reduction in debt granted by creditors during restructuring negotiations
A P P E N D I X
MIDDLE EAST AND NORTH AFRICA REgION ECONOMIC UPDATE APRIL 2021
52
APPENDIX TABLE B1 World Bankrsquos Growth Current Account and Fiscal Account Forecasts
Real GDP Growthpercent
Real GDP per capita Growthpercent
Current Account Balancepercent of GDP
Fiscal Balancepercent of GDP
2019 2020e 2021f 2022f 2019 2020e 2021f 2022f 2019 2020e 2021f 2022f 2019 2020e 2021f 2022f
MENA 00 -38 22 35 -13 -53 06 19 21 -38 -09 07 -42 -94 -66 -46
Developing MENA -08 -28 23 37 -16 -41 06 21 -21 -46 -46 -35 -47 -76 -75 -64
Oil Exporters -08 -42 23 34 -21 -60 05 17 38 -37 01 20 -36 -98 -63 -39
gCC 07 -49 22 33 -15 -63 06 19 62 -29 24 44 -36 -113 -57 -30
Qatar 08 -32 30 41 -10 -48 13 24 24 -25 17 27 10 -36 -23 27
United Arab Emirates 17 -63 12 25 02 -74 02 15 65 -15 29 49 -10 -80 -05 17
Kuwait 04 -54 24 36 -60 -62 08 22 164 -27 82 117 -98 -262 -226 -193
Bahrain 20 -54 33 32 -25 -88 06 11 -21 -95 -69 -46 -93 -175 -116 -94
Saudi Arabia 03 -41 24 33 -13 -56 09 19 66 -27 26 45 -42 -113 -56 -30
Oman -08 -63 25 65 -37 -87 02 45 -55 -104 -81 -52 -90 -174 -68 -46
Developing Oil Exporters -31 -31 24 36 -42 -51 06 18 00 -50 -49 -32 -36 -75 -76 -61
Iraq 24 -119 19 84 15 -149 -16 47 61 -129 -113 -56 14 -44 -54 -10
Iran Islamic Rep -68 17 21 22 -79 05 10 11 06 -08 08 11 -37 -63 -67 -70
Algeria 08 -55 36 23 -12 -69 21 09 -100 -144 -121 -114 -96 -164 -121 -100
Developing Oil Importers 32 -22 22 40 17 -30 05 25 -56 -39 -43 -38 -66 -77 -75 -67
Lebanon -67 -203 -95 -68 -199 -88 -212 -110 -67 -105 -49 -28
Jordan 20 -18 14 22 05 -27 08 19 -21 -72 -70 -60 -46 -67 -64 -54
Djibouti 78 05 55 60 61 -09 40 45 149 201 -15 -08 -05 -17 -19 -17
West Bank and Gaza 14 -115 35 32 -12 -137 09 04 -104 -65 -81 -83 -45 -76 -64 -57
Morocco 25 -70 42 37 12 -81 30 26 -41 -30 -35 -39 -36 -77 -65 -64
Tunisia 10 -88 40 26 -01 -98 30 17 -85 -68 -92 -90 -31 -100 -86 -68
Egypt Arab Rep 56 36 23 45 35 16 04 26 -36 -30 -34 -28 -81 -80 -82 -70
Memorandum
Libya 25 -313 667 10 -322 646 116 -464 -62 17 -644 -90
Sources Authorsrsquo calculations based on data from World Bank Macro and Poverty Outlooks April 2021Note e=estimate f=forecast and NP=not presented GDP is at market prices Data are rounded up to a single digit Data for Egypt correspond to its fiscal year (July-June) Libya Syria and Yemen are not included in the regional and sub-regional averages due to lack of data Lebanon and Libya are not forecasted beyond 2021 due to high uncertainty
Data Appendix
A P P E N D I X
LIVINg wITH DEBT HOw INSTITUTIONS CAN CHART A PATH TO RECOVERY FOR THE MIDDLE EAST AND NORTH AFRICA
53
APPENDIX TABLE B2 Magnitude of Revisions to Macro Forecasts by the World Bank
Panel A Between April 2021 and October 2019
Real GDP growth(April 2021 - October 2019)
Current Account Balance(April 2021 - October 2019)
Fiscal Balance(April 2021 - October 2019)
2020e 2021f 2020e 2021f 2020e 2021f
MENA -64 -06 -46 -17 -48 -23
Developing MENA -58 -08 -03 -04 -17 -18
Oil Exporters -63 -01 -62 -23 -57 -25
gCC -71 -05 -86 -37 -80 -29
Qatar -62 -02 -79 -30 -56 -50
United Arab Emirates -89 -18 -76 -28 -70 01
Kuwait -79 -04 -113 -07 -204 -169
Bahrain -75 10 -61 -32 -98 -40
Saudi Arabia -57 02 -98 -53 -68 -15
Oman -98 -15 -14 -11 -80 02
Developing Oil Exporters -50 07 -16 -13 -21 -21
Iraq -169 -08 -89 -72 -10 -23
Iran Islamic Rep 16 12 -03 11 -04 -07
Algeria -74 14 -38 04 -92 -49
Developing Oil Importers -66 -24 15 09 -12 -13
Lebanon -206 -99 104 146 49 70
Jordan -41 -11 -09 -06 -43 -44
Djibouti -69 -25 12 -239 -11 -27
West Bank and Gaza -104 39 34 16 42 50
Morocco -105 07 07 -02 -42 -31
Tunisia -110 14 39 09 -50 -39
Egypt Arab Rep -22 -37 -04 -08 -04 -12
Sources Authorsrsquo calculations based on data from World Bank Macro and Poverty Outlook Note Libya Syria and Yemen are not included in the regional and sub-regional averages due to lack of reliable data The changes are in percentage points Lebanon is not forecasted beyond 2021
A P P E N D I X
MIDDLE EAST AND NORTH AFRICA REgION ECONOMIC UPDATE APRIL 2021
54
Panel B Between April 2021 and October 2020
Real GDP growth(April 2021 - October 2020)
Current Account Balance(April 2021 - October 2020)
Fiscal Balance(April 2021 - October 2020)
2020e 2021f 2022f 2020e 2021f 2022f 2020e 2021f 2022f
MENA 13 03 04 11 23 23 07 13 11
Developing MENA 19 02 00 11 -01 01 20 11 09
Oil Exporters 16 04 06 09 29 29 08 16 16
gCC 08 04 07 11 42 38 -08 13 10
Qatar -12 00 11 -15 08 08 00 15 14
United Arab Emirates 00 00 00 00 00 00 00 00 00
Kuwait 25 14 07 25 91 95 15 04 -39
Bahrain -02 11 07 -16 -04 08 -41 -16 -07
Saudi Arabia 13 04 11 21 70 62 -13 22 27
Oman 31 20 -14 40 46 10 07 98 63
Developing Oil Exporters 30 03 05 07 -05 01 32 19 21
Iraq -24 -01 11 -07 -33 -11 124 85 94
Iran Islamic Rep 62 06 05 -02 02 04 03 -01 -01
Algeria 11 -02 02 -10 36 32 -06 09 -04
Developing Oil Importers 00 01 -06 17 04 02 05 01 -07
Lebanon -11 37 -66 -111 96 120
Jordan 37 -23 00 04 -06 -08 15 -08 -05
Djibouti 15 -16 -12 42 -178 -174 06 11 05
West Bank and Gaza -36 12 08 28 20 18 -32 -21 -16
Morocco -07 09 02 69 30 13 -01 -12 -22
Tunisia 04 -19 07 03 -29 -26 -19 -30 -21
Egypt Arab Rep 01 -01 -13 11 10 05 02 02 -01
Sources Authorsrsquo calculations based on data from World Bank Macro and Poverty Outlook Note Libya Syria and Yemen are not included in the regional and sub-regional averages due to lack of reliable data The changes are in percentage points Lebanon is not forecasted beyond 2021
A P P E N D I X
LIVINg wITH DEBT HOw INSTITUTIONS CAN CHART A PATH TO RECOVERY FOR THE MIDDLE EAST AND NORTH AFRICA
55
APPENDIX TABLE B3 Overview of MENArsquos Debt
Public Debt
Public Domestic
Debt
Public External
Debt
External Debt to Official Debtor
Public amp Private
External Debt
Interest Payments for Public
Debt
Moodys Rating Foreign
Currency Long Term DebtWorld
Bankrsquos MPOWorld
Bankrsquos MPOWorld
Bankrsquos MPOWorld
Banks IDSIMFrsquos WEO
World Bankrsquos MPO
2019 2020 2019 2020 2019 2020 2019 2019 2020 2019 2020 112020 1212021
Gu
lf C
oo
pe
rati
on
C
ou
nci
l
Qatar 57 641 1314 1613 16 18 Aa3 Aa3
United Arab Emirates 201 25 767 975 03 03 Aa2 Aa2
kuwait 203 225 488 645 03 08 Aa2 A1
Bahrain 1023 1324 2264 2546 45 49 B2u B2u
Saudi Arabia 231 328 232 299 08 12 A1 A1
Oman 601 812 924 1215 23 28 Ba1 Ba3
Oth
er
Oil
E
xpo
rte
rs
Libya 488 1371
Iraq 482 693 233 344 249 35 309 405 12 11 Caa1 Caa1
Iran 479 503 01 17 17 07 1
Algeria 456 514 450 508 06 06 08 23 19 06 06
Yemen 527 227 30 274 243 256 38
Oil
Imp
ort
ers
Lebanon 171 1867 1076 878 634 99 36 1978 4828 10 22 Caa2 C
Jordan 974 109 583 641 39 449 190 68 776 35 41 B1 B1
Djibouti 669 702 04 02 664 699 644 66 702 13 12
west Bank and gaza 163 242 92 154 71 88 03 04
Morocco 649 778 509 584 14 194 198 331 392 23 25 Ba1 Ba1
Tunisia 718 872 223 279 495 593 411 994 972 27 38 B2 B2
Egypt 902 875 725 686 178 19 190 36 344 10 98 B2 B2
world Median 519 632 196 227 268 303 200 505 592 16 19
High-income median 569 653 266 349 191 233 885 1017 21 23
Middle-income median 515 649 200 230 274 324 190 473 543 18 21
Low-income median 525 505 176 187 268 297 244 314 321 11 13
Source World Bankrsquos Macro and Poverty Outlook (April 2021) World Bankrsquos International Debt Statistics IMFrsquos World Economic OutlookNote Debt and interest payments are in percent of GDP Official external debt includes debt held by international organizations (multilateral loans) and by foreign governments (bilateral loans)
A P P E N D I X
MIDDLE EAST AND NORTH AFRICA REgION ECONOMIC UPDATE APRIL 2021
56
APPENDIX TABLE B4 Characteristics of MENA Economies
Public Debt Output Gap Governance InflationExchange Rate Arrangement
( of GDP) (percentage points) (score) (percent)
World Bankrsquos MPO
World Bankrsquos MPO
World BankWorld Bankrsquos
MPOIMF
2019 2020 2020 2019 2019 2020 2019
Gu
lf C
oo
pe
rati
on
C
ou
nci
l
Qatar 57 641 -49 07 -09 -26 Conventional peg
United Arab Emirates 201 25 -9 11 -19 -16 Conventional peg
kuwait 203 225 -55 01 11 09 Conventional peg
Bahrain 1023 1324 -82 04 1 -26 Conventional peg
Saudi Arabia 231 328 -56 01 -12 34 Conventional peg
Oman 601 812 -83 04 01 -1 Conventional peg
Oth
er
Oil
E
xpo
rte
rs
Libya 488 1371 -2 -3 -2 Conventional peg
Iraq 482 693 -183 -14 -02 06 Conventional peg
Iran 479 503 11 -09 413 369 Stabilized arrangement
Algeria 456 514 -75 -09 23 21 Crawl-like arrangement
Yemen 527 29 -19 10 264 Stabilized arrangement
Oil
Imp
ort
ers
Lebanon 171 1867 -191 -07 29 843 Stabilized arrangement
Jordan 974 109 -39 01 08 03 Conventional peg
Djibouti 669 702 -67 -08 33 18 Currency board
west Bank and gaza 163 242 -148 08 -07
Morocco 649 778 -101 -02 02 07 Stabilized arrangement
Tunisia 718 872 -104 -02 67 56 Crawl-like arrangement
Egypt 902 875 -12 -06 139 57 Stabilized arrangement
world Median 519 632 -67 -01 28 3
High-income median 569 653 -86 11 11 15
Middle-income median 515 649 -73 -04 28 26
Low-income median 525 505 -41 -04 31 59
Sources World Bank Macro Poverty Outlook (October 2020) and World Governance Indicators International Monetary Fund Annual Report on Exchange Arrangements and Exchange RestrictionsNote Output gap = growth in 2020 minus average growth from 2015 through 2019) Governance is the average of Regulatory Quality Government Effectiveness and Rule of Law A lower score represents lower governance quality
A P P E N D I X
LIVINg wITH DEBT HOw INSTITUTIONS CAN CHART A PATH TO RECOVERY FOR THE MIDDLE EAST AND NORTH AFRICA
57
APPENDIX TABLE B5 Public Debt Reporting in MENA
Alg
eri
a
Ba
hra
in
Djib
ou
ti
Eg
yp
t A
rab
Re
p
Ira
n I
sla
mic
Re
p
Ira
q
Jord
an
Ku
wa
it
Leb
an
on
Lib
ya
Mo
rocc
o
Om
an
Qa
tar
Sa
ud
i Ara
bia
Sy
ria
Tun
isia
Un
ite
d A
rab
Em
ira
tes
We
st B
an
k a
nd
Ga
za
Yem
en
Central government radic radic radic radic times radic radic radic radic radic radic radic radic radic radic radic radic
State and local government na radic radic times radic radic na radic na na na na radic times times
Other elements of the general government times radic times radic times radic times times
ow social security fundna radic times radic radic times radic times na
ow extra budgetary fundstimes radic times na times times radic times times
guarantees (to other public and private sector including to SOEs)
times times radic radic radic radic radic radic times times times radic radic times na
Central bank (borrowed on behalf of the government) na na radic radic times radic na radic na radic na
Non-guaranteed SOE debt times times times times times times times times times radic times na na
Source World Bank staffNote Table follows the public debt reporting template of World Bank-IMFrsquos Debt Sustainability Framework (see IMF 2017) radic indicates the country reports the type of debt (for both domestic and external debts) times indicates the country has the type of debt but does not report it na = not applicable and indicates that the country might not have this type of debt blank cells indicate that World Bank economists do not have information regarding whether the country has the type of debt but does not report it or that the country does not have the type of debt or that the debt might be included in total government debt Debt reporting is as of 2020 Red cells indicate changes between 2019 and 2020
A P P E N D I X
MIDDLE EAST AND NORTH AFRICA REgION ECONOMIC UPDATE APRIL 2021
58
W O R L D B A N K M I D D L E E A S T A N D N O R T H A F R I C A R E G I O NMENA ECONOMIC UPDATE APRIL 2021
P R E F A C E
Chapter II How Institutions Can Chart a Path to Recovery for the Middle East and North Africa
Figure II1 Public Debt and Output Growth around Natural Disasters 22
Figure BII1 Public Debt around Armed Conflicts 23
Figure II2 Correlations between Public Debt Interest Payments and Private Investment 25
Figure II3 Median Annual per Capita Growth During 2000-2019 across Countries Ranked by Central Government Debt in 2000 27
Figure II4 Coupon Rates of US Dollar-denominated Debt Issuances during the Pandemic by Maturity for MENA countries Chile and Brazil 28
Figure II5 GDP Growth in Lebanon and Jordan 35
Figure II6 Growth and Governance before Restructurings 36
Figure II7 Output Growth and Debt Growth around Restructurings 38
Appendix
Figure A11 Natural Disasters 1900-2020 46
List of Boxes
Chapter II How Institutions Can Chart a Path to Recovery for the Middle East and North Africa
Box II1 Conflicts Debt and Growth 23
Box II2 The Debt Service Suspension Initiative (DSSI) 32
Acknowledgements
The MENA Economic Update is a product of the Chief Economist Office of the Middle East and North Africa Region (MNACE) of the World Bank The report was written by Roberta Gatti (Regional Chief Economist) Daniel Lederman (Deputy Chief Economist) Ha M Nguyen (Team Lead) Sultan Abdulaziz Alturki Rachel Yuting Fan Asif M Islam and Claudio J Rojas
Helpful guidance and comments were provided by Ferid Belhaj (Regional Vice President) Carmen Reinhart (Vice President and Chief Economist of the World Bank Group) Eric Le Borgne Kevin Carey Nancy Lozano Gracia Jesko S Hentschel Djibrilla Issa Graciela Kaminsky Stefan G Koeberle Nadir Mohammed Steven Pennings Ismail Radwan Sergio Schmukler Ayat Soliman and Marina Wes
Inputs from Mark Ahern Dalia Al Kadi Khaled Alhmoud Sara B Alnashar Amir Mokhtar Althibah Jaime de Pinies Bianchi Javier Diaz Cassou Damir Cosic Emmanuel F Cuvillier Cyril Desponts Romeo Jacky Gansey Michael Geiger Ugo Gentilini Alexander Haider Naji Mohamad Abou Hamde Mouna Hamden Wissam Harake Johannes G Hoogeveen Sahar Sajjad Hussain Rick Emery Tsouck Ibounde Amina Iraqi Robert Bou Jaoude Anastasia Janzer-Araji Majid Kazemi Naoko C Kojo Shireen Mahdi Wael Mansour Ashwaq Natiq Maseeh Minh Cong Nguyen Harun Onder Aminur Rahman Nate Rawlings Saadia Refaqat Christina Wood and Marwane Zouaidi are much appreciated
We thank James L Rowe Jr for editing the manuscript Help from Translation and Printing amp Multimedia Unit from The World Bankrsquos Global Corporate Solutions is acknowledged Stellar administrative support was provided by Swati Raychaudhuri
A C k N O w L E D g E M E N T S
MIDDLE EAST AND NORTH AFRICA REgION ECONOMIC UPDATE APRIL 2021
iv
Abbreviations
CDC Centers for Disease Control and Prevention
CDS Credit Default Swaps
COVAX COVID-19 Vaccines Global Access
COVID-19 Coronavirus Disease 2019
DSA Debt Sustainability Analysis
DSSI Debt Service Suspension Initiative
EM-DAT Emergency Events Database
FDI Foreign Direct Investment
FOMC Federal Open Market Committee
g20 Group of 20 Advanced Economies
gCC Gulf Cooperation Council
gDD Global Debt Database
gDP Gross Domestic Product
gHS Global Health Security
IDS International Debt Statistics
IMF International Monetary Fund
MENA Middle East and North Africa
MPO Macro and Poverty Outlook
NPR National Public Radio
OECD Organization for Economic Cooperation and Development
PMI Purchasing Managersrsquo Index
RHS Right-hand side
SOE State-Owned Enterprises
UAE United Arab Emirates
UNCTAD United Nations Conference on Trade and Development
USEIA US Energy Information Administration
VIX Chicago Board Options Exchange Volatility Index
wEO World Economic Outlook
wHO World Health Organization
A B B R E V I AT I O N S
LIVINg wITH DEBT HOw INSTITUTIONS CAN CHART A PATH TO RECOVERY FOR THE MIDDLE EAST AND NORTH AFRICA
v
Preface
One year ago the first cases of a new coronavirus appeared in the Middle East and North Africa (MENA) region and the pandemic that followed has been wreaking havoc ever since Nearly every country in MENA has been overwhelmed by a surge of deadly infections accompanied by collapsing economies that threw millions of people out of work and pushed many more into poverty
The pandemic hit MENA countries at a bad time Many countries in the region entered 2020 with chronic low growth persistent macroeconomic imbalances and governance challenges including a deficit in transparency Public health systems in developing MENA countries were unprepared to face the pandemic
Today the MENA region like the rest of the world remains in crisis But we can see hopeful signs of light through the tunnel Vaccines to fight COVID-19 the disease caused by the coronavirus are being produced and in some countries rapidly deployed Shortages of medical supplies are abating There is evidence that the lockdowns and social distancing that caused the economic distress have also helped tamp down the spread of the virus And after a sharp contraction in GDP a recovery of sorts is forecast for the global economy and for the MENA region in 2021
But that recovery is unlikely to be strong enough to get the MENA regionrsquos output back to pre-pandemic levels And the substantial borrowing that MENA governments had to incur to finance essential health and social protection measures boosted government debt dramatically The average public debt in MENA countries is expected to rise 8 percentage points from about 46 percent of gross domestic product (GDP) in 2019 to 54 percent in 2021 Notably debt among MENA oil importers is expected to average about 93 percent of GDP in 2021 And the need to keep spendingmdashand keep borrowingmdashwill remain strong for the immediate future
The tension between short-term needs and long-term consequences is stark for countries in the MENA region For many debt repayments are large and growing Moreover although global interest rates are at an all-time low some MENA countries do not have access to markets because they are not considered creditworthy while some others must pay high rates Poor governance and lackluster growth prospects prevent them from taking advantage of favorable global credit conditions Consequently most MENA countries may find themselves in a post-pandemic world stuck with a debt service bill sucking up resources that otherwise could be devoted to economic development
This report examines both the regionrsquos economic challenges and the uncomfortable tradeoffs governments will have to make in the coming years They have no option but to continue spending on health and income transfers as long as the pandemic continues That will improve the health and help maintain the financial stability of their citizens But it will also add to already high debt burdens which spell complicated policy decisions after the pandemic recedes Should MENA governments then immediately turn their attention to providing fiscal stimulus to stumbling economies Will they need to Pent-up demandmdashespecially from tourism and other travelmdashcould provide enough spark to invigorate economies Eventually MENA countries will have to deal with accumulated debt and its costs and will have to bring debt down to a more sustainable level
The report discusses policy options available for MENA countries One significant takeaway is the important role of strong efficient and transparent institutions in addressing the tradeoffs between short-term needs and long-term costs of public debt Good governance could increase the effectiveness of fiscal spending Improving debt transparency could lower borrowing costs when countries try to roll over their debt Even in the short term improvements in governance and transparency will help
P R E F A C E
MIDDLE EAST AND NORTH AFRICA REgION ECONOMIC UPDATE APRIL 2021
vi
during the pandemic Investing in testing disease surveillance and data transparency can reduce the economic costs of the pandemic As the crisis subsides effective transparent and credible pandemic surveillance in the region would help boost demand from domestic and foreign sourcesmdashsuch as the arrival of foreign tourists
Strong institutions are one crucial dimension to helping MENA build back stronger and more resilient economies As needed they can be reformed and strengthened with limited fiscal costs and can thus help boost the regionrsquos long-run growth As MENA emerges from this dark time the World Bank stands ready to help the region not only to meet the short-term needs of disaster relief but also to enhance institutions that will help usher in brighter years ahead
Ferid Belhaj Vice President Middle East and North Africa Region The World Bank
P R E F A C E
LIVINg wITH DEBT HOw INSTITUTIONS CAN CHART A PATH TO RECOVERY FOR THE MIDDLE EAST AND NORTH AFRICA
1
Overview
The Middle East and North Africa (MENA) region like the rest of the world remains in a pandemic-spawned crisis In 2020 the regionrsquos real output contracted by 38 percent The rebound in 2021 is unlikely to be strong enough to allow the region to regain the level of economic activity it had in 2019 and certainly not the level the World Bank had forecasted before the pandemic
The regionrsquos inflation-adjusted government revenues dropped by 24 percent in 2020 The disaster relief demanded by the pandemic combined with the decline in revenues led to further accumulation of debt in a region that already had high public debt The World Bank expects the regionrsquos public debt to rise from 46 percent of its GDP in 2019 to 54 percent by the end of 2021 This increase would be MENArsquos fastest accumulation of public debt as a share of output in the 21st century Among MENA country groups MENA oil importers have the highest levels of debt which will hover around 93 percent of GDP in 2021
As the pandemic subsides tensions will inevitably emerge between the potential short-run gains and the potential long-run costs of debt-financed public spending
In the short-term fiscal spending is needed to mitigate the effects of the pandemic including income transfers to support consumption of hardest hit families and health spending on testing treatment and vaccination As the pandemic subsides fiscal authorities will have to decide whether additional fiscal stimulus is warranted to raise aggregate demand to accelerate the post-pandemic economic recovery
Because the pandemic shares many traits with natural disasters this report examines trends in public debt and output growth around natural disasters to illustrate how debt-financed fiscal expenditures can help the recovery The evidence indicates that growth in both public debt and output tends to rise faster after disasters than it does in economies without disasters thus illustrating how debt-financed fiscal expansions can help economic reconstruction
However in the longer run debt might be costly especially for developing economies When governments borrow they may crowd out private sector investment because rising interest rates increase the cost of capital for the private sector In fact the correlation between private investment and public debt was negative for MENArsquos developing countries1 during the past two decades In addition high levels of debt may be accompanied by costly debt-interest payments that gradually reduce the space for other growth-enhancing public investment priorities For example a few countries in the MENA region already have interest payments equivalent to about 10 percent of GDP and account for more than 30 percent of total public expenditures
Maintaining high debt could also be risky in the long term threatening economiesrsquo credit worthiness and their ability to refinance (or roll over) maturing debt in the future These risks if they materialize can result in economic pain characterized by currency devaluations run-away inflation capital flight and ultimately costly debt crises Lebanonrsquos debt default in March 2020 and the ongoing crisis is a painful example
The report provides suggestive evidence that atypically high debt levels relative to GDP can dampen long-term growth prospects Countries that entered the 21st century with high debt- to- GDP ratios tended to grow more slowly over the next two decades than countries with lower debt burdens For developing countries the data are striking Economies in the top tercile of countries in terms of debt-to-GDP ratios in 2000 typically experienced a GDP-per-capita growth rates about 1 percentage point per year lower than the rest of the developing countries over the next 20 years
1 Throughout the report the term ldquoMENArsquos developing countriesrdquo refers to low- and middle-income MENA countries
O V E R V I E w
MIDDLE EAST AND NORTH AFRICA REgION ECONOMIC UPDATE APRIL 2021
2
The tension between short-term needs and long-term costs of debt-financing seems more severe for developing economies than for high-income ones In advanced economies accommodative monetary policy and rising savings are expected to combine to keep interest rates low favoring government borrowing that could help finance growth-enhancing activities In general academic literature suggests that advanced economies are less ldquodebt intolerantrdquo than developing and emerging economies (Reinhart et al 2003) That is they can continue to borrow when debt levels are high without risking major growth slowdowns The data collected for this report is consistent with this hypothesis
For developing economies however including those in MENA the tension between debt and growth is apparent During the pandemic many MENA countries face borrowing costs higher than other economies even though global interest rates are at historically low levels Default risk indicators for many MENA countries rose sharply during 2020 and some have not returned to pre-pandemic levels This is probably because many MENA countries entered 2020 with high debt and chronic low growth relative to world peers while also facing notable institutional challenges such as poor transparency and governance These pre-existing vulnerabilities might have heightened the long-term costs of public debt accumulation
What can MENA countries do to resolve the tensions between short-term objectives and long-term risks of rising public debt
Chapter 2 tackles this question by discussing policy options during three distinct phases of economic recovery
expenditure priorities during the pandemic
fiscal stimulus as the pandemic subsides
mitigating the potential costs of debt overhang in the medium term
Governance and transparency issues emerge as central protagonists across all three phases
Prioritizing spending during the pandemic
While the pandemic is still ongoing fiscal spending is probably best used to protect the welfare of vulnerable families and to invest in public health The pandemic is having disproportionate impacts on poor households because they are less healthy and less likely to be able to social distance Supporting the consumption of the hardest hit households is an essential objective for fiscal spending at this time MENA countries have taken unprecedented actions to support the most vulnerable The good news is that cash transfers are reasonably well-targeted although there is room to improve Evidence from phone surveys in the region suggests that a higher percentage of the poorest households are beneficiaries than those at the top of the distribution Using fiscal spending to stimulate aggregate demand is likely to be difficult as long as the risk of Covid-19 exposure remains ndash for the very reason that social distancing and limited mobility continue to be key to overcoming the pandemic
Public health investment as a short-term response to the pandemic could also bring long-term gains As vaccines become available it is important to plan and roll out effective vaccination campaigns Proper investment in vaccination would not only reduce the risk of a prolonged crisis and speed up economic recovery but also would reinforce the infrastructure for long-term public health Rough calculations of the costs and benefits of investing in vaccination programs which need to be interpreted with a grain of salt indicate that the benefit-cost ratio could be large around 781 if MENA vaccinates 20 percent of its population at current prices proposed by COVAX the multilateral effort to channel Covid-19 vaccines to poor and lower-middle income countries
O V E R V I E w
LIVINg wITH DEBT HOw INSTITUTIONS CAN CHART A PATH TO RECOVERY FOR THE MIDDLE EAST AND NORTH AFRICA
3
Investing in testing and public surveillance of the outbreak also appears to reduce the economic costs of the pandemic Preliminary evidence suggests that countries with higher test-positivity rates suffered larger growth downgrades A high test-positivity rate indicates a relatively uncontrolled pandemic and might reflect a slow or ineffective public health surveillance strategy Unfortunately many MENA countries have either high positivity rates (above the 5 percent benchmark set by the World Health Organization) or do not reliably report test data Notably however several high-income countries in MENA have been at the global forefront of using testing for disease surveillance and in rolling out vaccination programs
Fiscal stimulus as the pandemic subsides
MENA policymakers will soon decide whether additional fiscal stimulus is warranted after the public health emergency abates Embarking on additional stimulus at that time is not without risks
First economic growth might rebound without fiscal stimulus Consumer and business spending might rise quickly after it becomes clear that the health risks have subsided (Krugman 2020 Lee 2020) This phenomenon is referred to in the current debate as ldquopent-up demandrdquo In MENA the extent of such a pent-up demand rebound especially from external sources of demand such as tourism is likely to depend on the effectiveness and transparency of governmentsrsquo pandemic surveillance
Second fiscal stimulus can be ineffective or even counterproductive in economies with elevated debt such as many MENA oil importers Published refereed research indicates that when public debt is high the so-called fiscal multiplier -- the effect on GDP from additional spending -- can be zero (Huidrom et al 2020) Consequently the short-term costs of fiscal consolidation could also be negligible and thoughtful consolidation could be a preferred policy stance in economies with very high public debt ratios
Third while public investment such as infrastructure projects can be a tool of choice studies have cautioned that delayed implementation can result in a limited short-term multiplier More importantly the economic gains from public investment projects can be hindered by poor governance which reduces the efficiency of public investment This appears to be the case for a large sample of European countries (Izquierdo et al 2019) Therefore in countries with the lowest institutional capacity and transparency the multiplier of public investment can be close to zero in both the short- and long-terms which reinforces the need to work on reforms to improve the governance of public investment decisions
Instead targeted fiscal spending can help heal the economic scars of the crisis In times of limited fiscal revenues and competing social demands for government assistance it is best to focus on scars with potentially long-lasting consequences For example financial constraints might prevent firms from making necessary investment to re-enter a market Likewise workers who became unemployed or under-employed during the crisis might face long-term reductions in employment probabilities and wages In these situations targeted government spending such as subsidized loans and job training might help heal the economic scars from the pandemic that can obstruct long term development Similarly investment in education that might help disadvantaged children recoup the lost learning during the pandemic might avert costly long-term losses in human capital
O V E R V I E w
MIDDLE EAST AND NORTH AFRICA REgION ECONOMIC UPDATE APRIL 2021
4
Mitigating the costs of debt after the pandemic
The costs of elevated debt are likely to manifest themselves eventually perhaps even in the short term Countries in the region may have to take action to reduce debt to GDP ratios soon after the pandemic even if output is below its potential
As mentioned highly indebted MENA countries can consider taking an approach to reduced debt and debt accumulation that combines prioritizing the most effective spending items and improving governance of investment decisions In highly indebted countries thoughtful fiscal consolidation could be welcomed by the private sector
MENA countries can also aim to roll over debt on more favorable terms To do so they would have to enhance their long-term growth prospects Perhaps more importantly transparency could also aid MENA countries by improving debt reporting and monitoring financial market vulnerabilities Published research indicates that such measures can lower borrowing costs (Cady 2005 Choi and Hashimoto 2018)
If rolling over debt is not an option highly indebted MENA countries will have to risk costly debt restructurings Evidence presented in this report suggests that pre-emptive restructurings in which a country decides to enter negotiations with external creditors before it misses any payments are less costly than post-default restructurings Unfortunately the evidence presented in this report also suggests that highly indebted countries are more likely to enter either preemptive or post-default restructurings with low growth and weak governance Several MENA oil importers entered 2020 with low growth and weak governance relative to countries that have not experienced episodes of debt distress
In sum economic growth is the most sustainable way to reduce public debt but is also the most challenging in the MENA region because it requires structural reforms to raise productivity and put people to work Many MENA countries have characteristics that would render post-pandemic fiscal stimulus ineffective In such situations policymakers may want to consider fiscal reforms early in the recovery phase Perhaps most importantly key institutional reforms that help improve debt transparency and the quality of public investment can be implemented immediately with limited fiscal costs They also hold the promise of boosting long-run growth Institutions then might help chart a path to lasting recovery for the Middle East and North Africa
O V E R V I E w
LIVINg wITH DEBT HOw INSTITUTIONS CAN CHART A PATH TO RECOVERY FOR THE MIDDLE EAST AND NORTH AFRICA
5
C H A P T E R I A C O N T I N U I N g C R I S I S
CHAPTER I A Continuing Crisis
CHAPTER I TAKEAWAYS
bull Economies in the Middle East and North Africa (MENA) remain in crisis The World Bank estimates that
MENArsquos GDP contracted 38 percent in 2020 and expects it to rebound by only 22 percent in 2021
bull Declining government revenue combined with the need to support vulnerable families and other policy
responses to the Covid-19 pandemic led to increases in public debt across the region The World Bank
expects the regionrsquos public debt burden to rise from 46 percent of GDP in 2019 to 54 percent of GDP by
2021 and debt of oil-importing developing countries to reach 93 percent
bull Having entered the crisis with chronic low growth high debt and poor governance the regionrsquos developing
economies are facing difficult tradeoffs associated with the accumulation of debt Institutional reforms
and transparency can help chart a solid path to recovery
I1 The Ongoing Pandemic in MENA
The Covid-19 pandemic has plunged the world into a crisis The virus has infected hundreds of millions of people caused millions of deaths and disrupted economies the world over The MENA region had more than 5 million recorded cases of Covid-19 by the end of February 2021
In the absence of a vaccine countries have experimented with various non-therapeutic interventions including lockdowns widespread use of masks and social distancing Early containment successes also relied on widespread use of testing contact tracing and isolating (TTI) symptomatic and asymptomatic cases An emerging literature has stressed the benefits of testing to save lives and livelihoods (Reed et al 2021 de Walque et al 2020) The ability to deploy testing and contact tracing on a large scale in turn depended on the strength of public health surveillance and clear and transparent communication from governments Transparent and credible data release on the virus spread allowed citizens to adapt their behavior to decrease the chance of contagion The availability of vaccines now offers hope that herd immunity can be achieved thus averting additional deaths restoring economic activity and staving off the risks of future pandemics A rapid scale up of vaccination however depends on the transparency and organizational capabilities of public health systems
Yet public health systems tend to be relatively weak in MENA Countries in the region fare poorly in the Global Health Security (GHS) Index which measures preparedness for epidemics and pandemics2 As of 2019 MENA ranked last among the worldrsquos regions in two components of the index that are critical to fighting a pandemic ldquoepidemiology workforcerdquo and ldquoemergency preparedness and response planningrdquo Many countries have had limited public health financing for decades According to data from the World Health Organization (WHO) countries such as Egypt and Iraq spent 5 percent or less of their government budget on health as of 20173
2 The index was jointly developed by the Nuclear Threat Initiative the Johns Hopkins Center for Health Security and the Economist Intelligence Unit Data were released in 2019 The index consists of six categories prevention detection and reporting rapid response health system compliance with international norms and risk environment
3 WHO Global Health Expenditure Database httpsappswhointnhadatabaseViewDataIndicatorsen
MIDDLE EAST AND NORTH AFRICA REgION ECONOMIC UPDATE APRIL 2021
6
C H A P T E R I A C O N T I N U I N g C R I S I S
Nevertheless some MENA health systems were well prepared especially those in the Gulf Cooperation Council (GCC)mdashBahrain Kuwait Oman Qatar Saudi Arabia and the United Arab Emirates (UAE) Bahrain and UAE rank among countries with highest testing per capita world-wide The GCC countries plus Lebanon and Jordan have done more testing per capita than the rest of the MENA region (see Table I1) Unfortunately many MENA countries have either high positivity rates (when more than 5 percent of tests for Covid-19 come back positive according to the WHO) or do not even have reliable testing or fail to report it (see Table I1) In conflict economies such as Syria and Yemen weak testing capacity leads to unreported testing statistics and fewer reported positive cases which paints a potentially misleading picture of low spread This said evidence from randomized anti-body testing high-income and developing countries indicate that the spread of Covid-19 is generally much higher than suggested by the official testing data due to unreported cases4
TABLE I1 Covid-19 Cases and Tests per Million People in MENA Countries
Country TestsMillion CasesMillion CasesTests ()
Gu
lf C
oo
pe
rati
on
C
ou
nci
l
Qatar 593580 61866 1042
United Arab Emirates 3547569 44141 124
kuwait 455811 50772 1114
Bahrain 1958570 77991 398
Saudi Arabia 415389 10937 263
Oman 298120 29004 973
Oth
er
Oil
Exp
ort
ers Libya 117877 21850 1854
Iraq 187298 19426 1037
Iran 143463 21248 1481
Algeria - 2615 -
Syrian Arab Republic - 978 -
Yemen - 113 -
Oil
Imp
ort
ers
Lebanon 498091 64610 1297
Jordan 533072 52108 977
Djibouti 123188 6599 536
west Bank and gaza 262956 43123 1640
Morocco 157616 13209 838
Tunisia 89342 20635 2310
Egypt - 1884 -
Source MENA Crisis Tracker based on data from Worldometer (httpswwwworldometersinfocoronavirus) Note Data are as of March 21 2021 ldquo-ldquo indicates that the country does not publicly report testing data Data do not necessarily match official statistics reported by the governments
Countries in the MENA region face mixed prospects of a vaccine rollout GCC countries gained access to vaccines earlier than most with the UAE and Bahrain leading the way As of March 21 2021 74 percent of people in the UAE and 38 percent of the population in Bahrain had been vaccinated with the rest of the region trailing behind (see Table I2) GCC countries have also been leveraging technology to facilitate their vaccination programs such as apps to book mobile vaccination units in Bahrain Some middle- and low-income MENA countries relied on international cooperation and support from global vaccine programs (such as COVAX)5 Although the majority of developing MENA countries have signed contracts with vaccine providers only Morocco has embarked on a vaccination program for a significant portion of population (see Table I2)
4 See MENA Crisis Tracker and related literature5 Covid-19 Vaccines Global Access or COVAX is a multilateral initiative to give poorer countries access to Covid-19 vaccines Among the groups in COVAX are the Global Alliance for
Vaccines and Immunization the World Health Organization and the Coalition for Epidemic Preparedness Innovations
LIVINg wITH DEBT HOw INSTITUTIONS CAN CHART A PATH TO RECOVERY FOR THE MIDDLE EAST AND NORTH AFRICA
7
C H A P T E R I A C O N T I N U I N g C R I S I S
Vaccinations are expected to help a country control the spread of Covid-19 paving the way for an economic recovery Preliminary evidence suggests a very large benefit from widespread vaccination Rough calculations indicate that in addition to the benefits in terms of lives saved there is a roughly 781 benefit-to-cost ratio if MENA countries vaccinate 20 percent of their population at current COVAX prices (Ahuja et al 2021) These calculations however are not flawless The benefits are computed as the decline in expected GDP growth rates for 2020 and 2021 relative to pre-pandemic forecasts Going forward since non-trivial shares of the population have already been infected the expected economic gains from vaccinations are probably slightly lower than implied by these calculations Still the benefits of effective vaccination campaigns relative to the costs of not vaccinating are probably huge
TABLE I2 Covid-19 Vaccination Programs in MENA
Country of population
Cumulative Covid-19
vaccination doses administered
Vaccine Contracts
Vaccine clinical trial participation
(YN)
Vaccine imports through COVAX
Facility (YN)
Gu
lf C
oo
pe
rati
on
Co
un
cil Qatar 2064 594613 by March 14
Pfizer-BioNTech and Moderna N Y
United Arab Emirates 7380 73 million by March 14 Sinopharm and Pfizer Y Y
kuwait 843 360000 by March 8 1m doses Pfizer-BioNTech AstraZeneca N Y
Bahrain 3839 653236 by March 17 Pfizer-BioNTech Sinopharm AstraZeneca Y N
Saudi Arabia 916 319 million by March 18 Pfizer-BioNTech Y Y
Oman 215 109844 by March 17 370000 Pfizer-BioNTech doses N N
Oth
er
Oil
Exp
ort
ers
Libya - - $96 million of vaccines contracted with WHO N N
Iraq- -
15m doses Pfizer-BioNTech 1m Sputnik
Sinopharm N Y
Iran 015 124193 by March 19 Sputnik V N N
Algeria 060 280000 by March 14 Sputnik V AstraZeneca and Sinopharm N Y
Syrian Arab Republic - - 5000 doses received N Y
Yemen - - 23 million doses with COVAX N Y
Oil
Imp
ort
ers
Lebanon 203 138420 by March 20 21m Pfizer-BioNTech N Y
Jordan 267 272648 by March 14 3m doses Pfizer-BioNTech Y Y
Djibouti - - Sputnik V N Y
west Bank and gaza
- -
37440 Pfizer-BioNTech and 24000 AstraZeneca
delivered through COVAX
N Y
Morocco 1812 669 million by March 20
65 million - Sinopharm and AstraZeneca Y Y
Tunisia lt001 12496 by March 12 2m doses Pfizer-BioNTech 1m Sputnik N Y
Egypt lt001 1315 by Jan 30 40m from Sinopharm AstraZeneca Y Y
Source World Bank MENA Crisis Tracker based on data on vaccination from Our World in Data (httpsourworldindataorgcovid-vaccinations) Data for Algeria are from WHO Note Data are as of March 21 2021 Data do not necessarily match official statistics reported by the governments
MIDDLE EAST AND NORTH AFRICA REgION ECONOMIC UPDATE APRIL 2021
8
C H A P T E R I A C O N T I N U I N g C R I S I S
I2 Economic Consequences of the Pandemic
The virus not only claims lives Its spread has had severe economic consequences MENA countries have experienced negative supply and demand shocks (Arezki et al 2020c) The negative supply shock came first from a reduction in labor supply mdashdirectly because workers get sick with Covid-19 and indirectly from travel restrictions quarantine efforts and workers staying home to take care of children or sick family members Supply was also affected by a reduction in the supply of materials capital and intermediate inputs due to disruptions in transport and businesses in MENA countries The negative demand shock was both global and regional Economic difficulties around the world and the disruption of global value chains reduced demand for the regionrsquos goods and servicesmdashmost notably oil and tourism Regional demand also declined as a result of the abrupt reduction in regional business activity and concerns about infectionmdashboth of which reduced travel In addition uncertainty about the spread of the virus and the level of aggregate demand impeded the regionrsquos investment and consumption Collapsing oil prices in 2020 further depressed demand in MENA where oil and gas comprise the most important sector in many economies As a consequence the Covid-19 pandemic severely affected virtually all aspects of the regional economies Output in 2020 contracted sharply The expected rebound in 2021 is unlikely to bring the region back to the level of economic activity it had in 2019 and certainly not to the level the World Bank had expected before the pandemic
Macroeconomic Impact
The pandemic and the associated collapse of oil prices severely hit MENA oil exporters The benchmark Brent oil price fell from about $65-a barrel before the pandemic to close to $20-a-barrel in April 2020 Since then it has only gradually climbed back to pre-pandemic levels Revenue from oil exports the main source of income for many oil producers in the region was expected to contract 38 percent in 2020 (IMFrsquos World Economic Outlook (WEO)- October 2020) This has been the trend notwithstanding a recent jump in oil prices associated with conflict in the region6
The pandemic was felt in all sectors not just energy MENA firms were severely affected (see Apedo-Amah et al (2020) for an analysis on early impact and Mohammed et al (2021) for a recent update) Overall exports from the MENA region fell sharply and have only partially recovered After dropping 44 percent year-on-year in the second quarter of 2020 goods exports from the region continued year-on-year declines of 17 percent in the third quarter and 10 percent in the fourth quarter (UNCTAD 2020 2021) Sectors such as autos in Morocco Tunisia and Iran and textiles in Jordan and Egypt have been hard hit by the pandemic and weakening global trade Covid-19 transport and travel restrictions directly affect the services trade including tourism which is an important source of income for many MENA countries For example it was the equivalent of 25 percent of exports in Egypt and 41 percent in Jordan in 2018 (World Development Indicators) Available high-frequency data indicate that tourism and air traffic in the region completely collapsed in April 2020 They have slightly recovered since then but for the four countries with available data (Morocco Tunisia Egypt and Saudi Arabia) tourism and air traffic were still 60 percent to 80 percent lower in February 2021 compared to February 2020 Data on Purchasing Managersrsquo Index (PMI) available for a few MENA countries also paint a picture of an uneven and difficult recovery A PMI above 50 represents an expansion over the previous month while a PMI below 50 represents a contraction PMIs for UAE and Egypt have hovered around 50 since July suggesting the two economies have not rebounded from the trough in April 2020 PMIs for Qatar and Saudi Arabia are above 50 as of February 2021 indicating a slight rebound Lebanonrsquos PMI is below 45 as of February 2021 indicating a continuing economic contraction (see Figure I1)
6 CNBC 2021
LIVINg wITH DEBT HOw INSTITUTIONS CAN CHART A PATH TO RECOVERY FOR THE MIDDLE EAST AND NORTH AFRICA
9
C H A P T E R I A C O N T I N U I N g C R I S I S
FIGURE I1 Purchasing Managersrsquo Index
25
30
35
40
45
50
55
60
65
Novem
ber 2019
Decem
ber 2019
Januar
y 2020
Februar
y 2020
March 2020
April 2020
May 2020
June 2020
July
2020
August 2020
September 2
020
October 2020
Novem
ber 2020
Decem
ber 2020
Januar
y 2021
Februar
y 2021
Egypt Lebanon Saudi Arabia UAE Qatar
Source Bloomberg LPNote Markit PMI is for the whole economy seasonally adjusted A PMI above 50 represents an expansion over the previous month A PMI reading under 50 represents a contraction
World Bank economists estimate that the regionrsquos real output contracted 38 percent in 2020 (see Appendix Table B1 for country-specific estimates) This estimate is a 13 percentage point upgrade compared to the forecast released in October 2020 (see Panel B Appendix Table B2) The upward adjustment in World Bank estimates for 2020 can be attributed mostly to a change in Iranrsquos GDP growth which was raised from a contraction of 45 percent in October 2020 forecasts to modest growth of 17 percent Nevertheless this regional growth estimate is 64 percentage points lower than the pre-pandemic growth forecast published in October 2019 (see Panel A Appendix Table B2) The downgrade is arguably a measure of the cost of the pandemic in 2020 because it was the dominant development since October 2019 This amounts to 202 billion dollars
World Bank economists forecast the regionrsquos real output to grow at a modest 22 percent in 2021 This is 03 percent higher than the forecast released in October 2020 (see Panel B of Appendix Table B2) on the back of a faster than expected recovery in oil prices7
Nevertheless the accumulated GDP losses due to the pandemic are substantial By 2021 the regional economy is forecast to be 72 percent below the no-pandemic counterfactual GDP level equivalent to 227 billion dollars (see Figure I2)
GDP per capita is arguably a more precise statistic of the regionrsquos standard of living than GDP The regionrsquos average real GDP per capita is estimated to decline 53 percent in 2020 The regionrsquos average real GDP per capita is forecast to increase by a meagre 06 percent in 2021 All in all the regionrsquos real GDP per capita in 2021 would be 47 percent below the level in 2019
Heavy GDP losses are observed across all MENA country groups The GDP level in 2021 for developing oil importers is forecast to be 93 percent below the counterfactual GDP level without the pandemic (see Figure I2) The counterfactual decline for
7 In October 2020 World Bank economists forecast the regionrsquos economic growth in 2021 at 19 percent
MIDDLE EAST AND NORTH AFRICA REgION ECONOMIC UPDATE APRIL 2021
10
C H A P T E R I A C O N T I N U I N g C R I S I S
GCC countries is 77 percent and is 44 percent for developing oil exporters The pandemic and the associated collapse in oil revenue trade and tourism have put MENA countries on a very difficult path This severely affects peoplersquos welfare puts immense pressure government budgets and reduces fiscal space to fight poverty
FIGURE I2 GDP Level Forecasts
Panel A MENA Panel B MENA Country groups
090
095
100
105
110
2019 2020 2021
GCC (Pandemic)
GCC (No Pandemic)Developing Oil Exporters (Pandemic)
Developing Oil Exporters (No Pandemic)
Developing Oil Importers (Pandemic)Developing Oil Importers (No Pandemic)
090
095
100
105
110
2019 2020 2021
MENA (Pandemic)
MENA (No Pandemic)
090
095
100
105
110
2019 2020 2021
GCC (Pandemic)
GCC (No Pandemic)Developing Oil Exporters (Pandemic)
Developing Oil Exporters (No Pandemic)
Developing Oil Importers (Pandemic)Developing Oil Importers (No Pandemic)
090
095
100
105
110
2019 2020 2021
MENA (Pandemic)
MENA (No Pandemic)
Source World Bank Macro and Poverty Outlook (in April 2021 and October 2019) and World Bank staffrsquos calculationNote The dotted lines show forecast GDP levels in the counter-factual case of no pandemic (based on GDP forecasts in October 2019) The straight lines show forecast GDP levels in the case of pandemic (based on GDP forecasts in April 2021)
The collapse in output underscores the importance of mitigation measures This report finds evidence that targeted efforts to control
the pandemic can help reduce economic costs For example in a global sample countries that have lower Covid-19 test positivity rates
have lower growth downgrades in 2020 Test positivity rates are arguably a proxy for the spread of the Covid-19 virus (CDC 2020) which
could also reflect a countryrsquos effort to control the pandemic through such efforts as masking testing and contact tracing Econometric
estimates suggest that a 10 percent reduction in a countryrsquos test posivitity rate is associated with 08 percent lower growth downgrades
after controlling for confounding factors (see Figure I3) This finding suggests that investment in public health measures not only reduces
the spread of the virus but also mitigates the economic costs of the pandemic
LIVINg wITH DEBT HOw INSTITUTIONS CAN CHART A PATH TO RECOVERY FOR THE MIDDLE EAST AND NORTH AFRICA
11
C H A P T E R I A C O N T I N U I N g C R I S I S
FIGURE I3 Test positivity Rates and Growth Downgrades
minus15
minus10
minus50
510
Gro
wth
Dow
ngra
de R
esid
ual (
perc
enta
ge p
oint
s)
minus10 0 10 20 30Positivity Rate Residual
Middle East amp North Africa Europe amp Central Asia
SubminusSaharan Africa Latin America amp Caribbean
East Asia amp Pacific South Asia
North America
Sources IMF World Economic Outlook Worldometer Johns Hopkins University World Bank World Development Indicators and World Bank staff calculationsNote The figure shows the partial correlation between 2020 growth adjustments between October 2020 and October 2019 and Covid-19 positivity rate (as of December 2020) The positivity rate is the number of Covid-19 cases as a percent of the total number of tests Other explanatory variables include log of GDP per capita in 2019 (in US dollars) total trade value in GDP in 2019 (percent) days since the first positive case until November 30 2020 and tourism as a percent of exports in 2018
Poverty Distributional and Long-Term Impacts
The pandemic has not only hurt economic activity it has had a profound impact on poverty and income distribution in the MENA region There are many pathways by which Covid-19 has painfully increased poverty There is the direct effect from succumbing to the disease Poor households are particularly at risk Poor people are more likely to have preexisting health conditions to live in crowded conditions with multigenerational households and to have less access to soap and clean water The indirect pathways that affect peoplersquos livelihoods include market disruptions that caused price increases and at times shortages of products Moreover because of lockdown policies and social distancing many poor people especially those in the informal sector lost their ability to earn an income The situation is particularly acute in Yemen Rising food prices declining remittances and reduced humanitarian assistance in a country devastated by years of conflict has pushed its population to the brink of starvation (IPC 2020) Between January and June 2021 the number of people with famine-like condition could nearly triple from 16500 to 47000 people In the same period the numbers of people facing emergency food insecurity and risk of famine could increase from 36 million to 5 million (one-sixth of the population) (IPC 2020)
Poverty is rising in the region Based on the regionrsquos baseline growth forecasts the number of poor people in the regionmdashthose making less than the $550 per day poverty linemdashis expected to increase from 176 million in 2019 to 192 million people by the end of 20218 This forecast assumes that every household is equally affected and that the effect of Covid-19 is uniform over
8 Thanks to the upward growth revisions this poverty forecast is slightly lower than the forecast released in October 2020 Based on the regionrsquos growth forecasts in a downside scenario World Bank economists in October 2020 forecast the number of people in poverty to reach 197 million by the end of 2021 (see Arezki et al 2020c)
MIDDLE EAST AND NORTH AFRICA REgION ECONOMIC UPDATE APRIL 2021
12
time In reality evidence from phone surveys in the first half of 2020 reported in Arezki et al (2020c) strongly suggests that the poor were hit harder They are more likely to have stopped working to have lost income and to have reduced consumption Furthermore in countries with high food-price inflation such as in Yemen but also in Lebanon the distributional impacts have been even more severe because food inflation is regressive It is likely then that far more than the forecasted 192 million people will be in poverty
Several rounds of phone surveys conducted recently in Tunisia and Djibouti allow us to observe the recovery of the labor market after the initial months of the pandemic In both countries the impact of the pandemic was dramatic during the first surveys but was more moderate during subsequent ones (see Figure I4) In the first wave of the survey (in April 2020 for Tunisia and July 2020 for Djibouti) a large share of respondents in both countries reported that they had stopped working Poor households were more likely to lose jobs than less-poor households This is clearer in Tunisia where 49 percent of the bottom quintile reportedly stopped working while only 29 percent of the top quintile did so In subsequent surveys the percentage of respondents reportedly without work gradually declined In the most recent surveys (in October 2020 for Tunisia and Jan 2021 for Djibouti) the fraction of people that reported having stopped working was smaller than during the first surveys
Nonetheless it is probably premature to conclude that a labor market recovery is well underway First even in the latest surveys in Tunisia and Djibouti there is evidence of lingering job losses Second the epidemic is still raging and thus it is difficult to conclude that any job gains relative to earlier in 2020 will be long lasting It is possible that if the spread of Covid-19 continues in these countries job losses could continue to accumulate Third the available evidence is silent with respect to wages or income Hence some jobs might have temporarily come back but we do not know for how long or at what income level
Regardless of the timing of the recovery much of the impact of the pandemic unfortunately could be felt for decades to come Disruption in core health services drops in household income school closures and persistent unemployment will likely carry long term costs in terms of slower human capital accumulation (Corral and Gatti 2020) Simulations conducted with the Human Capital Index indicated that without concerted remediation school closures alone which at the height of the pandemic affected 16bn children worldwide (Azevedo et al 2020) are likely to be associated with a drop in human capital for the cohort of children currently in school by 5 This is the same order of magnitude of the average global gains in human capital in the past decade (World Bank 2020c)
C H A P T E R I A C O N T I N U I N g C R I S I S
LIVINg wITH DEBT HOw INSTITUTIONS CAN CHART A PATH TO RECOVERY FOR THE MIDDLE EAST AND NORTH AFRICA
13
C H A P T E R I A C O N T I N U I N g C R I S I S
FIGURE I4 Distributional Effects of Covid-19
Panel A Tunisia
0
20
40
60
80
100
Bot
tom 2 3 4
Top
Bot
tom 2 3 4
Top
Bot
tom 2 3 4
Top
Apr-20 May-20 Oct-20
Bottom 2 3 4 Bottom 2 3 4 Bottom 2 3 4
Jul-20 Oct-20 Jan-21
Worked in the week before surveyed Stopped working Had not worked since before the pandemic
0
20
40
60
80
100
26 27 27 2514
38 43 4838
25
64 70 6553
43
49 48 5036
29
41 26 23
18
16
9 56
4
3
26 26 2339
56
21 30 2944
59
27 25 3043
54
59 56 60 6176 74
80 79 84 79 81 86
22 20 22 13
17 18 10 11 34 4 3
19 24 1826
7 8 10 10 13 17 15 12Panel B Djibouti
0
20
40
60
80
100B
otto
m 2 3 4
Top
Bot
tom 2 3 4
Top
Bot
tom 2 3 4
Top
Apr-20 May-20 Oct-20
Bottom 2 3 4 Bottom 2 3 4 Bottom 2 3 4
Jul-20 Oct-20 Jan-21
Worked in the week before surveyed Stopped working Had not worked since before the pandemic
0
20
40
60
80
100
26 27 27 2514
38 43 4838
25
64 70 6553
43
49 48 5036
29
41 26 23
18
16
9 56
4
3
26 26 2339
56
21 30 2944
59
27 25 3043
54
59 56 60 6176 74
80 79 84 79 81 86
22 20 22 13
17 18 10 11 34 4 3
19 24 1826
7 8 10 10 13 17 15 12
Source COVID-19 Phone Surveys fielded in Djibouti (Waves 1-3) and Tunisia (Waves 1-5)Note The figure reports the share of people who continued to work stopped working or had not worked since before the pandemic by quintile The quintile breakdown is by income in Djibouti (the top quintile is not covered by the survey) and by consumption in Tunisia The top (5th) quintile for Djibouti is not covered
MENA countries have carried out unprecedented policy responses to assist firms and households (see IMF 2021 for detailed policy responses) Social transfers are arguably one of the most important instruments in this crisis If targeted well social assistance is the most effective in supporting consumption of vulnerable households Most of the 19 MENA countries have extended cash-based transfers as part of pandemic response These cash transfers were mostly targeted towards supporting low-income households the elderly and workers in informal sectors As another part of the social assistance programs most MENA countries have provided baskets of food and hygiene kits and subsidized essential food products to the most vulnerable Several MENA governments offered paid leave for workers in both private and public sectors as well as free health treatments for individuals with Covid-19 as part of their social insurance plans In their further attempt to support labor markets about half of MENA governments have activated programs to subsidize wages of workers at private employers to partially alleviate financial burdens Gentilini et al (2020) provide a detailed update of country-specific social assistance measures
MIDDLE EAST AND NORTH AFRICA REgION ECONOMIC UPDATE APRIL 2021
14
C H A P T E R I A C O N T I N U I N g C R I S I S
Available data from early MENA phone surveys suggest that cash transfers are reasonably well targeted with much larger fractions of the poorest households being recipients than of households at the top of the distribution Nevertheless most of the poor households were not reached (Arezki et al 2020c) Targeted cash transfers even when targeting is imperfect tend to be ldquoprogressiverdquo that is they disproportionately benefit the poor (see Joumard et al (2012) for evidence in the OECD) This is because targeted cash transfers are more likely to reach poorer households and because the same amount of cash is more meaningful to poorer recipients than those that are better off In times of crisis imperfect targeting is expected because many countries in the region did not have in place well tested mechanisms that could ensure that benefits went to the intended recipients In the medium term refining targeting mechanisms including through strengthened social registries will remain an important element of the regional development policy agenda Morocco has made good progress in setting up a digital registry with World Bank support (World Bank 2016) Without a good transfer targeting mechanism in place countries may have to resort to less targeted measures such as subsidizing fuel or increasing public wages Caution is warranted against subsidizing fuel or increasing public wages as a temporary support to households These measures may end up supporting more well-off households incur substantial budget costs and in the case of fuel subsidies increase environmental costs9
Fiscal Balances and Public Debt
This section is dedicated to the analyses of fiscal balance and public debt the focus of the report The MENA region entered the Covid-19 crisis with chronic low growth macroeconomic imbalances (Arezki et al 2019) and weak governance especially when it comes to transparency (Arezki et al 2020b) The pandemic has put tremendous pressure on government fiscal positions Real government revenue in 2020 is 24 percent less than in 2019 The sharpest declines were among the GCC and developing oil exporters not surprising given the oil price collapse (see Figure I5) Squeezed by declining revenue government expenditure in the MENA also dropped compared to pre-pandemic expectations The expenditure decline is smaller than the revenue fall-off which reflects pressing demands to spend on policy responses to the pandemic As a consequence the regionrsquos average fiscal deficit in 2020 is estimated to be around 94 percent of GDP (see Appendix Table B1) compared to the pre-pandemic forecast deficit of 46 percent MENA countries have had to borrow to finance the deficits The pandemic is estimated to increase the regionrsquos public debt to about 54 percent of GDP in 2020 accelerating the rise in public debt during the past decade The increases are observed across MENA country groups (see Figure I6)
9 Targeted cash transfers are arguably more progressive than previous tools used to assist the poor Fuel subsidies for example tend to disproportionately benefit richer households given their substantial fuel consumption (see Del Granado et al 2012 for a cross-country study and World Bank (2019) for a detailed study on Egypt)
LIVINg wITH DEBT HOw INSTITUTIONS CAN CHART A PATH TO RECOVERY FOR THE MIDDLE EAST AND NORTH AFRICA
15
C H A P T E R I A C O N T I N U I N g C R I S I S
FIGURE I5 Changes in Real Government Revenue and Expenditure in 2020
40-
35-
30-
25-
20-
15-
10-
5-
0
5pe
rcen
t
GCC Developing OilExporters
Developing OilImporters
GCC Developing OilExporters
Developing OilImporters
Real Revenue and Grants Real Expenditure
Source World Bank Macro and Poverty Outlook (April 2021)Note Bars represent percentage change of real government revenue and grants and real government expenditure in constant 2019 USD from 2019 level
FIGURE I6 Median Public Debt by Country Group
30
40
50
60
70
80
90
High income Middle-incomeoil exporters
Middle-incomeoil importers
High income Middle-incomeoil exporters
Middle-incomeoil importers
2019 2020
perc
ent o
f GD
P
WorldMENA
Source World Bank Macro and Poverty Outlook (April 2021)Note Country groups are represented by median observation of the group The bars show median debt of MENA country groups The diamonds show median debt of the corresponding worldrsquos income groups Debt data are generally not available for MENA low income (Yemen and Syria) The high-income group in MPO is limited to only countries covered by the World Bank
MIDDLE EAST AND NORTH AFRICA REgION ECONOMIC UPDATE APRIL 2021
16
C H A P T E R I A C O N T I N U I N g C R I S I S
Before the pandemic many MENA countries had large public debt positions relative to peers in the same income groups outside the region (see Figure I6 for country group medians and Appendix Table B3 for country-specific debt data) Many of them are oil importers although GCC countries Bahrain and Oman are two notable high-income oil exporters with a large stock of public debt
This report analyzes factors that contributed to public debt changes in 2020 for selected MENA countries with debt levels exceeding 75 percent of GDP in 2020 (presented in Panel A of Figure I7) Primary deficits (before interest payments are added) and interest rate-growth rate differential are the main contributors Primary deficit significantly added to debt in 2020 for many of these countries (except for Egypt) given the decline in revenue and the increase in expenditure due to the pandemic10
The interest rate-growth rate differential also contributed much of the increase debt in 2020 Due to the pandemic growth is slower for many MENA countries contributing to larger interest rate-growth rate differential
Primary deficits are still expected to drive up debt in 2021 (Panel B of Figure I7) However the interest rate-growth rate differential is expected to drive down debt moderately for most countries since growth in 2021 is expected to recover slightly Overall primary balance and growth are the two key factors that could affect MENArsquos debt in the near term according to the baseline forecasts
FIGURE I7 Decomposition of Changes in Public Debt in MENA 2020 and 2021
Panel A 2020 Panel B 2021
0
20
40
60
80
100
120
140
20-
10-
0
10
20
30
40
Contribution from primary deficits
Contribution from interest rategrowth dierential
Change in public debt
Public debt ( of GDP) (RHS)
perc
ent o
f GD
P
0
20
40
60
80
100
120
140
20-
10-
0
10
20
30
40
Contribution from primary deficits
Contribution from interest rategrowth dierential
Change in public debt
Forecast public debt ( of GDP) (RHS)
perc
ent o
f GD
P
perc
ent o
f GD
P
perc
ent o
f GD
P
Bahrai
nOman
Jord
an
Morocc
o
Tunisia
Egypt
Bahrai
nOman
Jord
an
Morocc
o
Tunisia
Egypt
0
20
40
60
80
100
120
140
20-
10-
0
10
20
30
40
Contribution from primary deficits
Contribution from interest rategrowth dierential
Change in public debt
Public debt ( of GDP) (RHS)
perc
ent o
f GD
P
0
20
40
60
80
100
120
140
20-
10-
0
10
20
30
40
Contribution from primary deficits
Contribution from interest rategrowth dierential
Change in public debt
Forecast public debt ( of GDP) (RHS)
perc
ent o
f GD
P
perc
ent o
f GD
P
perc
ent o
f GD
P
Bahrai
nOman
Jord
an
Morocc
o
Tunisia
Egypt
Bahrai
nOman
Jord
an
Morocc
o
Tunisia
Egypt
Source World Bank Macro and Poverty Outlook (April 2021) and World Bank staff calculationsNote The figure shows contributions to debt for selected MENA countries with debt above 75 percent of GDP in 2020 The diamonds indicate changes in public debt as percentage of GDP The red bars represent primary deficits as a percent of GDP and the gray bars represent contributions from interest rate-growth differential The green lines represent public debt as a percent of GDP (right-hand side scale) Other debt-creating flows that are not presented in the chart include exchange rate depreciation privatization receipts recognition of implicit or contingent liabilities due to lack of data
10 For Egypt primary balance was in surplus However note that the Egyptrsquos 2020 fiscal year goes from July 2019 to June 2020 Therefore the 2020 fiscal data for Egypt reflect only partially the impact of the pandemic
LIVINg wITH DEBT HOw INSTITUTIONS CAN CHART A PATH TO RECOVERY FOR THE MIDDLE EAST AND NORTH AFRICA
17
C H A P T E R I A C O N T I N U I N g C R I S I S
MENArsquos Creditworthiness
Given the debt trends described above it is worth asking if a rebound in the global price of oil will help MENA countries This is an important question due to the salient role played by oil prices for both oil-exporters and importers The regions creditworthiness could be affected by oil-price fluctuations And creditworthiness matters for debt First lenders would factor the probability of default into their computation of interest rates Therefore a deterioration in creditworthiness could contribute to rising interest rates and as a result increase the debt-to-GDP ratio In turn high and increasing debt could jeopardize creditworthiness especially in turbulent times creating a vicious cycle between countryrsquos creditworthiness and its debt level
MENArsquos creditworthiness can be evaluated by credit default risk Sovereign credit default swaps (CDS) credit ratings and sovereign bond spreads are available market-based measures of countriesrsquo default risk11 A rise in the CDS price implies higher default risk and lower creditworthiness Figure I8 presents the prices for CDSs of available MENA countries during the pandemic12 CDS prices rose sharply during the pandemic indicating a deterioration of MENArsquos creditworthiness Among the GCC countries Oman and Bahrainrsquos credit default risk rose the most significantly consistent with the two countriesrsquo substantial debt levels Among middle-income MENA countries CDSs for Egypt Tunisia and Iraq rose the mostmdashand more than CDS increases of GCC countries As of early March 2021 the CDS levels have returned to the pre-pandemic level with some exceptions
FIGURE I8 Credit Default Swaps for Available MENA Countries
Panel A gCC
0
200
400
600
800
1000
1200
1400
1600
9219
102
19
11219
122
1912
20
222
0
322
0
422
0
522
0
622
0
722
0
822
0
922
0
102
20
1122
0
122
20
122
1
222
1
322
1
basi
s po
ints
Qatar Abu Dhabi Oman Bahrain Dubai Kuwait Saudi Arabia
0
200
400
600
800
1000
1200
1400
1600
92
19
102
19
112
19
122
19
12
20
22
20
32
20
42
20
52
20
62
20
72
20
82
20
92
20
102
20
112
20
122
20
12
21
22
21
32
21
basi
s po
ints
Iraq Morocco Egypt Algeria Tunisia
26 27 27 2514
38 43 4838
25
64 70 6553
43
49 48 5036
29
41 26 23
18
16
9 56
4
3
26 26 2339
56
21 30 2944
59
27 25 3043
54
59 56 60 6176 74 80 79 84 79 81 86
22 20 22 13
17 18 10 11 3 4 4 319 24 18 267 8 10 10 13 17 15 12
11 A credit default swap is a financial derivative or contract that allows an investor to swap or offset his or her credit risk with that of another investor To swap the risk of default the lender buys a CDS from another investor who agrees to reimburse the lender in the case the borrower defaults For example a CDS of 100 basis points implies that the CDS costs the lender 1 percent of the loan to ensure that the lender can be reimbursed in the case of default The price of the CDS is an insurance premium
12 Note that a CDS markets exists only for a subset of MENA countryrsquos sovereign bonds Bloomberg does not report CDS data for Lebanon which defaulted in March 2020 The bond spread for Lebanon shows a gradual increase since July 2019 and a spike to 10000 basis points in March and April of 2020
continues on next page gtgt
MIDDLE EAST AND NORTH AFRICA REgION ECONOMIC UPDATE APRIL 2021
18
C H A P T E R I A C O N T I N U I N g C R I S I S
Panel B Developing MENA
0
200
400
600
800
1000
1200
1400
1600
9219
102
19
11219
122
1912
20
222
0
322
0
422
0
522
0
622
0
722
0
822
0
922
0
102
20
1122
0
122
20
122
1
222
1
322
1
basi
s po
ints
Qatar Abu Dhabi Oman Bahrain Dubai Kuwait Saudi Arabia
0
200
400
600
800
1000
1200
1400
1600
92
19
102
19
112
19
122
19
12
20
22
20
32
20
42
20
52
20
62
20
72
20
82
20
92
20
102
20
112
20
122
20
12
21
22
21
32
21
basi
s po
ints
Iraq Morocco Egypt Algeria Tunisia
26 27 27 2514
38 43 4838
25
64 70 6553
43
49 48 5036
29
41 26 23
18
16
9 56
4
3
26 26 2339
56
21 30 2944
59
27 25 3043
54
59 56 60 6176 74 80 79 84 79 81 86
22 20 22 13
17 18 10 11 3 4 4 319 24 18 267 8 10 10 13 17 15 12
Source Bloomberg Note CDS data are from early September 2020 to March 5 2021
This report examines what factors might have affected the sharp changes in MENArsquos default risk In addition to the global factors it also examines oil demand and supply shocks which are important for the regional economies Daily data from 2016 to 2020 of 12 MENArsquos CDSs are analyzed for the regionrsquos oil exportersmdashAlgeria Bahrain Iraq Kuwait Oman Qatar Saudi Arabia and UAE (with separate CDSs for Abu Dhabi and Dubai bonds) and the oil importersmdashEgypt Morocco and Tunisia Results suggest that in addition to global factors oil demand and supply shocks play a big role in 2020 (see Appendix A2 for a detailed description of data and econometric specifications)
The above findings can offer insights on the evolution of MENArsquos credit default risk in the near term based on the forecasts of the oil market Brent oil prices are expected to be stable in 2021 at around USD 65 to USD 70 a barrel according to future Brent oil prices collected in the first week of March 2021 (Bloomberg) The US Energy Information Administration (USEIA) forecasts that oil consumption and production will likely recover to their pre-pandemic level by end of 2021 As of February 2021 the USEIA expected oil consumption to rise 63 percent and production by 33 percent (see Figure I9)
Even based on a set of large estimated effects of oil demand and supply fluctuations for 202013 the oil market recoveryrsquos impact on CDS will likely be small Assuming that the oil demand shock in 2021 equals the USEIArsquos expected change in oil consumption (63 percent) and the oil supply shock in 2021 equals the expected change in oil production (33 percent) we estimate that MENArsquos oil exportersrsquo CDSs will go down by only 22 basis points and MENArsquos oil importersrsquo CDSs will go up by only 32 basis points Even if the price of oil rises more than the February estimates of USEIA imply the oil market recovery is not likely to significantly reduce borrowing costs for MENA countries particularly for oil importers who would actually face higher default risks and thus borrowing costs as oil prices rise
In brief the pandemic has hit the regional economy hard pushing many people into poverty Fiscal positions are in distress and debt is piling up And the recovery of oil prices is unlikely to significantly reduce borrowing costs Thus how can MENA resolve the tensions between the need to borrow to pay for short-term needs and the long-term risks of public debt This is the subject of Chapter II
13 For the year 2020 a 1 percent decrease in oil demand significantly increases oil exportersrsquo CDS by 048 basis points [coefficient=048] The coefficient of oil supply shocks on oil exportersrsquo CDSs is 022 of oil demand shocks on oil importersrsquo CDS is 036 of oil supply shock on oil importersrsquo CDS is -031 The impact of oil shocks on CDS before 2020 is much smaller and largely statistically insignificant See Appendix A2 for a detailed description of data and econometric specifications
LIVINg wITH DEBT HOw INSTITUTIONS CAN CHART A PATH TO RECOVERY FOR THE MIDDLE EAST AND NORTH AFRICA
19
C H A P T E R I I H O w I N S T I T U T I O N S C A N C H A R T A PAT H T O R E C O V E R Y F O R T H E M I D D L E E A S T A N D N O R T H A F R I C A
FIGURE I9 Expected Oil Production and Consumption
80
85
90
95
100
105
Q1
2019
Q2
2019
Q3
2019
Q4
2019
Q1
2020
Q2
2020
Q3
2020
Q4
2020
Q1
2021
Q2
2021
Q3
2021
Q4
2021
Q1
2022
Q2
2022
Q3
2022
Q4
2022
mill
ion
barr
els
per d
ay
World Production World Consumption
Source US Energy Information Administration Short-Term Energy Outlook February 2021Note Data on and after Q4 2020 are projections
C H A P T E R I A C O N T I N U I N g C R I S I S
MIDDLE EAST AND NORTH AFRICA REgION ECONOMIC UPDATE APRIL 2021
20
C H A P T E R I I H O w I N S T I T U T I O N S C A N C H A R T A PAT H T O R E C O V E R Y F O R T H E M I D D L E E A S T A N D N O R T H A F R I C A
CHAPTER II How Institutions Can Chart a Path to Recovery for the Middle East and North Africa
CHAPTER II TAKEAWAYS
bull As MENA suffers the economic consequences of the pandemic most countries will face tensions between
short-term needs and the long-term risks of debt-financed government spending
bull During the pandemic fiscal spending is best used to support vulnerable families and invest in public
healthmdashsuch as disease surveillance data transparency and vaccinations
bull As the pandemic subsides some MENA countries with characteristics associated with ineffective fiscal
stimulus can consider thoughtful consolidation early during the recovery such as identifying and reducing
low-return spending items
bull Governance and transparency can help during and immediately after the pandemic as well as in the
longer term by reducing borrowing costs and accelerating growth
The pandemic is forcing economies in the MENA region to borrow a lot While addressing the immediate concerns of the pandemic is paramount prudence requires economies in the region to assess the consequences of building up debt This chapter takes stock of recent research and debates in the economics profession about debt and debt accumulation and applies it to the latest data available for the region
II1 Tensions between Short-run Needs and Long-run Costs of Debt-financed Spending
The Short-run Needs
Public debt can alleviate short-run financial constraints allowing governments to increase or maintain public consumption and investment14 Governments especially in developing countries have many pressing spending options with potentially high returns but may lack the resources to finance these activities Public debt provides those financial resources Theoretically if the economic social and environmental return on government spending exceeds the interest rate paid on the debt it makes sense for governments to finance spending through debt15 In principle governments via taxation can collect a portion of the total social return to pay back the debt that helps finance spending As productivity increases over time future generations are
14 Taxes are generally not a substitute for public debt Only in a world of perfect foresight perfect capital markets and economic agents with infinite horizons (called Ricardian-Equivalence by economists) can debt-financing and tax-financing of government spending have equivalent economic effects (Barro 1974) That is because in such a world people recognize that the debt will have to be repaid and set aside funds for future taxes In reality the proposition of perfect Ricardian equivalence is generally rejected (see Poterba and Summers 1987) Therefore debt-financed government spending can be more effective than tax-financed government spending because people do not fully consider the associated future tax liabilities of current borrowing In addition taxes are distortionary which provides another rationale for relying on borrowing it keeps tax rates constant (Barro 1979)
15 For examples investing in early education and in reducing air pollution have been shown to have very large benefit-cost ratios (see Heckman et al 2010 and USEPA 2011)
LIVINg wITH DEBT HOw INSTITUTIONS CAN CHART A PATH TO RECOVERY FOR THE MIDDLE EAST AND NORTH AFRICA
21
C H A P T E R I I H O w I N S T I T U T I O N S C A N C H A R T A PAT H T O R E C O V E R Y F O R T H E M I D D L E E A S T A N D N O R T H A F R I C A
likely better off than older generations Since public debt is akin to borrowing from tomorrow it allows smoothing resources intertemporally
Spending is needed now to limit the effects of the pandemic in the MENA region This includes transfers to support the consumption of hardest hit families and health spending to cover testing treatment and vaccination As the pandemic subsides fiscal authorities must decide whether additional fiscal stimulus is warranted to raise aggregate demand to accelerate the recovery
The Covid-19 pandemic is similar to a natural disaster such as earthquakes and floods in fundamental ways that are relevant to understanding analytically how public debt and economic growth interact Both pandemic and natural disasters are rare and unexpected occurrences and neither are directly caused by economic policies Both result in economic contractions because people are unable to work (due to physical destruction or safety concerns) Given these similarities this report examines trends in public debt and growth that occur around severe natural disasters to gain insights into how debt-financed fiscal expenditures can help the recovery of economies afflicted by disastersmdashand by analogy pandemics In developing countries after large natural disasters public debt does tend to rise to finance economic recovery (see Figure II1) During the three years following a large natural disaster growth in public debt is significantly higher than in countries that did not experience a disaster Real (adjusted for inflation) GDP growth collapses in the year of a natural disaster but is statistically significantly higher than the baseline growth two years later This finding provides an important empirical regularity that public debt does accumulate after disasters and is likely to do so after this pandemic possibly to support economic recovery
Note that the economics of armed conflicts is not the same as that of natural disasters (see Box II1) Public debt is found to increase during armed conflicts but economic growth does not pick up after them which suggests that government spending during conflicts might not be used to support economic growth
FIGURE II1 Public Debt and Output Growth around Natural Disasters
-2
-1
0
1
2
3
4
-3 -2 -1 t=0 1 2 3 GD
P gr
owth
ann
ual
Publ
ic d
ebt g
row
th a
nnua
l
Timeline around a large natural disaster years
Public debth growth annual GDP growth annual (RHS)
Sources World Bank World Development Indicators International Monetary Fund Global Debt DatabaseNote The figure displays central government public debt growth and GDP growth before during and after severe natural disasters relative to the baseline of no severe disasters Severe natural disasters are those that generate damages equivalent to at least 1 percent of the countryrsquos GDP The sample covers 324 severe natural disasters that occurred between 1960 and 2019 in 90 developing economies The disasters include floods earthquakes droughts storms landslides volcanic activities extreme temperature and wildfires The econometric framework follows a difference-in-difference approach with country and year fixed effects (see Appendix A1 for detail) Public debt growth is statistically significant at 10 percent level at t=123 GDP growth is statistically significant at 10 percent level at t=012
MIDDLE EAST AND NORTH AFRICA REgION ECONOMIC UPDATE APRIL 2021
22
C H A P T E R I I H O w I N S T I T U T I O N S C A N C H A R T A PAT H T O R E C O V E R Y F O R T H E M I D D L E E A S T A N D N O R T H A F R I C A
Box II1 Conflicts Debt and Growth
The economics of armed conflicts is different to that of natural disasters Public debt increases around armed conflicts but is probably not used to support economic growth
FIGURE BII1 Public Debt around Armed Conflicts
0
5
10
15
20
25
-5 -4 -3 -2 -1 t=0 1 2 3 4 5
Publ
ic d
ebt a
s
of G
DP
Timeline around the onset of armed conflicts years
All conflicts Severe conflicts
Source Lederman and Rojas 2018Note The figure displays the evolution of public debt of conflict countries relative to non-conflict economies before during and after armed conflicts t=0 indicates the onset of armed conflicts Severe conflicts are defined as having 1000 deaths per year at t=0 The sample includes 180 developing and developed countries (and 32 conflicts) between 1960-2015
Armed conflicts and public debt Lederman and Rojas (2018) shed light on the potentially long-lasting increases in the debt burden experienced by developing countries affected by armed conflicts The authors find that public debt in conflict-afflicted economies tends to be higher than in non-conflict economies prior to the onset of conflicts begins to rise further before conflict begins and stays high afterward (see Figure BII1) These findings suggest that developing economies experiencing conflicts finance the increased government expenditures by relying on public debt particularly after the conflict starts The weaker fiscal position under which conflict-affected countries entered the Covid-19 pandemic could severely affect not only their immediate but also their long-term ability to finance government expenditures
Armed conflicts and GDP growth The literature on the detrimental effects of conflicts on output is abundant and consistent Collier (1999) distinguishes four common routes by which armed conflicts can hurt the economy Conflicts
bull destroy physical and human capital
bull disrupt internal social dynamics
bull cause countries to divert public funds from activities that enhance output
bull contribute to dissaving which leads to economic deterioration
The magnitude of the impact of conflict on output is also estimated by economic literature Collier finds that the annual growth rate during civil wars is 22 percentage points lower than would have occurred had the war never happened Growth during the five years that follow a one-year conflict is also about 21 percentage points lower than what would have occurred had the war never happened This lack of a sustained post-conflict growth remains ldquoeven if countries successfully avoid relapsing back into conflictrdquo (Carey and Harake 2017) Armed conflict can also generate important collateral damage to the output of neighboring economies These negative spillover effects tend to amplify as the intensity of conflict increases (Murdoch and Sandler 2002 and 2004)
LIVINg wITH DEBT HOw INSTITUTIONS CAN CHART A PATH TO RECOVERY FOR THE MIDDLE EAST AND NORTH AFRICA
23
C H A P T E R I I H O w I N S T I T U T I O N S C A N C H A R T A PAT H T O R E C O V E R Y F O R T H E M I D D L E E A S T A N D N O R T H A F R I C A
The Long-Run Costs
Although public debt has an important role it also carries risks Public debt can be problematical if is used for unproductive ends More precisely if the economic and social returns to fiscal spending are lower than the realized interest rates paid for debt the debt burden relative to national income will tend to grow over time In many instances governments can be overly optimistic in their estimates of the returns to fiscal spending16 Negative shocks (such as an unexpected recession) can reduce the returns to public investment and increase realized interest rates For example the social return of infrastructure projects can be dampened in recessions when the projectsrsquo utilization declines In addition currency depreciations in bad times would inflate debt if external debt is denominated in foreign currencies In other instances governments may enact permanent spending programs based on a revenue windfall that is only temporary (Veacutegh Lederman and Bennet 2017) forcing them to continue the spending even after interest rates rise Kaminsky et al (2004) show that fiscal policy was procyclical for many developing countries although it has become more countercyclical for some of them in recent years (Frankel et al 2013)
Even when the economic and social return of fiscal spending exceeds the interest rate on debt used to finance it governments still need to be cautious about borrowing more when debt is already high As governments borrow more they may soak up available funds needed for private investment (Reinhart et al 2012) Interest rates may also rise which increases the cost of capital for the private sector Effectively the public sector may crowd out the private sector Furthermore there is also the prospect at least in the short run that an increase in debt raises expectations of future increases in tax rates to repay it which dampens present consumption and investment undermining any stimulative effect from debt-financed spending (Barro 1974)
Empirically public debt which includes both public domestic and public external debt is negatively correlated with private investment This appears to be true across MENA as shown in Figure II2 as well as for typical developing and middle-income countries This is consistent with the crowding out effects described above Note that the correlation between public debt and private investment is more negative in most MENA countries than in a typical developing country implying that the crowding out effect appears to be more severe in MENA Of course this does not mean that public debt can never reinforce private investment in some contexts In fact economic theory argues that public investment can in some instances raise private investment when it enhances the provision of public goods resulting in higher overall income in the long run
16 Frankel (2011) examines growth forecasts made by 33 official government agencies and finds that optimism bias contributes to excessive deficits More recently Beaudry and Willems (2018) find that in a sample of 189 countries optimism in real GDP growth forecasts increases the likelihood of future recessions and fiscal crises
MIDDLE EAST AND NORTH AFRICA REgION ECONOMIC UPDATE APRIL 2021
24
C H A P T E R I I H O w I N S T I T U T I O N S C A N C H A R T A PAT H T O R E C O V E R Y F O R T H E M I D D L E E A S T A N D N O R T H A F R I C A
FIGURE II2 Correlations between Public Debt Interest Payments and Private Investment
-10
-05
00
05
10
Leban
onIra
n
Jord
an
Algeria
Tunisia
Egypt
Djibouti
Developing C
ountries
Middle-Inco
me Countri
es
Correlation between public debt and private investment
Correlation between public debt and interest payments
Source World Bank Macro and Poverty Outlook (October 2020)Note Correlations are derived from public debt (percent of GDP) private fixed investment (percent of GDP) and interest payments (percent of GDP) Data are from 2000-2020 for most countries Country groups are represented by the median observation
As interest payments rise with the stock of debt they tend to increase their share in a governmentrsquos fiscal outlays Figure II2 also shows that public debt and interest payments are positively correlated for MENA countries and for a typical developing or middle-income country In two MENA countries Egypt and Lebanon interest payments have already reached around 10 percent of GDP and over 30 percent of total public expenditures in recent years (see Appendix Table B3) Such repayments may limit a governmentrsquos ability to spend on important items such as infrastructure and human capital which lowers growth prospects (Mahdavi 2004)
Elevated debt can increase vulnerability to macroeconomic volatility for several reasons As debt rises it creates fear that governments will be unable to repay resulting in a higher risk premia and therefore higher long-term real interest rates (Reinhart et al 2012) The tools at the disposal of governments such as counter-cyclical fiscal policy is also severely weakened Elevated debt reduces credit worthiness restricting access to further financing and curbing the ability of economies to roll over (that is refinance maturing) debt High levels of debt may be monetized leading to inflation currency depreciation capital flight and possibly debt or financial crises (Boskin 2020) The ongoing economic and social crisis of Lebanon after the country defaulted in March 2020 can be interpreted as a vivid example of this type of situation
At the extreme are economies that serially default Such economies may achieve a status of debt intolerance which means they are unable to take on even normal ranges of debt (Reinhart et al 2003 Reinhart and Rogoff 2009) The costs of defaulting on debt are significant for a countryrsquos trade investment flows and growth (Borensztein and Panizza 2009 Asonuma and Trebesch 2016) Defaulting on debt severely damages a countryrsquos financial systems (Reinhart et al 2003)
LIVINg wITH DEBT HOw INSTITUTIONS CAN CHART A PATH TO RECOVERY FOR THE MIDDLE EAST AND NORTH AFRICA
25
C H A P T E R I I H O w I N S T I T U T I O N S C A N C H A R T A PAT H T O R E C O V E R Y F O R T H E M I D D L E E A S T A N D N O R T H A F R I C A
Debt and Growth during 2000-2019 Evidence of Long-run Costs
Because public debt carries both costs and benefits how public debt affects economic growth is an empirical question There seem to be conceptual reasons to caution against elevated debt levels as discussed above The issue is the level of public debt that is considered ldquoelevatedrdquo Is there a common threshold across countries above which public debt accumulation hurts growth Starting from the seminal contribution of Reinhart and Rogoff (2010) many studies have investigated this relationship attempting to identify to what extent debt accumulation has a detrimental effect on GDP growth The literature seems to refute the idea of a common threshold across countries (Eberhardt and Presbitero 2015 Chudik et al 2017) But the literature does not rule out the possibility of country-specific debt thresholdsmdashincluding ones in debt intolerant countries that result in ldquoextreme duressrdquo if crossed (Reinhart et al 2003 and Reinhart and Rogoff 2009) This threshold varies by country depending on a countryrsquos default and inflation history and in debt intolerant countries may be well below a level easily managed by an advanced economy
Data suggest that countries with higher initial public debt levels in 2000 experienced lower long-run growth in GDP per capita in the following two decades (see Figure II3) The top-left panel shows that in a sample of 158 countries a median country with very high initial public debt in 2000 (that is in the high debt tercile) on average grew slower than a median country with lower initial public debt levels (in the low and medium debt terciles) in the next two decades Countries in the medium debt tercile have roughly similar average long-run growth as do countries in the low debt tercile This suggests a non-linear role of debt Nevertheless there is a great variation in average growth within each tercile For high-income economies very high initial public debt in 2000 does not seem associated with lower long-run growth which suggests that they are debt tolerant For developing and middle-income economies (the bottom panels) the association between high initial public debt in 2000 and subsequent low growth is more striking Developing economies in the top tercile of debt-to-GDP in 2000 typically grew about 1 percentage point per year lower in the following 20 years than those in the first and second debt terciles17
17 A similar finding is obtained when considering the relationship between initial debt in 1980 and subsequent long-run growth in 1980-1999 Developing economies in the lowest tercile of debt-to-GDP in 1980 typically grew 08 percentage points per year lower in the next two decades than those in the second and the highest terciles Developing economies in the middle debt tercile also had as low long-run growth as countries in the top debt tercile did This might reflect a volatile environment during 1980-1999 with relatively high interest rates and more default episodes
MIDDLE EAST AND NORTH AFRICA REgION ECONOMIC UPDATE APRIL 2021
26
C H A P T E R I I H O w I N S T I T U T I O N S C A N C H A R T A PAT H T O R E C O V E R Y F O R T H E M I D D L E E A S T A N D N O R T H A F R I C A
FIGURE II3 Median Annual per Capita Growth During 2000-2019 across Countries Ranked by Central Government Debt in 2000
Low Debt Tercile in2000 (median
2310)
Medium DebtTercile in 2000
(median 5359)
High Debt Tercile in2000 (median
9838)
All Countries
40th percentile Median 60th percentile
Low Debt Tercile in2000 (median
2476)
Medium DebtTercile in 2000
(median 5659)
High Debt Tercilein 2000 (median
10253)
Developing Economies
00
05
10
15
20
25
30
35
Low Debt Tercile in2000 (median
2171)
Medium Debt Tercilein 2000 (median
4206)
High Debt Tercile in2000 (median
7932)
Middle Income Economies
00
05
10
15
20
25
30
35
Low Debt Tercile in2000 (median
2274)
Medium Debt Tercilein 2000 (median
4138)
High Debt Tercile in2000 (median
8384)
High Income Economies
00
05
10
15
20
25
30
35
00
05
10
15
20
25
30
35
Source World Bank World Development Indicators International Monetary Fund Global Debt DatabaseNote Figure displays the real GDP per capita growth between 2000 and 2019 for each tercile of central government debt (percent of GDP) in 2000 by each country income group The overall sample covers 158 economiesmdash131 developing and 27 advanced economies based on the 1987 World Bank income classification The average annual growth rate is calculated between 2000 and 2019 The median real GDP per capita growth is presented for each of four groups (i) all countries (ii) high income (iii) developing (including middle-income and low-income countries) and (iv) middle income The debt terciles are in increasing order with the median of each tercile indicated in the horizontal axis Growth rates for the median 40th percentile and 60th percentile country are presented for each group
The Tensions are More Severe for Developing Countries
The association between developing countriesrsquo high initial public debt in 2000 and their subsequent low growth supports the notion that the tension between short-term needs and long-term costs of debt-financing is more severe for developing economies than for advanced ones For the developed world accommodative monetary policy and rising savings are expected to keep interest rates low favoring government borrowing Advanced countries are also known to be less debt intolerant so they can continue to borrow at relatively higher levels of public debt For the developing world including developing MENA the tension is starker Many MENA countriesmdashsuch as Egypt Jordan and Bahrainmdashface relatively high borrowing costs despite extremely low global interest rates (see Figure II4) The borrowing if not resulting in sufficiently high return fiscal spending in terms of GDP growth will add to future debt burden The default risk of many MENA countries rose sharply during the pandemic as
LIVINg wITH DEBT HOw INSTITUTIONS CAN CHART A PATH TO RECOVERY FOR THE MIDDLE EAST AND NORTH AFRICA
27
C H A P T E R I I H O w I N S T I T U T I O N S C A N C H A R T A PAT H T O R E C O V E R Y F O R T H E M I D D L E E A S T A N D N O R T H A F R I C A
shown in Figure I8 in Chapter I This is probably because many MENA countries entered the pandemic with high debt chronic low growth and weak governancemdashespecially when it came to transparency These existing vulnerabilities heighten the costs of their debt accumulation It is noteworthy that historically the probability of defaults andor current account reversals in developing MENA was abnormally low despite chronic low growth and persistent macroeconomic imbalances This was possible because of the support of high-income GCC countries via FDI and official assistance (Arezki et al 2019) However secular oil price declines driven by technological changes in the energy sector have significantly reduced the GCCrsquos willingness to continue to serve as a lender thus changing market expectations about debt vulnerability in developing MENA
FIGURE II4 Coupon Rates of US Dollar-denominated Debt Issuances during the Pandemic by Maturity for MENA countries Chile and Brazil
Bahrain
Bahrain
Bahrain Bahrain
Bahrain
Bahrain
Egypt
Egypt
Egypt
Egypt Egypt
Egypt
Egypt
Jordan
Jordan
Morocco
Morocco
MoroccoQatar
Qatar
Qatar
Saudi ArabiaSaudi Arabia
Saudi Arabia
Saudi Arabia
Saudi Arabia
Saudi ArabiaChile
Chile
Chile
Brazil
Brazil
24
68
10C
oupo
n R
ate
()
2020 2030 2040 2050 2060 2070Maturity
Source CbondscomNote Data are from the beginning of 2020 to February 27 2021 For comparability only coupon rates of US dollar-denominated debt issuances are displayed Coupon rates of EURO-denominated debt issuances from the region are not displayed but the overall finding remains the same
II2 The Role of Institutions in Shaping the Tradeoff
What can MENA countries do to navigate the tensions between short-term objectives and long-term risks of rising public debt
MENA countries can develop a transparent and credible multi-year fiscal and debt strategy to reduce the costs of public debt to bring debt-to-GDP ratio to sustainable levels and to reduce uncertainty for creditors and other economic agents18 This section tackles this question by discussing policy options during three different phases of an economic recovery from the pandemic
18 A fiscal rule is an example of a transparent and credible plan that applies in short-term and long-term in which a government provides clarity about when and to what extent it would conduct debt-financing fiscal spending (see Vegh et al 2017)
MIDDLE EAST AND NORTH AFRICA REgION ECONOMIC UPDATE APRIL 2021
28
C H A P T E R I I H O w I N S T I T U T I O N S C A N C H A R T A PAT H T O R E C O V E R Y F O R T H E M I D D L E E A S T A N D N O R T H A F R I C A
expenditure priorities during the pandemic
fiscal stimulus immediately as the pandemic subsides
mitigating the potential costs of debt overhang in the medium term
Prioritizing Spending during the Pandemic - Transparency and Surveillance
Conventional wisdom advocates a strong counter-cyclical role of fiscal expenditure Early studies suggest that fiscal multipliers are generally larger during bad times (Corsetti et al 2012 Riera-Crichton et al 2015 Auerbach and Gorodnichenko 2012) although recent research casts doubt on this wisdom (Ramey 2019) Nevertheless it is important to note that unlike in previous recessions fiscal policies are not designed primarily to boost aggregate demand during the Covid-19 pandemic because the collapse in aggregate demand in the pandemic was mainly driven by health concerns associated with the exposure to Covid-19 and not by underlying economic issues Social distancing has been shown to take place whether or not a government imposes restrictions such as lockdowns to slow the spread of the virus (Maloney and Taskin 2020 Gupta et al 2020) The collapse in demand is concentrated in sectors that require travel and face-to-face interactionsmdashsuch as airlines tourism hotel and restaurants brick-and-mortar retail and personal services19 As long as the risk of Covid-19 exposure remains stimulating aggregate demand is likely to be elusive
There are two main roles of fiscal spending during the pandemic to protect the welfare of vulnerable families and to invest in public health As Chapter I discusses poorer households in MENA have been disproportionately hurt Supporting the consumption of the hardest hit households is an essential objective for fiscal spending MENA countries have taken unprecedented actions to support the most vulnerable The good news is that cash transfers are reasonably well-targeted A bigger portion of the poorest households are beneficiaries than those at the top of the distribution evidence from phone surveys in the region suggests Yet there is room to improve since social transfers have been able to reach only a small portion of the families most in need
Public health investment as a short-term response to the pandemic could bring large long-term social returns such as better access to healthcare for the poor To contain the pandemic authorities could boost health spendingmdashto produce or acquire personal protective equipment testing kits and contact tracing systems and to mobilize and pay health workers Scaling up testing and contact tracing for Covid-19 as well as improving data transparency are especially important because these steps enable authorities to determine the dimensions of the infection to detect and isolate cases and to encourage the population to take appropriate social distancing measures The Gulf Cooperation Council (GCC) countriesmdashBahrain Kuwait Oman Qatar Saudi Arabia and the United Arab Emiratesmdashhave relatively high testing per capita As vaccines become available health spending can be allocated toward an immunization infrastructuremdashincluding among other things procurement of vaccines clear and effective communication to generate awareness of and demand for vaccination and building networks of local vaccination providers An effective vaccination campaign can both speed up the roll-out of vaccines which would pave the way for economic recovery and reinforce the foundation of public health infrastructure Simple calculations of the costs and benefits of investing in vaccination programs indicate that the benefit-cost ratio is very large around 781 if MENA vaccinates 20 percent of its population at the current prices envisioned by COVAX the multilateral initiative to make Covid-19 vaccines available to low- and middle-income countries (Ahuja et al 2021)
Investing in testing and public surveillance of the outbreak also appears to reduce the economic costs of the pandemic Preliminary evidence suggests that countries with a high level of tests coming back positive (a high test-positivity rate) suffered larger growth downgrades (see Figure I3 in Chapter I) A high test-positivity rate reflects a relatively uncontrolled pandemic
19 For example see Georgetown Universityrsquos job tracker httpscewgeorgetowneducew-reportsjobtracker for sectoral job losses in the United States
LIVINg wITH DEBT HOw INSTITUTIONS CAN CHART A PATH TO RECOVERY FOR THE MIDDLE EAST AND NORTH AFRICA
29
C H A P T E R I I H O w I N S T I T U T I O N S C A N C H A R T A PAT H T O R E C O V E R Y F O R T H E M I D D L E E A S T A N D N O R T H A F R I C A
which might reflect a limited outreach of testing as a public health surveillance tool Unfortunately many MENA countries have either high positivity rates (above the 5 percent benchmark set by the World Health Organization) or do not report reliable test results But some high-income countries in the MENA region have been at the global forefront of using testing for disease surveillance and rolling out vaccination programs (see Table I2 in Chapter I)
The Effectiveness of Public Investment Depends on Governance
MENA countries will have to decide whether additional fiscal stimulus is warranted after the public health emergency
On the one hand certain factors caution against embarking on additional stimulus in MENA First fiscal stimulus might not be needed because the recovery could be aided by rebound growth from demand for goods and services that could not be satisfied during the health emergency Because of this pent-up demand consumer and business spending will rise after it becomes clear that health risks have subsided (Krugman 2020 Lee 2020) The pent-up demand rebound depends on the duration of the crisis The longer the crisis goes the more likely firm liquidity constraints will result in solvency issues which might limit the upside of the recovery This scenario again underscores the importance of a rapid rollout of vaccines Moreover the extent of this pent-up demand rebound for the MENA regionmdashespecially from important external sources of demand such as tourismmdashdepends on the effectiveness and transparency of pandemic surveillance People will not likely resume traveling or spending on personal services if uncertainty regarding Covid-19 persists
Second fiscal stimulus can be ineffective or even counterproductive in MENA countries with elevated debt such as many oil importers (see Appendix Table B4) Published research indicates that in an environment of high public debt the so-called fiscal multiplier from additional spending can be zero (Ilzetzki et al 2013) Huidrom et al (2020) estimate that two-year fiscal multipliers can range from zero when government debt is high (in the 90th percentile of their sample that is above 92 percent of GDP) to 06 when government debt is low (in the 10th percentile or less than 17 percent of GDP) Two channels could cause negligible response to fiscal stimulus in economies with high public debt In one households reduce consumption when the fiscal stimulus is implemented in anticipation of future fiscal adjustments (such as tax increases or fiscal austerity) to finance the stimulus This is referred to as the Ricardian equivalence channel after Robert Barrorsquos seminal research in 1974 In the second called the interest rate channel concerns about sovereign credit risk raise interest rates and hence reduce aggregate demand (Huidrom et al 2020)
Third even though public investment can bring short and long run gains caution is warranted in countries with poor governance Public investment such as infrastructure projects is usually understood to have larger long-run effects than public consumption and social transfers (Auerbach and Gorodnichenko 2012 Veacutegh et al 2018) Unlike government consumption public investment directly improves the economyrsquos productive capacity by increasing the marginal product of private capital and labor As time progresses this generates positive effects both on private investment and private consumption (Leduc and Wilson 2013) In addition countries with a low initial stock of public capital (as a proportion of GDP) have significantly higher public investment multipliers than countries with a high initial stock of public capital (Izquierdo et al 2019) Eden and Kraay (2014) report that in low-income countries on average an extra dollar of government investment raises private investment by roughly two dollars and output by 15 dollars Nevertheless public investment may have a more limited short-term multiplier because of delayed implementation (Ramey 2020) More important the economic gains from public investment projects can be hindered by poor governance which reduces the efficiency of public investment For example public projects with
MIDDLE EAST AND NORTH AFRICA REgION ECONOMIC UPDATE APRIL 2021
30
C H A P T E R I I H O w I N S T I T U T I O N S C A N C H A R T A PAT H T O R E C O V E R Y F O R T H E M I D D L E E A S T A N D N O R T H A F R I C A
low economic and social return are selected when governance is poor At least this appears to be the case even for a large sample of European countries (Izquierdo et al 2019) In countries with the lowest institutional capacity and transparency the multiplier of public investment can be close to zero in both the short- and long-term Unfortunately governance is one area in which the MENA region trails its world peers (see Appendix Table B4) This concern reinforces the need to work on reforms to improve the governance of public investment decisions
On the other hand many countries in MENA rely on fixed exchange rate regimes (see Appendix Table B4) which can boost fiscal multipliers (Corsetti et al 2012 Ilzetzki et al 2013) As described by Ilzetzki et al (2013) ldquothe initial effect of a fiscal expansion is to increase output raise interest rates and induce an inflow of foreign capital which creates pressure to appreciate the domestic currency Under predetermined exchange rates the monetary authority expands the money supply to prevent this appreciation Such monetary policy accommodation serves to accommodate the rise in output Under flexible exchange rates however the monetary authority keeps a lid on the money supply and thus allows the real exchange rate appreciation to reduce net exports Output does not change because the increase in government spending is exactly offset by the fall in net exportsrdquo Table II1 summarizes the literature on country characteristics and the size of fiscal multipliers
TABLE II1 Country Characteristics and the Size of Fiscal Multipliers
Size of Fiscal Multipliers Public Debt Output Gap Governance Exchange Rate
Regime
LARgE Low Large Strong Pegged
SMALL High Small Weak Flexible
Sources Ilzetzki et al (2013) Huidrom et al (2020)
Corsetti et al (2012) Riera-Crichton et al (2015)
Auerbach and Gorodnichenko (2012)
Izquierdo et al (2019)Corsetti et al (2012) Ilzetzki
et al (2013)
Note See Appendix Table B4 for the corresponding positions of MENA countries
The arguments for and against demand-stimulating fiscal actions after the pandemic do not rule out the usefulness of targeted fiscal
spending Focusing on economic impacts of the crisis with potentially long-lasting consequences can be a helpful guide Consistent with
the existing literature this report labels these as ldquoscarring effectsrdquo (Portes 2020 Baldwin and Weder di Mauro 2020 Arellano-Bover
forthcoming) For example financial constraints might prevent firms from making the initial investment to re-enter the market Or workers
who became unemployed or under-employed during the crisis might face long-term reductions in the chances of finding employment and
even lower wagesmdashand thus need retraining and job search assistance School closures interrupt studentsrsquo skill accumulation20 For example
without targeted remediation the human capital of children who are now in school is likely to be reduced by almost 5 which is the order
of magnitude of the average improvement in human capital globally in the past ten years (World Bank 2020c) Government spending
such as subsidized loans job training and resources for schools to make up for the loss of learning can mitigate these ldquoscarringrdquo effects
20 If the return to an additional year of education is approximately 8-10 percent and the average student misses one quarter of the school year then one might estimate a permanent impact on earnings of 2 percent to 25 percent (Portes 2020)
LIVINg wITH DEBT HOw INSTITUTIONS CAN CHART A PATH TO RECOVERY FOR THE MIDDLE EAST AND NORTH AFRICA
31
C H A P T E R I I H O w I N S T I T U T I O N S C A N C H A R T A PAT H T O R E C O V E R Y F O R T H E M I D D L E E A S T A N D N O R T H A F R I C A
Mitigating the Costs of Public Debt after the Pandemic with Transparency and Governance
The costs of elevated debt are likely to manifest themselves eventually perhaps even in the short term To help in April 2020 the so-called Group of 20 advanced economies initiated a Debt Service Suspension Initiative (DSSI) which suspended interest and principal payments for the poorest countries from May 1 through December 31 2020 It was later extended to June 30 2021 While this is a helpful respite DSSI does not reduce debt value (see Box II2)
Box II2 The Debt Service Suspension Initiative (DSSI)
With the support of the World Bank Group and the International Monetary Fund (IMF) the so-called Group of 20 advanced economies (G20) is allowing 73 low- and lower-middle-income countries to temporarily suspend debt service paymentsmdashboth interest and principalmdashowed to their official bilateral creditors The suspension is designed to temporarily ease the debt pressure on poorer countries and free up resources that can be used to fight the pandemic and support vulnerable people The G20 has also called on private creditors to participate in the initiative on comparable terms The Debt Service Suspension Initiative (DSSI) originally was to run from May 1 2020 through December 31 2020 but was extended through the end of June 2021 (World Bank 2020b)
Two MENA countries are eligible from the DSSImdashDjibouti and Yemen In the latest Debt Sustainability Analysis (DSA) conducted in May 2020 by the World Bank and the IMF Djibouti is considered to be at high risk of external debt distress and at high risk of overall debt distress because of the impact of the Covid-19 on macroeconomic prospects (World Bank and IMF 2020) The government of Djibouti has participated in the DSSI Potential DSSI savings for Djibouti amounts to 17 percent of GDP during May-December 2020 and 2 percent of GDP during January-June 2021 (World Bank 2020b) Yemen is also participating in the DSSI However because of external arrears Yemenrsquos benefit from the DSSI is notional
The DSSI is helping poorest countries by allowing payment delay The initiative does not reduce the debt stock nor the total amount that the debtors are expected to pay to the creditors The DSSI also does not restructure debt Restructurings encompasses actions that reduce the debt stock andor extend maturities andor reduce interest rates
Soon after the pandemic countries in the region may have to take action to reduce the share debt represents of GDP even when economic output remains below potential To do so governments can
Raise economic growth
Undertake thoughtful fiscal consolidation
Use inflation to erode the value of domestic debt
Refinance (roll over) maturing debt on more favorable terms
Default or restructure debt
Some options are more beneficial and feasible than others with transparency and governance playing a key role
MIDDLE EAST AND NORTH AFRICA REgION ECONOMIC UPDATE APRIL 2021
32
C H A P T E R I I H O w I N S T I T U T I O N S C A N C H A R T A PAT H T O R E C O V E R Y F O R T H E M I D D L E E A S T A N D N O R T H A F R I C A
Raising economic growth increasing economic output remains the most sustainable way to reduce debt Boosting economic growth in MENA requires much-needed deep structural reforms to raise the productivity of the existing workforce and put idle working-age people in jobs Unemployment in the MENA region is high and is concentrated in young people and the educated The regionrsquos female labor force participation rate is the lowest in the world A powerful way to put more people to work and enhance the productivity of the current workforce is to promote fair competition (Arezki et al 2020a) and adopt digital technologymdashespecially in finance and telecommunication These enhancements would be especially important to the informal sector which would gain access to services and markets previously accessible only to the privileged few and to state-owned enterprises In some countries where the both telecommunication and digital payment infrastructure are underdeveloped removing barriers to entering and leaving markets is important
Undertake thoughtful fiscal consolidation After the pandemic steps to reduce fiscal deficits (called fiscal consolidation) can also be considered by MENA countries that have such conditions as high debt and weak governance that impedes the effectiveness of fiscal stimulus Fiscal consolidation does not mean indiscriminate spending reduction Rather this can be achieved by prioritizing the most effective spending items coupled with improved spending decisions In highly indebted countries thoughtful fiscal consolidation such as reducing low-return spending items might have a small negative impact or could even be welcomed by private sector This is consistent with the finding that the fiscal multiplier is close to zero or negative in such countries (Ilzetzki et al 2013 Huidrom et al 2020) Over the medium term MENA countries can aim to gradually reduce heavy subsidies and expand the formal private sector to increase the tax base MENArsquos labor market currently consists of a large informal sector that gives workers virtually no social protections and produces little tax in tax revenue (World Bank 2014 Gatti et al 2014)
Using inflation to erode domestic debt Although historically inflationary episodes have reduced the value of domestic debt inflation is unlikely to be a deliberate policy tool to reduce debt High inflation is well-known to be very costlymdashhurting long-run economic growth (Bruno and Easterly 1998) and putting depreciation pressure on exchange rates High inflation also has important distributional costs as it disproportionately hurts the poor (Easterly and Fischer 2001 Bulir 2001) and people living on fixed income such as retirees Unlike most poor people the rich have access to real and financial instruments and can protect themselves against inflation Inflation can also cause social unrest Anecdotal evidence suggests that inflation especially in food and fuel prices can trigger protests (NPR 2011 Washington Post 2015) Arezki and Bruckner (2011) systematically find that increases in food prices cause anti-government demonstrations and riots in poor countries In sum inflation is not likely a policy tool Rather it is usually a sign of difficult economic conditions as demonstrated by two MENA countries with high inflationmdashLebanon and Iran
An alternative approach financial repression can only work to gradually reduce public debt over time and carries costs Financial repression consists of controlled domestic interest rates captive domestic lenders that provide credit to the government and positive inflation rates (McKinnon 1973 and Reinhart and Sbrancia 2015) These factors can generate negative real interest rates and gradually reduce existing domestic public debt Financial repression was an important factor in the debt reduction of advanced countries in the decades after World War II21 The early literature found that because of government interventions in pricing and funding allocation financial repression hurts financial development (Demetriades and Luintel 1997) and long-run growth (Roubini and Sala-i-Martin 1992) In addition to their downsides financial repression policies take time to substantially reduce the debt-to-GDP ratio
21 For example for the United States and the United Kingdom the annual liquidation of debt via negative real interest rates amounted on average to 2 and 3 percent of GDP a year during the post-war period (Reinhart and Sbrancia 2015)
LIVINg wITH DEBT HOw INSTITUTIONS CAN CHART A PATH TO RECOVERY FOR THE MIDDLE EAST AND NORTH AFRICA
33
C H A P T E R I I H O w I N S T I T U T I O N S C A N C H A R T A PAT H T O R E C O V E R Y F O R T H E M I D D L E E A S T A N D N O R T H A F R I C A
Rolling over debt with more favorable terms To reduce debt MENA countries can also aim to refinance maturing debt on more favorable terms The good news is that global interest rates are expected to remain low The US Federal Reserve has set its policy interest rate goal at or near zero to achieve maximum employment and will allow inflation to moderately go above the 2 percent target rate for some time (Federal Reserve FOMC Statement December 2020)22 The Federal Reserve forecasts that interest rates will remain near zero at least through 2023 (Federal Reserve Economic Projections December 2020)23 The European Central Bankrsquos overnight deposit rate has been negative and declining since 2014 (European Central Bank 2021) Given these monetary policy goals for two of the worldrsquos most important central banks global interest rates are likely to remain low for some time although that could change due to pent-up demand
However interest rates for MENArsquos new debt will not necessarily be low given the regionrsquos high debt and low growth The coupon rates paid by many MENA countriesmdashsuch as Egypt Jordan and Bahrainmdashwere high during the pandemic for debt issuances denominated in hard currencies even when interest rates were extremely low globally (see Figure II4) But MENA countries with low levels of public external debt (such as Qatar Saudi Arabia and Morocco) could issue debt with lower coupon rates In addition it is not certain that after the pandemic interest rates will remain so low Partly because of favorable global liquidity conditions fostered by central banks in advanced markets private capital outflows have been moderate and many middle-income countries were able to continue borrowing in global capital markets After the pandemic the unprecedented liquidity support by advanced countriesrsquo central banks will probably stop Many emerging markets with synchronized rises in debt levels might have to compete for liquidity to roll over their debt A less liquid global scenario added to the high debt reduced oil prices chronic low growth and the external imbalances that beset many MENA countries means that the region might face considerable challenges competing for liquidity
To access more favorable terms MENA countries need to enhance their growth prospects Economic growth can directly reduce debt as a share of GDP and help MENA countries roll over existing debt on good terms If MENA countries are to be able to roll over their debt and gradually get on a sustainable debt dynamic it is crucial that they achieve the stable macroeconomic conditions necessary for growth
MENA countries can work to enhance debt reporting transparency and monitor financial market vulnerabilities Such measures can lower rollover costs Studies have shown that greater data transparency can lower the costs of external borrowing (Cady 2005 Choi and Hashimoto 2018) This is probably because when investors are unsure about a countryrsquos debt profile they demand a higher risk premium More broadly studies have found positive correlations between data transparency and governance (Islam 2006 and Williams 2009) and growth (Arezki et al 2020b) MENA countries can improve public debt reporting including debt borrowed from China24 Improving debt reporting is important because hidden public debt such as debt of SOEs can become exposed usually in distressed times and is added to the total tally of public debt precisely at the moments public debt needs to be brought under the control the most (Reinhart 2015) A potential mechanism to mitigate hidden debt is to develop a secondary market for private debt including non-performing loans
This report updates MENArsquos public debt reporting first documented in Arezki et al (2020b) providing an overall reporting of different categories of public debt such as state and local government extra budgetary funds and SOE liabilities The transparency of public debt reporting is largely unchanged between 2019 and 2020 with notable improvements in Tunisia
22 httpswwwfederalreservegovnewseventspressreleasesmonetary20201216ahtm23 httpswwwfederalreservegovmonetarypolicyfomcprojtabl20201216htm24 Horn and others (2020) find that 50 of Chinarsquos lending to developing countries is not reported to the IMF or World Bank These ldquohidden debtsrdquo distort policy surveillance risk
pricing and debt sustainability analyses
MIDDLE EAST AND NORTH AFRICA REgION ECONOMIC UPDATE APRIL 2021
34
C H A P T E R I I H O w I N S T I T U T I O N S C A N C H A R T A PAT H T O R E C O V E R Y F O R T H E M I D D L E E A S T A N D N O R T H A F R I C A
and Jordan (see Appendix Table B5) Closely monitoring financial market vulnerabilities such as non-performing loans held by banks is also important to improve investor confidence and reduce borrowing costs
Defaulting or Restructuring Debt If MENA countries cannot roll over debt they may risk costly debt restructurings Debt restructuring is a process wherein a country experiencing financial distress and liquidity problems refinances its existing debt obligations in order to gain more flexibility in the short term and make its debt load more manageable overall There are two types of debt restructuringsmdashpreemptive and post-default In preemptive restructurings a country decides to restructure its external debt before it misses any payments In a post-default restructuring a country is forced to enter into debt negotiations because it has missed payments (that is defaulted)
FIGURE II5 GDP Growth in Lebanon and Jordan
-25
-20
-15
-10
-5
0
5
2017 2018 2019 2020 2021 2022 2023
perc
ent
Jordan Lebanon
Source World Bank Macro and Poverty Forecasts (April 2021)Note Data for 2021 2022 and 2023 are forecasts Forecasts for Lebanonrsquos GDP growth in 2022 and 2023 are not available Lebanon defaulted in March 2020
Defaults are costly as the default of Lebanon shows On March 7 2020 the Lebanese government defaulted on a $12 billion Eurobond payment in its first sovereign default The Lebanese Lira depreciated sharply and with heavy fluctuations The Eurobond default precludes access to international markets for foreign financing The domestic banking sector is impaired because of the exposure to the government debt The lack of bank credit coupled with exchange market pressures choke trade and corporate finance in the highly dollarized economy constraining the capital and final goods imports (World Bank 2020a) The current account deficit was sharply reduced from a deficit of 21 percent of GDP in 2019 to a deficit of 11 percent of GDP in 2020 mainly because imports dried up A year into the economic crisis there have been limited policy responses by the authorities The political situation is volatile Lebanon lacks a fully functioning executive authority and as of early March 2021 is trying to form its cabinet
The warning signs of Lebanonrsquos economic collapse were ominous Lebanonrsquos GDP growth gradually declined in the years leading up to the default (Figure II5) Real GDP contracted by 19 percent in 2018 and 67 percent in 2019 respectively In 2020 real GDP is estimated to contract 203 percent and in 2021 it is expected to shrink another 95 percent This performance is in stark contrast to a neighbor Jordan which is expected to record positive economic growth in 2021
LIVINg wITH DEBT HOw INSTITUTIONS CAN CHART A PATH TO RECOVERY FOR THE MIDDLE EAST AND NORTH AFRICA
35
C H A P T E R I I H O w I N S T I T U T I O N S C A N C H A R T A PAT H T O R E C O V E R Y F O R T H E M I D D L E E A S T A N D N O R T H A F R I C A
To systematically understand restructurings we study the evolution of growth external debt and governance around restructurings for developing countries using the restructuring dataset constructed and maintained by Asonuma and Trebesch (2016) The dataset provides information on the occurrence and duration of restructurings with private external creditors from 1978 (see Appendix A3 for detail)25 The cases are differentiated into two categories preemptive restructurings and post-default restructurings
Highly indebted countries are more likely to enter either type of debt restructuring when they experience low growth and weak governance In Figure II6 the blue bars show that countries that default or preemptively restructure have lower growth and weaker governance quality in the five years preceding the event than do countries with no restructurings Several MENA countries entered 2020 with deficits in both dimensions as shown in the red bars The deficits are most striking for Lebanon which defaulted in 2020 and to a lesser extent for MENA middle-income countries The good news for MENA middle-income oil importers the group of countries with relatively high public debt is that the gaps in growth and governance are more modest than those in other MENA middle-income countries
In addition there seems to be a systematic difference in governance quality between countries that default and countries that preemptively restructure In the five years before the event countries that default have governance scores than average 02 points lower than countries that do not restructure while countries that preemptively restructure have an average governance score 01 points lowermdashsuggesting that institutions play a role in restructuring decisions
FIGURE II6 Growth and Governance before Restructurings
Panel A Difference in gDP growth (percentage)
-5
-4
-3
-2
-1
0
Countries thatdefaulted minus
the control group
MENA middleincome minus the
control group
MENA middle-income oil
importers minusthe control group
Lebanon minus thecontrol group
-05
-04
-03
-02
-01
0
Countries thatdefaulted minus
the control group
Countries thatpreemptivelyrestructured
minus thecountrol group
Countries thatpreemptivelyrestructured
minus thecountrol group
MENA middleincome minus the
control group
MENA middle-income oil
importers minusthe control group
Lebanon minusthe control group
Source World Bank staff calculationNote The first bar from the left shows 5-year average annual GDP growth before a post-default restructuring minus that before non-restructuring periods (referred to as average growth of the control group or agcg) The second bar shows 5-year average annual GDP growth before a preemptive restructuring minus agcg The third bar shows the average annual GDP growth during 2014-2019 for MENA middle-income countries minus agcg The fourth bar shows the average annual GDP growth during 2014-2019 for MENA middle income oil importers minus agcg The fifth bar shows the average annual GDP growth during 2014-2019 for Lebanon minus agcg
25 See Schlegl et al (2019) for a study on restructurings of debts owed by foreign governments Multilateral institutions such as the IMF the World Bank and other regional banks are the most ldquoseniorrdquo creditors meaning their loans get repaid first
continues on next page gtgt
MIDDLE EAST AND NORTH AFRICA REgION ECONOMIC UPDATE APRIL 2021
36
C H A P T E R I I H O w I N S T I T U T I O N S C A N C H A R T A PAT H T O R E C O V E R Y F O R T H E M I D D L E E A S T A N D N O R T H A F R I C A
Panel B Difference in governance (score)
-5
-4
-3
-2
-1
0
Countries thatdefaulted minus
the control group
MENA middleincome minus the
control group
MENA middle-income oil
importers minusthe control group
Lebanon minus thecontrol group
-05
-04
-03
-02
-01
0
Countries thatdefaulted minus
the control group
Countries thatpreemptivelyrestructured
minus thecountrol group
Countries thatpreemptivelyrestructured
minus thecountrol group
MENA middleincome minus the
control group
MENA middle-income oil
importers minusthe control group
Lebanon minusthe control group
Source World Bank staff calculationNote Governance is simple average between rule of law regulatory quality and government effectiveness (with a range from -25 (worst) to 25 (best))The first bar from the left shows 5-year average governance before a post-default restructuring minus that for non-restructuring periods (referred to as average governance of the control group or agocg The second bar shows 5-year average governance before a preemptive restructuring minus agocg The third bar shows average governance during 2014-2019 for MENA middle-income countries minus agocg The fourth bar shows average governance during 2014-2019 for MENA middle-income oil importers minus agocg The fifth bar shows average governance during 2014-2019 for Lebanon minus agocg
While both forms of restructurings with private external creditors are costly preemptive restructurings are less so They are shorter and most importantly associated with lower output cost than post-default restructurings Countries that preemptively restructure are able to re-enter borrowing markets sooner than those that default (Asonuma and Trebesch 2016) To gain further understanding of the extent to which pre-emptive restructurings might be preferable to post-default debt restructuring this report estimates the impact of such events on both growth and debt We focus on three years before the year of the announcement of a restructuring and three years after the start of a restructuring For both types of episodes the estimates are relative to the performance of countries that did not experience a debt restructuring Details of the analysis are in Appendix A3
Our analyses show that both types of restructurings are costly in terms of output growth but preemptive restructurings are less costly than defaults Panel A of Figure II7 show before they restructure debtor countries experience lower growth relative to countries that do not restructure This is the case for both preemptive and post-default restructurings However after the first year of restructuring growth starts to recover for preemptive restructurings but remains depressed for post-default restructurings
In addition restructurings help slow debt accumulation Panel B of Figure II7 shows that during the first two years after a restructuring starts (that is t=12) debt growth is significantly lower in both preemptive and post-default restructurings compared to the countries that did not restructure This could reflect the exclusion of restructuring countries from international debt markets and the reduction in debt granted by creditors during the restructuring negotiations
LIVINg wITH DEBT HOw INSTITUTIONS CAN CHART A PATH TO RECOVERY FOR THE MIDDLE EAST AND NORTH AFRICA
37
C H A P T E R I I H O w I N S T I T U T I O N S C A N C H A R T A PAT H T O R E C O V E R Y F O R T H E M I D D L E E A S T A N D N O R T H A F R I C A
FIGURE II7 Output Growth and Debt Growth around Restructurings
Panel A Output growth around Restructurings Panel B External Debt growth around Restructurings
-4
-3
-2
-1
0
1
-2 -1 0 1 2 3
percent
-30
-20
-10
0
10
20
-3 -2 -1 0 1 2 3
Pre-emptive restructurings Post-default restructurings
percent
-3
Pre-emptive restructurings Post-default restructurings
Source World Bankrsquos staff estimates (see Appendix A3 for details)Note Difference-in-difference approach t=0 onset of a restructuring t=-3-2-1 indicate the years before restructurings t=123 indicate the years after a restructuring starts Data consists of 197 restructurings to private external creditors between 1981 and 2019 and are collected and updated by Asonuma amp Trebesch (2016) Panel A The coefficient at t=-1 is statistically significant at 10 level for preemptive restructurings The coefficients at t=-112 are statistically significant at 10 level for post-default restructurings Panel B The coefficients at t=12 are statistically significant at 10 level for preemptive restructurings The coefficient at t=2 is statistically significant at 10 level for post-default restructurings
II3 How Institutions Shape the Recovery
Economic growth remains the most sustainable way to reduce debt Boosting economic growth requires deep structural reforms to raise the productivity of the existing workforce and to put idle working-age people in jobs Many MENA countries that have characteristics associated with ineffective fiscal stimulus such as high public debt and poor governance could consider fiscal reforms early in the recovery from the pandemic Rolling over debt with more favorable terms is an important way for countries to gradually reduce debt This also requires debt transparency and financial market monitoring If they are unable to roll over maturing loans countries risk costly debt restructurings Our evidence suggests that many MENA countries share certain characteristics with countries that entered costly debt restructurings namely low growth and poor governance Institutions can play an important role in mitigating the long-term costs of public debt
Improvements in governance and transparency also help during the pandemic and when it subsides Investing in testing disease surveillance and data transparency can reduce the economic costs of the pandemic As the pandemic subsides effective and transparent pandemic surveillance in the region would help boost demand from domestic and foreign sourcesmdashsuch as the arrival of foreign tourists Good governance in public investment decisions can raise the economic gains of public investment projects
Institutional reforms to improve governance and transparency can address the tradeoff between the short-term needs and long-term costs of public debt They can be implemented with limited fiscal costs They also hold the promise of boosting long-run growth Looking forward institutions might be the key to helping MENA build back better with or without fiscal consolidation
-4
-3
-2
-1
0
1
-2 -1 0 1 2 3
percent
-30
-20
-10
0
10
20
-3 -2 -1 0 1 2 3
Pre-emptive restructurings Post-default restructurings
percent
-3
Pre-emptive restructurings Post-default restructurings
MIDDLE EAST AND NORTH AFRICA REgION ECONOMIC UPDATE APRIL 2021
38
References
Ahuja Amrita Juan Camilo Castillo Michael Kremer Greg Larson and Jean Lee 2021 ldquoPurchasing Covid-19 Vaccines Analysis of Costs and Benefits for Africardquo mimeo
Apedo-Amah Marie Christine Besart Avdiu Xavier Cirera Marcio Cruz Elwyn Davies Arti Grover Leonardo Iacovone Umut Kilinc Denis Medvedev Franklin Okechukwu Maduko Stavros Poupakis Jesica Torres Trang Thu Tran 2020 ldquoUnmasking the Impact of COVID-19 on Businesses Firm Level Evidence from Across the Worldrdquo Policy Research Working Paper No 9434
Arellano-Bover Jaime Forthcoming ldquoThe Effect of Labor Market Conditions at Entry on Workersrsquo Long-Term Skillsrdquo The Review of Economics and Statistics
Arezki Rabah and Markus Bruckner 2011 Food prices and political instability IMF Working Papers 1-22
Arezki Rabah Lederman Daniel Harb Amani Abou Fan Rachel Yuting Nguyen Ha 2019 ldquoReforms and External Imbalances The Labor-Productivity Connection in the Middle East and North Africardquo Middle East and North Africa Economic Update (April) World Bank Washington DC
Arezki Rabah Ait Ali Slimane Meriem Barone Andrea Decker Klaus Detter Dag Fan Rachel Yuting Nguyen Ha Miralles Murciego Graciela Senbet Lemma 2020a ldquoReaching New Heights Promoting Fair Competition in the Middle East and North Africardquo Middle East and North Africa Economic Update (October) Washington DC World Bank
Arezki Rabah Lederman Daniel Abou Harb Amani El-Mallakh Nelly Fan Rachel Yuting Islam Asif Nguyen Ha Zouaidi Marwane 2020b ldquoHow Transparency Can Help the Middle East and North Africardquo Middle East and North Africa Economic Update (April) Washington DC World Bank
Arezki Rabah Moreno-Dodson Blanca Yuting Fan Rachel Gansey Romeo Nguyen Ha Cong Nguyen Minh Mottaghi Lili Tsakas Constantin Wood Christina 2020c Trading Together Reviving Middle East and North Africa Regional Integration in the Post-Covid Era Middle East and North Africa Economic Update October 2020
Asonuma Tamon and Christoph Trebesch 2016 Sovereign Debt Restructurings Preemptive or Post-default Journal of the European Economic Association 141 175-214
Auerbach Alan and Yuriy Gorodnichenko 2012 ldquoFiscal Multipliers in Recession and Expansionrdquo In Fiscal Policy after the Financial Crisis (pp 63-98) University of Chicago press
Azevedo Joao Pedro Amer Hasan Diana Goldemberg Syedah Aroob Iqbal and Koen Geven 2020 ldquoSimulating the Potential Impacts of COVID-19 School Closures on Schooling and Learning Outcomes A Set of Global Estimatesrdquo Policy Research Working Paper No 9284 World Bank Washington DC
Barro Robert 1974 Are Government Bonds Net Wealth Journal of Political Economy NovemberDecember 83 1095-117
R E F E R E N C E S
LIVINg wITH DEBT HOw INSTITUTIONS CAN CHART A PATH TO RECOVERY FOR THE MIDDLE EAST AND NORTH AFRICA
39
Barro Robert 1979 On the Determination of the Public Debt Journal of Political Economy 87(5) 940-971
Baldwin Richard and B Weder di Mauro 2020 ldquoMitigating the Covid Economic Crisis Act Fast and Do Whatever It Takesrdquo Voxeuorg eBook CEPR Press
Beaudry Paul and Tim Willems 2018 ldquoOn the Macroeconomic Consequences of Over Optimismrdquo NBER Working Paper No 24685 Cambridge MA National Bureau of Economic Research
Borensztein Eduardo and Ugo Panizza 2009 The costs of sovereign default IMF Staff Papers 564 683-741
Boskin Michael 2020 ldquoAre Large Deficits and Debt Dangerousrdquo AEA Papers and Proceedings 110 145-148
Bruno Michael and William Easterly 1998 ldquoInflation Crises and Long-run Growthrdquo Journal of Monetary Economics 41(1) pp 3-26
Bulir Aleš 2001 Income Inequality Does Inflation Matter IMF Staff papers 48 no 1 (2001) 139-159
Cady John 2005 Does SDDS Subscription Reduce Borrowing Costs for Emerging Market Economies IMF Staff Papers 52(3) 1-6
Carey Kevin and Wissam Harake 2017 ldquoUnited NationsmdashWorld Bank Prevention Study Chapter 7 Input Macroeconomic Environment and Policiesrdquo The World Bank
Cashin Paul Kamiar Mohaddes Maziar Raissi and Mehdi Raissi 2014 ldquoThe Differential Effects of Oil Demand and Supply Shocks on the Global Economyrdquo Energy Economics 44 113ndash134
Centers for Disease Control and Prevention ndash CDC 2020 Frequently Asked Questions Calculating Severe Acute Respiratory Syndrome Coronavirus 2 (SARS-CoV-2) RT-PCR Laboratory Test Percent Positivity
Choi Sangyup and Yuko Hashimoto 2018 Does Transparency Pay Evidence from IMF Data Transparency Policy Reforms and Emerging Market Sovereign Bond Spreads Journal of International Money and Finance vol 88(C) pages 171-190
Chudik Alexander Kamiar Mohaddes M Hashem Pesaran and Mehdi Raissi 2017 Is There a Debt-threshold effect on Output Growth Review of Economics and Statistics 99 (1) 135-150
Collier Paul 1999 ldquoOn the economic consequences of civil warrdquo Oxford Economic Papers 51(1) 168-183
Corral Paul amp Roberta Gatti 2020 Accumulation interrupted COVID-19 and human capital among the young Vox eBook Chapters in Simeon Djankov amp Ugo Panizza (ed) COVID-19 in Developing Economies edition 1 volume 1 chapter 1 pages 286-302 Centre for Economic Policy Research
Corsetti Giancarlo Andre Meier and Gernot J Muumlller 2012 ldquoWhat Determines Government Spending Multipliersrdquo Economic Policy 27(72) 521-565
CNBC 2021 Oil slides reversing early gains that pushed prices to highest level in more than a year March 7 2021 httpswwwcnbccom20210308brent-breaks-70-after-houthis-attack-saudi-arabias-oil-facilitieshtml
r
R E F E R E N C E S
MIDDLE EAST AND NORTH AFRICA REgION ECONOMIC UPDATE APRIL 2021
40
De Walque Damien Fred Friedman Roberta Gatti Aaditya Mattoo 2020 How Two Tests Can Help Contain COVID-19 and Revive the Economy Research amp Policy Briefs no 29 Washington DC
Del Granado Francisco Javier Arze David Coady and Robert Gillingham 2012 The Unequal Benefits of Fuel Subsidies A Review of Evidence for Developing Countries World Development 4011 (2012) 2234-2248
Devarajan Shantayanan Vinaya Swaroop and Heng-fu Zou 1996 ldquoThe Composition of Public Expenditure and Economic Growthrdquo Journal of Monetary Economics 37(2) 313-344
Demetriades Panicos and Kul B Luintel 1997 The Direct Costs of Financial Repression Evidence from India Review of Economics and Statistics 792 311-320
Easterly William and Stanley Fischer 2001 Inflation and the Poor Journal of Money Credit and Banking pp 160-178
Eberhardt Markus and Andrea F Presbitero 2015 Public debt and growth Heterogeneity and non-linearity Journal of International Economics 97 (1) 45-58
Eden Maya and Aart Kraay 2014 ldquoCrowding inrdquo and the Returns to Government Investment in Low-Income Countriesrdquo Policy Research Working Paper No 6781 The World Bank
European Central Bank 2021 Key ECB interest rates httpswwwecbeuropaeustatspolicy_and_exchange_rateskey_ecb_interest_rateshtmlindexenhtml
Fomby Thomas Yuki Ikeda and Norman V Loayza 2013 The Growth Aftermath of Natural Disasters Journal of Applied Econometrics 28 (3) 412-434
Frankel Jeffrey 2011 ldquoOver-optimism in Forecasts by Official Budget Agencies and Its Implicationsrdquo NBER Working Paper No 17239
Frankel Jeffrey Carlos A Veacutegh and Guillermo Vuletin 2013 On Graduation from Fiscal Procyclicality Journal of Development Economics 100 (1) 32-47
Gatti Roberta Diego Angel-Urdinola Joana Silva and Andraacutes Bodor 2014 ldquoStriving for Better Jobs The Challenge of Informality in the Middle East and North Africardquo Washington DC World Bank
Gentilini Ugo Mohamed Almenfi and Pamela Dale 2020 ldquoSocial Protection and Jobs Responses to Covid-19 A Real-Time Review of Country Measuresrdquo ldquoLiving paperrdquo version 14 (December 11 2020) The World Bank
Gupta Sumedha Kosali I Simon and Coady Wing 2020 Mandated and Voluntary Social Distancing During The Covid-19 Epidemic A Review NBER Working Papers 28139
Hall Robert 1978 Stochastic Implications of the Life Cycle-Permanent Income Hypothesis Theory and Evidence Journal of Political Economy 866 971-987
R E F E R E N C E S
LIVINg wITH DEBT HOw INSTITUTIONS CAN CHART A PATH TO RECOVERY FOR THE MIDDLE EAST AND NORTH AFRICA
41
Heckman James J Seong Hyeok Moon Rodrigo Pinto Peter A Savelyev and Adam Yavitz 2010 The rate of return to the HighScope Perry Preschool Program Journal of Public Economics 94 no 1-2 114-128
Horn Sebastian Carmen M Reinhart and Christoph Trebesch 2019 Chinarsquos overseas lending National Bureau of Economic Research Working Paper w26050
Huidrom Raju M Ayhan Kose James Lim and Franziska L Ohnsorge 2020 Why do Fiscal Multipliers depend on Fiscal Positions Journal of Monetary Economics Elsevier vol 114(C) pages 109-125
Ilzetzki Ethan Enrique Mendoza and Carlos Veacutegh 2013 ldquoHow Big (Small) Are Fiscal Multipliersrdquo Journal of Monetary Economics 60(2) 239-254
Integrated Food Security Phase Classification (IPC) 2020 Yemen Integrated Food Insecurity Phase Classification Snapshot- October 2020- June 2021
International Monetary Fund (IMF) 2013 ldquoStaff Guidance Note for Public Debt Sustainability Analysis in Market-Access Countriesrdquo
mdashmdashmdash2017 ldquoGuidance note on the Bank-Fund Debt Sustainability Framework for Low Income Countriesrdquo
mdashmdashmdash2021 ldquoPolicy Responses to Covid-19rdquo httpswwwimforgenTopicsimf-and-covid19Policy-Responses-to-COVID-19
Islam Roumeen 2006 ldquoDoes More Transparency Go along with Better Governancerdquo Economics and Politics 18 (2)121ndash67
Izquierdo Alejandro Ruy E Lama Juan Pablo Medina Jorge P Puig Daniel Riera-Crichton Carlos A Veacutegh and Guillermo Vuletin 2019 ldquoIs the Public Investment Multiplier Higher in Developing Countries An Empirical Investigationrdquo NBER Working Paper No 26478
Joumard Isabelle Mauro Pisu and Debbie Bloch 2012 ldquoTackling income inequality The role of taxes and transfersrdquo OECD Journal Economic Studies
Kaminsky Graciela L Carmen Reinhart and Carlos Veacutegh 2004 When It Rains It Pours Procyclical Capital Flows and Macroeconomic Policies NBER Macroeconomics Annual 19 11-53
Krugman Paul 2020 ldquoThings Will Get Better Seriouslyrdquo New York Times December 31 2020
Kubota Megumi and Albert Zeufack 2020 ldquoAssessing the Returns on Investment in Data Openness and Transparencyrdquo Policy Research Working Paper WPS 9136 Washington DC World Bank Group
Lederman Daniel and Claudio Rojas 2018 ldquoThree Macroeconomic Trends Around the Onset of Armed Conflict in Developing Economiesrdquo Policy Research Working Paper No WPS 8647 The World Bank
Leduc Sylvain and Daniel Wilson 2013 Roads to Prosperity or Bridges to Nowhere Theory and Evidence on the Impact of Public Infrastructure Investment NBER Macroeconomics Annual 27 no 1 89-142
R E F E R E N C E S
MIDDLE EAST AND NORTH AFRICA REgION ECONOMIC UPDATE APRIL 2021
42
Lee Don 2020 Vaccinesrsquo Rollout and Pent-up Consumer Demand Brighten US Economic Outlook December 16 2020 httpswwwlatimescompoliticsstory2020-12-16rollout-of-vaccines-and-pent-up-demand-brighten-u-s-economic-outlook
Mahdavi Saeid 2004 ldquoShifts in the Composition of Government Spending in Response to External Debt Burdenrdquo World Development 32(7) 1139-1157
McKinnon Ronald I 1973 Money and Capital in Economic Development Brooking Institution Press
Maloney William and Temel Taskin 2020 ldquoDeterminants of Social Distancing and Economic Activity during Covid-19 A Global Viewrdquo Policy Research Working Paper No 9242 World Bank Washington DC
Mohammed Nadir Djibrilla Issa and Aminur Rahman 2021 ldquoWhy the COVID-19 impact on Firms in MENA differ from other regionsrdquo Asharq Bloomberg
Murdoch James and Todd Sandler 2002 ldquoEconomic Growth Civil Wars and Spatial Spilloversrdquo Journal of Conflict Resolution 46(1) 91-110
Murdoch James and Todd Sandler 2004 Civil Wars and Economic Growth Spatial Dispersion American Journal of Political Science 48 (1) 138-151
National Public Radio (NPR) 2011 ldquoThe Impact of Rising Food Prices on Arab Unrestrdquo February 18 2011
Obstfeld Maurice and Kenneth Rogoff 1995 The Intertemporal Approach to the Current Account Handbook of International Economics 3 1731-1799
Poterba James M and Lawrence H Summers 1987 Finite Lifetimes and the Effects of Budget Deficits on National Saving Journal of Monetary Economics 202 369-391
Portes Jonathan 2020 ldquoThe Lasting Scars of the Covid-19 Crisis Channels and Impactsrdquo VoxEU Blog httpsvoxeuorgarticlelasting-scars-covid-19-crisis
Psacharopoulos George and Harry Anthony Patrinos 2018 ldquoReturns to Investment in Education A Decennial Review of the Global Literaturerdquo Education Economics 265 445-458
Rafiq Shudhasattwa Pasquale Sgro and Nicholas Apergis 2016 Asymmetric Oil Shocks and External Balances of Major Oil Exporting and Importing Countries Energy Economics 56 42ndash50
Ramey Valerie 2011 ldquoIdentifying Government Spending Shocks Its All in the Timingrdquo The Quarterly Journal of Economics 126(1) 1-50
Ramey Valerie 2019 Ten Years after the Financial Crisis What Have We Learned from the Renaissance in Fiscal Research Journal of Economic Perspectives 332 89-114
R E F E R E N C E SR E F E R E N C E S
LIVINg wITH DEBT HOw INSTITUTIONS CAN CHART A PATH TO RECOVERY FOR THE MIDDLE EAST AND NORTH AFRICA
43
Ramey Valerie 2020 ldquoThe Macroeconomic Consequences of Infrastructure Investmentrdquo National Bureau of Economic Research Working Paper 27625
Ready Robert 2018 ldquoOil Prices and the Stock Marketrdquo Review of Finance 155ndash176
Reed Tristan William Waites David Manheim Damien de Walque Chiara Vallini Roberta Gatti Timothy Hallett 2021 ldquoFive Ways that COVID-19 Diagnostics Can Save Lives Prioritizing Uses of Tests to Maximize Cost-Effectivenessrdquo Research and Policy Brief No 43 World Bank Washington DC
Reinhart Carmen 2015 The Hidden Debt Burden of Emerging Markets Project Syndicate October 9 2015
Reinhart Carmen M and Kenneth S Rogoff 2010 Growth in a Time of Debt American Economic Review Papers and Proceedings 1002 573-78
Reinhart Carmen Vincent Reinhart and Kenneth Rogoff 2012 ldquoPublic Debt Overhangs Advanced Economy Episodes Since 1800rdquo Journal of Economic Perspectives 26(3) 69-86
Reinhart Carmen and Kenneth Rogoff 2009 This Time is Different Eight Centuries of Financial Folly Princeton University Press
Reinhart Carmen and Belen Sbrancia 2015 The Liquidation of Government Debt Economic Policy 3082 291-333
Reinhart Carmen Kenneth S Rogoff and Miguel A Savastano 2003 ldquoDebt Intolerancerdquo Brookings Papers on Economic Activity 11-62
Riera-Crichton Daniel Carlos A Vegh and Guillermo Vuletin 2015 ldquoProcyclical and Countercyclical Fiscal Multipliers Evidence from OECD countriesrdquo Journal of International Money and Finance 52 15-31
Romer Cristina D and David H Romer 2010 ldquoThe Macroeconomic Effects of Tax Changes Estimates Based on a New Measure of Fiscal Shocksrdquo American Economic Review 100(3) 763-801
Roubini Nouriel and Xavier Sala-i-Martin 1992 Financial Repression and Economic Growth Journal of Development Economics 391 (1992) 5-30
Schlegl Matthias Christoph Trebesch and Mark LJ Wright 2019 The Seniority Structure of Sovereign Debt NBER Working Papers 25793 National Bureau of Economic Research Inc
United Nations Conference on Trade and Development - UNCTAD 2020 Global Trade Update October 2020
mdashmdashmdash 2021 Global Trade Update February 2021
United States Environmental Protection Agency- USEPA 2011 The Benefits and Costs of the Clean Air Act from 1990 to 2020
Veacutegh Carlos Daniel Lederman and Federico Bennet 2017 ldquoLeaning against the Wind Fiscal Policy in Latin America and the Caribbean in a Historical Perspectiverdquo LAC Semiannual Report (April) Washington DC World Bank
R E F E R E N C E S
MIDDLE EAST AND NORTH AFRICA REgION ECONOMIC UPDATE APRIL 2021
44
Veacutegh Carlos Guillermo Vuletin Daniel Riera-Crichton Diego Friedheim Luis Morano and Joseacute Andreacutee Camarena 2018 ldquoFiscal Adjustment in Latin America and the Caribbean Short-Run Pain Long-Run Gainrdquo LAC Semiannual Report (April) World Bank Washington DC
Washington Post 2015 ldquoWhere and Why Food Prices Lead to Social Upheavalrdquo February 22 2015
Williams Andrew 2009 ldquoOn the Release of Information by Governments Causes and Consequencesrdquo Journal of Development Economics 89 124ndash38
World Bank 2016 MoroccomdashIdentity and Targeting for Social Protection Project (English) Washington DCWorld Bank Group httpdocumentsworldbankorgcurateden298251489370445157Morocco-Identity-and-Targeting-for-Social-Protection-Project
mdashmdashmdash 2014 Unlocking the Employment Potential in the Middle East and North Africa
mdashmdashmdash2019 Understanding Poverty and Inequality in Egypt World Bank Washington DC
mdashmdashmdash 2020a Lebanon Economic Monitor Fall 2020 The Deliberate Depression World Bank Washington DC
mdashmdashmdash2020b Covid-19 Debt Service Suspension Initiative httpswwwworldbankorgentopicdebtbriefcovid-19-debt-service-suspension-initiative
World Bank 2020c The Human Capital Index 2020 Update Human Capital in the Time of COVID-19 World Bank Washington DC
mdashmdashmdashand IMF 2020 Djibouti Joint World Bank-IMF Debt Sustainability Analysis httpdocuments1worldbankorgcurateden649601596487780040pdfDjibouti-Joint-World-Bank-IMF-Debt-Sustainability-Analysispdf
R E F E R E N C E S
LIVINg wITH DEBT HOw INSTITUTIONS CAN CHART A PATH TO RECOVERY FOR THE MIDDLE EAST AND NORTH AFRICA
45
R E F E R E N C E S
Appendix
Appendix A1 Debt and Output Growth After Natural Disasters
Epidemics are not new to modern societies According to the Centre for Research on the Epidemiology of Disasters and its Emergency Events Database (EM-DAT) between 1900 and 2020 the world has had 15563 natural disasters of which 1492 were epidemics making them the fourth most common natural disaster after floods storms and earthquakes (see Figure A11)26 Our objective is to estimate the impact that natural disasters of large magnitude like the Covid-19 pandemic have on public debt and GDP growth in developing economies27 To achieve this our empirical strategy is based on a difference-in-difference estimator
Data
Data on natural disasters are from EM-DAT The pool of natural disasters included in EM-DAT fulfils at least one of the following outcomes in the country affected 10 or more people dead or 100 or more people affected or a declaration of a state of emergency or a call for international assistance
Since we are interested in analyzing macroeconomic trends in developing countries all developed countries (identified by the World Bankrsquos Historical Income Classification in 1987) have been excluded from the analysis If a country was created after 1987 its classification is based on the income classification the year it was created The final sample has 142 countries
Not all disasters generate damages large enough to change the macroeconomic dynamics of a country To filter events with discernable macroeconomic effects our research weights the magnitude of the damages produced by a disaster by the overall size of the economy of the affected country More specifically our econometric analysis focuses on natural disasters of high intensity that generated damages that are equivalent to at least 1 percent of the GDP of the country affected that year (based on the total estimated damages reported by EM-DAT28) Using those filters we end up with 324 natural disasters that occurred in 90 developing countries between 1960 and 2019 They include flood earthquake droughts storm landslide volcanic activity extreme temperature and wildfire
We rely on two macroeconomic indicators The first GDP annual growth comes from the World Bankrsquos World Development Indicators The second comes from the IMFrsquos Global Debt Database (GDD) Central Government Debt
26 According to the EM-DAT database from the 691 catastrophes registered for Middle East and North Africa Region between 1900 and 2020 the most common natural disasters are floods (323 episodes 467 percent of the total) earthquakes (167 episodes 242 percent) storms (72 episodes 104 percent) and epidemics (39 episodes 56 percent)
27 Our question is close to Fomby and others (2013) although their study does not examine debt28 According to EM-DAT this is a value of all damages and economic losses directly or indirectly related to the disaster
FIGURE A11 Natural Disasters 1900-2020
Flood34
Storm28
Earthquake10
Epidemic9
Landslide5
Drought5
Others2
Wildfire3
Ext Temp4
Source World Banks staff calculations based on EM-DAT database
A P P E N D I X
MIDDLE EAST AND NORTH AFRICA REgION ECONOMIC UPDATE APRIL 2021
46
Econometric strategy
Results
1
To systematically analyze the macroeconomic impacts of natural disasters in developing economies we rely on a
difference-in-difference estimator This method estimates the effect of a treatment (the onset of a natural disaster)
on an outcome (GDP growth and public debt accumulation) This is done by comparing the average change over
time of these variables for the treatment group (economies affected by a natural disaster) with the average change
over time for the control group (non-affected economies)
The econometric strategy that aims to identify these potential effects is the following difference-in-difference
estimator
= $ +micro + micro + amp(amp + )(++-012134 + 5
The subscripts c and t denote countries and event years respectively represents the macroeconomic variable
of interest (GDP growth annual percent Debt growth annual percent) The inclusion of country fixed effects (micro) along with time fixed effects (micro) implies that we will be comparing within-country macroeconomic trends of
affected economies and non-affected economies during each year in the sample
(amp is a dummy variable that identifies the year of the onset of a disaster $ represents the constant term and 5 is the error term is the coefficient of interest to be estimated which we allow to vary over the course of the
episodes of natural disasters The subscript n denotes the duration of each episode covering as mentioned above
seven years around the onset of disasters Therefore n ranges from -3 to +3 This setup implies that we are tracing
pre-disaster trends as well as post-onset trends which allows for inferences about whether the differential trends
if any predate the onset of a natural disaster Additional controls in the regression include -012134 which
is a control for the number of natural disasters during the previous six years that cause damages that cost more
than 1 percent of GDP and in the regression for public debt (+ which is the annual change in GDP We
clustered the errors at the country level
Results
Figure II1 plots the coefficients for the estimated mean differences between countries affected by natural disasters
that generated damages of at least 1 percent of their GDP and the contemporaneous control group of non-affected
countries for public debt and GDP growth The double asterisks highlight the coefficient estimates that are
statistically significant at the 10 percent level Both figures analyze the same 324 natural disasters
Debt growth significantly increases in countries affected by natural disasters that generated damages of at least 1
percent of their GDP relative to those countries who did not experience such natural disasters (see Figure II1) GDP
growth is higher in the post-disaster period in countries affected by large natural disasters relative to those
countries who did not experience them In the year of the disaster GDP growth in affected economies is significantly
lower relative to the control group But GDP growth is 09 higher in the first year after the onset of a high intensity
natural disaster and 083 percentage points higher in the second year in affected counties relative to non-affected
countries In sum although natural disasters that generated damages of at least 1 percent of a countryrsquos GDP cause
a strong economic contraction in the year they occur GDP tends to bounce back the three years following the
event reaching a rate of growth that is on average almost one percentage point higher than in non-affected
economies
1
To systematically analyze the macroeconomic impacts of natural disasters in developing economies we rely on a
difference-in-difference estimator This method estimates the effect of a treatment (the onset of a natural disaster)
on an outcome (GDP growth and public debt accumulation) This is done by comparing the average change over
time of these variables for the treatment group (economies affected by a natural disaster) with the average change
over time for the control group (non-affected economies)
The econometric strategy that aims to identify these potential effects is the following difference-in-difference
estimator
= $ +micro + micro + amp(amp + )(++-012134 + 5
The subscripts c and t denote countries and event years respectively represents the macroeconomic variable
of interest (GDP growth annual percent Debt growth annual percent) The inclusion of country fixed effects (micro) along with time fixed effects (micro) implies that we will be comparing within-country macroeconomic trends of
affected economies and non-affected economies during each year in the sample
(amp is a dummy variable that identifies the year of the onset of a disaster $ represents the constant term and 5 is the error term is the coefficient of interest to be estimated which we allow to vary over the course of the
episodes of natural disasters The subscript n denotes the duration of each episode covering as mentioned above
seven years around the onset of disasters Therefore n ranges from -3 to +3 This setup implies that we are tracing
pre-disaster trends as well as post-onset trends which allows for inferences about whether the differential trends
if any predate the onset of a natural disaster Additional controls in the regression include -012134 which
is a control for the number of natural disasters during the previous six years that cause damages that cost more
than 1 percent of GDP and in the regression for public debt (+ which is the annual change in GDP We
clustered the errors at the country level
Results
Figure II1 plots the coefficients for the estimated mean differences between countries affected by natural disasters
that generated damages of at least 1 percent of their GDP and the contemporaneous control group of non-affected
countries for public debt and GDP growth The double asterisks highlight the coefficient estimates that are
statistically significant at the 10 percent level Both figures analyze the same 324 natural disasters
Debt growth significantly increases in countries affected by natural disasters that generated damages of at least 1
percent of their GDP relative to those countries who did not experience such natural disasters (see Figure II1) GDP
growth is higher in the post-disaster period in countries affected by large natural disasters relative to those
countries who did not experience them In the year of the disaster GDP growth in affected economies is significantly
lower relative to the control group But GDP growth is 09 higher in the first year after the onset of a high intensity
natural disaster and 083 percentage points higher in the second year in affected counties relative to non-affected
countries In sum although natural disasters that generated damages of at least 1 percent of a countryrsquos GDP cause
a strong economic contraction in the year they occur GDP tends to bounce back the three years following the
event reaching a rate of growth that is on average almost one percentage point higher than in non-affected
economies A P P E N D I X
LIVINg wITH DEBT HOw INSTITUTIONS CAN CHART A PATH TO RECOVERY FOR THE MIDDLE EAST AND NORTH AFRICA
47
Appendix A2 Oil Shocks and MENArsquos Creditworthiness
1
To systematically analyze the macroeconomic impacts of natural disasters in developing economies we rely on a
difference-in-difference estimator This method estimates the effect of a treatment (the onset of a natural disaster)
on an outcome (GDP growth and public debt accumulation) This is done by comparing the average change over
time of these variables for the treatment group (economies affected by a natural disaster) with the average change
over time for the control group (non-affected economies)
The econometric strategy that aims to identify these potential effects is the following difference-in-difference
estimator
= $ +micro + micro + amp(amp + )(++-012134 + 5
The subscripts c and t denote countries and event years respectively represents the macroeconomic variable
of interest (GDP growth annual percent Debt growth annual percent) The inclusion of country fixed effects (micro) along with time fixed effects (micro) implies that we will be comparing within-country macroeconomic trends of
affected economies and non-affected economies during each year in the sample
(amp is a dummy variable that identifies the year of the onset of a disaster $ represents the constant term and 5 is the error term is the coefficient of interest to be estimated which we allow to vary over the course of the
episodes of natural disasters The subscript n denotes the duration of each episode covering as mentioned above
seven years around the onset of disasters Therefore n ranges from -3 to +3 This setup implies that we are tracing
pre-disaster trends as well as post-onset trends which allows for inferences about whether the differential trends
if any predate the onset of a natural disaster Additional controls in the regression include -012134 which
is a control for the number of natural disasters during the previous six years that cause damages that cost more
than 1 percent of GDP and in the regression for public debt (+ which is the annual change in GDP We
clustered the errors at the country level
Results
Figure II1 plots the coefficients for the estimated mean differences between countries affected by natural disasters
that generated damages of at least 1 percent of their GDP and the contemporaneous control group of non-affected
countries for public debt and GDP growth The double asterisks highlight the coefficient estimates that are
statistically significant at the 10 percent level Both figures analyze the same 324 natural disasters
Debt growth significantly increases in countries affected by natural disasters that generated damages of at least 1
percent of their GDP relative to those countries who did not experience such natural disasters (see Figure II1) GDP
growth is higher in the post-disaster period in countries affected by large natural disasters relative to those
countries who did not experience them In the year of the disaster GDP growth in affected economies is significantly
lower relative to the control group But GDP growth is 09 higher in the first year after the onset of a high intensity
natural disaster and 083 percentage points higher in the second year in affected counties relative to non-affected
countries In sum although natural disasters that generated damages of at least 1 percent of a countryrsquos GDP cause
a strong economic contraction in the year they occur GDP tends to bounce back the three years following the
event reaching a rate of growth that is on average almost one percentage point higher than in non-affected
economies
2
Appendix A2 Oil Shocks and MENArsquos Creditworthiness
We adopt the methodology followed by Ready (2018) to decompose oil shocks into supply and demand shocks
This decomposition allows us to examine the impact of both oil supply and demand shocks at daily frequency
Ready (2018) classifies and decomposes three types of oil shocks
Demand shocks the residuals of a contemporaneous regression where returns on the global index of oil producing
firms are regressed against unexpected changes in the log of VIX index (that is the uncertainty index)
Supply shocks the residuals of a contemporaneous regression where changes in oil prices are regressed against
demand shocks and unexpected changes in the VIX index
Risk shocks After obtaining oil supply and demand shocks we adopt a conventual model setup in the literature
to examine the impact of oil shocks on sovereign default risk measured by credit default swaps (CDS)
∆-(8 =$ + (∆-(8( +9)(lt8=gt-( +9+A(
-(+
amp
-(
B(30CD( +)8EFF( +G
where ΔCDSit is the daily change in sovereign CDS spread of countries denoted by i over days denoted by t
DOMESTICjit-1 contains the set of domestic control variables the daily return on each countryrsquos stock market (St
Return) and the daily change in the exchange rate of each countryrsquos currency against the US dollar (ΔFX Rate)
GLOBALjt-1 is the set of global control variables the daily change in the Chicago Board Options Exchange volatility
index (ΔVIX ) the daily SampP 500 index return (SampP500 Return) the daily change in the German 10-year Bond yield
(ΔGerman Bond) the daily change in the effective Federal Funds rate (ΔFedFund) the daily change in the European
Repo rate (ΔEuro Repo) and the daily change in the 10-year US Treasury yield (ΔTreasury) Demandt-1 is the one-
day lagged shock to the demand side of oil and Supplyt-1 is the one-day lagged shock to the supply side of oil
both shocks constructed as in Ready (2018) Exporti is an invariant dummy variable that takes the value of 1 if a
country is net oil-exporter at the beginning of the sample period and 0 otherwise Year2020 is a dummy variable
that takes the value one in days of year 2020 and zero otherwise The sample period is from January 2016 to
October 2020 Countries included in the analysis are MENA oil exporters Algeria Bahrain Iraq Kuwait Oman
Qatar Saudi Arabia and United Arab Emirates (Abu Dhabi and Dubai) and oil importers Egypt Morocco and
Tunisia The impact of oil shocks may differ based on the energy status of a country (Cashin et al 2014 Rafiq et
al 2016) Table A21 shows the baseline results for our analysis
Appendix A3 Debt and Output Growth Around Restructurings
To understand the impact of restructurings on external debt and GDP growth in developing economies we
studied the restructuring dataset constructed first by Asonuma and Trebesch (2016)
Data on restructurings
Asonuma and Trebesch (2016) provide information on the occurrence and duration of 204 restructurings globally
starting in 1978 197 of which have been completed The cases are further differentiated into two categories
preemptive restructurings and post-default restructurings In preemptive restructurings governments renegotiate
A P P E N D I X
MIDDLE EAST AND NORTH AFRICA REgION ECONOMIC UPDATE APRIL 2021
48
TABLE A21 Impacts of Global Factors and Oil Shocks on MENArsquos Credit Default Swaps
Dependent variable ΔCDSit Estimated Coefficients
ΔCDSit-1
00133
(00101)
St Returnit-1
00707
(0480)
ΔFX Rateit-1
-4620
(6089)
ΔVIXt-1
-0158
(00848)
SampP500 Returnt-1
-0492
(0165)
ΔGerman Bondt-1
9513
(3774)
ΔFedFundt-1
-2138
(2399)
ΔEuro Repot-1
7070
(7248)
ΔTreasuryt-1
0141
(3081)
Demandt-1
-0158
(0163)
Supplyt-1
000538
(0110)
Supplyt-1
Exporti
-0281
(0137)
Demandt-1
Exporti
0147
(0197)
Year20201103
(0343)
Supplyt-1
Year2020-0318
(0129)
Demandt-1
Year20200518
(0203)
Supplyt-1
ExportiYear2020
0369
(0163)
Demandt-1
ExportiYear2020
-0985
(0247)
Demandt-1
ExportiYear2020
-0477
(0101)
A P P E N D I X
LIVINg wITH DEBT HOw INSTITUTIONS CAN CHART A PATH TO RECOVERY FOR THE MIDDLE EAST AND NORTH AFRICA
49
Demandt-1
Exporti
-0010
(0123)
Supplyt-1 Export
iYear2020
-0224
(056)
Supplyt-1
Exporti
-0276
(0083)
Demandt-1
ImportiYear20200360
(0129)
Demandt-1
ImportiYear2020-0312
(0068)
Constant-0183
(0253)
Country Effects Yes
Year Effects Yes
Observations 9999
R-squared 0012
Number of Countries 12
Appendix A3 Debt and Output Growth Around Restructurings
Data on restructurings
2
Appendix A2 Oil Shocks and MENArsquos Creditworthiness
We adopt the methodology followed by Ready (2018) to decompose oil shocks into supply and demand shocks
This decomposition allows us to examine the impact of both oil supply and demand shocks at daily frequency
Ready (2018) classifies and decomposes three types of oil shocks
Demand shocks the residuals of a contemporaneous regression where returns on the global index of oil producing
firms are regressed against unexpected changes in the log of VIX index (that is the uncertainty index)
Supply shocks the residuals of a contemporaneous regression where changes in oil prices are regressed against
demand shocks and unexpected changes in the VIX index
Risk shocks After obtaining oil supply and demand shocks we adopt a conventual model setup in the literature
to examine the impact of oil shocks on sovereign default risk measured by credit default swaps (CDS)
∆-(8 =$ + (∆-(8( +9)(lt8=gt-( +9+A(
-(+
amp
-(
B(30CD( +)8EFF( +G
where ΔCDSit is the daily change in sovereign CDS spread of countries denoted by i over days denoted by t
DOMESTICjit-1 contains the set of domestic control variables the daily return on each countryrsquos stock market (St
Return) and the daily change in the exchange rate of each countryrsquos currency against the US dollar (ΔFX Rate)
GLOBALjt-1 is the set of global control variables the daily change in the Chicago Board Options Exchange volatility
index (ΔVIX ) the daily SampP 500 index return (SampP500 Return) the daily change in the German 10-year Bond yield
(ΔGerman Bond) the daily change in the effective Federal Funds rate (ΔFedFund) the daily change in the European
Repo rate (ΔEuro Repo) and the daily change in the 10-year US Treasury yield (ΔTreasury) Demandt-1 is the one-
day lagged shock to the demand side of oil and Supplyt-1 is the one-day lagged shock to the supply side of oil
both shocks constructed as in Ready (2018) Exporti is an invariant dummy variable that takes the value of 1 if a
country is net oil-exporter at the beginning of the sample period and 0 otherwise Year2020 is a dummy variable
that takes the value one in days of year 2020 and zero otherwise The sample period is from January 2016 to
October 2020 Countries included in the analysis are MENA oil exporters Algeria Bahrain Iraq Kuwait Oman
Qatar Saudi Arabia and United Arab Emirates (Abu Dhabi and Dubai) and oil importers Egypt Morocco and
Tunisia The impact of oil shocks may differ based on the energy status of a country (Cashin et al 2014 Rafiq et
al 2016) Table A21 shows the baseline results for our analysis
Appendix A3 Debt and Output Growth Around Restructurings
To understand the impact of restructurings on external debt and GDP growth in developing economies we
studied the restructuring dataset constructed first by Asonuma and Trebesch (2016)
Data on restructurings
Asonuma and Trebesch (2016) provide information on the occurrence and duration of 204 restructurings globally
starting in 1978 197 of which have been completed The cases are further differentiated into two categories
preemptive restructurings and post-default restructurings In preemptive restructurings governments renegotiate
2
Appendix A2 Oil Shocks and MENArsquos Creditworthiness
We adopt the methodology followed by Ready (2018) to decompose oil shocks into supply and demand shocks
This decomposition allows us to examine the impact of both oil supply and demand shocks at daily frequency
Ready (2018) classifies and decomposes three types of oil shocks
Demand shocks the residuals of a contemporaneous regression where returns on the global index of oil producing
firms are regressed against unexpected changes in the log of VIX index (that is the uncertainty index)
Supply shocks the residuals of a contemporaneous regression where changes in oil prices are regressed against
demand shocks and unexpected changes in the VIX index
Risk shocks After obtaining oil supply and demand shocks we adopt a conventual model setup in the literature
to examine the impact of oil shocks on sovereign default risk measured by credit default swaps (CDS)
∆-(8 =$ + (∆-(8( +9)(lt8=gt-( +9+A(
-(+
amp
-(
B(30CD( +)8EFF( +G
where ΔCDSit is the daily change in sovereign CDS spread of countries denoted by i over days denoted by t
DOMESTICjit-1 contains the set of domestic control variables the daily return on each countryrsquos stock market (St
Return) and the daily change in the exchange rate of each countryrsquos currency against the US dollar (ΔFX Rate)
GLOBALjt-1 is the set of global control variables the daily change in the Chicago Board Options Exchange volatility
index (ΔVIX ) the daily SampP 500 index return (SampP500 Return) the daily change in the German 10-year Bond yield
(ΔGerman Bond) the daily change in the effective Federal Funds rate (ΔFedFund) the daily change in the European
Repo rate (ΔEuro Repo) and the daily change in the 10-year US Treasury yield (ΔTreasury) Demandt-1 is the one-
day lagged shock to the demand side of oil and Supplyt-1 is the one-day lagged shock to the supply side of oil
both shocks constructed as in Ready (2018) Exporti is an invariant dummy variable that takes the value of 1 if a
country is net oil-exporter at the beginning of the sample period and 0 otherwise Year2020 is a dummy variable
that takes the value one in days of year 2020 and zero otherwise The sample period is from January 2016 to
October 2020 Countries included in the analysis are MENA oil exporters Algeria Bahrain Iraq Kuwait Oman
Qatar Saudi Arabia and United Arab Emirates (Abu Dhabi and Dubai) and oil importers Egypt Morocco and
Tunisia The impact of oil shocks may differ based on the energy status of a country (Cashin et al 2014 Rafiq et
al 2016) Table A21 shows the baseline results for our analysis
Appendix A3 Debt and Output Growth Around Restructurings
To understand the impact of restructurings on external debt and GDP growth in developing economies we
studied the restructuring dataset constructed first by Asonuma and Trebesch (2016)
Data on restructurings
Asonuma and Trebesch (2016) provide information on the occurrence and duration of 204 restructurings globally
starting in 1978 197 of which have been completed The cases are further differentiated into two categories
preemptive restructurings and post-default restructurings In preemptive restructurings governments renegotiate
3
with lenders while they are still current on their loan payments In post-default restructurings governments
unilaterally default then start to renegotiate their debt Among the 197 finished restructurings 81 were
preemptive and 116 were post-default Many countries have multiple restructurings Among 74 countries that had
completed restructurings five are from MENA region
To analyze the macroeconomic impact of restructurings before during and after the restructurings started we
apply an event study approach transforming calendar years into event years We focus on the three years before
the year of the onset and the three years after a restructuring (analyzing seven years in total) In this new timeline
year zero corresponds to the year a restructuring began As in Appendix A1 our sample is all countries not classified
as a high-Income in 1987 in the World Bankrsquos Historical Income Classification dataset
Data on GDP growth and external debt
The two outcome variables are annual growth in real GDP and the annual growth rate of the external debt in US
dollars Both are from the IMFrsquos World Economic Outlook (October 2020) with data starting from 1981 By
focusing on the change of external debt level the difference-in-difference estimator can show the differential
level of acceleration of debt accumulation between affected and non-affected countries in the years before
during and after restructuring started
Econometric strategy
To systematically analyze the macroeconomic impacts of restructurings in developing economies we rely on a
difference-in-difference estimator (similar to the approach Appendix A1) The baseline econometric strategy that
aims to identify these potential effects is the following difference-in-difference estimator
= $ + H + H + I + 9 ampamp
(
amp-++ 9 A +
+
-(5
where represents the macroeconomic variable of interest (annual growth of real GDP and annual growth of
debt level) of country c at year t H is the country fixed effects H is year fixed effects I is a dummy variable
that takes the value of 1 for the onset of restructuring years that is the first year of the restructuring and 0
otherwise n is the number of years before the first year of restructuring (going from 3 years before the default (-
3-2-1) amp is a dummy variable that takes a value of 1 if it is n year before the restructuring and 0 otherwise m
is the number of years after the first year of restructuring (going from 1 to 3 years after the first year of
restructuring (123) A is a dummy variable that takes a value of 1 if it is m years after the onset of restructuring
and 0 otherwise The coefficients of interests are (what happens when restructuring starts) β (n=1 to 3) what
happens 3 years before the restructuring (m=1 to 3) what happens after restructuring starts
To control for overlapping events we have added frequency indicators in all regressions For each of the seven
years on the timeline there are three different counts (1) how many windows of three years before a restructuring
overlap with that specific year (2) how many events starts on the same year and (3) how many windows of three
years after a restructuring overlap with that specific year These construct three counts for each year on the
timeline of an event resulting in a total of 21 variables
In an extension to see if the macroeconomics respond differently to preemptive restructurings and post-default
restructurings we extended the baseline regression with a different set of dummies between the two categories
A P P E N D I X
MIDDLE EAST AND NORTH AFRICA REgION ECONOMIC UPDATE APRIL 2021
50
Data on GDP growth and external debt
Econometric strategy
3
with lenders while they are still current on their loan payments In post-default restructurings governments
unilaterally default then start to renegotiate their debt Among the 197 finished restructurings 81 were
preemptive and 116 were post-default Many countries have multiple restructurings Among 74 countries that had
completed restructurings five are from MENA region
To analyze the macroeconomic impact of restructurings before during and after the restructurings started we
apply an event study approach transforming calendar years into event years We focus on the three years before
the year of the onset and the three years after a restructuring (analyzing seven years in total) In this new timeline
year zero corresponds to the year a restructuring began As in Appendix A1 our sample is all countries not classified
as a high-Income in 1987 in the World Bankrsquos Historical Income Classification dataset
Data on GDP growth and external debt
The two outcome variables are annual growth in real GDP and the annual growth rate of the external debt in US
dollars Both are from the IMFrsquos World Economic Outlook (October 2020) with data starting from 1981 By
focusing on the change of external debt level the difference-in-difference estimator can show the differential
level of acceleration of debt accumulation between affected and non-affected countries in the years before
during and after restructuring started
Econometric strategy
To systematically analyze the macroeconomic impacts of restructurings in developing economies we rely on a
difference-in-difference estimator (similar to the approach Appendix A1) The baseline econometric strategy that
aims to identify these potential effects is the following difference-in-difference estimator
= $ + H + H + I + 9 ampamp
(
amp-++ 9 A +
+
-(5
where represents the macroeconomic variable of interest (annual growth of real GDP and annual growth of
debt level) of country c at year t H is the country fixed effects H is year fixed effects I is a dummy variable
that takes the value of 1 for the onset of restructuring years that is the first year of the restructuring and 0
otherwise n is the number of years before the first year of restructuring (going from 3 years before the default (-
3-2-1) amp is a dummy variable that takes a value of 1 if it is n year before the restructuring and 0 otherwise m
is the number of years after the first year of restructuring (going from 1 to 3 years after the first year of
restructuring (123) A is a dummy variable that takes a value of 1 if it is m years after the onset of restructuring
and 0 otherwise The coefficients of interests are (what happens when restructuring starts) β (n=1 to 3) what
happens 3 years before the restructuring (m=1 to 3) what happens after restructuring starts
To control for overlapping events we have added frequency indicators in all regressions For each of the seven
years on the timeline there are three different counts (1) how many windows of three years before a restructuring
overlap with that specific year (2) how many events starts on the same year and (3) how many windows of three
years after a restructuring overlap with that specific year These construct three counts for each year on the
timeline of an event resulting in a total of 21 variables
In an extension to see if the macroeconomics respond differently to preemptive restructurings and post-default
restructurings we extended the baseline regression with a different set of dummies between the two categories
3
with lenders while they are still current on their loan payments In post-default restructurings governments
unilaterally default then start to renegotiate their debt Among the 197 finished restructurings 81 were
preemptive and 116 were post-default Many countries have multiple restructurings Among 74 countries that had
completed restructurings five are from MENA region
To analyze the macroeconomic impact of restructurings before during and after the restructurings started we
apply an event study approach transforming calendar years into event years We focus on the three years before
the year of the onset and the three years after a restructuring (analyzing seven years in total) In this new timeline
year zero corresponds to the year a restructuring began As in Appendix A1 our sample is all countries not classified
as a high-Income in 1987 in the World Bankrsquos Historical Income Classification dataset
Data on GDP growth and external debt
The two outcome variables are annual growth in real GDP and the annual growth rate of the external debt in US
dollars Both are from the IMFrsquos World Economic Outlook (October 2020) with data starting from 1981 By
focusing on the change of external debt level the difference-in-difference estimator can show the differential
level of acceleration of debt accumulation between affected and non-affected countries in the years before
during and after restructuring started
Econometric strategy
To systematically analyze the macroeconomic impacts of restructurings in developing economies we rely on a
difference-in-difference estimator (similar to the approach Appendix A1) The baseline econometric strategy that
aims to identify these potential effects is the following difference-in-difference estimator
= $ + H + H + I + 9 ampamp
(
amp-++ 9 A +
+
-(5
where represents the macroeconomic variable of interest (annual growth of real GDP and annual growth of
debt level) of country c at year t H is the country fixed effects H is year fixed effects I is a dummy variable
that takes the value of 1 for the onset of restructuring years that is the first year of the restructuring and 0
otherwise n is the number of years before the first year of restructuring (going from 3 years before the default (-
3-2-1) amp is a dummy variable that takes a value of 1 if it is n year before the restructuring and 0 otherwise m
is the number of years after the first year of restructuring (going from 1 to 3 years after the first year of
restructuring (123) A is a dummy variable that takes a value of 1 if it is m years after the onset of restructuring
and 0 otherwise The coefficients of interests are (what happens when restructuring starts) β (n=1 to 3) what
happens 3 years before the restructuring (m=1 to 3) what happens after restructuring starts
To control for overlapping events we have added frequency indicators in all regressions For each of the seven
years on the timeline there are three different counts (1) how many windows of three years before a restructuring
overlap with that specific year (2) how many events starts on the same year and (3) how many windows of three
years after a restructuring overlap with that specific year These construct three counts for each year on the
timeline of an event resulting in a total of 21 variables
In an extension to see if the macroeconomics respond differently to preemptive restructurings and post-default
restructurings we extended the baseline regression with a different set of dummies between the two categories
A P P E N D I X
LIVINg wITH DEBT HOw INSTITUTIONS CAN CHART A PATH TO RECOVERY FOR THE MIDDLE EAST AND NORTH AFRICA
51
Results
4
= $ + H + H + I + 9 ampamp(
amp-++ 9 A +
+
-(0( + 9 amp0amp0
(
amp-++ 9 0A0 +
+
-(5
I is a dummy that takes 1 if a preemptive restructuring starts ( is a dummy that takes 1 if a post-default
restructuring happens amp is a dummy that takes 1 if n years before a preemptive restructuring amp0 is a dummy
that takes 1 if n years before a post-default restructuring Aamp is a dummy that takes 1 if n years after the start of a
preemptive restructuring Aamp0 is a dummy that takes 1 in n years after a default starts The seven in the first set
will trace macroeconomic trend for preemptive restructurings while the seven in the second set will trace
macroeconomic trend for post-default restructurings
Results
Restructurings are costly to output growth and even costlier in post-default restructurings In addition
restructurings seem to slow debt growth Panel A of Figure II7 shows that countries experience lower growth
relative to the baseline in the years preceding restructuringsmdashwhether preemptive or post-default However after
the first year of restructuring growth starts to recover for preemptive restructuring but remains depressed for
post-default restructurings Panel B of Figure II7 shows that during the first two years after the restructuring
starts debt growth is significantly lower in both preemptive and post-default cases relative to countries without
restructurings This could reflect the defaulting countriesrsquo exclusion from the international debt market and the
reduction in debt granted by creditors during restructuring negotiations
A P P E N D I X
MIDDLE EAST AND NORTH AFRICA REgION ECONOMIC UPDATE APRIL 2021
52
APPENDIX TABLE B1 World Bankrsquos Growth Current Account and Fiscal Account Forecasts
Real GDP Growthpercent
Real GDP per capita Growthpercent
Current Account Balancepercent of GDP
Fiscal Balancepercent of GDP
2019 2020e 2021f 2022f 2019 2020e 2021f 2022f 2019 2020e 2021f 2022f 2019 2020e 2021f 2022f
MENA 00 -38 22 35 -13 -53 06 19 21 -38 -09 07 -42 -94 -66 -46
Developing MENA -08 -28 23 37 -16 -41 06 21 -21 -46 -46 -35 -47 -76 -75 -64
Oil Exporters -08 -42 23 34 -21 -60 05 17 38 -37 01 20 -36 -98 -63 -39
gCC 07 -49 22 33 -15 -63 06 19 62 -29 24 44 -36 -113 -57 -30
Qatar 08 -32 30 41 -10 -48 13 24 24 -25 17 27 10 -36 -23 27
United Arab Emirates 17 -63 12 25 02 -74 02 15 65 -15 29 49 -10 -80 -05 17
Kuwait 04 -54 24 36 -60 -62 08 22 164 -27 82 117 -98 -262 -226 -193
Bahrain 20 -54 33 32 -25 -88 06 11 -21 -95 -69 -46 -93 -175 -116 -94
Saudi Arabia 03 -41 24 33 -13 -56 09 19 66 -27 26 45 -42 -113 -56 -30
Oman -08 -63 25 65 -37 -87 02 45 -55 -104 -81 -52 -90 -174 -68 -46
Developing Oil Exporters -31 -31 24 36 -42 -51 06 18 00 -50 -49 -32 -36 -75 -76 -61
Iraq 24 -119 19 84 15 -149 -16 47 61 -129 -113 -56 14 -44 -54 -10
Iran Islamic Rep -68 17 21 22 -79 05 10 11 06 -08 08 11 -37 -63 -67 -70
Algeria 08 -55 36 23 -12 -69 21 09 -100 -144 -121 -114 -96 -164 -121 -100
Developing Oil Importers 32 -22 22 40 17 -30 05 25 -56 -39 -43 -38 -66 -77 -75 -67
Lebanon -67 -203 -95 -68 -199 -88 -212 -110 -67 -105 -49 -28
Jordan 20 -18 14 22 05 -27 08 19 -21 -72 -70 -60 -46 -67 -64 -54
Djibouti 78 05 55 60 61 -09 40 45 149 201 -15 -08 -05 -17 -19 -17
West Bank and Gaza 14 -115 35 32 -12 -137 09 04 -104 -65 -81 -83 -45 -76 -64 -57
Morocco 25 -70 42 37 12 -81 30 26 -41 -30 -35 -39 -36 -77 -65 -64
Tunisia 10 -88 40 26 -01 -98 30 17 -85 -68 -92 -90 -31 -100 -86 -68
Egypt Arab Rep 56 36 23 45 35 16 04 26 -36 -30 -34 -28 -81 -80 -82 -70
Memorandum
Libya 25 -313 667 10 -322 646 116 -464 -62 17 -644 -90
Sources Authorsrsquo calculations based on data from World Bank Macro and Poverty Outlooks April 2021Note e=estimate f=forecast and NP=not presented GDP is at market prices Data are rounded up to a single digit Data for Egypt correspond to its fiscal year (July-June) Libya Syria and Yemen are not included in the regional and sub-regional averages due to lack of data Lebanon and Libya are not forecasted beyond 2021 due to high uncertainty
Data Appendix
A P P E N D I X
LIVINg wITH DEBT HOw INSTITUTIONS CAN CHART A PATH TO RECOVERY FOR THE MIDDLE EAST AND NORTH AFRICA
53
APPENDIX TABLE B2 Magnitude of Revisions to Macro Forecasts by the World Bank
Panel A Between April 2021 and October 2019
Real GDP growth(April 2021 - October 2019)
Current Account Balance(April 2021 - October 2019)
Fiscal Balance(April 2021 - October 2019)
2020e 2021f 2020e 2021f 2020e 2021f
MENA -64 -06 -46 -17 -48 -23
Developing MENA -58 -08 -03 -04 -17 -18
Oil Exporters -63 -01 -62 -23 -57 -25
gCC -71 -05 -86 -37 -80 -29
Qatar -62 -02 -79 -30 -56 -50
United Arab Emirates -89 -18 -76 -28 -70 01
Kuwait -79 -04 -113 -07 -204 -169
Bahrain -75 10 -61 -32 -98 -40
Saudi Arabia -57 02 -98 -53 -68 -15
Oman -98 -15 -14 -11 -80 02
Developing Oil Exporters -50 07 -16 -13 -21 -21
Iraq -169 -08 -89 -72 -10 -23
Iran Islamic Rep 16 12 -03 11 -04 -07
Algeria -74 14 -38 04 -92 -49
Developing Oil Importers -66 -24 15 09 -12 -13
Lebanon -206 -99 104 146 49 70
Jordan -41 -11 -09 -06 -43 -44
Djibouti -69 -25 12 -239 -11 -27
West Bank and Gaza -104 39 34 16 42 50
Morocco -105 07 07 -02 -42 -31
Tunisia -110 14 39 09 -50 -39
Egypt Arab Rep -22 -37 -04 -08 -04 -12
Sources Authorsrsquo calculations based on data from World Bank Macro and Poverty Outlook Note Libya Syria and Yemen are not included in the regional and sub-regional averages due to lack of reliable data The changes are in percentage points Lebanon is not forecasted beyond 2021
A P P E N D I X
MIDDLE EAST AND NORTH AFRICA REgION ECONOMIC UPDATE APRIL 2021
54
Panel B Between April 2021 and October 2020
Real GDP growth(April 2021 - October 2020)
Current Account Balance(April 2021 - October 2020)
Fiscal Balance(April 2021 - October 2020)
2020e 2021f 2022f 2020e 2021f 2022f 2020e 2021f 2022f
MENA 13 03 04 11 23 23 07 13 11
Developing MENA 19 02 00 11 -01 01 20 11 09
Oil Exporters 16 04 06 09 29 29 08 16 16
gCC 08 04 07 11 42 38 -08 13 10
Qatar -12 00 11 -15 08 08 00 15 14
United Arab Emirates 00 00 00 00 00 00 00 00 00
Kuwait 25 14 07 25 91 95 15 04 -39
Bahrain -02 11 07 -16 -04 08 -41 -16 -07
Saudi Arabia 13 04 11 21 70 62 -13 22 27
Oman 31 20 -14 40 46 10 07 98 63
Developing Oil Exporters 30 03 05 07 -05 01 32 19 21
Iraq -24 -01 11 -07 -33 -11 124 85 94
Iran Islamic Rep 62 06 05 -02 02 04 03 -01 -01
Algeria 11 -02 02 -10 36 32 -06 09 -04
Developing Oil Importers 00 01 -06 17 04 02 05 01 -07
Lebanon -11 37 -66 -111 96 120
Jordan 37 -23 00 04 -06 -08 15 -08 -05
Djibouti 15 -16 -12 42 -178 -174 06 11 05
West Bank and Gaza -36 12 08 28 20 18 -32 -21 -16
Morocco -07 09 02 69 30 13 -01 -12 -22
Tunisia 04 -19 07 03 -29 -26 -19 -30 -21
Egypt Arab Rep 01 -01 -13 11 10 05 02 02 -01
Sources Authorsrsquo calculations based on data from World Bank Macro and Poverty Outlook Note Libya Syria and Yemen are not included in the regional and sub-regional averages due to lack of reliable data The changes are in percentage points Lebanon is not forecasted beyond 2021
A P P E N D I X
LIVINg wITH DEBT HOw INSTITUTIONS CAN CHART A PATH TO RECOVERY FOR THE MIDDLE EAST AND NORTH AFRICA
55
APPENDIX TABLE B3 Overview of MENArsquos Debt
Public Debt
Public Domestic
Debt
Public External
Debt
External Debt to Official Debtor
Public amp Private
External Debt
Interest Payments for Public
Debt
Moodys Rating Foreign
Currency Long Term DebtWorld
Bankrsquos MPOWorld
Bankrsquos MPOWorld
Bankrsquos MPOWorld
Banks IDSIMFrsquos WEO
World Bankrsquos MPO
2019 2020 2019 2020 2019 2020 2019 2019 2020 2019 2020 112020 1212021
Gu
lf C
oo
pe
rati
on
C
ou
nci
l
Qatar 57 641 1314 1613 16 18 Aa3 Aa3
United Arab Emirates 201 25 767 975 03 03 Aa2 Aa2
kuwait 203 225 488 645 03 08 Aa2 A1
Bahrain 1023 1324 2264 2546 45 49 B2u B2u
Saudi Arabia 231 328 232 299 08 12 A1 A1
Oman 601 812 924 1215 23 28 Ba1 Ba3
Oth
er
Oil
E
xpo
rte
rs
Libya 488 1371
Iraq 482 693 233 344 249 35 309 405 12 11 Caa1 Caa1
Iran 479 503 01 17 17 07 1
Algeria 456 514 450 508 06 06 08 23 19 06 06
Yemen 527 227 30 274 243 256 38
Oil
Imp
ort
ers
Lebanon 171 1867 1076 878 634 99 36 1978 4828 10 22 Caa2 C
Jordan 974 109 583 641 39 449 190 68 776 35 41 B1 B1
Djibouti 669 702 04 02 664 699 644 66 702 13 12
west Bank and gaza 163 242 92 154 71 88 03 04
Morocco 649 778 509 584 14 194 198 331 392 23 25 Ba1 Ba1
Tunisia 718 872 223 279 495 593 411 994 972 27 38 B2 B2
Egypt 902 875 725 686 178 19 190 36 344 10 98 B2 B2
world Median 519 632 196 227 268 303 200 505 592 16 19
High-income median 569 653 266 349 191 233 885 1017 21 23
Middle-income median 515 649 200 230 274 324 190 473 543 18 21
Low-income median 525 505 176 187 268 297 244 314 321 11 13
Source World Bankrsquos Macro and Poverty Outlook (April 2021) World Bankrsquos International Debt Statistics IMFrsquos World Economic OutlookNote Debt and interest payments are in percent of GDP Official external debt includes debt held by international organizations (multilateral loans) and by foreign governments (bilateral loans)
A P P E N D I X
MIDDLE EAST AND NORTH AFRICA REgION ECONOMIC UPDATE APRIL 2021
56
APPENDIX TABLE B4 Characteristics of MENA Economies
Public Debt Output Gap Governance InflationExchange Rate Arrangement
( of GDP) (percentage points) (score) (percent)
World Bankrsquos MPO
World Bankrsquos MPO
World BankWorld Bankrsquos
MPOIMF
2019 2020 2020 2019 2019 2020 2019
Gu
lf C
oo
pe
rati
on
C
ou
nci
l
Qatar 57 641 -49 07 -09 -26 Conventional peg
United Arab Emirates 201 25 -9 11 -19 -16 Conventional peg
kuwait 203 225 -55 01 11 09 Conventional peg
Bahrain 1023 1324 -82 04 1 -26 Conventional peg
Saudi Arabia 231 328 -56 01 -12 34 Conventional peg
Oman 601 812 -83 04 01 -1 Conventional peg
Oth
er
Oil
E
xpo
rte
rs
Libya 488 1371 -2 -3 -2 Conventional peg
Iraq 482 693 -183 -14 -02 06 Conventional peg
Iran 479 503 11 -09 413 369 Stabilized arrangement
Algeria 456 514 -75 -09 23 21 Crawl-like arrangement
Yemen 527 29 -19 10 264 Stabilized arrangement
Oil
Imp
ort
ers
Lebanon 171 1867 -191 -07 29 843 Stabilized arrangement
Jordan 974 109 -39 01 08 03 Conventional peg
Djibouti 669 702 -67 -08 33 18 Currency board
west Bank and gaza 163 242 -148 08 -07
Morocco 649 778 -101 -02 02 07 Stabilized arrangement
Tunisia 718 872 -104 -02 67 56 Crawl-like arrangement
Egypt 902 875 -12 -06 139 57 Stabilized arrangement
world Median 519 632 -67 -01 28 3
High-income median 569 653 -86 11 11 15
Middle-income median 515 649 -73 -04 28 26
Low-income median 525 505 -41 -04 31 59
Sources World Bank Macro Poverty Outlook (October 2020) and World Governance Indicators International Monetary Fund Annual Report on Exchange Arrangements and Exchange RestrictionsNote Output gap = growth in 2020 minus average growth from 2015 through 2019) Governance is the average of Regulatory Quality Government Effectiveness and Rule of Law A lower score represents lower governance quality
A P P E N D I X
LIVINg wITH DEBT HOw INSTITUTIONS CAN CHART A PATH TO RECOVERY FOR THE MIDDLE EAST AND NORTH AFRICA
57
APPENDIX TABLE B5 Public Debt Reporting in MENA
Alg
eri
a
Ba
hra
in
Djib
ou
ti
Eg
yp
t A
rab
Re
p
Ira
n I
sla
mic
Re
p
Ira
q
Jord
an
Ku
wa
it
Leb
an
on
Lib
ya
Mo
rocc
o
Om
an
Qa
tar
Sa
ud
i Ara
bia
Sy
ria
Tun
isia
Un
ite
d A
rab
Em
ira
tes
We
st B
an
k a
nd
Ga
za
Yem
en
Central government radic radic radic radic times radic radic radic radic radic radic radic radic radic radic radic radic
State and local government na radic radic times radic radic na radic na na na na radic times times
Other elements of the general government times radic times radic times radic times times
ow social security fundna radic times radic radic times radic times na
ow extra budgetary fundstimes radic times na times times radic times times
guarantees (to other public and private sector including to SOEs)
times times radic radic radic radic radic radic times times times radic radic times na
Central bank (borrowed on behalf of the government) na na radic radic times radic na radic na radic na
Non-guaranteed SOE debt times times times times times times times times times radic times na na
Source World Bank staffNote Table follows the public debt reporting template of World Bank-IMFrsquos Debt Sustainability Framework (see IMF 2017) radic indicates the country reports the type of debt (for both domestic and external debts) times indicates the country has the type of debt but does not report it na = not applicable and indicates that the country might not have this type of debt blank cells indicate that World Bank economists do not have information regarding whether the country has the type of debt but does not report it or that the country does not have the type of debt or that the debt might be included in total government debt Debt reporting is as of 2020 Red cells indicate changes between 2019 and 2020
A P P E N D I X
MIDDLE EAST AND NORTH AFRICA REgION ECONOMIC UPDATE APRIL 2021
58
W O R L D B A N K M I D D L E E A S T A N D N O R T H A F R I C A R E G I O NMENA ECONOMIC UPDATE APRIL 2021
P R E F A C E
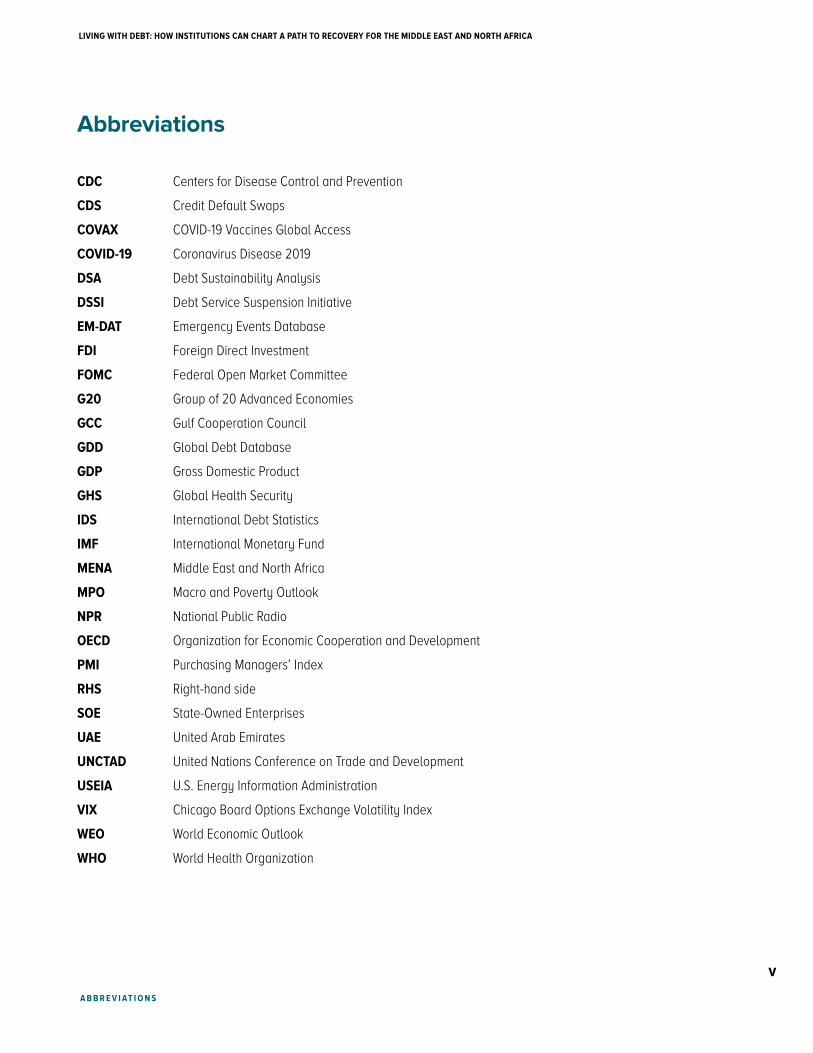