Embed Size (px)
Citation preview
Report No.78689-HR
CROATIA
RAILWAY POLICY NOTE
June 2013
Sustainable Development Department
Europe and Central Asia Region
Pub
lic D
iscl
osur
e A
utho
rized
Pub
lic D
iscl
osur
e A
utho
rized
Pub
lic D
iscl
osur
e A
utho
rized
Pub
lic D
iscl
osur
e A
utho
rized
Pub
lic D
iscl
osur
e A
utho
rized
Pub
lic D
iscl
osur
e A
utho
rized
Pub
lic D
iscl
osur
e A
utho
rized
Pub
lic D
iscl
osur
e A
utho
rized
2
© 2013 The International Bank for Reconstruction and Development/the World
Bank Office, Croatia
Radnička 80/IX
10000 Zagreb
Telephone: 2357 230
Internet: www.worldbank.hr
1818 H Street NW
Washington DC 20433
Telephone: 202-473-1000
Internet: www.worldbank.org
E-mail: [email protected]
All rights reserved
The findings, interpretations, and conclusions expressed herein are those of the authors
and do not necessarily reflect the views of the Board of Executive Directors of The
World Bank or the governments they represent.
World Bank does not guarantee the accuracy of the data included in this work. The
boundaries, colors, denominations, and other information shown on any map in this work
do not imply any judgment on the part of the World Bank concerning the legal status of
any territory or the endorsement or acceptance of such boundaries.
Rights and Permissions
The material in this publication is copyrighted. Copying and/or transmitting portions or
all of this work without permission may be a violation of applicable law. The World
Bank encourages dissemination of its work and will normally grant permission promptly.
Short extracts from this publication may be reproduced unaltered without authorization,
on condition that the source is indicated.
For permission to photocopy or reprint any part of this work, please send a request with
complete information to the Copyright Clearance Center Inc., 222 Rosewood Drive,
Danvers, MA 01923 USA; telephone: 978-750-8400; fax: 978-750-4470; Internet:
www.copyright.com.
All other queries on rights, licenses, including subsidiary rights, should be addressed to
the Office of the Publisher; the World Bank, 1818 H street NW, Washington, DC 20433,
USA; fax: 202-522-2422; e-mail: [email protected]
ISBN: 978-953-7974-00-8
Cover page: World Bank
Photo: Rea Brcic
3
CURRENCY AND EQUIVALENT UNITS
(Exchange Rate Effective as of December 31, 2012)
Currency Unit = Croatian Kuna (HRK)
EUR 1 = 7.529 HRK
US$ 1 = 5.747 HRK
EUR 1 = US$ 1.319
FISCAL YEAR
January 1 – December 31
WEIGHTS AND MEASURES Metric System
ABBREVIATIONS AND ACRONYMS
ARTZU Railway Market Regulatory Agency KM Kilometer
CAGR Compounded Annual Growth Rate MAIC Multi-Annual Infrastructure
Contract
CEO Chief Executive Officer MMATI Ministry of Maritime Affairs,
Transport and Infrastructure
DG
MOVE
Directorate General for Mobility
and Transport, EC
MOF Ministry of Finance
DMU Diesel Multiple Unit MRDEUF
Ministry of Regional Development
and EU Funds
D.O.O. Limited liability company (LLC) OECD Organization for Economic Co-
operation and Development
EBITDA Earnings before interest taxes,
depreciation and amortization
OP Operational Program
EC European Commission pkm passenger kilometer
EMU Electric Multiple Unit PSC Public Service Contract
EU European Union PPIAF Public-Private Infrastructure
Advisory Facility
EUR Euro tkm train kilometer
FINA Financial Agency TAC Track Access Charge
GDP Gross Domestic Product TEN-T Trans European Transport Network
HRK Croatian Kuna TU Traffic Unit
HŽ Croatian Railways UIC International Union of Railways
IFC International Finance Corporation WB World Bank
IM Infrastructure Manager
Vice President:
Country Director:
Sector Manager:
Project Team Leader:
Philippe H. Le Houérou
Mamta Murthi
Juan Gaviria
Jean-Francois Marteau
EXECUTIVE SUMMARY…..………………………………………………………………..i
A. INTRODUCTION .............................................................................................................. 1
B. SECTOR BACKGROUND ................................................................................................ 5
C. MAIN OBJECTIVES OF THE RAILWAY SECTOR REFORM IN CROATIA ............. 7
D. ENHANCING RAILWAY SECTOR GOVERNANCE – ANALYSIS OF PRE-JUNE
2012 STATUS .......................................................................................................................... 9
E. IMPROVING CORPORATE GOVERNANCE, MANAGEMENT AND
PERFORMANCE OF RAILWAY SERVICES ..................................................................... 14
E.1. Structure from 2006 to 2012 .................................................................................... 14
E.2. Assessment of the General Capacity of the Sector to Compete in the Open Market15
E.3. Staffing Issues .......................................................................................................... 19
E.4. Organizational Issues ............................................................................................... 22
F. PERFORMANCE OF THE MAIN COMPANIES IN HŽ HOLDING............................ 25
F.1. Assessment of HŽ Infrastructure Performance ........................................................ 25
F.2. Assessment of HŽ Cargo Performance .................................................................... 29
F.3. Assessment of HŽ Passenger Transport Performance ............................................. 37
G. THE INVESTMENT CAPACITY OF HŽ HOLDING COMPANIES ........................... 41
H. THE RESTRUCTURING PLAN PROMOTED BY HŽ HOLDING (JUNE 2012) ........ 45
I. GOING BEYOND THE RESTRUCTURING PLAN: SETTING TARGETS TO
INCREASE OPERATIONAL PERFORMANCE AND ACHIEVE FINANCIAL
SUSTAINABILITY ................................................................................................................ 51
I.1. General Presentation of the Assumptions and Goals of the Recommended Scenario .
.................................................................................................................................. 53
I.2. Expected Results from Implementation of the Recommended Restructuring Actions
.................................................................................................................................. 57
I.3. Outcomes of the Alternative Pessimistic Scenario .................................................. 60
J. IMPLEMENTING A NEW BUSINESS CULTURE AT CROATIAN RAILWAYS ..... 61
J.1. Redefining the Role of the Government .................................................................. 61
J.2. Embracing Modern Corporate Organization Principles ........................................... 63
K. CONCLUSIONS: TOUGH CHOICES NEED TO BE MADE ....................................... 65
I. Annex 1: Data Discrepancy in Financial Statements Received from HŽ Holding ...... 67
II. Annex 2: Factors Impeding the Financial Modeling of the Approved Restructuring Plan
for HŽ Holding ....................................................................................................................... 72
III. Annex 3: Detailed Description of the Assumptions in the Model for Improving the
Financial Performance of HŽ Holding ................................................................................... 74
i. World Bank Recommended Scenario for Improving Financial Performance ............. 74
ii. Alternative Scenario for Improving Financial Performance Based on Pessimistic
Assumptions ........................................................................................................................ 85
Figures:
Figure 1: Difference between the World Bank and HŽ levels of public funding to the railway
sector needed during the period of 2012-2016 (in HRK thousands) ........................................ v Figure 2: Overview of Past and Expected Future State Contribution to Infrastructure (in HRK
thousands) ................................................................................................................................. 2 Figure 3: Railway Traffic Evolution ....................................................................................... 12
Figure 4: Evolution of TACs (HRK per train-km) ................................................................. 12
Figure 5: Cost Recovery Ratio – Viability Ratio .................................................................... 18 Figure 6: HŽ Holding Labor Productivity (traffic units/staff) ................................................ 20 Figure 7: HŽ Holding Labor Productivity Compared to the EU (2011) ................................. 20
Figure 8: HŽ Holding Labor Costs as a Percentage of Operating Revenues .......................... 21 Figure 9: Split of Traction Costs ............................................................................................. 23
Figure 10: Evolution of Locomotive Productivity .................................................................. 23 Figure 11: Locomotive Productivity, 2011 (million traffic units/locomotive) ....................... 23 Figure 12: Traffic Intensity Compared to the EU, 2011 ......................................................... 26
Figure 13: Traffic Intensity (traffic units/km) ........................................................................ 27
Figure 14: Infrastructure Managers in the EU – Number of Staff per track-km .................... 27
Figure 15: HŽ Cargo Average Unit Operating Cost Including Depreciation (Eurocents) ..... 31 Figure 16: HŽ Cargo Viability Ratio ...................................................................................... 31
Figure 17: HŽ Cargo Labor Productivity, 2011...................................................................... 32 Figure 18: HŽ Cargo Labor Productivity (traffic units/staff) ................................................. 32 Figure 19: HŽ Cargo Traffic Intensity Compared to the EU, 2011 ........................................ 34
Figure 20: Evolution of Wagon Productivity.......................................................................... 35 Figure 21: Wagon Productivity Benchmark, 2011 (million ton-km per wagon) .................... 35 Figure 22: HŽ Passenger Transport Traffic Intensity, 2011 (passenger-km/km of track) ...... 37 Figure 23: HŽ Passenger Transport Labor Productivity (traffic units/staff) .......................... 38 Figure 24: HŽ Passenger Transport Labor Productivity Benchmark, 2011 ........................... 38 Figure 25: Evolution of Coach Productivity ........................................................................... 39
Figure 26: Coach Productivity Benchmark, 2011 (passenger-km/coach per year) ................ 39 Figure 27: Age of Rolling Stock Fleet .................................................................................... 41 Figure 28: Age of Infrastructure Assets .................................................................................. 41
Figure 29: HŽ Restructuring Plan: Level of Public Funds to the Railway Sector Needed
during the Period of 2012-2016 (in HRK thousands) ............................................................. 50 Figure 30: WB Scenario: Level of Public Funds to Railway Sector Needed during the Period
of 2012-2016 (in HRK thousands) .......................................................................................... 59 Figure 31: Evolution of HŽ Cargo’s Staff Productivity (in million TU) ................................ 76 Figure 32: Evolution of Operating Profit for HŽ Cargo ......................................................... 77
Figure 33: HŽ Cargo Cash Flow Breakdown ......................................................................... 78
Figure 34: HŽ Passenger Transport Staff Productivity Evolution .......................................... 80 Figure 35: Evolution of Operating Profit for HŽ Passenger Transport .................................. 81 Figure 36: HŽ Infrastructure Traffic Intensity Evolution ....................................................... 83
Figure 37: HŽ Infrastructure Staff Productivity Evolution..................................................... 83 Figure 38: Evolution of Operating Profit for HŽ Infrastructure ............................................. 84 Figure 39: Evolution of Operating Profit for HŽ Cargo – Pessimistic Scenario .................... 87 Figure 40: Evolution of Operating Profit for HŽ Passenger Transport – Pessimistic Scenario
................................................................................................................................................. 90
Figure 41: Evolution of Operating Profit for HŽ Infrastructure – Pessimistic Scenario ........ 92 Figure 42: Rail Network of Croatia ........................................................................................ 94
Tables
Table 1: State Contribution to the Railway Transport Sector ................................................. 10 Table 2: HŽ Holding Governance Structure ........................................................................... 15 Table 3: Croatia – Railway Performance Indicators ............................................................... 16
Table 4: HŽ Holding Income Statement, 2005-2011 .............................................................. 19 Table 5: HŽ Infrastructure Income Statement, 2005-2012 ..................................................... 29
Table 6: HŽ Cargo Income Statement, 2005-2012 ................................................................. 36 Table 7: HŽ Passenger Transport Income Statement, 2005-2012 .......................................... 40 Table 8: Investment Estimates for Rolling Stock ................................................................... 42
Table 9: Investment Estimates for Infrastructure .................................................................... 43 Table 10: HŽ Restructuring Plan: Investment Financing Plan for HŽ Infrastructure (in HRK
thousands) ............................................................................................................................... 47 Table 11: Comparison of Main Differences between the Assumptions of the Optimistic and
Pessimistic Scenarios .............................................................................................................. 52 Table 12: Market Conditions .................................................................................................. 53 Table 13: Major Cost Cutting Assumptions of the Recommended Scenario ......................... 54
Table 14: Recommended Scenario Results ............................................................................. 54 Table 15: Scenarios for Improving the Current Performance ................................................. 55 Table 16: Investment Financing Plan for HŽ Infrastructure during the Period of 2012-2016
Proposed by the World Bank (in HRK thousands) ................................................................. 55 Table 17: HŽ Holding Income Statement, 2009-2010............................................................ 69 Table 18: HŽ Holding Balance Sheet, 2009-2010 .................................................................. 70 Table 19: HŽ Holding Basic Operational and Financial Statistics, 2005-2011 ...................... 71
Table 20: Overview of Key Assumptions Used in the Financial Model ................................ 75 Table 21: Evolution of Earnings for HŽ Cargo ...................................................................... 77
Table 22: Evolution of Earnings for HŽ Passenger Transport ............................................... 81 Table 23: Evolution of Earnings for HŽ Infrastructure .......................................................... 84 Table 24: Overview of Key Assumptions Used in the Financial Model – Pessimistic Scenario
................................................................................................................................................. 86 Table 25: Evolution of Earnings for HŽ Cargo – Pessimistic Scenario ................................. 88
Table 26: Evolution of Earnings for HŽ Passenger Transport – Pessimistic Scenario .......... 90 Table 27: Evolution of Earnings for HŽ Infrastructure – Pessimistic Scenario ..................... 92
Boxes:
Box 1: Multi-Annual Infrastructure Contract in the EU Context ........................................... 13 Box 2: Public Service Contract in the EU Context ................................................................. 13
Acknowledgments
This Draft Policy Note was prepared by a World Bank team composed of Vasile Olievschi,
Blanka Babic, Mohammed Dalil Essakali and Jean-Francois Marteau. Jukka-Pekka Strand
provided guidance on the use of the financial model designed by the World Bank in its
Railway Toolkit. Frank Jost (European Commission - DG MOVE), Pierre Pozzo di Borgo
(IFC), Sanja Mazdarevic-Sujster, Martha Lawrence, Hongjoo Hahm and Juan Gaviria (World
Bank) provided comments and guidance on the successive versions of the Note.
The World Bank team would like to thank counterparts in Croatia for fruitful discussions,
and access to data and information. These counterparts include management and officials
from the Ministry of Maritime Affairs, Transport and Infrastructure, the Ministry of Finance,
and Croatian Railways companies.
i
Executive Summary
Context: Strong Challenges and Opportunities Linked to EU Integration
1. The achievements of Croatian railways (HŽ Holding) over the past two decades have
been significant. With the gradual stabilization of the Croatian political and economic
environment at the end of the 1990’s, railway traffic volumes have stabilized, benefiting
from the strategic location of Croatia at the junction of two main European transport
corridors. However, the global financial crisis that started in 2008 has deteriorated the
financial position of the State-owned railway undertakings. The system still relies heavily on
State support, despite several attempts to implement organizational changes and pave the
way for a customer-oriented and competitive railway business. The last restructuring was
undertaken in 2012, when a 5-year reform program (the Restructuring Plan) prepared by HŽ
Holding was approved by the Ministry of Maritime Affairs, Transport and Infrastructure
(MMATI). The Restructuring Plan included the dissolution of the railways holding into three
independent companies: HŽ Infrastructure, HŽ Cargo and HŽ Passenger Transport.
2. Croatia has prepared the railway sector’s legal and institutional set-up to comply with
the new requirements that will be existent following the country’s upcoming accession into
the European Union (EU) in mid-2013. The legal and institutional framework is almost fully
harmonized with the EU’s Acquis Communautaire. Additional legal texts including on rail
safety are envisaged to be adopted and entered into force in 2013. These additional legal texts
will further strengthen the role of the regulatory institutions and improve the operating
environment. The recent adoption of a new directive (the Fourth Railway Package)1 by the
EU commission will further require sector adjustment in the coming years.
3. State support has historically been very strong in Croatia, although the amount has
been declining over the past several years. This support has provided HŽ Holding with the
ability to cover its operating costs. In 2011, public transfers to railways amounted to about
HRK 2 billion (EUR 265 million equivalent), or about 0.7% of the GDP—this represented
about a quarter of the support received by the road sector. Such support was possible from
2000-2007 as a result of a steady GDP growth of 4-6%. Because Croatia experienced an
abrupt slowdown in the economy in 2008 and has yet to recover, State support has been
constrained, and current levels of support will be difficult to maintain. The Government of
Croatia (the Government) is facing challenging issues, including a high unemployment rate, a
growing trade deficit, uneven regional development, and a challenging investment climate in
a context of global financial crisis. This imposes an urgency to speed up the implementation
of structural reforms and to cut or maximize efficiency of public spending in order to limit
the risk of a sustained recession. In this context, the Croatian railway system must act
immediately to improve its financial sustainability and reduce its dependence on public
funds.
4. The period of post-EU accession is going to present the railway sector with unique
opportunities to modernize its key international corridors EU Structural Funds. However, this
1 http://ec.europa.eu/transport/modes/rail/packages/2013_en.htm.
ii
requires counterpart funding from the Government that is beyond the current level of State
support, and that could amount to nearly EUR 615 million during the financing period of
2014-2020. Any additional transformational program that would enhance the railway
infrastructure—such as private financing also require very substantial public funding or
guarantees, and an appropriate linkage with the existing network. This means that there is an
even greater need than in the past for Croatia to rationalize the current sector expenditures
and revenue, in order to make room to finance investment.
The Purpose of the Note
5. This policy note (the Note) presents the results of a diagnostic of the Croatian railway
sector undertaken by the World Bank between December 2011 and September 2012—based
on data and information obtained from HŽ Holding and Government authorities. After a first
round of discussions with the World Bank Team (the Team), the MMATI adopted in June
2012 a Restructuring Plan presented by HŽ Holding that already incorporated a significant
number of the measures identified during the first part of the Bank Team’s work—and
implementation of the Restructuring Plan has started. Therefore, sentences in italics
throughout the Note reflect measures that have already been incorporated into the
Restructuring Plan.
6. Based on this diagnostic and the start of implementation of the Restructuring Plan, the
Note presents ways forward that could enable the railway sector to overcome the difficult
challenges ahead. They relate to: (i) Sector Governance—this is mostly a domain where
Government action is needed, and covers the effective formulation and implementation of
public policies in the railway sector and the use of public funds for their implementation; (ii)
Corporate and Management Performance of the Service Providers—this relates to the
organizational performance of the HŽ Companies as business entities; and (iii) Overall
Business Culture—this relates to the “change management” ingredients that will be
necessary (i.e., without them the other actions/recommendations would have minimal
chances of success) to ensure that the business mindset in the railway sector in Croatia abets
a smooth implementation. These elements are summarized in the Action Plan attached to this
summary. The Note includes an analysis of the July 2012 Restructuring Plan—discusses its
impact and sustainability—and simulates the impact of the Note’s recommendations on the
rail system, presenting both an Optimistic Scenario and a Pessimistic Scenario.
7. As a result, the Note aims at informing the Government—specifically, the Ministry of
Finance (MOF) and the MMATI—about: (i) the financial and technical options that are
available to position the Croatian railway sector as a growth engine; and (ii) the targets that
the railway companies would need achieve in order to attain a level of efficiency that would
allow them to be competitive.
The Need to Create a Long-term Vision for the Railway Sector in Croatia
8. The railway sector in Croatia is predominantly transit, as Croatian Adriatic ports
serve as an entry-point for international cargo to South East European markets. During the
past decade, Croatia has made significant investments in modernization, capacity increase,
iii
and competitiveness enhancement of its sea ports. For example, Croatia has invested more
than EUR 200 million in the Rijeka Gateway2, and close to EUR 100 million in Ploče
3.
However, limited connectivity with rail infrastructure and services, lack of coordination with
neighboring countries, and underdevelopment of intermodal transport in general, has limited
the efficiency of the services provided. As a result, the country has substantially lower traffic
intensity than its EU peers—reaching less than half of the traffic intensity of the EU-27
average. Likewise, passenger service intensity has been much lower than in the EU-27—with
untapped potential in the Zagreb area and between the main cities, coupled with a lot of
heavily subsidized low-volume links.
9. The European vision to which Croatia adheres promotes a shift toward railways as a
more energy efficient and sustainable mode of transport. The traditional advantages of rail
investments in contrast to those in roads include less congestion, less pollution and
environmental damage, and lower costs—due to better integration and complementarity
between transport modes. For Croatia, EU membership is expected to rapidly boost imports
and exports; however, the country needs to ensure that physical preconditions are in place for
its full trade integration. The railway sector can potentially be a source of growth, through
the creation or development of logistics hubs in the main ports and in Zagreb, and by
attracting additional revenue through transit between Western Europe and Turkey (Corridor
X), and Northern and Central Europe and the Adriatic (Corridors Vb and Vc). Efficient
passenger transport to serve the main cities and their surroundings, and to provide service
between the main cities, could also substantially improve living conditions for commuters
and better integrate Croatia and its neighbors. These possibilities represent opportunities for
Croatian operators, including the existing public undertakings, to grow their businesses.
10. The availability of capital coming from the EU funds to spur the investment cycle
underlines the need to continue developing the railway sector, and thus, reinforces the role of
Croatia as a transit corridor. Therefore, the economic program of the Government puts a
strong emphasis on investments in railway infrastructure. But beyond this general intention,
the immediate elaboration of a comprehensive strategic multimodal transport plan for Croatia
is needed, in order to channel around EUR 2.4 billion in EU funding to Croatian transport
sector4, for the 2014-2020 EU financing period. The scale of the resulting investment
program is likely to be unprecedented. One major challenge for the Government will then be
to put in place a professional team for the preparation, contracting, and monitoring of this
program.
11. The need for a new business model in railway sector. The implementation of a
vision based on Croatia as a transit and logistics hub in South East Europe requires a change
in the way that the sector operates. Despite all good intentions, the chances of success
regarding any longstanding improvement of the system would be minimal in the absence of a
collective effort from all of the public and private stakeholders involved in the Croatian
railway sector to change the sector culture. This has been an essential lesson learned from the
experience with railway reforms worldwide and in recent EU member states. The
2 http://www.worldbank.org/projects/P043195/rijeka-gateway-project?lang=en.
3 http://www.worldbank.org/projects/P093767/trade-transport-integration?lang=en.
4 The World Bank Team estimates that about EUR 1.95 million from the EU funds allocation to Croatia will be earmarked
for railways in the 2014-2020 financing perspective.
iv
Government needs to set its goals and vision and the accompanying the financial means that
it wants to allocate to the system, but it also needs to consider the importance of the overall
context of reforms, their political economy, and the process under which they are undertaken.
In the EU context, moving towards market-oriented and business-oriented railways is
mandatory from a regulatory standpoint, and also from a survival standpoint.
12. Going forward, there are three fundamental challenges facing Croatia’s railway
sector:
a) The first challenge is to determine how to ensure that the Government receives
value for the money it provides to the railway companies. The operational results
of railways have been achieved in Croatia by relying on significant financial
support from the State, with relatively limited efforts to rationalize its assets or
human resources. This raises the question of the sustainability of such a model in
the future EU context, especially if the allocation of public resources remains
heavily targeted towards operations at the expense of investments.
b) The second challenge is to determine how to make the relatively new railway
legal and institutional framework work for Croatia, especially after the EU
accession. Experience in both “old” and new EU member states has shown that
implementing the EU requirements is a necessary condition, but it is far from
being sufficient to develop railways as a viable transport industry. The move from
the legal compliance mode to nurturing a culture that leads to the intended
outcomes of EU policies has proven to be extremely difficult in many EU
countries—and especially so in new member states. The biggest challenges for the
Croatian authorities over the next several years will be to: (i) change the culture in
railway operation so as to create a nimble industry that adapts to changing market
conditions without resorting to constant Government policy (and funding)
interventions; and (ii) to refrain on the Government side from creating distortions
by intervening directly in the sector management.
c) The third challenge is to ensure that the key operators reach a financial
sustainability without relying on Government subsidies to cover operating costs—
because failure to meet this challenge would limit the Government’s capacity to
allocate funds to development.
The Government Needs to Receive Value for Money in the Railway Sector
13. The railway companies in Croatia are over-dependent on the financial support
of the State—which amounted to 0.7% of the GDP in 2011. For the Government to
maintain such an influx is already challenging, given the ongoing fiscal consolidation due to
a large budget deficit—equal to 4% of the GDP—and a very limited market access with a
non-investment grade sovereign credit rating. Therefore, the sector requires restructuring to
be more efficient. The Government needs to coordinate its efforts and ensure that short- to
medium-term targets on subsidies, staffing, network resizing and overall cost cutting are
meticulously executed.
v
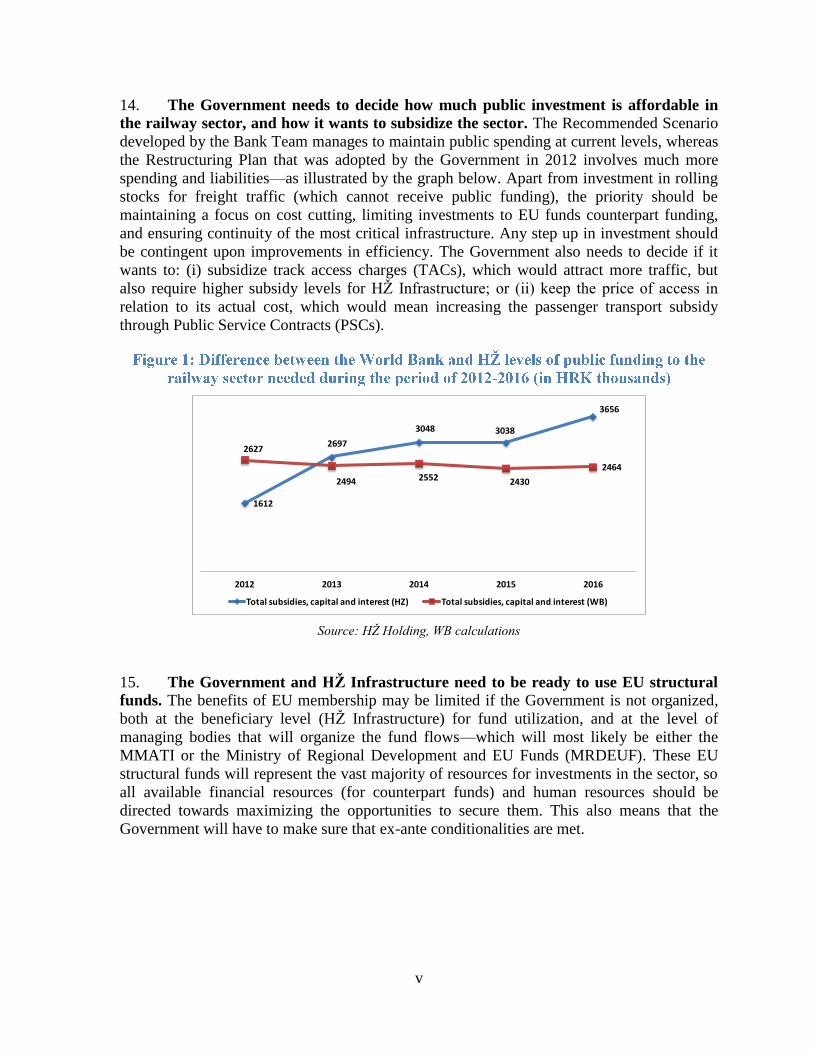
14. The Government needs to decide how much public investment is affordable in
the railway sector, and how it wants to subsidize the sector. The Recommended Scenario
developed by the Bank Team manages to maintain public spending at current levels, whereas
the Restructuring Plan that was adopted by the Government in 2012 involves much more
spending and liabilities—as illustrated by the graph below. Apart from investment in rolling
stocks for freight traffic (which cannot receive public funding), the priority should be
maintaining a focus on cost cutting, limiting investments to EU funds counterpart funding,
and ensuring continuity of the most critical infrastructure. Any step up in investment should
be contingent upon improvements in efficiency. The Government also needs to decide if it
wants to: (i) subsidize track access charges (TACs), which would attract more traffic, but
also require higher subsidy levels for HŽ Infrastructure; or (ii) keep the price of access in
relation to its actual cost, which would mean increasing the passenger transport subsidy
through Public Service Contracts (PSCs).
1612
2697
3048 3038
3656
2627
2494 2552 2430
2464
2012 2013 2014 2015 2016
Total subsidies, capital and interest (HZ) Total subsidies, capital and interest (WB)
Source: HŽ Holding, WB calculations
15. The Government and HŽ Infrastructure need to be ready to use EU structural
funds. The benefits of EU membership may be limited if the Government is not organized,
both at the beneficiary level (HŽ Infrastructure) for fund utilization, and at the level of
managing bodies that will organize the fund flows—which will most likely be either the
MMATI or the Ministry of Regional Development and EU Funds (MRDEUF). These EU
structural funds will represent the vast majority of resources for investments in the sector, so
all available financial resources (for counterpart funds) and human resources should be
directed towards maximizing the opportunities to secure them. This also means that the
Government will have to make sure that ex-ante conditionalities are met.
vi
Making the EU Legal Framework Work for Croatia: Reinforcing the Government and
Clarifying the Roles of Each Stakeholder
16. The Government should rethink its role, and put the appropriate human
resources in place to manage the sector. The capacity of the MMATI needs to be enhanced
to focus on setting policies with an adequate allocation of resources to carry them out, and to
monitor the railway sector’s performance. In this context, the MMATI should strengthen its
capacity to act as an informed and active owner by devising a clear and consistent ownership
policy and by ensuring conditions for transparent and accountable management in the HŽ
Companies—with the needed degree of professionalism and effectiveness. The MMATI
should also secure regular consultation channels with the MOF and the MRDEUF, to take
into account resource constraints at the Governmental level, and to ensure efficient use of EU
funds. In parallel, the agencies created to ensure safety and competition regulation in the
sector should also be reinforced to implement optimally the EU legal framework for
railways.
17. Focus the Government role in order to strengthen the HŽ Companies, and make
them more responsive to the market. There are three main steps that the Government needs
to take in order to enhance sector governance and establish a market-oriented and
competitive railway industry that requires a lower State contribution. These are: (i) to review
the levels of State support for the various lines of railway business, (ii) to adjust railway
infrastructure charges so as to stimulate an increase in traffic; and (iii) to create stronger
contracting relationships with the railway companies that provide services requested by the
Government for the maintenance of railway infrastructure and passenger services.
18. Create conditions for a wise investment policy in the railway sector. Most of the
railway infrastructure components in Croatia are old or in poor technical condition. The
integration of the Croatian railway network into the seamless European railway network will
require large investments to gradually achieve the same quality and safety standards. The
Note estimates that maintaining the system will annually require more than EUR 55 million
for infrastructure, EUR 30 million for freight rolling stock, and EUR 45 million for passenger
rolling stock. In the context of the EU accession, it is mandatory to orient most of the railway
investment programs towards EU Structural Funds—an objective that will also involve
significant investment. The key to that element is a comprehensive master plan that includes
identification of the appropriate size of the network.
19. Adapt the railway network to traffic flows, and make the Infrastructure Manager
independent. The change in Croatian economic activity since the early 1990s substantially
impacted railway transport demand, and led to diverging trends in traffic intensity within the
core railway network and the secondary lines. The latter carry an increasingly low level of
traffic. Very low traffic intensity means that the market generates low revenues and the costs
of operating railway infrastructure are essentially subsidized. Therefore, there is a need for
the Government to assess the options for network resizing, and to consider whether to close
the non-economic lines for operation and streamline funds for the modernization of railway
infrastructure towards revenue-generating lines that could in turn increase traffic intensity
and make the HŽ Companies competitive.
vii
20. Strengthen the Multi-annual Infrastructure Contract, and optimize the Track
Access Charge (TAC). The Multi-Annual Infrastructure Contract (MAIC) between the
Government and the Infrastructure Manager should cover a period of 4-5 years in order to
better plan and manage long-term contracts specific for track renewal or maintenance of
infrastructure. Investments included in the MAIC should be economically justified and
consistent with the overall State budgetary process. The MAIC should include clear and
transparent incentives for the Infrastructure Manager to cut the operating costs and enhance
the HŽ Companies’ productivity by achieving a performance level closer to the EU-27
average. The MAIC should include provisions for the optimization of the Track Access
Charge (TAC) through a better allocation of costs between passenger and freight users, and
the setting of appropriate levels of charges to attract more traffic on railway infrastructure.
Once these charges have been set, the intervention of the Government on a case-by-case
basis should be avoided.
21. Adjust passenger services to the market demand, and strengthen the Public
Service Contracts (PSCs). The PSCs should cover a longer period—around 10-15 years—to
provide visibility to the operator(s), especially when investments in rolling stock are
envisaged. The services required by the Government authorities under the PSCs should be
based on a careful analysis of market demand, cost, tariff structures, and availability of
alternative transport. The PSCs should include performance incentives for the provider(s) of
passenger services, and they should ensure realistic and critical investments in passenger
services. PSCs in Croatia are done yearly and split between a main contract managed by the
MMATI and smaller contracts with counties managed in a decentralized manner. This means
that some form of coordination might be needed to provide a big picture of the needs and
ensure consistency in the approach. In the medium-term, the Government could look into the
opportunities of the EU framework to open the market to other operators for subsidized
services.
22. Reconsider the State’s involvement in railway freight business. After EU accession,
HŽ Cargo will operate in a very competitive market. It will not only compete with the road
haulage industry, but also with new rail cargo operators that are not saddled with the rigid
costs or the rigid management environment that HŽ Cargo has to operate within. Therefore,
the Bank Team recommends that the State as an owner undertake legal, regulatory, financial
and technical due diligence regarding the potential privatization of HŽ Cargo, and evaluate
the existing interest of the market for developing a successful privatization. Otherwise, there
is a substantial risk that new entrants in the Croatian rail cargo market—following Croatia’s
EU accession—will take away HŽ Cargo’s profitable business, and leave the company in a
dire financial situation.
Ensuring the Sustainability of the Railway Operators
23. The current operational and financial performance of all of the HŽ Companies
is not sustainable. The plunge in traffic volumes that began in 2007-2008 negatively
impacted the financial and operational performance of HŽ Holding, which was already
largely reliant on State transfers. Revenues have been declining over the years; the main cost
drivers were low labor productivity combined with high labor costs and aged and non-
productive rolling stock. The major conclusion of the analysis is that the HŽ Companies
viii
should act urgently to: (i) become more market-oriented by increasing their ability to
generate and attract more traffic and business—and to generate sufficient revenues to cover
their expenses and generate return on capital; and (ii) put in place drastic cost cutting
measures.
24. The June 2012 Restructuring Plan represents a major step forward for
irreversible reforms. The most important outcome of this program was the dissolution of
the railways holding into three independent companies: HŽ Infrastructure, HŽ Cargo and HŽ
Passenger Transport. For each company, the Restructuring Plan outlined a detailed program
that was to be implemented over the period of 2012-2016. In addition to the analysis of
current business, it laid out strategic goals, and an assessment of infrastructure and human
resources, investment needs, and financial plans. Because it was developed in house by HŽ
Holding, it did not tackle the issues related to: (i) rightsizing the network; (ii) evaluating the
volume and range of services that the State should be purchasing from the HŽ Companies;
and (iii) identifying what would be an affordable level of global sector contribution from the
State. It also failed to present the overall strategy that the Government has for the sector. The
MMATI (together with the MOF) must take the lead in seeking input from HŽ infrastructure
and HŽ Passenger Transport, and developing this overall vision. The sustainability of the
Restructuring Plan has also not been secured from a financial standpoint. The cost cutting
measures are not ambitious enough in light of the financial status of the companies and their
situations vis-à-vis European competitors. At the same time, the investment plans are
substantial, and they rely heavily on Government support and on timely absorption of EU
funds—which has proven to be difficult for most new member states post–accession, and will
be particularly challenging in the case of Croatia, because it will be joining the EU during a
period of global economic instability.
25. Additional cost cutting measures are needed to sustain the sector. The Bank
Team conducted a financial analysis of the system that incorporated many of the measures
proposed in the Restructuring Plan, but refined the cost cutting targets to ensure
sustainability, and adjusted the investment plans. From this exercise, the Team developed
what is referred to in the Note as the ‘Optimistic’ or ‘Recommended’ Scenario. The
Recommended Scenario presents specific target values aimed at increasing the operational
performance of the railway sector. In addition, the Team also developed what is referred to in
the Note as the ‘Pessimistic’ Scenario, which is a conservative variant to account for the
possibility that the actual level of traffic will turn out to be worse than anticipated. The
Recommended Scenario proposes solutions for each HŽ Company to achieve operational
performance comparable with the average values of the EU-27 by 2016. From the financial
modeling, the Team derived concrete numbers indicating the annual targets for resizing of
staff, the dimensions of the necessary fleets for operating transport services, and the length of
the railway network. The outputs of the financial modeling illustrate that by implementing
the restructuring measures outlined in the Note, all of the HŽ Companies can become
financially viable by 2016. All of the companies would also be able to maintain achieved
efficiency throughout the forecast period ending in 2040. However, the cost cutting measures
proposed in the Recommended Scenario are much stronger than what was proposed in the
Restructuring Plan, especially in terms of staff reductions in HŽ Infrastructure and HŽ
Passenger Transport. The Recommended Scenario also calls for lower investment plans than
those in the Restructuring Plan. Regarding HŽ Cargo, the most viable solution is to privatize
ix
it as early as possible. Under the ‘Pessimistic Scenario’, greater levels of network and service
cuts and higher State subsidy levels would likely be required to enable the sector to survive
and hopefully prosper in the future.
26. HŽ Infrastructure: EU funding is expected to replace State subsidies as the major
source of financing for the modernization of Croatian railway infrastructure, but EU funds
will be limited to international corridors. The projected annual investment required to
preserve the current capacity of railway infrastructure is around HRK 425 million. In
essence, these costs will not be covered by the upcoming EU funds. Therefore, the long-term
financial and technical sustainability of HŽ Infrastructure will require major cost cutting
measures—and must include a significant increase in staff and asset productivity—through a
combination of traffic growth and rightsizing of staff and network.
27. HŽ Passenger Transport: Over the years, HŽ Passenger Transport has benefited
from: (i) low track access charges (TACs); (ii) traction costs that were essentially subsidized
by HŽ Cargo; and (iii) substantial financial resources through the PSCs. This has resulted in
a relatively good operational performance—but, at the same time, poses risks for future,
especially considering that the network utilization is three times lower than the EU-27
average, and the quality of service has not experienced significant improvement over the past
decade. Moreover, long distance and international services—which are usually among the
most profitable in Europe—are experiencing difficulties due inter alia to coordination issues.
In addition to reviewing the PSCs, the Bank Team recommends that HŽ Passenger Transport
focus on increasing the quality of services and cutting costs to adapt to the new environment
in which cross-subsidies from HŽ Cargo will be less likely to occur.
28. HŽ Cargo: Upon EU accession, HŽ Cargo will be the HŽ Company most exposed to
competition. Any delays in adapting to the new environment of open competition would
place HŽ Cargo in the situation of being increasingly squeezed between a deregulated road
freight industry and a private rail freight industry that will target the most profitable freight
segments with very low fixed costs. This would leave HŽ Cargo with the least profitable
business, which could complicate its chances of keeping a non-negligible market share. The
key issue for HŽ Cargo is low productivity in operation (under-utilization of locomotives,
wagons, and surplus staff). To overcome that problem, HŽ Cargo would need to allocate
approximately HRK 222 million annually for the modernization of its existing fleet. The
operational performance of HŽ Cargo—analyzed during the period of 2007-2012—
demonstrates its ability to cover its operating costs without any State support, but it is not
capable of covering its investment needs. From a global market standpoint, traffic intensity
might increase if countries in the region adapt a harmonized policy for TACs—which might
provide opportunities. However, management of HŽ Cargo will also need to be more agile to
retain its market share in a changing business environment with the arrival of private
operators in this segment. Without ambitious rationalization and the support of a major
player in the European market that could secure a substantial market share for HŽ Cargo,
privatization plans should be put forward at the earliest moment feasible.
29. Subsidiaries of the various undertakings: The HŽ Companies should review and
restructure their portfolios of subsidiaries through absorption, privatization or liquidation,
depending on each given case. Most of the subsidiaries are currently serving only their parent

x
companies in a non-competitive context—leading to losses or artificially high cost centers. A
sound reassessment of the subsidiary situation would clarify both the actual financial
situation of each company and help rationalize the relationships between them while tackling
the joint subsidiaries.
xi
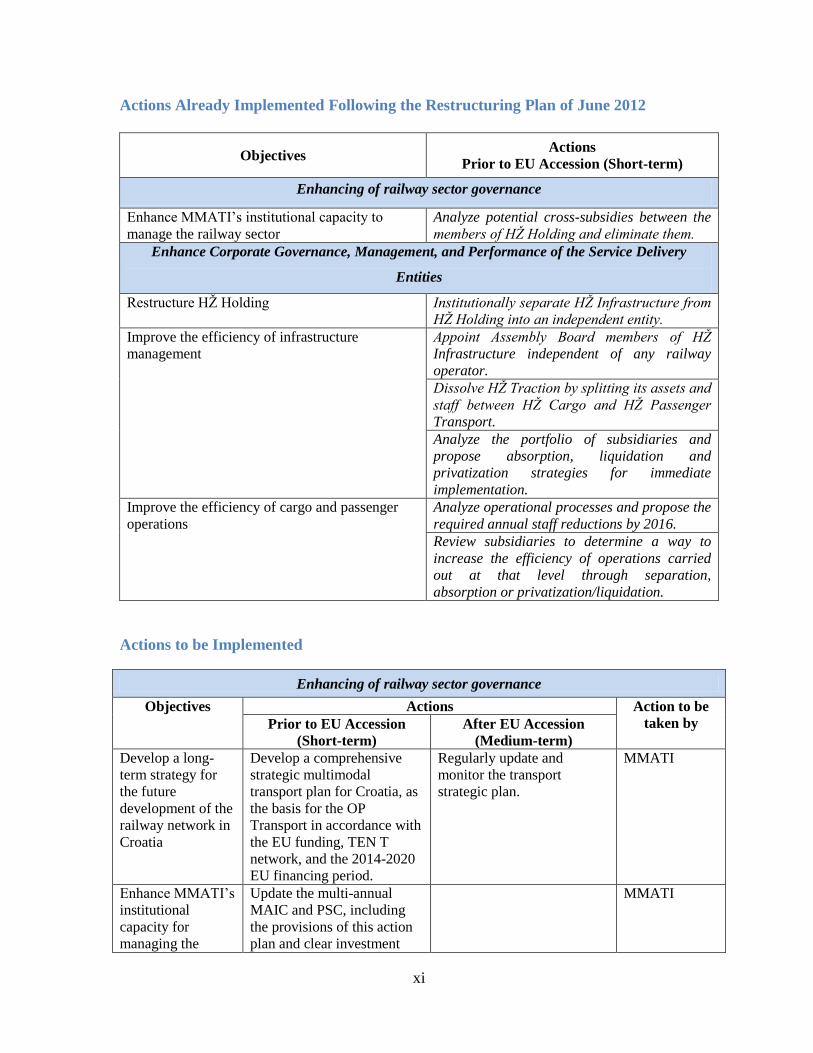
Actions Already Implemented Following the Restructuring Plan of June 2012
Objectives Actions
Prior to EU Accession (Short-term)
Enhancing of railway sector governance
Enhance MMATI’s institutional capacity to
manage the railway sector Analyze potential cross-subsidies between the
members of HŽ Holding and eliminate them. Enhance Corporate Governance, Management, and Performance of the Service Delivery
Entities
Restructure HŽ Holding Institutionally separate HŽ Infrastructure from
HŽ Holding into an independent entity. Improve the efficiency of infrastructure
management Appoint Assembly Board members of HŽ
Infrastructure independent of any railway
operator. Dissolve HŽ Traction by splitting its assets and
staff between HŽ Cargo and HŽ Passenger
Transport. Analyze the portfolio of subsidiaries and
propose absorption, liquidation and
privatization strategies for immediate
implementation. Improve the efficiency of cargo and passenger
operations Analyze operational processes and propose the
required annual staff reductions by 2016. Review subsidiaries to determine a way to
increase the efficiency of operations carried
out at that level through separation,
absorption or privatization/liquidation.
Actions to be Implemented
Enhancing of railway sector governance
Objectives Actions Action to be
taken by Prior to EU Accession (Short-term)
After EU Accession (Medium-term)
Develop a long-
term strategy for
the future
development of the
railway network in
Croatia
Develop a comprehensive
strategic multimodal
transport plan for Croatia, as
the basis for the OP
Transport in accordance with
the EU funding, TEN T
network, and the 2014-2020
EU financing period.
Regularly update and
monitor the transport
strategic plan.
MMATI
Enhance MMATI’s
institutional
capacity for
managing the
Update the multi-annual
MAIC and PSC, including
the provisions of this action
plan and clear investment
MMATI
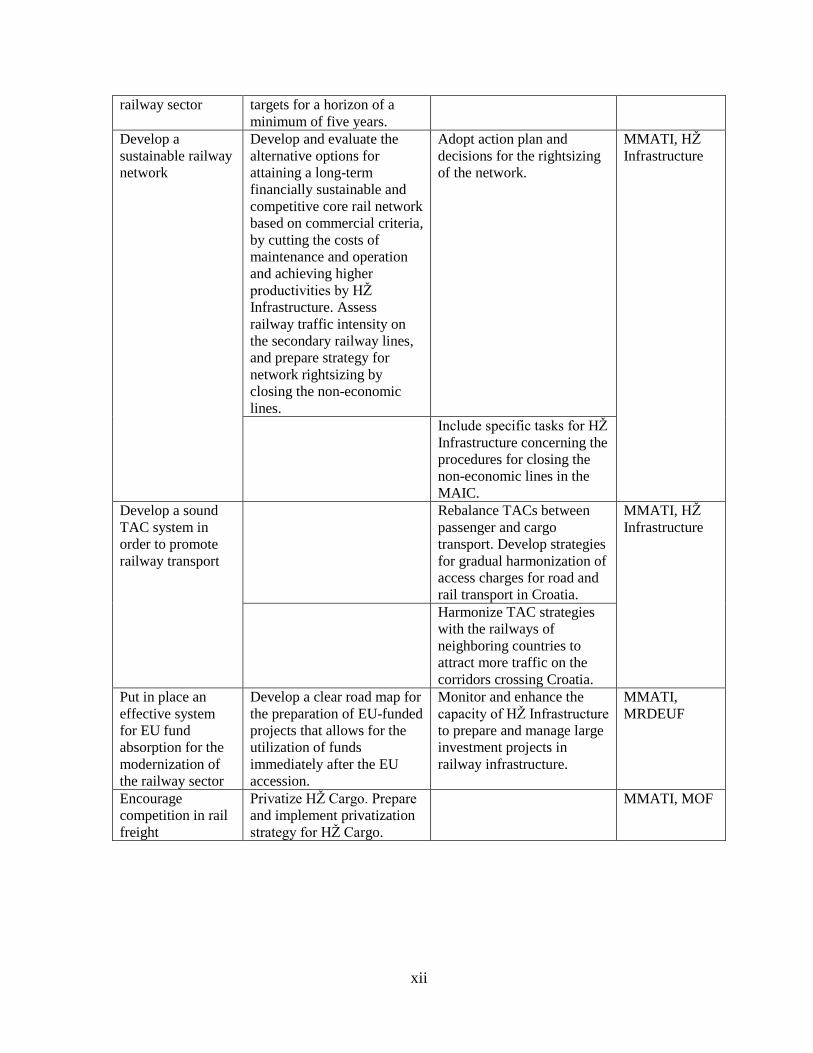
xii
railway sector targets for a horizon of a
minimum of five years. Develop a
sustainable railway
network
Develop and evaluate the
alternative options for
attaining a long-term
financially sustainable and
competitive core rail network
based on commercial criteria,
by cutting the costs of
maintenance and operation
and achieving higher
productivities by HŽ
Infrastructure. Assess
railway traffic intensity on
the secondary railway lines,
and prepare strategy for
network rightsizing by
closing the non-economic
lines.
Adopt action plan and
decisions for the rightsizing
of the network.
MMATI, HŽ
Infrastructure
Include specific tasks for HŽ
Infrastructure concerning the
procedures for closing the
non-economic lines in the
MAIC. Develop a sound
TAC system in
order to promote
railway transport
Rebalance TACs between
passenger and cargo
transport. Develop strategies
for gradual harmonization of
access charges for road and
rail transport in Croatia.
MMATI, HŽ
Infrastructure
Harmonize TAC strategies
with the railways of
neighboring countries to
attract more traffic on the
corridors crossing Croatia. Put in place an
effective system
for EU fund
absorption for the
modernization of
the railway sector
Develop a clear road map for
the preparation of EU-funded
projects that allows for the
utilization of funds
immediately after the EU
accession.
Monitor and enhance the
capacity of HŽ Infrastructure
to prepare and manage large
investment projects in
railway infrastructure.
MMATI,
MRDEUF
Encourage
competition in rail
freight
Privatize HŽ Cargo. Prepare
and implement privatization
strategy for HŽ Cargo.
MMATI, MOF
xiii
Enhance Corporate Governance, Management, and Performance of the Service Delivery Entities
Objectives Actions Action to be
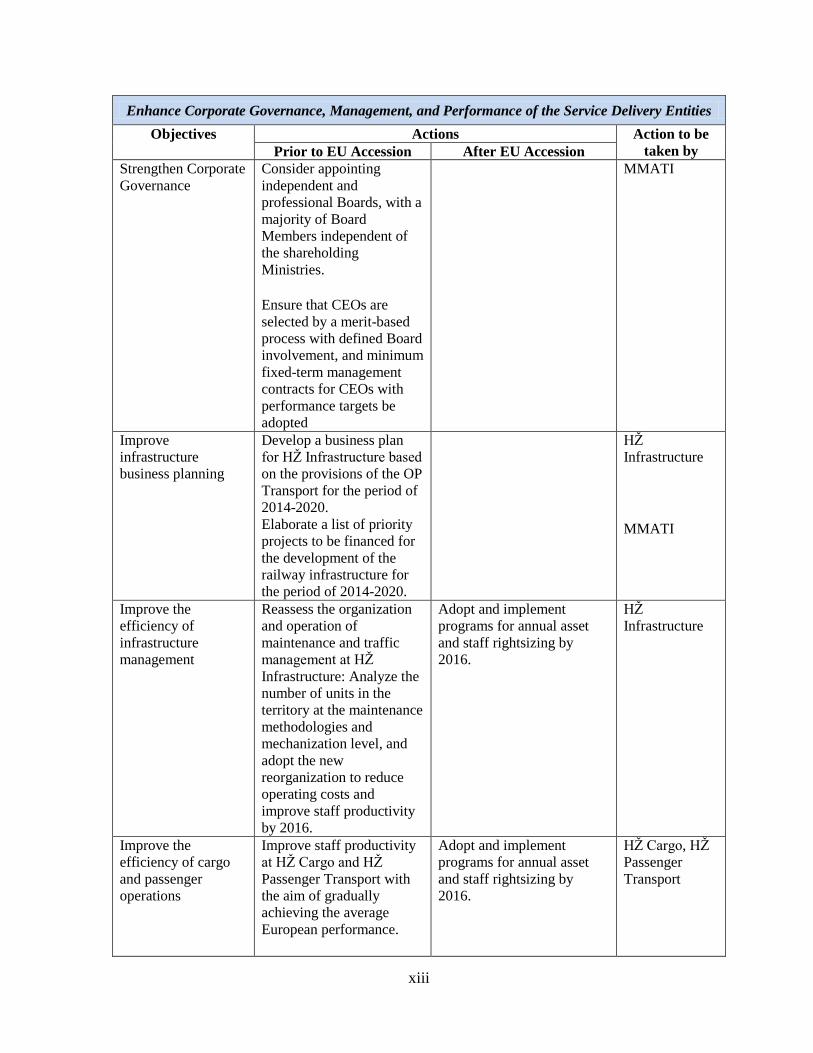
taken by Prior to EU Accession After EU Accession Strengthen Corporate
Governance Consider appointing
independent and
professional Boards, with a
majority of Board
Members independent of
the shareholding
Ministries. Ensure that CEOs are
selected by a merit-based
process with defined Board
involvement, and minimum
fixed-term management
contracts for CEOs with
performance targets be
adopted
MMATI
Improve
infrastructure
business planning
Develop a business plan
for HŽ Infrastructure based
on the provisions of the OP
Transport for the period of
2014-2020. Elaborate a list of priority
projects to be financed for
the development of the
railway infrastructure for
the period of 2014-2020.
HŽ
Infrastructure
MMATI
Improve the
efficiency of
infrastructure
management
Reassess the organization
and operation of
maintenance and traffic
management at HŽ
Infrastructure: Analyze the
number of units in the
territory at the maintenance
methodologies and
mechanization level, and
adopt the new
reorganization to reduce
operating costs and
improve staff productivity
by 2016.
Adopt and implement
programs for annual asset
and staff rightsizing by
2016.
HŽ
Infrastructure
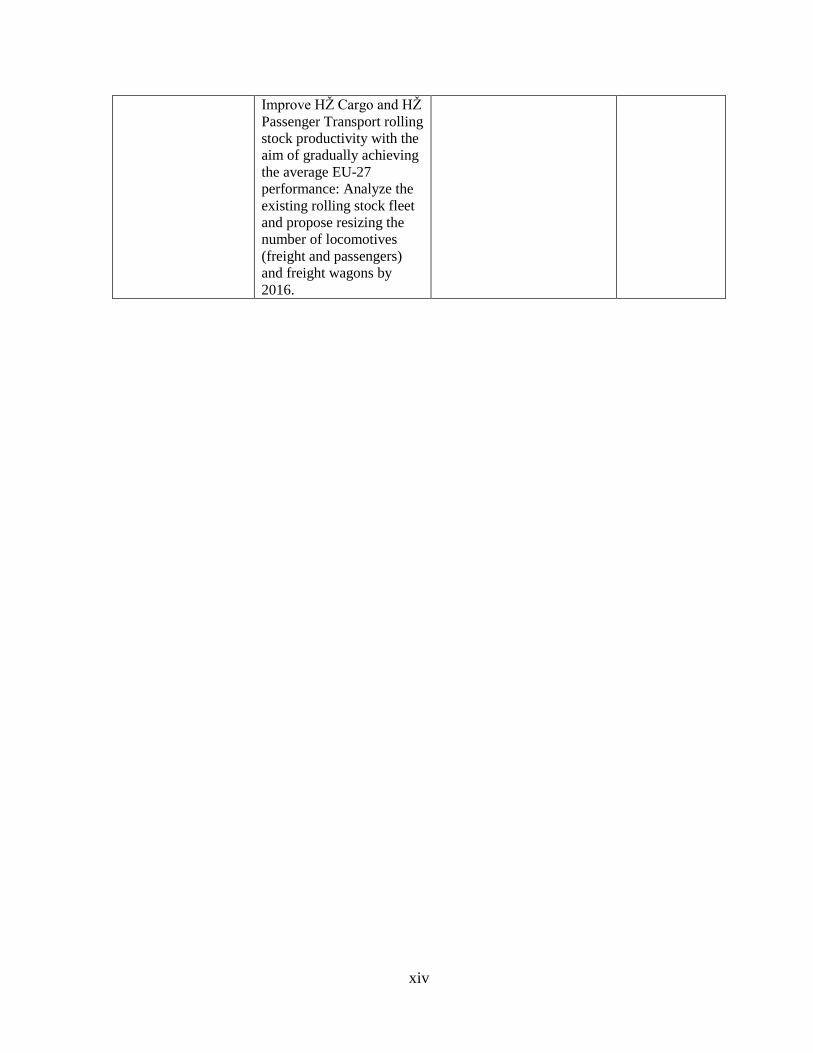
Improve the
efficiency of cargo
and passenger
operations
Improve staff productivity
at HŽ Cargo and HŽ
Passenger Transport with
the aim of gradually
achieving the average
European performance.
Adopt and implement
programs for annual asset
and staff rightsizing by
2016.
HŽ Cargo, HŽ
Passenger
Transport
xiv
Improve HŽ Cargo and HŽ
Passenger Transport rolling
stock productivity with the
aim of gradually achieving
the average EU-27
performance: Analyze the
existing rolling stock fleet
and propose resizing the
number of locomotives
(freight and passengers)
and freight wagons by
2016.
1
CROATIA
RAILWAY POLICY NOTE
1. The main objective of this Policy Note (the Note) is to review the operational and
financial sustainability of the Croatian Railway system and to identify immediate and
medium-term actions necessary for a smooth integration into the European transport
market. The Croatian railway sector has undergone a profound transformation over the past
decade to meet EU accession criteria. Significant changes have taken place in the legal,
institutional, and organizational framework, resulting in harmonized legislation, and new
institutions for competition and safety regulation—and reorganization within the Croatian
Railways (HŽ Holding) of railway transport service, operations, and railway infrastructure
management. Following these developments, the operational and financial performance of
HŽ Holding improved, and it is currently superior to other railways in the Western Balkans
region. The Note complements the findings of a comprehensive study on railway reforms in
South East Europe—published by the World Bank in 2011—that ranks HŽ Holding above its
neighbors and on a par with several EU railways in terms of legal and institutional
environment and operational and financial performance5. However, major efforts remain to
be undertaken to make this new legal and institutional framework work for Croatia,
especially following the country’s upcoming EU accession in mid-2013.
2. The railway sector in Croatia must be prepared to face the challenges of the
European open transport market. Many railways in South East Europe are in a difficult
situation, and operate within a less competitive environment than the one that accompanies
EU accession. Moreover, the results achieved in Croatia come at a relatively high cost to
taxpayers (close to HRK 2 billion per year), and the system may be challenged in the coming
years by: (i) the financing demands of an ambitious and needed investment program; (ii) the
accumulated backlog in maintenance; and (iii) the increased competition for operators—
especially in freight traffic. The experience in the EU has shown that making the EU
framework work for railways and for EU countries goes beyond ensuring legal and
institutional compliance with the EU Acquis Communautaire.
3. The evolution of the Croatian economy requires reviewing the State financial
support for the railway sector. After a steady GDP growth from 2000-2007 of between 4%
and 6%, led by a rebound in tourism and credit-driven consumer spending, Croatia
experienced an abrupt slowdown in the economy in 2008, and has yet to recover. The
5 In March 2011, the World Bank presented a detailed analysis of the railway systems of Croatia and the neighboring
countries, as a part of the study titled “Railway Reform in South East Europe and Turkey: On the Right Track?” The study
was also presented to the European Commission in Brussels, as well as to Croatian authorities in Zagreb.
2
government of Croatia (the Government) has had to face challenging issues, including a high
unemployment rate, a growing trade deficit, uneven regional development, and a challenging
investment climate in the context of a global financial crisis. High foreign debt, an anemic
export sector, a strained State budget, and overreliance on tourism revenue may jeopardize
the economic progress of the country. The Government needs to accelerate the
implementation of delayed structural reforms—and to cut public spending—in order to avoid
the risk of deepening the recession in 2013 and the coming years. In this context, it must act
immediately to ensure that the Croatian Railway System improves its financial sustainability
and reduces its dependence on public funds.
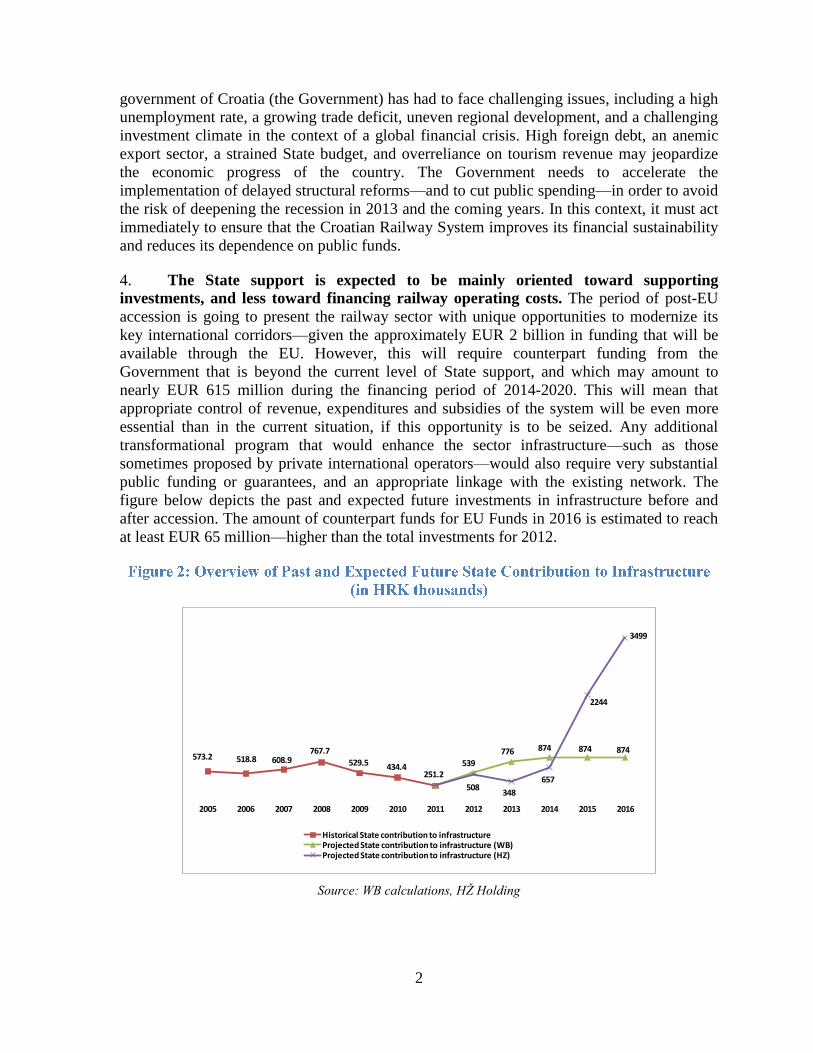
4. The State support is expected to be mainly oriented toward supporting
investments, and less toward financing railway operating costs. The period of post-EU
accession is going to present the railway sector with unique opportunities to modernize its
key international corridors—given the approximately EUR 2 billion in funding that will be
available through the EU. However, this will require counterpart funding from the
Government that is beyond the current level of State support, and which may amount to
nearly EUR 615 million during the financing period of 2014-2020. This will mean that
appropriate control of revenue, expenditures and subsidies of the system will be even more
essential than in the current situation, if this opportunity is to be seized. Any additional
transformational program that would enhance the sector infrastructure—such as those
sometimes proposed by private international operators—would also require very substantial
public funding or guarantees, and an appropriate linkage with the existing network. The
figure below depicts the past and expected future investments in infrastructure before and
after accession. The amount of counterpart funds for EU Funds in 2016 is estimated to reach
at least EUR 65 million—higher than the total investments for 2012.
573.2 518.8 608.9767.7
529.5 434.4251.2
539
776 874 874 874
508348
657
2244
3499
2005 2006 2007 2008 2009 2010 2011 2012 2013 2014 2015 2016
Historical State contribution to infrastructureProjected State contribution to infrastructure (WB)Projected State contribution to infrastructure (HZ)
Source: WB calculations, HŽ Holding
3
5. Therefore, the Note addresses future challenges and outstanding weaknesses of
the current system—and outlines priority actions necessary to achieve sustainability in
the context of the EU accession—rather than focusing on the well-known achievements. The proposed actions should be finalized within the next 12-18 months, but longer-term
actions necessary for the consolidation of the Croatian railway transport industry have also
been proposed. All existing issues should be addressed with a holistic approach—prioritizing
actions to be achieved before the EU accession. Delays in addressing the present challenges
would increase the State burden for sector financing. It could also undermine the
competitiveness of the Croatian railway operator(s) in the open European market in freight,
and the sector capacity to retain a significant market share consistent with EU policy
objectives.
6. There was already a reform undertaken in 2006, with minimal results. The 2006
reform of the railway transport sector in Croatia was a consequence of the Croatian
negotiations prior to accession to the EU, which imposed modifications in the way the sector
operates in order to comply with EU regulations. The EU places a major focus on
deregulation of the railway sector, vertical disintegration of railway companies, increased
private participation in transport services, and standardization of transport infrastructure and
services—most of which was still to be introduced in Croatia. The actual EU Accession in
July 2013 became an opportunity to make additional long-needed changes in HŽ Holding,
and address challenges amplified by the global economic crisis.
7. During the course of the preparation of the Note, the Government adopted a far
reaching Restructuring Plan for HŽ Holding. After a first round of discussions with the
World Bank team (the Team), the Government adopted a Restructuring Plan for HŽ Holding
in June 2012 that already incorporated a significant number of measures covered in the Note.
The Restructuring Plan included the dissolution of the railways holding into three
independent companies: HŽ Infrastructure, HŽ Cargo and HŽ Passenger Transport. The
assets and staff of the traction company would be divided between the cargo and passenger
companies. These measures were formalized between October 2012 and January 2013.
Therefore, sentences in italics throughout the Note highlight either a context that has changed
after the implementation of the plan, or actions that have already been incorporated into the
Government plan. A detailed overview of the Restructuring Plan for HŽ Holding is presented
in Chapter H.
8. Structure of the Policy Note. The Note first presents a brief overview of the
Croatian railway sector, listing the main challenges that it is currently facing, and identifying
the main areas of intervention for the development of a financially sustainable sector—which
should guide any thorough sector reform program in the long-run. Sector governance
challenges are presented, outlining the sector’s high dependency on State support, its
organizational weaknesses, and its market distortions. This is followed by more detailed
historical analysis of HŽ Holding’s performance, corporate governance issues, and
investment needs. The operational and financial performance of each major line of business
of HŽ Holding is assessed, highlighting their competitiveness issues. Following the adoption
of the Restructuring Plan, the Bank Team used a global financial model to identify measures
that might be necessary to make the system sustainable in the long–run. The Team
considered a range of optimistic and pessimistic scenarios—which may call for additional
4
measures to be taken to complement the measures laid out in the Restructuring Plan. The
Note concludes with the presentation of these scenarios, the targets that should be fixed to
business lines in cost-cutting, and actions that the Government might take to ensure that the
system is sustainable and to secure the successful integration of the Croatian railway sector
into the EU. It highlights the choices that remain open to the Government in terms of sector
spending and financial structuring of its support in a constrained fiscal environment.
9. Benchmarking. For the purpose of analysis undertaken under the Note, the
performance of Croatian undertakings (HŽ Holding and its subsidiary companies) was
benchmarked against the EU market to ensure that the appropriate level of performance
would be attained. The Team assessed the performance of Croatian Railways as compared
with railways of a number of selected EU member states with comparable size and transit
positions. The member states chosen were Latvia, Lithuania, Finland and Slovakia. The
average EU-27 values for selected indicators were also used as benchmarks for
competitiveness.6 The main benchmarking indicators for operational performance were
traffic intensity, labor productivity, and rolling stock productivity. The main benchmarking
indicators for financial performance were cost recovery ratio7, viability ratio
8, and wage bill
to total operating revenues ratio.
6 Although the international benchmarks are a useful tool to identify the necessary improvements in the railway
performance, all comparisons must be carefully evaluated, taking into consideration geographical position, traffic structure,
market conditions, and many other specific factors that vary by railway—even in the case of similar railway network
dimensions. 7 Cost Recovery Ratio is defined as the degree of coverage of total operating costs with total revenue, including State
support. 8 Viability Ratio is defined as the ratio of commercial revenue divided by total operating costs.
5
10. Croatia has a favorable geographic location for railway transport, with key
sections of the pan-European transport corridors crossing the country. The railway
network in Croatia consists of 2,723 km of track—close to the European average in terms of
network density, considering the country’s total area or population. The main characteristic
of the Croatian railway network is its transit potential along important European corridors.
The most important line is the Pan-European rail Corridor X, which crosses the country from
West to East, and currently carries the highest volume of traffic. Other important lines are
Corridor Vb, which connects the Port of Rijeka with Zagreb and the Hungarian Border, and
Corridor Vc, which runs North to South within Croatia to the Port of Ploče. The railway line
from Zagreb to Split is also an important connection for the core network of the country.
11. Railways could play an important role in Croatia in supporting the sustainable
development of the country. The railway sector has to compete with the road sector for
State funding. Roads have benefited from State funding equivalent to approximately 4% of
the GDP annually for road development since 2000, in comparison with less than 1% of the
GDP provided to railways—essentially for railway operating costs. In addition to their roles
in developing a multimodal transport system, railways are generally more environmentally
friendly—being responsible for only 1.5% of transport related CO2 emissions, compared to
91% generated by roads9. They are also generally safer: for the past few years Croatia has
registered 0-5 rail fatalities annually, compared to more than 600 road fatalities10
. The
railway infrastructure occupies 2-3 times less land per passenger or freight unit than road
transport. Its external costs (safety, pollution, congestion) represent only 1% of those of
roads. Therefore, an efficient rail transport system is a critical element of the recommended
EU 2020 strategy, and could improve Croatia’s environment-related targets in terms of
energy use. With improved intermodal connections, an efficient railway system could also be
both a driver of growth of international logistics to the rest of Europe and a means of
attracting investments in Croatia itself.
12. The legal and institutional framework for the railway transport sector has been
harmonized with the EU Acquis Communautaire. The main criteria of compliance have
been fulfilled by Croatia. This includes: (i) the gradual opening of the transport market—to
be completed by the EU accession date; (ii) the establishment of regulatory institutions; and
(iii) the adoption of Public Service Contracts (PSCs) to fund passenger services, and rules for
financing the infrastructure. The regulatory institutions are now in place. The Regulatory
Body (ARTŽU11
, which acts as the appeal entity for competition and market access issues)
and the Safety Agency are still relatively new, and their capacity to respond to the challenges
after EU accession should continue to be strengthened. The Ministry of Maritime Affairs,
Transport and Infrastructure (MMATI) is in charge of setting the sector policy, supervising
the State-owned railway companies (as owner), and contracting various services with the
railway companies (as client).
9 EC Statistics 2010. 10 EC Statistics 2010.
11 Railway Market Regulatory Agency (Agencija za regulaciju tržišta željezničkih usluga).
6
13. After the dissolution of Yugoslavia in 1991, Croatian Railways (HŽ Holding)
was established as the exclusive operator of railway transport in Croatia. The company
has gone through several organizational changes. Prior to October 2012, it was organized as a
holding, with four major lines of business organized as companies: HŽ Passenger Transport,
HŽ Cargo, HŽ Infrastructure, and HŽ Traction. Each company had a number of subsidiaries
that mainly served their parent companies.
14. Railways in Croatia are facing multiple challenges, and there is no single model
with which to address them. Across the EU, the railway transport sector has been subjected
to very complex changes, and the speed and models of reforms have varied significantly by
country. As a new member state, Croatia’s railway industry will have to compete in the
integrated transport market with railways that are more advanced in implementing
commercial rules, more efficient in operations, and stronger financially. Croatia is also
joining the EU at one of the worst economic times in recent history—which for a cyclical
business such as transport, means serious strains on operators’ financial viability. Given these
circumstances, it is expected that the Government will define how much it can afford to
financially support railways, and plan resources accordingly—and the companies of HŽ
Holding will be restructured in order to become financially stable and competitive in the
European transport market, in the new conditions of the revised State contribution.
15. Structural, organizational and operational changes may be envisaged to address
the new challenges. Due to the complexity and cost of implementing measures—especially
in infrastructure—some goals (e.g., improving the technical condition of the infrastructure)
will require a long time to be achieved. The EU funds to be absorbed in the sector
(essentially rehabilitation and upgrading of Corridors X and Vb) will also de facto introduce
rigidity into the financial setting, given the large amount of Government funds or guaranteed
loans required to complement EU Structural Funds (because EU funds will only finance a
fraction of each investment).
16. What type of reform for the railway sector in Croatia? Croatia has achieved a
reliable legal and institutional framework for the railway sector. The Government roles have
been clearly established, the regulatory framework is in place, HŽ Holding has been
organized fully in line with the EU directives, and the Croatian rail market will soon be fully
opened to competition. Not many changes are to be made to improve the general framework
put in place by the Government for railways. However, for many new EU member states, this
has been the point when reforms have stopped, and this has created serious problems for the
governments and jeopardized overall railway reforms. The newly created environment has no
meaning if the new entities are not able to act according to the new rules. The next phase in
railway reforms in Croatia is to develop the conditions that will make railways a nimble
industry that can adapt by itself to market signals, without needing to resort to continuous
State intervention. Only then will this environment become fully functional. The tools for
such reform are essentially in strengthening operational governance arrangements with full
accountability of the key public players, and a different use of financial resources for the
sector.
7
17. The key overarching goal of the Government should be to develop a financially
sustainable railway sector in Croatia that is based on a transparent public financial
support to railways, and consistent with transport market demand, EU transport
policies, and prudent fiscal policies. The Government’s key role is to create an environment
to nurture such a railway sector. The new environment should be built on the value-for-
money principle—the State benefitting from enhanced services, in return for its financial
contribution. Due to the complexity of actions to be undertaken and the duration of a full
implementation of this goal, a phased approach is recommended along two areas of
interventions: (i) enhancing the governance of the railway transport sector; and (ii) improving
the corporate governance, management and performance of the HŽ Holding companies.
These interventions are defined according to the results of the diagnostic and analyses
developed in the sections that follow. The elements laid out below constitute the key pillars
for a global reform. They are presented as a full consistent set in order to serve as a guide
beyond the plan approved in June 2012 by the Government, which tackles only part of that
set of elements. In addition to these two areas of reform, a change management process is
necessary within the operators to ensure that a business culture is developed in parallel,
within the railway industry.
18. Enhancing the governance of the railway transport sector. This will be
accomplished by implementing methods of financing railways according to the principle of
value for money, and by enhancing the accountability of the various stakeholders to provide
the expected quality of services. The key actions include:
a) Eliminating transport market distortions created by the existing cross-subsidies,
and abolishing State subsidies for HŽ Holding that are inconsistent with the EU
framework;
b) Improving the contractual relationships of the State with the railway service
providers HŽ Infrastructure and HŽ Passenger Transport, based on updated multi-
annual infrastructure contracts (MAIC) for HŽ Infrastructure, and Passenger
Service Contracts (PSC) for HŽ Passenger Transport—with specific efficiency
targets;
c) Developing a sustainable rail network by: (i) rightsizing the rail network based on
an assessment of traffic flows to increase the traffic density on the core railway
network; (ii) focusing resources on maintenance of the core network; and (iii)
allocating public funds for maintenance and development of the railway
infrastructure based on achievement of specific key performance indicators for
quality and safety;
d) Developing a sustainable fully-funded railway passenger transport market by: (i)
putting in place a multi-annual PSC framework between the Government, the
local governments, and HŽ Passenger Transport based on the assessment of
8
market demand for such services; (ii) introducing performance incentives for HŽ
Passenger Transport to increase the quality of services and reduce its costs; and
(iii) ensuring realistic and critical investments in passenger services—in the
longer–term, the Government may consider opening the market for services to
other operators and awarding PSCs competitively;
e) Assessing the conditions and preparing HŽ Cargo for competition in the open
transport market—given the expected future strong competition in the freight
transport market, some options to be considered in order to secure HŽ Cargo’s
market share include restructuring of activities based on a stronger commercial
approach and potential privatization.
19. Improving the corporate governance, management and performance of the HŽ
Holding companies (HŽ Infrastructure, HŽ Cargo, HŽ Passenger Transport and HŽ
Traction). The key actions include:
a) Enhancing the corporate governance of the companies through independent
boards, better business planning, merit-based selection of management,
incentives-based management contracts, and strong accountability;
b) Restructuring HŽ Holding by adopting two major changes: (i) the establishment
of HŽ Infrastructure as independent entity from the holding, and (ii) the
dissolution of HŽ Traction through the absorption of its assets and staff by HŽ
Cargo and HŽ Passenger Transport—this step was agreed upon in June 2012, and
is under implementation;
c) Reassessing HŽ Infrastructure’s organization and its operation and maintenance
procedures to reduce the railway infrastructure’s operating costs; gradually
decreasing State support for operating costs, and thereby creating more room for
State support to the EU-funded programs and renewal of the core network;
d) Implementing new policies and measures for human resource management at HŽ
Infrastructure, HŽ Cargo, and HŽ Passenger Transport to increase labor
productivity and better control labor costs (mentioned in principle in the
Restructuring Plan);
e) Reassessing the assets of HŽ Cargo and HŽ Passenger Transport (locomotives
and wagons) to achieve higher productivity in order to match the average EU-27
levels in the medium-term (mentioned in principle in the Restructuring Plan).
9
20. The current railway transport market in Croatia has specific characteristics that
may be revisited in order to create a stronger and more market responsive sector. The
Government should take the following steps in order to enhance railway sector governance
and incentivize the market forces to establish a competitive railway industry requiring a
lower State contribution: (i) adjust the level and allocation of State support for various lines
of business; (ii) adjust the Track Access Charges (TACs); and (iii) create stronger contracting
relationships with the companies that the Government utilizes for the maintenance of
infrastructure and passenger services.
21. The State subsidy for railways is still high, and efforts to reduce it should
continue. The railway sector in Croatia has received strong State support over the past years,
as illustrated by Table 1. Despite its decreasing trend, in 2011 State support still accounted
for more than half of the total annual needs of HŽ Holding to cover its operating costs and
investment needs; in the case of HŽ Infrastructure the percentage of State contribution was
83% in 2011.
22. Table 1 also demonstrates that the State gave substantial support to all of the
companies of HŽ Holding. EU regulations limit State support for the railway sector to only
infrastructure and passenger services through PSCs. During the period of 2005-2011, HŽ
Holding received State subsidies for freight and traction activities—as well as for passenger
transport aside from the PSC. It is highly recommended that the Government assess the
compliance with EU regulations with regard to subsidies before EU accession—even if the
outstanding amounts of subsidy are very low (see Table 1: rows in italics indicate
questionable subsidies).
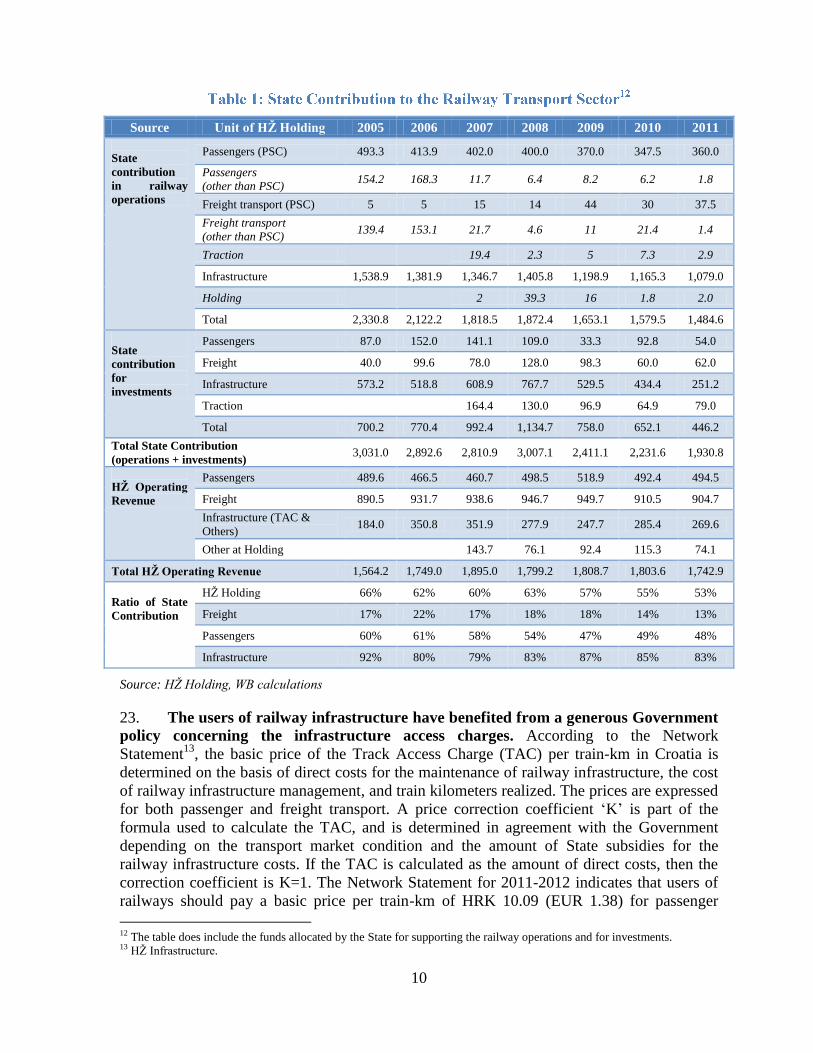
10
Source Unit of HŽ Holding 2005 2006 2007 2008 2009 2010 2011
State
contribution
in railway
operations
Passengers (PSC) 493.3 413.9 402.0 400.0 370.0 347.5 360.0
Passengers
(other than PSC) 154.2 168.3 11.7 6.4 8.2 6.2 1.8
Freight transport (PSC) 5 5 15 14 44 30 37.5
Freight transport
(other than PSC) 139.4 153.1 21.7 4.6 11 21.4 1.4
Traction
19.4 2.3 5 7.3 2.9
Infrastructure 1,538.9 1,381.9 1,346.7 1,405.8 1,198.9 1,165.3 1,079.0
Holding
2 39.3 16 1.8 2.0
Total 2,330.8 2,122.2 1,818.5 1,872.4 1,653.1 1,579.5 1,484.6
State
contribution
for
investments
Passengers 87.0 152.0 141.1 109.0 33.3 92.8 54.0
Freight 40.0 99.6 78.0 128.0 98.3 60.0 62.0
Infrastructure 573.2 518.8 608.9 767.7 529.5 434.4 251.2
Traction
164.4 130.0 96.9 64.9 79.0
Total 700.2 770.4 992.4 1,134.7 758.0 652.1 446.2
Total State Contribution
(operations + investments) 3,031.0 2,892.6 2,810.9 3,007.1 2,411.1 2,231.6 1,930.8
HŽ Operating
Revenue
Passengers 489.6 466.5 460.7 498.5 518.9 492.4 494.5
Freight 890.5 931.7 938.6 946.7 949.7 910.5 904.7
Infrastructure (TAC &
Others) 184.0 350.8 351.9 277.9 247.7 285.4 269.6
Other at Holding
143.7 76.1 92.4 115.3 74.1
Total HŽ Operating Revenue 1,564.2 1,749.0 1,895.0 1,799.2 1,808.7 1,803.6 1,742.9
Ratio of State
Contribution
HŽ Holding 66% 62% 60% 63% 57% 55% 53%
Freight 17% 22% 17% 18% 18% 14% 13%
Passengers 60% 61% 58% 54% 47% 49% 48%
Infrastructure 92% 80% 79% 83% 87% 85% 83%
Source: HŽ Holding, WB calculations
23. The users of railway infrastructure have benefited from a generous Government
policy concerning the infrastructure access charges. According to the Network
Statement13
, the basic price of the Track Access Charge (TAC) per train-km in Croatia is
determined on the basis of direct costs for the maintenance of railway infrastructure, the cost
of railway infrastructure management, and train kilometers realized. The prices are expressed
for both passenger and freight transport. A price correction coefficient ‘K’ is part of the
formula used to calculate the TAC, and is determined in agreement with the Government
depending on the transport market condition and the amount of State subsidies for the
railway infrastructure costs. If the TAC is calculated as the amount of direct costs, then the
correction coefficient is K=1. The Network Statement for 2011-2012 indicates that users of
railways should pay a basic price per train-km of HRK 10.09 (EUR 1.38) for passenger
12 The table does include the funds allocated by the State for supporting the railway operations and for investments. 13 HŽ Infrastructure.
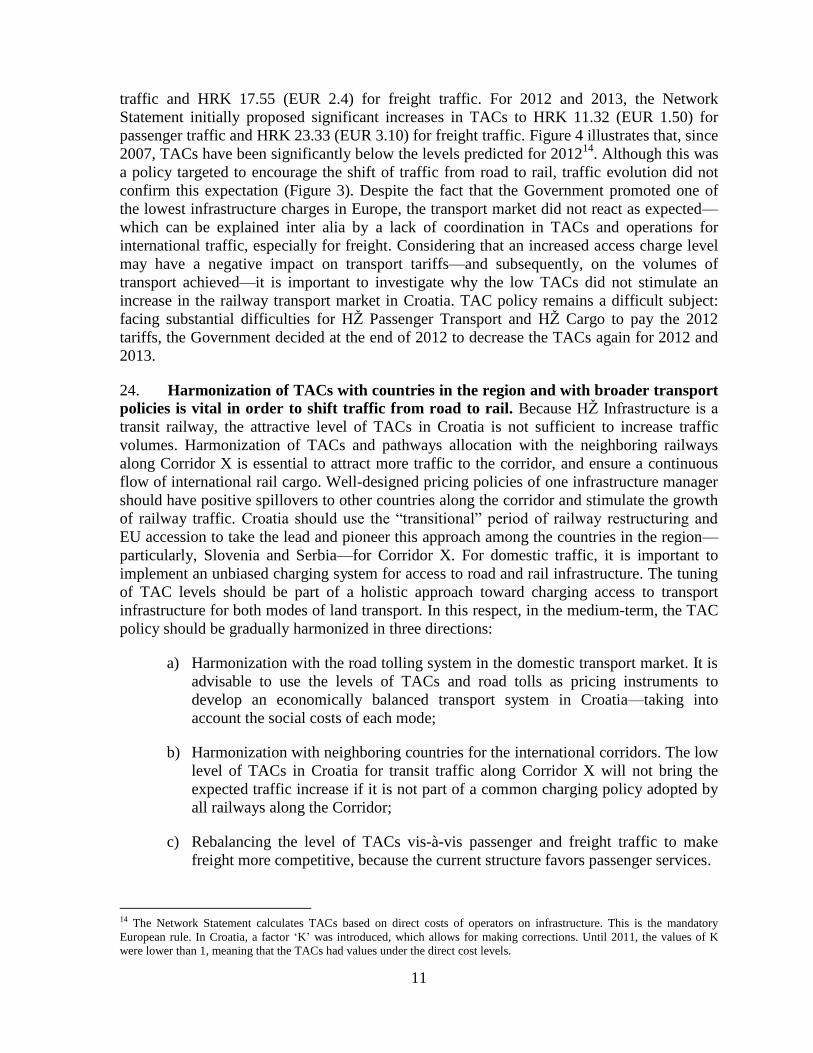
11
traffic and HRK 17.55 (EUR 2.4) for freight traffic. For 2012 and 2013, the Network
Statement initially proposed significant increases in TACs to HRK 11.32 (EUR 1.50) for
passenger traffic and HRK 23.33 (EUR 3.10) for freight traffic. Figure 4 illustrates that, since
2007, TACs have been significantly below the levels predicted for 201214
. Although this was
a policy targeted to encourage the shift of traffic from road to rail, traffic evolution did not
confirm this expectation (Figure 3). Despite the fact that the Government promoted one of
the lowest infrastructure charges in Europe, the transport market did not react as expected—
which can be explained inter alia by a lack of coordination in TACs and operations for
international traffic, especially for freight. Considering that an increased access charge level
may have a negative impact on transport tariffs—and subsequently, on the volumes of
transport achieved—it is important to investigate why the low TACs did not stimulate an
increase in the railway transport market in Croatia. TAC policy remains a difficult subject:
facing substantial difficulties for HŽ Passenger Transport and HŽ Cargo to pay the 2012
tariffs, the Government decided at the end of 2012 to decrease the TACs again for 2012 and
2013.
24. Harmonization of TACs with countries in the region and with broader transport
policies is vital in order to shift traffic from road to rail. Because HŽ Infrastructure is a
transit railway, the attractive level of TACs in Croatia is not sufficient to increase traffic
volumes. Harmonization of TACs and pathways allocation with the neighboring railways
along Corridor X is essential to attract more traffic to the corridor, and ensure a continuous
flow of international rail cargo. Well-designed pricing policies of one infrastructure manager
should have positive spillovers to other countries along the corridor and stimulate the growth
of railway traffic. Croatia should use the “transitional” period of railway restructuring and
EU accession to take the lead and pioneer this approach among the countries in the region—
particularly, Slovenia and Serbia—for Corridor X. For domestic traffic, it is important to
implement an unbiased charging system for access to road and rail infrastructure. The tuning
of TAC levels should be part of a holistic approach toward charging access to transport
infrastructure for both modes of land transport. In this respect, in the medium-term, the TAC
policy should be gradually harmonized in three directions:
a) Harmonization with the road tolling system in the domestic transport market. It is
advisable to use the levels of TACs and road tolls as pricing instruments to
develop an economically balanced transport system in Croatia—taking into
account the social costs of each mode;
b) Harmonization with neighboring countries for the international corridors. The low
level of TACs in Croatia for transit traffic along Corridor X will not bring the
expected traffic increase if it is not part of a common charging policy adopted by
all railways along the Corridor;
c) Rebalancing the level of TACs vis-à-vis passenger and freight traffic to make
freight more competitive, because the current structure favors passenger services.
14 The Network Statement calculates TACs based on direct costs of operators on infrastructure. This is the mandatory
European rule. In Croatia, a factor ‘K’ was introduced, which allows for making corrections. Until 2011, the values of K
were lower than 1, meaning that the TACs had values under the direct cost levels.
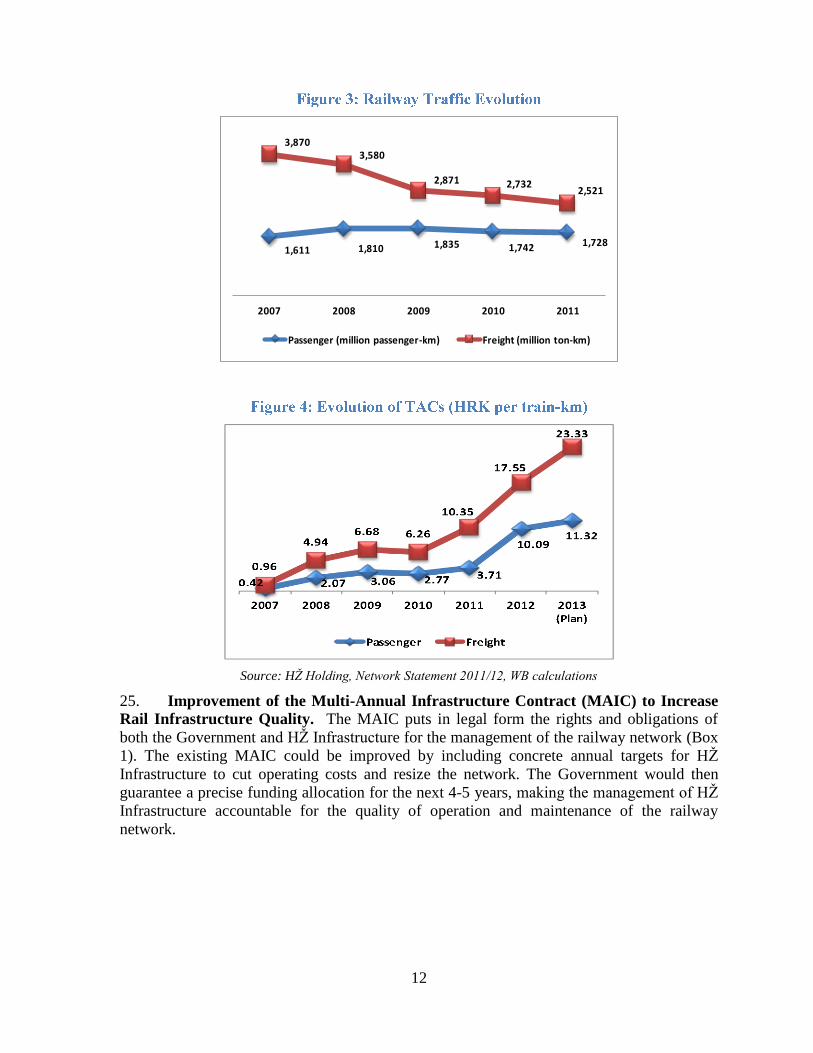
12
1,611 1,810 1,835 1,742 1,728
3,870 3,580
2,871 2,732 2,521
2007 2008 2009 2010 2011
Passenger (million passenger-km) Freight (million ton-km)
Source: HŽ Holding, Network Statement 2011/12, WB calculations
25. Improvement of the Multi-Annual Infrastructure Contract (MAIC) to Increase
Rail Infrastructure Quality. The MAIC puts in legal form the rights and obligations of
both the Government and HŽ Infrastructure for the management of the railway network (Box
1). The existing MAIC could be improved by including concrete annual targets for HŽ
Infrastructure to cut operating costs and resize the network. The Government would then
guarantee a precise funding allocation for the next 4-5 years, making the management of HŽ
Infrastructure accountable for the quality of operation and maintenance of the railway
network.
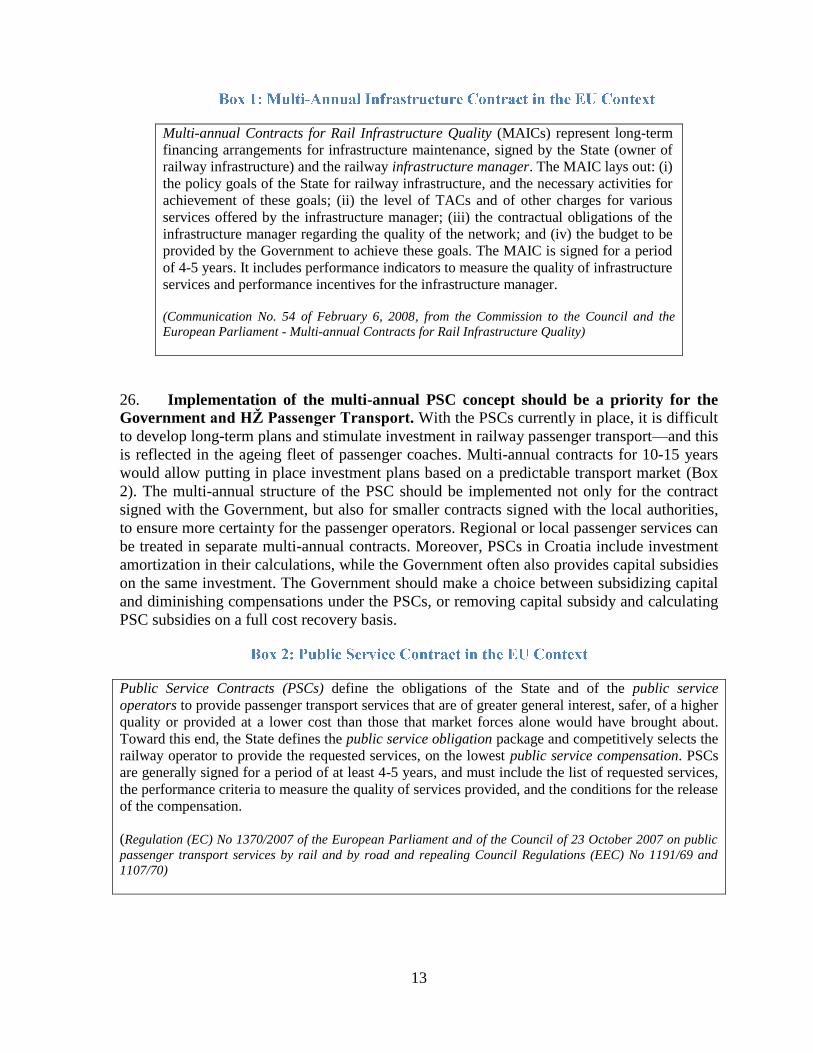
13
Multi-annual Contracts for Rail Infrastructure Quality (MAICs) represent long-term
financing arrangements for infrastructure maintenance, signed by the State (owner of
railway infrastructure) and the railway infrastructure manager. The MAIC lays out: (i)
the policy goals of the State for railway infrastructure, and the necessary activities for
achievement of these goals; (ii) the level of TACs and of other charges for various
services offered by the infrastructure manager; (iii) the contractual obligations of the
infrastructure manager regarding the quality of the network; and (iv) the budget to be
provided by the Government to achieve these goals. The MAIC is signed for a period
of 4-5 years. It includes performance indicators to measure the quality of infrastructure
services and performance incentives for the infrastructure manager.
(Communication No. 54 of February 6, 2008, from the Commission to the Council and the
European Parliament - Multi-annual Contracts for Rail Infrastructure Quality)
26. Implementation of the multi-annual PSC concept should be a priority for the
Government and HŽ Passenger Transport. With the PSCs currently in place, it is difficult
to develop long-term plans and stimulate investment in railway passenger transport—and this
is reflected in the ageing fleet of passenger coaches. Multi-annual contracts for 10-15 years
would allow putting in place investment plans based on a predictable transport market (Box
2). The multi-annual structure of the PSC should be implemented not only for the contract
signed with the Government, but also for smaller contracts signed with the local authorities,
to ensure more certainty for the passenger operators. Regional or local passenger services can
be treated in separate multi-annual contracts. Moreover, PSCs in Croatia include investment
amortization in their calculations, while the Government often also provides capital subsidies
on the same investment. The Government should make a choice between subsidizing capital
and diminishing compensations under the PSCs, or removing capital subsidy and calculating
PSC subsidies on a full cost recovery basis.
Public Service Contracts (PSCs) define the obligations of the State and of the public service
operators to provide passenger transport services that are of greater general interest, safer, of a higher
quality or provided at a lower cost than those that market forces alone would have brought about.
Toward this end, the State defines the public service obligation package and competitively selects the
railway operator to provide the requested services, on the lowest public service compensation. PSCs
are generally signed for a period of at least 4-5 years, and must include the list of requested services,
the performance criteria to measure the quality of services provided, and the conditions for the release
of the compensation.
(Regulation (EC) No 1370/2007 of the European Parliament and of the Council of 23 October 2007 on public
passenger transport services by rail and by road and repealing Council Regulations (EEC) No 1191/69 and
1107/70)
14
27. The State-owned railway company in Croatia has been organized as a holding
since 2006. HŽ Hrvatske Željeznice Holding d.o.o. (HŽ Holding) is a limited liability
company that was established on December 22, 2006. Its sole owner is the Republic of
Croatia, represented in the company’s Assembly by MMATI. In addition to the Assembly,
the corporate structure consists of a two-tier management and monitoring structure appointed
by the Assembly at the suggestion of the Government. A Management Board manages the
company under its own responsibility; a Supervisory Board monitors the activity of the
Management Board and reports its observations to the Assembly. The Supervisory Board is
composed of seven members, including a Chairman who is selected by the Board among its
members, and one member who is appointed by the Workers’ Council. The current
Management Board consists of seven members, one of whom is appointed as a CEO by the
Assembly. The 2005 Act on Division of Croatian Railways separated the previous railway
company into four new limited liability companies that are all 100% owned and managed by
HŽ Holding: HŽ Cargo, HŽ Passenger Transport, HŽ Traction and HŽ Infrastructure. All of
the subsidiaries have a similar corporate governance structure, as presented in Table 2 below.
As a company of special State interest15
, HŽ Holding is subject to the Company Law and
additional provisions of the Audit Law, requiring: (i) public disclosure of financial
statements through Financial Agency (FINA); (ii) an independent external audit; and (iii) the
establishment of an Audit Committee within the Supervisory Board, which oversees financial
reporting and disclosure. This structure was modified by the Restructuring Plan approved in
June 2012 (see summary in Chapter H below), but the diagnostic of the system still needs to
be based on the holding structure, given the current interlinkages between the various
elements until the full plan is implemented.
15 According to the Audit Law, all companies with a share capital of over HRK 300 million are companies of special State
interest, subject to additional audit requirements.
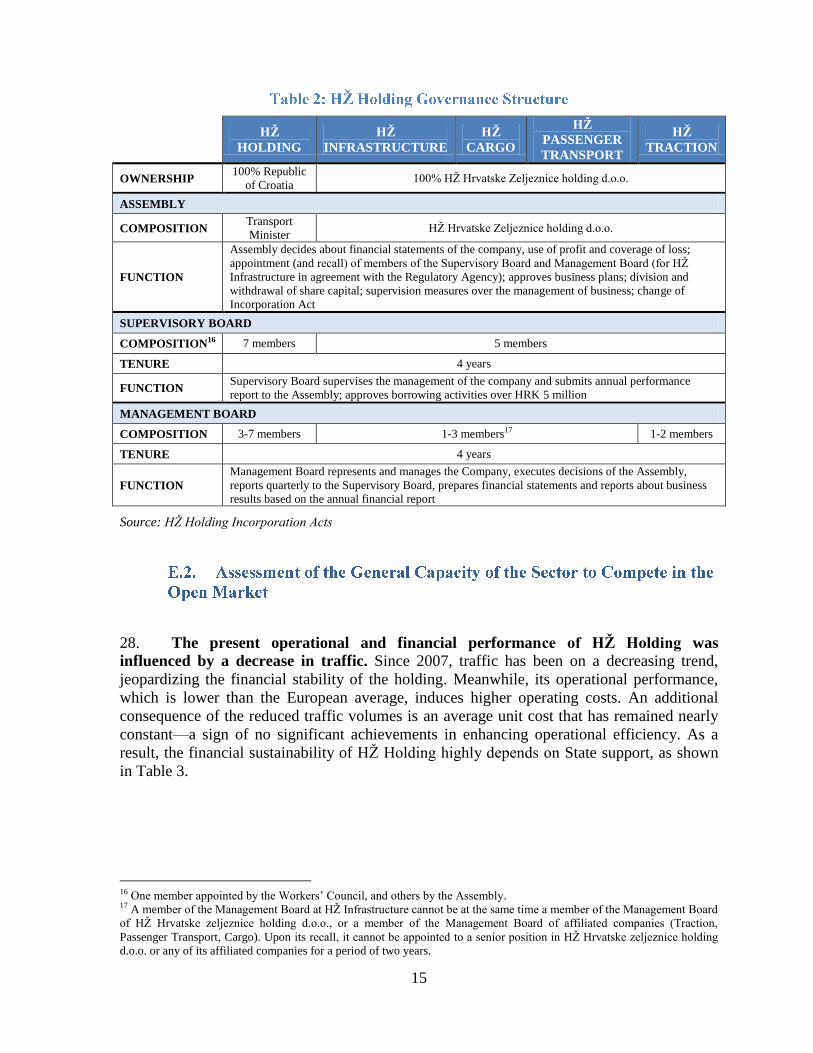
15
HŽ
HOLDING
HŽ
INFRASTRUCTURE
HŽ
CARGO
HŽ
PASSENGER
TRANSPORT
HŽ
TRACTION
OWNERSHIP 100% Republic
of Croatia 100% HŽ Hrvatske Zeljeznice holding d.o.o.
ASSEMBLY
COMPOSITION Transport
Minister HŽ Hrvatske Zeljeznice holding d.o.o.
FUNCTION
Assembly decides about financial statements of the company, use of profit and coverage of loss;
appointment (and recall) of members of the Supervisory Board and Management Board (for HŽ
Infrastructure in agreement with the Regulatory Agency); approves business plans; division and
withdrawal of share capital; supervision measures over the management of business; change of
Incorporation Act
SUPERVISORY BOARD
COMPOSITION16 7 members 5 members
TENURE 4 years
FUNCTION Supervisory Board supervises the management of the company and submits annual performance
report to the Assembly; approves borrowing activities over HRK 5 million
MANAGEMENT BOARD
COMPOSITION 3-7 members 1-3 members17 1-2 members
TENURE 4 years
FUNCTION
Management Board represents and manages the Company, executes decisions of the Assembly,
reports quarterly to the Supervisory Board, prepares financial statements and reports about business
results based on the annual financial report
Source: HŽ Holding Incorporation Acts
28. The present operational and financial performance of HŽ Holding was
influenced by a decrease in traffic. Since 2007, traffic has been on a decreasing trend,
jeopardizing the financial stability of the holding. Meanwhile, its operational performance,
which is lower than the European average, induces higher operating costs. An additional
consequence of the reduced traffic volumes is an average unit cost that has remained nearly
constant—a sign of no significant achievements in enhancing operational efficiency. As a
result, the financial sustainability of HŽ Holding highly depends on State support, as shown
in Table 3.
16 One member appointed by the Workers’ Council, and others by the Assembly. 17 A member of the Management Board at HŽ Infrastructure cannot be at the same time a member of the Management Board
of HŽ Hrvatske zeljeznice holding d.o.o., or a member of the Management Board of affiliated companies (Traction,
Passenger Transport, Cargo). Upon its recall, it cannot be appointed to a senior position in HŽ Hrvatske zeljeznice holding
d.o.o. or any of its affiliated companies for a period of two years.
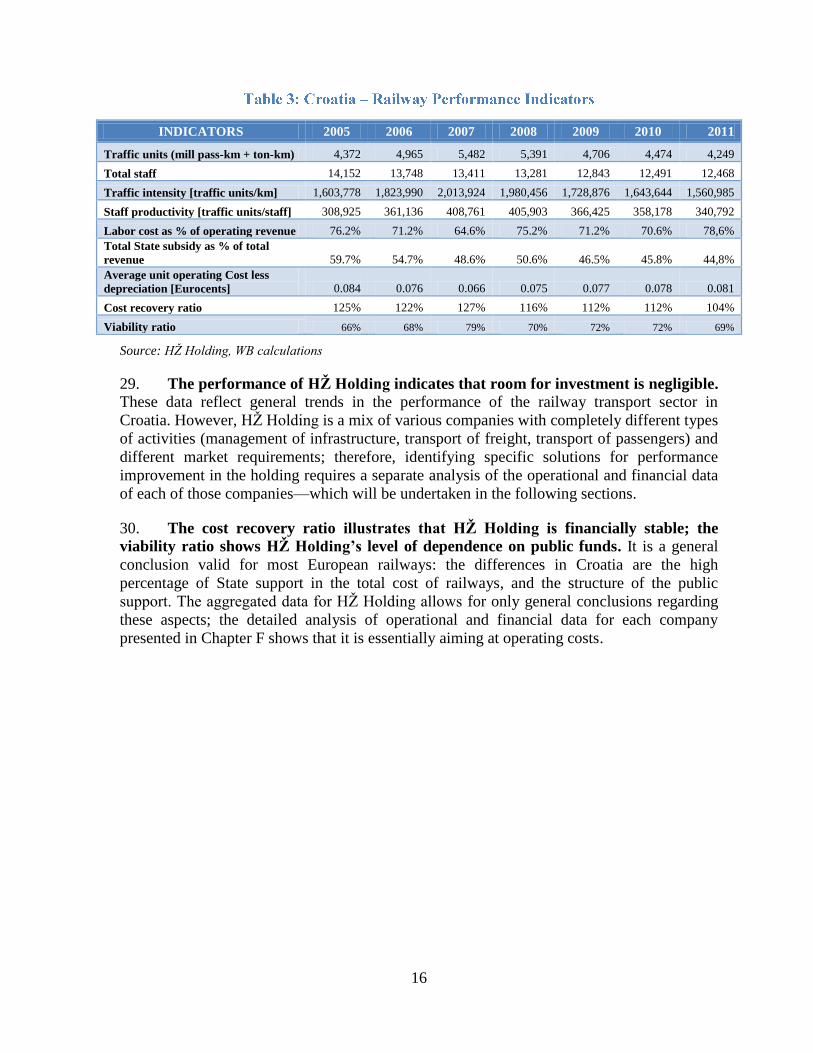
16
Source: HŽ Holding, WB calculations
29. The performance of HŽ Holding indicates that room for investment is negligible.
These data reflect general trends in the performance of the railway transport sector in
Croatia. However, HŽ Holding is a mix of various companies with completely different types
of activities (management of infrastructure, transport of freight, transport of passengers) and
different market requirements; therefore, identifying specific solutions for performance
improvement in the holding requires a separate analysis of the operational and financial data
of each of those companies—which will be undertaken in the following sections.
30. The cost recovery ratio illustrates that HŽ Holding is financially stable; the
viability ratio shows HŽ Holding’s level of dependence on public funds. It is a general
conclusion valid for most European railways: the differences in Croatia are the high
percentage of State support in the total cost of railways, and the structure of the public
support. The aggregated data for HŽ Holding allows for only general conclusions regarding
these aspects; the detailed analysis of operational and financial data for each company
presented in Chapter F shows that it is essentially aiming at operating costs.
INDICATORS 2005 2006 2007 2008 2009 2010 2011
Traffic units (mill pass-km + ton-km) 4,372 4,965 5,482 5,391 4,706 4,474 4,249
Total staff 14,152 13,748 13,411 13,281 12,843 12,491 12,468
Traffic intensity [traffic units/km] 1,603,778 1,823,990 2,013,924 1,980,456 1,728,876 1,643,644 1,560,985
Staff productivity [traffic units/staff] 308,925 361,136 408,761 405,903 366,425 358,178 340,792
Labor cost as % of operating revenue 76.2% 71.2% 64.6% 75.2% 71.2% 70.6% 78,6%
Total State subsidy as % of total
revenue 59.7% 54.7% 48.6% 50.6% 46.5% 45.8% 44,8%
Average unit operating Cost less
depreciation [Eurocents] 0.084 0.076 0.066 0.075 0.077 0.078 0.081
Cost recovery ratio 125% 122% 127% 116% 112% 112% 104%
Viability ratio 66% 68% 79% 70% 72% 72% 69%
17
31. Table 4 illustrates the evolution of the financial performance of HŽ Holding since
2005, revealing that:
a) The total revenues and the total costs of the holding have remained nearly
constant since 2005;
b) The total State contribution (including PSCs, support to operations, and
investments) in 2011 was around 36%, which was lower in nominal terms
compared with 2005, but still very high;
c) The cost recovery ratio and the viability ratio indicate that, since 2005, HŽ
Holding has been able to cover all of its operating costs from the total revenues
(operating and State contribution), with an increasing share of the operating
revenues every year allowing for a reduction in the State contribution;
d) These ratios may implicitly signal that there is a serious constraint on any
rehabilitation or capital investment, both in rolling stock and equipment, because
revenue and most subsidies are absorbed in operating costs.
32. In 2011, the operating revenues of HŽ Holding covered about 69% of the operating
costs—including the State contribution for the PSC (The cost recovery ratio illustrates that
HŽ Holding is financially stable; the viability ratio shows HŽ Holding’s level of
dependence on public funds. It is a general conclusion valid for most European railways:
the differences in Croatia are the high percentage of State support in the total cost of
railways, and the structure of the public support. The aggregated data for HŽ Holding allows
for only general conclusions regarding these aspects; the detailed analysis of operational and
financial data for each company presented in Chapter F shows that it is essentially aiming at
operating costs.
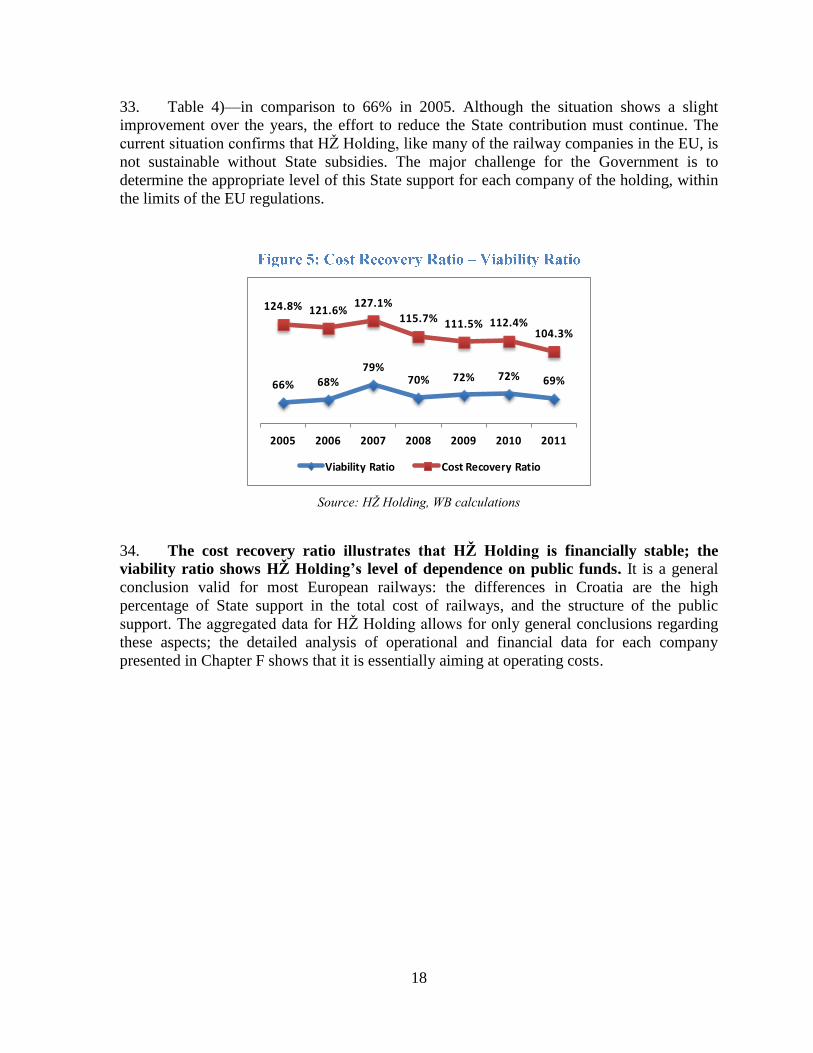
18
33. Table 4)—in comparison to 66% in 2005. Although the situation shows a slight
improvement over the years, the effort to reduce the State contribution must continue. The
current situation confirms that HŽ Holding, like many of the railway companies in the EU, is
not sustainable without State subsidies. The major challenge for the Government is to
determine the appropriate level of this State support for each company of the holding, within
the limits of the EU regulations.
66% 68%79%
70% 72% 72% 69%
124.8% 121.6%127.1%
115.7% 111.5% 112.4%104.3%
2005 2006 2007 2008 2009 2010 2011
Viability Ratio Cost Recovery Ratio
Source: HŽ Holding, WB calculations
34. The cost recovery ratio illustrates that HŽ Holding is financially stable; the
viability ratio shows HŽ Holding’s level of dependence on public funds. It is a general
conclusion valid for most European railways: the differences in Croatia are the high
percentage of State support in the total cost of railways, and the structure of the public
support. The aggregated data for HŽ Holding allows for only general conclusions regarding
these aspects; the detailed analysis of operational and financial data for each company
presented in Chapter F shows that it is essentially aiming at operating costs.
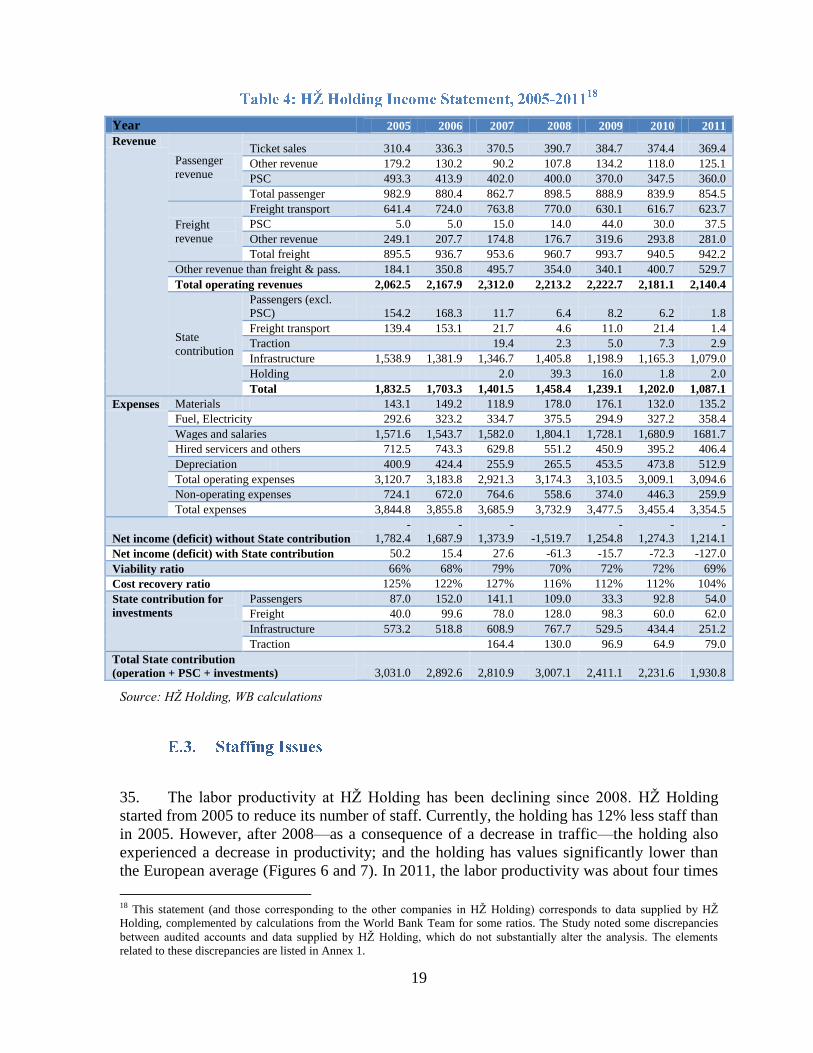
19
Year 2005 2006 2007 2008 2009 2010 2011
Revenue
Passenger
revenue
Ticket sales 310.4 336.3 370.5 390.7 384.7 374.4 369.4
Other revenue 179.2 130.2 90.2 107.8 134.2 118.0 125.1
PSC 493.3 413.9 402.0 400.0 370.0 347.5 360.0
Total passenger 982.9 880.4 862.7 898.5 888.9 839.9 854.5
Freight
revenue
Freight transport 641.4 724.0 763.8 770.0 630.1 616.7 623.7
PSC 5.0 5.0 15.0 14.0 44.0 30.0 37.5
Other revenue 249.1 207.7 174.8 176.7 319.6 293.8 281.0
Total freight 895.5 936.7 953.6 960.7 993.7 940.5 942.2
Other revenue than freight & pass. 184.1 350.8 495.7 354.0 340.1 400.7 529.7
Total operating revenues 2,062.5 2,167.9 2,312.0 2,213.2 2,222.7 2,181.1 2,140.4
State
contribution
Passengers (excl.
PSC) 154.2 168.3 11.7 6.4 8.2 6.2 1.8
Freight transport 139.4 153.1 21.7 4.6 11.0 21.4 1.4
Traction 19.4 2.3 5.0 7.3 2.9
Infrastructure 1,538.9 1,381.9 1,346.7 1,405.8 1,198.9 1,165.3 1,079.0
Holding 2.0 39.3 16.0 1.8 2.0
Total 1,832.5 1,703.3 1,401.5 1,458.4 1,239.1 1,202.0 1,087.1
Expenses Materials 143.1 149.2 118.9 178.0 176.1 132.0 135.2
Fuel, Electricity 292.6 323.2 334.7 375.5 294.9 327.2 358.4
Wages and salaries 1,571.6 1,543.7 1,582.0 1,804.1 1,728.1 1,680.9 1681.7
Hired servicers and others 712.5 743.3 629.8 551.2 450.9 395.2 406.4
Depreciation 400.9 424.4 255.9 265.5 453.5 473.8 512.9
Total operating expenses 3,120.7 3,183.8 2,921.3 3,174.3 3,103.5 3,009.1 3,094.6
Non-operating expenses 724.1 672.0 764.6 558.6 374.0 446.3 259.9
Total expenses 3,844.8 3,855.8 3,685.9 3,732.9 3,477.5 3,455.4 3,354.5
Net income (deficit) without State contribution
-
1,782.4
-
1,687.9
-
1,373.9 -1,519.7
-
1,254.8
-
1,274.3
-
1,214.1
Net income (deficit) with State contribution 50.2 15.4 27.6 -61.3 -15.7 -72.3 -127.0
Viability ratio 66% 68% 79% 70% 72% 72% 69%
Cost recovery ratio 125% 122% 127% 116% 112% 112% 104%
State contribution for
investments
Passengers 87.0 152.0 141.1 109.0 33.3 92.8 54.0
Freight 40.0 99.6 78.0 128.0 98.3 60.0 62.0
Infrastructure 573.2 518.8 608.9 767.7 529.5 434.4 251.2
Traction 164.4 130.0 96.9 64.9 79.0
Total State contribution
(operation + PSC + investments) 3,031.0 2,892.6 2,810.9 3,007.1 2,411.1 2,231.6 1,930.8
Source: HŽ Holding, WB calculations
35. The labor productivity at HŽ Holding has been declining since 2008. HŽ Holding
started from 2005 to reduce its number of staff. Currently, the holding has 12% less staff than
in 2005. However, after 2008—as a consequence of a decrease in traffic—the holding also
experienced a decrease in productivity; and the holding has values significantly lower than
the European average (Figures 6 and 7). In 2011, the labor productivity was about four times
18 This statement (and those corresponding to the other companies in HŽ Holding) corresponds to data supplied by HŽ
Holding, complemented by calculations from the World Bank Team for some ratios. The Study noted some discrepancies
between audited accounts and data supplied by HŽ Holding, which do not substantially alter the analysis. The elements
related to these discrepancies are listed in Annex 1.
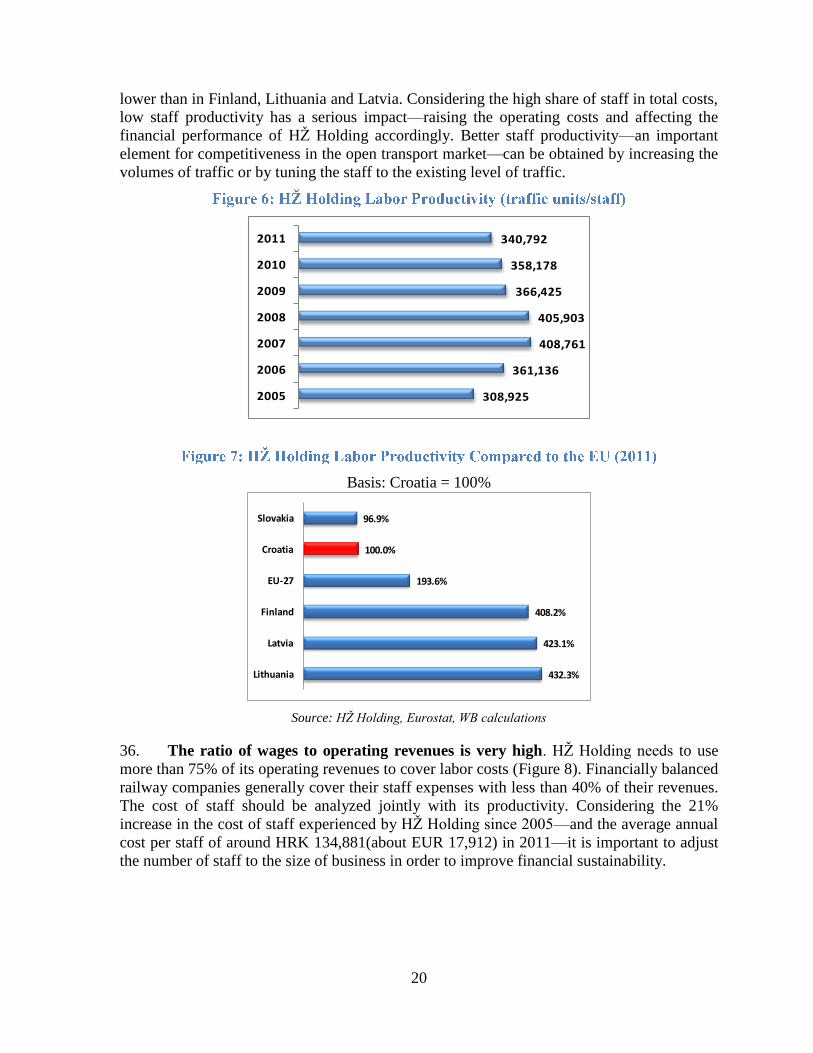
20
lower than in Finland, Lithuania and Latvia. Considering the high share of staff in total costs,
low staff productivity has a serious impact—raising the operating costs and affecting the
financial performance of HŽ Holding accordingly. Better staff productivity—an important
element for competitiveness in the open transport market—can be obtained by increasing the
volumes of traffic or by tuning the staff to the existing level of traffic.
308,925
361,136
408,761
405,903
366,425
358,178
340,792
2005
2006
2007
2008
2009
2010
2011
Basis: Croatia = 100%
432.3%
423.1%
408.2%
193.6%
100.0%
96.9%
Lithuania
Latvia
Finland
EU-27
Croatia
Slovakia
Source: HŽ Holding, Eurostat, WB calculations
36. The ratio of wages to operating revenues is very high. HŽ Holding needs to use
more than 75% of its operating revenues to cover labor costs (Figure 8). Financially balanced
railway companies generally cover their staff expenses with less than 40% of their revenues.
The cost of staff should be analyzed jointly with its productivity. Considering the 21%
increase in the cost of staff experienced by HŽ Holding since 2005—and the average annual
cost per staff of around HRK 134,881(about EUR 17,912) in 2011—it is important to adjust
the number of staff to the size of business in order to improve financial sustainability.
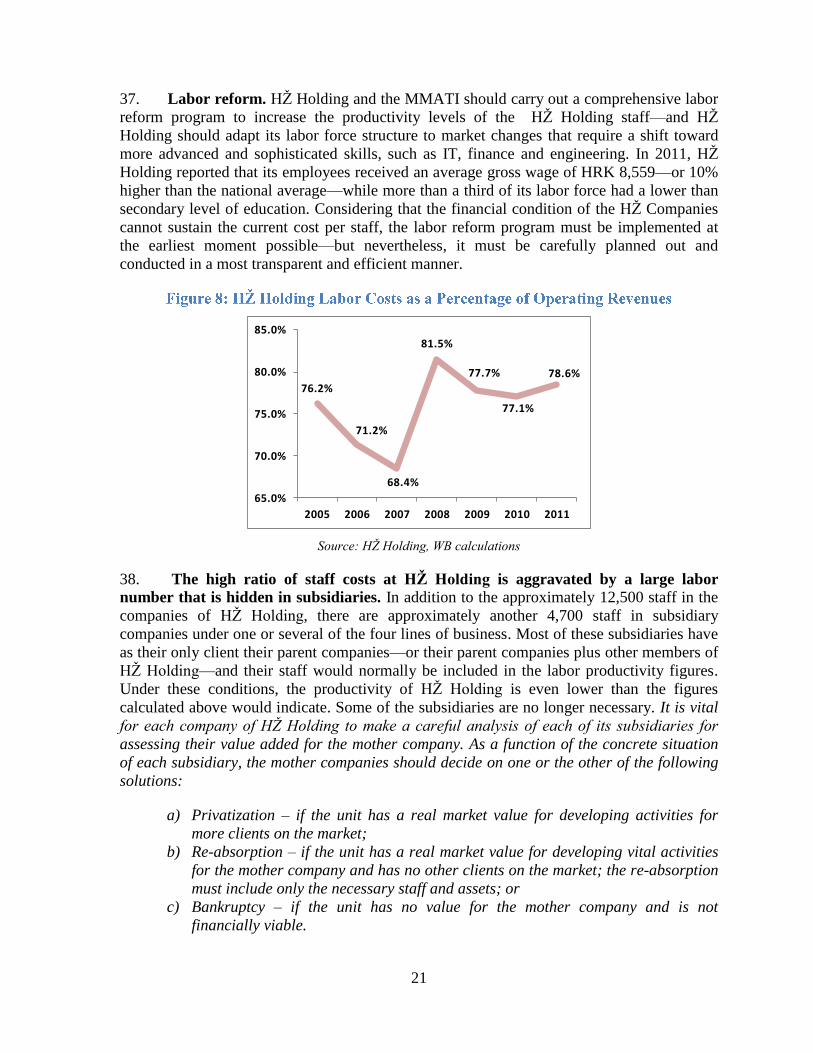
21
37. Labor reform. HŽ Holding and the MMATI should carry out a comprehensive labor
reform program to increase the productivity levels of the HŽ Holding staff—and HŽ
Holding should adapt its labor force structure to market changes that require a shift toward
more advanced and sophisticated skills, such as IT, finance and engineering. In 2011, HŽ
Holding reported that its employees received an average gross wage of HRK 8,559—or 10%
higher than the national average—while more than a third of its labor force had a lower than
secondary level of education. Considering that the financial condition of the HŽ Companies
cannot sustain the current cost per staff, the labor reform program must be implemented at
the earliest moment possible—but nevertheless, it must be carefully planned out and
conducted in a most transparent and efficient manner.
76.2%
71.2%
68.4%
81.5%
77.7%
77.1%
78.6%
65.0%
70.0%
75.0%
80.0%
85.0%
2005 2006 2007 2008 2009 2010 2011
Source: HŽ Holding, WB calculations
38. The high ratio of staff costs at HŽ Holding is aggravated by a large labor
number that is hidden in subsidiaries. In addition to the approximately 12,500 staff in the
companies of HŽ Holding, there are approximately another 4,700 staff in subsidiary
companies under one or several of the four lines of business. Most of these subsidiaries have
as their only client their parent companies—or their parent companies plus other members of
HŽ Holding—and their staff would normally be included in the labor productivity figures.
Under these conditions, the productivity of HŽ Holding is even lower than the figures
calculated above would indicate. Some of the subsidiaries are no longer necessary. It is vital
for each company of HŽ Holding to make a careful analysis of each of its subsidiaries for
assessing their value added for the mother company. As a function of the concrete situation
of each subsidiary, the mother companies should decide on one or the other of the following
solutions:
a) Privatization – if the unit has a real market value for developing activities for
more clients on the market;
b) Re-absorption – if the unit has a real market value for developing vital activities
for the mother company and has no other clients on the market; the re-absorption
must include only the necessary staff and assets; or
c) Bankruptcy – if the unit has no value for the mother company and is not
financially viable.
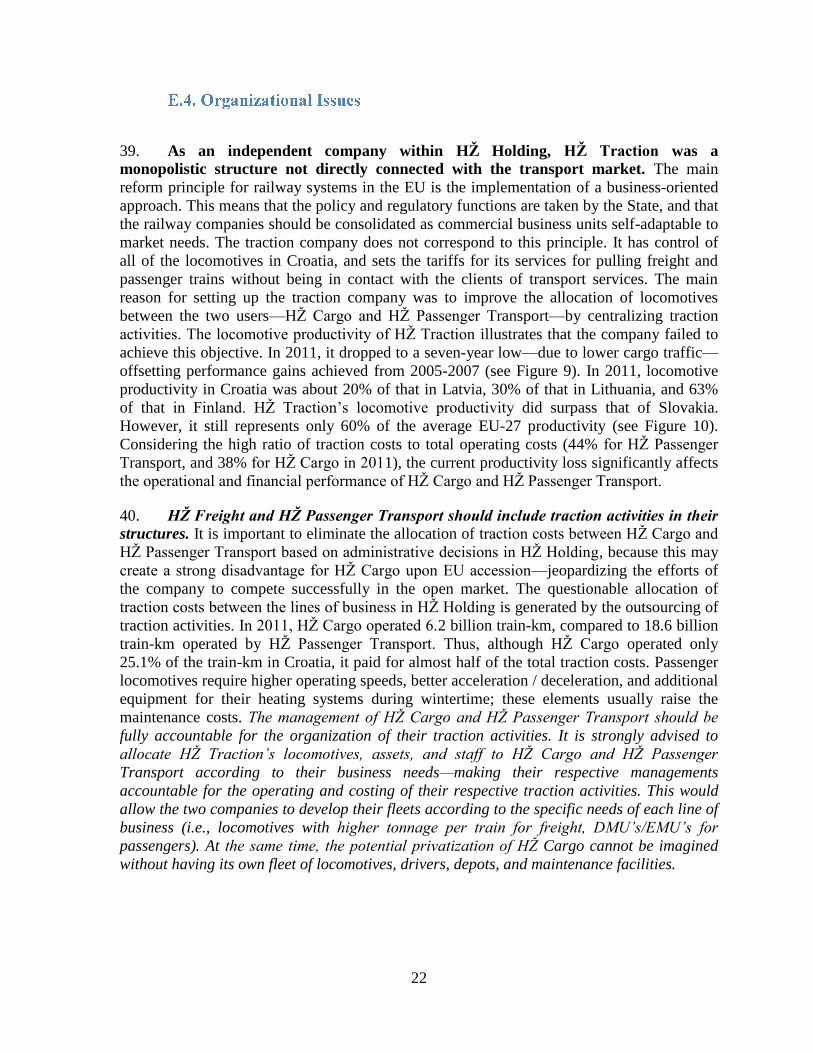
22
39. As an independent company within HŽ Holding, HŽ Traction was a
monopolistic structure not directly connected with the transport market. The main
reform principle for railway systems in the EU is the implementation of a business-oriented
approach. This means that the policy and regulatory functions are taken by the State, and that
the railway companies should be consolidated as commercial business units self-adaptable to
market needs. The traction company does not correspond to this principle. It has control of
all of the locomotives in Croatia, and sets the tariffs for its services for pulling freight and
passenger trains without being in contact with the clients of transport services. The main
reason for setting up the traction company was to improve the allocation of locomotives
between the two users—HŽ Cargo and HŽ Passenger Transport—by centralizing traction
activities. The locomotive productivity of HŽ Traction illustrates that the company failed to
achieve this objective. In 2011, it dropped to a seven-year low—due to lower cargo traffic—
offsetting performance gains achieved from 2005-2007 (see Figure 9). In 2011, locomotive
productivity in Croatia was about 20% of that in Latvia, 30% of that in Lithuania, and 63%
of that in Finland. HŽ Traction’s locomotive productivity did surpass that of Slovakia.
However, it still represents only 60% of the average EU-27 productivity (see Figure 10).
Considering the high ratio of traction costs to total operating costs (44% for HŽ Passenger
Transport, and 38% for HŽ Cargo in 2011), the current productivity loss significantly affects
the operational and financial performance of HŽ Cargo and HŽ Passenger Transport.
40. HŽ Freight and HŽ Passenger Transport should include traction activities in their
structures. It is important to eliminate the allocation of traction costs between HŽ Cargo and
HŽ Passenger Transport based on administrative decisions in HŽ Holding, because this may
create a strong disadvantage for HŽ Cargo upon EU accession—jeopardizing the efforts of
the company to compete successfully in the open market. The questionable allocation of
traction costs between the lines of business in HŽ Holding is generated by the outsourcing of
traction activities. In 2011, HŽ Cargo operated 6.2 billion train-km, compared to 18.6 billion
train-km operated by HŽ Passenger Transport. Thus, although HŽ Cargo operated only
25.1% of the train-km in Croatia, it paid for almost half of the total traction costs. Passenger
locomotives require higher operating speeds, better acceleration / deceleration, and additional
equipment for their heating systems during wintertime; these elements usually raise the
maintenance costs. The management of HŽ Cargo and HŽ Passenger Transport should be
fully accountable for the organization of their traction activities. It is strongly advised to
allocate HŽ Traction’s locomotives, assets, and staff to HŽ Cargo and HŽ Passenger
Transport according to their business needs—making their respective managements
accountable for the operating and costing of their respective traction activities. This would
allow the two companies to develop their fleets according to the specific needs of each line of
business (i.e., locomotives with higher tonnage per train for freight, DMU’s/EMU’s for
passengers). At the same time, the potential privatization of HŽ Cargo cannot be imagined
without having its own fleet of locomotives, drivers, depots, and maintenance facilities.
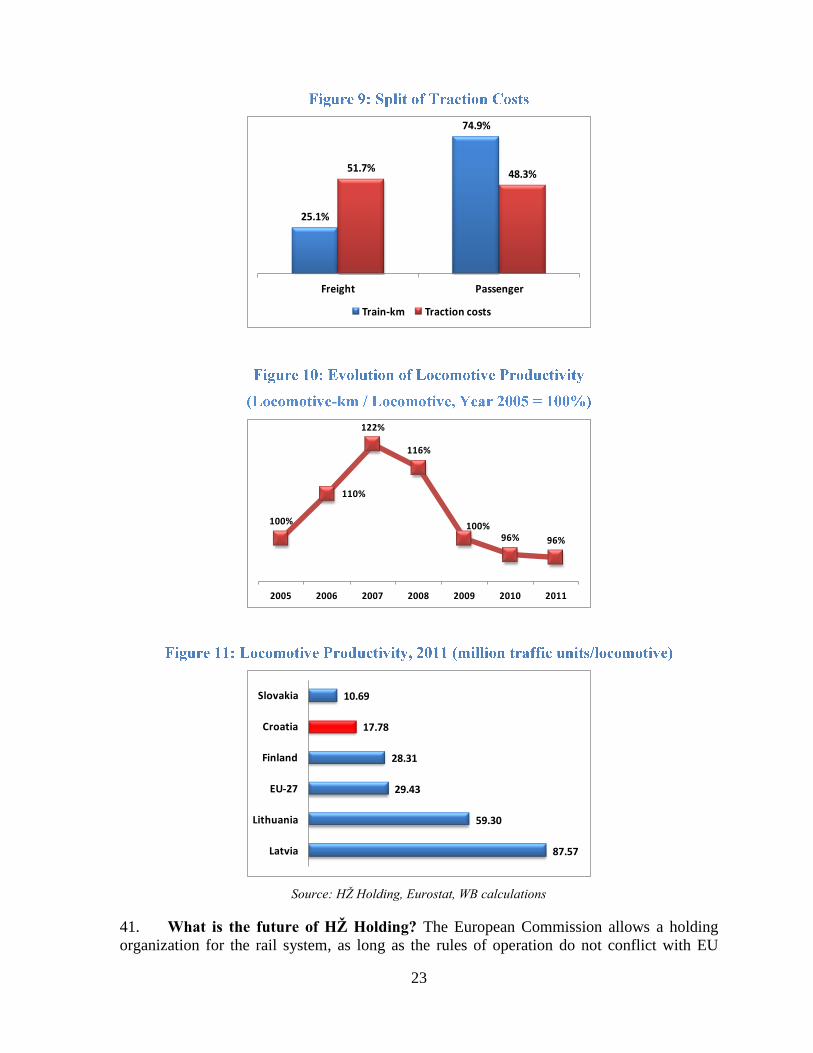
23
25.1%
74.9%
51.7%48.3%
Freight Passenger
Train-km Traction costs
100%
110%
122%
116%
100%96% 96%
2005 2006 2007 2008 2009 2010 2011
87.57
59.30
29.43
28.31
17.78
10.69
Latvia
Lithuania
EU-27
Finland
Croatia
Slovakia
Source: HŽ Holding, Eurostat, WB calculations
41. What is the future of HŽ Holding? The European Commission allows a holding
organization for the rail system, as long as the rules of operation do not conflict with EU
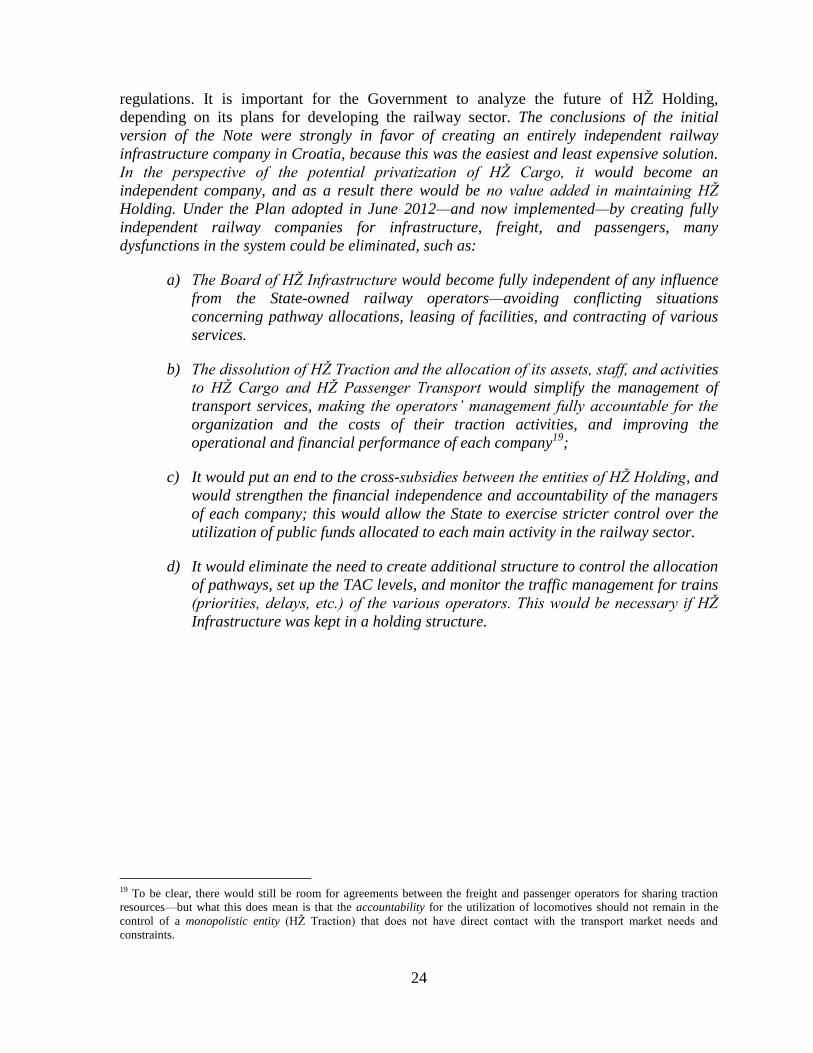
24
regulations. It is important for the Government to analyze the future of HŽ Holding,
depending on its plans for developing the railway sector. The conclusions of the initial
version of the Note were strongly in favor of creating an entirely independent railway
infrastructure company in Croatia, because this was the easiest and least expensive solution.
In the perspective of the potential privatization of HŽ Cargo, it would become an
independent company, and as a result there would be no value added in maintaining HŽ
Holding. Under the Plan adopted in June 2012—and now implemented—by creating fully
independent railway companies for infrastructure, freight, and passengers, many
dysfunctions in the system could be eliminated, such as:
a) The Board of HŽ Infrastructure would become fully independent of any influence
from the State-owned railway operators—avoiding conflicting situations
concerning pathway allocations, leasing of facilities, and contracting of various
services.
b) The dissolution of HŽ Traction and the allocation of its assets, staff, and activities
to HŽ Cargo and HŽ Passenger Transport would simplify the management of
transport services, making the operators’ management fully accountable for the
organization and the costs of their traction activities, and improving the
operational and financial performance of each company19
;
c) It would put an end to the cross-subsidies between the entities of HŽ Holding, and
would strengthen the financial independence and accountability of the managers
of each company; this would allow the State to exercise stricter control over the
utilization of public funds allocated to each main activity in the railway sector.
d) It would eliminate the need to create additional structure to control the allocation
of pathways, set up the TAC levels, and monitor the traffic management for trains
(priorities, delays, etc.) of the various operators. This would be necessary if HŽ
Infrastructure was kept in a holding structure.
19 To be clear, there would still be room for agreements between the freight and passenger operators for sharing traction
resources—but what this does mean is that the accountability for the utilization of locomotives should not remain in the
control of a monopolistic entity (HŽ Traction) that does not have direct contact with the transport market needs and
constraints.
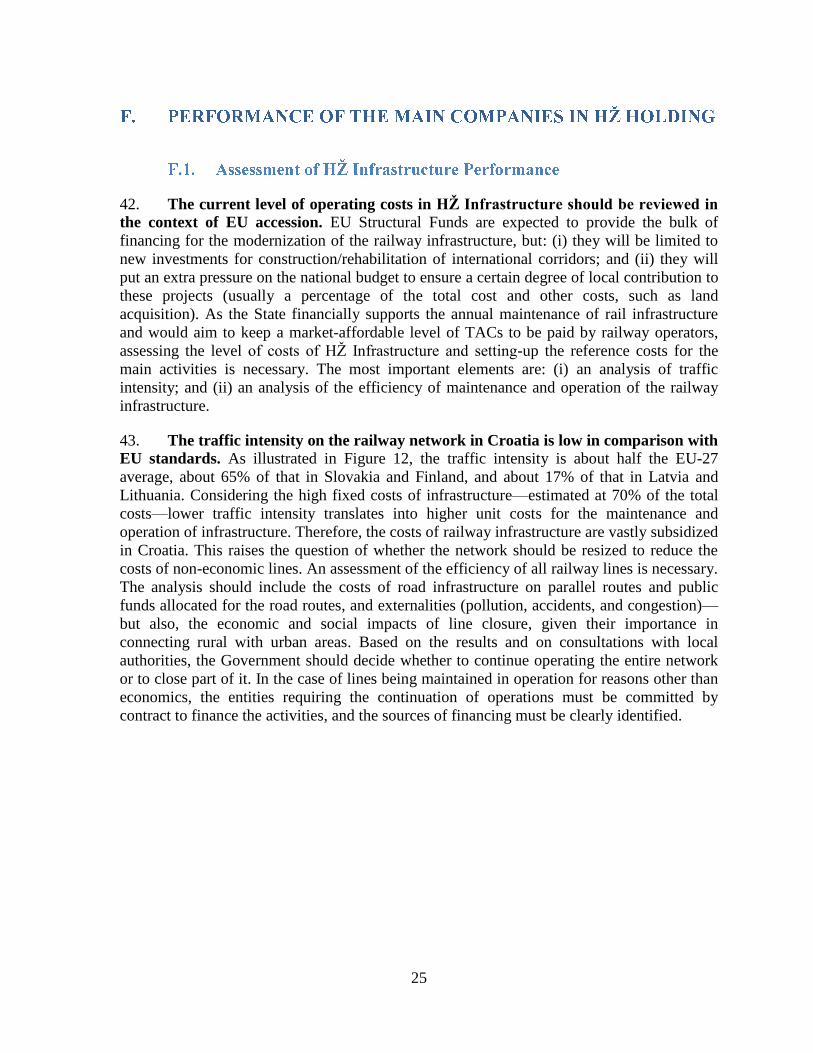
25
42. The current level of operating costs in HŽ Infrastructure should be reviewed in
the context of EU accession. EU Structural Funds are expected to provide the bulk of
financing for the modernization of the railway infrastructure, but: (i) they will be limited to
new investments for construction/rehabilitation of international corridors; and (ii) they will
put an extra pressure on the national budget to ensure a certain degree of local contribution to
these projects (usually a percentage of the total cost and other costs, such as land
acquisition). As the State financially supports the annual maintenance of rail infrastructure
and would aim to keep a market-affordable level of TACs to be paid by railway operators,
assessing the level of costs of HŽ Infrastructure and setting-up the reference costs for the
main activities is necessary. The most important elements are: (i) an analysis of traffic
intensity; and (ii) an analysis of the efficiency of maintenance and operation of the railway
infrastructure.
43. The traffic intensity on the railway network in Croatia is low in comparison with
EU standards. As illustrated in Figure 12, the traffic intensity is about half the EU-27
average, about 65% of that in Slovakia and Finland, and about 17% of that in Latvia and
Lithuania. Considering the high fixed costs of infrastructure—estimated at 70% of the total
costs—lower traffic intensity translates into higher unit costs for the maintenance and
operation of infrastructure. Therefore, the costs of railway infrastructure are vastly subsidized
in Croatia. This raises the question of whether the network should be resized to reduce the
costs of non-economic lines. An assessment of the efficiency of all railway lines is necessary.
The analysis should include the costs of road infrastructure on parallel routes and public
funds allocated for the road routes, and externalities (pollution, accidents, and congestion)—
but also, the economic and social impacts of line closure, given their importance in
connecting rural with urban areas. Based on the results and on consultations with local
authorities, the Government should decide whether to continue operating the entire network
or to close part of it. In the case of lines being maintained in operation for reasons other than
economics, the entities requiring the continuation of operations must be committed by
contract to finance the activities, and the sources of financing must be clearly identified.
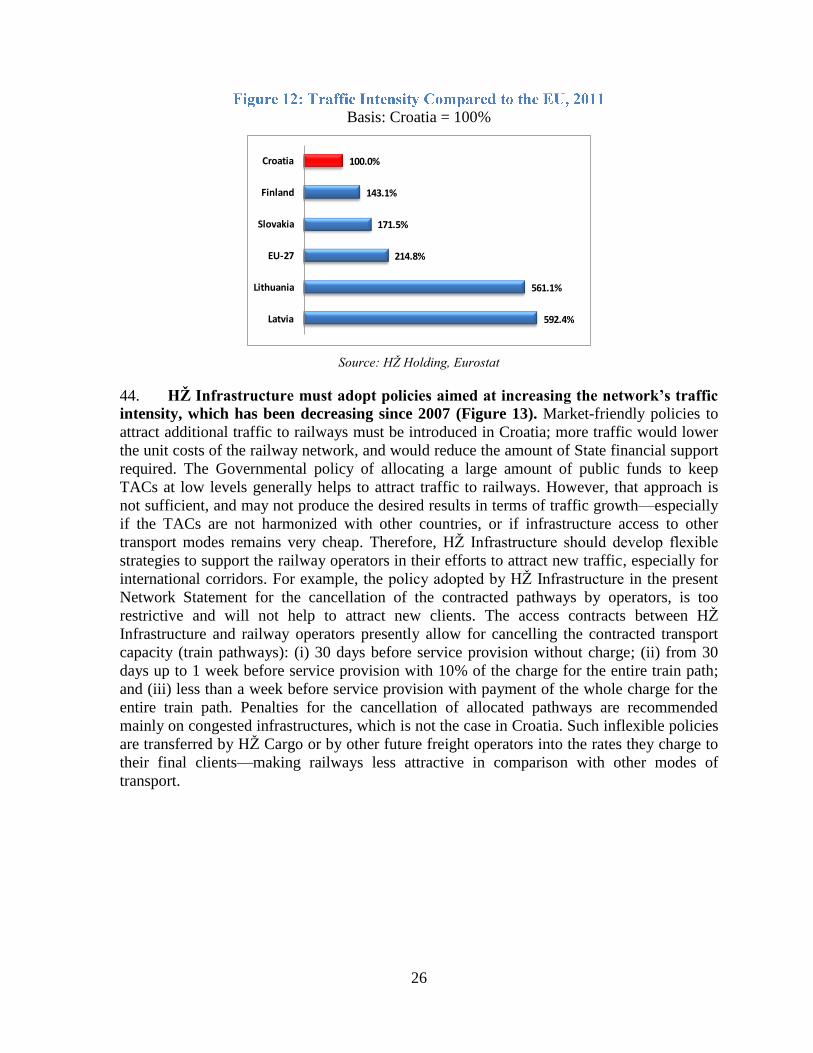
26
Basis: Croatia = 100%
592.4%
561.1%
214.8%
171.5%
143.1%
100.0%
Latvia
Lithuania
EU-27
Slovakia
Finland
Croatia
Source: HŽ Holding, Eurostat
44. HŽ Infrastructure must adopt policies aimed at increasing the network’s traffic
intensity, which has been decreasing since 2007 (Figure 13). Market-friendly policies to
attract additional traffic to railways must be introduced in Croatia; more traffic would lower
the unit costs of the railway network, and would reduce the amount of State financial support
required. The Governmental policy of allocating a large amount of public funds to keep
TACs at low levels generally helps to attract traffic to railways. However, that approach is
not sufficient, and may not produce the desired results in terms of traffic growth—especially
if the TACs are not harmonized with other countries, or if infrastructure access to other
transport modes remains very cheap. Therefore, HŽ Infrastructure should develop flexible
strategies to support the railway operators in their efforts to attract new traffic, especially for
international corridors. For example, the policy adopted by HŽ Infrastructure in the present
Network Statement for the cancellation of the contracted pathways by operators, is too
restrictive and will not help to attract new clients. The access contracts between HŽ
Infrastructure and railway operators presently allow for cancelling the contracted transport
capacity (train pathways): (i) 30 days before service provision without charge; (ii) from 30
days up to 1 week before service provision with 10% of the charge for the entire train path;
and (iii) less than a week before service provision with payment of the whole charge for the
entire train path. Penalties for the cancellation of allocated pathways are recommended
mainly on congested infrastructures, which is not the case in Croatia. Such inflexible policies
are transferred by HŽ Cargo or by other future freight operators into the rates they charge to
their final clients—making railways less attractive in comparison with other modes of
transport.
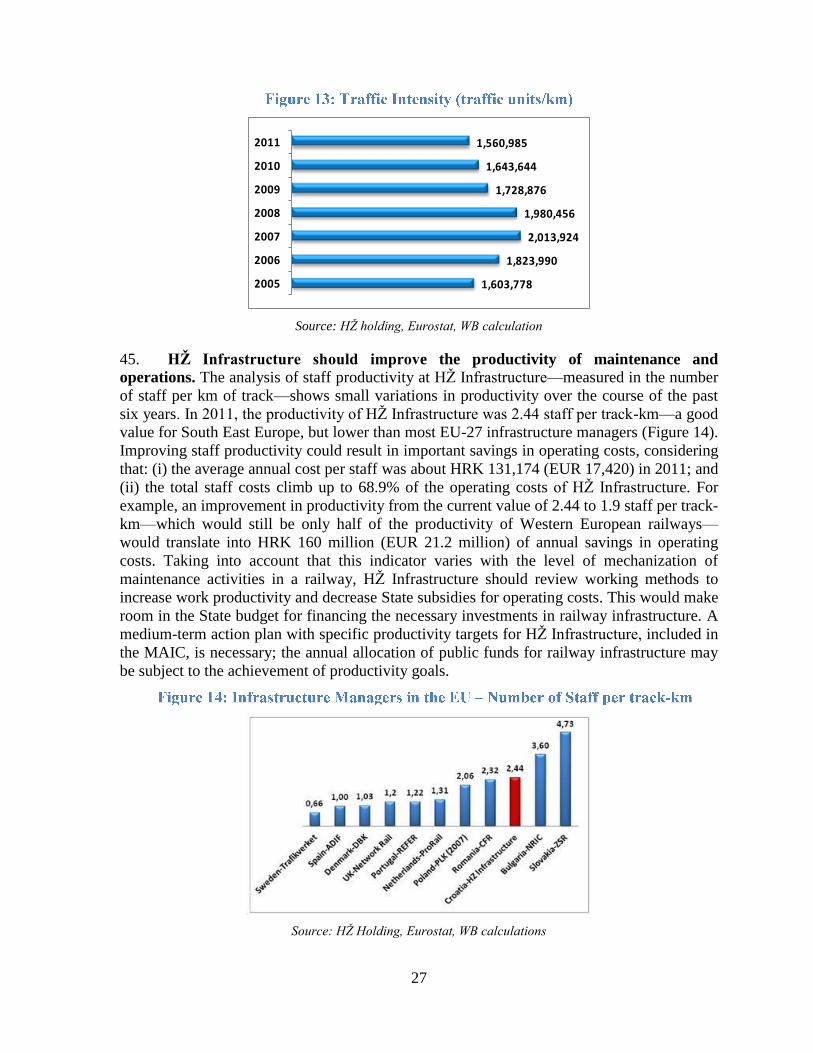
27
1,603,778
1,823,990
2,013,924
1,980,456
1,728,876
1,643,644
1,560,985
2005
2006
2007
2008
2009
2010
2011
Source: HŽ holding, Eurostat, WB calculation
45. HŽ Infrastructure should improve the productivity of maintenance and
operations. The analysis of staff productivity at HŽ Infrastructure—measured in the number
of staff per km of track—shows small variations in productivity over the course of the past
six years. In 2011, the productivity of HŽ Infrastructure was 2.44 staff per track-km—a good
value for South East Europe, but lower than most EU-27 infrastructure managers (Figure 14).
Improving staff productivity could result in important savings in operating costs, considering
that: (i) the average annual cost per staff was about HRK 131,174 (EUR 17,420) in 2011; and
(ii) the total staff costs climb up to 68.9% of the operating costs of HŽ Infrastructure. For
example, an improvement in productivity from the current value of 2.44 to 1.9 staff per track-
km—which would still be only half of the productivity of Western European railways—
would translate into HRK 160 million (EUR 21.2 million) of annual savings in operating
costs. Taking into account that this indicator varies with the level of mechanization of
maintenance activities in a railway, HŽ Infrastructure should review working methods to
increase work productivity and decrease State subsidies for operating costs. This would make
room in the State budget for financing the necessary investments in railway infrastructure. A
medium-term action plan with specific productivity targets for HŽ Infrastructure, included in
the MAIC, is necessary; the annual allocation of public funds for railway infrastructure may
be subject to the achievement of productivity goals.
Source: HŽ Holding, Eurostat, WB calculations
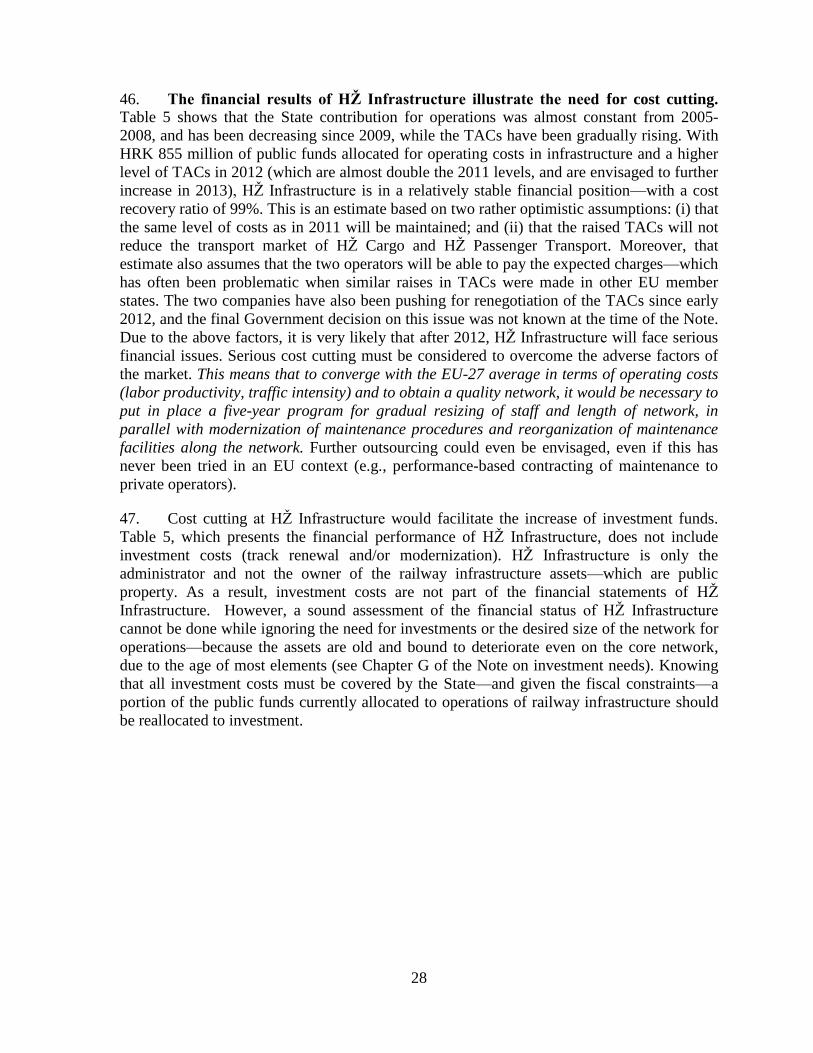
28
46. The financial results of HŽ Infrastructure illustrate the need for cost cutting.
Table 5 shows that the State contribution for operations was almost constant from 2005-
2008, and has been decreasing since 2009, while the TACs have been gradually rising. With
HRK 855 million of public funds allocated for operating costs in infrastructure and a higher
level of TACs in 2012 (which are almost double the 2011 levels, and are envisaged to further
increase in 2013), HŽ Infrastructure is in a relatively stable financial position—with a cost
recovery ratio of 99%. This is an estimate based on two rather optimistic assumptions: (i) that
the same level of costs as in 2011 will be maintained; and (ii) that the raised TACs will not
reduce the transport market of HŽ Cargo and HŽ Passenger Transport. Moreover, that
estimate also assumes that the two operators will be able to pay the expected charges—which
has often been problematic when similar raises in TACs were made in other EU member
states. The two companies have also been pushing for renegotiation of the TACs since early
2012, and the final Government decision on this issue was not known at the time of the Note.
Due to the above factors, it is very likely that after 2012, HŽ Infrastructure will face serious
financial issues. Serious cost cutting must be considered to overcome the adverse factors of
the market. This means that to converge with the EU-27 average in terms of operating costs
(labor productivity, traffic intensity) and to obtain a quality network, it would be necessary to
put in place a five-year program for gradual resizing of staff and length of network, in
parallel with modernization of maintenance procedures and reorganization of maintenance
facilities along the network. Further outsourcing could even be envisaged, even if this has
never been tried in an EU context (e.g., performance-based contracting of maintenance to
private operators).
47. Cost cutting at HŽ Infrastructure would facilitate the increase of investment funds.
Table 5, which presents the financial performance of HŽ Infrastructure, does not include
investment costs (track renewal and/or modernization). HŽ Infrastructure is only the
administrator and not the owner of the railway infrastructure assets—which are public
property. As a result, investment costs are not part of the financial statements of HŽ
Infrastructure. However, a sound assessment of the financial status of HŽ Infrastructure
cannot be done while ignoring the need for investments or the desired size of the network for
operations—because the assets are old and bound to deteriorate even on the core network,
due to the age of most elements (see Chapter G of the Note on investment needs). Knowing
that all investment costs must be covered by the State—and given the fiscal constraints—a
portion of the public funds currently allocated to operations of railway infrastructure should
be reallocated to investment.
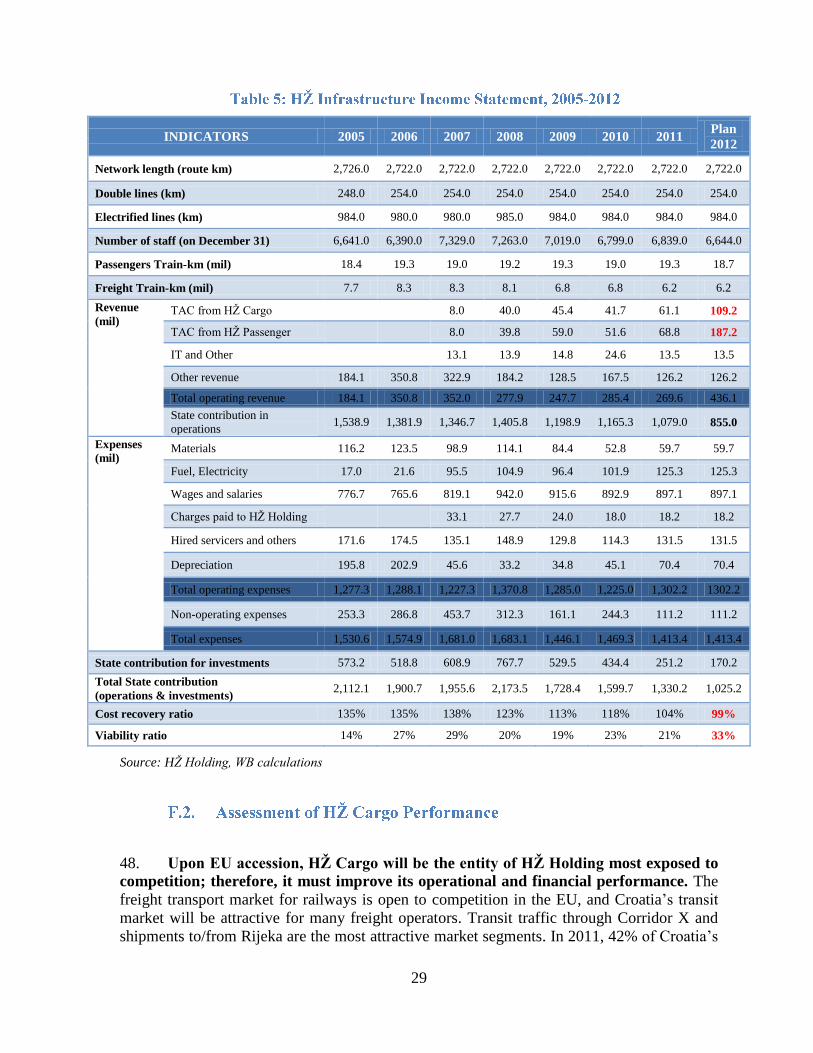
29
INDICATORS 2005 2006 2007 2008 2009 2010 2011 Plan
2012
Network length (route km) 2,726.0 2,722.0 2,722.0 2,722.0 2,722.0 2,722.0 2,722.0 2,722.0
Double lines (km) 248.0 254.0 254.0 254.0 254.0 254.0 254.0 254.0
Electrified lines (km) 984.0 980.0 980.0 985.0 984.0 984.0 984.0 984.0
Number of staff (on December 31) 6,641.0 6,390.0 7,329.0 7,263.0 7,019.0 6,799.0 6,839.0 6,644.0
Passengers Train-km (mil) 18.4 19.3 19.0 19.2 19.3 19.0 19.3 18.7
Freight Train-km (mil) 7.7 8.3 8.3 8.1 6.8 6.8 6.2 6.2
Revenue
(mil) TAC from HŽ Cargo
8.0 40.0 45.4 41.7 61.1 109.2
TAC from HŽ Passenger
8.0 39.8 59.0 51.6 68.8 187.2
IT and Other
13.1 13.9 14.8 24.6 13.5 13.5
Other revenue 184.1 350.8 322.9 184.2 128.5 167.5 126.2 126.2
Total operating revenue 184.1 350.8 352.0 277.9 247.7 285.4 269.6 436.1
State contribution in
operations 1,538.9 1,381.9 1,346.7 1,405.8 1,198.9 1,165.3 1,079.0 855.0
Expenses
(mil) Materials 116.2 123.5 98.9 114.1 84.4 52.8 59.7 59.7
Fuel, Electricity 17.0 21.6 95.5 104.9 96.4 101.9 125.3 125.3
Wages and salaries 776.7 765.6 819.1 942.0 915.6 892.9 897.1 897.1
Charges paid to HŽ Holding
33.1 27.7 24.0 18.0 18.2 18.2
Hired servicers and others 171.6 174.5 135.1 148.9 129.8 114.3 131.5 131.5
Depreciation 195.8 202.9 45.6 33.2 34.8 45.1 70.4 70.4
Total operating expenses 1,277.3 1,288.1 1,227.3 1,370.8 1,285.0 1,225.0 1,302.2 1302.2
Non-operating expenses 253.3 286.8 453.7 312.3 161.1 244.3 111.2 111.2
Total expenses 1,530.6 1,574.9 1,681.0 1,683.1 1,446.1 1,469.3 1,413.4 1,413.4
State contribution for investments 573.2 518.8 608.9 767.7 529.5 434.4 251.2 170.2
Total State contribution
(operations & investments) 2,112.1 1,900.7 1,955.6 2,173.5 1,728.4 1,599.7 1,330.2 1,025.2
Cost recovery ratio 135% 135% 138% 123% 113% 118% 104% 99%
Viability ratio 14% 27% 29% 20% 19% 23% 21% 33%
Source: HŽ Holding, WB calculations
48. Upon EU accession, HŽ Cargo will be the entity of HŽ Holding most exposed to
competition; therefore, it must improve its operational and financial performance. The
freight transport market for railways is open to competition in the EU, and Croatia’s transit
market will be attractive for many freight operators. Transit traffic through Corridor X and
shipments to/from Rijeka are the most attractive market segments. In 2011, 42% of Croatia’s
30
freight traffic was transit, 11% represented import traffic, and 21% export. This means that
the share of international traffic in total business of HŽ Cargo represents 74%. HŽ Cargo
must be able to offer highly competitive tariffs and quality of services to preserve these
volumes in an open transport market. The analysis of the present operational and financial
performance of HŽ Cargo will offer a clearer image of its capacity to compete successfully in
this segment. Creating international alliances with other important railway operators in
Europe would be a good method by which to consolidate the important transit flows of
freight on Corridor X in Croatia.
49. Creating better conditions under which to compete in the open transport market
is paramount. After EU accession, HŽ Cargo will have to compete against other rail freight
operators that will be focusing on attracting the company’s customers, especially those for
whom rail offers the greatest competitive advantage. In this context, private operators in
particular are generally more flexible than State-owned railways—with less structure costs,
and a greater capacity to make rapid decisions and adapt to market needs. Another source of
competition is a highly decentralized, deregulated and entrepreneurial road freight haulage
industry that faces minimal constraints on entry, movement, management or pricing. If HŽ
Cargo does not quickly adapt its business practices, private freight operators and road freight
transport may take all of the most profitable freight business in Croatia and leave HŽ Cargo
with the least profitable or unprofitable segments. This future competition combined with the
prohibition of State aid to railway freight in the EU context may put HŽ Cargo in serious
financial difficulties.
50. Therefore, the potential privatization of HŽ Cargo would normally represent the
best solution to ensure its survival. However, this would be a complex task and would
require preparation that could take at least 12-18 months—unless there is an extremely well-
prepared process supported at the highest political level. Preparatory actions would include
legal, regulatory, financial and technical due diligence to privatize freight services, clarify all
property issues, develop appropriate financial models to assess the profitability of HŽ Cargo
under various scenarios of competition and traffic levels, staffing and other operating costs,
investments, or exclusivity periods.
51. There has been a lack of significant progress to improve the operational
performance of HŽ Cargo, as reflected by increasing unit costs20
since 2007 (Figure 15). Under these conditions, HŽ Cargo achieved a viability ratio of 106% (Figure 16), illustrating
its ability to cover costs from operating revenues without State support. The main challenge
after the EU accession will be to achieve a level of viability ratio that would allow for the
replacement of life-expired assets (mainly wagons and locomotives) in addition to financing
operating costs. The enhancement of the financial performance of HŽ Cargo could be based
on a precise set of actions, such as:
a) Transferring part of HŽ Traction’s locomotives, staff, and assets to its own
administration for better cost control;
b) Resizing the staff, and the locomotive and wagon fleets to mirror market needs
and achieve better productivities.
20 Unit cost = average operating cost for transporting one ton-km.
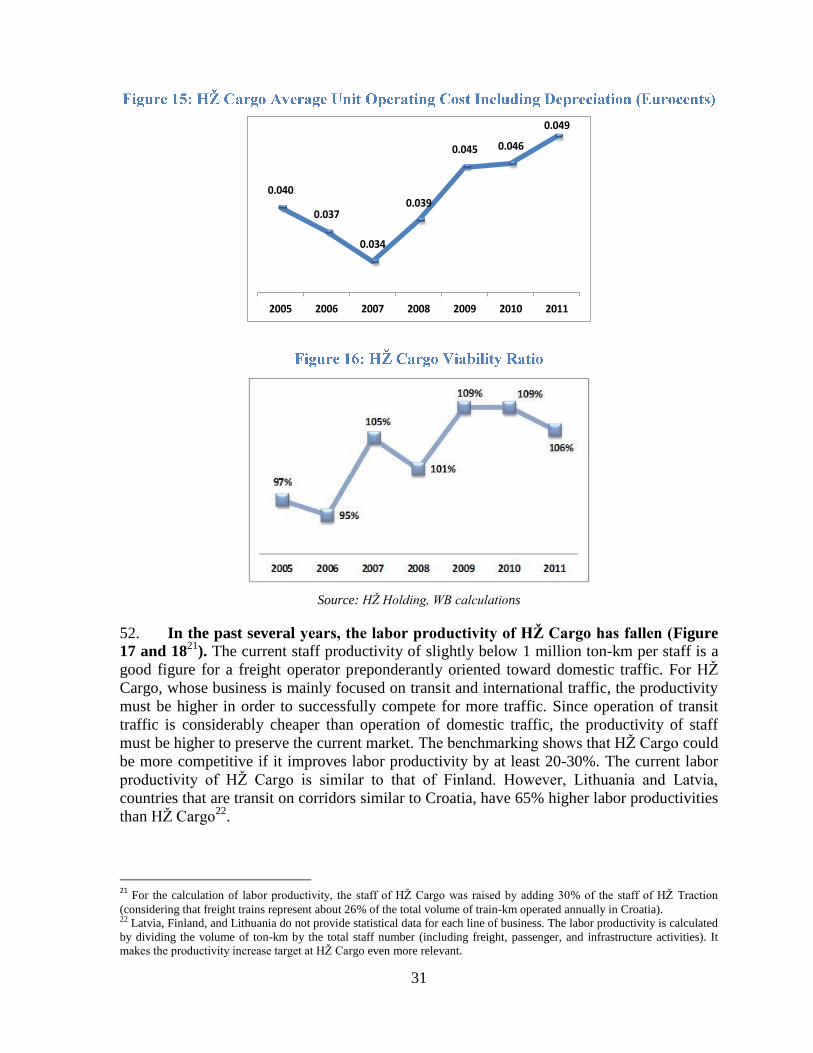
31
0.040
0.037
0.034
0.039
0.045 0.046
0.049
2005 2006 2007 2008 2009 2010 2011
Source: HŽ Holding, WB calculations
52. In the past several years, the labor productivity of HŽ Cargo has fallen (Figure
17 and 1821
). The current staff productivity of slightly below 1 million ton-km per staff is a
good figure for a freight operator preponderantly oriented toward domestic traffic. For HŽ
Cargo, whose business is mainly focused on transit and international traffic, the productivity
must be higher in order to successfully compete for more traffic. Since operation of transit
traffic is considerably cheaper than operation of domestic traffic, the productivity of staff
must be higher to preserve the current market. The benchmarking shows that HŽ Cargo could
be more competitive if it improves labor productivity by at least 20-30%. The current labor
productivity of HŽ Cargo is similar to that of Finland. However, Lithuania and Latvia,
countries that are transit on corridors similar to Croatia, have 65% higher labor productivities
than HŽ Cargo22
.
21
For the calculation of labor productivity, the staff of HŽ Cargo was raised by adding 30% of the staff of HŽ Traction
(considering that freight trains represent about 26% of the total volume of train-km operated annually in Croatia). 22 Latvia, Finland, and Lithuania do not provide statistical data for each line of business. The labor productivity is calculated
by dividing the volume of ton-km by the total staff number (including freight, passenger, and infrastructure activities). It
makes the productivity increase target at HŽ Cargo even more relevant.
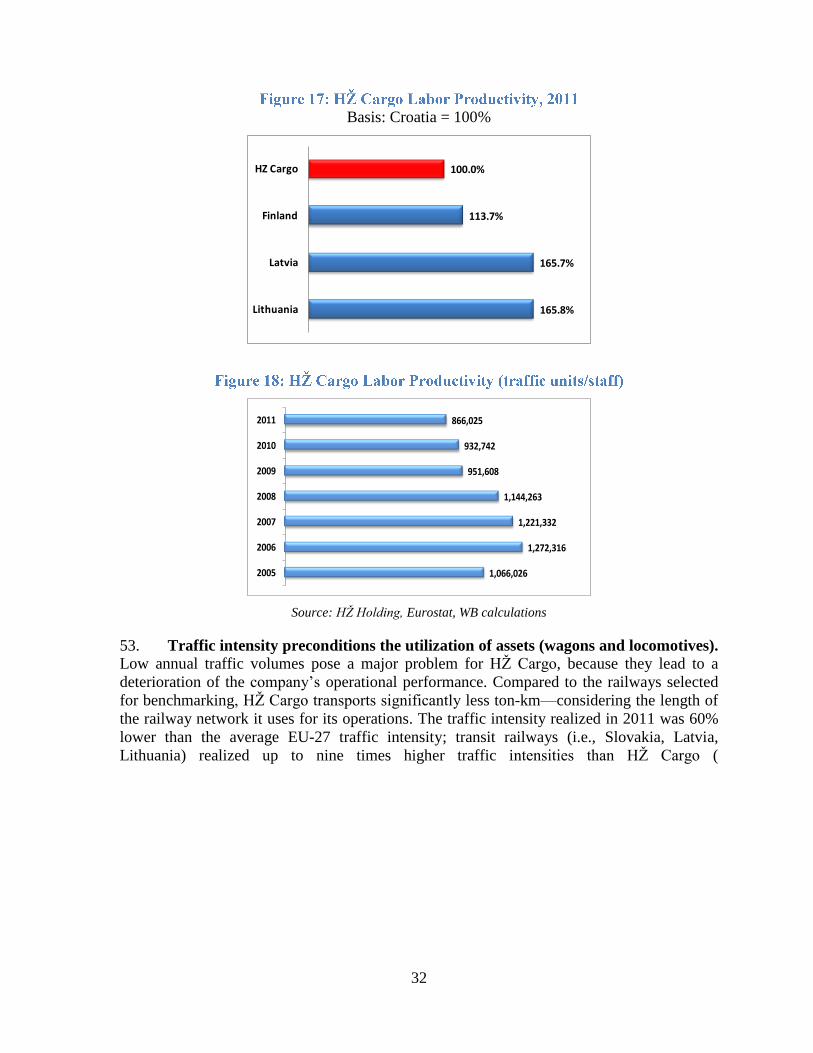
32
Basis: Croatia = 100%
165.8%
165.7%
113.7%
100.0%
Lithuania
Latvia
Finland
HZ Cargo
1,066,026
1,272,316
1,221,332
1,144,263
951,608
932,742
866,025
2005
2006
2007
2008
2009
2010
2011
Source: HŽ Holding, Eurostat, WB calculations
53. Traffic intensity preconditions the utilization of assets (wagons and locomotives).
Low annual traffic volumes pose a major problem for HŽ Cargo, because they lead to a
deterioration of the company’s operational performance. Compared to the railways selected
for benchmarking, HŽ Cargo transports significantly less ton-km—considering the length of
the railway network it uses for its operations. The traffic intensity realized in 2011 was 60%
lower than the average EU-27 traffic intensity; transit railways (i.e., Slovakia, Latvia,
Lithuania) realized up to nine times higher traffic intensities than HŽ Cargo (

33
Figure 19). This indicator raises the problem of evaluating the size of the railway network
open for freight traffic in Croatia—especially in secondary lines with a low volume of traffic
and high operating costs. Nevertheless, attracting more traffic along Corridor X in
cooperation with the neighboring railways is paramount to improve HŽ Cargo’s financial
strength.
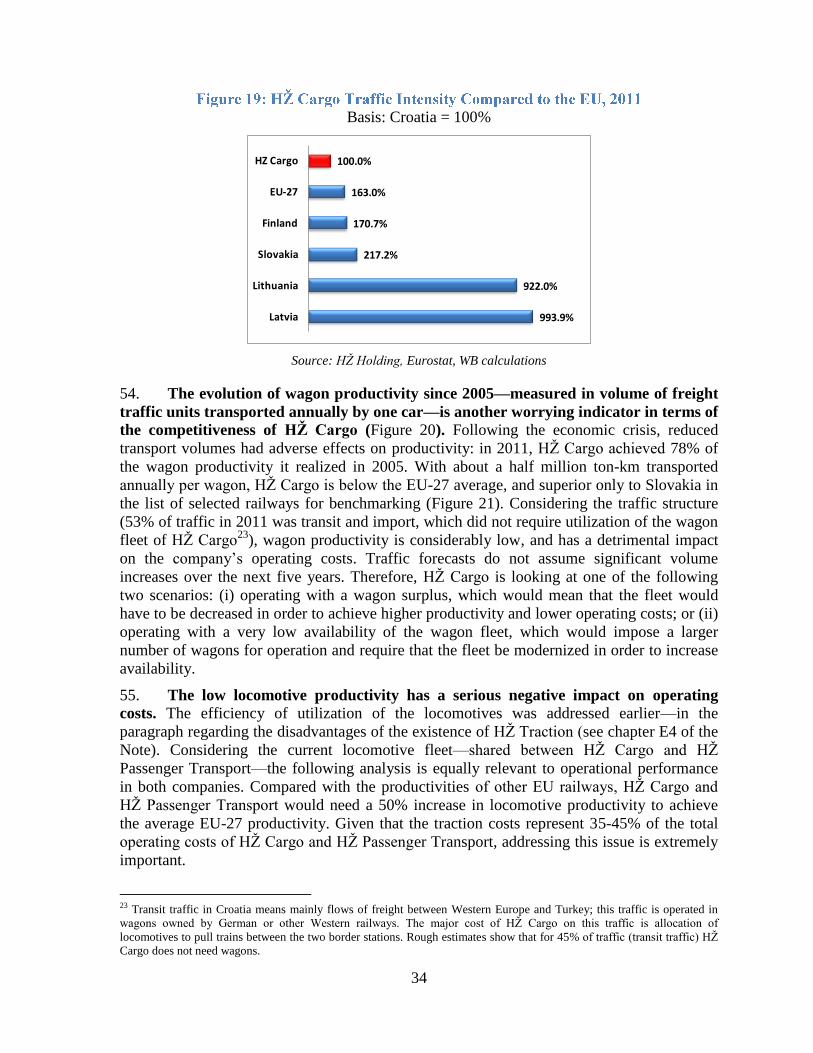
34
Basis: Croatia = 100%
993.9%
922.0%
217.2%
170.7%
163.0%
100.0%
Latvia
Lithuania
Slovakia
Finland
EU-27
HZ Cargo
Source: HŽ Holding, Eurostat, WB calculations
54. The evolution of wagon productivity since 2005—measured in volume of freight
traffic units transported annually by one car—is another worrying indicator in terms of
the competitiveness of HŽ Cargo (Figure 20). Following the economic crisis, reduced
transport volumes had adverse effects on productivity: in 2011, HŽ Cargo achieved 78% of
the wagon productivity it realized in 2005. With about a half million ton-km transported
annually per wagon, HŽ Cargo is below the EU-27 average, and superior only to Slovakia in
the list of selected railways for benchmarking (Figure 21). Considering the traffic structure
(53% of traffic in 2011 was transit and import, which did not require utilization of the wagon
fleet of HŽ Cargo23
), wagon productivity is considerably low, and has a detrimental impact
on the company’s operating costs. Traffic forecasts do not assume significant volume
increases over the next five years. Therefore, HŽ Cargo is looking at one of the following
two scenarios: (i) operating with a wagon surplus, which would mean that the fleet would
have to be decreased in order to achieve higher productivity and lower operating costs; or (ii)
operating with a very low availability of the wagon fleet, which would impose a larger
number of wagons for operation and require that the fleet be modernized in order to increase
availability.
55. The low locomotive productivity has a serious negative impact on operating
costs. The efficiency of utilization of the locomotives was addressed earlier—in the
paragraph regarding the disadvantages of the existence of HŽ Traction (see chapter E4 of the
Note). Considering the current locomotive fleet—shared between HŽ Cargo and HŽ
Passenger Transport—the following analysis is equally relevant to operational performance
in both companies. Compared with the productivities of other EU railways, HŽ Cargo and
HŽ Passenger Transport would need a 50% increase in locomotive productivity to achieve
the average EU-27 productivity. Given that the traction costs represent 35-45% of the total
operating costs of HŽ Cargo and HŽ Passenger Transport, addressing this issue is extremely
important.
23 Transit traffic in Croatia means mainly flows of freight between Western Europe and Turkey; this traffic is operated in
wagons owned by German or other Western railways. The major cost of HŽ Cargo on this traffic is allocation of
locomotives to pull trains between the two border stations. Rough estimates show that for 45% of traffic (transit traffic) HŽ
Cargo does not need wagons.
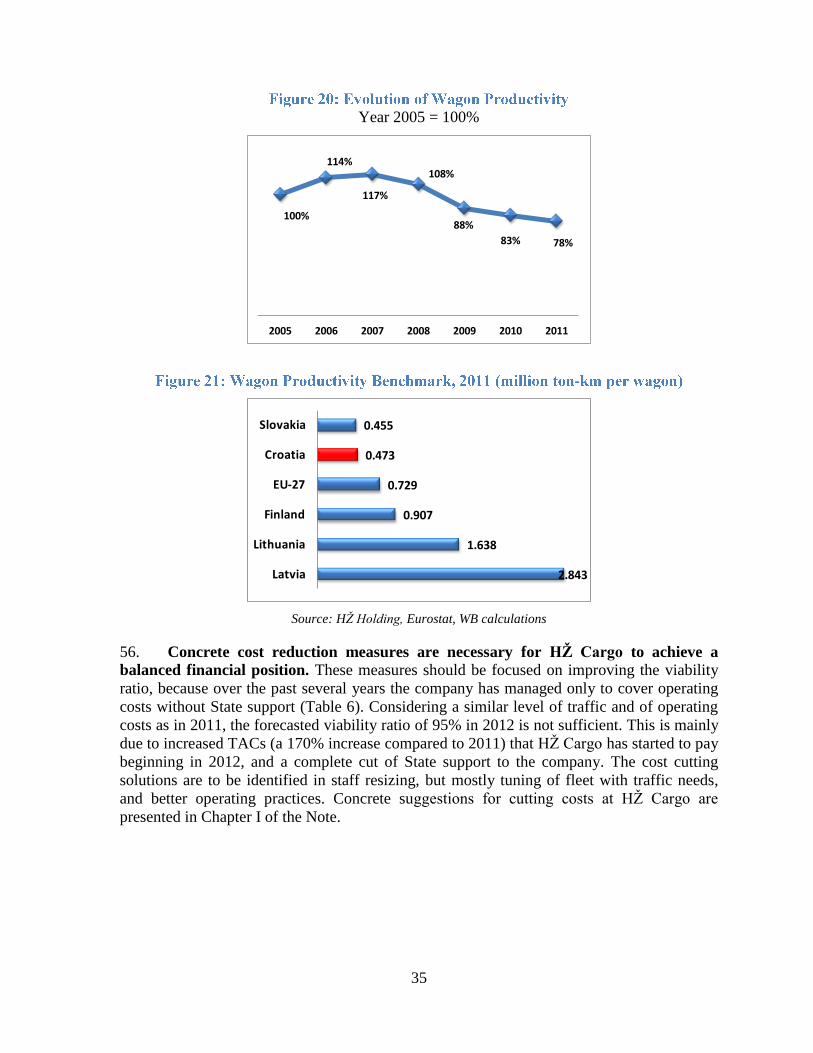
35
Year 2005 = 100%
100%
114%
117%
108%
88%
83% 78%
2005 2006 2007 2008 2009 2010 2011
2.843
1.638
0.907
0.729
0.473
0.455
Latvia
Lithuania
Finland
EU-27
Croatia
Slovakia
Source: HŽ Holding, Eurostat, WB calculations
56. Concrete cost reduction measures are necessary for HŽ Cargo to achieve a
balanced financial position. These measures should be focused on improving the viability
ratio, because over the past several years the company has managed only to cover operating
costs without State support (Table 6). Considering a similar level of traffic and of operating
costs as in 2011, the forecasted viability ratio of 95% in 2012 is not sufficient. This is mainly
due to increased TACs (a 170% increase compared to 2011) that HŽ Cargo has started to pay
beginning in 2012, and a complete cut of State support to the company. The cost cutting
solutions are to be identified in staff resizing, but mostly tuning of fleet with traffic needs,
and better operating practices. Concrete suggestions for cutting costs at HŽ Cargo are
presented in Chapter I of the Note.
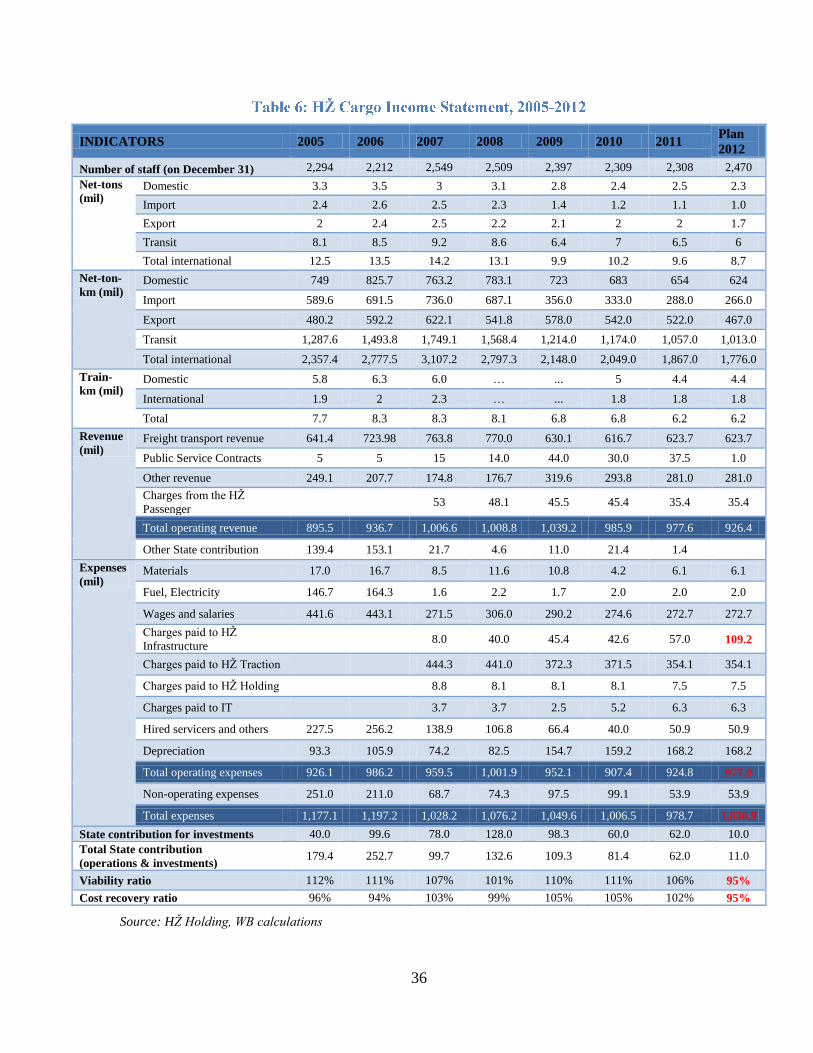
36
INDICATORS 2005 2006 2007 2008 2009 2010 2011 Plan
2012
Number of staff (on December 31) 2,294 2,212 2,549 2,509 2,397 2,309 2,308 2,470
Net-tons
(mil) Domestic 3.3 3.5 3 3.1 2.8 2.4 2.5 2.3
Import 2.4 2.6 2.5 2.3 1.4 1.2 1.1 1.0
Export 2 2.4 2.5 2.2 2.1 2 2 1.7
Transit 8.1 8.5 9.2 8.6 6.4 7 6.5 6
Total international 12.5 13.5 14.2 13.1 9.9 10.2 9.6 8.7
Net-ton-
km (mil) Domestic 749 825.7 763.2 783.1 723 683 654 624
Import 589.6 691.5 736.0 687.1 356.0 333.0 288.0 266.0
Export 480.2 592.2 622.1 541.8 578.0 542.0 522.0 467.0
Transit 1,287.6 1,493.8 1,749.1 1,568.4 1,214.0 1,174.0 1,057.0 1,013.0
Total international 2,357.4 2,777.5 3,107.2 2,797.3 2,148.0 2,049.0 1,867.0 1,776.0
Train-
km (mil) Domestic 5.8 6.3 6.0 … ... 5 4.4 4.4
International 1.9 2 2.3 … ... 1.8 1.8 1.8
Total 7.7 8.3 8.3 8.1 6.8 6.8 6.2 6.2
Revenue
(mil) Freight transport revenue 641.4 723.98 763.8 770.0 630.1 616.7 623.7 623.7
Public Service Contracts 5 5 15 14.0 44.0 30.0 37.5 1.0
Other revenue 249.1 207.7 174.8 176.7 319.6 293.8 281.0 281.0
Charges from the HŽ
Passenger 53 48.1 45.5 45.4 35.4 35.4
Total operating revenue 895.5 936.7 1,006.6 1,008.8 1,039.2 985.9 977.6 926.4
Other State contribution 139.4 153.1 21.7 4.6 11.0 21.4 1.4
Expenses
(mil) Materials 17.0 16.7 8.5 11.6 10.8 4.2 6.1 6.1
Fuel, Electricity 146.7 164.3 1.6 2.2 1.7 2.0 2.0 2.0
Wages and salaries 441.6 443.1 271.5 306.0 290.2 274.6 272.7 272.7
Charges paid to HŽ
Infrastructure 8.0 40.0 45.4 42.6 57.0 109.2
Charges paid to HŽ Traction
444.3 441.0 372.3 371.5 354.1 354.1
Charges paid to HŽ Holding
8.8 8.1 8.1 8.1 7.5 7.5
Charges paid to IT
3.7 3.7 2.5 5.2 6.3 6.3
Hired servicers and others 227.5 256.2 138.9 106.8 66.4 40.0 50.9 50.9
Depreciation 93.3 105.9 74.2 82.5 154.7 159.2 168.2 168.2
Total operating expenses 926.1 986.2 959.5 1,001.9 952.1 907.4 924.8 977.0
Non-operating expenses 251.0 211.0 68.7 74.3 97.5 99.1 53.9 53.9
Total expenses 1,177.1 1,197.2 1,028.2 1,076.2 1,049.6 1,006.5 978.7 1,030.9
State contribution for investments 40.0 99.6 78.0 128.0 98.3 60.0 62.0 10.0
Total State contribution
(operations & investments) 179.4 252.7 99.7 132.6 109.3 81.4 62.0 11.0
Viability ratio 112% 111% 107% 101% 110% 111% 106% 95%
Cost recovery ratio 96% 94% 103% 99% 105% 105% 102% 95%
Source: HŽ Holding, WB calculations
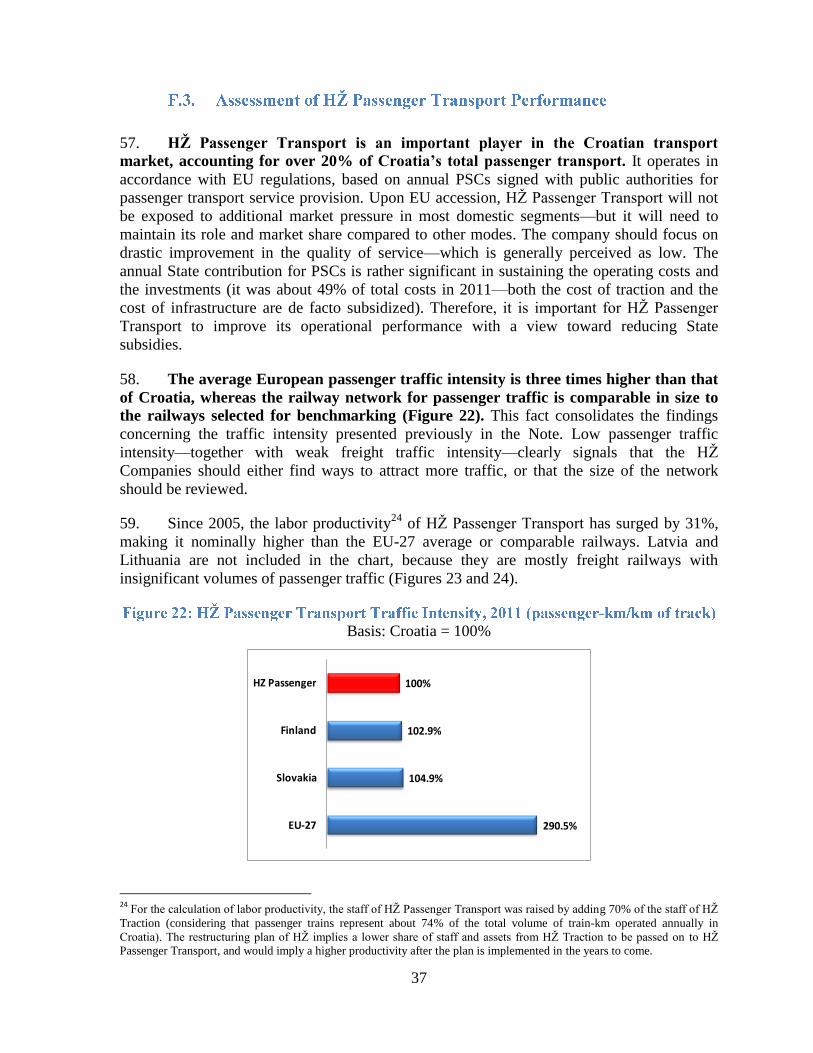
37
57. HŽ Passenger Transport is an important player in the Croatian transport
market, accounting for over 20% of Croatia’s total passenger transport. It operates in
accordance with EU regulations, based on annual PSCs signed with public authorities for
passenger transport service provision. Upon EU accession, HŽ Passenger Transport will not
be exposed to additional market pressure in most domestic segments—but it will need to
maintain its role and market share compared to other modes. The company should focus on
drastic improvement in the quality of service—which is generally perceived as low. The
annual State contribution for PSCs is rather significant in sustaining the operating costs and
the investments (it was about 49% of total costs in 2011—both the cost of traction and the
cost of infrastructure are de facto subsidized). Therefore, it is important for HŽ Passenger
Transport to improve its operational performance with a view toward reducing State
subsidies.
58. The average European passenger traffic intensity is three times higher than that
of Croatia, whereas the railway network for passenger traffic is comparable in size to
the railways selected for benchmarking (Figure 22). This fact consolidates the findings
concerning the traffic intensity presented previously in the Note. Low passenger traffic
intensity—together with weak freight traffic intensity—clearly signals that the HŽ
Companies should either find ways to attract more traffic, or that the size of the network
should be reviewed.
59. Since 2005, the labor productivity24
of HŽ Passenger Transport has surged by 31%,
making it nominally higher than the EU-27 average or comparable railways. Latvia and
Lithuania are not included in the chart, because they are mostly freight railways with
insignificant volumes of passenger traffic (Figures 23 and 24).
Basis: Croatia = 100%
290.5%
104.9%
102.9%
100%
EU-27
Slovakia
Finland
HZ Passenger
24
For the calculation of labor productivity, the staff of HŽ Passenger Transport was raised by adding 70% of the staff of HŽ
Traction (considering that passenger trains represent about 74% of the total volume of train-km operated annually in
Croatia). The restructuring plan of HŽ implies a lower share of staff and assets from HŽ Traction to be passed on to HŽ
Passenger Transport, and would imply a higher productivity after the plan is implemented in the years to come.
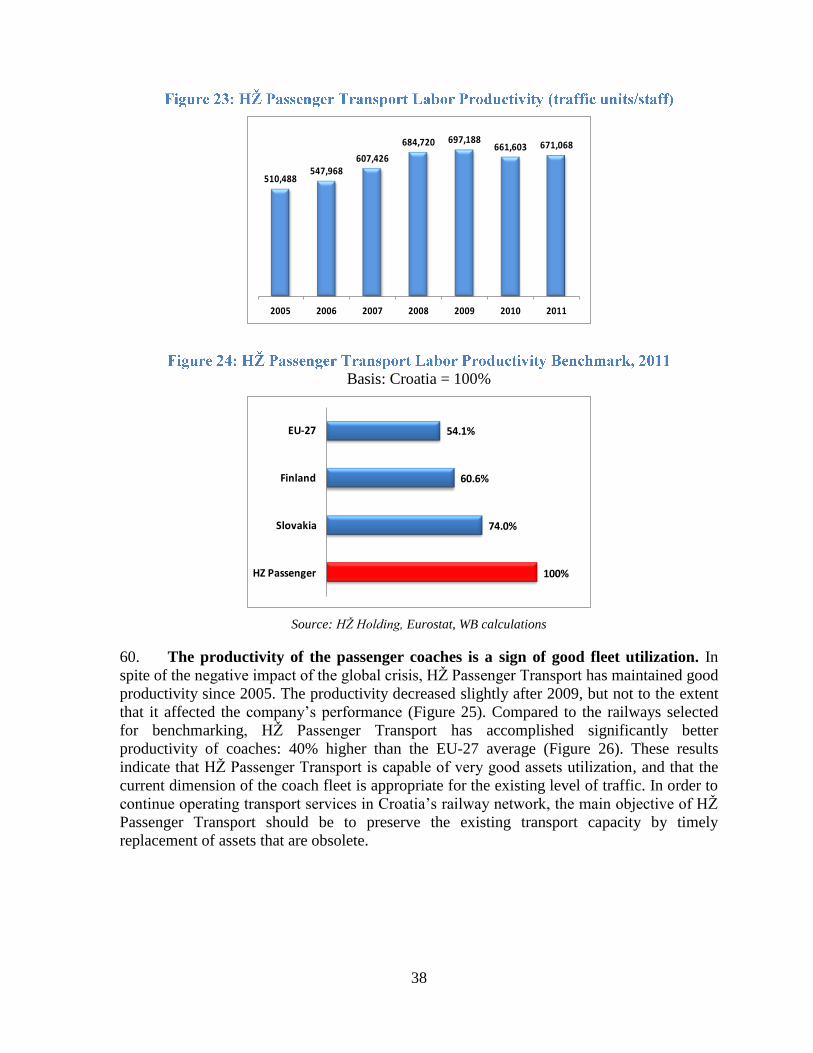
38
510,488547,968
607,426
684,720 697,188661,603 671,068
2005 2006 2007 2008 2009 2010 2011
Basis: Croatia = 100%
100%
74.0%
60.6%
54.1%
HZ Passenger
Slovakia
Finland
EU-27
Source: HŽ Holding, Eurostat, WB calculations
60. The productivity of the passenger coaches is a sign of good fleet utilization. In
spite of the negative impact of the global crisis, HŽ Passenger Transport has maintained good
productivity since 2005. The productivity decreased slightly after 2009, but not to the extent
that it affected the company’s performance (Figure 25). Compared to the railways selected
for benchmarking, HŽ Passenger Transport has accomplished significantly better
productivity of coaches: 40% higher than the EU-27 average (Figure 26). These results
indicate that HŽ Passenger Transport is capable of very good assets utilization, and that the
current dimension of the coach fleet is appropriate for the existing level of traffic. In order to
continue operating transport services in Croatia’s railway network, the main objective of HŽ
Passenger Transport should be to preserve the existing transport capacity by timely
replacement of assets that are obsolete.
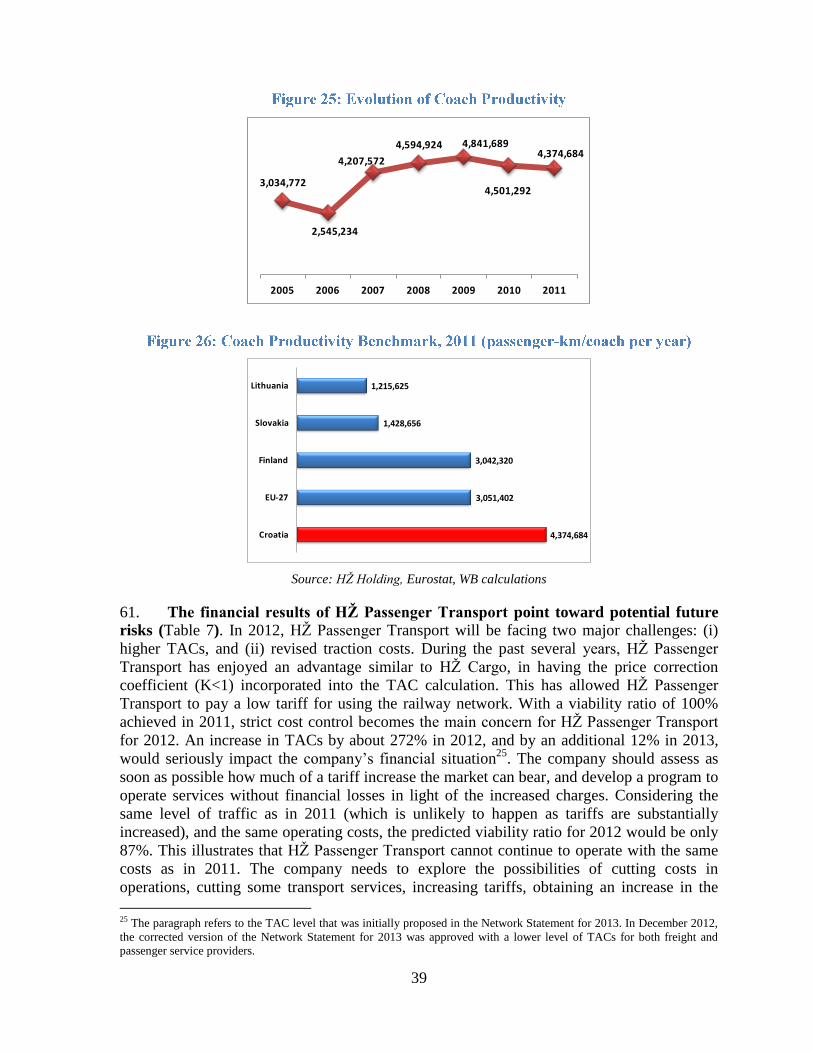
39
3,034,772
2,545,234
4,207,572
4,594,924 4,841,689
4,501,292
4,374,684
2005 2006 2007 2008 2009 2010 2011
4,374,684
3,051,402
3,042,320
1,428,656
1,215,625
Croatia
EU-27
Finland
Slovakia
Lithuania
Source: HŽ Holding, Eurostat, WB calculations
61. The financial results of HŽ Passenger Transport point toward potential future
risks (Table 7). In 2012, HŽ Passenger Transport will be facing two major challenges: (i)
higher TACs, and (ii) revised traction costs. During the past several years, HŽ Passenger
Transport has enjoyed an advantage similar to HŽ Cargo, in having the price correction
coefficient (K<1) incorporated into the TAC calculation. This has allowed HŽ Passenger
Transport to pay a low tariff for using the railway network. With a viability ratio of 100%
achieved in 2011, strict cost control becomes the main concern for HŽ Passenger Transport
for 2012. An increase in TACs by about 272% in 2012, and by an additional 12% in 2013,
would seriously impact the company’s financial situation25
. The company should assess as
soon as possible how much of a tariff increase the market can bear, and develop a program to
operate services without financial losses in light of the increased charges. Considering the
same level of traffic as in 2011 (which is unlikely to happen as tariffs are substantially
increased), and the same operating costs, the predicted viability ratio for 2012 would be only
87%. This illustrates that HŽ Passenger Transport cannot continue to operate with the same
costs as in 2011. The company needs to explore the possibilities of cutting costs in
operations, cutting some transport services, increasing tariffs, obtaining an increase in the
25 The paragraph refers to the TAC level that was initially proposed in the Network Statement for 2013. In December 2012,
the corrected version of the Network Statement for 2013 was approved with a lower level of TACs for both freight and
passenger service providers.
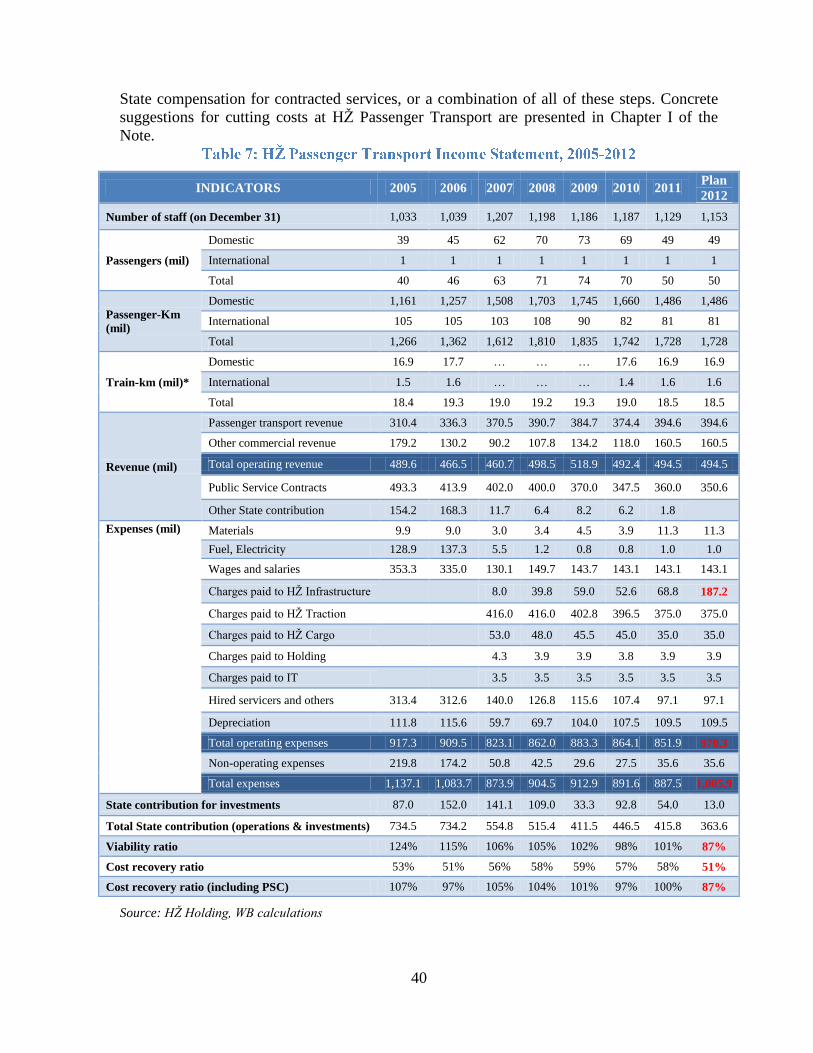
40
State compensation for contracted services, or a combination of all of these steps. Concrete
suggestions for cutting costs at HŽ Passenger Transport are presented in Chapter I of the
Note.
INDICATORS 2005 2006 2007 2008 2009 2010 2011 Plan
2012
Number of staff (on December 31) 1,033 1,039 1,207 1,198 1,186 1,187 1,129 1,153
Passengers (mil)
Domestic 39 45 62 70 73 69 49 49
International 1 1 1 1 1 1 1 1
Total 40 46 63 71 74 70 50 50
Passenger-Km
(mil)
Domestic 1,161 1,257 1,508 1,703 1,745 1,660 1,486 1,486
International 105 105 103 108 90 82 81 81
Total 1,266 1,362 1,612 1,810 1,835 1,742 1,728 1,728
Train-km (mil)*
Domestic 16.9 17.7 … … … 17.6 16.9 16.9
International 1.5 1.6 … … … 1.4 1.6 1.6
Total 18.4 19.3 19.0 19.2 19.3 19.0 18.5 18.5
Revenue (mil)
Passenger transport revenue 310.4 336.3 370.5 390.7 384.7 374.4 394.6 394.6
Other commercial revenue 179.2 130.2 90.2 107.8 134.2 118.0 160.5 160.5
Total operating revenue 489.6 466.5 460.7 498.5 518.9 492.4 494.5 494.5
Public Service Contracts 493.3 413.9 402.0 400.0 370.0 347.5 360.0 350.6
Other State contribution 154.2 168.3 11.7 6.4 8.2 6.2 1.8
Expenses (mil) Materials 9.9 9.0 3.0 3.4 4.5 3.9 11.3 11.3
Fuel, Electricity 128.9 137.3 5.5 1.2 0.8 0.8 1.0 1.0
Wages and salaries 353.3 335.0 130.1 149.7 143.7 143.1 143.1 143.1
Charges paid to HŽ Infrastructure
8.0 39.8 59.0 52.6 68.8 187.2
Charges paid to HŽ Traction
416.0 416.0 402.8 396.5 375.0 375.0
Charges paid to HŽ Cargo
53.0 48.0 45.5 45.0 35.0 35.0
Charges paid to Holding
4.3 3.9 3.9 3.8 3.9 3.9
Charges paid to IT
3.5 3.5 3.5 3.5 3.5 3.5
Hired servicers and others 313.4 312.6 140.0 126.8 115.6 107.4 97.1 97.1
Depreciation 111.8 115.6 59.7 69.7 104.0 107.5 109.5 109.5
Total operating expenses 917.3 909.5 823.1 862.0 883.3 864.1 851.9 970.3
Non-operating expenses 219.8 174.2 50.8 42.5 29.6 27.5 35.6 35.6
Total expenses 1,137.1 1,083.7 873.9 904.5 912.9 891.6 887.5 1,005.9
State contribution for investments 87.0 152.0 141.1 109.0 33.3 92.8 54.0 13.0
Total State contribution (operations & investments) 734.5 734.2 554.8 515.4 411.5 446.5 415.8 363.6
Viability ratio 124% 115% 106% 105% 102% 98% 101% 87%
Cost recovery ratio 53% 51% 56% 58% 59% 57% 58% 51%
Cost recovery ratio (including PSC) 107% 97% 105% 104% 101% 97% 100% 87%
Source: HŽ Holding, WB calculations
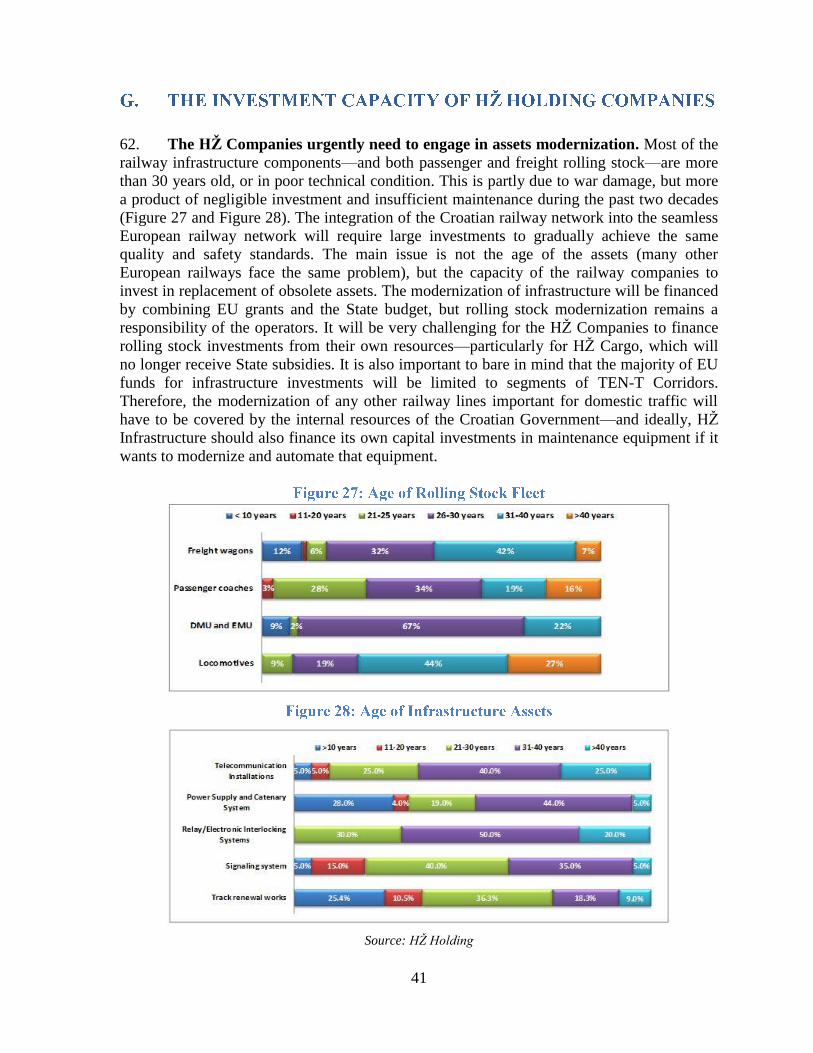
41
62. The HŽ Companies urgently need to engage in assets modernization. Most of the
railway infrastructure components—and both passenger and freight rolling stock—are more
than 30 years old, or in poor technical condition. This is partly due to war damage, but more
a product of negligible investment and insufficient maintenance during the past two decades
(Figure 27 and Figure 28). The integration of the Croatian railway network into the seamless
European railway network will require large investments to gradually achieve the same
quality and safety standards. The main issue is not the age of the assets (many other
European railways face the same problem), but the capacity of the railway companies to
invest in replacement of obsolete assets. The modernization of infrastructure will be financed
by combining EU grants and the State budget, but rolling stock modernization remains a
responsibility of the operators. It will be very challenging for the HŽ Companies to finance
rolling stock investments from their own resources—particularly for HŽ Cargo, which will
no longer receive State subsidies. It is also important to bare in mind that the majority of EU
funds for infrastructure investments will be limited to segments of TEN-T Corridors.
Therefore, the modernization of any other railway lines important for domestic traffic will
have to be covered by the internal resources of the Croatian Government—and ideally, HŽ
Infrastructure should also finance its own capital investments in maintenance equipment if it
wants to modernize and automate that equipment.
Source: HŽ Holding
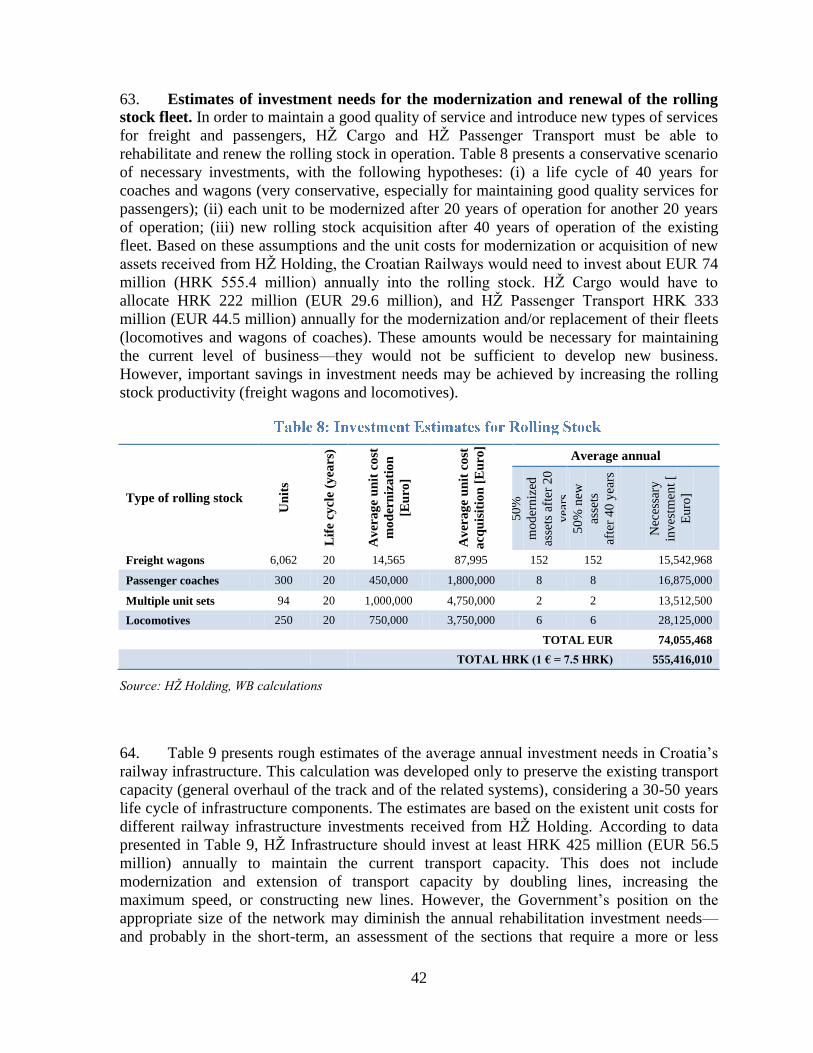
42
63. Estimates of investment needs for the modernization and renewal of the rolling
stock fleet. In order to maintain a good quality of service and introduce new types of services
for freight and passengers, HŽ Cargo and HŽ Passenger Transport must be able to
rehabilitate and renew the rolling stock in operation. Table 8 presents a conservative scenario
of necessary investments, with the following hypotheses: (i) a life cycle of 40 years for
coaches and wagons (very conservative, especially for maintaining good quality services for
passengers); (ii) each unit to be modernized after 20 years of operation for another 20 years
of operation; (iii) new rolling stock acquisition after 40 years of operation of the existing
fleet. Based on these assumptions and the unit costs for modernization or acquisition of new
assets received from HŽ Holding, the Croatian Railways would need to invest about EUR 74
million (HRK 555.4 million) annually into the rolling stock. HŽ Cargo would have to
allocate HRK 222 million (EUR 29.6 million), and HŽ Passenger Transport HRK 333
million (EUR 44.5 million) annually for the modernization and/or replacement of their fleets
(locomotives and wagons of coaches). These amounts would be necessary for maintaining
the current level of business—they would not be sufficient to develop new business.
However, important savings in investment needs may be achieved by increasing the rolling
stock productivity (freight wagons and locomotives).
Type of rolling stock
Un
its
Lif
e cy
cle
(yea
rs)
Av
era
ge
un
it c
ost
mo
der
niz
ati
on
[Eu
ro]
Av
era
ge
un
it c
ost
acq
uis
itio
n [
Eu
ro]
Average annual
50
%
mo
der
niz
ed
asse
ts a
fter
20
yea
rs
50
% n
ew
asse
ts
afte
r 4
0 y
ears
Nec
essa
ry
inv
estm
ent
[
Eu
ro]
Freight wagons 6,062 20 14,565 87,995 152 152 15,542,968
Passenger coaches 300 20 450,000 1,800,000 8 8 16,875,000
Multiple unit sets 94 20 1,000,000 4,750,000 2 2 13,512,500
Locomotives 250 20 750,000 3,750,000 6 6 28,125,000
TOTAL EUR 74,055,468
TOTAL HRK (1 € = 7.5 HRK) 555,416,010
Source: HŽ Holding, WB calculations
64. Table 9 presents rough estimates of the average annual investment needs in Croatia’s
railway infrastructure. This calculation was developed only to preserve the existing transport
capacity (general overhaul of the track and of the related systems), considering a 30-50 years
life cycle of infrastructure components. The estimates are based on the existent unit costs for
different railway infrastructure investments received from HŽ Holding. According to data
presented in Table 9, HŽ Infrastructure should invest at least HRK 425 million (EUR 56.5
million) annually to maintain the current transport capacity. This does not include
modernization and extension of transport capacity by doubling lines, increasing the
maximum speed, or constructing new lines. However, the Government’s position on the
appropriate size of the network may diminish the annual rehabilitation investment needs—
and probably in the short-term, an assessment of the sections that require a more or less
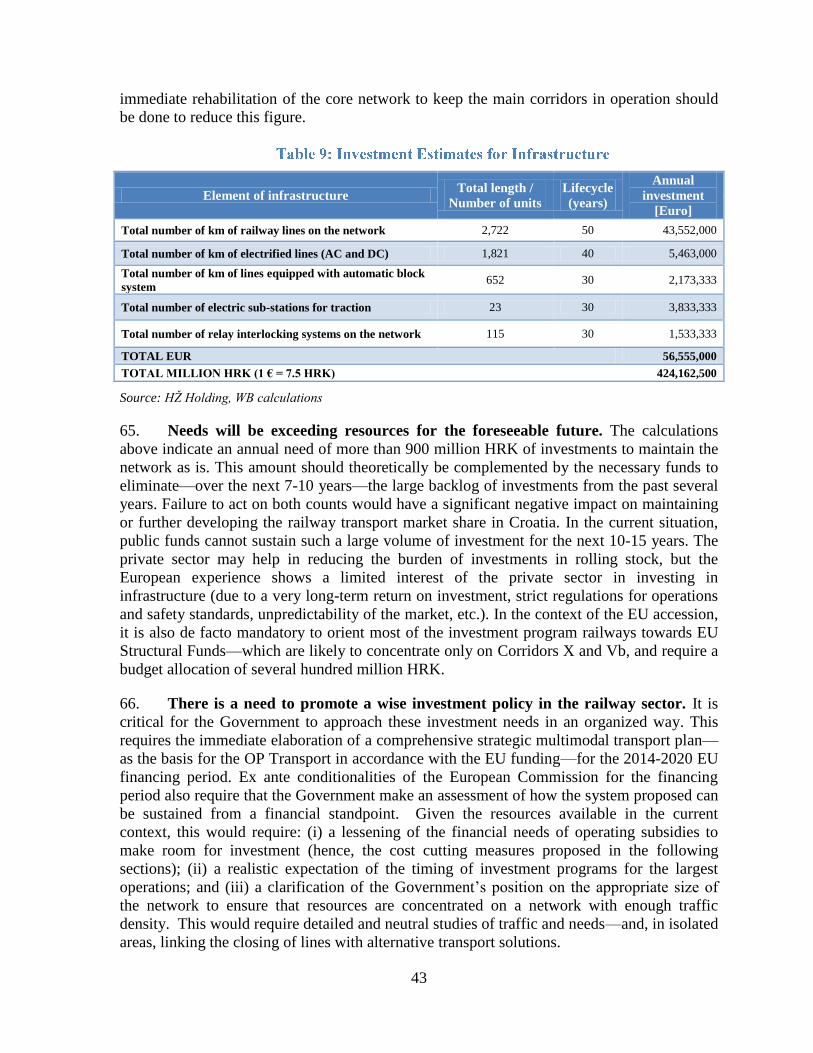
43
immediate rehabilitation of the core network to keep the main corridors in operation should
be done to reduce this figure.
Element of infrastructure Total length /
Number of units
Lifecycle
(years)
Annual
investment
[Euro]
Total number of km of railway lines on the network 2,722 50 43,552,000
Total number of km of electrified lines (AC and DC) 1,821 40 5,463,000
Total number of km of lines equipped with automatic block
system 652 30 2,173,333
Total number of electric sub-stations for traction 23 30 3,833,333
Total number of relay interlocking systems on the network 115 30 1,533,333
TOTAL EUR 56,555,000
TOTAL MILLION HRK (1 € = 7.5 HRK) 424,162,500
Source: HŽ Holding, WB calculations
65. Needs will be exceeding resources for the foreseeable future. The calculations
above indicate an annual need of more than 900 million HRK of investments to maintain the
network as is. This amount should theoretically be complemented by the necessary funds to
eliminate—over the next 7-10 years—the large backlog of investments from the past several
years. Failure to act on both counts would have a significant negative impact on maintaining
or further developing the railway transport market share in Croatia. In the current situation,
public funds cannot sustain such a large volume of investment for the next 10-15 years. The
private sector may help in reducing the burden of investments in rolling stock, but the
European experience shows a limited interest of the private sector in investing in
infrastructure (due to a very long-term return on investment, strict regulations for operations
and safety standards, unpredictability of the market, etc.). In the context of the EU accession,
it is also de facto mandatory to orient most of the investment program railways towards EU
Structural Funds—which are likely to concentrate only on Corridors X and Vb, and require a
budget allocation of several hundred million HRK.
66. There is a need to promote a wise investment policy in the railway sector. It is
critical for the Government to approach these investment needs in an organized way. This
requires the immediate elaboration of a comprehensive strategic multimodal transport plan—
as the basis for the OP Transport in accordance with the EU funding—for the 2014-2020 EU
financing period. Ex ante conditionalities of the European Commission for the financing
period also require that the Government make an assessment of how the system proposed can
be sustained from a financial standpoint. Given the resources available in the current
context, this would require: (i) a lessening of the financial needs of operating subsidies to
make room for investment (hence, the cost cutting measures proposed in the following
sections); (ii) a realistic expectation of the timing of investment programs for the largest
operations; and (iii) a clarification of the Government’s position on the appropriate size of
the network to ensure that resources are concentrated on a network with enough traffic
density. This would require detailed and neutral studies of traffic and needs—and, in isolated
areas, linking the closing of lines with alternative transport solutions.
44
67. There is a need to ensure that the investment program is managed
professionally. Based on the experience of the most recent EU member states and of the
implementation of pre-accession funds, a major challenge for the Government and HŽ
Infrastructure will be to put in place a professional team for the preparation, contracting, and
monitoring of the major investment projects—which will be several times larger than what
the system has managed over previous years—to avoid having railways continue to be a slow
disburser and user of EU funds26
.
26 According to a Report from the European Court of Auditors (Special Report No 14/2011 – Has EU assistance improved
Croatia’s capacity to manage post accession funding?), under IPA-IIIa 2007-09, only 20% of the budget has been
contracted, and 4% disbursed for railway projects. These figures illustrate the urgent need to improve the institutional
capacity of developing and implementing projects financed by EU funds in Croatia.
45
68. The Restructuring Plan included the reorganization of HŽ Holding as suggested
by the World Bank Team. The Restructuring Plan for HŽ Holding, which was prepared by
HŽ Holding itself, was adopted by HŽ Holding’s Assembly (headed by the Minister of
Transport) on June 30, 2012. The most important outcome of this program was the
dissolution of the railway holding into three independent companies: HŽ Infrastructure, HŽ
Cargo, and HŽ Passenger Transport. For each company, the Restructuring Plan outlined a
detailed program that was to be implemented over the period of 2012-2016. In addition to the
analysis of current business, it laid out strategic goals, and an assessment of infrastructure
and human resources, investment needs, and financial plans. The most significant changes
for each company were the following:
a) HŽ Holding: The railway holding ceased to exist in November 2012, after all of
the individual companies had initiated activities according to their restructuring
programs. Until then, HŽ Holding had served as a coordinating body to ensure a
smooth transition to the new organizational structure. Its business shares, as well
as most of its 114 employees, were reallocated between the three new
independent HŽ Companies, most of them going to HŽ Infrastructure.
b) HŽ Infrastructure: HŽ Infrastructure became an independent State company in
charge of the management of railway infrastructure. Its strategic goal was the
overall modernization of railway infrastructure through an ambitious series of
investments that would in total require HRK 17.6 billion27
over the period of
2012-2016. By 2017, HŽ Infrastructure planned to grow its share of revenues
from TACs by 22% as compared to 201228
, and to increase its operated freight
train-km by 24%; it expected that its passenger train-km would decline slightly
over the same period. Additional revenue of around HRK 684 million was to be
created through the sale and lease of real-estate assets, and by providing
secondary services. During the same period, the number of employees was to be
reduced by 21% and retrenchment costs covered by the State—although such
funds have not yet been envisaged in the State budget. The direct effect of the
restructuring would be an increase in total annual revenues to HRK 1.6 billion by
2016, while maintaining a steady level of expenses. The total revenues would also
include a State contribution to railway infrastructure—which would be increased
from HRK 855 million in 2012 to HRK 860 million in 2014, and then held flat
until 2016. This would result in a very minor loss in 2016—as in 2013—and
would correspond to activities essentially even from a financial standpoint during
the period of 2012-2016.
27 A total investment need should be financed from several sources, including the State budget, EU funds, commercial
loans, and HŽ Infrastructure’s own funds.
28 Revenues from TACs in 2012 assume maintained traffic level for freight and passengers, as well as TAC prices
according to the Network Statement 2011/2012. These revenues seem to be inflated, as railway undertakings expect a traffic
decrease in 2012 (forecast also in their restructuring plans), while the actual level of TACs paid by HŽ Cargo and HŽ
Passenger Transport historically was below the price charged by HŽ Infrastructure and in fine diminished in October 2012.
46
c) HŽ Traction: The traction company has been dissolved, and its assets and
liabilities divided between HŽ Cargo and HŽ Passenger Transport. However, this
split has not been even: the cargo company took on the majority of HŽ Traction’s
liabilities, while receiving only half of the rolling stock and employees. HŽ Cargo
and HŽ Passenger Transport have these changes reflected in their Restructuring
Plans, and all calculations and projections for the period of 2012-2016 have been
made taking into account the agreed upon split of traction.
d) HŽ Cargo: By 2016, HŽ Cargo aims at increasing tariffs by an average of 2.2%
annually, decreasing operating costs by an average of 3.6% annually, and signing
5-year business contracts with their clients. The opening of the Croatian railway
market to other operators will curtail the market power of HŽ Cargo such that the
company can expect about 9% lower revenues in 2016 as compared to 2012. Over
this period, the company plans to invest around HRK 2.9 billion—mainly in
rolling stock—which is foreseen to directly reduce costs by HRK 113 million. An
additional HRK 176.5 million of savings are expected through a staff cutting of
54% over the period of 2012-2016. Funds for retrenchment of approximately
HRK 289 million are still to be secured. If the required investments and staff cuts
take place, HŽ Cargo expects to reduce its costs by 14.3% and break-even by end
2016. In the absence of such measures, both revenues and costs are likely to
decrease substantially, and the company would thus be accumulating losses
throughout the restructuring period—finishing 2016 with a net loss of HRK 35.5
million. Given the current state of the economy, the financial position of the cargo
company, and an unfavorable market—plus the need for large investments for
modernizing the company, the Restructuring Plan also mentions the possibility of
privatizing HŽ Cargo prior to Croatia’s EU accession.
e) HŽ Passenger Transport: The passenger company set relatively ambitious
targets to be achieved through the restructuring process during a 5-year period.
These entail an increase in the number of transported passengers by 22%, revenue
growth of 23.3%, and a decrease of State subsidies to below 45% of total revenue,
along with development of long-term PSC contracts. The program also contains a
plan for a series of investment activities—in rolling stock, real-estate assets,
logistics centers—and an upgrade of sales channels. Therefore, the overall
investment need is estimated at around HRK 4 billion, to be secured solely
through the State budget. The 24% staff cut between 2012 and 2016 should be
covered by State funds as well. The Restructuring Plan provides three financial
scenarios, which test various access charge levels over the medium-term. The
most realistic, version II of the proposed financial plans—which assumes TAC
levels as defined by HŽ Infrastructure and an active investment strategy—
produces a net loss that gradually decreases to HRK 120 million in 2016.
f) Subsidiary companies: The Restructuring Plan also gave an assessment of the
portfolio of HŽ Holding subsidiaries. Each subsidiary has been reviewed and
proposed for (partial) privatization, liquidation or absorption. The subsidiaries
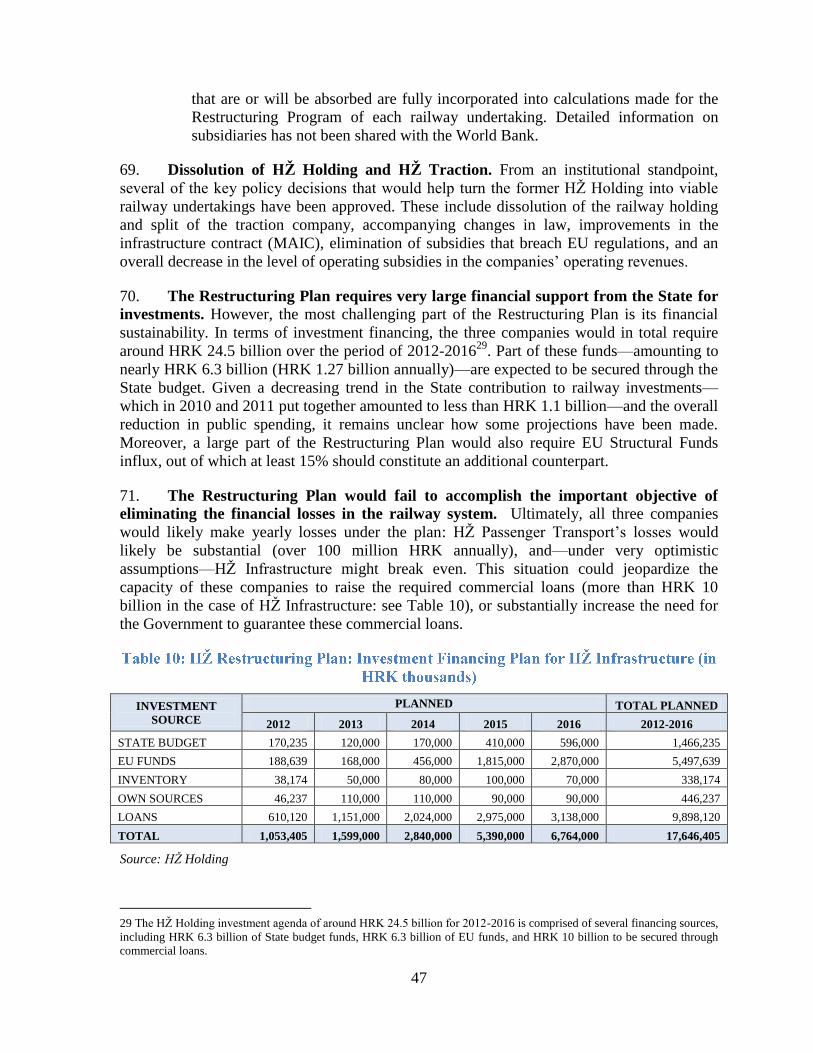
47
that are or will be absorbed are fully incorporated into calculations made for the
Restructuring Program of each railway undertaking. Detailed information on
subsidiaries has not been shared with the World Bank.
69. Dissolution of HŽ Holding and HŽ Traction. From an institutional standpoint,
several of the key policy decisions that would help turn the former HŽ Holding into viable
railway undertakings have been approved. These include dissolution of the railway holding
and split of the traction company, accompanying changes in law, improvements in the
infrastructure contract (MAIC), elimination of subsidies that breach EU regulations, and an
overall decrease in the level of operating subsidies in the companies’ operating revenues.
70. The Restructuring Plan requires very large financial support from the State for
investments. However, the most challenging part of the Restructuring Plan is its financial
sustainability. In terms of investment financing, the three companies would in total require
around HRK 24.5 billion over the period of 2012-201629
. Part of these funds—amounting to
nearly HRK 6.3 billion (HRK 1.27 billion annually)—are expected to be secured through the
State budget. Given a decreasing trend in the State contribution to railway investments—
which in 2010 and 2011 put together amounted to less than HRK 1.1 billion—and the overall
reduction in public spending, it remains unclear how some projections have been made.
Moreover, a large part of the Restructuring Plan would also require EU Structural Funds
influx, out of which at least 15% should constitute an additional counterpart.
71. The Restructuring Plan would fail to accomplish the important objective of
eliminating the financial losses in the railway system. Ultimately, all three companies
would likely make yearly losses under the plan: HŽ Passenger Transport’s losses would
likely be substantial (over 100 million HRK annually), and—under very optimistic
assumptions—HŽ Infrastructure might break even. This situation could jeopardize the
capacity of these companies to raise the required commercial loans (more than HRK 10
billion in the case of HŽ Infrastructure: see Table 10), or substantially increase the need for
the Government to guarantee these commercial loans.
INVESTMENT
SOURCE
PLANNED TOTAL PLANNED
2012 2013 2014 2015 2016 2012-2016
STATE BUDGET 170,235 120,000 170,000 410,000 596,000 1,466,235
EU FUNDS 188,639 168,000 456,000 1,815,000 2,870,000 5,497,639
INVENTORY 38,174 50,000 80,000 100,000 70,000 338,174
OWN SOURCES 46,237 110,000 110,000 90,000 90,000 446,237
LOANS 610,120 1,151,000 2,024,000 2,975,000 3,138,000 9,898,120
TOTAL 1,053,405 1,599,000 2,840,000 5,390,000 6,764,000 17,646,405
Source: HŽ Holding
29 The HŽ Holding investment agenda of around HRK 24.5 billion for 2012-2016 is comprised of several financing sources,
including HRK 6.3 billion of State budget funds, HRK 6.3 billion of EU funds, and HRK 10 billion to be secured through
commercial loans.
48
72. The financing of rolling stock for passenger traffic using public funds is a
sensitive issue, considering the EU rules. The EU regulations require railways to operate
without subsidies—they only allow the Government to finance the railway infrastructure and
PSC contracts (which can include both investment subsidies and operating subsidies).
Providing State money outside this framework is characterized as State aid, and needs to be
authorized by the EC. In addition to almost HRK 1.4 billion needed for PSC contracts from
2013-2016, HŽ Passenger Transport anticipates receiving HRK 3.6 billion from the State
budget for modernization and purchase of rolling stock. The passenger company will have to
ensure that these investments are clearly contributing to subsidized services and are not
providing benefits to services in competition, such as international passenger services.
73. The cost of severance payments for staff reduction is assumed to be paid by the
State, which will increase the financial burden for the Government. As a part of the
reform process, the staffs of the HŽ Companies should be reduced by more than 35% over
the next five years. This measure, which would lower operating expenses and increase
operational productivity, has been suggested by the Bank Team throughout the Note.
However, covering the cost of severance pay would require between HRK 520-760 million
of additional funds. HŽ Passenger Transport is the only HŽ Company that identifies its
source of funding (Government); the others imply that this expense should be covered by the
Government. The retrenchment cost—an average of HRK 105-150 million annually—would
be a significant burden on the State budget, on top of the above mentioned contributions to
investment.
74. Overoptimistic traffic forecasts for passengers have created unrealistic
expectations related to projected revenues. Some trends and forecasts in the Restructuring
Plan should also be reassessed. In particular, a 22% increase in the number of transported
passengers over the following four years remains optimistic—most European railways have
experienced little or no increase in passenger traffic in recent years. This assumption is also
not consistent with those of HŽ Infrastructure. The shift of passengers from other means of
transportation to railways would require a very strong incentive, such as a significant
improvement in the quality of services. This could be achieved through a combination of
rolling stock modernization and infrastructure investments, which would facilitate high
rolling stock utilization. However, given its reliance on EU funding, it still remains unclear
whether the proposed financing scheme allows for such investments to materialize by 2016—
and therefore, calls into question the accuracy of the traffic forecast.
75. Unrealistic revenue growth forecasts for HŽ Infrastructure reduce the reliability
of the Restructuring Plan, and hide additional increases in the State contribution to the
railway sector. Likewise, HRK 75-100 million of annual increases in HŽ Infrastructure’s
revenues through lease and sale of real estate assets might have been possible if preparatory
activities for this measure had started before the approval of the Restructuring Plan. Some
delays are expected because of bureaucratic procedures related to long-term leases (all real-
estate leases longer than five years need Government approval), and it will be challenging to
identify potential buyers and lessees for these assets in the current economic environment.
49
76. It is uncertain whether uncorrelated investment projects among the railway
companies will be financed by the EU funds. The Restructuring Plan identifies a number of
projects for overhaul, modernization and construction of railway infrastructure. Many of
these works have already started, but a number of projects are still in draft form, and will not
be proposed for EU financing until a later time. There is a high level of uncertainty about
whether these projects will be approved for financing through Structural Funds. Therefore, it
is difficult to assess the investment dynamics and corresponding financial needs of HŽ
Infrastructure (in many countries there is a more than a 2-year gap between the start of the
EU funding period and the investment start itself). Additional issues arise from the fact that
the Restructuring Plans of HŽ Cargo and HŽ Passenger Transport, and their accompanying
forecasts, are based on the assumption that all infrastructure investments will take place as
laid out in those forecasts. However, those forecasts do not correspond to the ones of HŽ
Infrastructure for the same time period.
77. Limited actions for operating cost cutting and Governmental subsidies are
proposed. Moreover, the cost cutting measures are probably not ambitious enough—
especially with regard to HŽ Infrastructure, because this company decreases staffing by only
slightly more than 20%, while it has one of the lowest EU productivities. There is also no
objective to decrease the network on the basis of economic interest, while network
concentration should normally improve productivity and reduce costs. Likewise, while some
initial measures to cut expensive and less travelled passenger services have been made, they
have proven to be very hard to implement and have not been sustained. To date, there is no
overall strategy to further strengthen the cost efficiency of PSC expenditures. Furthermore,
operating subsidies are not substantially reduced over the proposed period (less than HRK 40
million out of more than HRK 1 billion), while productivity gains should call for a transfer of
public resources from operations to investment.
78. Predictions of an increased State contribution for the railway sector do not
conform to the Government’s mandate for better public funds utilization in the railway
sector. The Restructuring Plan is unclear about whether loans taken by HŽ Infrastructure and
HŽ Passenger Transport will be subject to reimbursement subsidies from the State—which
has been common practice in the past, both for capital and interest. The following graph
attempts to simulate the Government’s resulting annual sector contribution under the Plan,
assuming the direct financing of HŽ Passenger Transport’s investments, and a contribution to
capital reimbursement under the loans taken by HŽ Infrastructure.
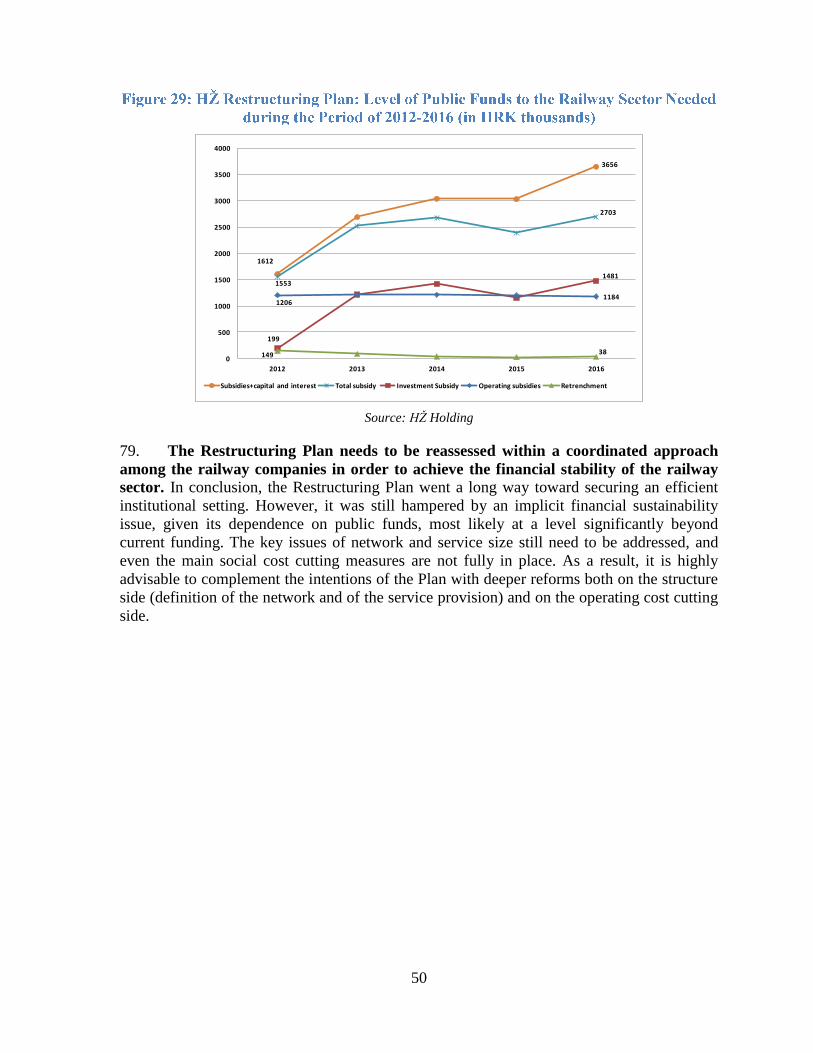
50
1612
3656
1553
2703
199
1481
12061184
149 380
500
1000
1500
2000
2500
3000
3500
4000
2012 2013 2014 2015 2016
Subsidies+capital and interest Total subsidy Investment Subsidy Operating subsidies Retrenchment
Source: HŽ Holding
79. The Restructuring Plan needs to be reassessed within a coordinated approach
among the railway companies in order to achieve the financial stability of the railway
sector. In conclusion, the Restructuring Plan went a long way toward securing an efficient
institutional setting. However, it was still hampered by an implicit financial sustainability
issue, given its dependence on public funds, most likely at a level significantly beyond
current funding. The key issues of network and service size still need to be addressed, and
even the main social cost cutting measures are not fully in place. As a result, it is highly
advisable to complement the intentions of the Plan with deeper reforms both on the structure
side (definition of the network and of the service provision) and on the operating cost cutting
side.
51
80. The ultimate goal of the Restructuring Plan should include achieving financial
sustainability of the railway system. All measures proposed in the Note are meant to create
an adequate environment for putting in place strong railway companies, capable of
competing successfully in the seamless European transport market. To achieve this goal, the
HŽ Companies must operate without financial losses—and they must be less dependent on
State financial support. The Bank Team has designed a financial model to verify various
scenarios by which to achieve the targeted financial performance. The model has been shared
with the HŽ Companies and the Government as a useful tool for the assessment of their
assumptions of cost cutting and operating performance improvement for various conditions
of traffic.
81. The financial model developed by the World Bank Team cannot be used to
verify the Restructuring Plan elaborated by HŽ Holding in June 2012. The Restructuring
Plan presents a set of isolated actions for each railway company without considering the
companies’ interdependencies and the impact that the actions of one of the companies may
have on the financial performance of the others. The precise sources of financing for some of
the proposed actions are also missing. Annex 2 of the Note provides, in a more detailed
manner, the inconsistencies in the Restructuring Plan that make the mathematical modeling
of the Plan impossible.
82. Scenarios to achieve financial sustainability of the railway system in Croatia. The
Bank Team simulated various solutions to achieve the financial sustainability of the system
in the shortest period of time. The Team attempted to find the best compromise between the
affordability of allocations of State support and the supportability of cost cutting actions, in
an uncertain environment of market forecast. The following paragraphs outline the main
results for two potential scenarios. The differences between them are presented in Table 11:
a. The Optimistic Scenario: Based on the findings presented in previous
sections, the improvement of the operational and financial performance of the
HŽ Companies is a medium-term target, requiring complex actions to cut
operating costs. The Team developed a scenario, hereinafter referred to as ‘the
Optimistic Scenario’ or ‘the Recommended Scenario’, which presents the way
to achieve this financial sustainability goal for all holding companies by 2016
at the latest. The targets suggested in the Recommended Scenario most likely
represent minimum cost reduction targets needed for this achievement30
, and
have been refined after discussions with the Government. They are organized
around three sets of actions: (i) downsizing operating expenses and focusing
on network and staff; (ii) introducing sustainable pricing levels for operators
30 The proposed cost cutting scenarios have been defined through a financial model of the World Bank, used to verify their
impact on the financial performance of each railway company until 2016.
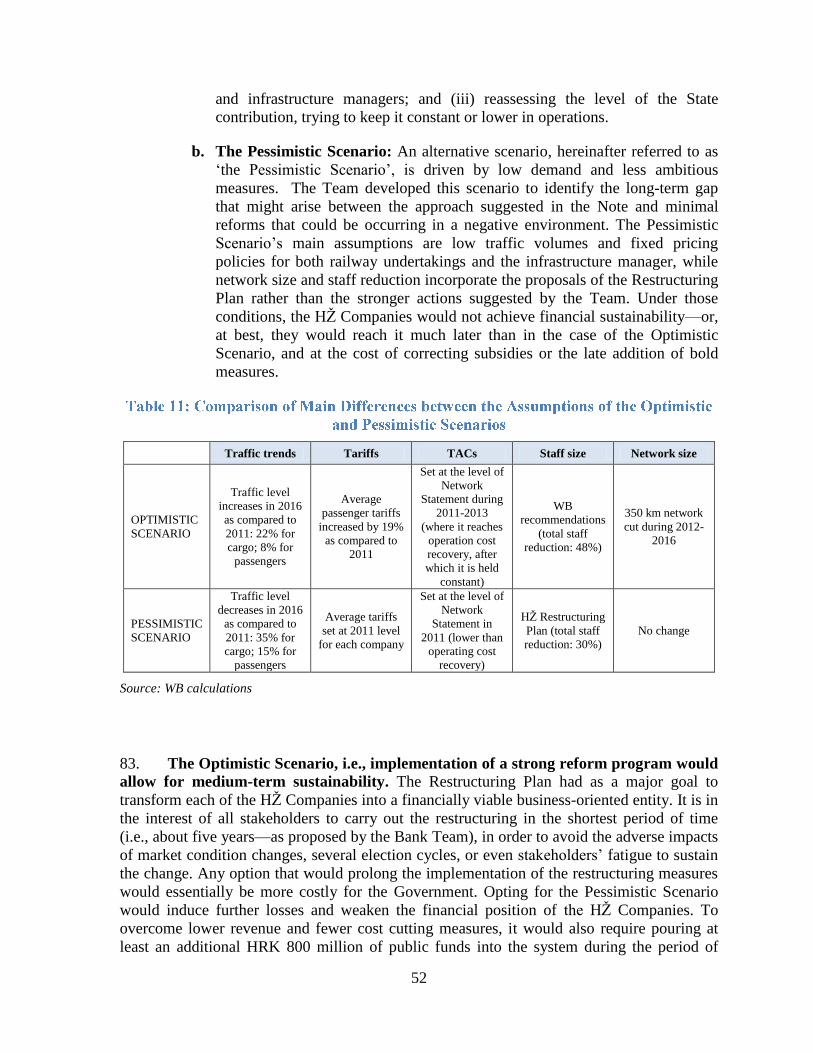
52
and infrastructure managers; and (iii) reassessing the level of the State
contribution, trying to keep it constant or lower in operations.
b. The Pessimistic Scenario: An alternative scenario, hereinafter referred to as
‘the Pessimistic Scenario’, is driven by low demand and less ambitious
measures. The Team developed this scenario to identify the long-term gap
that might arise between the approach suggested in the Note and minimal
reforms that could be occurring in a negative environment. The Pessimistic
Scenario’s main assumptions are low traffic volumes and fixed pricing
policies for both railway undertakings and the infrastructure manager, while
network size and staff reduction incorporate the proposals of the Restructuring
Plan rather than the stronger actions suggested by the Team. Under those
conditions, the HŽ Companies would not achieve financial sustainability—or,
at best, they would reach it much later than in the case of the Optimistic
Scenario, and at the cost of correcting subsidies or the late addition of bold
measures.
Traffic trends Tariffs TACs Staff size Network size
OPTIMISTIC
SCENARIO
Traffic level
increases in 2016
as compared to
2011: 22% for
cargo; 8% for
passengers
Average
passenger tariffs
increased by 19%
as compared to
2011
Set at the level of
Network
Statement during
2011-2013
(where it reaches
operation cost
recovery, after
which it is held
constant)
WB
recommendations
(total staff
reduction: 48%)
350 km network
cut during 2012-
2016
PESSIMISTIC
SCENARIO
Traffic level
decreases in 2016
as compared to
2011: 35% for
cargo; 15% for
passengers
Average tariffs
set at 2011 level
for each company
Set at the level of
Network
Statement in
2011 (lower than
operating cost
recovery)
HŽ Restructuring
Plan (total staff
reduction: 30%)
No change
Source: WB calculations
83. The Optimistic Scenario, i.e., implementation of a strong reform program would
allow for medium-term sustainability. The Restructuring Plan had as a major goal to
transform each of the HŽ Companies into a financially viable business-oriented entity. It is in
the interest of all stakeholders to carry out the restructuring in the shortest period of time
(i.e., about five years—as proposed by the Bank Team), in order to avoid the adverse impacts
of market condition changes, several election cycles, or even stakeholders’ fatigue to sustain
the change. Any option that would prolong the implementation of the restructuring measures
would essentially be more costly for the Government. Opting for the Pessimistic Scenario
would induce further losses and weaken the financial position of the HŽ Companies. To
overcome lower revenue and fewer cost cutting measures, it would also require pouring at
least an additional HRK 800 million of public funds into the system during the period of
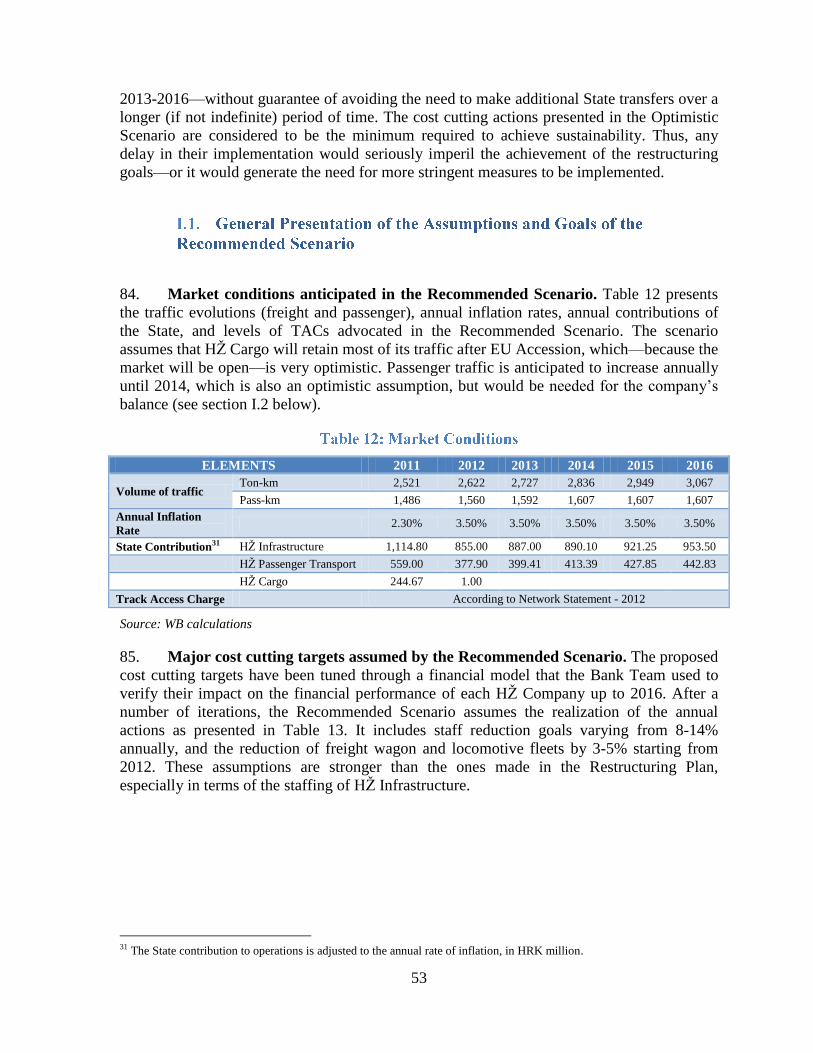
53
2013-2016—without guarantee of avoiding the need to make additional State transfers over a
longer (if not indefinite) period of time. The cost cutting actions presented in the Optimistic
Scenario are considered to be the minimum required to achieve sustainability. Thus, any
delay in their implementation would seriously imperil the achievement of the restructuring
goals—or it would generate the need for more stringent measures to be implemented.
84. Market conditions anticipated in the Recommended Scenario. Table 12 presents
the traffic evolutions (freight and passenger), annual inflation rates, annual contributions of
the State, and levels of TACs advocated in the Recommended Scenario. The scenario
assumes that HŽ Cargo will retain most of its traffic after EU Accession, which—because the
market will be open—is very optimistic. Passenger traffic is anticipated to increase annually
until 2014, which is also an optimistic assumption, but would be needed for the company’s
balance (see section I.2 below).
ELEMENTS 2011 2012 2013 2014 2015 2016
Volume of traffic Ton-km 2,521 2,622 2,727 2,836 2,949 3,067
Pass-km 1,486 1,560 1,592 1,607 1,607 1,607
Annual Inflation
Rate 2.30% 3.50% 3.50% 3.50% 3.50% 3.50%
State Contribution31 HŽ Infrastructure 1,114.80 855.00 887.00 890.10 921.25 953.50
HŽ Passenger Transport 559.00 377.90 399.41 413.39 427.85 442.83
HŽ Cargo 244.67 1.00
Track Access Charge According to Network Statement - 2012
Source: WB calculations
85. Major cost cutting targets assumed by the Recommended Scenario. The proposed
cost cutting targets have been tuned through a financial model that the Bank Team used to
verify their impact on the financial performance of each HŽ Company up to 2016. After a
number of iterations, the Recommended Scenario assumes the realization of the annual
actions as presented in Table 13. It includes staff reduction goals varying from 8-14%
annually, and the reduction of freight wagon and locomotive fleets by 3-5% starting from
2012. These assumptions are stronger than the ones made in the Restructuring Plan,
especially in terms of the staffing of HŽ Infrastructure.
31 The State contribution to operations is adjusted to the annual rate of inflation, in HRK million.
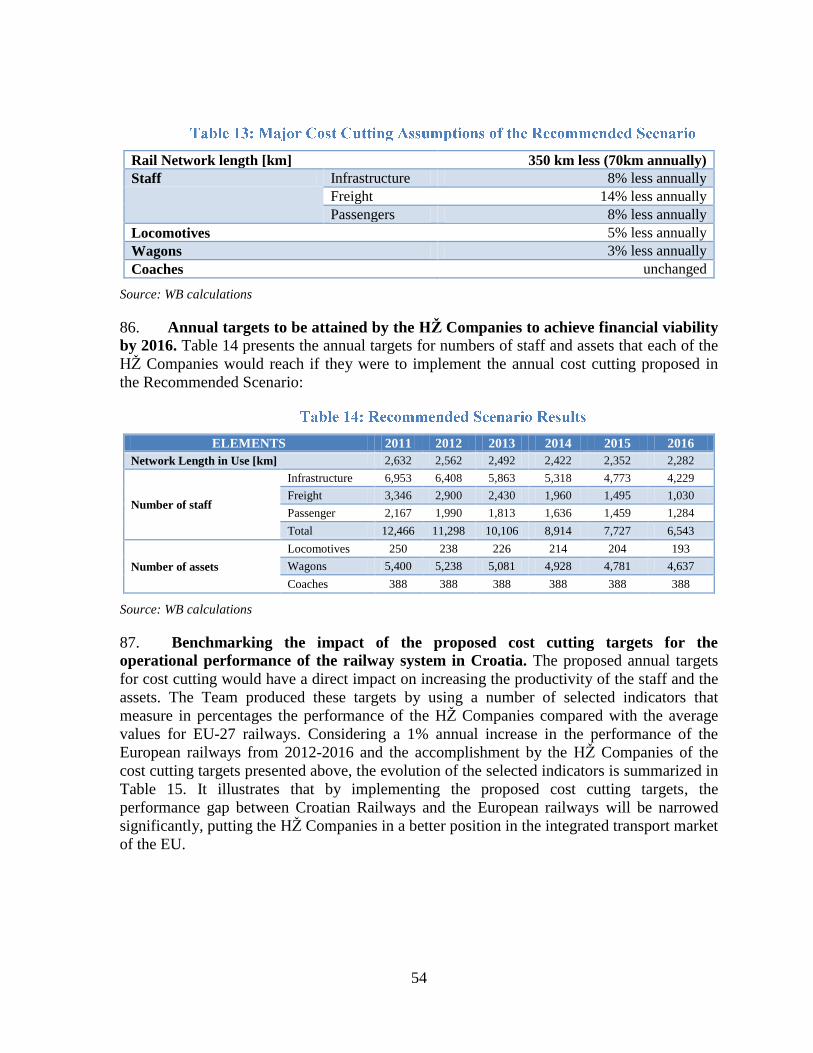
54
Rail Network length [km] 350 km less (70km annually)
Staff Infrastructure 8% less annually
Freight 14% less annually
Passengers 8% less annually
Locomotives 5% less annually
Wagons 3% less annually
Coaches unchanged
Source: WB calculations
86. Annual targets to be attained by the HŽ Companies to achieve financial viability
by 2016. Table 14 presents the annual targets for numbers of staff and assets that each of the
HŽ Companies would reach if they were to implement the annual cost cutting proposed in
the Recommended Scenario:
ELEMENTS 2011 2012 2013 2014 2015 2016
Network Length in Use [km] 2,632 2,562 2,492 2,422 2,352 2,282
Number of staff
Infrastructure 6,953 6,408 5,863 5,318 4,773 4,229
Freight 3,346 2,900 2,430 1,960 1,495 1,030
Passenger 2,167 1,990 1,813 1,636 1,459 1,284
Total 12,466 11,298 10,106 8,914 7,727 6,543
Number of assets
Locomotives 250 238 226 214 204 193
Wagons 5,400 5,238 5,081 4,928 4,781 4,637
Coaches 388 388 388 388 388 388
Source: WB calculations
87. Benchmarking the impact of the proposed cost cutting targets for the
operational performance of the railway system in Croatia. The proposed annual targets
for cost cutting would have a direct impact on increasing the productivity of the staff and the
assets. The Team produced these targets by using a number of selected indicators that
measure in percentages the performance of the HŽ Companies compared with the average
values for EU-27 railways. Considering a 1% annual increase in the performance of the
European railways from 2012-2016 and the accomplishment by the HŽ Companies of the
cost cutting targets presented above, the evolution of the selected indicators is summarized in
Table 15. It illustrates that by implementing the proposed cost cutting targets, the
performance gap between Croatian Railways and the European railways will be narrowed
significantly, putting the HŽ Companies in a better position in the integrated transport market
of the EU.
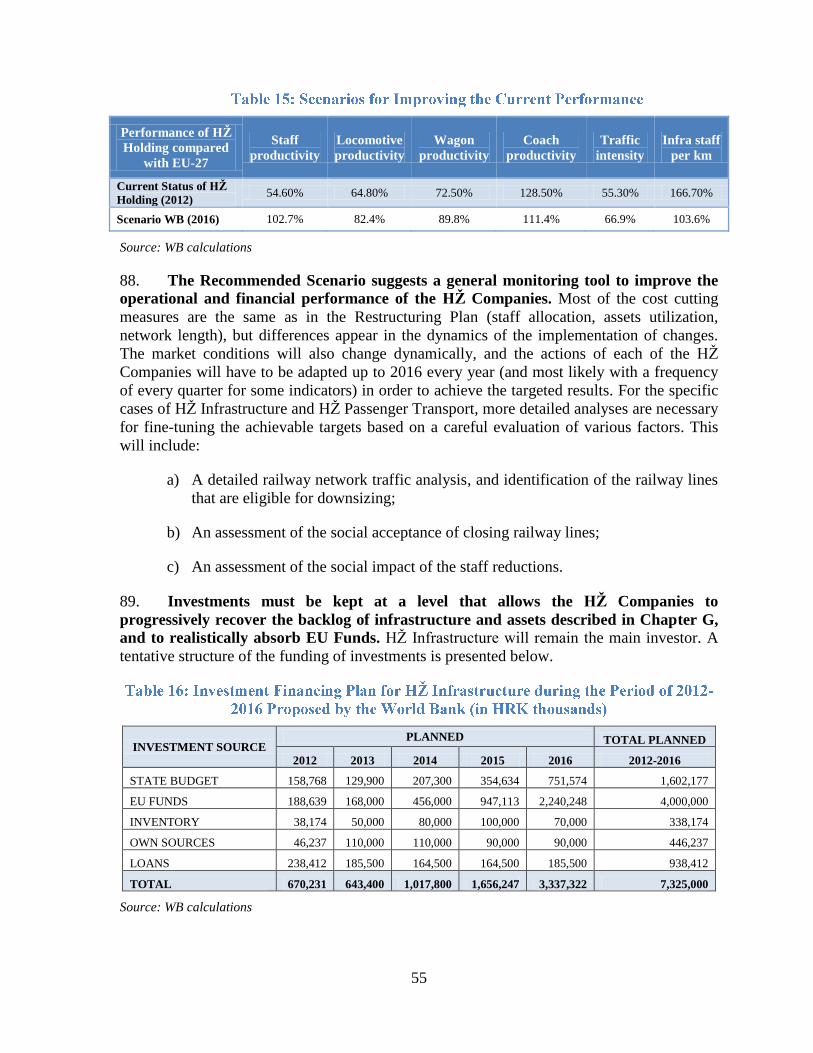
55
Performance of HŽ
Holding compared
with EU-27
Staff
productivity
Locomotive
productivity
Wagon
productivity
Coach
productivity
Traffic
intensity
Infra staff
per km
Current Status of HŽ
Holding (2012) 54.60% 64.80% 72.50% 128.50% 55.30% 166.70%
Scenario WB (2016) 102.7% 82.4% 89.8% 111.4% 66.9% 103.6%
Source: WB calculations
88. The Recommended Scenario suggests a general monitoring tool to improve the
operational and financial performance of the HŽ Companies. Most of the cost cutting
measures are the same as in the Restructuring Plan (staff allocation, assets utilization,
network length), but differences appear in the dynamics of the implementation of changes.
The market conditions will also change dynamically, and the actions of each of the HŽ
Companies will have to be adapted up to 2016 every year (and most likely with a frequency
of every quarter for some indicators) in order to achieve the targeted results. For the specific
cases of HŽ Infrastructure and HŽ Passenger Transport, more detailed analyses are necessary
for fine-tuning the achievable targets based on a careful evaluation of various factors. This
will include:
a) A detailed railway network traffic analysis, and identification of the railway lines
that are eligible for downsizing;
b) An assessment of the social acceptance of closing railway lines;
c) An assessment of the social impact of the staff reductions.
89. Investments must be kept at a level that allows the HŽ Companies to
progressively recover the backlog of infrastructure and assets described in Chapter G,
and to realistically absorb EU Funds. HŽ Infrastructure will remain the main investor. A
tentative structure of the funding of investments is presented below.
INVESTMENT SOURCE PLANNED TOTAL PLANNED
2012 2013 2014 2015 2016 2012-2016
STATE BUDGET 158,768 129,900 207,300 354,634 751,574 1,602,177
EU FUNDS 188,639 168,000 456,000 947,113 2,240,248 4,000,000
INVENTORY 38,174 50,000 80,000 100,000 70,000 338,174
OWN SOURCES 46,237 110,000 110,000 90,000 90,000 446,237
LOANS 238,412 185,500 164,500 164,500 185,500 938,412
TOTAL 670,231 643,400 1,017,800 1,656,247 3,337,322 7,325,000
Source: WB calculations
56
90. Variations from the above proposed scenario were simulated by using the World
Bank financial model included in the railway toolkit32
, but not the Government
Restructuring Plan per se. This allowed for a change in targets, and measured the impact
on the results of each of the HŽ Companies. The Bank Team took into account many of the
Restructuring Plan features in its own scenario, but was unable to simulate the Restructuring
Plan as a separate scenario due to a lack of essential information needed to create a financial
model and some data inconsistencies discovered in the Restructuring Plan—particularly in
the traffic projections and the TAC levels applied by each company. Additional information
regarding the reasons why it was not possible to present the impact of the Restructuring Plan
is presented in Annex 2.
32 http://www.ppiaf.org/ppiaf/sites/ppiaf.org/files/documents/toolkits/railways_toolkit/ch2_4.html.
57
91. The financial model for the Optimistic Scenario was developed for the period of
2011-2040. This means that the model verifies the capacity of the HŽ Companies to achieve
a balanced financial status by 2016 (see I.1 above) and to preserve the achieved efficiency
over the entire forecasted period. The model indirectly took into account the effect of cutting
350 km of network. However, these effects may be underestimated, because it is difficult to
reflect the impact of network reduction beyond staff and operating cost reduction for the
infrastructure manager, and operating cost reduction for the passenger company (which
would no longer operate some services on heavily subsidized sections). A detailed
description of the modeling results, together with a complete overview of assumptions and
targets, is outlined in Annex 3. The main differences between the Recommended Scenario
and the Restructuring Plan are that the former projects: (i) higher levels of staff reduction—
especially in HŽ Infrastructure; and (ii) higher levels of traffic for HŽ Cargo. The model
interpretation for the Recommended Scenario has taken into account a cash flow analysis to
determine the financial position of each HŽ Company.
92. Upon implementation of the Optimistic Scenario, the HŽ Companies are expected to
achieve significant improvements, as follows:
93. HŽ Infrastructure: Upon dissolution of the railway holding, the company will start
to apply a higher level of TACs—the share of operating revenue of the latter will more than
double by the end of the restructuring. Together with HRK 860 million of operating
subsidies, this should result in HRK 1,475 million in operating revenues in 2016—
representing a 7% increase as compared to 2011. Operating expenses are contracted mainly
due to staff rationalization. With HRK 112 million in net income, HŽ Infrastructure
would become profitable in 2015. Because profitability improves over the entire forecasted
period, it is strongly suggested that the Government reassess the TAC levels or the level of
subsidies to the infrastructure manager after 2016, depending on the market conditions.
However, if the Government chooses to have a low level of TACs for 2013—as proposed in
the corrected version of the Network Statement for the year—the situation may play out very
differently, because TACs are the main revenue increase driver under the Optimistic
Scenario. HŽ Infrastructure as administrator of public transport infrastructure does not have a
profit-generating role; achieving a break-even status should be the goal, and this would create
room for adjusting the TACs or State subsidies. Strengthened cash flow allows for capital
expenditure financing starting in 2014. Outstanding loan obligations are forecast to be
covered from HŽ Infrastructure’s own sources starting in 2016—a year in which the
company would also be fully self-sustainable. However, new potential loans for investment
in railway infrastructure should be mainly reimbursed from State contributions because: (i)
HŽ Infrastructure’s assets themselves are not in the books of the company; and (ii) road
transport’s assets are de facto fully-funded by the State, and this would therefore create a fair
competition between HŽ Infrastructure and road transport.
58
94. HŽ Cargo: As a consequence of significant cost cutting measures—namely,
substantial staff downsizing—and increasing freight traffic revenue (which in reality implies
a very aggressive commercial policy), the company is forecast to turn profitable in 2015
with a net income of HRK 25 million. For compliance with EU regulations, subsidies will
be abolished starting in 2012, and it will take six years for the company to recover the loss of
this revenue. As of 2016, HŽ Cargo’s free cash flow would enable it to finance its capital
expenditure program and settle its debt obligations, which would turn it into a fully self-
sustainable company. If the Government does not succeed in a quick privatization of HŽ
Cargo as-is—before entry in the EU—the Government may consider a cash injection or debt
write-off or guaranteed loans to help bridge the financial gap in the first years of
restructuring, and ease privatization—because traffic targets are unlikely to be achieved
without a very strong partnership with an already strong operator in the EU market. These
potential steps would also need to be assessed against EU commitments in terms of
compliance with the Competition Policy.
95. HŽ Passenger Transport: This is the most exposed HŽ Company, and the
conditions to achieve financial sustainability would be highly questionable with a level of
State contribution similar to that of 2012. Despite a significant reduction of staff (about 41%
by 2016), due to the important increase in TACs (in 2012 and 2013), the company will face
serious challenges. According to the simulated Recommended Scenario, the market
evolution of HŽ Passenger Transport should turn it into a break-even company by end-
2016—when it is estimated to realize HRK 1 million in net income—and strengthen this
positive trend into the future. Because the operating cost cutting was not sufficient to
balance the financial status of the company, the financial forecast assumes a gradual increase
in passenger fares from 2013-2016, with a rhythm of 5-6% every year. In total, in 2015 the
tariffs for passengers will be about 25% higher compared with 2012; this will have a negative
impact on traffic, which will cease to increase (a decrease in traffic is still possible, and the
scenario must be adapted annually based on the market response). The State contribution in
the final year of restructuring is forecast at HRK 385.9 million in real terms. It will be
slightly higher than the HRK 359 million State contribution in 2012, but the total
contribution of the State for the railway transport passengers will not be increased.
96. Financing method of investments for HŽ Passenger Transport. Currently, the
State pays twice for the capital costs, because depreciation is included in the operating costs
compensated by the State, and the latter additionally provides funds for investments. The
financial model eliminated this anomaly. With the Recommended Scenario, the company
only receives an operating subsidy, which includes a contribution to depreciation. Savings
made through a cut of capital subsidies then allows for a slight increase in the annual
operating subsidy. From 2016 on, the company will have an adequate amount of free cash to
independently contribute to its capital investments in rolling stock. However, full financial
viability would be achieved only as of 2018, because HŽ Passenger Transport does not have
enough cash to repay its loan obligations before that date. An earlier attainment of financial
viability could be facilitated by a temporary increase in the State subsidy, or a restructuring
of the two bullet loans to be repaid in 2016 and 2017—given the specific economic
circumstances. The weak point of this rationale is the unpredictable feedback of the market to
the tariff increase policy. It would require good communication with the clients, explaining
the goals of achieving better quality services over the next 3-5 years. It would also require
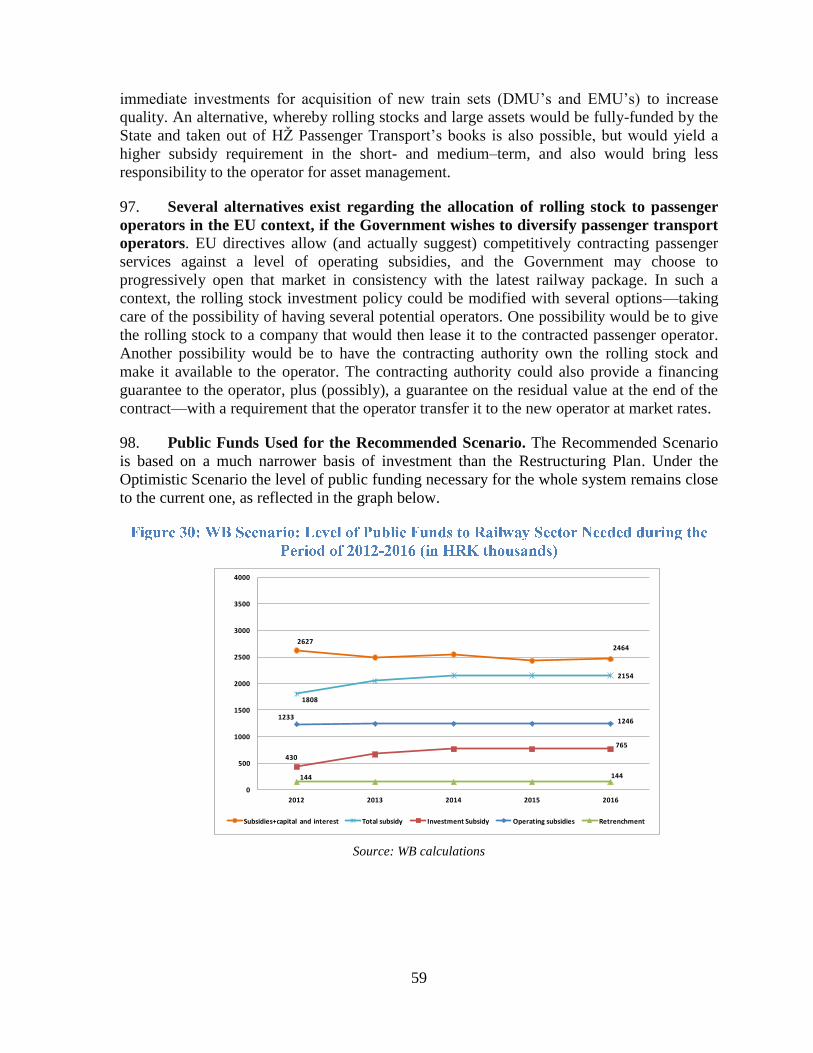
59
immediate investments for acquisition of new train sets (DMU’s and EMU’s) to increase
quality. An alternative, whereby rolling stocks and large assets would be fully-funded by the
State and taken out of HŽ Passenger Transport’s books is also possible, but would yield a
higher subsidy requirement in the short- and medium–term, and also would bring less
responsibility to the operator for asset management.
97. Several alternatives exist regarding the allocation of rolling stock to passenger
operators in the EU context, if the Government wishes to diversify passenger transport
operators. EU directives allow (and actually suggest) competitively contracting passenger
services against a level of operating subsidies, and the Government may choose to
progressively open that market in consistency with the latest railway package. In such a
context, the rolling stock investment policy could be modified with several options—taking
care of the possibility of having several potential operators. One possibility would be to give
the rolling stock to a company that would then lease it to the contracted passenger operator.
Another possibility would be to have the contracting authority own the rolling stock and
make it available to the operator. The contracting authority could also provide a financing
guarantee to the operator, plus (possibly), a guarantee on the residual value at the end of the
contract—with a requirement that the operator transfer it to the new operator at market rates.
98. Public Funds Used for the Recommended Scenario. The Recommended Scenario
is based on a much narrower basis of investment than the Restructuring Plan. Under the
Optimistic Scenario the level of public funding necessary for the whole system remains close
to the current one, as reflected in the graph below.
26272464
1808
2154
430
765
12331246
144 144
0
500
1000
1500
2000
2500
3000
3500
4000
2012 2013 2014 2015 2016
Subsidies+capital and interest Total subsidy Investment Subsidy Operating subsidies Retrenchment
Source: WB calculations
60
99. Results of the Pessimistic Scenario. The Pessimistic Scenario was developed to
evaluate the cost of essentially not reforming the railway sector, based on the hypothesis that
the minimal reform program is only partially implemented. It also served to illustrate the gap
that would eventually open up in comparison with the Optimistic Scenario. The majority of
assumptions in the two scenarios were the same. However, the Pessimistic Scenario differed
in making negative pricing and traffic level forecasts, while the level of operating expenses—
notably staff and network size—resembled the figures of the Restructuring Plan and would
not be reduced as much as in the Optimistic Scenario at the beginning of the implementation
period. Under the Pessimistic Scenario, all of the HŽ Companies are forecast to operate
with a net loss in 2016. Considering the state of their cash flows, this would mean that the
companies would either go bankrupt by that time, or require higher subsidies to survive.
Provided that their liquidity problems had been solved, financial sustainability would be
achieved four years later, or in some cases not achieved at all, which de facto implies that
the Government would have to find a bridging solution up to 2018/2020 in terms of added
funding and guarantees.
100. Considering that the system could not survive under these conditions, the Bank Team
tested corrective measures to the Pessimistic Scenario to overcome the traffic and pricing
challenges and to allow sustainability by 2016. In practice, HŽ Cargo could become
financially viable by 2016, if it simultaneously decreased costs of staff and external services
by an additional 71% and 8%, respectively, from 2012-2016. HŽ Passenger Transport is the
most affected of all the HŽ Companies by the pessimistic assumptions. The company is
projected to turn profitable by 2015 if it opts for a combination of an annual increase in
operating subsidies by HRK 40 million in real terms (during the last four years of
restructuring), and makes a further 16% cost reduction of staff and constant external services
in 2016 compared to 2011. HŽ Infrastructure is projected to become profitable and fully self-
sustainable in 2016 if it takes steps similar to those suggested for HŽ Passenger Transport (an
HRK 50 million additional increase in operating subsidies, and a 23% further staff and
constant external services cost cut).
101. It is crucial to note that the Pessimistic Scenario only reinforces the
recommendations outlined in the Optimistic Scenario. A significant additional cost
cutting (10-15% in staff and up to 20% in external services) and network and service
resizing, together with around 5-20% higher subsidies than in the Optimistic Scenario (the
amount varies depending on the company and policy actions introduced in parallel), would
be needed under the Pessimistic Scenario to place the HŽ Companies on a viable path that
could be maintained over the long-term. If the Government tried to keep subsidies constant,
the cost cutting measures would need to be much stronger than presented here. If the
economic context only affected traffic and the Government implemented the actions
proposed in the Recommended Scenario, sustainability would require only a few additional
subsidies or cost cutting measures. A detailed description of the Pessimistic Scenario and
additional recommendations are presented in Annex 3.
61
102. As a part of a policy to move toward market-oriented and business-oriented railways,
both the Government of Croatia and the HŽ Companies need to embrace and implement a
new business model—with specific strategies to improve railway governance. The twofold
approach should tackle the issue of sector as well as corporate governance, providing new
solutions to improve organization, transparency, accountability, management and
productivity of all railway stakeholders. Several principles of good governance are already
being applied under the current system, and have been reinforced by the June 2012
Restructuring Plan (such as the separation between all entities, smaller boards, and
performance-based contracts for managers). However, the implementation of these elements
usually takes time, because the rail system has functioned historically within an integrated
and often closed environment. Therefore, this chapter should serve as a reminder of the larger
change objectives of the Restructuring Plan. It is particularly critical that future board and
managerial appointments in the HŽ Companies be made in consistency with these principles.
103. Multiple roles of the Government enable it to shape the railway sector environment,
which in turn endows it with a responsibility to protect the public interest. To be able to
effectively perform its manifold functions, this cultural change should encompass the
following areas:
a) Separation of roles of the State and the railway companies. This concept must
be clearly implemented on two layers: (i) separation of the roles of the State as the
policymaker, regulator, owner and a client of railway, and the railway companies
as the service providers—by putting in place clear and transparent relationships
between the two entities, and (ii) separation of State ownership functions from
regulatory functions in the railway sector within the Government. The main role
of the Government as policymaker should be to set up an overall policy and
framework through a sustainable multi-modal transport strategy—which urgently
needs to be elaborated in Croatia to reflect its vision for the coming years (inter
alia to obtain EU Cohesion Funds in support of the sector). As regulator, the
Government needs to protect the public interest, but also ensure that the interests
of potential private competitors entering the market are taken into account. The
subsidies for various railway activities must be allocated in a transparent way,
without discriminating against private railway operators. The State-owned and the
private railway companies should have equal access to finance, based on purely
33
Many of the recommendations of the present Chapter have already been defined in principle by the newly implemented
legal framework for Croatia or in the June 2012 Restructuring Plan. Because many of the aspects presented in the present
chapter are highly sensitive and it is not easy to simulate their implementation, the main reason to include them in the Note
is to emphasize the necessity to continuously ensure that the parties concerned are adhering to these principles.
62
commercial grounds, and must be treated equally by the law when creditors
decide to press their claims and to initiate insolvency procedures.
b) Adequate staffing and organization at the Governmental level. The divisional
organizational structure of the Ministry of Maritime Affairs, Transport and
Infrastructure (MMATI) duplicates some functions, requiring more personnel, and
thus increasing costs. At the same time, due to budget constraints, the
administrative apparatus seems to be understaffed. Creating multi-modal units
with functional separation of policy, administration of State-owned companies,
and regulation would bring more flexibility to a rather complex system, decrease
costs, and develop broader skills. Lack of human capacity could emerge as a
potential threat in the forthcoming EU Accession, because it would generate an
increase in workload, especially in the areas of: (i) defining comprehensive
transport policies for all modes of transport, (ii) utilizing EU funds, which would
be significantly high for the railway sector; and (iii) contracting of services by the
State. The MMATI should continue to allocate adequate qualified human
resources to fulfill its functions as per the EU framework for railways, including
the licensing of new operators. Coordination should be established with the
Ministry of Finance (MOF) and the Ministry of Regional Development and EU
Funds (MRDEUF) for all policies and actions related to the railway sector and
indicated in the Action Plan.
c) Establish clear and transparent policies for the State-owned railway
companies. The State as an owner of State-owned railway companies (both
infrastructure and operators), should decide what it requires from the companies,
and how they should be administered. In this context, the State must establish a
clear and consistent ownership policy, define objectives for the medium- and
long-term for the companies, and provide predictability regarding its long-term
commitments (e.g., its contributions to infrastructure funding and requests for
passenger services). The public consultation process is a good practice for
developing these objectives. The ownership policy and associated objectives
should be public documents accessible to the general public, and widely
circulated amongst the relevant ministries, agencies, railway boards, management,
and the parliament. As a matter of principle, the role of the State as an owner
should be separated from its role as a buyer of services in the organization of the
ministry.
d) Exercise the ownership power without interfering in the management of the
railway companies. The State should oversee the activities of the companies and
exercise its ownership power by acting as an informed and active owner. It should
avoid interfering in daily operational matters, allowing the railway full
operational autonomy to achieve the defined objectives. The boards should
exercise their responsibilities as independent entities. The exercising of ownership
rights while avoiding meddling in the management should be achieved through
the Supervisory Board—as a shareholder’s representative it is entitled to obtain
information on the companies on a regular basis. Supervisory Boards should have
63
committees that deal with aspects such as audits, compliance, risk, transparency,
human resources, for better oversight of different aspects within the companies.
e) The accountability of the managers of the HŽ Companies to the Government
as owner. The independence of the management of the HŽ Companies does not
mean a lack of responsibility for the Government regarding the achievement of
the owner’s policy and objectives in the railway sector. In this respect, the
Supervisory Board—as representative of the State as owner—has the role of
monitoring the activities of management.
f) Clear rules and transparent selection of Railway Board members. The State
should appoint skilled, experienced, committed and independent individuals to its
Supervisory Boards. The members of the Supervisory Board do not need to have
detailed knowledge of railway operations. They should be skilled professionals
with legal, financial, economic and management expertise, experienced in
carrying out fiduciary responsibilities. Eligibility criteria for the appointment of
Supervisory Board members should be transparent—and integrity is a
fundamental requirement in choosing members. It is advisable for the Supervisory
Board to develop guidelines or codes of ethics for both its own members and for
those appointed as members of related boards—including State officials selected
to serve on the Board of Directors. Any potential conflicts of interest for the
members of the boards should be carefully evaluated. For example, members
should disclose any personal ownership they have in the railway or in suppliers or
customers of the railway, and follow the relevant trading regulations. It is
essential that the members of the Railway Board do not act as a channel for
unjustified political influence. Likewise, appointments of management board
members or of chief executives of companies should follow a competitive process
managed by the Supervisory Board with transparent eligibility and selection
criteria.
104. Aligning the governance structure with the best business practices, such as those
outlined in the OECD Guidelines on Corporate Governance of State-owned Enterprises34
,
requires embarking on reforms and embracing good principles that already exist but are not
duly followed. This could be achieved by engaging in the following activities:
a) Contractual relationships with the Government. The agreements between the
State and the railway enterprises relate to the administration of railway
infrastructure and the social responsibilities of railway enterprises. They usually
take the form of multi-annual contracts for maintenance of infrastructure, and
Public Service Contracts to establish how and under which terms such obligations
are managed with HŽ Passenger Transport. These must be multi-annual contracts
that include clear and measurable conditions for the allocation of financial support
34 http://www.oecd.org/dataoecd/46/51/34803211.pdf.
64
from the State. In the case of the HŽ Companies (see paragraphs above) what is
needed is essentially an improvement in the current setting for more time
visibility and more incentives for efficiency.
b) Implement performance-based management. The CEOs should be selected by
a merit-based process with defined Supervisory Board involvement, and
minimum fixed-term management contracts for CEOs—with performance targets.
The managers of the key companies must be selected competitively according to
transparent procedures, and must be given clear objectives for achievement.
Establishing management performance targets and linking them to an incentive
system is essential. Performance contracts must increase the accountability of
managers, and become motivational for the achievement of specific goals.
Salaries of managers should then be linked to management’s performance and
implementation of business plans agreed upon for the accomplishment of the
goals of the Government strategy for its companies.
c) Establish staff training and development programs. Staff is the core of each
organization, and professional development of that staff impacts the overall
progress of the business. Therefore, in a fast-moving business environment, a
company should continuously invest in the upgrade of skills and knowledge.
Middle and senior management of the key companies should be regularly trained
in up-to-date marketing, costing, financing and pricing. In a top-down approach,
all employees must become familiar with the principles of client-driven and
commercial culture.
d) Embrace transparency and disclosure. The HŽ Companies have legal and
social obligations to different stakeholders beyond their owner, including
employees, investors, local communities and customers. Information on the
companies’ performance—including State subsidies, public procurement, and
awarding of contracts—should be easily accessible and always available publicly.
Under HŽ Holding, the information was often presented in an aggregate manner,
which makes it difficult to drill down specific data and accurately assess the
performance of each company35, total subsidies, cost of staff, etc. This was clearly
a constraint while preparing the Note.
35 HŽ Infrastructure has achieved significant progress in public reporting of data during the past several years, but other
companies and HŽ Holding as an entity have been less transparent.
65
105. Public Fund Contributions to the railway sector need to be defined upfront. Under both the Restructuring Plan and the World Bank Recommended Scenario, the level of
public support remains high, while the affordability of the services proposed is not
guaranteed. In this context, with needs that are potentially significant, the safest strategy is
for the MOF to calculate upfront what the reasonable level is for its engagement in terms of
operating and investment subsidies. The MOF needs to determine if and at what level it will
authorize HŽ Infrastructure and HŽ Passenger Transport to borrow—and whether it intends
to contribute to their loan reimbursements—in order to propose a profile of financial support
that is known to all the sector stakeholders. Depending on the evolution of the economy, this
financial support can be adjusted as a percentage of the GDP or set as an absolute value.
Based on the presentations above, a realistic basis is that an effort similar to the previous
years may actually barely maintain the sector.
106. Even maintaining the current level of funding would still require some significant
investment choices, such as whether anything should be funded beyond EU-funded projects
and minimum rehabilitation costs, and what should be the level of acceptable contingent
liabilities (authorization to borrow) with HŽ Infrastructure and HŽ Passenger Services.
However, there is a small but existing margin of decrease—mostly in operating, but also
slightly in investment costs—if the Government decides to diminish the size of the network
and to discontinue those of the most heavily subsidized passenger lines that could be replaced
by cheaper modes such as buses.
107. The Government needs to take the lead in the implementation of the
restructuring. The Restructuring Plan represents the maximum that could be achieved
internally by HŽ—but it was not possible from inside to take or propose decisions that would
go beyond the companies’ perspectives, especially with regard to service definition and
network size. Moreover, a recurring issue linked to the TACs prevented the companies from
presenting homogeneous proposals. The two main areas in which a financial choice needs to
be made by the Government are:
a) Charging of Infrastructure: Either low TACs & high operating subsidies for the
Infrastructure Manager—and implicit incentives for freight to use railways, or
high TACs & lower operating subsidy for the Infrastructure Manager—with
higher passenger subsidy.
b) Passenger transport investment funding strategy: Either direct subsidies to
control investments made by HŽ Passenger Transport, or incorporation of
depreciation into the PSC(s) to empower the operator(s). Based on a Government
decision in December 6, 2012, the Government seems to have decided to finance
upfront the rolling stocks, which implies that PSCs should be revised accordingly.
66
108. While these choices do not determine the financial amount of State support, they
provide different policy incentives both to the operators and to the public on the use of
railways. Given the past very relative success of a considerably low level of TACs, the
Note’s recommendation is to go with a significantly higher level of TACs to ensure direct
revenue to the Infrastructure Manager.
109. The Government needs to make choices in the long-term to fix the size of the network
and the level of service, and translate those choices into performance-based contracting
arrangements with HŽ Passenger Transport and HŽ Infrastructure to maximize the chances
for the sector to be sustainable.
67
1. The financial information used in the Note for the analysis of the performance of HŽ
Holding and its main companies (Tables A1 and A2) was provided by HŽ Holding during the
period of December 2011 to January 2012. This included the operational and financial
statistics of each railway holding company. As a result of discussions in March 2012, the
World Bank Team and the representatives of the Government agreed to modify the Policy
Note structure, and complement it with an assessment of possible scenarios for the
improvement of the HŽ Companies’ operational and financial performance. The aim was for
those companies to achieve the average EU-27 level by 2016. The Bank Team’s financial
model required more detailed financial information than that initially provided by HŽ
Holding (presented in Table A1). Therefore, the Bank Team requested and subsequently
received from HŽ Holding the Audit Reports and Audited Financial Statements for 2008-
2011. The Team’s analysis of the data from the Audited Accounts revealed discrepancies
with the data from the HŽ Accounts.
2. Major differences in reporting the State subsidies and the cost of staff. Considering that audited accounts are the most trustful source of data, the analysis presented
in this annex emphasizes the following major inconsistencies:
a) In some cases, State subsidies reported in the Audited Accounts were not booked
in the year for which they were received, but recorded as a cost of amortization of
fixed assets in future periods. No additional information was given on the actual
usage of these funds.
b) According to the Audited Accounts, the total State contribution to HŽ Holding in
2010 was HRK 1988.2 million—which is 12% less than the information provided
in the HŽ Accounts—and the total operating expenses were more than 40%
higher.
c) Expenses were not booked in a consolidated manner; some costs (e.g., staff costs)
were instead recorded under several different categories of expenses. Therefore,
the cost of staff for HŽ Holding in 2010 is 40% higher in the Audited Accounts
than in the HŽ Accounts.
d) The information provided on the company’s subsidiaries and transfers among
affiliated companies were scarce, and as such, limited the degree of analysis
possible in regard to company’s operational and financial performance.
68
3. Impact of the quality of data on the findings of the Note. The recommendations
outlined in the Note were based on the HŽ Accounts. In light of the differences indicated
above, some calculations—such as the viability and cost recovery ratios for HŽ Holding—
could be affected. For 2010, the viability of HŽ Holding was 4% lower in the Audited
Accounts than in the HŽ Accounts—and the cost recovery ratio was 20% lower. It is possible
to conclude that—despite the fact that they are based on the HŽ Accounts—the findings and
recommendations will remain valid. However, the dependency of the HŽ Companies on State
support may be considerably higher, and the companies’ operational performance may be
deteriorating further in 2012 (due to higher ratio of salaries in total costs). This would make
it necessary to take much tougher measures to improve the operational and financial
performance of the HŽ Companies. Although these uncertainties in the quality of data
provided by HŽ Holding for the period of 2005-2011 affected the accuracy of figures in
Chapter F, the data concerning the actions necessary for cost cutting presented in Chapter I
can be accurately determined using only data from the Audited Accounts for 2011 as a basis.
This is also one of the explanations for the minor differences in many data between the
model (based on the audited statements) and the historic analysis.
4. Transparency and accountability in data reporting. It is vital to point out the
importance of accuracy, transparency and accountability in financial reporting. Presenting
information in a manner different from usual reporting standards makes information less
understandable to outsiders. Without an accurate reporting system it is also not possible to
make a precise diagnosis and to make the appropriate decisions and have them understood. It
is in the interest of all railway stakeholders to have an accurate and timely overview of HŽ
Holding’s operations and financial situation. While some information should remain
confidential, railway business should be transparent to its owners and Board. Therefore,
State-owned railways should model best practice from other transport and State-owned
enterprises, adopting proactive compliance with reporting standards—in particular, full,
accurate and timely disclosure of information. EU statistical requirements as well as the
Inspire Directive are also strong incentives to improve the flow of information supplied by
the sector.
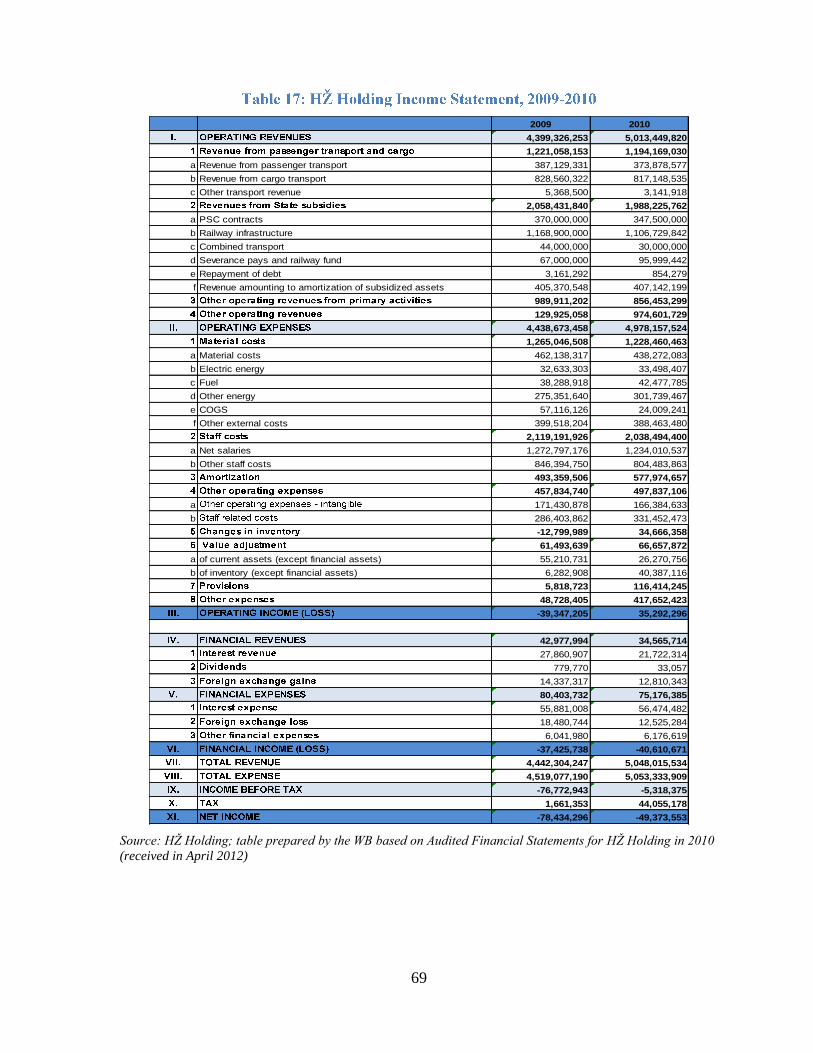
69
2009 2010
4,399,326,253 5,013,449,820
1,221,058,153 1,194,169,030
a Revenue from passenger transport 387,129,331 373,878,577
b Revenue from cargo transport 828,560,322 817,148,535
c Other transport revenue 5,368,500 3,141,918
2,058,431,840 1,988,225,762
a PSC contracts 370,000,000 347,500,000
b Railway infrastructure 1,168,900,000 1,106,729,842
c Combined transport 44,000,000 30,000,000
d Severance pays and railway fund 67,000,000 95,999,442
e Repayment of debt 3,161,292 854,279
f Revenue amounting to amortization of subsidized assets 405,370,548 407,142,199
989,911,202 856,453,299
129,925,058 974,601,729
4,438,673,458 4,978,157,524
1,265,046,508 1,228,460,463
a Material costs 462,138,317 438,272,083
b Electric energy 32,633,303 33,498,407
c Fuel 38,288,918 42,477,785
d Other energy 275,351,640 301,739,467
e COGS 57,116,126 24,009,241
f Other external costs 399,518,204 388,463,480
2,119,191,926 2,038,494,400
a Net salaries 1,272,797,176 1,234,010,537
b Other staff costs 846,394,750 804,483,863
493,359,506 577,974,657
457,834,740 497,837,106
a 171,430,878 166,384,633
b 286,403,862 331,452,473
-12,799,989 34,666,358
61,493,639 66,657,872
a of current assets (except financial assets) 55,210,731 26,270,756
b of inventory (except financial assets) 6,282,908 40,387,116
5,818,723 116,414,245
48,728,405 417,652,423
-39,347,205 35,292,296
42,977,994 34,565,714
27,860,907 21,722,314
779,770 33,057
14,337,317 12,810,343
80,403,732 75,176,385
55,881,008 56,474,482
18,480,744 12,525,284
6,041,980 6,176,619
-37,425,738 -40,610,671
4,442,304,247 5,048,015,534
4,519,077,190 5,053,333,909
-76,772,943 -5,318,375
1,661,353 44,055,178
-78,434,296 -49,373,553
Source: HŽ Holding; table prepared by the WB based on Audited Financial Statements for HŽ Holding in 2010
(received in April 2012)
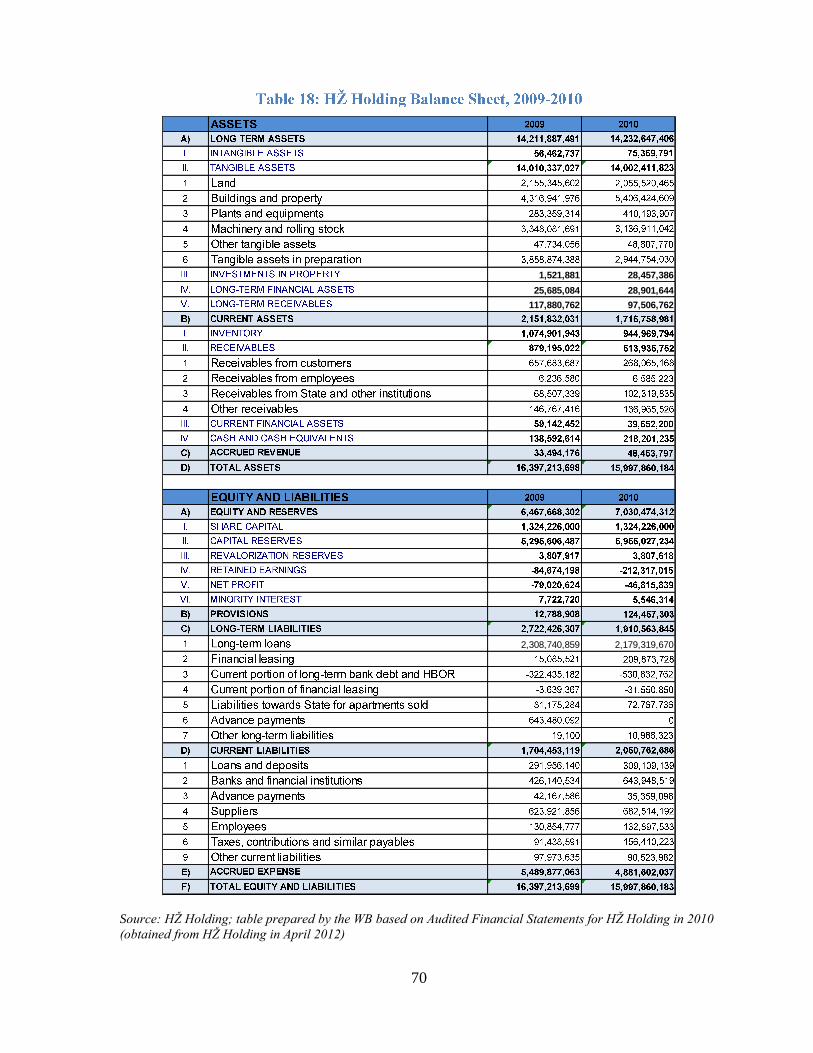
70
1,521,881 28,457,386
25,685,084 28,901,644
117,880,762 97,506,762
2,308,740,859 2,179,319,670
Source: HŽ Holding; table prepared by the WB based on Audited Financial Statements for HŽ Holding in 2010
(obtained from HŽ Holding in April 2012)
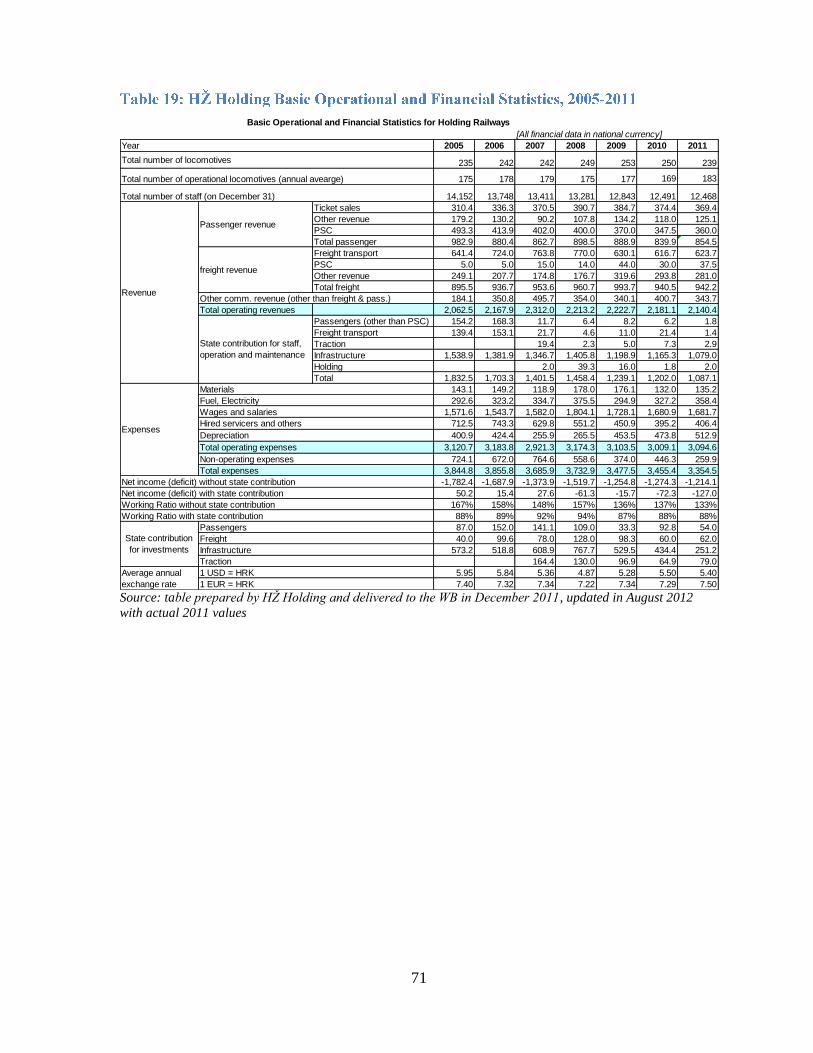
71
[All financial data in national currency]
2005 2006 2007 2008 2009 2010 2011
235 242 242 249 253 250 239
175 178 179 175 177 169 183
14,152 13,748 13,411 13,281 12,843 12,491 12,468
Ticket sales 310.4 336.3 370.5 390.7 384.7 374.4 369.4
Other revenue 179.2 130.2 90.2 107.8 134.2 118.0 125.1
PSC 493.3 413.9 402.0 400.0 370.0 347.5 360.0
Total passenger 982.9 880.4 862.7 898.5 888.9 839.9 854.5
Freight transport 641.4 724.0 763.8 770.0 630.1 616.7 623.7
PSC 5.0 5.0 15.0 14.0 44.0 30.0 37.5
Other revenue 249.1 207.7 174.8 176.7 319.6 293.8 281.0
Total freight 895.5 936.7 953.6 960.7 993.7 940.5 942.2
Other comm. revenue (other than freight & pass.) 184.1 350.8 495.7 354.0 340.1 400.7 343.7
Total operating revenues 2,062.5 2,167.9 2,312.0 2,213.2 2,222.7 2,181.1 2,140.4
Passengers (other than PSC) 154.2 168.3 11.7 6.4 8.2 6.2 1.8
Freight transport 139.4 153.1 21.7 4.6 11.0 21.4 1.4
Traction 19.4 2.3 5.0 7.3 2.9
Infrastructure 1,538.9 1,381.9 1,346.7 1,405.8 1,198.9 1,165.3 1,079.0
Holding 2.0 39.3 16.0 1.8 2.0
Total 1,832.5 1,703.3 1,401.5 1,458.4 1,239.1 1,202.0 1,087.1
Materials 143.1 149.2 118.9 178.0 176.1 132.0 135.2
Fuel, Electricity 292.6 323.2 334.7 375.5 294.9 327.2 358.4
Wages and salaries 1,571.6 1,543.7 1,582.0 1,804.1 1,728.1 1,680.9 1,681.7
Hired servicers and others 712.5 743.3 629.8 551.2 450.9 395.2 406.4
Depreciation 400.9 424.4 255.9 265.5 453.5 473.8 512.9
Total operating expenses 3,120.7 3,183.8 2,921.3 3,174.3 3,103.5 3,009.1 3,094.6
Non-operating expenses 724.1 672.0 764.6 558.6 374.0 446.3 259.9
Total expenses 3,844.8 3,855.8 3,685.9 3,732.9 3,477.5 3,455.4 3,354.5
-1,782.4 -1,687.9 -1,373.9 -1,519.7 -1,254.8 -1,274.3 -1,214.1
50.2 15.4 27.6 -61.3 -15.7 -72.3 -127.0
167% 158% 148% 157% 136% 137% 133%
88% 89% 92% 94% 87% 88% 88%
87.0 152.0 141.1 109.0 33.3 92.8 54.0
40.0 99.6 78.0 128.0 98.3 60.0 62.0
573.2 518.8 608.9 767.7 529.5 434.4 251.2
Traction 164.4 130.0 96.9 64.9 79.0
1 USD = HRK 5.95 5.84 5.36 4.87 5.28 5.50 5.40
1 EUR = HRK 7.40 7.32 7.34 7.22 7.34 7.29 7.50
Infrastructure
State contribution for staff,
operation and maintenance
Freight
Average annual
exchange rate
Net income (deficit) without state contribution
Net income (deficit) with state contribution
Passengers
Working Ratio with state contribution
State contribution
for investments
Basic Operational and Financial Statistics for Holding Railways
Total number of operational locomotives (annual avearge)
Total number of staff (on December 31)
Revenue
Working Ratio without state contribution
Year
Passenger revenue
Total number of locomotives
Expenses
freight revenue
Source: table prepared by HŽ Holding and delivered to the WB in December 2011, updated in August 2012
with actual 2011 values
72
1. Following the approval of the Restructuring Plan for HŽ Holding by the Government,
the Bank Team received its summary version that details the most important actions and
measures to be taken between 2012 and 2016. During the discussions between the Team and
the representatives of MMATI and HŽ Holding, it was agreed that the assumptions proposed
in the Restructuring Plan would be run through the same financial model that was used for
simulating the WB Recommended Scenario. The Policy Note would then give a comparative
assessment of the models’ outputs.
2. During this process, the Team came across several inconsistencies that made it
impossible to simulate the Restructuring Plan using the existing financial model. The
following paragraphs highlight the major elements that led to this conclusion:
a) The financial and operational results in the Restructuring Plans of HŽ Cargo and
HŽ Passenger Transport are based on the assumption that HŽ Infrastructure will
cover all investment needs related to railway infrastructure as outlined in their
restructuring programs. Although HŽ Infrastructure has already embarked on
numerous infrastructure projects, the company would not realistically be able to
carry out all of the investments that are factored into the financial and operational
forecasts of HŽ Cargo and HŽ Passenger Transport over the next five years.
b) The impact of some staff cuts was difficult to reconcile—all the more so, because
the companies did not have a homogeneous way of factoring retrenchment costs
in their books. For example, HŽ Cargo factors in retrenchment costs of HRK 33.8
million for a staff decrease of 899 in 2012—and then, the company factors in
retrenchment costs of HRK 47.4 million for a staff decrease of 494 in 2013.
Additionally, these financial effects are not well reflected in the complementary
income statements of HŽ Cargo, which factor in retrenchment costs of HRK 272
million in 2011, HRK 376 million in 2012 (following the restructuring process),
and HRK 255 million in 2013.
c) HŽ Passenger Transport is planning to launch a HRK 4 billion investment
program, to be realized over the period of 2013-2016. The State budget has been
listed as a source of HRK 3.6 billion of investment funds, namely for
modernization and procurement of new rolling stock. The financing source for the
residual, which will amount to HRK 400 million, remains unclear. The HŽ
Passenger Transport Restructuring Plan later lists the State budget as a source of
only HRK 2.8 million of investment funds.
d) In the HŽ Passenger Transport Restructuring Plan, tables and graphs representing
total revenues from passenger transport for the period of 2012-2016 do not match
those presented in the income statement. Discrepancies between the two sources
range between HRK 140 million and HRK 170 million per year.
73
e) HŽ Infrastructure’s revenues from TACs do not correspond to the TAC expenses
paid by HŽ Cargo and HŽ Passenger Transport. The amount of transported freight
and the number of passengers forecast by HŽ Infrastructure do not correspond to
those in the plans of HŽ Cargo and HŽ Passenger Transport. Moreover, it is
unclear how much of HŽ Infrastructure’s TAC revenue was derived from foreign
operators.
f) For all of the HŽ Companies, the Restructuring Plan does not indicate how
increases or decreases in revenue and cost drivers—such as the levels of traffic,
staff or investments—would affect specific elements in the financial statements.
Therefore, it is not possible to assess the precise impact of many restructuring
measures.
74
1. The purpose of this Annex is to illustrate the impact of the World Bank
Recommended Scenario assumptions—simulated using an excel-based model—on key
financial performance indicators of the HŽ system. The financial model was developed for
the period of 2011-2040, based on 2011 Audited Financial Statements with additional inputs
from HŽ Holding and the MMATI. The model takes into account institutional measures
proposed in the Restructuring Plan. The accounts of HŽ Traction have been divided between
HŽ Cargo and HŽ Passenger Transport—as planned by the HŽ Holding Restructuring
Program; those of HŽ Holding (which were very small in size compared to the rest) have
been added to HŽ Infrastructure. The State contribution through subsidies was taken into
consideration based on the planned State budget for 2012-2014. As of 2014, all subsidies
have been kept flat (HŽ Cargo: HRK 0 million; HŽ Passenger Transport: HRK 386 million;
HŽ Infrastructure: HRK 860 million) and corrected only in line with inflation. In addition to
consolidated results for the railway system as a whole, model outputs have been produced
separately for HŽ Cargo, HŽ Passenger Transport and HŽ Infrastructure. To focus on the
main outcomes of the Recommended Scenario, the results in most graphs are shown up to
2025. The model is meant to be illustrative rather than to provide an exact outcome of a
policy option.
2. Table A4 presents the general assumptions used in the financial model. Cost cutting
measures are introduced between 2012 and 2016, after which expenses are held constant in
real terms. Some items increase with inflation over the entire forecasted period (tariffs,
operating subsidies, other operating revenue, TACs and all operating expense items). The
aim of the Scenario that has been developed using these variables is to achieve a balanced
financial situation for each of the HŽ Companies by 2016. The model also verifies the
capacity of the companies to preserve the achieved efficiency up to 2040.
3. The resulting initial values of the model are sometimes quite different from the data
presented in Chapters E and F (historical trends in HŽ Holding and in the various
companies). This is due to: (i) the inclusion of the dismantled units in HŽ holding into the
infrastructure, passenger and cargo companies; (ii) the use of the Audited Accounts as a basis
instead of the HŽ Accounts; (iii) the use of the definition of purchases and services to
subsidiaries from the Audited Accounts (for example, HŽ Cargo’s sales to the company’s
freight forwarding subsidiary is not counted as freight traffic, but as other services—which
impacts the share of operating revenues from freight by a significant percentage); (iv) the
need to compensate asset depreciation for investment paid for by the State by a matching
subsidy.
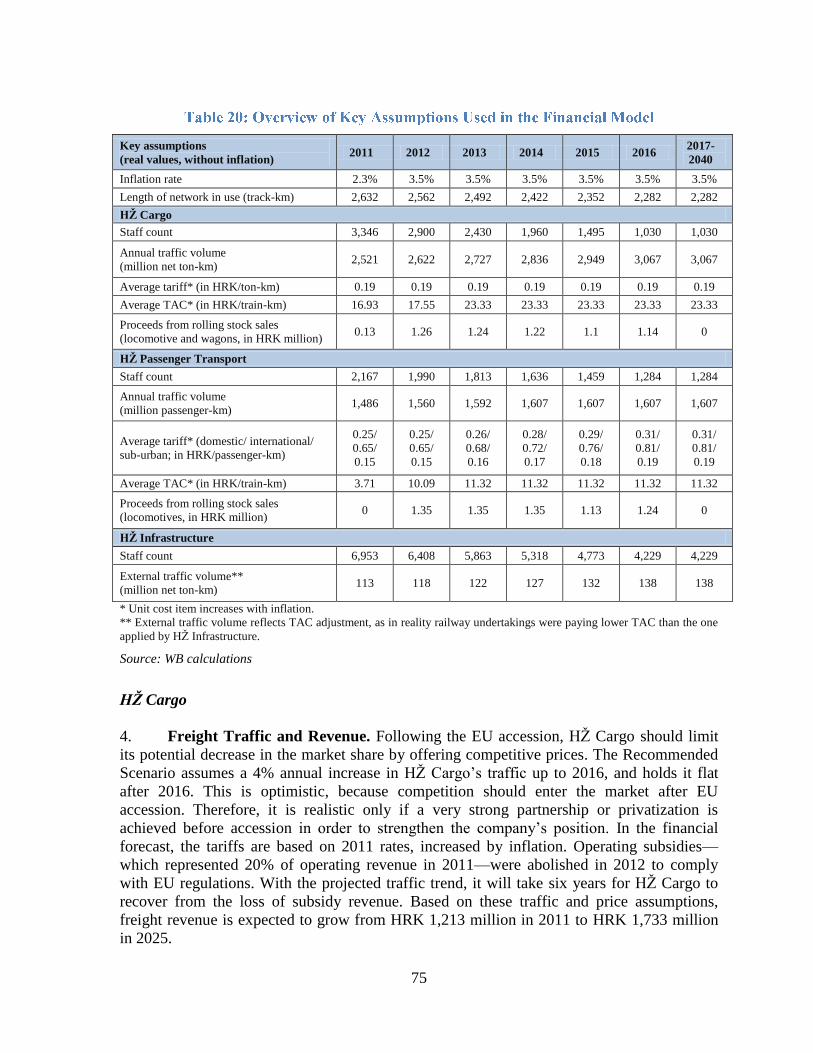
75
Key assumptions
(real values, without inflation) 2011 2012 2013 2014 2015 2016
2017-
2040
Inflation rate 2.3% 3.5% 3.5% 3.5% 3.5% 3.5% 3.5%
Length of network in use (track-km) 2,632 2,562 2,492 2,422 2,352 2,282 2,282
HŽ Cargo
Staff count 3,346 2,900 2,430 1,960 1,495 1,030 1,030
Annual traffic volume
(million net ton-km) 2,521 2,622 2,727 2,836 2,949 3,067 3,067
Average tariff* (in HRK/ton-km) 0.19 0.19 0.19 0.19 0.19 0.19 0.19
Average TAC* (in HRK/train-km) 16.93 17.55 23.33 23.33 23.33 23.33 23.33
Proceeds from rolling stock sales
(locomotive and wagons, in HRK million) 0.13 1.26 1.24 1.22 1.1 1.14 0
HŽ Passenger Transport
Staff count 2,167 1,990 1,813 1,636 1,459 1,284 1,284
Annual traffic volume
(million passenger-km) 1,486 1,560 1,592 1,607 1,607 1,607 1,607
Average tariff* (domestic/ international/
sub-urban; in HRK/passenger-km)
0.25/
0.65/
0.15
0.25/
0.65/
0.15
0.26/
0.68/
0.16
0.28/
0.72/
0.17
0.29/
0.76/
0.18
0.31/
0.81/
0.19
0.31/
0.81/
0.19
Average TAC* (in HRK/train-km) 3.71 10.09 11.32 11.32 11.32 11.32 11.32
Proceeds from rolling stock sales
(locomotives, in HRK million) 0 1.35 1.35 1.35 1.13 1.24 0
HŽ Infrastructure
Staff count 6,953 6,408 5,863 5,318 4,773 4,229 4,229
External traffic volume**
(million net ton-km) 113 118 122 127 132 138 138
* Unit cost item increases with inflation.
** External traffic volume reflects TAC adjustment, as in reality railway undertakings were paying lower TAC than the one
applied by HŽ Infrastructure.
Source: WB calculations
HŽ Cargo
4. Freight Traffic and Revenue. Following the EU accession, HŽ Cargo should limit
its potential decrease in the market share by offering competitive prices. The Recommended
Scenario assumes a 4% annual increase in HŽ Cargo’s traffic up to 2016, and holds it flat
after 2016. This is optimistic, because competition should enter the market after EU
accession. Therefore, it is realistic only if a very strong partnership or privatization is
achieved before accession in order to strengthen the company’s position. In the financial
forecast, the tariffs are based on 2011 rates, increased by inflation. Operating subsidies—
which represented 20% of operating revenue in 2011—were abolished in 2012 to comply
with EU regulations. With the projected traffic trend, it will take six years for HŽ Cargo to
recover from the loss of subsidy revenue. Based on these traffic and price assumptions,
freight revenue is expected to grow from HRK 1,213 million in 2011 to HRK 1,733 million
in 2025.
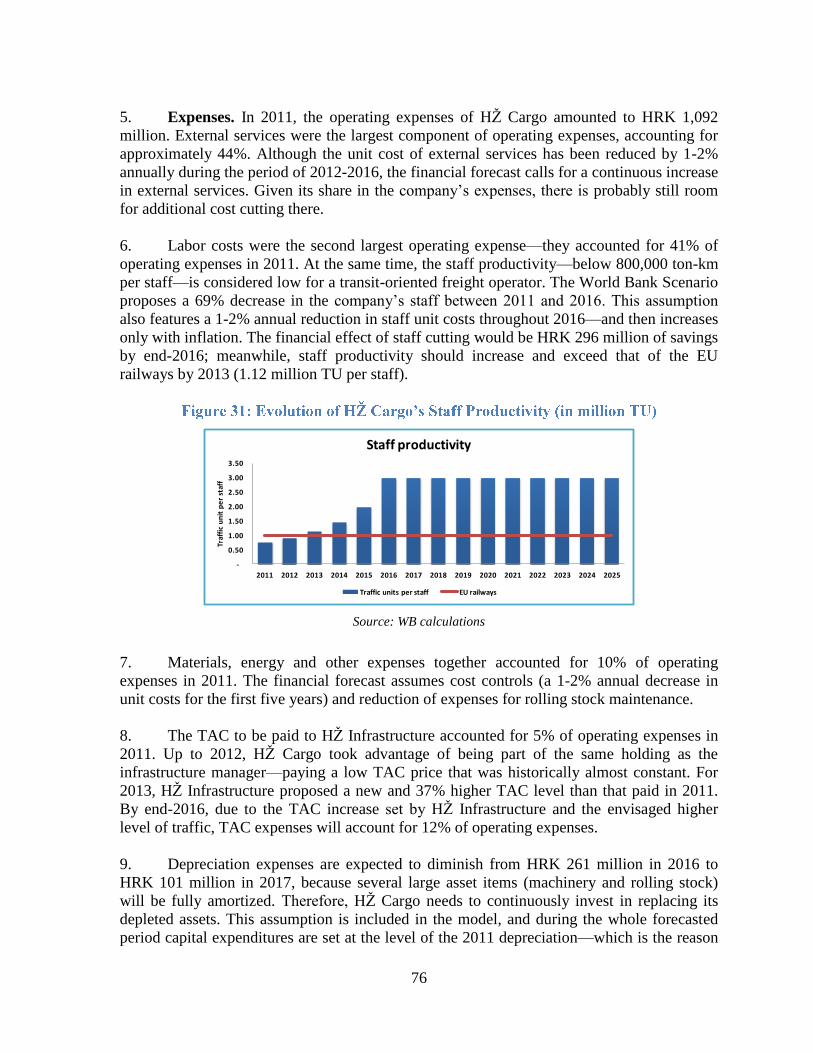
76
5. Expenses. In 2011, the operating expenses of HŽ Cargo amounted to HRK 1,092
million. External services were the largest component of operating expenses, accounting for
approximately 44%. Although the unit cost of external services has been reduced by 1-2%
annually during the period of 2012-2016, the financial forecast calls for a continuous increase
in external services. Given its share in the company’s expenses, there is probably still room
for additional cost cutting there.
6. Labor costs were the second largest operating expense—they accounted for 41% of
operating expenses in 2011. At the same time, the staff productivity—below 800,000 ton-km
per staff—is considered low for a transit-oriented freight operator. The World Bank Scenario
proposes a 69% decrease in the company’s staff between 2011 and 2016. This assumption
also features a 1-2% annual reduction in staff unit costs throughout 2016—and then increases
only with inflation. The financial effect of staff cutting would be HRK 296 million of savings
by end-2016; meanwhile, staff productivity should increase and exceed that of the EU
railways by 2013 (1.12 million TU per staff).
-
0.50
1.00
1.50
2.00
2.50
3.00
3.50
2011 2012 2013 2014 2015 2016 2017 2018 2019 2020 2021 2022 2023 2024 2025
Traf
fic
un
it p
er
staf
f
Staff productivity
Traffic units per staff EU railways
Source: WB calculations
7. Materials, energy and other expenses together accounted for 10% of operating
expenses in 2011. The financial forecast assumes cost controls (a 1-2% annual decrease in
unit costs for the first five years) and reduction of expenses for rolling stock maintenance.
8. The TAC to be paid to HŽ Infrastructure accounted for 5% of operating expenses in
2011. Up to 2012, HŽ Cargo took advantage of being part of the same holding as the
infrastructure manager—paying a low TAC price that was historically almost constant. For
2013, HŽ Infrastructure proposed a new and 37% higher TAC level than that paid in 2011.
By end-2016, due to the TAC increase set by HŽ Infrastructure and the envisaged higher
level of traffic, TAC expenses will account for 12% of operating expenses.
9. Depreciation expenses are expected to diminish from HRK 261 million in 2016 to
HRK 101 million in 2017, because several large asset items (machinery and rolling stock)
will be fully amortized. Therefore, HŽ Cargo needs to continuously invest in replacing its
depleted assets. This assumption is included in the model, and during the whole forecasted
period capital expenditures are set at the level of the 2011 depreciation—which is the reason
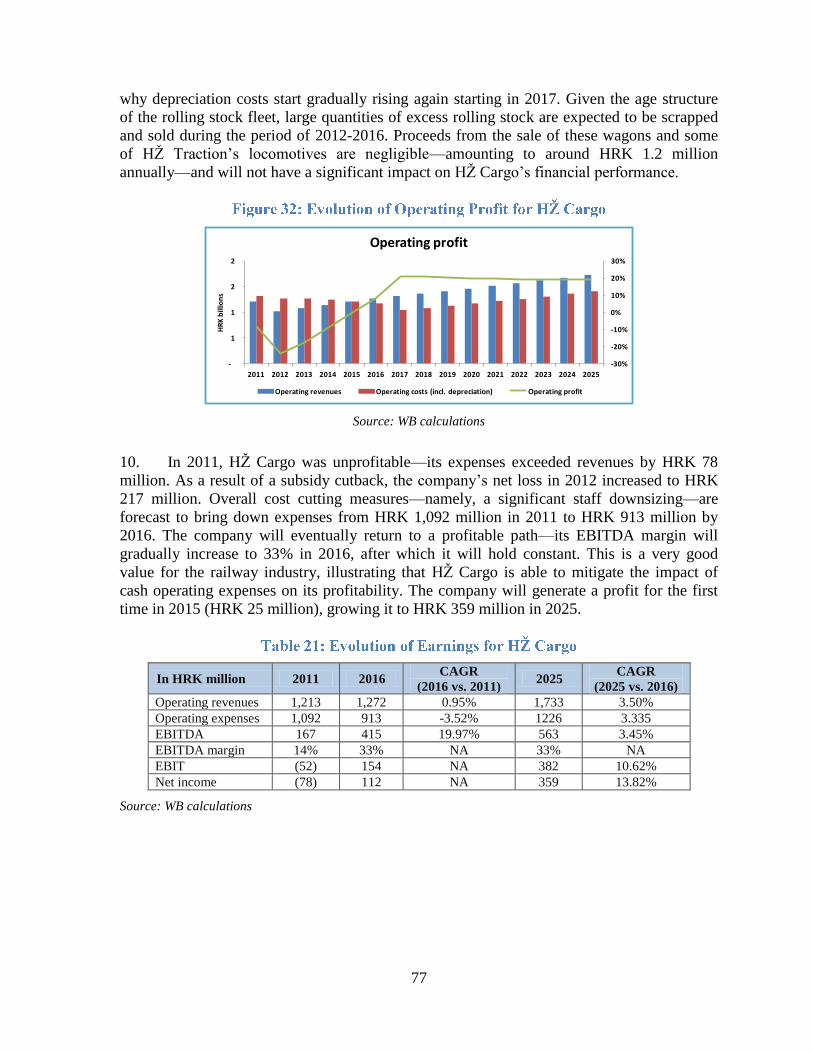
77
why depreciation costs start gradually rising again starting in 2017. Given the age structure
of the rolling stock fleet, large quantities of excess rolling stock are expected to be scrapped
and sold during the period of 2012-2016. Proceeds from the sale of these wagons and some
of HŽ Traction’s locomotives are negligible—amounting to around HRK 1.2 million
annually—and will not have a significant impact on HŽ Cargo’s financial performance.
-30%
-20%
-10%
0%
10%
20%
30%
-
1
1
2
2
2011 2012 2013 2014 2015 2016 2017 2018 2019 2020 2021 2022 2023 2024 2025
HR
K b
illio
ns
Operating profit
Operating revenues Operating costs (incl. depreciation) Operating profit
Source: WB calculations
10. In 2011, HŽ Cargo was unprofitable—its expenses exceeded revenues by HRK 78
million. As a result of a subsidy cutback, the company’s net loss in 2012 increased to HRK
217 million. Overall cost cutting measures—namely, a significant staff downsizing—are
forecast to bring down expenses from HRK 1,092 million in 2011 to HRK 913 million by
2016. The company will eventually return to a profitable path—its EBITDA margin will
gradually increase to 33% in 2016, after which it will hold constant. This is a very good
value for the railway industry, illustrating that HŽ Cargo is able to mitigate the impact of
cash operating expenses on its profitability. The company will generate a profit for the first
time in 2015 (HRK 25 million), growing it to HRK 359 million in 2025.
In HRK million 2011 2016 CAGR
(2016 vs. 2011) 2025
CAGR
(2025 vs. 2016)
Operating revenues 1,213 1,272 0.95% 1,733 3.50%
Operating expenses 1,092 913 -3.52% 1226 3.335
EBITDA 167 415 19.97% 563 3.45%
EBITDA margin 14% 33% NA 33% NA
EBIT (52) 154 NA 382 10.62%
Net income (78) 112 NA 359 13.82%
Source: WB calculations
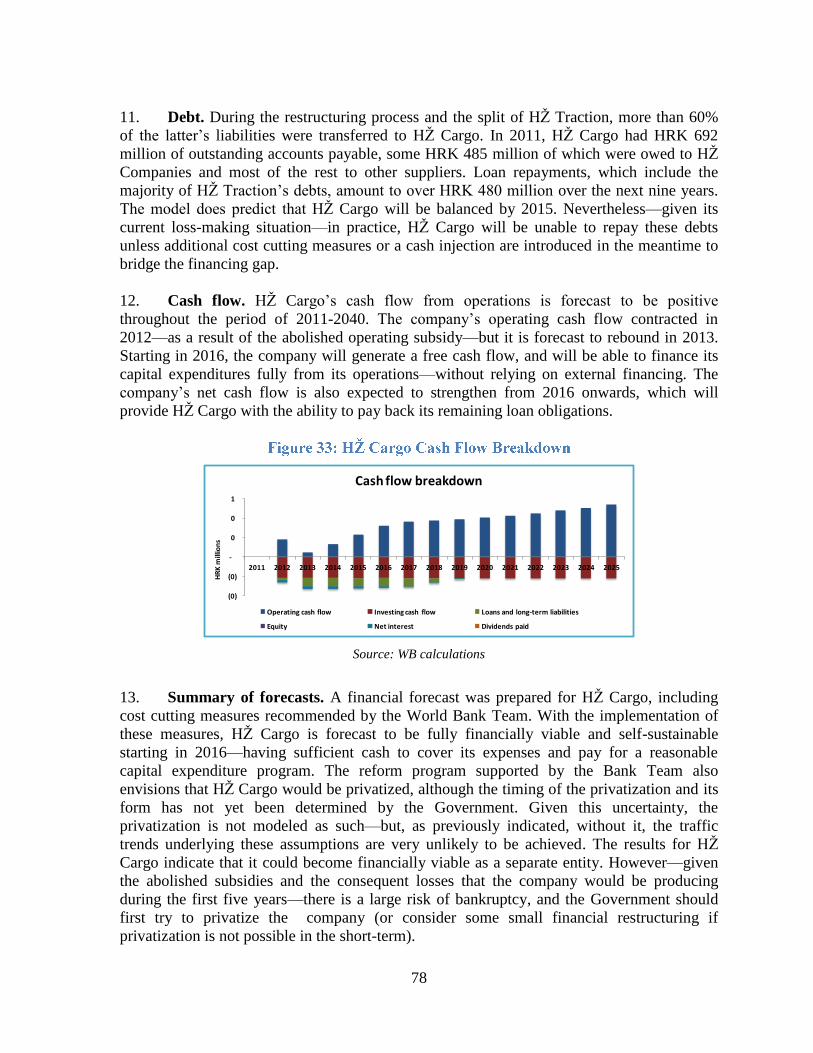
78
11. Debt. During the restructuring process and the split of HŽ Traction, more than 60%
of the latter’s liabilities were transferred to HŽ Cargo. In 2011, HŽ Cargo had HRK 692
million of outstanding accounts payable, some HRK 485 million of which were owed to HŽ
Companies and most of the rest to other suppliers. Loan repayments, which include the
majority of HŽ Traction’s debts, amount to over HRK 480 million over the next nine years.
The model does predict that HŽ Cargo will be balanced by 2015. Nevertheless—given its
current loss-making situation—in practice, HŽ Cargo will be unable to repay these debts
unless additional cost cutting measures or a cash injection are introduced in the meantime to
bridge the financing gap.
12. Cash flow. HŽ Cargo’s cash flow from operations is forecast to be positive
throughout the period of 2011-2040. The company’s operating cash flow contracted in
2012—as a result of the abolished operating subsidy—but it is forecast to rebound in 2013.
Starting in 2016, the company will generate a free cash flow, and will be able to finance its
capital expenditures fully from its operations—without relying on external financing. The
company’s net cash flow is also expected to strengthen from 2016 onwards, which will
provide HŽ Cargo with the ability to pay back its remaining loan obligations.
(0)
(0)
-
0
0
1
2011 2012 2013 2014 2015 2016 2017 2018 2019 2020 2021 2022 2023 2024 2025
HR
K m
illio
ns
Cash flow breakdown
Operating cash flow Investing cash flow Loans and long-term liabilities
Equity Net interest Dividends paid
Source: WB calculations
13. Summary of forecasts. A financial forecast was prepared for HŽ Cargo, including
cost cutting measures recommended by the World Bank Team. With the implementation of
these measures, HŽ Cargo is forecast to be fully financially viable and self-sustainable
starting in 2016—having sufficient cash to cover its expenses and pay for a reasonable
capital expenditure program. The reform program supported by the Bank Team also
envisions that HŽ Cargo would be privatized, although the timing of the privatization and its
form has not yet been determined by the Government. Given this uncertainty, the
privatization is not modeled as such—but, as previously indicated, without it, the traffic
trends underlying these assumptions are very unlikely to be achieved. The results for HŽ
Cargo indicate that it could become financially viable as a separate entity. However—given
the abolished subsidies and the consequent losses that the company would be producing
during the first five years—there is a large risk of bankruptcy, and the Government should
first try to privatize the company (or consider some small financial restructuring if
privatization is not possible in the short-term).
79
HŽ Passenger Transport
14. Passenger Traffic and Revenue. HŽ Passenger Transport carried about 50 million
passengers in 2011, which produced HRK 357 million in ticket revenues. In the financial
model, tariffs are forecast to gradually increase between 2013 and 201636
, after which they
will hold flat—adjusted only with inflation—throughout the forecasted period. The model
also assumes a slight uptick in traffic up to 201437
, with no additional changes until 2040 as a
consequence of higher fares. This would translate into HRK 574 million in revenues from
passenger fares in 2016.
15. In 2011, the State contribution to HŽ Passenger Transport for PSC contracts was
HRK 360 million; it was reduced to HRK 350.6 million in 2012. The portion of the State
budget envisaged for PSC contracts in 2013 and 2014 amounts to HRK 358.6 million. For
the purpose of modeling, the capital cost contribution from the State was abolished due to the
fact that the Government already provides for investments by covering the cost of the
company’s depreciation (see paragraph 21 below). Therefore, the operating subsidy was
increased by the amount of savings generated from eliminating the double payment of
investments. The resulting level of subsidies for 2013 would be HRK 385.9 million in real
terms, and it would be kept at that level up to 2040—adjusted only with inflation.
Considering these assumptions, HŽ Passenger Transport’s operating revenue of HRK 1,495
million in 2011, is projected to rise by 14% by 2016. Although the model forecasted growth
in operating revenues to HRK 2,321 million by 2025, in principle revenues will be frozen in
real terms and any increase would be the result of inflation corrections.
16. Expenses. The total operating expenses of HŽ Passenger Transport in 2011 were
HRK 1,239 million—external services accounted for roughly half of that amount (HRK 622
million). Although the unit cost of external services will be decreased by 1-2% up to 2016
(with increases to account for inflation during the forecasted period), its share in operating
expenses will remain almost unchanged.
17. In 2011, the cost of labor represented 26% of operating expenses. Through the labor
restructuring program suggested in the Recommended Scenario, total staff would decrease by
41% between 2011 and 2016. This is projected to generate average annual savings of around
HRK 22.6 million. HŽ Passenger Transport’s staff productivity—measured in traffic units
per staff—would meet the average EU-27 staff productivity by 2015 (1.1 million TU per
staff).
36 Every year, tariffs are proportionally increased for all fare categories: 5% in 2013 and 2014; 6% in 2015; and 7% in 2016. 37 The projected traffic increase is 5% for 2012, 2% for 2012, and 1% for 2014.
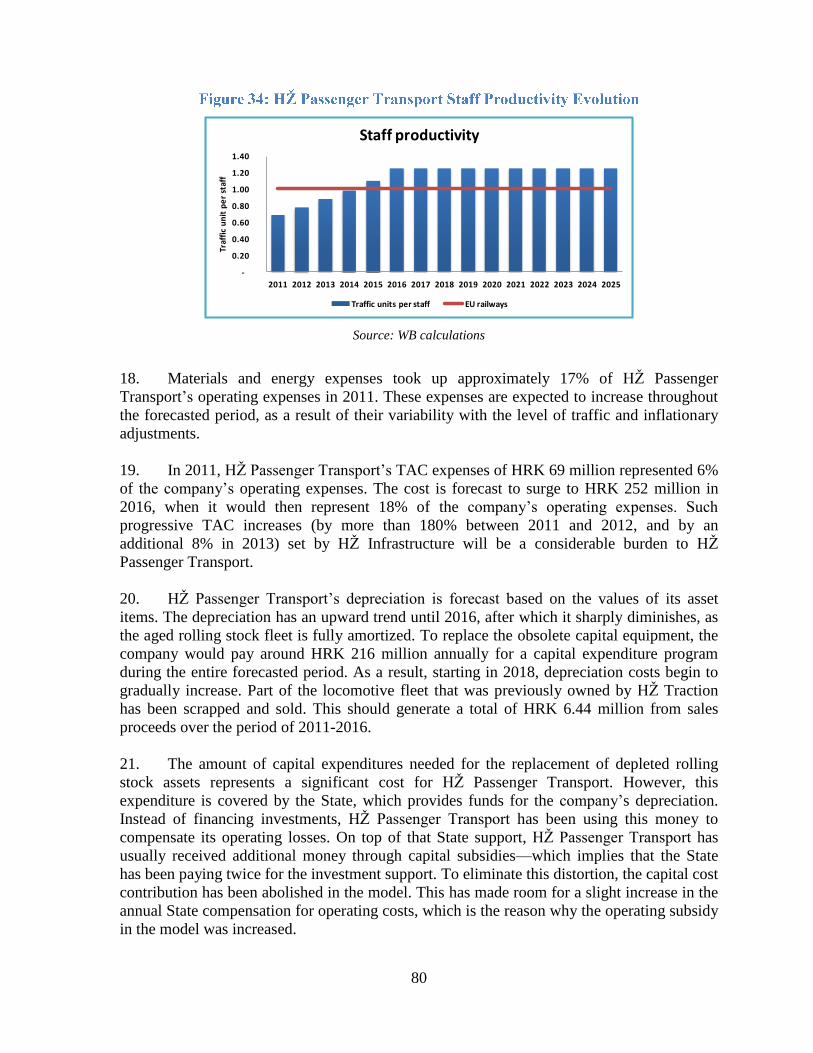
80
-
0.20
0.40
0.60
0.80
1.00
1.20
1.40
2011 2012 2013 2014 2015 2016 2017 2018 2019 2020 2021 2022 2023 2024 2025
Traf
fic
un
it p
er
staf
f
Staff productivity
Traffic units per staff EU railways
Source: WB calculations
18. Materials and energy expenses took up approximately 17% of HŽ Passenger
Transport’s operating expenses in 2011. These expenses are expected to increase throughout
the forecasted period, as a result of their variability with the level of traffic and inflationary
adjustments.
19. In 2011, HŽ Passenger Transport’s TAC expenses of HRK 69 million represented 6%
of the company’s operating expenses. The cost is forecast to surge to HRK 252 million in
2016, when it would then represent 18% of the company’s operating expenses. Such
progressive TAC increases (by more than 180% between 2011 and 2012, and by an
additional 8% in 2013) set by HŽ Infrastructure will be a considerable burden to HŽ
Passenger Transport.
20. HŽ Passenger Transport’s depreciation is forecast based on the values of its asset
items. The depreciation has an upward trend until 2016, after which it sharply diminishes, as
the aged rolling stock fleet is fully amortized. To replace the obsolete capital equipment, the
company would pay around HRK 216 million annually for a capital expenditure program
during the entire forecasted period. As a result, starting in 2018, depreciation costs begin to
gradually increase. Part of the locomotive fleet that was previously owned by HŽ Traction
has been scrapped and sold. This should generate a total of HRK 6.44 million from sales
proceeds over the period of 2011-2016.
21. The amount of capital expenditures needed for the replacement of depleted rolling
stock assets represents a significant cost for HŽ Passenger Transport. However, this
expenditure is covered by the State, which provides funds for the company’s depreciation.
Instead of financing investments, HŽ Passenger Transport has been using this money to
compensate its operating losses. On top of that State support, HŽ Passenger Transport has
usually received additional money through capital subsidies—which implies that the State
has been paying twice for the investment support. To eliminate this distortion, the capital cost
contribution has been abolished in the model. This has made room for a slight increase in the
annual State compensation for operating costs, which is the reason why the operating subsidy
in the model was increased.
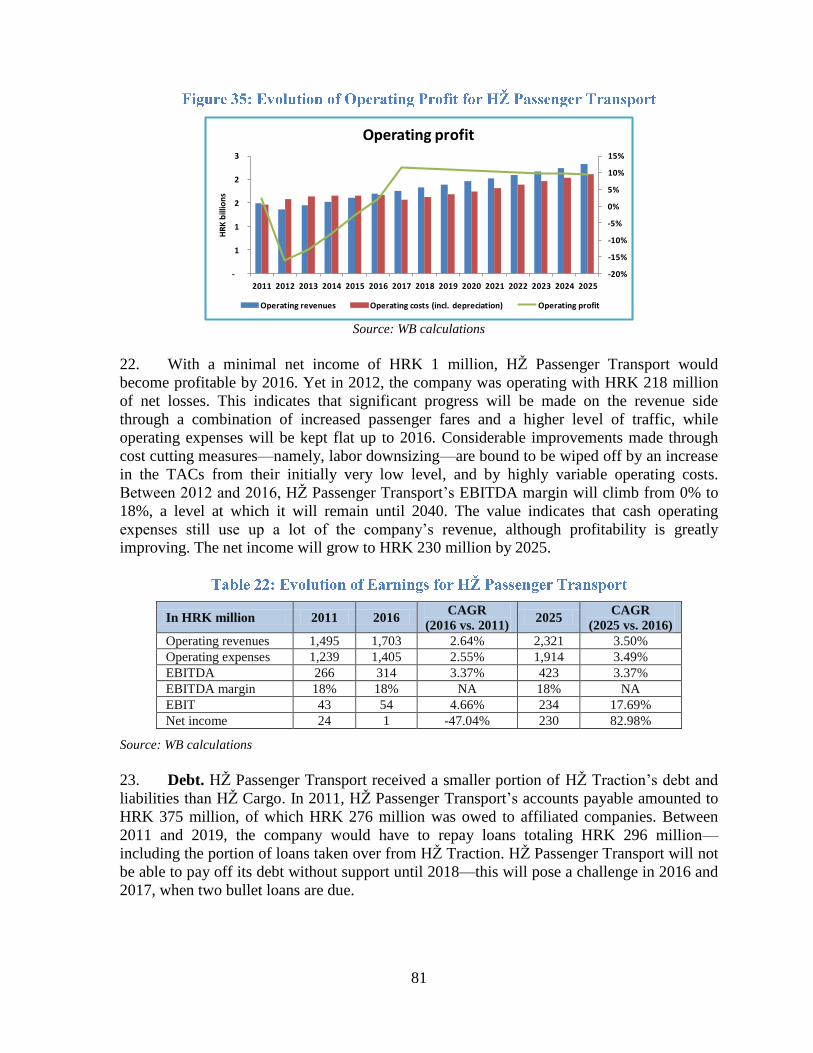
81
-20%
-15%
-10%
-5%
0%
5%
10%
15%
-
1
1
2
2
3
2011 2012 2013 2014 2015 2016 2017 2018 2019 2020 2021 2022 2023 2024 2025
HR
K b
illio
ns
Operating profit
Operating revenues Operating costs (incl. depreciation) Operating profit
Source: WB calculations
22. With a minimal net income of HRK 1 million, HŽ Passenger Transport would
become profitable by 2016. Yet in 2012, the company was operating with HRK 218 million
of net losses. This indicates that significant progress will be made on the revenue side
through a combination of increased passenger fares and a higher level of traffic, while
operating expenses will be kept flat up to 2016. Considerable improvements made through
cost cutting measures—namely, labor downsizing—are bound to be wiped off by an increase
in the TACs from their initially very low level, and by highly variable operating costs.
Between 2012 and 2016, HŽ Passenger Transport’s EBITDA margin will climb from 0% to
18%, a level at which it will remain until 2040. The value indicates that cash operating
expenses still use up a lot of the company’s revenue, although profitability is greatly
improving. The net income will grow to HRK 230 million by 2025.
In HRK million 2011 2016 CAGR
(2016 vs. 2011) 2025
CAGR
(2025 vs. 2016)
Operating revenues 1,495 1,703 2.64% 2,321 3.50%
Operating expenses 1,239 1,405 2.55% 1,914 3.49%
EBITDA 266 314 3.37% 423 3.37%
EBITDA margin 18% 18% NA 18% NA
EBIT 43 54 4.66% 234 17.69%
Net income 24 1 -47.04% 230 82.98%
Source: WB calculations
23. Debt. HŽ Passenger Transport received a smaller portion of HŽ Traction’s debt and
liabilities than HŽ Cargo. In 2011, HŽ Passenger Transport’s accounts payable amounted to
HRK 375 million, of which HRK 276 million was owed to affiliated companies. Between
2011 and 2019, the company would have to repay loans totaling HRK 296 million—
including the portion of loans taken over from HŽ Traction. HŽ Passenger Transport will not
be able to pay off its debt without support until 2018—this will pose a challenge in 2016 and
2017, when two bullet loans are due.
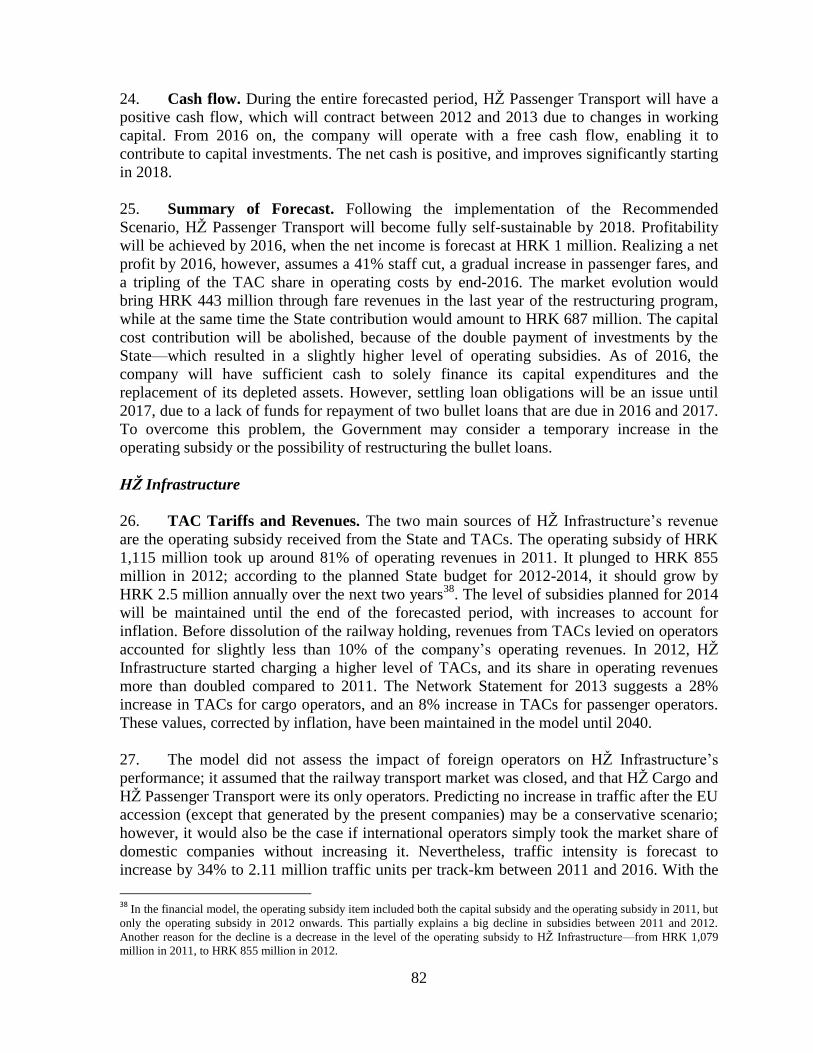
82
24. Cash flow. During the entire forecasted period, HŽ Passenger Transport will have a
positive cash flow, which will contract between 2012 and 2013 due to changes in working
capital. From 2016 on, the company will operate with a free cash flow, enabling it to
contribute to capital investments. The net cash is positive, and improves significantly starting
in 2018.
25. Summary of Forecast. Following the implementation of the Recommended
Scenario, HŽ Passenger Transport will become fully self-sustainable by 2018. Profitability
will be achieved by 2016, when the net income is forecast at HRK 1 million. Realizing a net
profit by 2016, however, assumes a 41% staff cut, a gradual increase in passenger fares, and
a tripling of the TAC share in operating costs by end-2016. The market evolution would
bring HRK 443 million through fare revenues in the last year of the restructuring program,
while at the same time the State contribution would amount to HRK 687 million. The capital
cost contribution will be abolished, because of the double payment of investments by the
State—which resulted in a slightly higher level of operating subsidies. As of 2016, the
company will have sufficient cash to solely finance its capital expenditures and the
replacement of its depleted assets. However, settling loan obligations will be an issue until
2017, due to a lack of funds for repayment of two bullet loans that are due in 2016 and 2017.
To overcome this problem, the Government may consider a temporary increase in the
operating subsidy or the possibility of restructuring the bullet loans.
HŽ Infrastructure
26. TAC Tariffs and Revenues. The two main sources of HŽ Infrastructure’s revenue
are the operating subsidy received from the State and TACs. The operating subsidy of HRK
1,115 million took up around 81% of operating revenues in 2011. It plunged to HRK 855
million in 2012; according to the planned State budget for 2012-2014, it should grow by
HRK 2.5 million annually over the next two years38
. The level of subsidies planned for 2014
will be maintained until the end of the forecasted period, with increases to account for
inflation. Before dissolution of the railway holding, revenues from TACs levied on operators
accounted for slightly less than 10% of the company’s operating revenues. In 2012, HŽ
Infrastructure started charging a higher level of TACs, and its share in operating revenues
more than doubled compared to 2011. The Network Statement for 2013 suggests a 28%
increase in TACs for cargo operators, and an 8% increase in TACs for passenger operators.
These values, corrected by inflation, have been maintained in the model until 2040.
27. The model did not assess the impact of foreign operators on HŽ Infrastructure’s
performance; it assumed that the railway transport market was closed, and that HŽ Cargo and
HŽ Passenger Transport were its only operators. Predicting no increase in traffic after the EU
accession (except that generated by the present companies) may be a conservative scenario;
however, it would also be the case if international operators simply took the market share of
domestic companies without increasing it. Nevertheless, traffic intensity is forecast to
increase by 34% to 2.11 million traffic units per track-km between 2011 and 2016. With the
38
In the financial model, the operating subsidy item included both the capital subsidy and the operating subsidy in 2011, but
only the operating subsidy in 2012 onwards. This partially explains a big decline in subsidies between 2011 and 2012.
Another reason for the decline is a decrease in the level of the operating subsidy to HŽ Infrastructure—from HRK 1,079
million in 2011, to HRK 855 million in 2012.
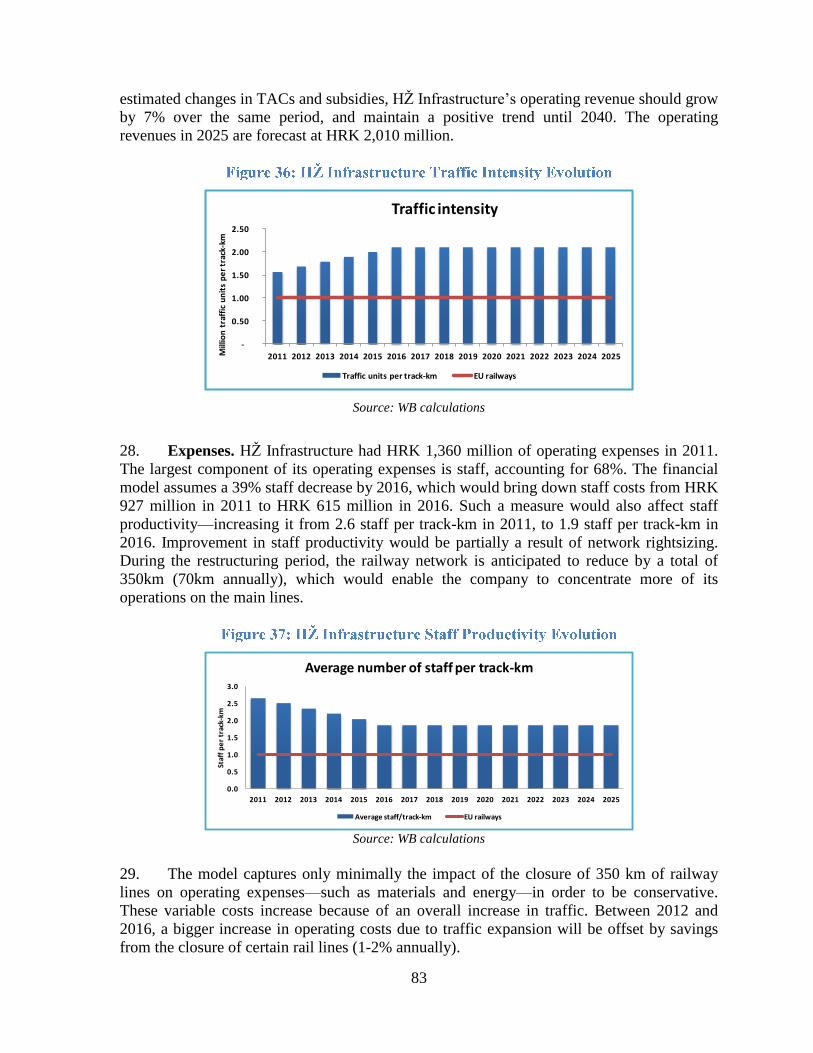
83
estimated changes in TACs and subsidies, HŽ Infrastructure’s operating revenue should grow
by 7% over the same period, and maintain a positive trend until 2040. The operating
revenues in 2025 are forecast at HRK 2,010 million.
-
0.50
1.00
1.50
2.00
2.50
2011 2012 2013 2014 2015 2016 2017 2018 2019 2020 2021 2022 2023 2024 2025Mill
ion
tra
ffic
un
its
pe
r tr
ack-
kmTraffic intensity
Traffic units per track-km EU railways
Source: WB calculations
28. Expenses. HŽ Infrastructure had HRK 1,360 million of operating expenses in 2011.
The largest component of its operating expenses is staff, accounting for 68%. The financial
model assumes a 39% staff decrease by 2016, which would bring down staff costs from HRK
927 million in 2011 to HRK 615 million in 2016. Such a measure would also affect staff
productivity—increasing it from 2.6 staff per track-km in 2011, to 1.9 staff per track-km in
2016. Improvement in staff productivity would be partially a result of network rightsizing.
During the restructuring period, the railway network is anticipated to reduce by a total of
350km (70km annually), which would enable the company to concentrate more of its
operations on the main lines.
0.0
0.5
1.0
1.5
2.0
2.5
3.0
2011 2012 2013 2014 2015 2016 2017 2018 2019 2020 2021 2022 2023 2024 2025
Staf
f p
er
trac
k-km
Average number of staff per track-km
Average staff/track-km EU railways
Source: WB calculations
29. The model captures only minimally the impact of the closure of 350 km of railway
lines on operating expenses—such as materials and energy—in order to be conservative.
These variable costs increase because of an overall increase in traffic. Between 2012 and
2016, a bigger increase in operating costs due to traffic expansion will be offset by savings
from the closure of certain rail lines (1-2% annually).
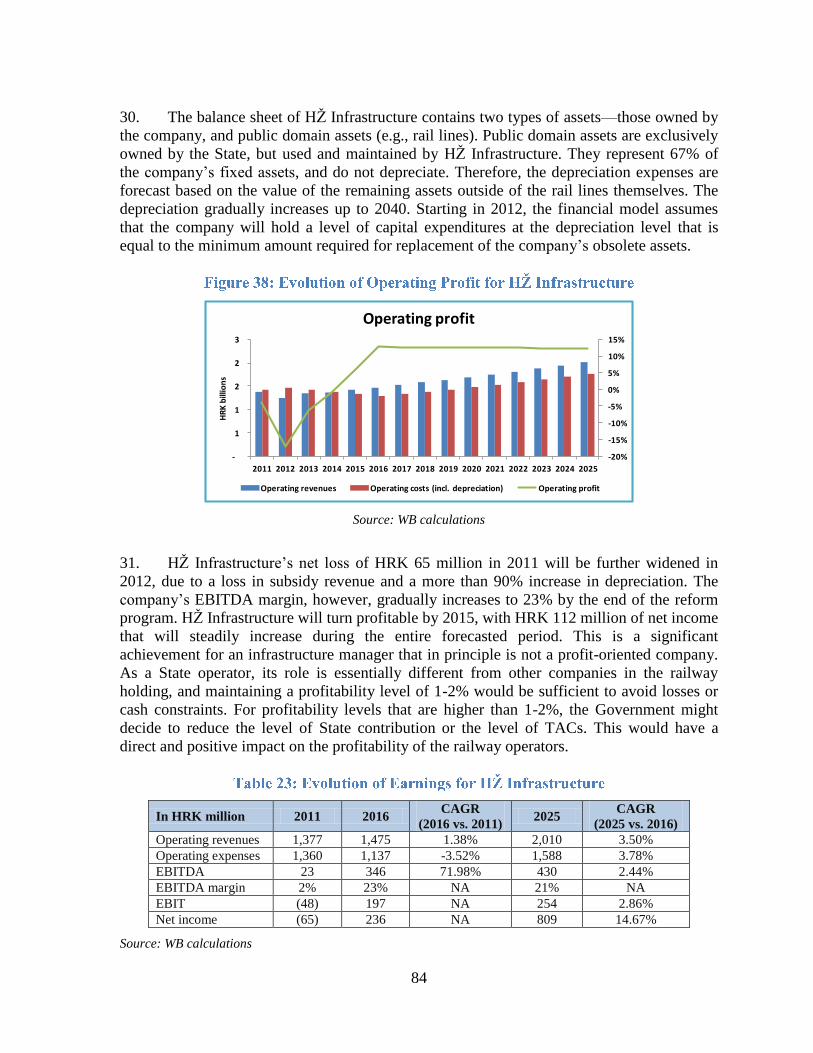
84
30. The balance sheet of HŽ Infrastructure contains two types of assets—those owned by
the company, and public domain assets (e.g., rail lines). Public domain assets are exclusively
owned by the State, but used and maintained by HŽ Infrastructure. They represent 67% of
the company’s fixed assets, and do not depreciate. Therefore, the depreciation expenses are
forecast based on the value of the remaining assets outside of the rail lines themselves. The
depreciation gradually increases up to 2040. Starting in 2012, the financial model assumes
that the company will hold a level of capital expenditures at the depreciation level that is
equal to the minimum amount required for replacement of the company’s obsolete assets.
-20%
-15%
-10%
-5%
0%
5%
10%
15%
-
1
1
2
2
3
2011 2012 2013 2014 2015 2016 2017 2018 2019 2020 2021 2022 2023 2024 2025
HR
K b
illio
ns
Operating profit
Operating revenues Operating costs (incl. depreciation) Operating profit
Source: WB calculations
31. HŽ Infrastructure’s net loss of HRK 65 million in 2011 will be further widened in
2012, due to a loss in subsidy revenue and a more than 90% increase in depreciation. The
company’s EBITDA margin, however, gradually increases to 23% by the end of the reform
program. HŽ Infrastructure will turn profitable by 2015, with HRK 112 million of net income
that will steadily increase during the entire forecasted period. This is a significant
achievement for an infrastructure manager that in principle is not a profit-oriented company.
As a State operator, its role is essentially different from other companies in the railway
holding, and maintaining a profitability level of 1-2% would be sufficient to avoid losses or
cash constraints. For profitability levels that are higher than 1-2%, the Government might
decide to reduce the level of State contribution or the level of TACs. This would have a
direct and positive impact on the profitability of the railway operators.
In HRK million 2011 2016 CAGR
(2016 vs. 2011) 2025
CAGR
(2025 vs. 2016)
Operating revenues 1,377 1,475 1.38% 2,010 3.50%
Operating expenses 1,360 1,137 -3.52% 1,588 3.78%
EBITDA 23 346 71.98% 430 2.44%
EBITDA margin 2% 23% NA 21% NA
EBIT (48) 197 NA 254 2.86%
Net income (65) 236 NA 809 14.67%
Source: WB calculations
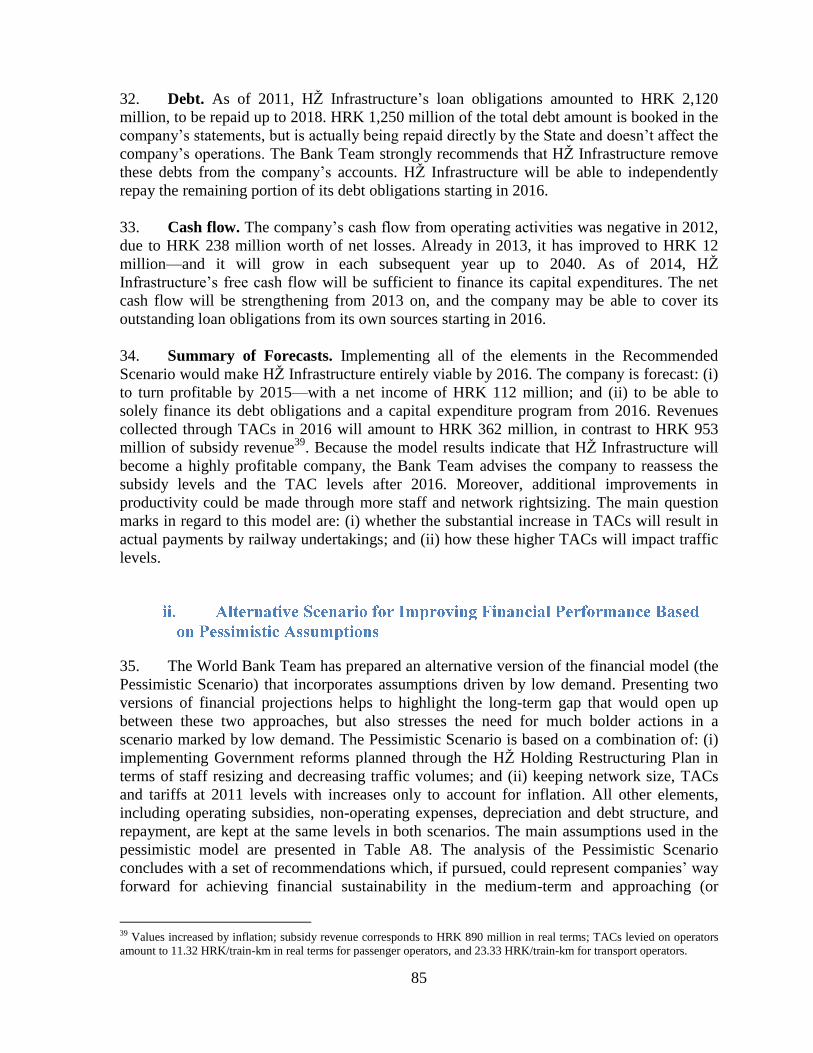
85
32. Debt. As of 2011, HŽ Infrastructure’s loan obligations amounted to HRK 2,120
million, to be repaid up to 2018. HRK 1,250 million of the total debt amount is booked in the
company’s statements, but is actually being repaid directly by the State and doesn’t affect the
company’s operations. The Bank Team strongly recommends that HŽ Infrastructure remove
these debts from the company’s accounts. HŽ Infrastructure will be able to independently
repay the remaining portion of its debt obligations starting in 2016.
33. Cash flow. The company’s cash flow from operating activities was negative in 2012,
due to HRK 238 million worth of net losses. Already in 2013, it has improved to HRK 12
million—and it will grow in each subsequent year up to 2040. As of 2014, HŽ
Infrastructure’s free cash flow will be sufficient to finance its capital expenditures. The net
cash flow will be strengthening from 2013 on, and the company may be able to cover its
outstanding loan obligations from its own sources starting in 2016.
34. Summary of Forecasts. Implementing all of the elements in the Recommended
Scenario would make HŽ Infrastructure entirely viable by 2016. The company is forecast: (i)
to turn profitable by 2015—with a net income of HRK 112 million; and (ii) to be able to
solely finance its debt obligations and a capital expenditure program from 2016. Revenues
collected through TACs in 2016 will amount to HRK 362 million, in contrast to HRK 953
million of subsidy revenue39
. Because the model results indicate that HŽ Infrastructure will
become a highly profitable company, the Bank Team advises the company to reassess the
subsidy levels and the TAC levels after 2016. Moreover, additional improvements in
productivity could be made through more staff and network rightsizing. The main question
marks in regard to this model are: (i) whether the substantial increase in TACs will result in
actual payments by railway undertakings; and (ii) how these higher TACs will impact traffic
levels.
35. The World Bank Team has prepared an alternative version of the financial model (the
Pessimistic Scenario) that incorporates assumptions driven by low demand. Presenting two
versions of financial projections helps to highlight the long-term gap that would open up
between these two approaches, but also stresses the need for much bolder actions in a
scenario marked by low demand. The Pessimistic Scenario is based on a combination of: (i)
implementing Government reforms planned through the HŽ Holding Restructuring Plan in
terms of staff resizing and decreasing traffic volumes; and (ii) keeping network size, TACs
and tariffs at 2011 levels with increases only to account for inflation. All other elements,
including operating subsidies, non-operating expenses, depreciation and debt structure, and
repayment, are kept at the same levels in both scenarios. The main assumptions used in the
pessimistic model are presented in Table A8. The analysis of the Pessimistic Scenario
concludes with a set of recommendations which, if pursued, could represent companies’ way
forward for achieving financial sustainability in the medium-term and approaching (or
39 Values increased by inflation; subsidy revenue corresponds to HRK 890 million in real terms; TACs levied on operators
amount to 11.32 HRK/train-km in real terms for passenger operators, and 23.33 HRK/train-km for transport operators.
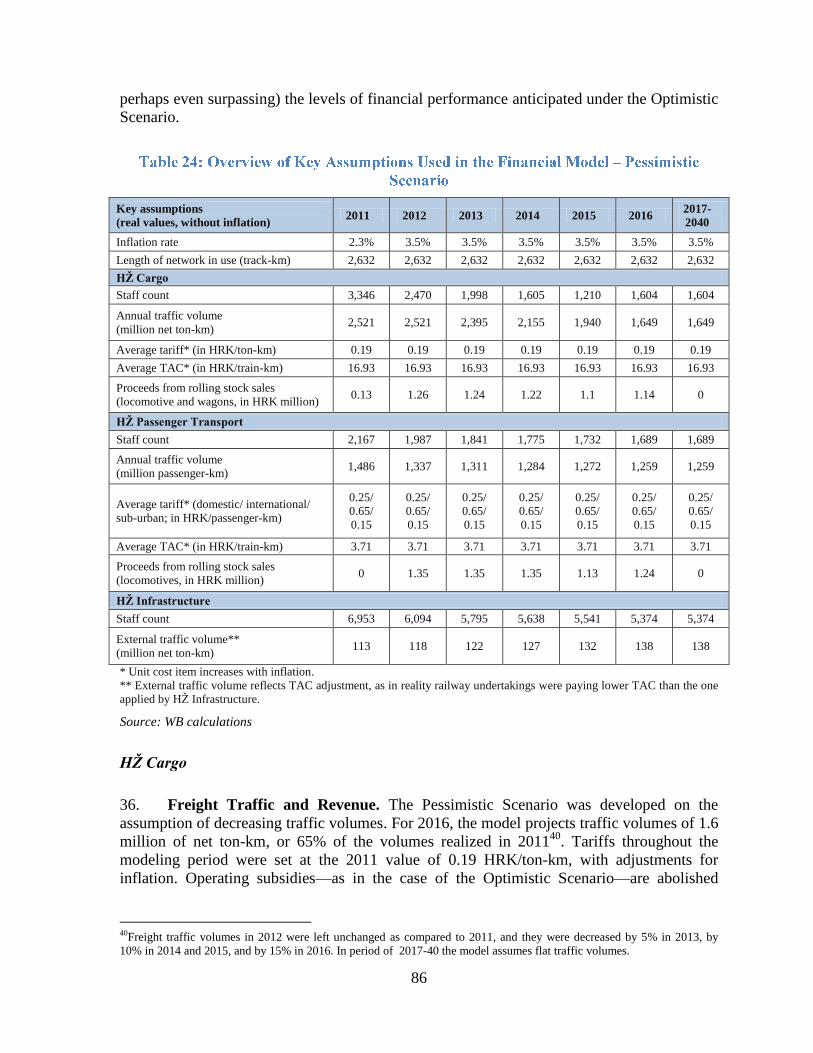
86
perhaps even surpassing) the levels of financial performance anticipated under the Optimistic
Scenario.
Key assumptions
(real values, without inflation) 2011 2012 2013 2014 2015 2016
2017-
2040
Inflation rate 2.3% 3.5% 3.5% 3.5% 3.5% 3.5% 3.5%
Length of network in use (track-km) 2,632 2,632 2,632 2,632 2,632 2,632 2,632
HŽ Cargo
Staff count 3,346 2,470 1,998 1,605 1,210 1,604 1,604
Annual traffic volume
(million net ton-km) 2,521 2,521 2,395 2,155 1,940 1,649 1,649
Average tariff* (in HRK/ton-km) 0.19 0.19 0.19 0.19 0.19 0.19 0.19
Average TAC* (in HRK/train-km) 16.93 16.93 16.93 16.93 16.93 16.93 16.93
Proceeds from rolling stock sales
(locomotive and wagons, in HRK million) 0.13 1.26 1.24 1.22 1.1 1.14 0
HŽ Passenger Transport
Staff count 2,167 1,987 1,841 1,775 1,732 1,689 1,689
Annual traffic volume
(million passenger-km) 1,486 1,337 1,311 1,284 1,272 1,259 1,259
Average tariff* (domestic/ international/
sub-urban; in HRK/passenger-km)
0.25/
0.65/
0.15
0.25/
0.65/
0.15
0.25/
0.65/
0.15
0.25/
0.65/
0.15
0.25/
0.65/
0.15
0.25/
0.65/
0.15
0.25/
0.65/
0.15
Average TAC* (in HRK/train-km) 3.71 3.71 3.71 3.71 3.71 3.71 3.71
Proceeds from rolling stock sales
(locomotives, in HRK million) 0 1.35 1.35 1.35 1.13 1.24 0
HŽ Infrastructure
Staff count 6,953 6,094 5,795 5,638 5,541 5,374 5,374
External traffic volume**
(million net ton-km) 113 118 122 127 132 138 138
* Unit cost item increases with inflation.
** External traffic volume reflects TAC adjustment, as in reality railway undertakings were paying lower TAC than the one
applied by HŽ Infrastructure.
Source: WB calculations
HŽ Cargo
36. Freight Traffic and Revenue. The Pessimistic Scenario was developed on the
assumption of decreasing traffic volumes. For 2016, the model projects traffic volumes of 1.6
million of net ton-km, or 65% of the volumes realized in 201140
. Tariffs throughout the
modeling period were set at the 2011 value of 0.19 HRK/ton-km, with adjustments for
inflation. Operating subsidies—as in the case of the Optimistic Scenario—are abolished
40Freight traffic volumes in 2012 were left unchanged as compared to 2011, and they were decreased by 5% in 2013, by
10% in 2014 and 2015, and by 15% in 2016. In period of 2017-40 the model assumes flat traffic volumes.
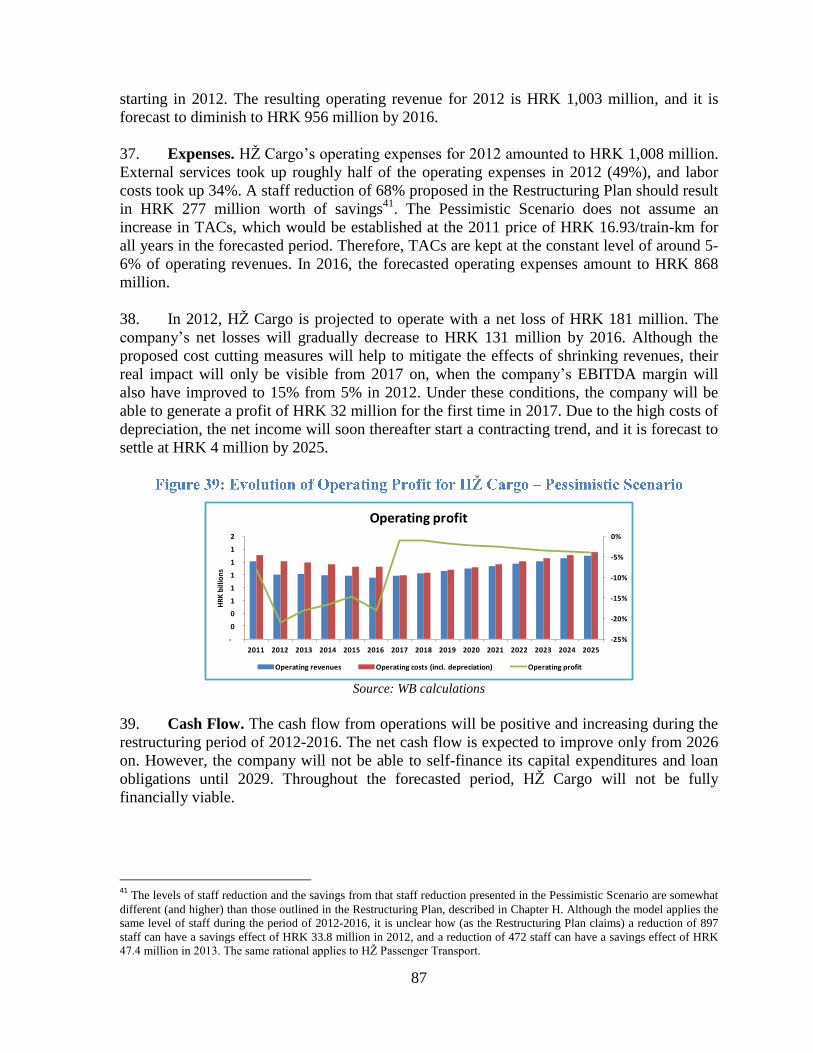
87
starting in 2012. The resulting operating revenue for 2012 is HRK 1,003 million, and it is
forecast to diminish to HRK 956 million by 2016.
37. Expenses. HŽ Cargo’s operating expenses for 2012 amounted to HRK 1,008 million.
External services took up roughly half of the operating expenses in 2012 (49%), and labor
costs took up 34%. A staff reduction of 68% proposed in the Restructuring Plan should result
in HRK 277 million worth of savings41
. The Pessimistic Scenario does not assume an
increase in TACs, which would be established at the 2011 price of HRK 16.93/train-km for
all years in the forecasted period. Therefore, TACs are kept at the constant level of around 5-
6% of operating revenues. In 2016, the forecasted operating expenses amount to HRK 868
million.
38. In 2012, HŽ Cargo is projected to operate with a net loss of HRK 181 million. The
company’s net losses will gradually decrease to HRK 131 million by 2016. Although the
proposed cost cutting measures will help to mitigate the effects of shrinking revenues, their
real impact will only be visible from 2017 on, when the company’s EBITDA margin will
also have improved to 15% from 5% in 2012. Under these conditions, the company will be
able to generate a profit of HRK 32 million for the first time in 2017. Due to the high costs of
depreciation, the net income will soon thereafter start a contracting trend, and it is forecast to
settle at HRK 4 million by 2025.
-25%
-20%
-15%
-10%
-5%
0%
-
0
0
1
1
1
1
1
2
2011 2012 2013 2014 2015 2016 2017 2018 2019 2020 2021 2022 2023 2024 2025
HR
K b
illio
ns
Operating profit
Operating revenues Operating costs (incl. depreciation) Operating profit
Source: WB calculations
39. Cash Flow. The cash flow from operations will be positive and increasing during the
restructuring period of 2012-2016. The net cash flow is expected to improve only from 2026
on. However, the company will not be able to self-finance its capital expenditures and loan
obligations until 2029. Throughout the forecasted period, HŽ Cargo will not be fully
financially viable.
41
The levels of staff reduction and the savings from that staff reduction presented in the Pessimistic Scenario are somewhat
different (and higher) than those outlined in the Restructuring Plan, described in Chapter H. Although the model applies the
same level of staff during the period of 2012-2016, it is unclear how (as the Restructuring Plan claims) a reduction of 897
staff can have a savings effect of HRK 33.8 million in 2012, and a reduction of 472 staff can have a savings effect of HRK
47.4 million in 2013. The same rational applies to HŽ Passenger Transport.
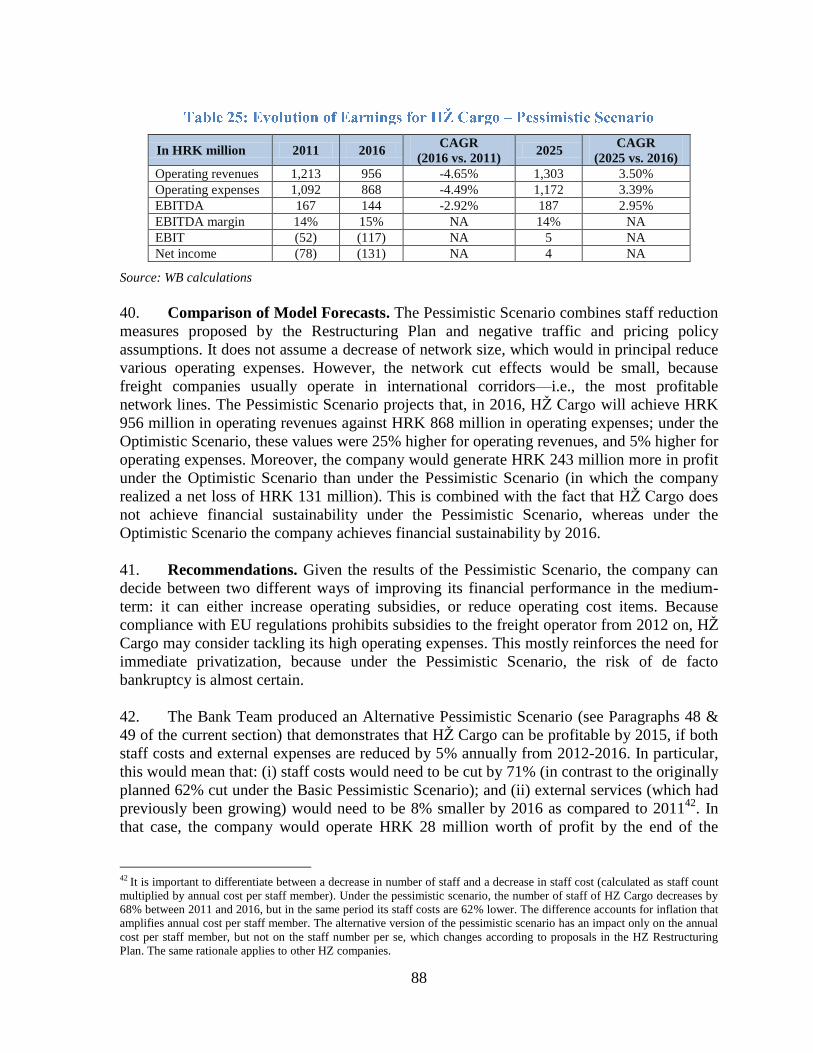
88
In HRK million 2011 2016 CAGR
(2016 vs. 2011) 2025
CAGR
(2025 vs. 2016)
Operating revenues 1,213 956 -4.65% 1,303 3.50%
Operating expenses 1,092 868 -4.49% 1,172 3.39%
EBITDA 167 144 -2.92% 187 2.95%
EBITDA margin 14% 15% NA 14% NA
EBIT (52) (117) NA 5 NA
Net income (78) (131) NA 4 NA
Source: WB calculations
40. Comparison of Model Forecasts. The Pessimistic Scenario combines staff reduction
measures proposed by the Restructuring Plan and negative traffic and pricing policy
assumptions. It does not assume a decrease of network size, which would in principal reduce
various operating expenses. However, the network cut effects would be small, because
freight companies usually operate in international corridors—i.e., the most profitable
network lines. The Pessimistic Scenario projects that, in 2016, HŽ Cargo will achieve HRK
956 million in operating revenues against HRK 868 million in operating expenses; under the
Optimistic Scenario, these values were 25% higher for operating revenues, and 5% higher for
operating expenses. Moreover, the company would generate HRK 243 million more in profit
under the Optimistic Scenario than under the Pessimistic Scenario (in which the company
realized a net loss of HRK 131 million). This is combined with the fact that HŽ Cargo does
not achieve financial sustainability under the Pessimistic Scenario, whereas under the
Optimistic Scenario the company achieves financial sustainability by 2016.
41. Recommendations. Given the results of the Pessimistic Scenario, the company can
decide between two different ways of improving its financial performance in the medium-
term: it can either increase operating subsidies, or reduce operating cost items. Because
compliance with EU regulations prohibits subsidies to the freight operator from 2012 on, HŽ
Cargo may consider tackling its high operating expenses. This mostly reinforces the need for
immediate privatization, because under the Pessimistic Scenario, the risk of de facto
bankruptcy is almost certain.
42. The Bank Team produced an Alternative Pessimistic Scenario (see Paragraphs 48 &
49 of the current section) that demonstrates that HŽ Cargo can be profitable by 2015, if both
staff costs and external expenses are reduced by 5% annually from 2012-2016. In particular,
this would mean that: (i) staff costs would need to be cut by 71% (in contrast to the originally
planned 62% cut under the Basic Pessimistic Scenario); and (ii) external services (which had
previously been growing) would need to be 8% smaller by 2016 as compared to 201142
. In
that case, the company would operate HRK 28 million worth of profit by the end of the
42 It is important to differentiate between a decrease in number of staff and a decrease in staff cost (calculated as staff count
multiplied by annual cost per staff member). Under the pessimistic scenario, the number of staff of HZ Cargo decreases by
68% between 2011 and 2016, but in the same period its staff costs are 62% lower. The difference accounts for inflation that
amplifies annual cost per staff member. The alternative version of the pessimistic scenario has an impact only on the annual
cost per staff member, but not on the staff number per se, which changes according to proposals in the HZ Restructuring
Plan. The same rationale applies to other HZ companies.
89
restructuring period. Moreover, as of 2016, HŽ Cargo would also be able to independently
finance its capital expenditures and settle its debt obligations.
HŽ Passenger Transport
Passenger Traffic and Revenue. In 2011, HŽ Passenger’s traffic was at 1,337 million
passenger-km. Starting in 2012, the traffic volumes under the Pessimistic Scenario are
projected to gradually decrease over the subsequent five years43
. This would result in a 15%
decrease in passenger-km in 2016 as compared to 2011, but an HRK 2 million increase in
ticket revenues. Because tariffs are set at 2011 levels during the entire modeling period—and
increase only with inflation—the incremental increase in ticket revenue would merely be a
product of inflation that would boost revenue from passenger fares—forecast to reach HRK
359 million by 2016.
43. The level of State contributions for PSC contracts would remain the same under
both the Optimistic and Pessimistic Scenarios, but the share of public funds in operating
revenues would need to be higher under the Pessimistic Scenario. HŽ Passenger Transport’s
operating revenue would grow from HRK 1,309 million in 2012 to HRK 1,489 million by the
end of restructuring period, and further to HRK 2,029 million by 2025. The revenue increase,
however, would be solely a product of inflation, given that all items are actually frozen in
real terms.
44. Expenses. In 2012, the total operating expenses of HŽ Passenger Transport amounted
to HRK 1,226 million. External services (HRK 644 million) and staff costs (HRK 303
million) were the company’s biggest cost items, followed by energy costs (HRK 154 million)
and TACs (64 million). During the period of 2012-2016, all expense items except staff are
forecast to have an increasing trend. A staff retrenchment of 22% yields savings of HRK 22
million, but those savings will be lost if staff resizing actions are not enforced post-2016.
TACs—set at 3.71 HRK/train-km for the entire modeling period, and increased with
inflation—do not represent a significant item in the company’s expense structure. The
forecasted operating expenses in 2016 amount to HRK 1,339 million, and increase to HRK
1,825 million by 2025.
45. In 2012, HŽ Passenger Transport is unprofitable, and operates with HRK 119 million
worth of net losses. By 2016, this loss is projected to increase to HRK 135 million, and then
turn to HRK 21 million of net profit in 2017. The change in net income between 2016 and
2017 stems from a decrease in non-operating expenses—namely depreciation (just like in the
Optimistic Scenario), but also from mitigated TAC expenses—which are kept at an
extremely low level during the forecasted period. However, the positive momentum will be
maintained for only three years—because in 2020, the company again starts producing losses
that gradually grow up to 2040.
43 Passenger traffic volumes are forecast to proportionally decrease for all categories by 10% in 2012, 2% in 2013 and 2014,
and 1% in 2015 and 2016. The model holds 2016 levels of traffic until 2040.
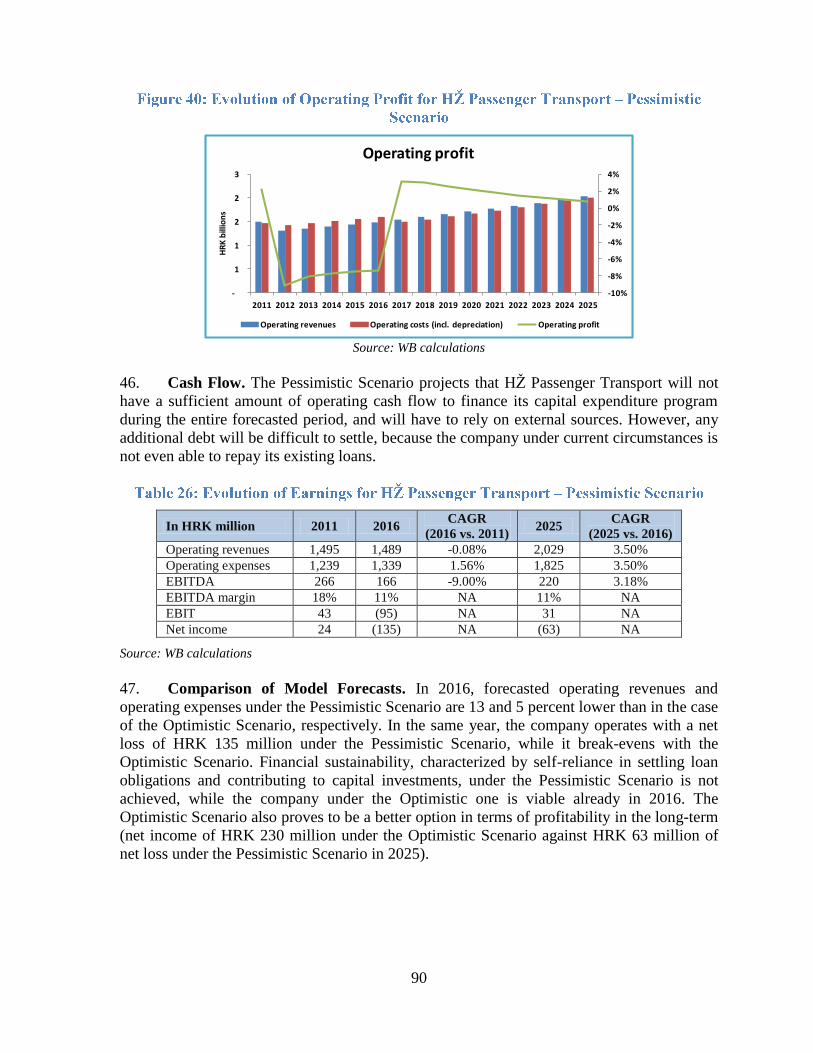
90
-10%
-8%
-6%
-4%
-2%
0%
2%
4%
-
1
1
2
2
3
2011 2012 2013 2014 2015 2016 2017 2018 2019 2020 2021 2022 2023 2024 2025
HR
K b
illio
ns
Operating profit
Operating revenues Operating costs (incl. depreciation) Operating profit
Source: WB calculations
46. Cash Flow. The Pessimistic Scenario projects that HŽ Passenger Transport will not
have a sufficient amount of operating cash flow to finance its capital expenditure program
during the entire forecasted period, and will have to rely on external sources. However, any
additional debt will be difficult to settle, because the company under current circumstances is
not even able to repay its existing loans.
In HRK million 2011 2016 CAGR
(2016 vs. 2011) 2025
CAGR
(2025 vs. 2016)
Operating revenues 1,495 1,489 -0.08% 2,029 3.50%
Operating expenses 1,239 1,339 1.56% 1,825 3.50%
EBITDA 266 166 -9.00% 220 3.18%
EBITDA margin 18% 11% NA 11% NA
EBIT 43 (95) NA 31 NA
Net income 24 (135) NA (63) NA
Source: WB calculations
47. Comparison of Model Forecasts. In 2016, forecasted operating revenues and
operating expenses under the Pessimistic Scenario are 13 and 5 percent lower than in the case
of the Optimistic Scenario, respectively. In the same year, the company operates with a net
loss of HRK 135 million under the Pessimistic Scenario, while it break-evens with the
Optimistic Scenario. Financial sustainability, characterized by self-reliance in settling loan
obligations and contributing to capital investments, under the Pessimistic Scenario is not
achieved, while the company under the Optimistic one is viable already in 2016. The
Optimistic Scenario also proves to be a better option in terms of profitability in the long-term
(net income of HRK 230 million under the Optimistic Scenario against HRK 63 million of
net loss under the Pessimistic Scenario in 2025).
91
48. Recommendations. Alternative versions of the model were developed to analyze the
impact of additional measures that could be taken for improving the financial viability of HŽ
Passenger Transport, given the current conditions. The first measure assumes an increase in
the operating subsidy to HŽ Passenger Transport as a means of accomplishing better
financial performance. If the subsidy in real terms was increased by HRK 105 million
annually during the period of 2013-2016, the company would: (i) turn profitable by 2016
(HRK 4 million net income); (ii) be able to invest in capital replacement from 2014 on; and
(iii) attain full viability by 2018.
49. Similar results could be achieved by influencing only operating expense items: for
example, by decreasing staff costs by 45% by 2016 instead of by the 7% planned under the
Basic Pessimistic Scenario; or by cutting external services by 3% by 2016 instead of growing
those services by the 19% planned under the Basic Pessimistic Scenario.
50. Finally, combining a cost cutting of 16% in staff and contracting external services to
their 2012 level by the end of restructuring—with a real term annual increase of HRK 40
million in subsidies between 2013 and 2016—the company is forecast to turn profitable by
2015, realizing a net income of HRK 8 million. As of 2018, it would also become financially
viable.
HŽ Infrastructure
51. TAC Tariffs and Revenues. In addition to revenue from the operating subsidy,
which is set at the same level as in the Optimistic Scenario, HŽ Infrastructure’s most
important revenue source is TACs. Under the Pessimistic Scenario, TACs for railway
operators is fixed at the 2011 level, and increases only with inflation. During the
implementation of the restructuring measures from 2012-2016, which entails a drop in traffic
volumes for national operators, TAC revenue will decline from HRK 126 million to HRK
117 million. Starting in 2017, TAC revenue will have an increasing trend due to inflation,
and its share in operating revenue will remain at around 10%, in contrast to 20% in the
Optimistic Scenario. The company’s operating revenue is forecast to grow as of 2012 to
HRK 1,229 million in 2016, and HRK 1,675 million in 2025. The revenue boost is an
outcome of inflationary impacts.
52. Expenses. Under the Pessimistic Scenario, HŽ Infrastructure’s operating expenses
will be decreasing from HRK 1,360 million in 2011 to HRK 1,312 million in 2016. During
this period, some savings will be made on materials and electricity due to lower traffic
volumes, while a 23% staff decrease will generate HRK 76 million worth of savings.
Nevertheless, the staff costs in 2016 represent 68% of operating costs, in contrast to 54%
under the Optimistic Scenario. All operating expenses will grow exponentially from 2017 on,
confirming that the cost cutting measures were negligible.
53. HŽ Infrastructure’s net loss of HRK 328 million in 2012 will be narrowed to HRK
161 million by 2016, as a result of contracting operating expenses, but also from an earned
interest on a positive cash balance as of 2015. The company will turn profitable by 2021,
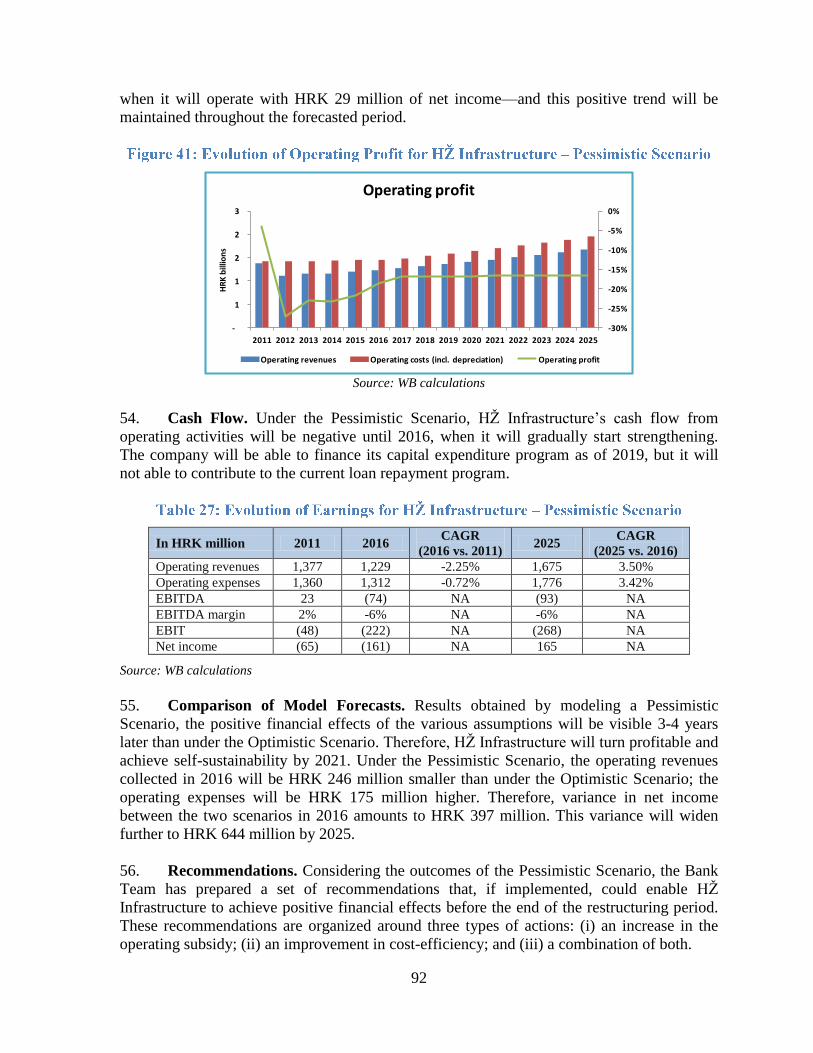
92
when it will operate with HRK 29 million of net income—and this positive trend will be
maintained throughout the forecasted period.
-30%
-25%
-20%
-15%
-10%
-5%
0%
-
1
1
2
2
3
2011 2012 2013 2014 2015 2016 2017 2018 2019 2020 2021 2022 2023 2024 2025
HR
K b
illio
ns
Operating profit
Operating revenues Operating costs (incl. depreciation) Operating profit
Source: WB calculations
54. Cash Flow. Under the Pessimistic Scenario, HŽ Infrastructure’s cash flow from
operating activities will be negative until 2016, when it will gradually start strengthening.
The company will be able to finance its capital expenditure program as of 2019, but it will
not able to contribute to the current loan repayment program.
In HRK million 2011 2016 CAGR
(2016 vs. 2011) 2025
CAGR
(2025 vs. 2016)
Operating revenues 1,377 1,229 -2.25% 1,675 3.50%
Operating expenses 1,360 1,312 -0.72% 1,776 3.42%
EBITDA 23 (74) NA (93) NA
EBITDA margin 2% -6% NA -6% NA
EBIT (48) (222) NA (268) NA
Net income (65) (161) NA 165 NA
Source: WB calculations
55. Comparison of Model Forecasts. Results obtained by modeling a Pessimistic
Scenario, the positive financial effects of the various assumptions will be visible 3-4 years
later than under the Optimistic Scenario. Therefore, HŽ Infrastructure will turn profitable and
achieve self-sustainability by 2021. Under the Pessimistic Scenario, the operating revenues
collected in 2016 will be HRK 246 million smaller than under the Optimistic Scenario; the
operating expenses will be HRK 175 million higher. Therefore, variance in net income
between the two scenarios in 2016 amounts to HRK 397 million. This variance will widen
further to HRK 644 million by 2025.
56. Recommendations. Considering the outcomes of the Pessimistic Scenario, the Bank
Team has prepared a set of recommendations that, if implemented, could enable HŽ
Infrastructure to achieve positive financial effects before the end of the restructuring period.
These recommendations are organized around three types of actions: (i) an increase in the
operating subsidy; (ii) an improvement in cost-efficiency; and (iii) a combination of both.
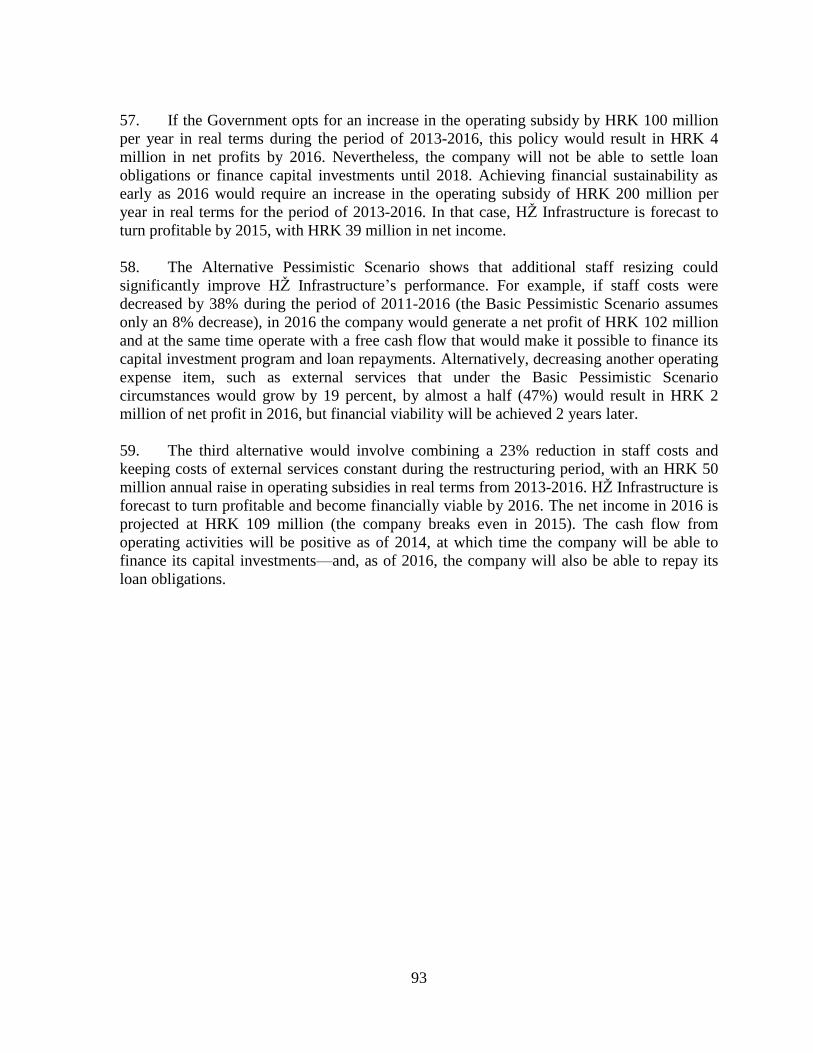
93
57. If the Government opts for an increase in the operating subsidy by HRK 100 million
per year in real terms during the period of 2013-2016, this policy would result in HRK 4
million in net profits by 2016. Nevertheless, the company will not be able to settle loan
obligations or finance capital investments until 2018. Achieving financial sustainability as
early as 2016 would require an increase in the operating subsidy of HRK 200 million per
year in real terms for the period of 2013-2016. In that case, HŽ Infrastructure is forecast to
turn profitable by 2015, with HRK 39 million in net income.
58. The Alternative Pessimistic Scenario shows that additional staff resizing could
significantly improve HŽ Infrastructure’s performance. For example, if staff costs were
decreased by 38% during the period of 2011-2016 (the Basic Pessimistic Scenario assumes
only an 8% decrease), in 2016 the company would generate a net profit of HRK 102 million
and at the same time operate with a free cash flow that would make it possible to finance its
capital investment program and loan repayments. Alternatively, decreasing another operating
expense item, such as external services that under the Basic Pessimistic Scenario
circumstances would grow by 19 percent, by almost a half (47%) would result in HRK 2
million of net profit in 2016, but financial viability will be achieved 2 years later.
59. The third alternative would involve combining a 23% reduction in staff costs and
keeping costs of external services constant during the restructuring period, with an HRK 50
million annual raise in operating subsidies in real terms from 2013-2016. HŽ Infrastructure is
forecast to turn profitable and become financially viable by 2016. The net income in 2016 is
projected at HRK 109 million (the company breaks even in 2015). The cash flow from
operating activities will be positive as of 2014, at which time the company will be able to
finance its capital investments—and, as of 2016, the company will also be able to repay its
loan obligations.
94
Source: WB