Embed Size (px)
Citation preview
Document of
The World Bank
FOR OFFICIAL USE ONLY
Report No. 3599b-CE
STAFF APPRAISAL REPORT
SRI LANKA
SEVENTH (MAHAWELI TRANSMISSION) POWER PROJECT
January 21, 1982
Regional Projects DepartmentSouth Asia Projects
This document has a restricted distribution and may be used by recipients only in the performance oftheir official duties. Its contents may not otherwise be disclosed without World Bank authorization.
Pub
lic D
iscl
osur
e A
utho
rized
Pub
lic D
iscl
osur
e A
utho
rized
Pub
lic D
iscl
osur
e A
utho
rized
Pub
lic D
iscl
osur
e A
utho
rized
Pub
lic D
iscl
osur
e A
utho
rized
Pub
lic D
iscl
osur
e A
utho
rized
Pub
lic D
iscl
osur
e A
utho
rized
Pub
lic D
iscl
osur
e A
utho
rized
SRI LANKA
SEVENTH (MAHAWELI TRANSMISSION) POWER PROJECT
CURRENCY EQIJIVALENTS
US$1.00 = SL Rs 18.5SL Rs 1.00 = US$0.054
MEASURES AND EQUIVALENT
1 kilometer (km) = 0.6214 mile1 kilovolt (kV) = 1,000 volts1 megavolt ampere (MVA) = 1 million volt amperes
= 1,000 kilovolt amperes1 megawatt (MW) = 1 million watts
1,000 kilowatts1 kilowatt hour (kWh) = 1,000 watt hours1 gigawatt hour (GWh) = 1 million kilowatt hours
ABBREVIATIONS AND ACRONYMS
ADB - Asian Development BankCEB - Ceylon Electricity BoardCPC - Ceylon Petroleum CorporationDGEU - Department of Government Electrical UndertakingsGSL - Government of Sri LankaGTZ - German Agency for Technical CooperationLRMC - Long-Run Marginal CostMPE - Ministry of Power and EnergyMASL - Mahaweli Authority of Sri LankaPPAR - Project Performance Audit ReportUSAID - United States Agency for International Development.
FISCAL YEAR
January 1 - December 31
FOR OFFICIAL USE ONLY
SRI LANKA
SEVENTH (MAHAWELI TRANSMISSION) POWER PROJECT
STAFF APPRAISAL REPORT
Table of Contents
Page No.
1. THE ENERGY AND POWER SECTOR .................................
A. Energy Resources ........................................
Hydro Power .................... 0......................Traditional Fuels ....................................Petroleum ............................................
B. The Power Subsector ..................... ...............Sector Organization ............ .. ....................External Assistance . ................ ..... ...........Existing Facilities ..................................Development Program ..................................Access to Service and Status of Supply ...............Plant Maintenance ....................................Rural Electrification ........................ . .......System Losses ........................................Historical Consumption ...............................Load Forecast ........................................
fl. THE IMPLEMENTING AGENCY ........................... ..-...
Lending Arrangements ......................................Organization ...... ........ ..................Management and Staffing ..................................Management Systems .......................................Training ................... 0...............................Local Authority Distribution Systems .....................Audit .....................................................
Insurance ..............................................
This report is based on the findings of an IDA mission comprising B.C. Davis
and J.C. Ryan who visited Colombo in May/June 1981.
This document has a restricted distribution and may be used by recipients only in the performance oftheir offial duties. Its contents may not otherwise be disclosed without World Bank authorization.
-2-
Table of Contents (Cont'd)
Page No.
III. THE PROJECT .
Objectives .............................................Description ...............................................Project Cost ..............................................Project Financing Plan ....................................Engineering and Implementation ............................Procurement ...............................................Disbursements .............................................Land Acquisition ..........................................Risks .....................................................
IV. FINANCIAL ANALYSIS .........................................
CEB's Statutory Position ...................................Past Financial Performance .................................Present Financial Position .................................Billing and Collection .....................................Revenues and Tariffs .......................................Transfer of Assets from the MASL ...........................Financing Plan (FYs 1981-85) ...............................Future Finances ............................................
V. JUSTIFICATION ..............................................
Approach ...................................................Economic Costs and Benefits ................................Results ....................................................
VI. AGREEMENTS REACHED AND RECOMMENDATION .....................
-3-
Tables of Contents (Cont-d)
Page No.
ANNEXES
1. Power and Energy Balances (through 1990).2. Generating Facilities.3. Existing Transmission and Distribution Systems.4. Load Forecast (through 1990) .5. Organization Chart.6. Reporting Requirements.7. Project Description.8. Project Cost Estimate .9. Construction Schedule ................................10. Schedule of Estimated Disbursements .....................11. Income Statement (FY1976 through FY1980) ................12. Tariff Structure ................................ .13. Income Statement (FY1979 through FY1988) ................14. Flow of Funds Statement (FY1979 through FY1988) .........15. Balance Sheets (FY1979 through FY1988) ..................16. Power Sector Investment Program (FY1981 through FY1990) .17. Assumptions for Financial Projections ...................18. Economic Analysis ................................
19. Related Documents and Information in the Project File ...
MAP
TBRD 16016R Seventh (Mahaweli Transmission) Power Project

A
I~~~~~~~~~~~~~~~~~~~~~~~~~~~~~~~~~~~~~~~~~~~~~~~~~~~~
I
SRI LANKA
STAFF APPRAISAL REPORT
SEVENTH (MAHAWELI TRANSMISSION) POWER PROJECT
I. THE ENERGY AND POWER SECTOR
A. Energy Resources
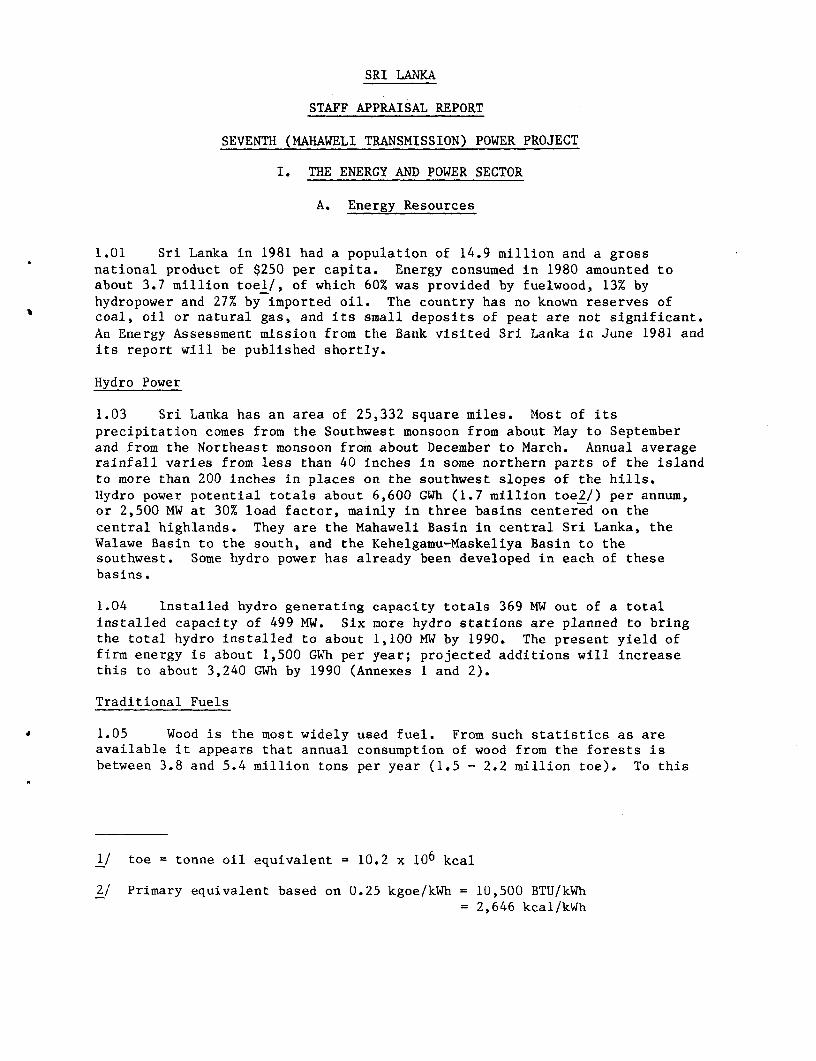
1.01 Sri Lanka in 1981 had a population of 14.9 million and a grossnational product of $250 per capita. Energy consumed in 1980 amounted toabout 3.7 million toel/, of which 60% was provided by fuelwood, 13% byhydropower and 27% by imported oil. The country has no known reserves ofcoal, oil or natural gas, and its small deposits of peat are not significant.An Energy Assessment mission from the Bank visited Sri Lanka in June 1981 andits report will be published shortly.
Hydro Power
1.03 Sri Lanka has an area of 25,332 square miles. Most of itsprecipitation comes from the Southwest monsoon from about May to Septemberand from the Northeast monsoon from about December to March. Annual averagerainfall varies from less than 40 inches in some northern parts of the islandto more than 200 inches in places on the southwest slopes of the hills.Tlydro power potential totals about 6,600 GWh (1.7 million toe2/) per annum,or 2,500 MW at 30% load factor, mainly in three basins centered on thecentral highlands. They are the Mahaweli Basin in central Sri Lanka, theWalawe Basin to the south, and the Kehelgamu-Maskeliya Basin to thesouthwest. Some hydro power has already been developed in each of thesebasins.
1.04 Installed hydro generating capacity totals 369 MW out of a totalinstalled capacity of 499 MW. Six more hydro stations are planned to bringthe total hydro installed to about 1,100 MW by 1990. The present yield offirm energy is about 1,500 GWh per year; projected additions will increasethis to about 3,240 GWh by 1990 (Annexes 1 and 2).
Traditional Fuels
* 1.05 Wood is the most widely used fuel. From such statistics as areavailable it appears that annual consumption of wood from the forests isbetween 3.8 and 5.4 million tons per year (1.5 - 2.2 million toe). To this
1/ toe = tonne oil equivalent = 10.2 x 10⁶ kcal
2/ Primary equivalent based on 0.25 kgoe/kWh = 10,500 BTU/kWh= 2,646 kcal/kWh
-2-
must be added 0.3 million tons per year (0.1 million toe) of fuelwood fromrubber and coconut plantations.
Petroleum
1.06 Exploration is taking place and it is expected that drilling will bestarted in 1981. Sri Lanka was recently classified as having favourablegeological prospects for potential oil or gas discoveries, but the chances ofsubstantial finds are thought to be low.
1.07 Ceylon Petroleum Corporation (CPC), a statutory corporation, is thesole importer and refiner; its refinery near Colombo has a capacity of 2.35 Mtonnes per year. The refinery does not produce enough kerosene or dieselfuel to satisfy local demand and the deficits are imported. Kerosene is soldon the local market at a price lower than either the cost of importing it orof producing it locally. Furnace oil, a blend of residual and distillateused among other purposes to fuel CEB's steam power station, is produced byCPC in greater quantity than the local market can absorb and the surplus isexported. Gasoline is sold at a high price to help offset the cost ofsubsidizing kerosene.l/
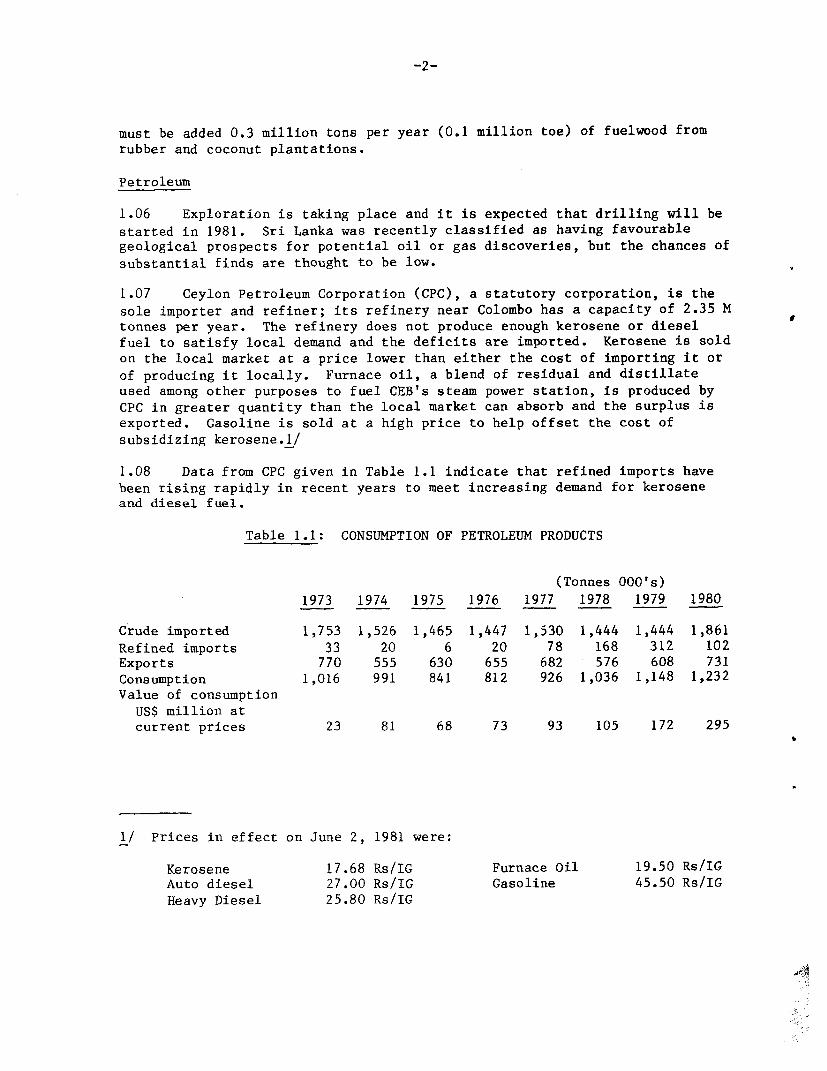
1.08 Data from CPC given in Table 1.1 indicate that refined imports havebeen rising rapidly in recent years to meet increasing demand for keroseneand diesel fuel.
Table 1.1: CONSUMPTION OF PETROLEUM PRODUCTS
(Tonnes 000's)1973 1974 1975 1976 1977 1978 1979 1980
Crude imported 1,753 1,526 1,465 1,447 1,530 1,444 1,444 1,861Refined imports 33 20 6 20 78 168 312 102Exports 770 555 630 655 682 576 608 731Consumption 1,016 991 841 812 926 1,036 1,148 1,232Value of consumption
US$ million atcurrent prices 23 81 68 73 93 105 172 295
1/ Prices in effect on June 2, 1981 were:
Kerosene 17.68 Rs/IG Furnace Oil 19.50 Rs/IGAuto diesel 27.00 Rs/IG Gasoline 45.50 Rs/IGHeavy Diesel 25.80 Rs/IG
-3-
B. The Power Subsector
Sector Organization
1.09 Sri Lanka's first public electricity supply was made available inColombo in 1895 by Messrs Boustead Bros. The business was soon taken overby United Planters Co., who extended it and in 1899 built the Colomboelectric tramways. In 1902, the Colombo Electric Tramways and Lighting Co.Ltd. was formed and provided electricity supply until 1927 when theDepartment of Government Electrical Undertakings (DGEU) was established tocontrol the utility, which had by then been purchased by the Government.DGEU was succeeded in 1969 when the Ceylon Electricity Board (CEB), astatutory corporation, was established with responsibility for thegeneration, transmission and distribution of electricity. CEB supplies powerdirect to consumers and also sells in bulk to local authorities who retail totheir own consumers. The Ministry of Power and Energy is responsible forsupervision of CEB's policies.
1.10 CEB has in the past been responsible for the development ofgenerating capacity and is now building the Canyon (60 MW) hydro station.For the next several years hydro generating capacity will be developed by theMahaweli Authority of Sri Lanka (MASL) an agency established uiider theMinistry of Mahaweli Development, having responsibility for theimplementation of the Accelerated Mahaweli Program. As they are completed,the Mahaweli generating facilities will be transferred to CEB for operation.During the next ten years some 580 MW of additional hydro capacity will bedeveloped in this way at Victoria, Kotmale, Randenigala and Rantembe (Annex1).
External Assistance
1.11 Sri Lanka has in the past obtained external financal assistancetowards the foreign exchange costs of its development program. The BankGroup has made available for power developments the following loans andcredits, totalling US$112.9 million:
(a) Loan 101-CE (US$15.9 million) to GSL in 1954 to help financethe 25 MW expansion of the Laksapana hydroelectric scheme.
(b) Loan 209-CE (US$7.4 million) to GSL in 1958 to help financeconstruction of a 25 MW thermal plant at Kelanitissa, Colombo.
(c) Loan 283-CE (US$14.1 million) to GSL in 1961 to help finance a25 MW expansion at Kelanitissa.
-4-
(d) Loan 636-CE (US$21.0 million) to CEBI/ in 1969 to help finance
the 90 MW Maskeliya Oya Stage II project, a 25 MW gas turbine,and management consultancy and engineering services. US$4.5million of this loan was cancelled when the gas turbine was notpurchased.
(e) Credit 372-CE (US$ 6.0 million) to GSL in 1973 for reinforcementand extension of CEB's transmission and distribution systems.
(f) Credit 1048-CE (US$ 19.5 million) to GSL in 1980 for the SixthPower Project to provide further reinforcement and improvementof CEB's transmission and distribution systems.
(g) Further, the Bank Group made available Loan 653-CE/Credit 174-CE(US$29.0 million) to GSL in 1969 for the multi-purpose(irrigation and power) Mahaweli Ganga Development of which the38 MW Ukuwela power station formed a part.
1.12 Six projects have been completed satisfactorily while that underCredit 1048-CE is at an early stage. Project Performance Audit Reports(PPAR) have recently been prepared for three of the above projects. That forLoan 653-CE/Credit 174-CE, which was for both irrigation and electricity,concluded that although implementation was seriously delayed, theagricultural and power benefits turned out to be much greater than expectedat appraisal; the benefit of power generated was much increased by the risein petroleum prices in 1973 and afterwards. The PPAR report on Loan 636-CE,for the 90 MW New Laksapana hydro station, concluded that the project hadbeen well conceived and constructed; it was built at low cost, and its timingwas fortunate in that it was almost complete at the time of the 1973 oilcrisis. A significant institutional advance under Loan 636-CE was theestablishment of CEB as a public corporation, replacing the Department ofGovernment Electrical Undertakings. Despite a promising start, CEB has notdeveloped as well as expected and both the Sixth (Credit 1048) and theproposed projects are seeking to promote significant advances in CEB'smanagement. The PPAR report dealing with Credit 372-CE concluded that theproject met its major objectives; the extensions to the transmission anddistribution system built under it, though completed late, enabled full useto be made of the Ukuwela and New Laksapana hydro stations.
1.13 The Sixth Power Project is about a year behind schedule.Effectiveness of Credit 1048-CE was postponed about 6 months because of adelay in arranging cofinancing, and further delays arose owing to thecomplexities of making procurement decisions, and because of changes of
1/ CEB was established in June 1969.
-5-
senior staff in CEB. At negotiations IDA was assured that CEB would adoptquicker procurement procedures and such delays would be avoided in future.
1.14 CEB's management shortcomings were noted in the appraisal of theSixth Power Project and in the PPAR report on the Fifth Power Project. Areview of CEB's managerial performance and methods, financed under Credit1048-CE, has been carried out by consultants, and action is being taken torestore management systems, provide support to senior management, andimplement comprehensive training programs for all types of staff (paras2.09-2.11).
1.15 The Asian Development Bank (ADB) has provided finance forconstruction of the Bowatenne and Canyon hydro stations and for ruralelectrification. GSL has arranged bilateral financing of hydro generationcomponents of the Mahaweli program as follows: - Sweden (Kotmale), U.K.(Victoria) and the Federal Republic of Germany (Randenigala). Theconstruction of hydro generating facilities at Samanalawewa has beenpostponed until the early 1990's.
Existing Facilities
1.16 CEB's existing generating, transmission and distribution facilitiesare described in Annexes 2 and 3. CEB's present installed capacity is 499MW, all interconnected on one system. In addition there are privately ownedgenerating stations, most of them less than 500 kW but ranging as large as5.75 MW in CPC's refinery at Sapugaskande and 6 MW at the urea factory. Thetransmission and distribution system comprises 569 miles of 132 kV line with17 substations, 214 miles of 66 kV lines with 9 substations, about 3,250miles of 33 kV, and about 750 miles of 11 kV lines. The system control andload dispatching centre is at Kolonnawa, and all important plants andswitching centers can communicate by means of power line carrier.
Development Program
1.17 Of recent years detailed planning has not usually extended more thanfour or five years ahead, but in mid 1981 CEB prepared a detailed developmentplan to meet its generation requirements over the next 15 years. The planhas not yet been officially adopted by GSL. The proposed hydro program showsadditions to the end of this decade bringing the installed capacity to about950 MW with a firm energy capacity of 3,170 GWh. In the first four years ofthe next decade, additions to hydro capacity of 1,000 MW and 2,000 GWh areproposed. To complement the hydro, some hundreds of megawatts of thermalplant will be needed between 1985 and 1994.
1.18 At negotiations, it was agreed that the following steps would betaken to put CEB's planning on a workable footing. The new General Managershould make planning a matter of high priority for his personal attention.A corporate planning department should be formed to plan generation and
-6-
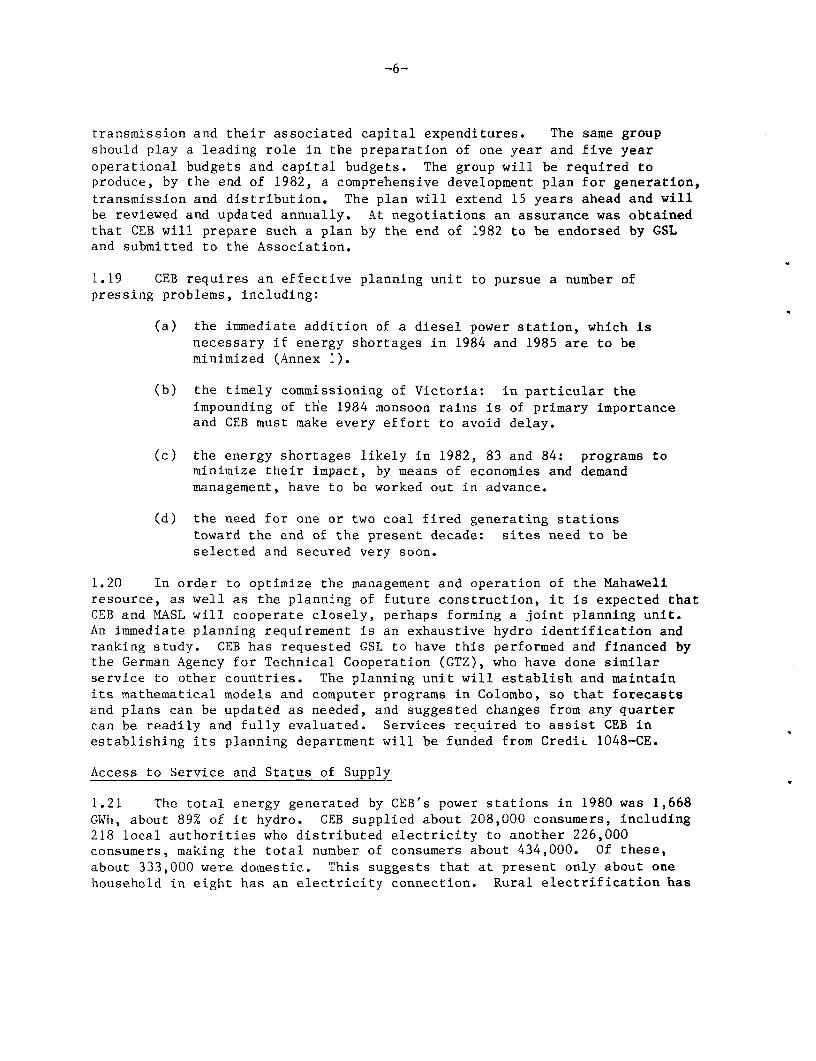
transmission and their associated capital expenditures. The same groupshould play a leading role in the preparation of one year and five yearoperational budgets and capital budgets. The group will be required toproduce, by the end of 1982, a comprehensive development plan for generation,transmission and distribution. The plan will extend 15 years ahead and willbe reviewed and updated annually. At negotiations an assurance was obtainedthat CEB will prepare such a plan by the end of 1982 to be endorsed by GSLand submitted to the Association.
1.19 CEB requires an effective planning unit to pursue a number ofpressing problems, including:
(a) the immediate addition of a diesel power station, which isnecessary if energy shortages in 1984 and 1985 are to beminimized (Annex 1).
(b) the timely commissioning of Victoria: in particular theimpounding of the 1984 monsoon rains is of primary importanceand CEB must make every effort to avoid delay.
(c) the energy shortages likely in 1982, 83 and 84: programs tominimize their impact, by means of economies and demandmanagement, have to be worked out in advance.
(d) the need for one or two coal fired generating stationstoward the end of the present decade: sites need to beselected and secured very soon.
1.20 In order to optimize the management and operation of the Mahaweliresource, as well as the planning of future construction, it is expected thatCEB and MASL will cooperate closely, perhaps forming a joint planning unit.An immediate planning requirement is an exhaustive hydro identification andranking study. CEB has requested GSL to have this performed and financed bythe German Agency for Technical Cooperation (GTZ), who have done similarservice to other countries. The planning unit will establish and maintainits mathematical models and computer programs in Colombo, so that forecastsand plans can be updated as needed, and suggested changes from any quartercan be readily and fully evaluated. Services required to assist CEB inestablishing its planning department will be funded from CrediL 1048-CE.
Access to Service and Status of Supply
1.21 The total energy generated by CEB's power stations in 1980 was 1,668GWh, about 89% of it hydro. CEB supplied about 208,000 consumers, including218 local authorities who distributed electricity to another 226,000consumers, making the total number of consumers about 434,000. Of these,about 333,000 were domestic. This suggests that at present only about onehousehold in eight has an electricity connection. Rural electrification has
-7--
been extended to over 2,000 of a total 25,000 villages (para 1.27), butelectricity consumption per head was less than 100 kWh in 1980. The majority
of households use firewood for cooking and kerosene for lighting.
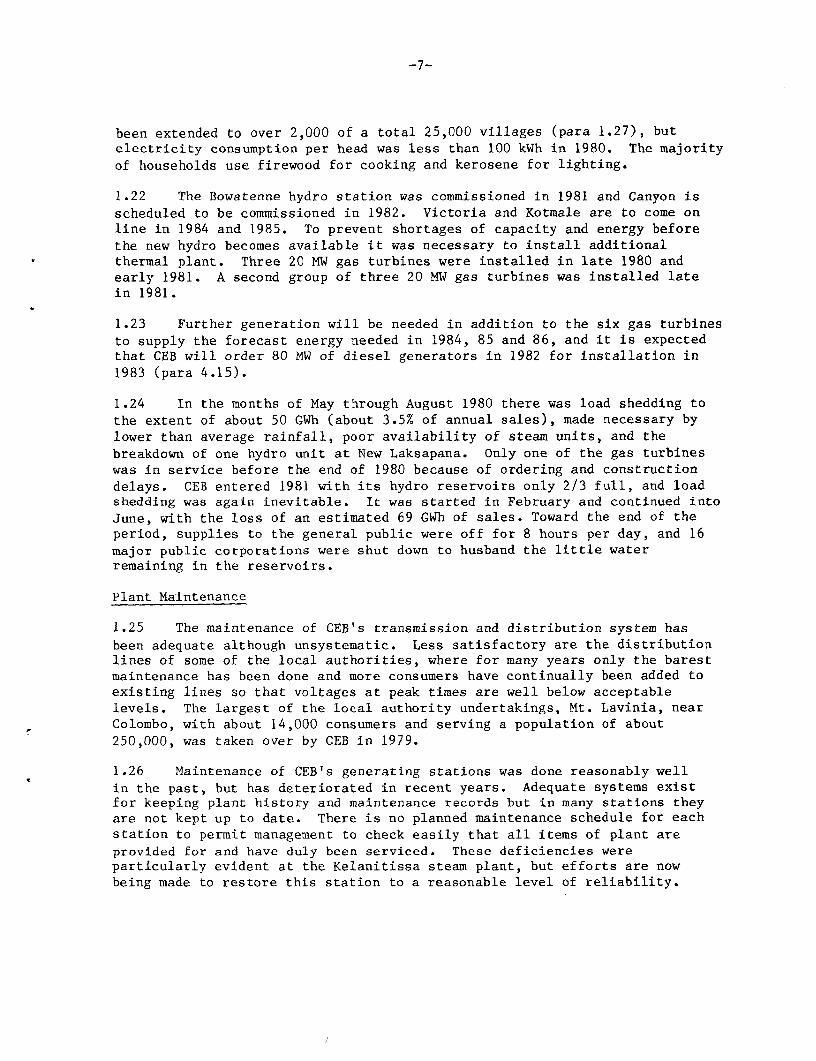
1.22 The Bowatenne hydro station was commissioned in 1981 and Canyon is
scheduled to be commissioned in 1982. Victoria and Kotmale are to come online in 1984 and 1985. To prevent shortages of capacity and energy beforethe new hydro becomes available it was necessary to install additionalthermal plant. Three 20 MW gas turbines were installed in late 1980 andearly 1981. A second group of three 20 MW gas turbines was installed latein 1981.
1.23 Further generation will be needed in addition to the six gas turbinesto supply the forecast energy needed in 1984, 85 and 86, and it is expectedthat CEB will order 80 MW of diesel generators in 1982 for installation in
1983 (para 4.15).
1.24 In the months of May through August 1980 there was load shedding tothe extent of about 50 GWh (about 3.5% of annual sales), made necessary bylower than average rainfall, poor availability of steam units, and thebreakdown of one hydro unit at New Laksapana. Only one of the gas turbineswas in service before the end of 1980 because of ordering and constructiondelays. CEB entered 1981 with its hydro reservoirs only 2/3 full, and loadshedding was again inevitable. It was started in February and continued intoJune, with the loss of an estimated 69 GWh of sales. Toward the end of theperiod, supplies to the general public were off for 8 hours per day, and 16major public corporations were shut down to husband the little waterremaining in the reservoirs.
Plant Maintenance
1.25 The maintenance of CEB's transmission and distribution system has
been adequate although unsystematic. Less satisfactory are the distributionlines of some of the local authorities, where for many years only the barestmaintenance has been done and more consumers have continually been added toexisting lines so that voltages at peak times are well below acceptablelevels. The largest of the local authority undertakings, Mt. Lavinia, nearColombo, with about 14,000 consumers and serving a population of about250,000, was taken over by CEB in 1979.
1.26 Maintenance of CEB's generating stations was done reasonably wellin the past, but has deteriorated in recent years. Adequate systems existfor keeping plant history and maintenance records but in many stations theyare not kept up to date. There is no planned maintenance schedule for eachstation to permit management to check easily that all items of plant are
provided for and have duly been serviced. These deficiencies wereparticularly evident at the Kelanitissa steam plant, but efforts are nowbeing made to restore this station to a reasonable level of reliability.
-8-
Rural Electrification
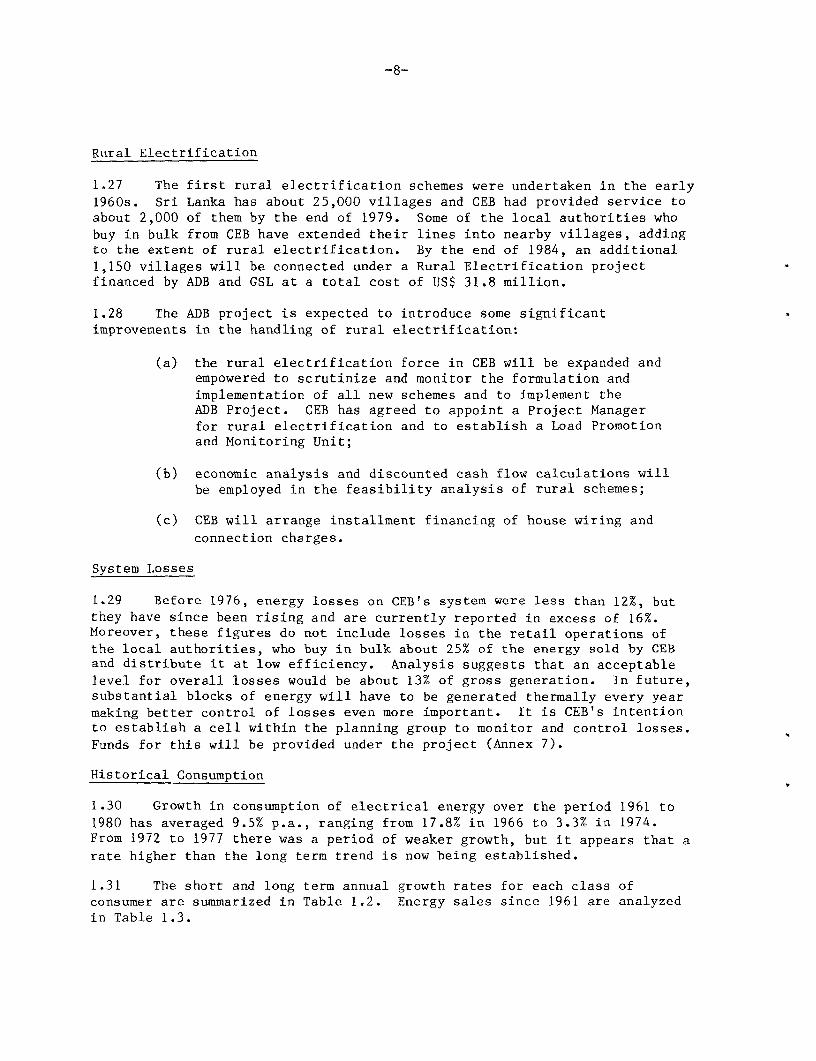
1.27 The first rural electrification schemes were undertaken in the early1960s. Sri Lanka has about 25,000 villages and CEB had provided service toabout 2,000 of them by the end of 1979. Some of the local authorities whobuy in bulk from CEB have extended their lines into nearby villages, addingto the extent of rural electrification. By the end of 1984, an additional1,150 villages will be connected under a Rural Electrification projectfinanced by ADB and GSL at a total cost of US$ 31.8 million.
1.28 The ADB project is expected to introduce some significantimprovements in the handling of rural electrification:
(a) the rural electrification force in CEB will be expanded andempowered to scrutinize and monitor the formulation andimplementation of all new schemes and to implement theADB Project. CEB has agreed to appoint a Project Managerfor rural electrification and to establish a Load Promotionand Monitoring Unit;
(b) economic analysis and discounted cash flow calculations willbe employed in the feasibility analysis of rural schemes;
(c) CEB will arrange installment financing of house wiring andconnection charges.
System Losses
1.29 Before 1976, energy losses on CEB's system were less than 12%, butthey have since been rising and are currently reported in excess of 16%.Moreover, these figures do not include losses in the retail operations ofthe local authorities, who buy in bulk about 25% of the energy sold by CEBand distribute it at low efficiency. Analysis suggests that an acceptablelevel for overall losses would be about 13% of gross generation. In future,substantial blocks of energy will have to be generated thermally every yearmaking better control of losses even more important. It is CEB's intentionto establish a cell within the planning group to monitor and control losses.Funds for this will be provided under the project (Annex 7).
Historical Consumption
1.30 Growth in consumption of electrical energy over the period 1961 to1980 has averaged 9.5% p.a., ranging from 17.8% in 1966 to 3.3% in 1974.From 1972 to 1977 there was a period of weaker growth, but it appears that arate higher than the long term trend is now being established.
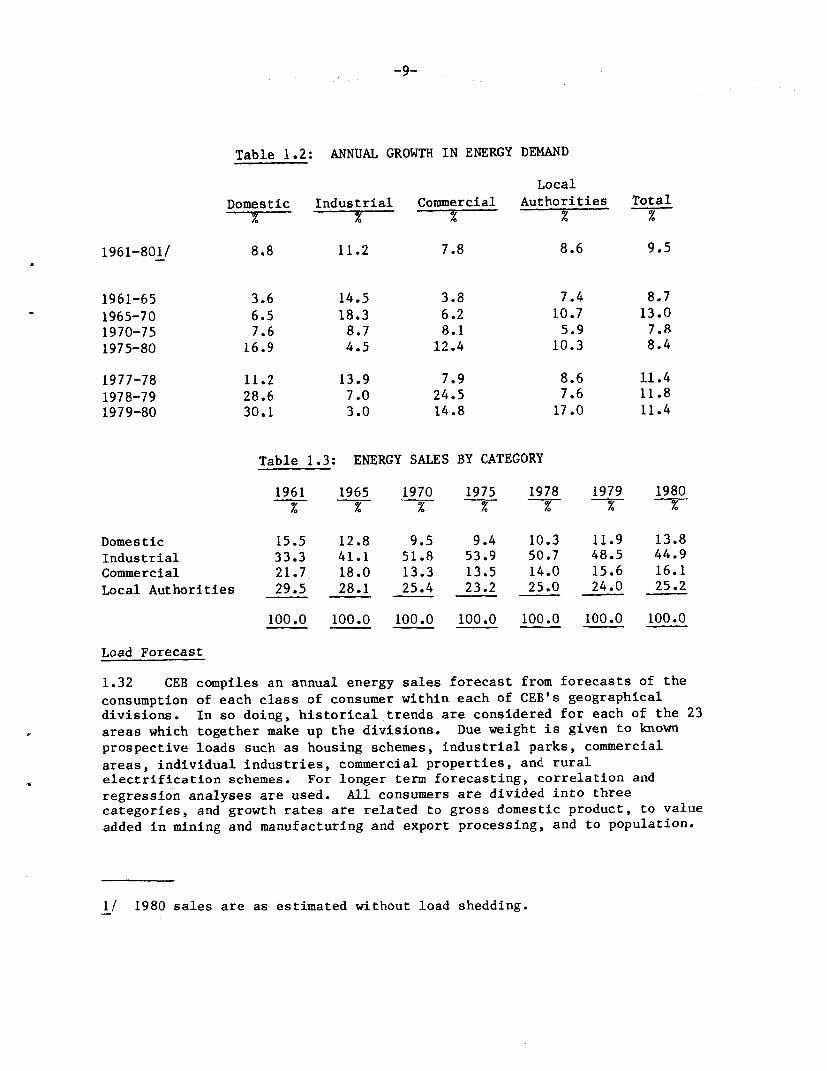
1.31 The short and long term annual growth rates for each class ofconsumer are summarized in Table 1.2. Energy sales since 1961 are analyzedin Table 1.3.
-9-
Table 1.2: ANNUAL GROWTH IN ENERGY DEMAND
LocalDomestic Industrial Commercial Authorities Total
1961-801/ 8.8 11.2 7.8 8.6 9.5
1961-65 3.6 14.5 3.8 7.4 8.71965-70 6.5 18.3 6.2 10.7 13.01970-75 7.6 8.7 8.1 5.9 7.81975-80 16.9 4.5 12.4 10.3 8.4
1977-78 11.2 13.9 7.9 8.6 11.41978-79 28.6 7.0 24.5 7.6 11.81979-80 30.1 3.0 14.8 17.0 11.4
Table 1.3: ENERGY SALES BY CATEGORY
1961 1965 1970 1975 1978 1979 1980
Domestic 15.5 12.8 9.5 9.4 10.3 11.9 13.8Industrial 33.3 41.1 51.8 53.9 50.7 48.5 44.9Commercial 21.7 18.0 13.3 13.5 14.0 15.6 16.1Local Authorities 29.5 28.1 25.4 23.2 25.0 24.0 25.2
100.0 100.0 100.0 100.0 100.0 100.0 100.0
Load Forecast
1.32 CEB compiles an annual energy sales forecast from forecasts of theconsumption of each class of consumer within each of CEB's geographicaldivisions. In so doing, historical trends are considered for each of the 23areas which together make up the divisions. Due weight is given to knownprospective loads such as housing schemes, industrial parks, commercialareas, individual industries, commercial properties, and ruralelectrification schemes. For longer term forecasting, correlation andregression analyses are used. All consumers are divided into threecategories, and growth rates are related to gross domestic product, to valueadded in mining and manufacturing and export processing, and to population.
1/ 1980 sales are as estimated without load shedding.
-10-
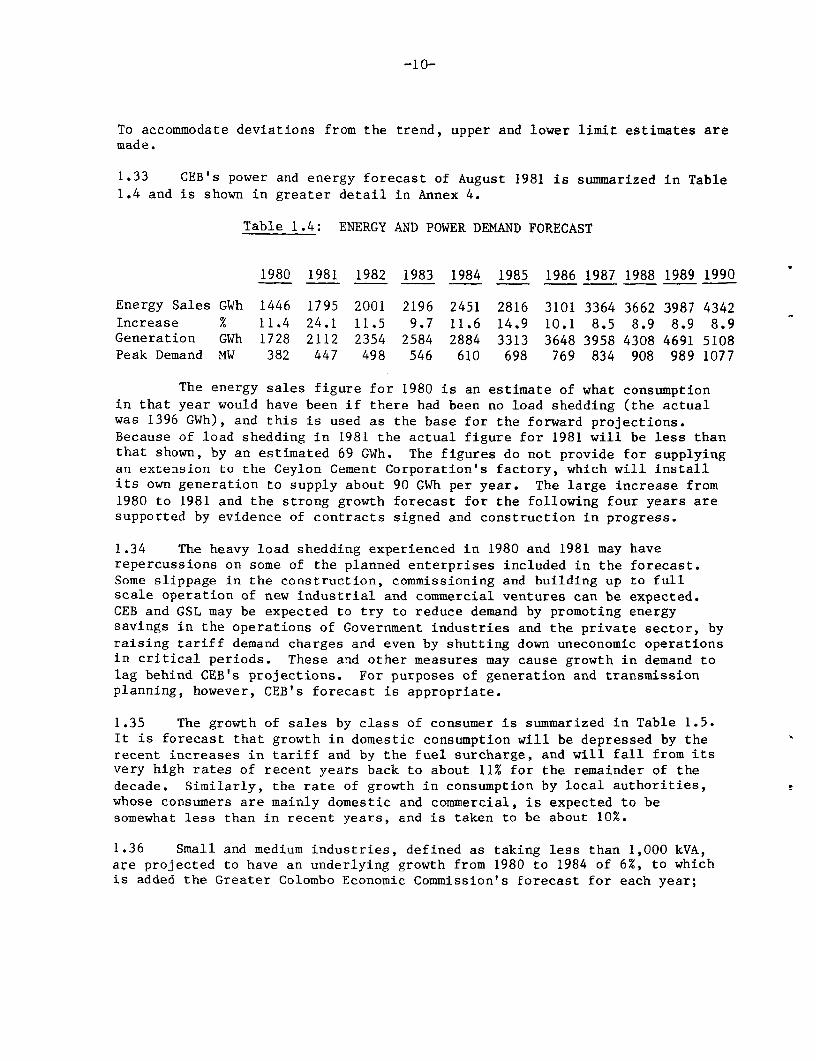
To accommodate deviations from the trend, upper and lower limit estimates aremade.
1.33 CEB's power and energy forecast of August 1981 is summarized in Table1.4 and is shown in greater detail in Annex 4.
Table 1.4: ENERGY AND POWER DEMAND FORECAST
1980 1981 1982 1983 1984 1985 1986 1987 1988 1989 1990
Energy Sales GWh 1446 1795 2001 2196 2451 2816 3101 3364 3662 3987 4342Increase % 11.4 24.1 11.5 9.7 11.6 14.9 10.1 8.5 8.9 8.9 8.9Generation GWh 1728 2112 2354 2584 2884 3313 3648 3958 4308 4691 5108Peak Demand MW 382 447 498 546 610 698 769 834 908 989 1077
The energy sales figure for 1980 is an estimate of what consumptionin that year would have been if there had been no load shedding (the actualwas 1396 GWh), and this is used as the base for the forward projections.Because of load shedding in 1981 the actual figure for 1981 will be less thanthat shown, by an estimated 69 GWh. The figures do not provide for supplyingan extension to the Ceylon Cement Corporation's factory, which will installits own generation to supply about 90 GWh per year. The large increase from1980 to 1981 and the strong growth forecast for the following four years aresupported by evidence of contracts signed and construction in progress.
1.34 The heavy load shedding experienced in 1980 and 1981 may haverepercussions on some of the planned enterprises included in the forecast.Some slippage in the construction, commissioning and building up to fullscale operation of new industrial and commercial ventures can be expected.CEB and GSL may be expected to try to reduce demand by promoting energysavings in the operations of Government industries and the private sector, byraising tariff demand charges and even by shutting down uneconomic operationsin critical periods. These and other measures may cause growth in demand tolag behind CEB's projections. For purposes of generation and transmissionplanning, however, CEB's forecast is appropriate.
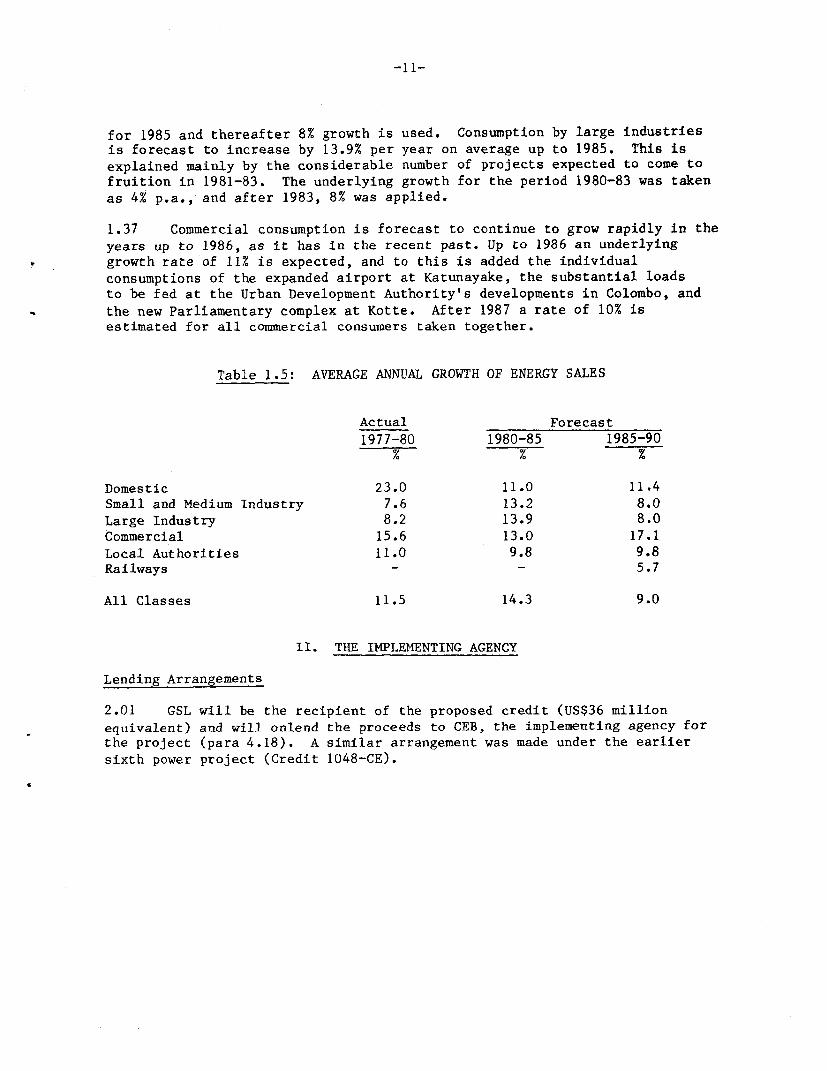
1.35 The growth of sales by class of consumer is summarized in Table 1.5.It is forecast that growth in domestic consumption will be depressed by therecent increases in tariff and by the fuel surcharge, and will fall from itsvery high rates of recent years back to about 11% for the remainder of thedecade. Similarly, the rate of growth in consumption by local authorities,whose consumers are mainly domestic and commercial, is expected to besomewhat less than in recent years, and is taken to be about 10%.
1.36 Small and medium industries, defined as taking less than 1,000 kVA,ave projected to have an underlying growth from 1980 to 1984 of 6%, to whichis added the Greater Colombo Economic Commission's forecast for each year;
-1 1-
for 1985 and thereafter 8% growth is used. Consumption by large industriesis forecast to increase by 13.9% per year on average up to 1985. This isexplained mainly by the considerable number of projects expected to come tofruition in 1981-83. The underlying growth for the period 1980-83 was takenas 4% p.a., and after 1983, 8% was applied.
1.37 Commercial consumption is forecast to continue to grow rapidly in theyears up to 1986, as it has in the recent past. Up to 1986 an underlyinggrowth rate of 11% is expected, and to this is added the individualconsumptions of the expanded airport at Katunayake, the substantial loadsto be fed at the Urban Development Authority's developments in Colombo, andthe new Parliamentary complex at Kotte. After 1987 a rate of 10% isestimated for all commercial consumers taken together.
Table 1.5: AVERAGE ANNUAL GROWTH OF ENERGY SALES
Actual Forecast1977-80 1980-85 1985-90
Domestic 23.0 11.0 11.4Small and Medium Industry 7.6 13.2 8.0Large Industry 8.2 13.9 8.0Commercial 15.6 13.0 17.1Local Authorities 11.0 9.8 9.8Railways - - 5.7
All Classes 11.5 14.3 9.0
II. THE IMPLEMENTING AGENCY
Lending Arrangements
2.01 GSL will be the recipient of the proposed credit (US$36 millionequivalent) and will onlend the proceeds to CEB, the implementing agency forthe project (para 4.18). A similar arrangement was made under the earliersixth power project (Credit 1048-CE).
-12-
Organization
2.02 CEB was established by the CEB Act, No. 17 of 1969 (1969 CEB Act)as the successor to the Department of Government Electrical Undertakings(DGEU) and is responsible for the development and coordination of thegeneration, supply and distribution of electrical energy in Sri Lanka. WhileCEB is a public corporation the 1969 CEB Act does not endow it with fullyautonomous powers and the government has reserved to itself a substantialrole in important policy matters and in particular tariffs, capitalinvestment, borrowing and the appointment of the Chairman and the GeneralManager. The conditions of service of all CEB staff are subject to GSLregulation. CEB is also subject to the provisions of the Finance Act, No.38 of 1971 (1971 Finance Act) which regulates the finances of all publiccorporations in Sri Lanka.
2.03 CEB is a corporate body governed by a seven-member Board; membersserve a five-year term and may be reappointed. Board members are appointedby GSL - four with experience in either engineering, commerce, administrationor accountancy, and the others representing local authorities, industry andthe Ministry of Finance - and may be removed at any time. The Chairman isappointed from amongst the Board members. The present Chairman is also theSecretary, Ministry of Power and Energy.
2.04 CEB's organization structure was designed by consultants, UrwickInternational Ltd., in the early 1970's under Loan 636-CE. While somemodifications have been made in recent years including the addition of twoposts of Additional General Manager, the original pattern is basicallyunchanged. Changes are now contemplated as part of the general managementimprovements now taking place in CEB (para 2.08). They would strengthen thedecentralization of CEB's operations while retaining key controls in Colombo.The assurance obtained under Credit 1048-CE that CEB will submit to IDA, inadvance, any proposal for major change to CEB's organizational structure isrepeated under the proposed project.
Management and Staffing
2.05 While the Chairman is responsible through the Board for policymatters and close liaison with government, the General Manager is CEB's ChiefExecutive Officer. He is responsible for the overall direction and controlof CEB's day-to-day business. The present General Manager was recentlypromoted to the post and is an experienced and long-serving engineer. He ispresently assisted by an Additional General Manager, four Deputy GeneralManagers and a Finance Manager. With the exception of the Finance Manager,who is not fully qualified in matters of finance but is a competent andlong-serving administration officer, all top management posts are filled byengineers. The Commercial and Personnel Managers, Chief Internal Auditor(vacant), and the Legal Officer all report directly to the General Manager.CEB's present senior management structure is set out in Annex 5. Below this
-13-
level, CEB operations are decentralized and are controlled at plant (forgeneration) and divisional level. Each of the seven operating divisions into
which Sri Lanka is organized is headed by a Divisional Manager, who is aqualified engineer; the divisions are further divided into areas which arethe primary units for systems maintenance, meter reading and consumerservices.
2.06 CEB has had considerable difficulty in retaining experienced staff inrecent years as many engineers and accountants have left for overseas orprivate sector posts offering substantially higher monetary rewards. Salary
differentials for senior CEB staff do not adequately reflect the heavyadditional responsibilities of such posts. The lack of experiencedengineering staff in the 30-45 year range is particularly noticeable at CEBwhile qualified or part-qualified accountants are now extremely difficult torecruit. These problems appear to be common to many public sectorenterprises in Sri Lanka. A number of key finance posts which were vacant atthe time of appraisal have since been filled.
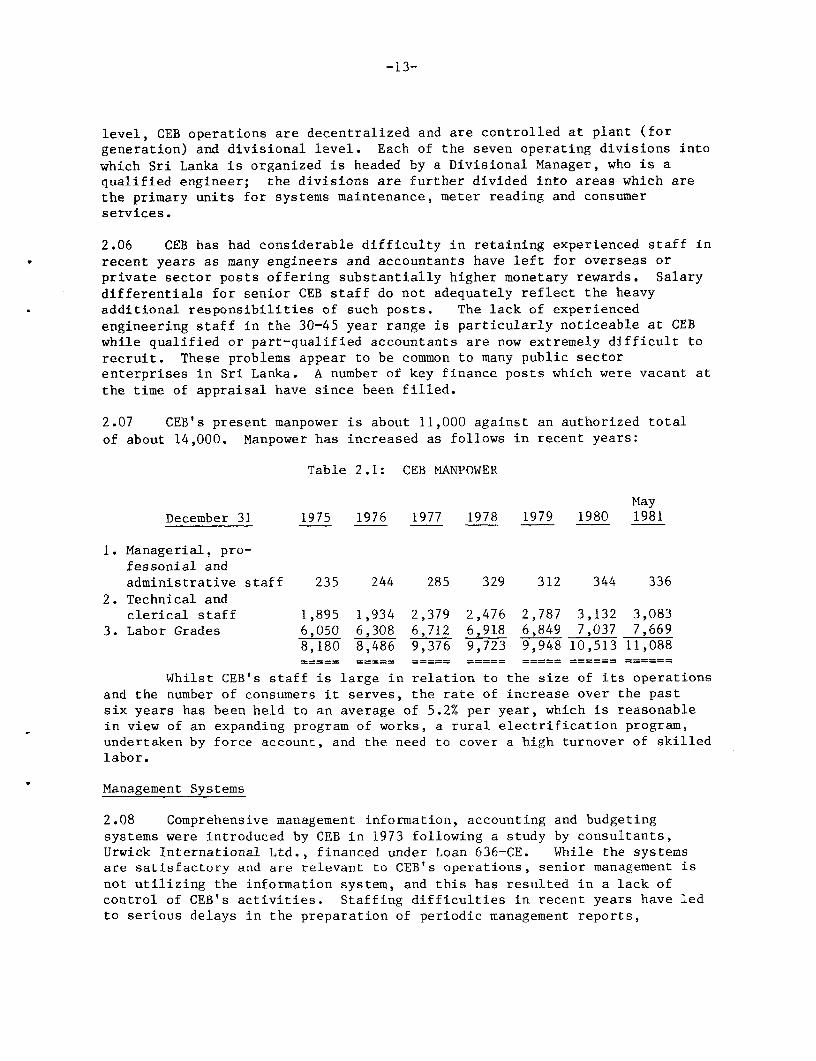
2.07 CEB's present manpower is about 11,000 against an authorized total
of about 14,000. Manpower has increased as follows in recent years:
Table 2.1: CEB MANPOWER
MayDecember 31 1975 1976 1977 1978 1979 1980 1981
1. Managerial, pro-fessonial andadministrative staff 235 244 285 329 312 344 336
2. Technical andclerical staff 1,895 1,934 2,379 2,476 2,787 3,132 3,083
3. Labor Grades 6,050 6,308 6,712 6,918 6,849 7,037 7,6698,180 8,486 9,376 9,723 9,948 10,513 11,088
Whilst CEB's staff is large in relation to the size of its operations
and the number of consumers it serves, the rate of increase over the pastsix years has been held to an average of 5.2% per year, which is reasonablein view of an expanding program of works, a rural electrification program,undertaken by force account, and the need to cover a high turnover of skilledlabor.
Management Systems
2.08 Comprehensive management information, accounting and budgetingsystems were introduced by CEB in 1973 following a study by consultants,Urwick International Ltd., financed under Loan 636-CE. While the systemsare satisfactory and are relevant to CEB's operations, senior management is
not utilizing the information system, and this has resulted in a lack ofcontrol of CEB's activities. Staffing difficulties in recent years have ledto serious delays in the preparation of periodic management reports,
-14-
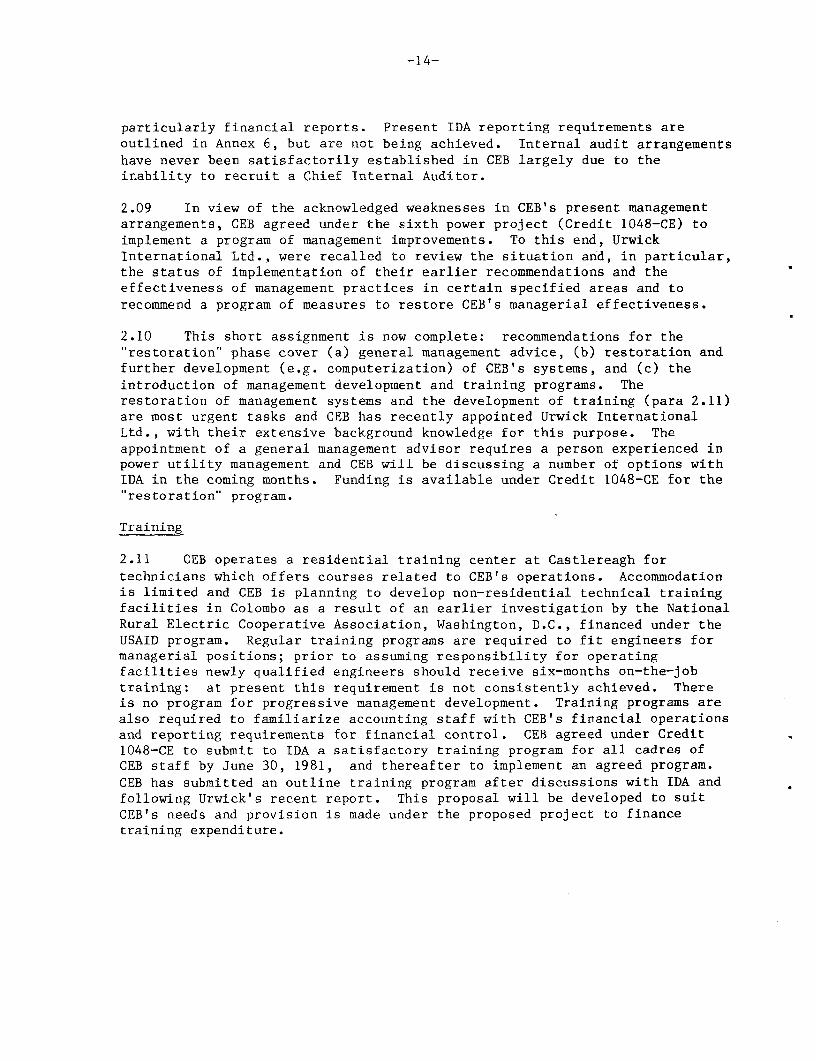
particularly financial reports. Present IDA reporting requirements areoutlined in Annex 6, but are not being achieved. Internal audit arrangementshave never been satisfactorily established in CEB largely due to theinability to recruit a Chief Internal Auditor.
2.09 In view of the acknowledged weaknesses in CEB's present managementarrangements, CEB agreed under the sixth power project (Credit 1048-CE) toimplement a program of management improvements. To this end, UrwickInternational Ltd., were recalled to review the situation and, in particular,the status of implementation of their earlier recommendations and theeffectiveness of management practices in certain specified areas and torecommend a program of measures to restore CEB's managerial effectiveness.
2.10 This short assignment is now complete: recommendations for the"restoration phase cover (a) general management advice, (b) restoration andfurther development (e.g. computerization) of CEB's systems, and (c) theintroduction of management development and training programs. Therestoration of management systems and the development of training (para 2.11)are most urgent tasks and CEB has recently appointed Urwick InternationalLtd., with their extensive background knowledge for this purpose. Theappointment of a general management advisor requires a person experienced inpower utility management and CEB will be discussing a number of options withIDA in the coming months. Funding is available under Credit 1048-CE for therestoration" program.
Training
2.11 CEB operates a residential training center at Castlereagh for
technicians which offers courses related to CEB's operations. Accommodationis limited and CEB is planning to develop non-residential technical trainingfacilities in Colombo as a result of an earlier investigation by the NationalRural Electric Cooperative Association, Washington, D.C., financed under theUSAID program. Regular training programs are required to fit engineers formanagerial positions; prior to assuming responsibility for operatingfacilities newly qualified engineers should receive six-months on-the-jobtraining: at present this requirement is not consistently achieved. Thereis no program for progressive management development. Training programs arealso required to familiarize accounting staff with CEB's financial operationsand reporting requirements for financial control. CEB agreed under Credit1048-CE to submit to IDA a satisfactory training program for all cadres ofCEB staff by June 30, 1981, and thereafter to implement an agreed program.CEB has submitted an outline training program after discussions with IDA andfollowing Urwick's recent report. This proposal will be developed to suitCEB's needs and provision is made under the proposed project to financetraining expenditure.
-15-
Local Authority Distribution Systems
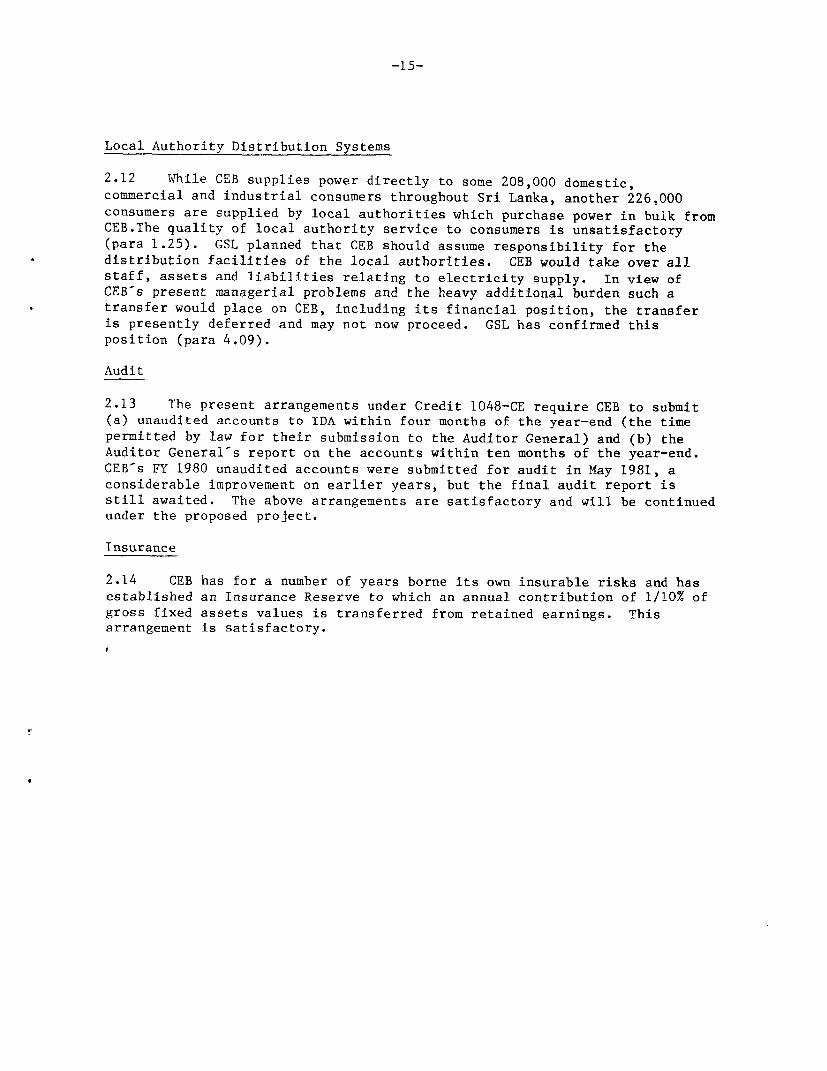
2.12 While CEB supplies power directly to some 208,000 domestic,commercial and industrial consumers throughout Sri Lanka, another 226,000consumers are supplied by local authorities which purchase power in bulk fromCEB.The quality of local authority service to consumers is unsatisfactory(para 1.25). GSL planned that CEB should assume responsibility for thedistribution facilities of the local authorities. CEB would take over allstaff, assets and liabilities relating to electricity supply. In view ofCEB's present managerial problems and the heavy additional burden such atransfer would place on CEB, including its financial position, the transferis presently deferred and may not now proceed. GSL has confirmed thisposition (para 4.09).
Audit
2.13 The present arrangements under Credit 1048-CE require CEB to submit(a) unaudited accounts to IDA within four months of the year-end (the timepermitted by law for their submission to the Auditor General) and (b) theAuditor Generals report on the accounts within ten months of the year-end.CEB-s FY 1980 unaudited accounts were submitted for audit in May 1981, aconsiderable improvement on earlier years, but the final audit report isstill awaited. The above arrangements are satisfactory and will be continuedunder the proposed project.
Insurance
2.14 CEB has for a number of years borne its own insurable risks and hasestablished an Insurance Reserve to which an annual contribution of 1/10% ofgross fixed assets values is transferred from retained earnings. Thisarrangement is satisfactory.
-1.6-
III. THE PROJECT
Objectives
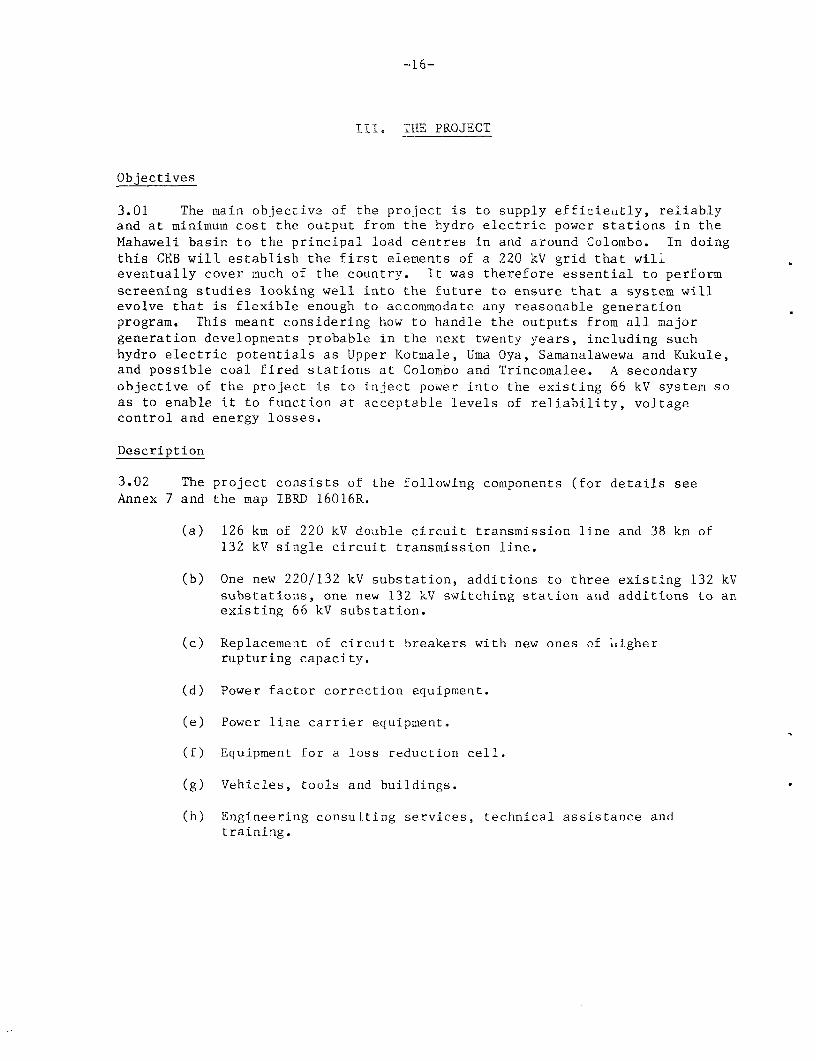
3.01 The main objective of the project is to supply efficieLitly, reliablyand at minimum cost the output from the hydro electric power stations in theMahaweli basin to the principal load centres in and around Colombo. In doingthis CEB will establish the first elements of a 220 kV grid that willeventually cover much of the country. It was therefore essential to performscreening studies looking well into the future to ensure that a system willevolve that is flexible enough to accommodate any reasonable generationprogram. This meant considering how to handle the outputs from all majorgeneration developments probable in the next twenty years, including suchhydro electric potentials as Upper Kotmale, Uma Oya, Samanalawewa and Kukule,and possible coal fired stations at Colombo and Trincomalee. A secondaryobjective of the project is to inject power into the existing 66 kV system soas to enable it to function at acceptable levels of reliability, voltagecontrol and energy losses.
Description
3.02 The project consists of the following components (for details seeAnnex 7 and the map IBRD 16016R.
(a) 126 km of 220 kV doable circuit transmission line and 38 km of132 kV single circuit transmission line.
(b) One new 220/132 kV substation, additions to three existing 132 kVsubstations, one new 132 kV switching station and additions to anexisting 66 kV substation.
(c) Replacement of circuit breakers with new ones of higherrupturing capacity.
(d) Power factor correction equipment.
(e) Power line carrier equipment.
(f) Equipment for a loss reduction cell.
(g) Vehicles, tools and buildings.
(h) Engineering consulting services, technical assistance andtraining.
-17-
Project Cost
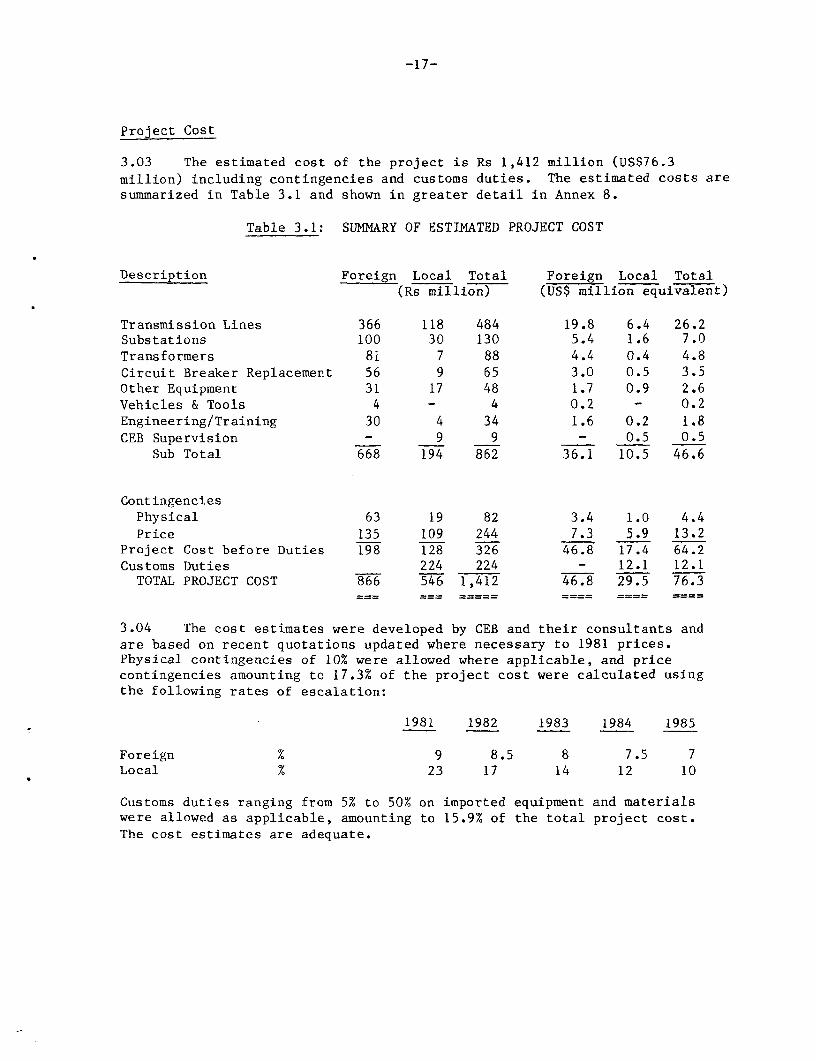
3.03 The estimated cost of the project is Rs 1,412 million (US$76.3million) including contingencies and customs duties. The estimated costs aresummarized in Table 3.1 and shown in greater detail in Annex 8.
Table 3.1: SUMMARY OF ESTIMATED PROJECT COST
Description Foreign Local Total Foreign Local Total(Rs million) (US$ million equivalent)
Transmission Lines 366 118 484 19.8 6.4 26.2Substations 100 30 130 5.4 1.6 7.0Transformers 81 7 88 4.4 0.4 4.8Circuit Breaker Replacement 56 9 65 3.0 0.5 3.5Other Equipment 31 17 48 1.7 0.9 2.6Vehicles & Tools 4 - 4 0.2 - 0.2Engineering/Training 30 4 34 1.6 0.2 1.8CEB Supervision - 9 9 - 0.5 0.5
Sub Total 668 194 862 36.1 10.5 46.6
ContingenciesPhysical 63 19 82 3.4 1.0 4.4Price 135 109 244 7.3 5.9 13.2
Project Cost before Duties 198 128 326 46.8 17.4 64.2Customs Duties 224 224 - 12.1 12.1TOTAL PROJECT COST 866 546 1,412 46.8 29.5 76.3
3.04 The cost estimates were developed by CEB and their consultants andare based on recent quotations updated where necessary to 1981 prices.Physical contingencies of 10% were allowed where applicable, and pricecontingencies amounting to 17.3% of the project cost were calculated usingthe following rates of escalation:
1981 1982 1983 1984 1985
Foreign % 9 8.5 8 7.5 7Local % 23 17 14 12 10
Customs duties ranging from 5% to 50% on imported equipment and materialswere allowed as applicable, amounting to 15.9% of the total project cost.The cost estimates are adequate.
-18-
Project Financing Plan
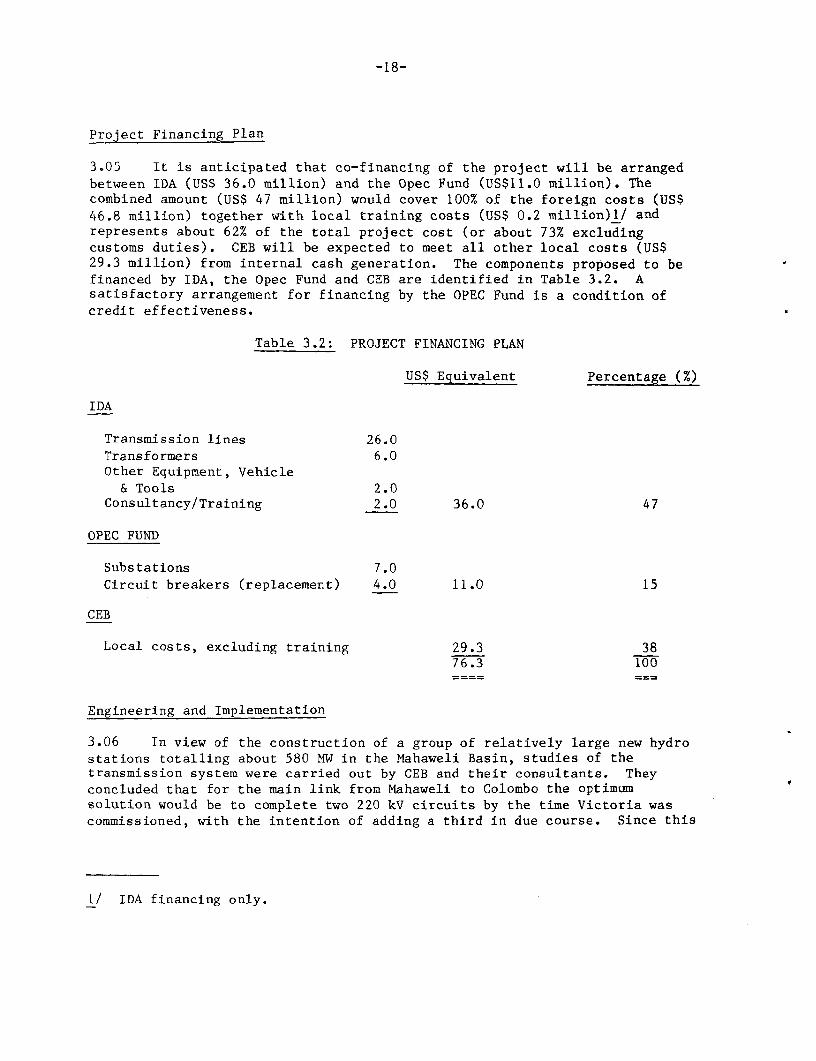
3.05 It is anticipated that co-financing of the project will be arrangedbetween IDA (US$ 36.0 million) and the Opec Fund (US$11.0 million). Thecombined amount (US$ 47 million) would cover 100% of the foreign costs (US$46.8 million) together with local training costs (US$ 0.2 million)1/ andrepresents about 62% of the total project cost (or about 73% excludingcustoms duties). CEB will be expected to meet all other local costs (US$29.3 million) from internal cash generation. The components proposed to befinanced by IDA, the Opec Fund and CEB are identified in Table 3.2. Asatisfactory arrangement for financing by the OPEC Fund is a condition ofcredit effectiveness.
Table 3.2: PROJECT FINANCING PLAN
US$ Equivalent Percentage (%)
IDA
Transmission lines 26.0Transformers 6.0Other Equipment, Vehicle& Tools 2.0
Consultancy/Training 2.0 36.0 47
OPEC FUND
Substations 7.0Circuit breakers (replacement) 4.0 11.0 15
CEB
Local costs, excluding training 29.3 3876.3 100
Engineering and Implementation
3.06 In view of the construction of a group of relatively large new hydrostations totalling about 580 MW in the Mahaweli Basin, studies of thetransmission system were carried out by CEB and their consultants. Theyconcluded that for the main link from Mahaweli to Colombo the optimumsolution would be to complete two 220 kV circuits by the time Victoria wascommissioned, with the intention of adding a third in due course. Since this
1/ IDA financing only.
-19-
voltage had not previously been used in the country, they decided to employconsultants for this project, and engaged the firm which had already starteddesigning the 220 kV substation at Victoria and the line from there toKotmale. The cost of engineering for the lines and substations as far asevaluation of tenders is being financed from Credit 1048-CE. The balance ofthe consulting work comprising detailed design, contract supervision,inspection and testing, and supervision of construction will be financed fromthe proposed Credit. The contract provides for about 140 man months offoreign engineers' services at an average man-month cost (including fees,international travel, subsistence, allowances, and reimbursable foreign
costs) of US$ 9,300.
3.07 The specification of the 220 kV lines will be essentially thatdeveloped for the line from Victoria to Kotmale, while the 132 kV lines willfollow CEB's established practice. The areas through which the lines willpass have been surveyed by helicopter and then visited on land, andprovisonal routes chosen. As soon as the contract is awarded the contractorwill perform check surveys. It is expected that tenders will have beenreceived and evaluated by end-March 1982.
3.08 The project will be constructed between September 1982 and slay 1984(Annex 9). Completion by this date is necessary to permit the firstgenerator in Victoria to come on line as scheduled in mid-1984.
Procurement
3.09 The main part of the project will be constructed under the followingcontracts:
(a) A single responsibility contract for the 220 kV and 132 kVlines.
(b) A single responsibility contract for the new 220 kV substation,the new 132 kV switching station, and the modifications tothe existing 132 kV and 66 kV substations; this contractwill include the supply and installation of the reactivecompensation equipment, and the installation (but not thesupply) of the power transformers and the power line carrierequipment.
(c) A supply contract for the power transformers.
(d) A supply contract for the circuit breaker replacements.
(e) A supply contract for the power line carrier equipment.
3.10 International competitive bidding in accordance with IDA's guidelineswill be employed for the major contracts. Vehicles, equipment and materials
-20-
3.10 International competitive bidding in accordance with IDA's guidelineswill be employed for the major contracts. Vehicles, equipment and materialsnot exceeding US$15,000 per item and US$150,000 in aggregate may be procuredin accordance with local procedures, which are satisfactory. For materialsand equipment tendered internationally, the standard domestic preference of15% on the c.i.f. price, or the prevailing duty, whichever is less, will beapplied in bid evaluation.
Disbursements
3.11 The Credit will be disbursed against the following items:
(a) 100% of the foreign expenditures for 220 kV and 132 kVtransmission lines.
(b) 100% of foreign expenditures for directly imported items, or100% of the local expenditure (ex-factory) for locallymanufactured items, or 65% for locally procured items(equipment and materials for power transformers, power linecarrier, loss reduction program, and vehicles and tools).
(c) 100% of foreign expenditures on engineering consultants.
(d) 100% of expenditures on technical assistance and 100% oftraining.
A schedule of estimated disbursements is provided in Annex 10. It isconsistent with the proposed implementation period for the project (para3.08) and provides for about 90% disbursements by project completion. Theproposed credit would be fully disbursed by June 1985, some 3 1/2 years fromproject approval. Similar recent Bank Group projects have been disbursedover about 4 1/2 years, but CEB is confident that it can complete the projectin a shorter period.
Land Acquisition
3.12 No problems are foreseen. The site for the Biyagama substation hasto be acquired but no difficulty is expected as the land is owned by GSL.Wayleaves for transmission lines are routinely acquired without difficulty.
Risks
3.13 The project consists of normal electric utility work entailing nounusual risks and no particular difficulty is foreseen in its execution.Price contingencies in the estimate have been allocated to minimise the riskof cost overruns.
-21-
IV. FINANCIAL ANALYSIS
CEB's Statutory Position
4.01 CEB's finances are regulated by the provisions of the 1969 CEB Actand the 1971 Finance Act, which affects all public corporations in Sri Lanka.CEB is required, by Section 38 of the 1969 CEB Act, to operate in acommercial manner so as to ensure that revenues are sufficient to meet alloutgoings, including depreciation and interest, and a reasonable proportionof development costs. CEB's statutory obligations were amended in twoimportant respects following IDA approval of Credits 372-CE and 1048-CE. 1/in 1973:
(a) CEB is permitted to charge depreciation in its accounts basedon a current valuation of fixed assets rather than the historiccost of such assets.
(b) CEB's obligation to pay an 8% annual dividend on GSL's equitycapital is waived each year until CEB has generated cashequivalent to a 30% contribution to the combined annualcapital expenditure on electricity supply, including interestduring construction, of CEB and any other body responsiblefor undertaking a joint scheme with CEB.
Past Financial Performance
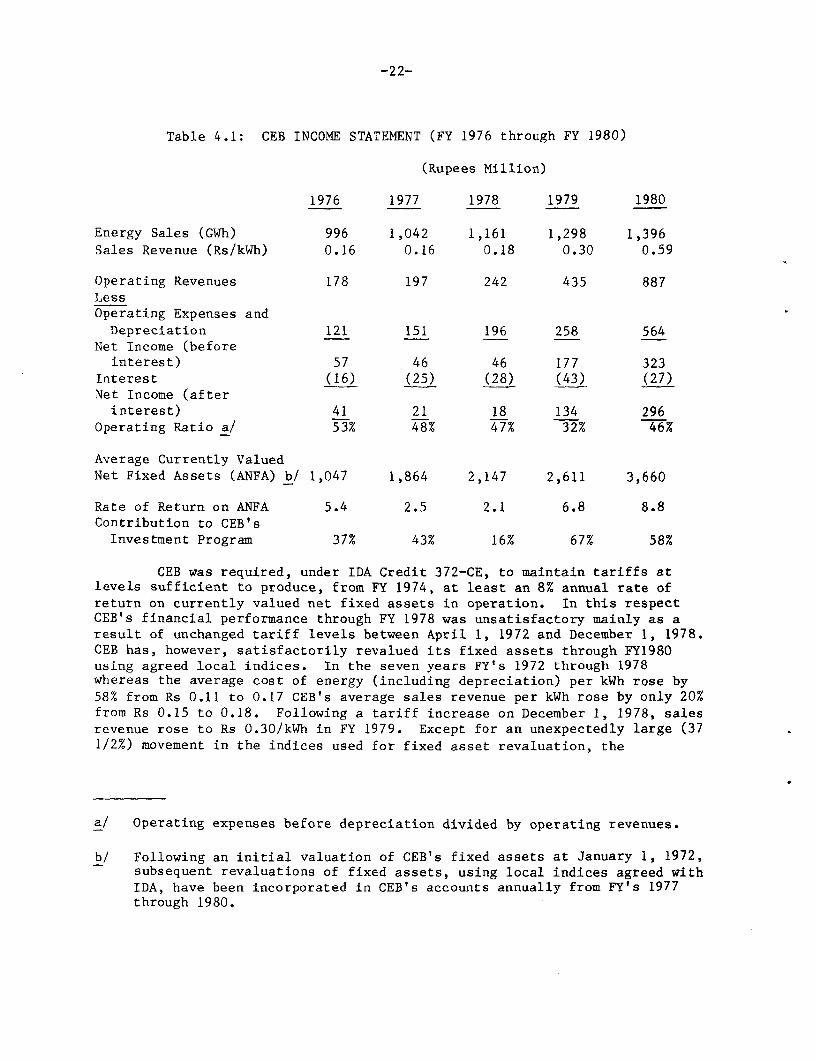
4.02 CEB's actual financial operations for the five years to FY 1980 aresummarized in Table 4.1 below and are shown in greater detail in Annex 11.
1/ These conditions are repeated under the proposed Credit.
-22-
Table 4.1: CEB INCOME STATEMENT (FY 1976 through FY 1980)
(Rupees Million)
1976 1977 1978 1979 1980
Energy Sales (GWh) 996 1,042 1,161 1,298 1,396Sales Revenue (Rs/kWh) 0.16 0.16 0.18 0.30 0.59
Operating Revenues 178 197 242 435 887LessOperating Expenses andDepreciation 121 151 196 258 564
Net Income (beforeinterest) 57 46 46 177 323
Interest (16) (25) (28) (43) (27)Net Income (afterinterest) 41 21 18 134 296
Operating Ratio a/ 53% 48% 47% 32% 46%
Average Currently ValuedNet Fixed Assets (ANFA) b/ 1,047 1,864 2,147 2,611 3,660
Rate of Return on ANFA 5.4 2.5 2.1 6.8 8.8Contribution to CEB'sInvestment Program 37% 43% 16% 67% 58%
CEB was required, under IDA Credit 372-CE, to maintain tariffs atlevels sufficient to produce, from FY 1974, at least an 8% annual rate ofreturn on currently valued net fixed assets in operation. In this respectCEB's financial performance through FY 1978 was unsatisfactory mainly as aresult of unchanged tariff levels between April 1, 1972 and December 1, 1978.CEB has, however, satisfactorily revalued its fixed assets through FY1980using agreed local indices. In the seven years FY's 1972 through 1978whereas the average cost of energy (including depreciation) per kWh rose by58% from Rs 0.11 to 0.17 CEB's average sales revenue per kWh rose by only 20%from Rs 0.15 to 0.18. Following a tariff increase on December 1, 1978, salesrevenue rose to Rs 0.30/kWh in FY 1979. Except for an unexpectedly large (371/2%) movement in the indices used for fixed asset revaluation, the
a/ Operating expenses before depreciation divided by operating revenues.
b/ Following an initial valuation of CEB's fixed assets at January 1, 1972,subsequent revaluations of fixed assets, using local indices agreed withIDA, have been incorporated in CEB's accounts annually from FY's 1977through 1980.
-23-
covenanted 8% rate of return would have been achieved, the actual being about7%. Operating expenses increased in FY 1979 by about 32%, much less thanbudgetted, bringing the average energy cost to Rs 0.20/kWh.
Present Financial Position
4.03 In order to achieve the 8% rate of return required by IDA, CEB was
required to make a further tariff increase as a condition of effectiveness ofCredit 1048-CE. From October 1, 1980, GSL authorized CEB (a) to increasetariffs from an average Rs 0.30 to Rs 0.58/kWh and (b) to introduce a revisedfuel adjustment surcharge on all consumers so as to recover automatically themonthly fuel cost of thermal generation (para 4.11). Following theserevisions CEB's rate of return on revalued assets in FY 1980 was about 9% andis estimated at about 11% in FY 1981. This constitutes a very satisfactoryturnaround of CEB's finances since FY 1978.
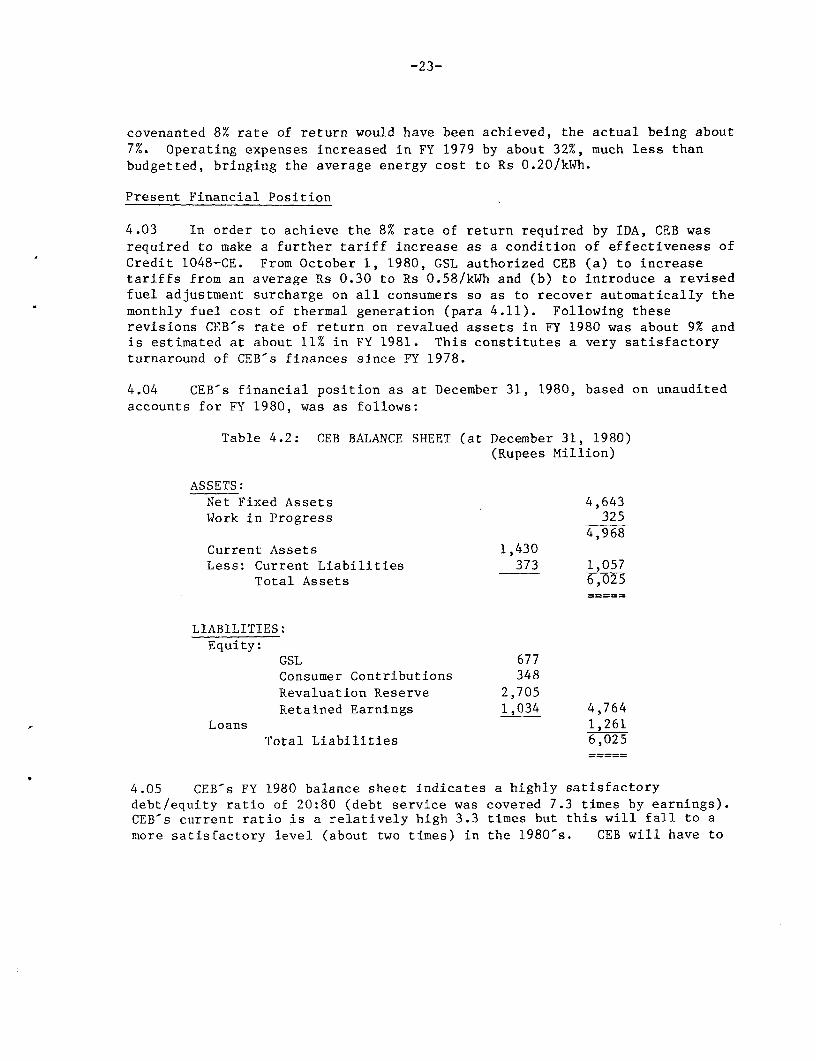
4.04 CEB's financial position as at December 31, 1980, based on unauditedaccounts for FY 1980, was as follows:
Table 4.2: CEB BALANCE SHEET (at December 31, 1980)(Rupees Million)
ASSETS:Net Fixed Assets 4,643Work in Progress 325
4,968Current Assets 1,430Less: Current Liabilities 373 1,057
Total Assets 6,025
LIABILITIES:Equity:
GSL 677Consumer Contributions 348Revaluation Reserve 2,705Retained Earnings 1,034 4,764
Loans 1,261Total Liabilities 6,025
4.05 CEB's FY 1980 balance sheet indicates a highly satisfactorydebt/equity ratio of 20:80 (debt service was covered 7.3 times by earnings).CEB's current ratio is a relatively high 3.3 times but this will fall to amore satisfactory level (about two times) in the 1980's. CEB will have to
-24-
maintain a tight control over the level of consumer receivables (paras 4.06 -
4.10) and inventories.l/
Billing and Collection
4.06 CEB's billing and collection performance has been reasonablysatisfactory in recent years. Under Credit 1048-CE, CEB's customerreceivables on the last day of each month should not exceed the aggregatebillings for the three months ending on the same day and this requirementis repeated under the proposed project. CEB has made considerable effortsto meet this target: the position at December 31, 1980 indicates receivablesequivalent to 3.2 months billings compared to 3.6 months billings at end FY1978. As CEB's revenues have quadrupled in this short period the presentreceivables position represents a commendable performance by CEB staff.
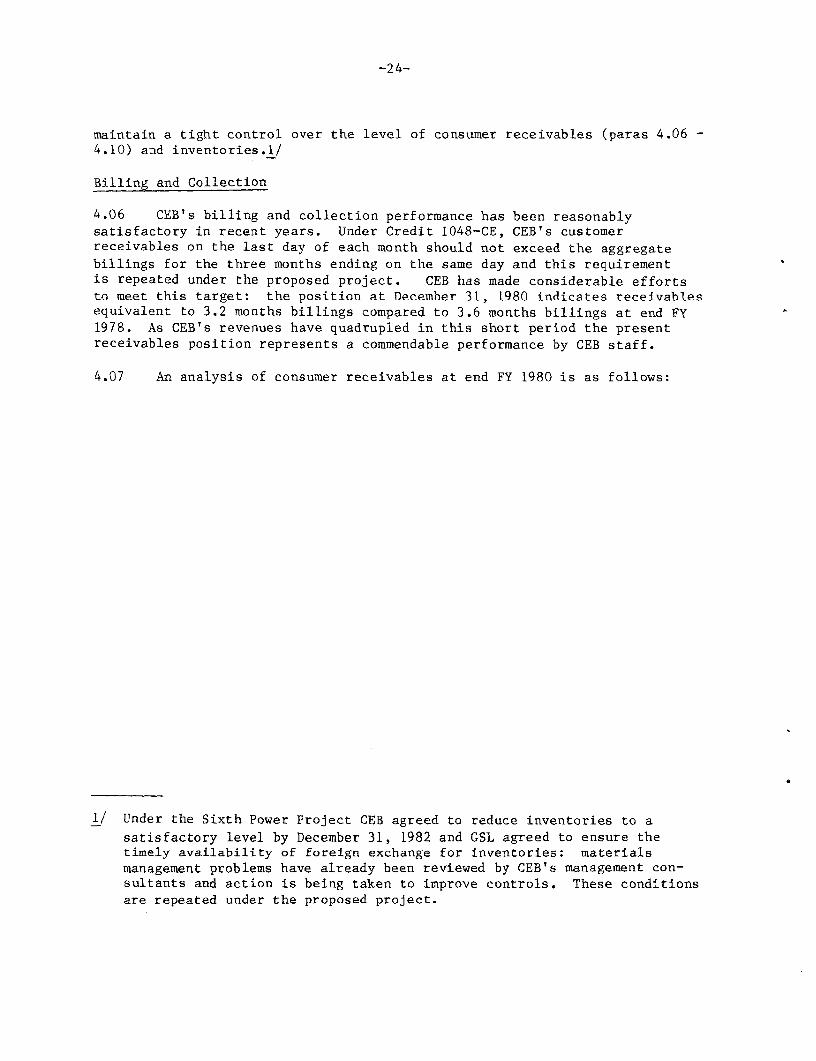
4.07 An analysis of consumer receivables at end FY 1980 is as follows:
1/ Under the Sixth Power Project CEB agreed to reduce inventories to a
satisfactory level by December 31, 1982 and GSL agreed to ensure thetimely availability of foreign exchange for inventories: materialsmanagement problems have already been reviewed by CEB's management con-sultants and action is being taken to improve controls. These conditionsare repeated under the proposed project.
-25-
Table 4.3: ANALYSIS OF CONSUMER RECEIVABLES (at December 31, 1980)
Consumer Large ConsumersCategory a/ (over 50 kVA) Other Consumers Total
No. % % No. % % No. % %months Bill- Receiv- months Bill- Receiv- months Bill- Receiv-out- ings ables out- ings ables out- ings ablesstand- stand- stand-ing ing ing
Private 2.3 24 18 3.7 25 28 3.1 49 46
PublicCorporations 2.7 39 32 - - - 2.7 39 32
Government 3.1 6 6 14.7 1 3 4.1 7 9LocalAuthorities- General 8.0 4 10 9.6 - - 8.8 4 10
- StreetLighting 16.2 1 3 - - - 16.2 1 3
Total 3.0 74 69 4.1 26 31 3.2 100 100
4.08 CEB has a separate unit to handle large consumers' accounts, whichare maintained on a manual system. The above table indicates that CEB ismaintaining a tight credit control over most large consumers, the exceptionbeing the 218 local authorities which CEB supplies in bulk and for streetlighting. In the first three months of 1981 CEB managed to reduce localauthority arrears by some Rs 6.5 million to about Rs 30 million, equivalentto some 7 months billings but the position is still unsatisfactory.
4.09 GSL agreed, under Credit 1048-CE to ensure the timely payment offuture amounts owed by the local authorities to CEB together with arrears inaccordance with an agreed program. At that time GSL was proposing totransfer the local authority systems to CEB and this led to a deteriorationin the local authority arrears position. Arrears would have been settled as
a part of the transfer arrangements. The transfer has now been abandoned.
a/ Local authority billings are at pre-December 1978 tariffs by agreement
between GSL and CEB. GSL is billed separately in respect of the tariffsincreases, including the fuel surcharge, since December 1, 1978: the
billings and receivables on this account are not included under theGovernment sector in this table but are shown under a separate debtor's
account (paragraph 4.09).
-26-
An assurance was obtained, therefore, at negotiations that, from October 1,1981, the local authorities will pay the current CEB tariffs for bulksupplies and introduce retail tariffs which are sufficient to cover CEB'sbulk supply charges and the local authorities distribution costs. PresentlyGSL is responsible for payment of increases in the local authority bulksupply tariffs since December 1, 1978, but to date has made payments to CEBonly up to March 31, 1981. Arrangements are in progress to settle theremaining amount and the payment to CEB of the amount outstanding atSeptember 30, 1981 is a condition of credit effectiveness.
4.10 The bulk of CEB's billings are of relatively small amounts and aremaintained on computer. They constitute some 25% of CEB's billings byamount. Over 50% of such monthly accounts are for less than Rs 15. Thedifficulty of recruiting satisfactory meter readers poses a continuingserious problem for CEB and leads to some delays in billing and problems incollection. CEB is striving for improved performance in this sector.
Revenues and Tariffs
4.11 The details of CEB's recent tariff structure are set out in Annex12. CEB's tariffs were unchanged between April 1972 and December 1978 butsince then two tariff increases have been made which have increased CEB'saverage tariff by about 260% from Rs 0.16 to 0.58/kWh (about 3 US cents).l/In addition to raising tariff levels in recent years, which has enabled it tomeet financial rate of return criteria, CEB has also made some structuralimprovements to its tariffs. Domestic consumers now pay higher block tariffsand non-domestic tariffs have been rationalized. Further, from October 1,1980, CEB is recovering automatically the cost of fuel needed for CEB'sincreasing thermal generation by way of a surcharge on consumers' monthlybills. The first 200 units of domestic consumption (equivalent to a maximumcharge of US$ 5) are exempt from the surcharge and this exempts over 90% ofdomestic consumers.
4.12 CEB agreed under Credit 1048-CE to carry out a study of long runmarginal cost (LRMC) pricing with technical assistance from the Bank. Thisstudy should have been completed by December 31 1980 but staffingconstraints in particular have led to delay and it was agreed to extend thedeadline by one year to December 31, 1981. Preliminary results of the studywere submitted at negotiations but further refinements are needed for theresults to be useful for tariff restructuring. The study is now beingrevised and CEB gave an assurance during negotiations to implement anyrecommendations agreed after consultation with GSL and IDA.
1/ with the addition of the fuel surcharge this was equivalent to about -6 US cents/kwh. in 1981.
-27-
4.13 An assurance was obtained at negotiations that CEB will continue,as previously, to review tariffs annually, before the start of each financialyear to ensure that revenues are sufficient to meet operating expenses,including fuel and depreciation, and to produce at least an 8% rate of returnon currently valued net fixed assets. While the presently agreed rate ofreturn is 8%, in FY 1982 CEB will have to increase tariffs by about 50%,(equivalent to a 12% rate of return) in order to generate sufficient internalresources to meet the local costs of its approved investment program through1985. This increase in tariffs is a condition of credit effectiveness. InFYs 1982 and 1983 such tariffs would produce a before-tax rate of return of16% (para 4.16). From FY 1985 onwards further tariff increases will berequired to enable CEB at least to maintain the covenanted 8% rate of return:the amount of such increases will depend to a great extent upon the size ofCEB's future investment program.
Transfer of Assets from MASL
4.14 The 1969 Act authorizes CEB to enter into "joint schemes" with otheragencies for the generation of electricity. The Act does not detail thearrangements for the transfer and operation of assets created under suchschemes. Subsequently, under Credit 372-CE, GSL agreed to ensure that CEB issufficiently involved on the formulation of all future joint schemes, andthat the power assets are transferred on completion to CEB on termssatisfactory to IDA. This was done in the case of the 38 MW Ukuwela hydrostation constructed under the Mahaweli Ganga Stage I (para 1.11(g)). Most ofthe hydro-power development in the 1980's in Sri Lanka will be carried outunder the Accelerated Mahaweli Program. CEB is not required to contribute tothe costs of these schemes during the construction phase but ownership willbe transferred to CEB on their completion. The need for adequateco-ordination between CEB and in the design and construction of thesefacilities was discussed in the context of the Sixth Power Project and againduring negotiations for the proposed project. CEB is not represented on theMASL Board and such representation would require legislation. However,technical co-ordination between the two agencies is now satisfactory. GSLagreed during negotiations to ensure proper future co-ordination between CEBand any other agency involved in a joint scheme. Futhermore, in view of themajor impact that the Victoria and Kotmale assets will have on CEB-sfinances, GSL and CEB have agreed a satisfactory provisional basis for thetransfer of these assets.
Financing Plan (FYs 1981-85)
4.15 CEB's presently approved investment program through FY 1985,comprises the ongoing ADB-assisted Bowatenne, Canyon and RuralElectrification projects, the IDA-assisted sixth (transmission anddistribution) and proposed seventh (Mahaweli transmission) projects, varioussmall system augmentation works and the installation of a second 60 MW of gasturbines in FY 1982. GSL confirmed at negotiations that it has recently
-28-
agreed to the inclusion of an 80 MW diesel project in CEB's investmentprogram (para 1.23) and to contribute Rs 800 million in the form of Equitytowards the cost of such a project. Furthermore, GSL has approached IDA forfinancial assistance towards the foreign costs of the project.
4.16 CEB has not, in past years, been liable to pay income tax. However,from April 1981 the basis of annual depreciation allowances used in thecomputation of tax liability has been changed. In future CEB will beentitled to claim a 12 1/2% depreciation allowance on newly commissionedassets over an eight year period as compared to the previous 100% allowancein the first year. Consequently, it is estimated that CEB may incur a taxliability totalling Rs 665 million in FY-s 1982/83 but thereafter thetransfer of major hydro-stations will create tax losses to be carried forwardto subsequent years. CEB is also liable to a Turnover Tax of 2% of itssales revenues, including those in respect of the recovery of fuel costs.
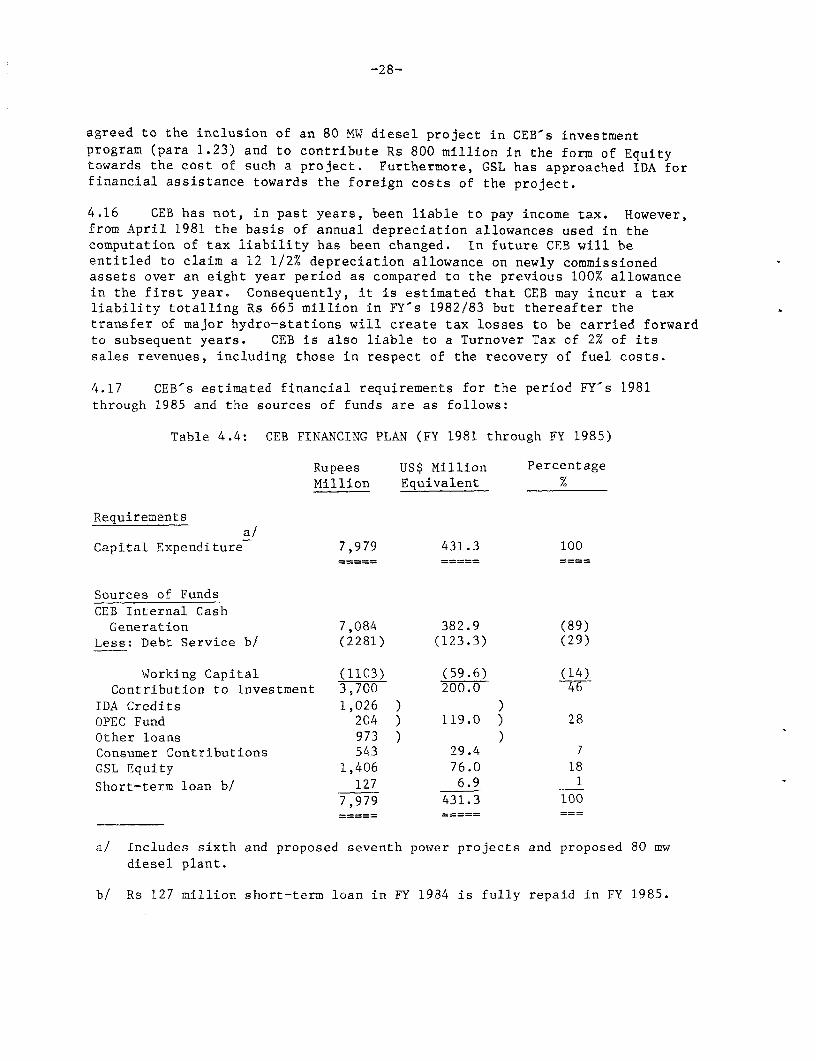
4.17 CEB's estimated financial requirements for the period FY's 1981through 1985 and the sources of funds are as follows:
Table 4.4: CEB FINANCING PLAN (FY 1981 through FY 1985)
Rupees US$ Million PercentageMillion Equivalent %
Requirementsa/
Capital Expenditure 7,979 431.3 100
Sources of FundsCEB Internal CashGeneration 7,084 382.9 (89)
Less: Debt Service b/ (2281) (123.3) (29)
Working Capital (1103) (59.6) (14)Contribution to Investment 3,700 200.0 46
IDA Credits 1,026 ) )OPEC Fund 204 ) 119.0 ) 28Other loans 973 ) )Consumer Contributions 543 29.4 7GSL Equity 1,406 76.0 18
Short-term loan bJ 127 6.9 17,979 431.3 100
a/ Includes sixth and proposed seventh power projects and proposed 80 mwdiesel plant.
b/ Rs 127 million short-term loan in FY 1984 is fully repaid in FY 1985.
- 29 -
4.18 The proceeds of the IDA credit of US$36 million will be madeavailable to CEB by GSL at 12% interest for a 20 year period with 3 yearsgrace. 1/ GSL will bear any foreign exchange risk in accordance with the1969 CEB Act. The execution of an onlending agreement satisfactory to IDA isa condition of credit effectiveness.
4.19 To protect its future financial viability, CEB has agreed previouslynot to incur any long-term debt without IDA's prior agreement unless itsmaximum future debt service is covered at least 1.25 times by its most recent12 months operating surplus before depreciation. This condition is repeatedunder the proposed Credit.
Future Finances
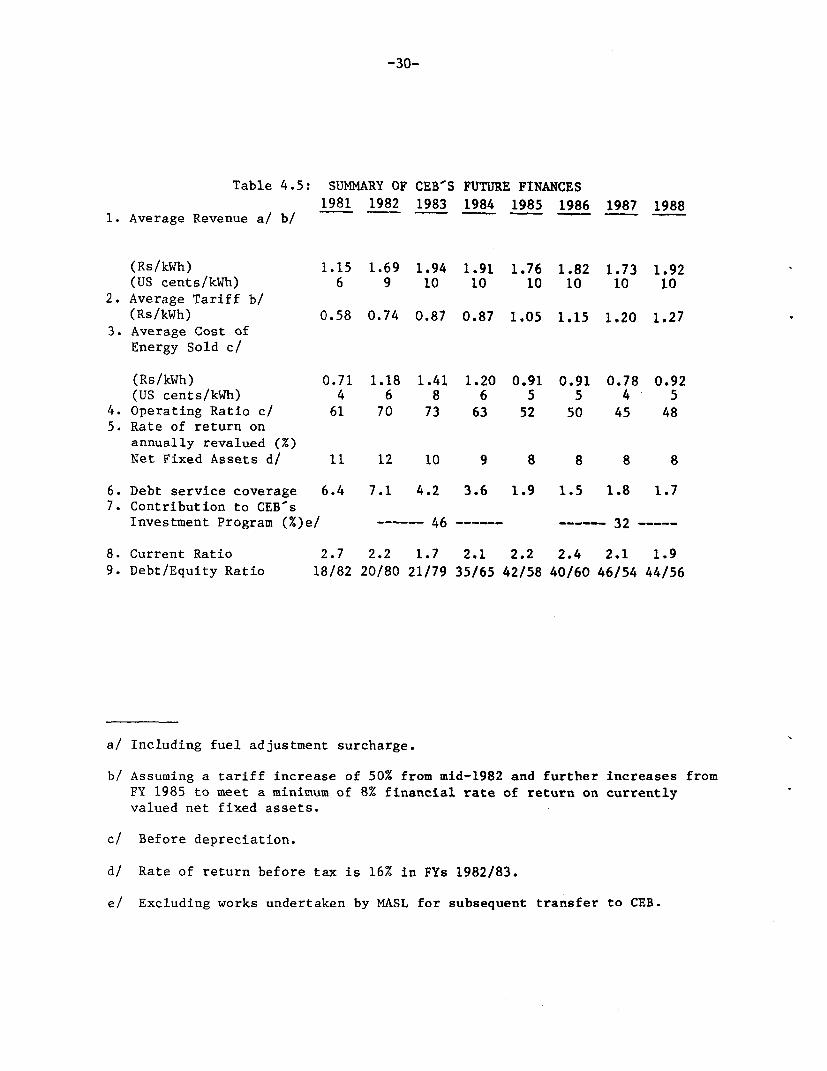
4.20 Financial projections for the period FY 1979 through FY 1988 are setout in Annexes 13-16. Assumptions used to prepare the projections are setout in Annex 17. Salient features of CEB's future finances, which aresatisfactory, are summarized in Table 4.5. The fluctuation in CEB's averagerevenue in future years (table 4.5, line 1) results from the operation of thepresent fuel adjustment clause. As part of the tariff review now beingundertaken (paras. 4.11-4.13) base fuel costs will be included in the basictariff to prevent fluctuations in consumer bills from month to month.
1/ CEB's commercial borrowing is negligible and loans are obtained towardsforeign and local expenditures from GSL whose present lending rate is10%. Inflation in Sri Lanka was, 1978-9%, 1979-16%, 1980-24%, and isforecast at 1981-23%, 1982-17%, 1983-14%.
-30-
Table 4.5: SUMMARY OF CEB'S FUTURE FINANCES
1981 1982 1983 1984 1985 1986 1987 19881. Average Revenue a/ b/
(Rs/kWh) 1.15 1.69 1.94 1.91 1.76 1.82 1.73 1.92(US cents/kWh) 6 9 10 10 10 10 10 10
2. Average Tariff b/(Rs/kWh) 0.58 0.74 0.87 0.87 1.05 1.15 1.20 1.27
3. Average Cost ofEnergy Sold c/
(Rs/kWh) 0.71 1.18 1.41 1.20 0.91 0.91 0.78 0.92(US cents/kWh) 4 6 8 6 5 5 4 5
4. Operating Ratio c/ 61 70 73 63 52 50 45 485. Rate of return on
annually revalued (%)Net Fixed Assets d/ 11 12 10 9 8 8 8 8
6. Debt service coverage 6.4 7.1 4.2 3.6 1.9 1.5 1.8 1.77. Contribution to CEB-s
Investment Program (%)e/ ---- 46 -- ----- 32…
8. Current Ratio 2.7 2.2 1.7 2.1 2.2 2.4 2.1 1.9
9. Debt/Equity Ratio 18/82 20/80 21/79 35/65 42/58 40/60 46/54 44/56
a/ Including fuel adjustment surcharge.
b/ Assuming a tariff increase of 50% from mid-1982 and further increases fromFY 1985 to meet a minimum of 8% financial rate of return on currentlyvalued net fixed assets.
c/ Before depreciation.
d/ Rate of return before tax is 16% in FYs 1982/83.
e/ Excluding works undertaken by MASL for subsequent transfer to CEB.
-31-
V. JUSTIFICATION
Approach
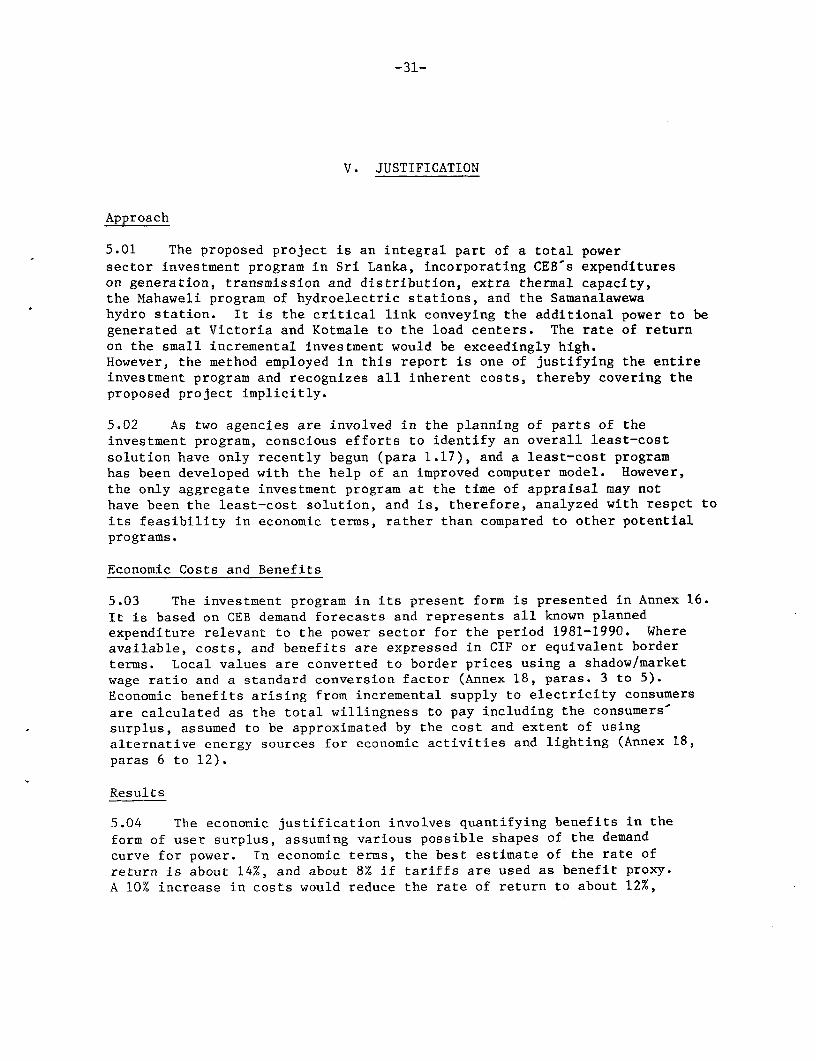
5.01 The proposed project is an integral part of a total power
sector investment program in Sri Lanka, incorporating CEB's expenditureson generation, transmission and distribution, extra thermal capacity,the Mahaweli program of hydroelectric stations, and the Samanalawewahydro station. It is the critical link conveying the additional power to begenerated at Victoria and Kotmale to the load centers. The rate of returnon the small incremental investment would be exceedingly high.However, the method employed in this report is one of justifying the entireinvestment program and recognizes all inherent costs, thereby covering theproposed project implicitly.
5.02 As two agencies are involved in the planning of parts of theinvestment program, conscious efforts to identify an overall least-cost
solution have only recently begun (para 1.17), and a least-cost programhas been developed with the help of an improved computer model. However,the only aggregate investment program at the time of appraisal may nothave been the least-cost solution, and is, therefore, analyzed with respct toits feasibility in economic terms, rather than compared to other potentialprograms.
Economic Costs and Benefits
5.03 The investment program in its present form is presented in Annex 16.It is based on CEB demand forecasts and represents all known plannedexpenditure relevant to the power sector for the period 1981-1990. Whereavailable, costs, and benefits are expressed in CIF or equivalent borderterms. Local values are converted to border prices using a shadow/marketwage ratio and a standard conversion factor (Annex 18, paras. 3 to 5).Economic benefits arising from incremental supply to electricity consumers
are calculated as the total willingness to pay including the consumers'surplus, assumed to be approximated by the cost and extent of usingalternative energy sources for economic activities and lighting (Annex 18,paras 6 to 12).
Results
5.04 The economic justification involves quantifying benefits in theform of user surplus, assuming various possible shapes of the demandcurve for power. In economic terms, the best estimate of the rate ofreturn is about 14%, and about 8% if tariffs are used as benefit proxy.A 10% increase in costs would reduce the rate of return to about 12%,
-32-
while a 10% decrease in costs would boost it to about 16%. If a real fuelprice increase of 3% p.a. is assumed, the rate of return with consumer surplusis reduced to about 12%, with tariff revenue as benefit proxy to about4% (Annex 18). The investment program in its aggregate form isjustified in economic terms if a conservative estimate of consumer surplusis used as part of the benefit. Given the large build-up of generatingcapacity in the next years, tariff revenue appears to be somewhat inadequateto recover the full cost (including headworks) of the program.
Tariffs and Marginal Cost
5.05 The average revenue for CEB (including fuel surcharge) is expectedto approach Rs 2.00/kWh in 1983 (table 4.5). Present preliminary estimatesof long-run marginal cost for the system range between Rs 1.80/kWh andRs 2.50/ kWh, depending on voltage level and consumer characteristics. Amore detailed study of the structure of long-run maginal cost is underpreparation and is expected to be completed by January 1982: a first draftis being finalized by CEB with Bank Group assistance. At present, itappears likely that average revenue will be approaching marginal cost by1983.
VI. AGREEMENTS TO BE REACHED AND RECOMMENDATION
Agreements during Negotiations
6.01 Satisfactory agreements were reached with GSL/CEB during negotiationswith regard to:
(a) the preparation and submission by December 31, 1982, andthereafter annually, of a long-term power development plan(para 1.18)
(b) modifications to CEB's organizational structure (para 2.04)
(c) implementation of CEB's training program (para 2.11)
(d) audit of CEB-s accounts (para 2.13)
(e) restriction of dividend payments by CEB and charge ofdepreciation on revalued assets (para 4.01)
(f) control of CEB's inventory levels and the provision of foreignexchange by GSL for inventories (para 4.05)
-33-
(g) CEB's consumer receivables not to exceed three months' billings(para 4.06)
(h) timely payment by GSL's local authorities of CEB's bulk supplycharges and adequate local authority retail tariffs (para 4.09)
(i) improvements to CEB's tariff structure (para 4.12)
(j) rate of return on CEB's currently valued net fixed assets(para 4.13)
(k) arrangements for GSL co-ordination of Joint Schemes (para 4.14)
(1) CEB's debt service coverage (para 4.19)
Conditions of Effectiveness
6.02 The following will be required prior to Credit effectiveness
(a) satisfactory arrangements for OPEC co-financing. (para 3.05);
(b) GSL's payment to CEB of outstanding arrears in respect ofits local authorities (para 4.09); and
(c) a tariff increase averaging about 50% (para 4.13);
(d) conclusion of a satisfactory onlending agreement for theproposed Credit (para 4.18).
Recommendation
6.03 Subject to agreement on the above matters the proposed project issuitable for an IDA credit of US$36 million equivalent.
SRI LANKA
SEVENTH (MAHAWELI TRANSMISSION) POWER PROJECT
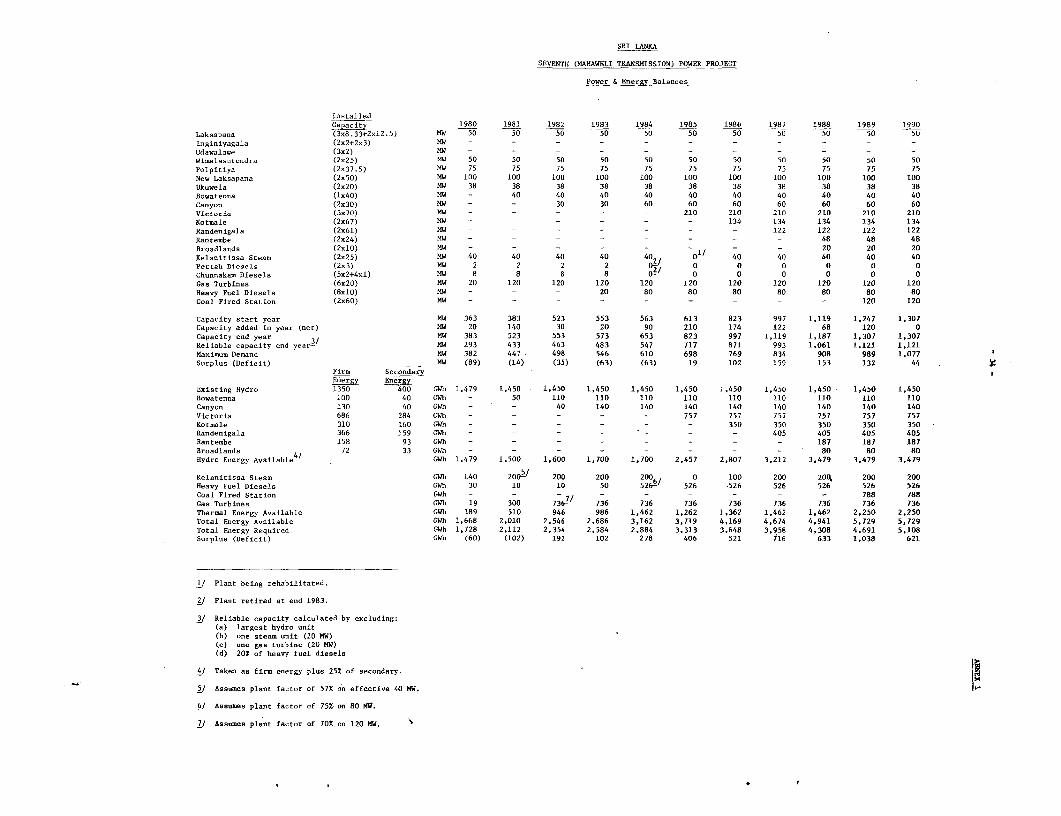
Power & Energy Balances
InstalledCapacity 1980 1981 1982 1983 1984 1985 1986 1987 1988 1989 1990
Laksapana (3x8.33+2x12.5) MW 50 50 50 50 50 50 50 50 50 50 50Inginiyagala (2x2+2x3) MW - - - - - - - - -Udawalawe (3x2) MW - - - - - - - - - -Wimalaaurendra (2x25) MW 50 50 50 50 50 50 50 50 50 50 50Polpitlya (2x37.5) MW 75 75 75 75 75 75 75 75 75 75 75New Laksapana (2x50) MW 100 100 100 100 100 100 100 100 100 100 100Ukuwela (2x20) MW 38 38 38 38 38 38 38 38 38 38 38Bowatenna (1s40) MW - 40 40 40 40 40 40 40 40 40 40Canyon (2x30) MW - - 30 30 60 60 60 60 60 60 60Victeria (3x70) MW - - - - - 210 210 210 210 210 210
Cotmale (2x67) MW - - - - - 134 134 134 134 134
Randenigala (2
x61) MW - - - - - - - 122 122 122 122Rantembe (
2x24) MW - - - - - - - - 48 48 48
Broadlands (2x10) MW - - - - - - - - 20 20 20Kelanitissa Steam (2x25) MW 40 40 40 40 40 0°/ 40 40 40 40 40Pettabh Diesal (2x3) MW 2 2 2 2 0 0 0 0 0 0Chunnakam Diesels (5x2+4xl) MW 8 8 8 8 0 / 0 0 0 0 0 0
Gas Turbines (6x20) MW 20 120 120 120 120 120 120 120 120 120 120Heavy Fuel Diesels (810) MW - - - 20 80 80 80 80 80 80 80Coal Fired Station (2x60) MW - - - - - - - - - 120 120
Capacity start year MW 363 383 523 553 563 613 823 997 1.119 1.247 1,307Capacity added in year (net) MW 20 140 30 20 90 210 174 122 68 120 0
Capacity end year 3/ MW 383 523 553 573 653 823 997 1,119 1.187 1,307 1,307Reliable capacity end y- MW 293 433 463 483 547 717 871 993 1.061 1.121 1,121Maxims Demand MW 382 447 498 546 610 698 769 834 908 989 1.077Surplus (Deficit) MW (89) (14) (35) (63) (63) 19 102 159 153 132 44
Firm SecondaryEnergy Energy
Existing Hydro 1350 400 GWh 1,479 1,450 1,450 1,450 1,450 1,450 1,450 1,450 1,450 1,450 1,450Bowatenna 100 40 GWh - 50 110 110 110 110 110 110 110 110 110Canyon 130 40 GWh - - 40 140 140 140 140 140 140 140 140Victoria 686 284 GWh - - - - - 757 757 757 757 757 757
Kotmal 310 160 GWh - - - - - 350 350 350 350 350Randenigala 366 159 GWh - - - - - - - 405 405 405 405Rantembe 158 93 GWh - - - - - - - - 187 187 187Broadlands 4/ 72 33 GWh - - - - - - - - 80 80 80
Hydro Energy Available GWh 1,479 1.500 1,600 1.700 1,700 2,457 2.807 3,212 3,479 3,479 3,479
Kelanitissa Steam GWh 140 200 / 200 200 200 0 100 200 209, 200 200Heavy FPel Diesels GWh 30 10 10 50 526 526 526 526 526 526 526
Coal Fired Station 1Wh - 7/ - 7 - - - - 788 788Gas Turbines GWb 19 300 736 736 736 736 736 736 736 736 736Thermal Energy Available GWh 189 510 946 986 1,462 1,262 1,362 1,462 1.462 2,250 2.250Total Energy Available GWh 1,668 2,010 2,546 2,686 3.162 3.719 4,169 4,674 4.941 5,729 5,729Total Energy Required GWh 1,728 2,112 2,354 2,584 2,884 3,313 3,648 3.958 4,308 4.691 5,108Surplas (Deficit) GWh (60) (102) 192 102 278 406 521 716 633 1,038 621
1/ Plant being rehabilitated.
2/ Plant retired at end 1983.
3/ Reliable capacity calculated by excluding:(a) largest hydro unit(b) one steam unit (20 MW)(c) one gas turbine (20 MW)(d) 20% of heavy foel diesels
4/ Taken as firm energy plus 25% of secondary.
5/ Assumes plant factor of 57% on effective 40 MW,
6/ Assumes plant factor of 75% on 80 MY.
7/ Assumes plant factor of 70% on 120 MW. s
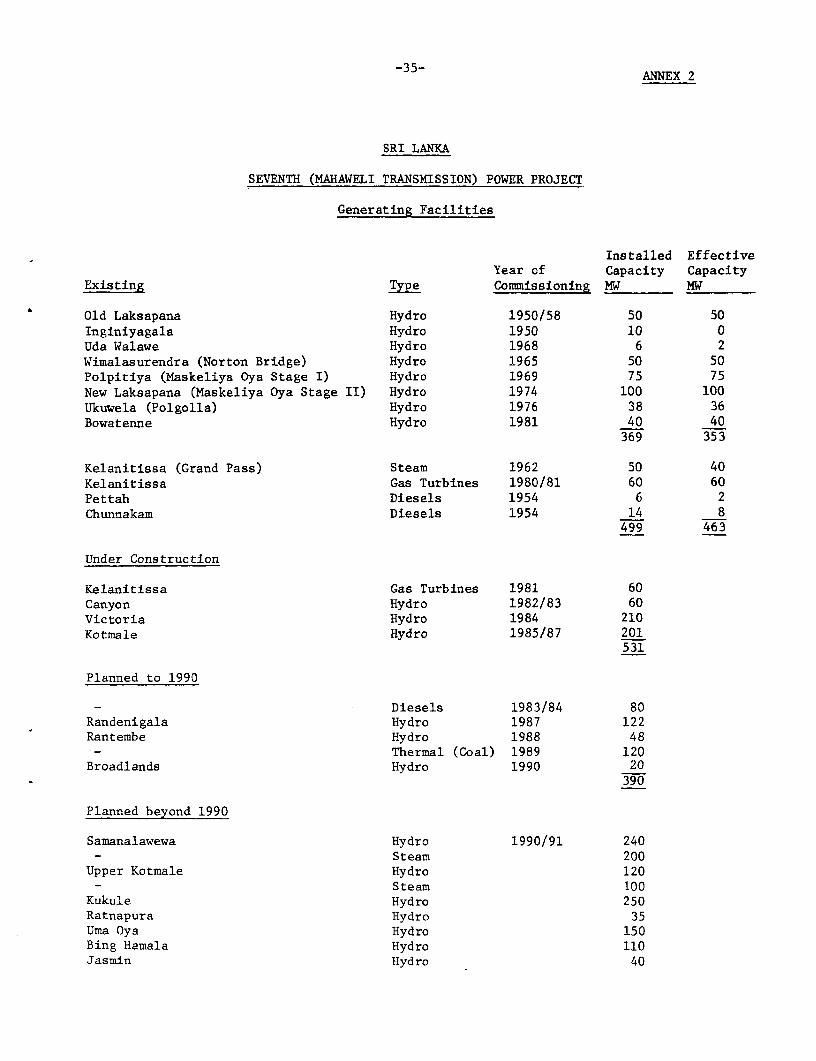
-35- ANNEX 2
SRI LANKA
SEVENTH (MAHAWELI TRANSMISSION) POWER PROJECT
Generating Facilities
Installed EffectiveYear of Capacity Capacity
Existing Type Commissioning MW MW
Old Laksapana Hydro 1950/58 50 50Inginiyagala Hydro 1950 10 0Uda Walawe Hydro 1968 6 2Wimalasurendra (Norton Bridge) Hydro 1965 50 50Polpitiya (Maskeliya Oya Stage I) Hydro 1969 75 75New Laksapana (Maskeliya Oya Stage II) Hydro 1974 100 100Ukuwela (Polgolla) Hydro 1976 38 36Bowatenne Hydro 1981 40 40
369 353
Kelanitissa (Grand Pass) Steam 1962 50 40Kelanitissa Gas Turbines 1980/81 60 60Pettah Diesels 1954 6 2Chunnakam Diesels 1954 14 8
499 463
Under Construction
Kelanitissa Gas Turbines 1981 60Canyon Hydro 1982/83 60Victoria Hydro 1984 210Kotmale Hydro 1985/87 201
531
Planned to 1990
Diesels 1983/84 80Randenigala Hydro 1987 122Rantembe Hydro 1988 48
Thermal (Coal) 1989 120Broadlands Hydro 1990 20
390
Planned beyond 1990
Samanalawewa Hydro 1990/91 240Steam 200
Upper Kotmale Hydro 120Steam 100
Kukule Hydro 250Ratnapura Hydro 35Uma Oya Hydro 150Bing Hamala Hydro 110Jasmin Hydro 40
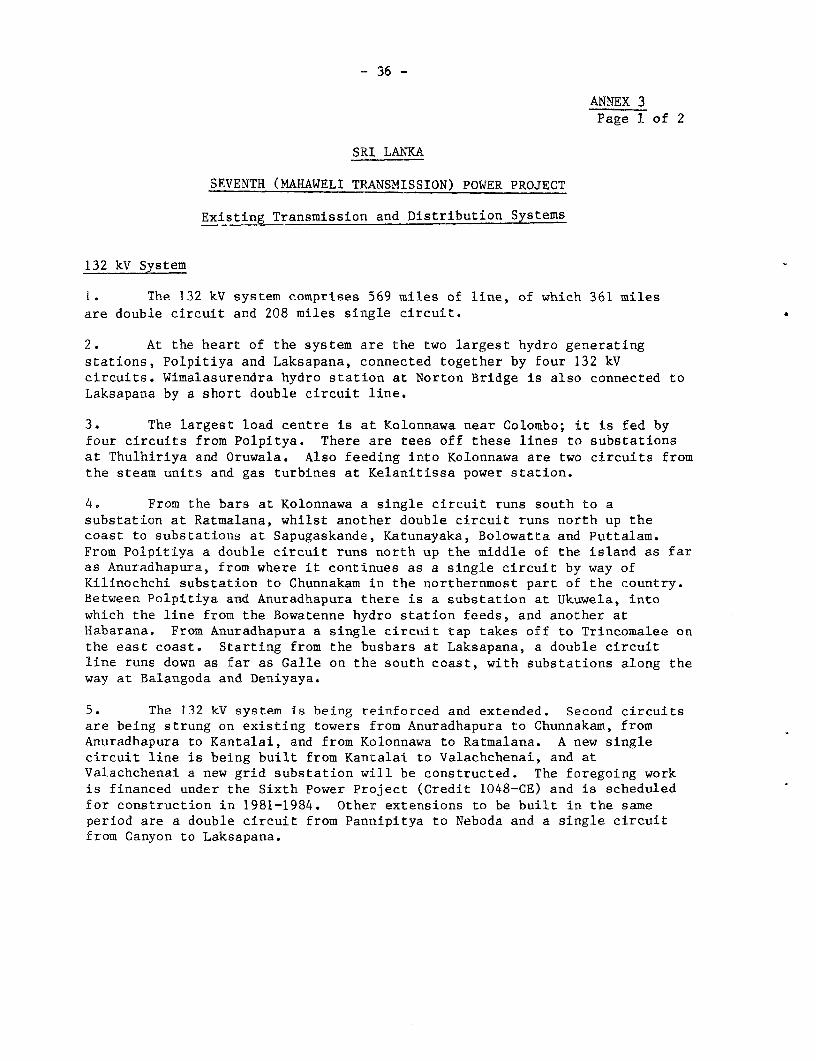
- 36 -
ANNEX 3Page I of 2
SRI LANKA
SEVENTH (MAHAWELI TRANSMISSION) POWER PROJECT
Existing Transmission and Distribution Systems
132 kV System
1. The 132 kV system comprises 569 miles of line, of which 361 milesare double circuit and 208 miles single circuit.
2. At the heart of the system are the two largest hydro generatingstations, Polpitiya and Laksapana, connected together by four 132 kVcircuits. Wimalasurendra hydro station at Norton Bridge is also connected toLaksapana by a short double circuit line.
3. The largest load centre is at Kolonnawa near Colombo; it is fed byfour circuits from Polpitya. There are tees off these lines to substationsat Thulhiriya and Oruwala. Also feeding into Kolonnawa are two circuits fromthe steam units and gas turbines at Kelanitissa power station.
4. From the bars at Kolonnawa a single circuit runs south to asubstation at Ratmalana, whilst another double circuit runs north up thecoast to substations at Sapugaskande, Katunayaka, Bolowatta and Puttalam.From Polpitiya a double circuit runs north up the middle of the island as faras Anuradhapura, from where it continues as a single circuit by way ofKilinochchi substation to Chunnakam in the northernmost part of the country.Between Polpitiya and Anuradhapura there is a substation at Ukuwela, intowhich the line from the Bowatenne hydro station feeds, and another atHabarana. From Anuradhapura a single circuit tap takes off to Trincomalee onthe east coast. Starting from the busbars at Laksapana, a double circuitline runs down as far as Galle on the south coast, with substations along theway at Balangoda and Deniyaya.
5. The 132 kV system is being reinforced and extended. Second circuitsare being strung on existing towers from Anuradhapura to Chunnakam, fromAnuradhapura to Kantalai, and from Kolonnawa to Ratmalana. A new singlecircuit line is being built from Kantalai to Valachchenai, and atValachchenai a new grid substation will be constructed. The foregoing workis financed under the Sixth Power Project (Credit 1048-CE) and is scheduledfor construction in 1981-1984. Other extensions to be built in the sameperiod are a double circuit from Pannipitya to Neboda and a single circuitfrom Canyon to Laksapana.
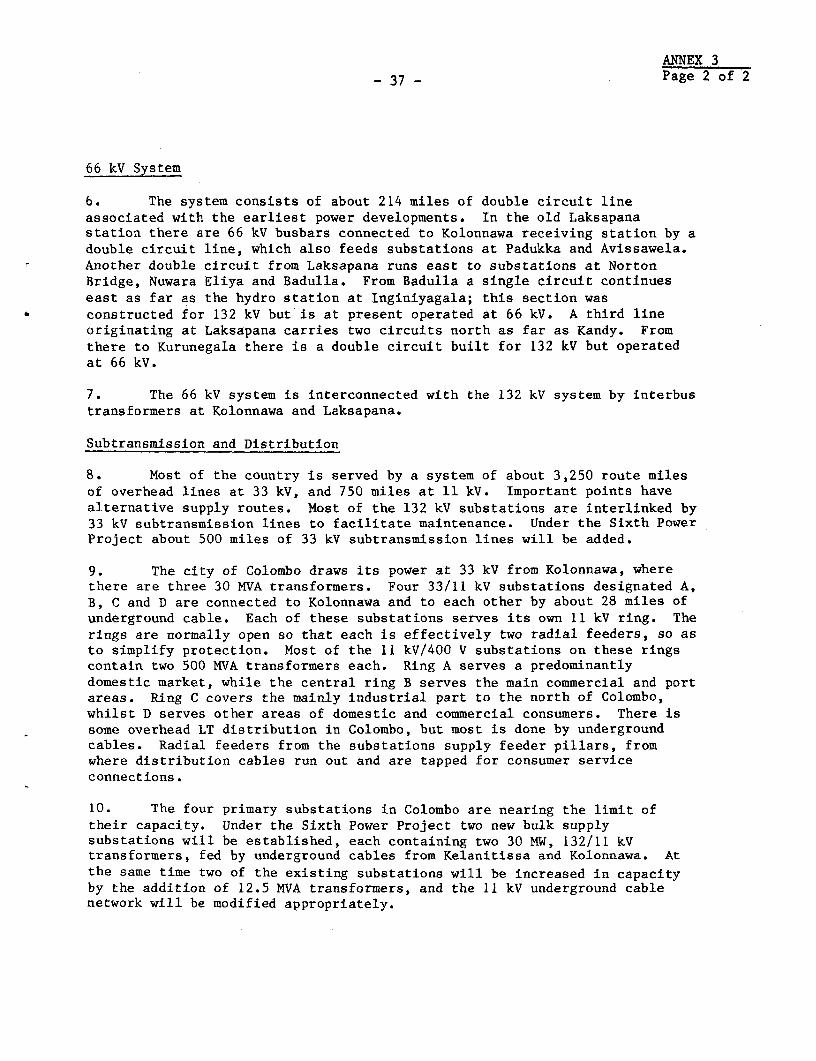
ANNEX 3- 37 - Page 2 of 2
66 kV System
6. The system consists of about 214 miles of double circuit lineassociated with the earliest power developments. In the old Laksapanastation there are 66 kV busbars connected to Kolonnawa receiving station by adouble circuit line, which also feeds substations at Padukka and Avissawela.Another double circuit from Laksapana runs east to substations at NortonBridge, Nuwara Eliya and Badulla. From Badulla a single circuit continueseast as far as the hydro station at Inginiyagala; this section wasconstructed for 132 kV but is at present operated at 66 kV. A third lineoriginating at Laksapana carries two circuits north as far as Kandy. Fromthere to Kurunegala there is a double circuit built for 132 kV but operatedat 66 kV.
7. The 66 kV system is interconnected with the 132 kV system by interbustransformers at Kolonnawa and Laksapana.
Subtransmission and Distribution
8. Most of the country is served by a system of about 3,250 route milesof overhead lines at 33 kV, and 750 miles at 11 kV. Important points havealternative supply routes. Most of the 132 kV substations are interlinked by33 kV subtransmission lines to facilitate maintenance. Under the Sixth PowerProject about 500 miles of 33 kV subtransmission lines will be added.
9. The city of Colombo draws its power at 33 kV from Kolonnawa, wherethere are three 30 MVA transformers. Four 33/11 kV substations designated A,B, C and D are connected to Kolonnawa and to each other by about 28 miles ofunderground cable. Each of these substations serves its own 11 kV ring. Therings are normally open so that each is effectively two radial feeders, so asto simplify protection. Most of the 11 kV/400 V substations on these ringscontain two 500 MVA transformers each. Ring A serves a predominantlydomestic market, while the central ring B serves the main commercial and portareas. Ring C covers the mainly industrial part to the north of Colombo,whilst D serves other areas of domestic and commercial consumers. There issome overhead LT distribution in Colombo, but most is done by undergroundcables. Radial feeders from the substations supply feeder pillars, fromwhere distribution cables run out and are tapped for consumer serviceconnections.
10. The four primary substations in Colombo are nearing the limit oftheir capacity. Under the Sixth Power Project two new bulk supplysubstations will be established, each containing two 30 MW, 132/11 kVtransformers, fed by underground cables from Kelanitissa and Kolonnawa. Atthe same time two of the existing substations will be increased in capacityby the addition of 12.5 MVA transformers, and the 11 kV underground cablenetwork will be modified appropriately.
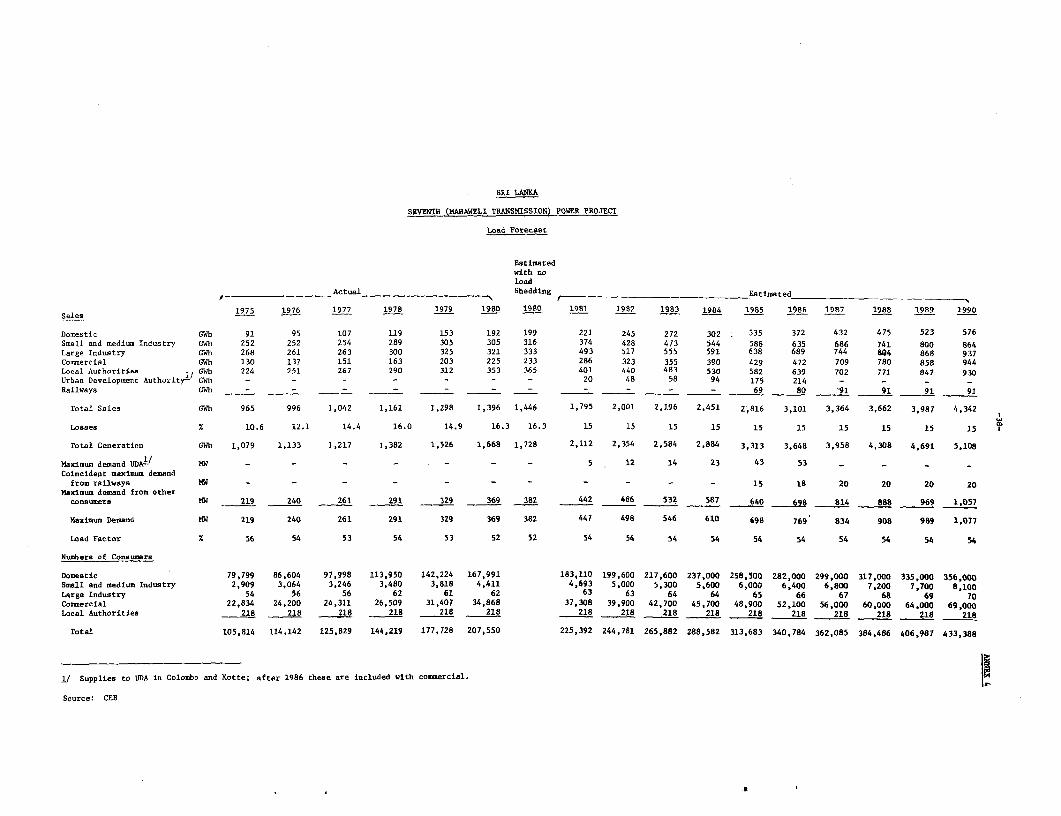
SRI LAY9A
SEVEZTN (MAHAWELI TRANSMISSION) POWER PROJECT
Load Forecast
Estimatedwith noload
Actual Shedding Estimated___-__
sales 1975 1976 1977 1978 1979 1980 1980 1981 1982 1983 1984 1985 1986 1987 1988 1989 1990
Domestic GWh 91 95 107 119 153 192 199 221 245 272 302 335 372 432 475 523 576Small and medium Industry GWh 252 252 254 289 305 305 316 374 428 473 544 588 635 686 741 800 864
Large Industry GWh 268 261 263 300 325 321 333 493 517 555 591 638 689 744 804 868 937
Commercial GWh 130 137 151 163 203 225 233 286 323 355 390 429 472 709 780 858 944
Local Authorities 1GWh 224 251 267 290 312 353 365 401 440 483 530 582 639 702 771 847 930
Urban Development Authority- GWh - - - - - - - 20 48 58 94 175 214 - - - -
Railways GWh - - - - - - - - - - - 69 80 '91 91 91 91
Total Sales GWh 965 996 1,042 1,161 1,298 1,396 1,446 1,795 2,001 2,196 2,451 2,816 3,101 3,364 3,662 3,987 4,342
Losses % 10.6 12.1 14.4 16.0 14.9 16.3 16.3 15 15 15 15 15 15 15 15 15 15
Total Generation GWh 1,079 1,133 1,217 1,382 1,526 1,668 1,728 2,112 2,354 2,584 2,884 3,313 3,648 3,958 4,308 4,691 5,108
Maximum demand UDA1' MW - - - - - - - 5 12 14 23 43 53 _ _ _
Coincident maximum demandfrom railways MW - - - - - - - - - - - 15 18 20 20 20 20
Maximum demand from otherconsumers MW 219 240 261 291 329 369 382 442 486 532 587 640 69 814 888 969 1,057
Maximum Demand MW 219 240 261 291 329 369 382 447 498 546 610 698 769 834 908 989 1.077
Load Factor Y 56 54 53 54 53 52 52 54 54 54 54 54 54 54 54 54 54
Numbers of Consumers
Domestic 79,799 86,604 97.998 113,950 142,224 167,991 183,110 199,600 217,600 237,000 258,500 282,000 299,000 317,000 335,000 356,000
Small and medium Industry 2,909 3,064 3,246 3,480 3,818 4,411 4,693 5,000 5,300 5,600 6,000 6,400 6,800 7,200 7,700 8,100
Large Industry 54 56 56 62 61 62 63 63 64 64 65 66 67 68 69 70Commercial 22,834 24,200 24,311 26,509 31,407 34,868 37,308 39,900 42,700 45,700 48,900 52,100 56,000 60,000 64,000 69,000
Local Authorities 218 218 218 218 218 218 218 218 218 218 218 218 218 218 218 218
Total 105,814 114,142 125,829 144,219 177,728 207,550 225,392 244,781 265,882 288,582 313,683 340,784 362,085 384,486 406,987 433,388
1/ Supplies to UDA in Colombo and Kotte; after 1986 these are included with commercial.
Source: CEB
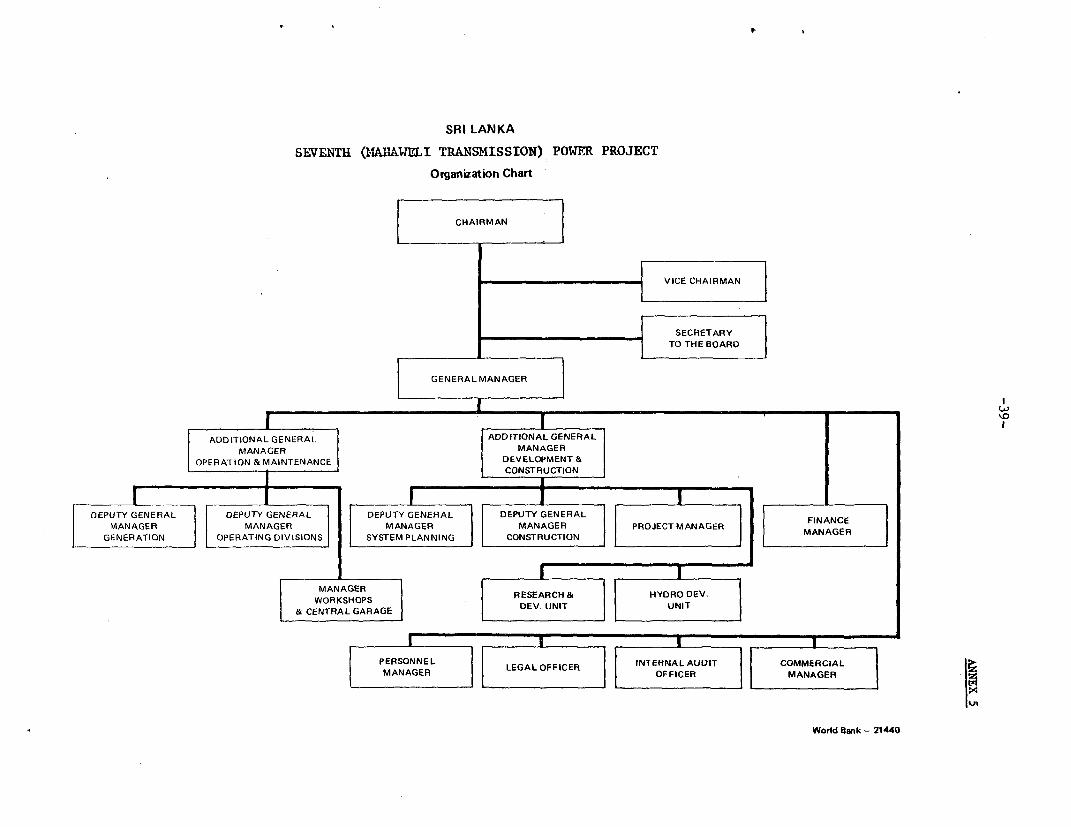
SRI LANKA
SEVENT1 (I4AU1WELI TRANSMISSION) POWER PROJECT
Organization Chart
CHAIRMAN
VICE CHAIRMAN
SECRETARYTO THE BOARD
GENERAL MANAGER
I I ~~~~~~~~~~~~~~~~~~~~~~~~~~~~~~~~~lw
ADDITYONAL GENERAL ADDITIONAL GENERAL
MANAGER MANAGER
OPERATION & MAINTENANCE DEVELOPMENT &CONSTRUCTION
DEPUTY GENERAL DEPUTY GENERAL DEPUTY GENERAL DEPUTY GENERAL
MANAGER MANAGER MANAGER MANAGER POETMANAGER FINANCE
GENERATION OPERATING DIVISIONS SYSTEM PLANNING CONSTRUCTION MANAGER
KMANAGERS RESEARCH & j HYDRO DEV.
& CENTRAL GARAGE D U UNIT
MAERONNGE LEGAL OFFICER f INTERNALAUDIT COMMERCIAL
MANAGER WOFFICER MANAGER
World Bank - 21440
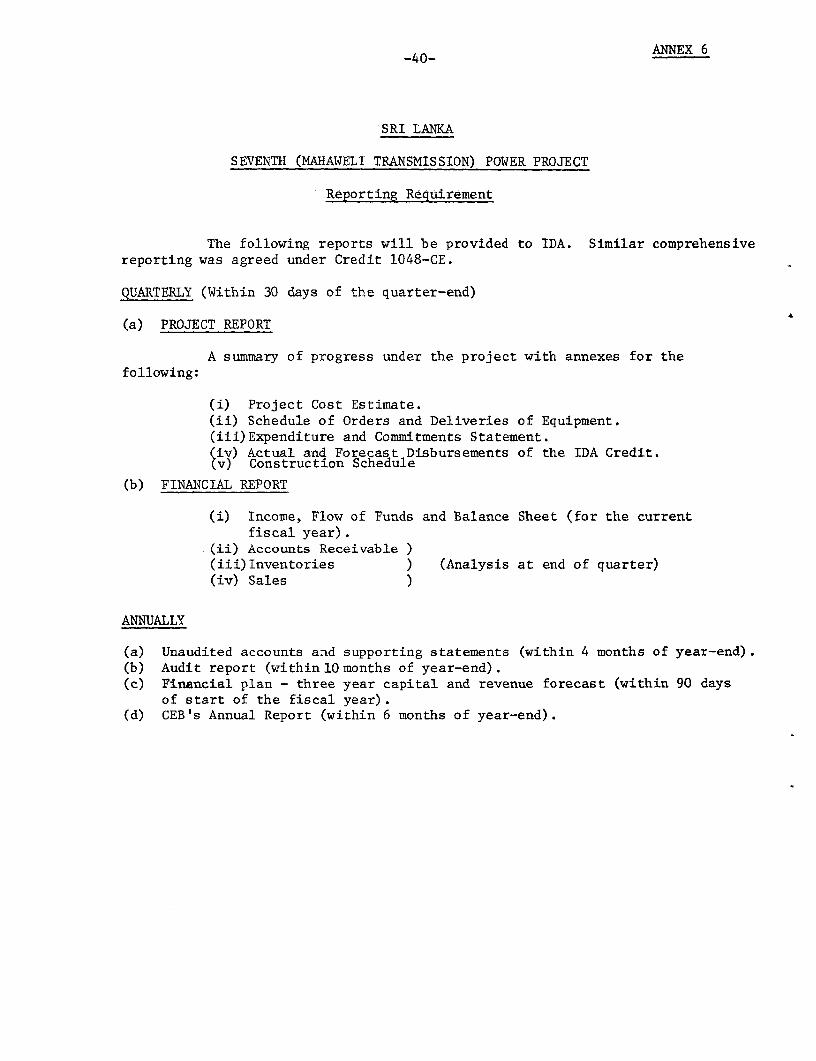
_40_ ANNEX 6
SRI LANKA
SEVENTH (MAHAWELI TRANSMISSION) POWER PROJECT
Reporting Requirement
The following reports will be provided to IDA. Similar comprehensivereporting was agreed under Credit 1048-CE.
QUARTERLY (Within 30 days of the quarter-end)
(a) PROJECT REPORT
A summary of progress under the project with annexes for thefollowing:
(i) Project Cost Estimate.(ii) Schedule of Orders and Deliveries of Equipment.(iii)Expenditure and Commitments Statement.(iv) Actual and Forecast Disbursements of the IDA Credit.(v) Construction Schedule
(b) FINANCIAL REPORT
(i) Income, Flow of Funds and Balance Sheet (for the currentfiscal year).
.(ii) Accounts Receivable )(iii)Inventories ) (Analysis at end of quarter)(iv) Sales )
ANNUALLY
(a) Unaudited accounts and supporting statements (within 4 months of year-end).(b) Audit report (within 10 months of year-end).(c) Financial plan - three year capital and revenue forecast (within 90 days
of start of the fiscal year).(d) CEB's Annual Report (within 6 months of year-end).
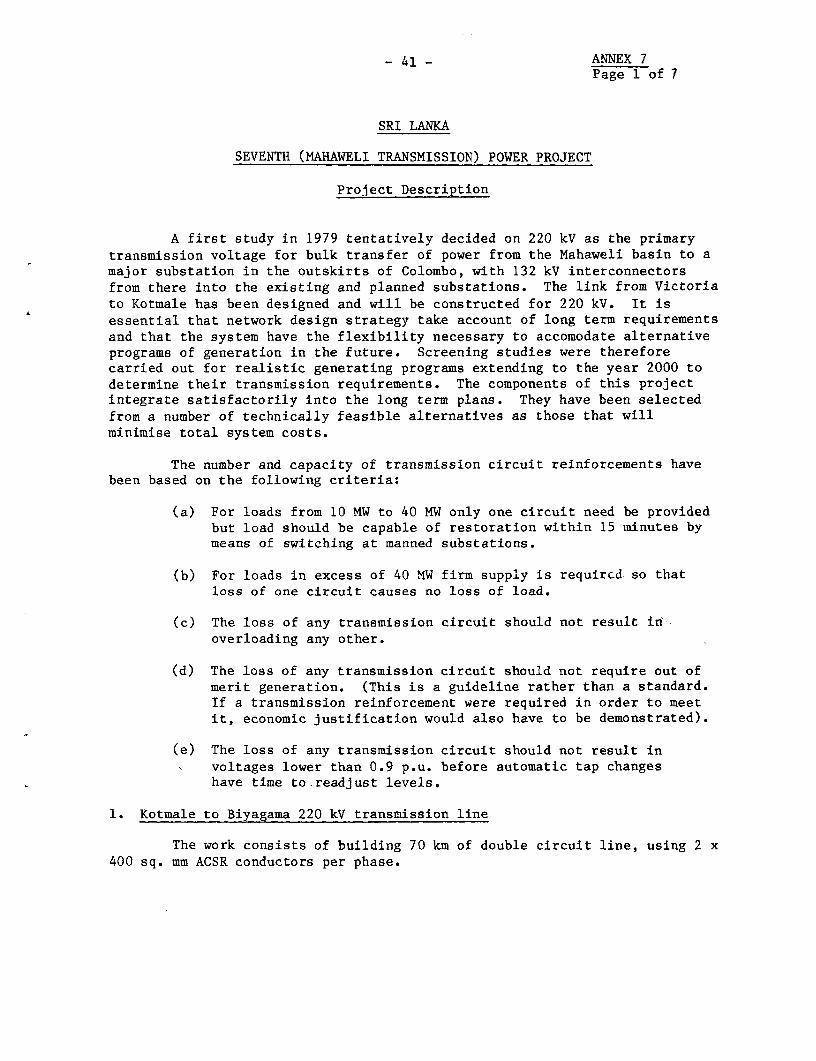
- 41- ANNEX 7Page 1 of 7
SRI LANKA
SEVENTH (MAHAWELI TRANSMISSION) POWER PROJECT
Project Description
A first study in 1979 tentatively decided on 220 kV as the primarytransmission voltage for bulk transfer of power from the Mahaweli basin to amajor substation in the outskirts of Colombo, with 132 kV interconnectorsfrom there into the existing and planned substations. The link from Victoriato Kotmale has been designed and will be constructed for 220 kV. It isessential that network design strategy take account of long term requirementsand that the system have the flexibility necessary to accomodate alternativeprograms of generation in the future. Screening studies were thereforecarried out for realistic generating programs extending to the year 2000 todetermine their transmission requirements. The components of this projectintegrate satisfactorily into the long term plans. They have been selectedfrom a number of technically feasible alternatives as those that willminimise total system costs.
The number and capacity of transmission circuit reinforcements havebeen based on the following criteria:
(a) For loads from 10 MW to 40 MW only one circuit need be providedbut load should be capable of restoration within 15 minutes bymeans of switching at manned substations.
(b) For loads in excess of 40 MW firm supply is requircd so thatloss of one circuit causes no loss of load.
(c) The loss of any transmission circuit should not result inoverloading any other.
(d) The loss of any transmission circuit should not require out ofmerit generation. (This is a guideline rather than a standard.If a transmission reinforcement were required in order to meetit, economic justification would also have to be demonstrated).
(e) The loss of any transmission circuit should not result involtages lower than 0.9 p.u. before automatic tap changeshave time to readjust levels.
1. Kotmale to Biyagama 220 kV transmission line
The work consists of building 70 km of double circuit line, using 2 x400 sq. mm ACSR conductors per phase.
ANNEX 7
- 42 - Page 2 of 7
This line, which will start from the Kotmale Power Stationswitchyard, will receive the major part of the output from new hydro stationseither now under construction or soon to be built at Kotmale, Victoria,Randenigala and Rantembe, and deliver it to a substation at Biyagama in theoutskirts of Colombo. The line will be of the same design as the one fromVictoria to Kotmale which has already been designed. If the substation atKotmale is not completed in time, the Kotmale--Biyagama part will be tieddirect to the Victoria--Kotmale line.
2. Biyagama to Kelanitissa 220 kV transmission line
This line will be 16 km long, double circuit, having two 300 sq. mmACSR conductors per phase.
Kelanitissa and Kolonnawa substations together will supply thecentral part of the city of Colombo, where very rapid load growth isexpected. The substation at Kelanitissa at present carries only 20 MW, butload will be transferred to it from Kolonnawa, and the projected load atKelanitissa is 65 MW by 1985, growing to 169 MW by 1995. The Kelanitissasite is restricted to the extent that only one more double circuit line canbe brought into it. A 132 kV line would serve the present purposes, but theline will be built for future operation at 220 kV (incurring a cost premiumof 10%) so as to permit its use at a later date to transmit the output froma 350 MW steam station in Colombo to the Biyagama substation. Were this lineto be built at 132 kV and a 220 kV line constructed later for the steamstation, the 132 kV line would then become redundant.
3. Biyagama to Pannipitiya 220 kV transmission line
This will be a double circuit line 17 km long, having one 400 sq. mmACSR conductor per phase. It will be built for 220 kV but operated initiallyat 132 kV until Samanalawewa is connected into the system.
A new substation is being built at Pannipitiya. It will be completedat the end of 1982, when load will be transferred to it from Ratmalana andKolonnawa. It will also feed another new substation now under constructionat Matugama, and the parliamentary complex at Kotte. The area is at presentsupplied by a single 132 kV circuit from Kolonawa and a second circuit is atpresent being strung, but the firm capacity of these two will be exceeded by1985. The present area load is 40 MW; this is forecast to reach 91 MW by1985 and 193 MW by 1995.
220 kV is preferred to 132 kV for this line for reasons of systemstability in later years, and 132 kV switchgear rupturing capacity. Thereare about 550 MW of future hydro developments at Samanalawewa and Kukule;Pannipitiya will be the place at which some of this power will be injectedinto the system and fed back to Biyagama.
- 43 - ANNEX 7Page 3 Of 7
4. Biyagama to Katunayake 220 kV transmission line
This comprises 23 km of double circuit line, using one 400 sq.mm ACSRconductor per phase. It will be operated as two transformer feeders totransformers in the Biyagama substation.
The firm rating of the existing lines into Katunayake is 85 MW andthe load in the area including Sapugaskande is already in excess of this.The area load is expected to increase to 147 MW by 1985 and 259 MW by 1995.Katunayake substation is now being extended with new 132 kV busbars andswitchgear to serve the existing free trade zone, the extended airport andthe local coconut industry. Sapugaskande substation, which will be fed fromKatunayake, is in the area of a large complex of heavy industry including therefinery and the fertilizer plant.
The requirements of this line could be met either at 132 kV usingtwo conductors per phase or at 220 kV using one conductor per phase, but 132kV would be unsatisfactory in respect of system stability in later years,fault levels on 132 kV switchgear, and higher losses. A 220 kV line willpermit a flow of power from Katunayake to Biyagama in the event that it isdecided to inject the output from the projected coal station at Trincomaleeinto the system at Katunayake. The higher voltage will also permit bettervoltage control in the Puttalam area by way of the taps on the 220 kVtransformers at Katunayake.
5. Rantembe to Badulla 132 kV transmission line
This comprises a single circuit line 37 km long, having a single 175sq. mm ACSR conductor per phase, running from the switchyard of the futureRantembe power station to a new switching station near Badulla.
The line is urgently needed to inject power into the 66 kV system,which is heavily overloaded, and which with the present configuration mustbe fed over a circuitous route causing heavy loss of energy. This new 132 kVlink will permit the Inginiyagala line and substation to be operated at theirdesign voltage of 132 kV instead of 66 kV as at present. Injection into theeast end of the old 66 kV system will be done by means of a new 31.5 MVA132/66 kV tie transformer at Badulla. The effect of the link will be toprovide firm power to all points on this part of the system with theexception of Inginiyagala which will depend on a single 132 kV line and itslocal hydro station.
Although the Rantembe hydro station itself will not be on line until1990, the adjacent one at Randenigala is scheduled for 1987. Recognising theneed for the feed to Badulla, under the Randenigala project will be includedthe building of a 220 kV line from Victoria to Randenigala and 3 km beyond toRantembe, as well as a switching station with 220/132 kV step down at
ANNEX 7Page 4 of 7
- 44 -
Rantembe. These works will be completed to meet the schedule of the projectline from Rantembe to Badulla.
6. Badulla turn in
This consists of a 1 km long 132 kV single circuit link using asingle 175 sq. mm ACSR conductor per phase to connect the existing 132 kVline from Badulla to Inginiyagala into the new 132 kV switching station.
7. Biyagama 220/132 kV substation
The work will provide:
- 220 kV switchgear, in a double busbar arrangement, for fourtransmission circuits (with space for six more), twotransformers (with space for two more), and a bus coupler.
- 132 kV switchgear, in double busbar arrangement, for twotransformers (with space for two more), one bus coupler,and four transmission circuits (with space for four more).
- Two transformers, 220/132 kV, 250 MVA each.
The Biyagama site has been selected as the closest possible one toColombo allowing access for lines into all existng or planned majorsubstations in and around the city. The area in which it is located is aboutto be developed by GOSL as a new free trade zone for heavy industry; it isclose to the Sapugaskande substation which serves existing heavy industry.The land imposes no restrictions on CEB's designs as it is owned by GOSL anddevelopment on it has not yet started. It is flat, offers good foundationconditions and will be accessible from a good road.
8. Katunayake substation
The extent of the work is: two additional bays of 132 kV switchgearfor transformers; two transformers, 220/132 kV, 250 MVA each, and a 220 kVskeleton gantry with isolators.
9. Kelanitissa substation
Two additional bays of 132 kV switchgear will be installed.
10. Badulla Switching Station
This will comprise a single busbar with three 132 kV feeder bays in anew switching station, and one 132/66 kV 31.5 MVA transformer in the existing66 kV substation. The transformer will be wound so that it can later be usedfor 132/33 kV.
ANNEX 7
Page 5 of 7- 45 -
11. Reactive Compensation
It is expected that about 100 MVA of capacitors will be required.These will be handled as part of the contract for the substations in whichthey will be installed.
12. Circuit Breaker Replacement
With the addition of the new hydro electric stations the fault levelson the system will be increased to such a degree that a number of theexisting 132 kV circuit breakers and current transformers will no longer beof adequate rating. It may be possible to upgrade some of this equipment butmost of it will probably need to be replaced by new. The matter is understudy and it is expected that about 45 circuit breakers with CTs will beaffected. The work under this item is to cover the purchase and installationof new equipment as necessary and the modification of existing plant wherepossible.
13. Power Line Carrier (PLC)
The work will provide for protection and intertripping of the 220 kVand 132 kV lines as well as communications.
14. Loss Reduction Programme
It is CEB's intention to establish a cell, probably within theplanning group, whose work will include continuous monitoring and reductionof energy losses in the system. This provision is to equip crews withportable meters and equipment for this purpose, and also to provide forpermanent metering on lines and feeders that do not at present have them butwould benefit from being so equipped.
15. Vehicles and tools
The project provides for the purchase of vehicles and special toolsand equipment needed by CEB's construction and supervision forces.
16. Buildings
The project includes operational buildings, offices, stores andquarters, mainly at Biyagama.
ANNEX 7Page 6 of 7
- 46 -
17. Consulting Services
Funds were provided under the Sixth Power Project for foreignengineering services on the 220 kV lines and substations in this project,to the point of receiving and evaluating tenders for the major contracts.In this project funds are included for the remaining foreign engineeringservices needed, including design, contract coordination, inspection servicesand supervision of construction. About 140 man months of foreign engineers'services are provided for, with fees, foreign travel and accomodation andother expenses, including those of CEB's engineers whilst working in theconsultants' offices overseas.
18. Technical Assistance and Training
CEB agreed under the Sixth Power Project to prepare and implementtraining programs for all types of staff. Funds are provided under thisproject for both foreign and local costs of implementing these programs.
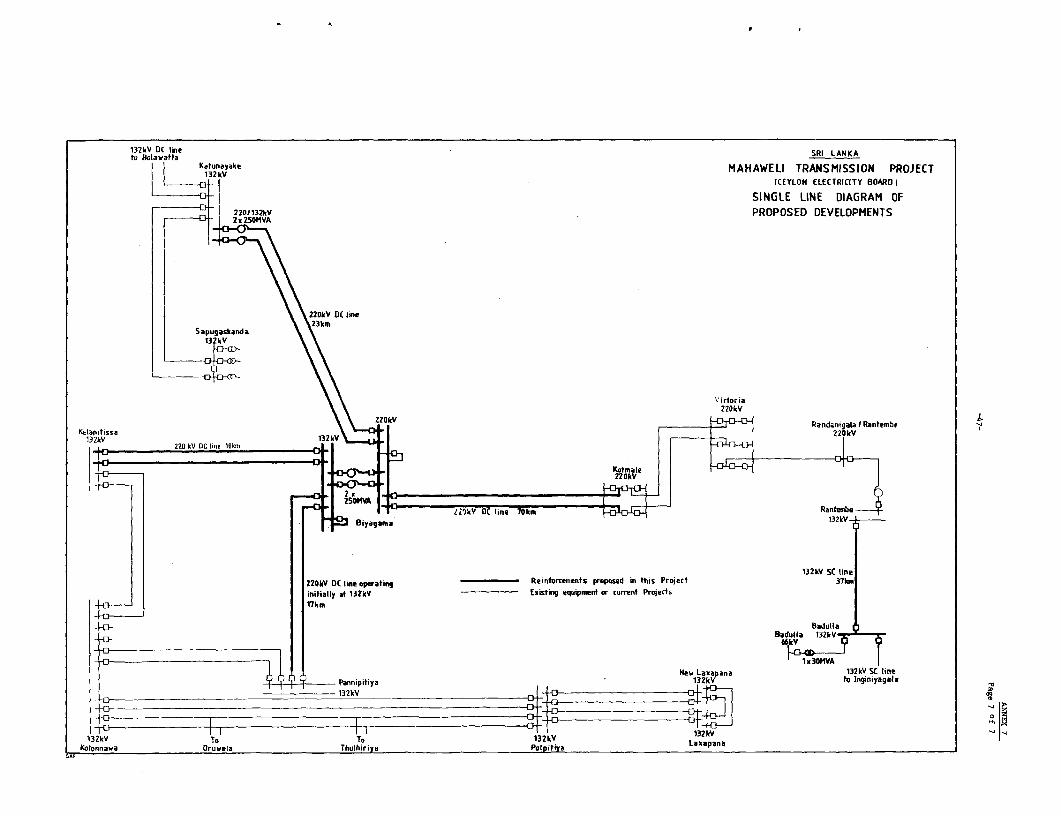
132kV DC line SRI LANKAto Bolawatta SRIHaANKA
Ketunayake MAHAWELI TRANSMISSION PROJECT213kV
(CEYLON ELECTRICITY BOAROI
El - ~~~~~~~~~~~~~~~~~~SINGLE LINE DIAGRAM OF2201132kV PROPOSED DEVELOPMENTS13- 2 1 250M'VA
220kV DC line23km
Sapugaskanda13?kV
\\ ; ~~~~~~~~~~~~~~~~~~~~~~~~~Vctoria\\ Z20kV 22011VIRandenigaba I Rantembe
Iean t isoa a2l 1t a2 k t s s a 2 2 0 kV D C lin e 16 k n 1 3 2
Bu8iyag am132kV I
220kV DC line operating Reintorcments proposed in this Project linitially at 132kv Existing equipment or rurrent Projects171km
Boduttaa
New Lx 132kV SL aineaPannipitiya 132kv to Inginoyagla132kV |1
13 kV To To 132kV LxapanaKolonnawda Oruwela Thuelhiriya Pli'a Lxpn
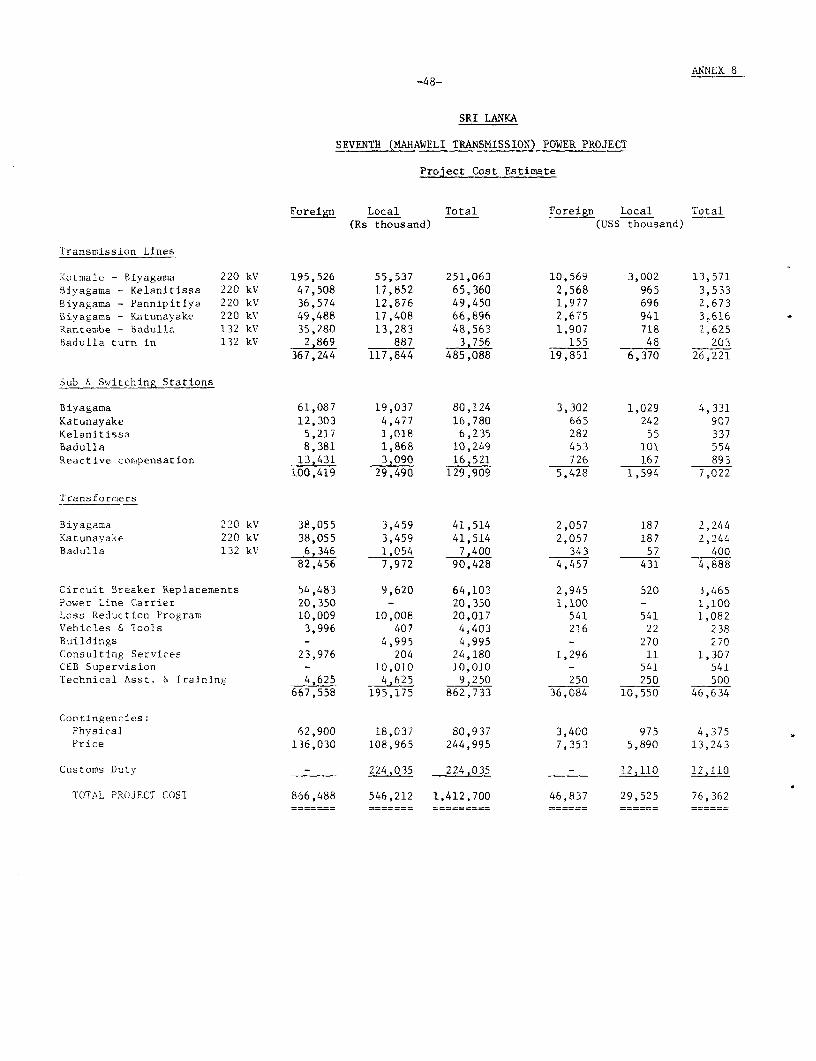
ANNEX 8-48-
SRI LANKA
SEVENTH (MAHAWELI TRANSMISSION) POWER PROJECT
Project Cost Estimate
Foreign Local Total Foreign Local Total(Rs thousand) (US$ thousand)
Transmission Lines
Kotnale - Biyagama 220 kV 195,526 55,537 251,063 10,569 3,002 13,571Biyagama - Kelanitissa 220 kV 47,508 17,852 65,360 2,568 965 3,533Biyagama - Pannipitiya 220 kV 36,574 12,876 49,450 1,977 696 2,673Biyagama - Katunayake 220 kV 49,488 17,408 66,896 2,675 941 3,616Rantembe - Badulla 132 kV 35,280 13,283 48,563 1,907 718 2,625Badulla turn in 132 kV 2,869 887 3,756 155 48 203
367,244 117,844 485,088 19,851 6,370 26,221
Sub & Switching Stations
Biyagama 61,087 19,037 80,124 3,302 1,029 4,331Katunayake 12,303 4,477 16,780 665 242 907Kelanitissa 5,217 1,018 6,235 282 55 337Badulla 8,381 1,868 10,249 453 101 554Reactive compensation 13,431 3,090 16,521 726 167 893
100,419 29,490 129,909 5,428 1,594 7,022
Transformers
Biyagama 220 kV 38,055 3,459 41,514 2,057 187 2,244Katunayake 220 kV 38,055 3,459 41,514 2,057 187 2,244Badulla 132 kV 6,346 1,054 7,400 343 57 400
82,456 7,972 90,428 4,457 431 4,888
Circuit Breaker Replacements 54,483 9,620 64,103 2,945 520 3,465Power Line Carrier 20,350 - 20,350 1,100 - 1,100Loss Reduction Program 10,009 10,008 20,017 541 541 1,082Vehicles & lools 3,996 407 4,403 216 22 238Buildings - 4,995 4,995 - 270 270Consulting Services 23,976 204 24,180 1,296 11 1,307CEB Supervision - 10,010 10,010 - 541 541Technical Asst. & Training 4,625 4,625 9,250 250 250 500
667,558 195,175 862,733 36,084 10,550 46,634
Contingencies:Physical 62,900 18,037 80,937 3,400 975 4,375Price 136,030 108,965 244,995 7,353 5,890 13,243
Customs Duty - 224,035 224_,35 - 12,110 12,110
TOTAL PROJECT COST 866,488 546,212 1,412,700 46,837 29,525 76,362
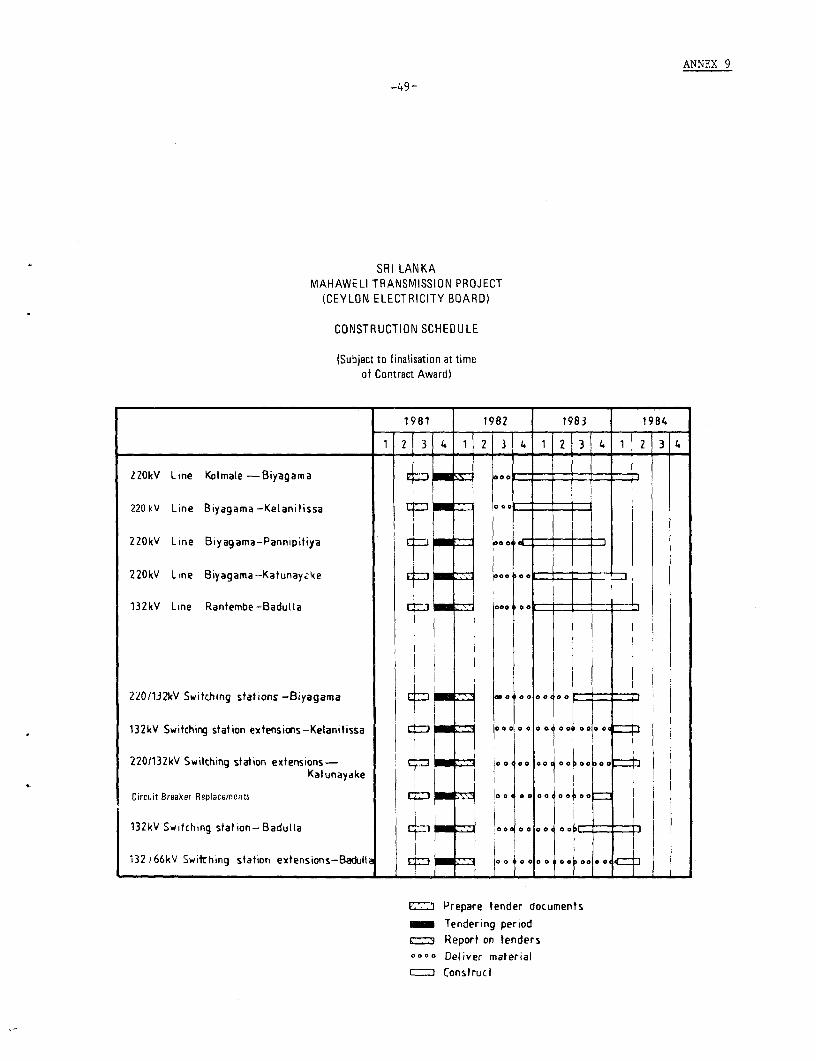
ANNEX 9
-49-
SRI LANKAMAHAWELI TRANSMISSION PROJECT
(CEYLON ELECTRICITY BOARD)
CONSTRUCTION SCHEDULE
(Subject to finalisation at timeof Contract Award)
1981 1982 1983 1984
1 2 3 4 1 41 2 3 4 1 2 34
220kV Line Kotmale-Biyagama E00
220 kV Line Biyagama -Kelanitissa C = = =
220kV Line Biyagama-Pannipitiya D o o ==-
220kV Line Biyagama-Katunaycke L0 00 C
132kV Line Rantembe -Badulla coo o 0 C _ =
220/132kV Switching stations -Biyagama 0 00 000 00=
132kV Switching stat ion extensions -Kelanitissa C30a0 a0 0 0 0 0 0000G=:
2201132kV Switching station extensions- _10 00 00 00500 00 = 3Katunayake "1 1
Circuit Breaker Replacements 00 oe o 1 = oo
|132kVSwitching station- Badulia i 00; 00 00 1 0 0,r !
132)66kV Swiching station extensions-Baduilt a e o.t o 00 -
17 Prepare tender documents
Tendering periodReport on tenders
0000 Deliver materialrn lConstruc t
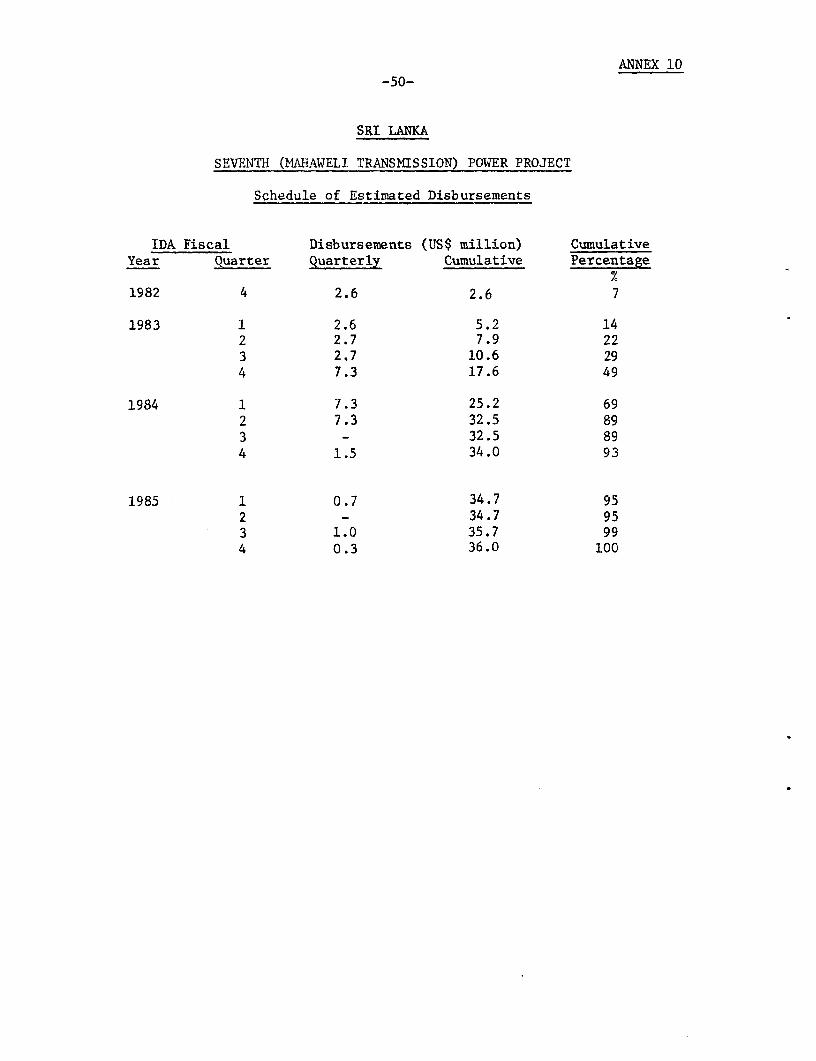
ANNEX 10-50-
SRI LANKA
SEVENTH (MAHAWELI TRANSMISSION) POWER PROJECT
Schedule of Estimated Disbursements
IDA Fiscal Disbursements (US$ million) CumulativeYear Quarter Quarterly Cumulative Percentage
1982 4 2.6 2.6 7
1983 1 2.6 5.2 142 2.7 7.9 223 2.7 10.6 294 7.3 17.6 49
1984 1 7.3 25.2 692 7.3 32.5 893 _ 32.5 89
4 1.5 34.0 93
1985 1 0.7 34.7 952 - 34.7 953 1.0 35.7 994 0.3 36.0 100
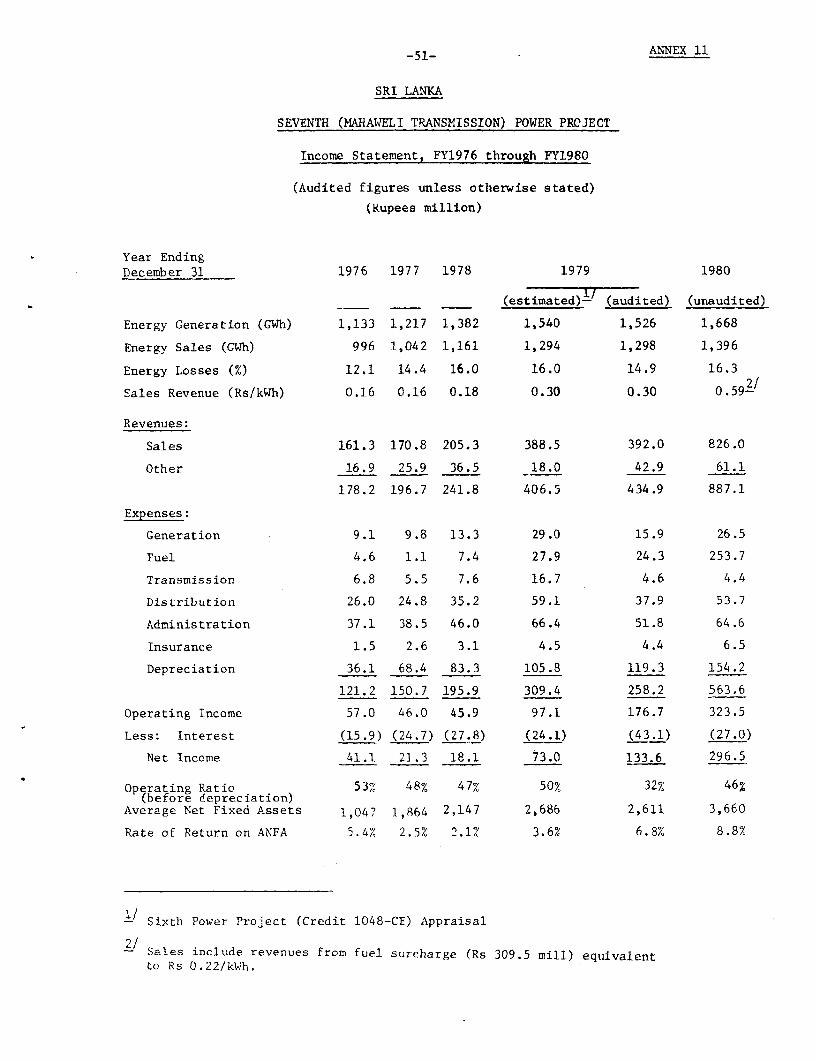
-51- ANNEX 11
SRI LANKA
SEVENTH (MAHAWELI TRANSMISSION) POWER PROJECT
Income Statement, FY1976 through FY1980
(Audited figures unless otherwise stated)
(Rupees million)
Year EndingDecember 31 1976 1977 1978 1979 1980
(estimated)-/ (audited) (unaudited)
Energy Generation (GWh) 1,133 1,217 1,382 1,540 1,526 1,668
Energy Sales (CWh) 996 1,042 1,161 1,294 1,298 1,396
Energy Losses (%) 12.1 14.4 16.0 16.0 14.9 16.3
Sales Revenue (Rs/kWh) 0.16 0.16 0.18 0.30 0.30 0.59/
Revenues:
Sales 161.3 170.8 205.3 388.5 392.0 826.0
Other 16.9 25.9 36.5 18.0 42.9 61.1
178.2 196.7 241.8 406.5 434.9 887.1
Expenses:
Generation 9.1 9.8 13.3 29.0 15.9 26.5
Fuel 4.6 1.1 7.4 27.9 24.3 253.7
Transmission 6.8 5.5 7.6 16.7 4.6 4.4
Distribution 26.0 24.8 35.2 59.1 37.9 53.7
Administration 37.1 38.5 46.0 66.4 51.8 64.6
Insurance 1.5 2.6 3.1 4.5 4.4 6.5
Depreciation 36.1 68.4 83.3 105.8 119.3 154.2
121.2 150.7 195.9 309.4 258.2 563.6
Operating Income 57.0 46.0 45.9 97.1 176.7 323.5
Less: Interest (15.9) (24.7) (27.8) (24.1) (43.1) (27.0)
Net Income 41.1 21.3 18.1 73.0 133.6 296.5
Operating Ratio 53% 48% 47% 50% 32% 46%(before depreciation)
Average Net Fixed Assets 1,04' 1,864 2,147 2,686 2,611 3,660
Rate of Return on ANFA 5.4% 2.5% 2.1% 3.6% 6.8% 8.8%
- Sixth Power Project (Credit 1048-CE) Appraisal
- Sales include revenues from fuel surcharge (Rs 309.5 mill) equivalentto Rs 0.22/kWh.
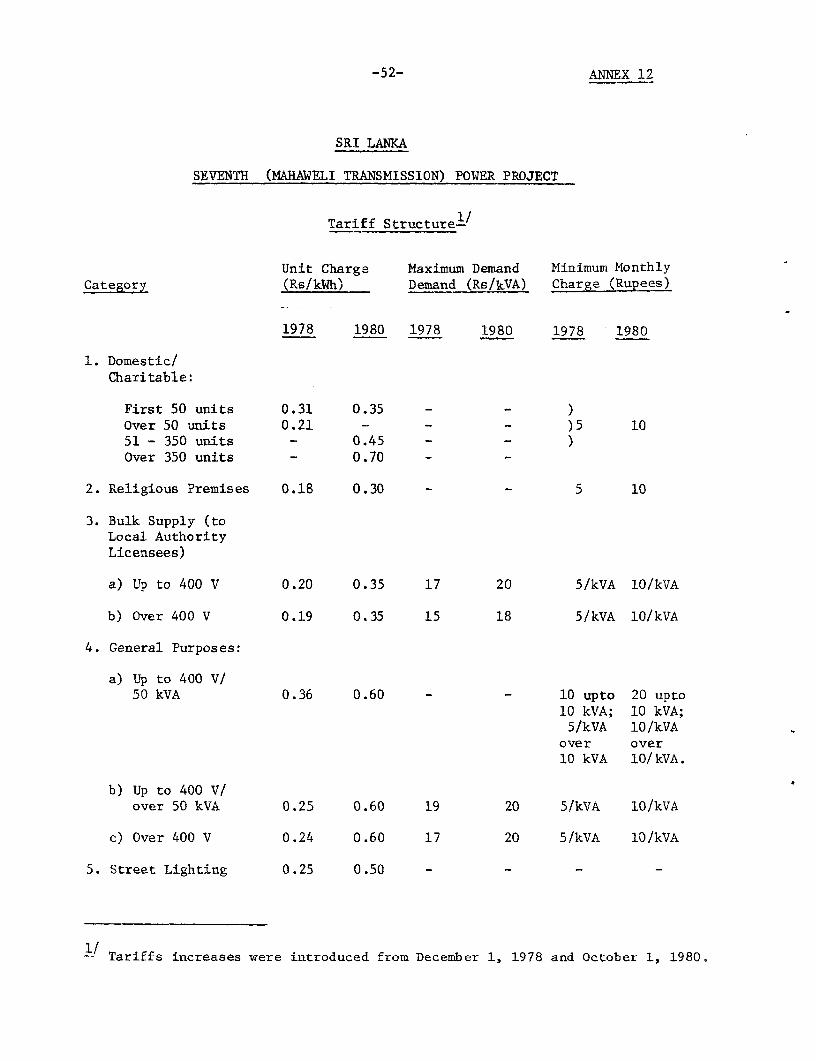
-52- ANNEX 12
SRI LANKA
SEVENTH (MAHAWELI TRANSMISSION) POWER PROJECT
Tariff Structurel/
Unit Charge Maximum Demand Minimum MonthlyCategory (Rs/kWh) Demand (Rs/kVA) Charge (Rupees)
1978 1980 1978 1980 1978 1980
1. Domestic/Charitable:
First 50 units 0.31 0.35 - - )Over 50 units 0.21 - - - )5 1051 - 350 units - 0.45 - - )Over 350 units - 0.70 - -
2. Religious Premises 0.18 0.30 - - 5 10
3. Bulk Supply (toLocal AuthorityLicensees)
a) Up to 400 V 0.20 0.35 17 20 5/kVA 1O/kVA
b) Over 400 V 0.19 0.35 15 18 5/kVA 1O/kVA
4. General Purposes:
a) Up to 400 V/50 kVA 0.36 0.60 - - 10 upto 20 upto
10 kVA; 10 kVA;5/kVA l0/kVAover over10 kVA 10/kVA.
b) Up to 400 V/over 50 kVA 0.25 0.60 19 20 5/kVA l0/kVA
c) Over 400 V 0.24 0.60 17 20 5/kVA 10/kVA
5. Street Lighting 0.25 0.50 - - - -
/ Tariffs increases were introduced from December 1, 1978 and October 1, 1980.
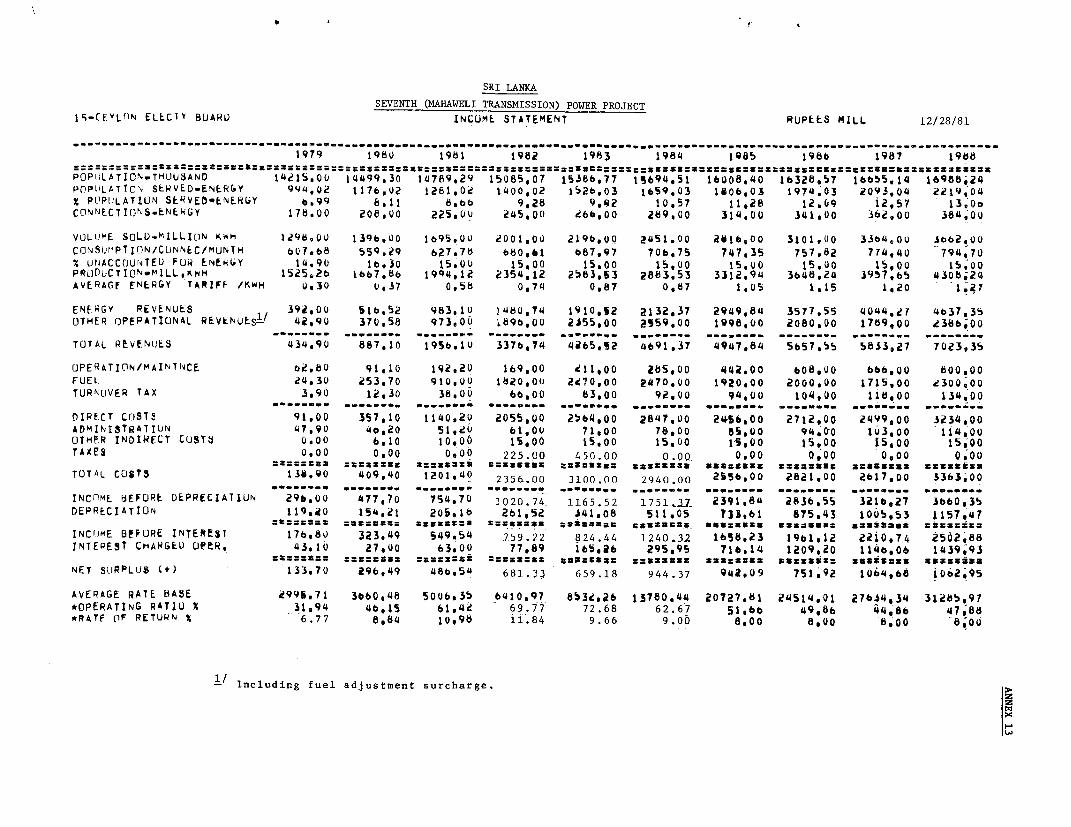
SRI LANKA
SEVENTH (MAHAWELI TRANSMISSION) POWER PROJECT
ISCEYLfON ELECTY BUARD INCUME STATEMENT RUPEES MILL 12/28/81
-------- _----_-----__- -___---_----__- -,-_-_-___---_,,----__- -_----_ -____--_ -_-_-__---_---- -_----___---_--_ ------
1979 1986 1981 1982 1983 1984 1985 1986 1987 1988
POPtJLATION-THUUSAND 14215,00 14499,30 14789,29 15085,07 15386,77 1%694,51 16008,40 16328,57 16655.14 16988,24
POPULATTON SERVED-ENERGY 994.02 1176,02 1281.02 1400,02 1526.03 1659.03 1606,03 1974.03 2093,04 2219.04
Z POPULATION SERVED.tNER(Y 6.99 8.11 Bb6 9.28 9,92 10.57 11.28 12.09 12,57 13,OaCO9NECTIONS.ENERGY 178.00 208.00 225,oo 245,00 d6b,00 289,00 314,00 341,00 362,00 384.00
VOLUME SoLD-mILLION KWH 1296.00 1396.30 1695.00 2001,00 219b,00 2451.00 aotb,oo 3101,00 33b4.00 u 3660 0
cfrDSop TI(IN/C[NNEC/MUNT9TH 607.68 559.29 627.76 680.61 687,97 706,75 747,35 757.82 774.40 794.70
% urNACC(juwTEO FUR ENEK6Y 14.90 1.30 15.00 15,00 15,OO 15,00 15.00 15.00 15,00 S0,00PRPLOUCTIONMILL,KWH 1525,26 1667,66 1994,12 2354,12 2583,13 2883.53 3312.94 3648,24 3957,65 4306b24
AVERAGF ENERGY TARIFF /KwH 0a30 0,37 0,56 0,74 0,87 0 87 1.05 1.15 s120 1. 7
ENERGY REVENUES 392,00 5I6,52 983.10 1480,74 1910,52 2132.37 2949,84 3577,55 4044.21 4637.35
OTHER OPERATIONAL REVENUES!! 42,90 370.58 973,00 89b,oo 2s55,00 2559,00 1998,00 2080,00 1789,00 238b,00
TOTAL REvENULS 434,90 887,10 195c,1° 3370,74 4265.12 4e91.37 4947,84 Se57,55 583327 7023,35
OPERATION/MAINTNCE o2,80 91.10 192,20 169,00 211.00 285,00 442.00 608.00 666,Uo 600,00
FUEL 24,30 253,70 910.00 1820, I00 2470.oO 21a70,00 1920,00 2000900 1715.00 d300,00
TURNOVER TAX 3,90 12,30 38,00 66,00 830o0 92,00 94,00 104,0o 11,00 134,00....... ...... , ." ...... ----- ...... ..... -- -,,W -_,," *- ... , .,-, _*_w
DIRECT COSTS 91,00 357,10 1140.20 2055,00 2564,00 2847,00 24S6,00 2712,00 24;9900 3234,00
ADMINISTRATION 47,90 46,20 51.2v 61,00 71,00 78,00 es,00 94,00 1r3,oo 114.00
OTHER INDIRECT CUSTS 0,00 6,10 10.00 15,00 15,00 IS,00 1S,00 15,00 15,00 15,00
TAXES 0.00 0,00 0,00 225.00 450.00 0.00 0.00 0,00 0,00 0.00=2:===z: =Tam:su: XT5ztuSm ;zzg:S:=ox X3us:::Sxz:zz:u u_:ga a s Y:ZSUUzZ *g as*as
TOTAL COSTS 13U.90 409.40 1201,40 2356.00 3100.00 2940.00 2556,00 2821,00 2617.00 3363,00
..... a.. ..... . ------ *......-------- -.---- *-----* ---
INCnME BEFORE DEPRECIATIUN 296,00 477.70 754.70 1020.74. 1165.52 l75l.17 2391,84 2836,55 3216,27 3660,35
DEPRECIATION 119.20 154.21 205I1t 261,52 S41,o8 511,05 733161 875.43 106b.53 1157,47=t:==am: :uSwuxz= azg3:i= SZ=z:au3 a.axaS:t maxaS3_ U3S:SUs UzzaU3E-- uzuS3za wz=x=-
INCI)ME BEFORE INTEREST 1760,0 323949 549,54 759.22 ?24.44 1240A32 1e5&.23 1961,12 22io,74 2sd2,88INTEREST CHARGEU OPtR 43,10 27.00 63,00 77,89 is,96 295,95 716.14 1209,20 1146,06 1439;93
3:::z:z: :m:c:Saa -::zZ3E 3zaxu tgua5:tS :aaaZUBX Sam:uSau 333333: x3UgU3xx 3353333
NET SURPLUS [+) 133.70 296,49 486,54 68l.33 659.18 944.37 942.09 751.92 1 064,6 ioo2,05
AVERAGE RATE BASE 2995.71 3660.48 5006,35 6410,97 8i3 ,26 13780,44 20727,61 24514,01 27644,34 3128!,97
*OPERATING RATIO X 31,94 46,15 61,42 69.77 72.68 62.67 51.S 6 49,86 44,86 47,88
*RATF oF RETURN 6 6.77 8,84 10,98 11.84 9.66 9.00 8,00 8.00 6,00 -8;00
Including fuel adjustment surcharge.
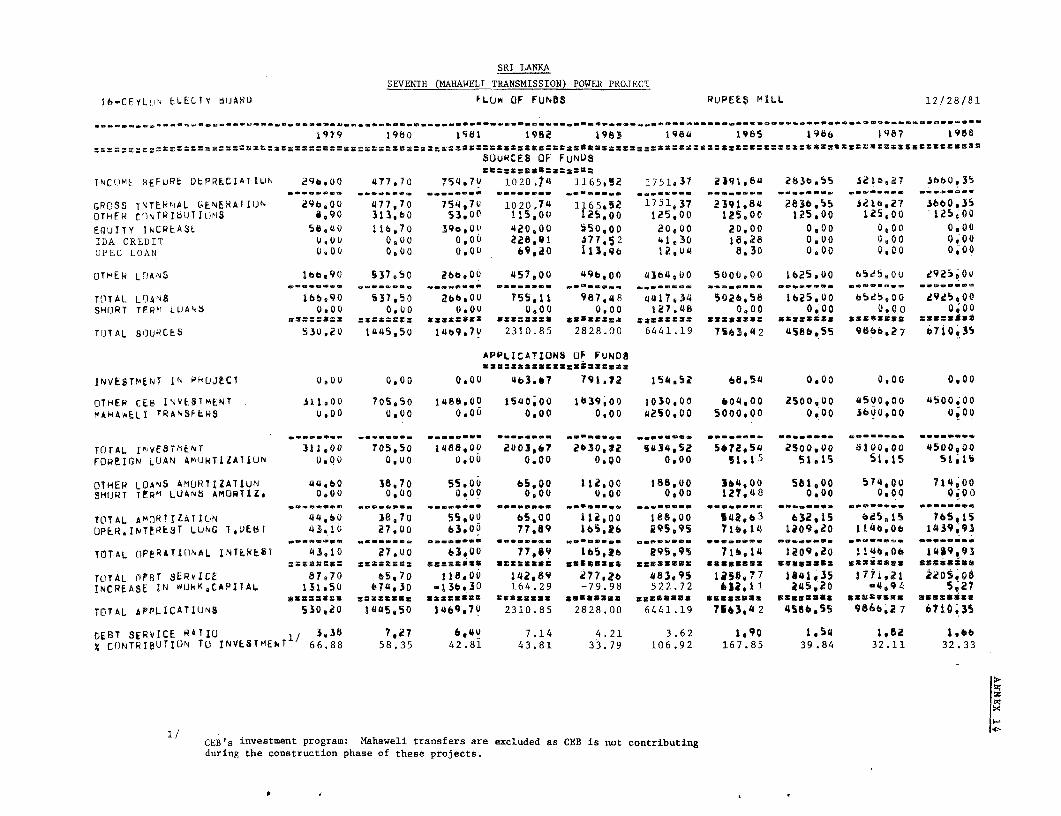
SRI LANKA
SEVENTH (MAHAWELI TRANSMISSION) POWER PROJECT
ib-CEYLtiN ELLECTY 'UARO FLUr OF FUNDS RuPEES MILL 12/28/81
1979 1980 l96l 1982 19823 1 9,8 1985 19b6 1987 1988
SOURCES OF FUNL9
TNC()ME REFURE DLPRkCIA1IUN 296,00 477,70 754,7U 1020.t 116s,!2 17512 37 2391,5a 283t,55 3I10,27 36bo,35
GROSS TETENNAL (ENERAIIUN 296,00 477,70 754,7V 1020 74 1165,S2 1751,37 2391,84 2836,55 3?16,27 3660,35
OTHER CfINTRIbOITIONS 6,90 313,60 53,00 115,00 125.00 125.00 125cOC 125,00 125,00 125e00
EQUITY INCREASL 5b,4u 116,70 39o,0u 420,00 550,00 20,0)0 20,00 0,0O 0 00 0,00IDA CREDIT Q0Q0 0,)00 0.00 228,91 $77,52 '1 130 18,28 0,00 0 00 0,00OPEC LOAN ,0 0 0,00 000 69,20 113,96 12,U4 8a30 0,00 0,00 0,00
OTHER LOANS 166,90 53 750 26600u 457,00 49,00 4364,U00 5000,00 1625,00 65es.00 d925-06a, … em ..... e..…....eClC C.* e.e
TOTAL LOANS lbb,90 537,50 266.00 755,1l 987.48 1417,30 5026,58 1625,0)0 65e!SO0 d925,oSHORT TERl LUANb 0,00 0,00 0,00 0,00 0.00 127048 0,00 0 00 0.00 0;00
_s:a:W:: ZM9==MXZ tSrx-$g5x xxv58XSX ZSBXX" SSCSSCXX =Szzxxxz sarxzixx -sssgxtxn sssXls9Z
TOTAL SOURCES 530,20 1445,5U I4h9.7U 2310.85 2828.00 6441.19 7S63,42 4586,55 9666,27 b71035
APPLICATIUN8 UF FUNDS0.0uZnasasacmma:Xxxxosms
INVESTMINT IN PkUJECT 0,00 0.00 0.00 63.67 791a72 154.52 t,li.54 0.00 0,00 0.00
OTHER CE8 INVESIMENT 311,00 705,50 1488,00 1540,00 1639,00 1030,00 6044,00 2500,00 45V0,00 4500,00MAHA,E.LT TRANSFLRS 0.00 0,0 0.00 0.00 0,00 4250,00 5000,00 0.00 36U0,00 0,00
TOTAL rNlVESTM1ENT 311,00 705,50 14a8a0 0 2003 ,7 2830, 12 S434,52 5*72,54 2500,00 8100,00 4500,00
FORtIGN LOAN AMIJHTILZATIUN a0.0 0.00 o,O0 0.00 0,O0 0,00 51I5 51.15 Sl,15 SI,IS
OTHER LOANS AMORTIZATIUN '4qo.o 38.70 55.0u 65,00 112,00 188,00 364,00 581,00 57 4,0U 71'4,00SHORT TtRm LOANS AMORTIZ, 0.0 0 0,00 0,00 0,00 o00 0,00 12,T48 0,00 0,00 0,00
.......... eptC.. .. a. .. ................... p. . . ......W.em.*..e .e. .ea.W. .eeee. . . .. ..
TOTAL AMoRTIZATION 44,60 38,70 55,01 65,00 I12,o0 188,00 142,63 632,15 625,15 765,15
OPER.INTEREST LUNG 1,UE8tI 43.10 27,00 63. 0 77,89 1*5,26 9Ss,s9 716,14 1209,20 110,06 1439;93a *........ ........ .... ........ ...... ........w*. ....... .,. ...........
TOTAL OPERATIONAL INTENESI 43,10 27,uo 63,00 77,89 165,26 295,95 716.14 1209,20 11446,06 1459,95==az3z= XXMZ::S: '::x:z3s asx:s:.: ummsemax zzaxzsa: c3mmus3x asxsaus g2xi*asm sm3a332
TOTAL nfBT SERVICE 87,70 65.7o II8. 0 142.89 077,26 483,9S 11SO,77 1*41,35 17*1,21 2205,08INCREASE IN WUKI,CAPITAL 131u50 674,30 -136.30 164.29 -79.98 522.72 632,11 245,20 -4,94 5,27
23sa32a3 s:33333 3as-z3:33 3srau33 a3333333 *g353333 uuzg:Js3 sS3333t 33g333 33s33g33
TOTAL APPLICATIUNS 530,20 1I445.50 1469,7U 2310.85 2828.00 6441.19 7563,42 456,55 9666a27 6710.35
DEBT SERVICE RATIU 1/ 3,38 7,27 8.4u 7.14 4.21 3.62 190 1.54 1,82 I,bb
X CONTRIBUTION To INVLSTMENT 66.88 58.35 42.81 43.81 33,79 106.92 167.85 39.84 32.11 32.33
CEB's investment program: Mahaweli transfers are excluded as CEB is not contributingduring the construction phase of these projects.
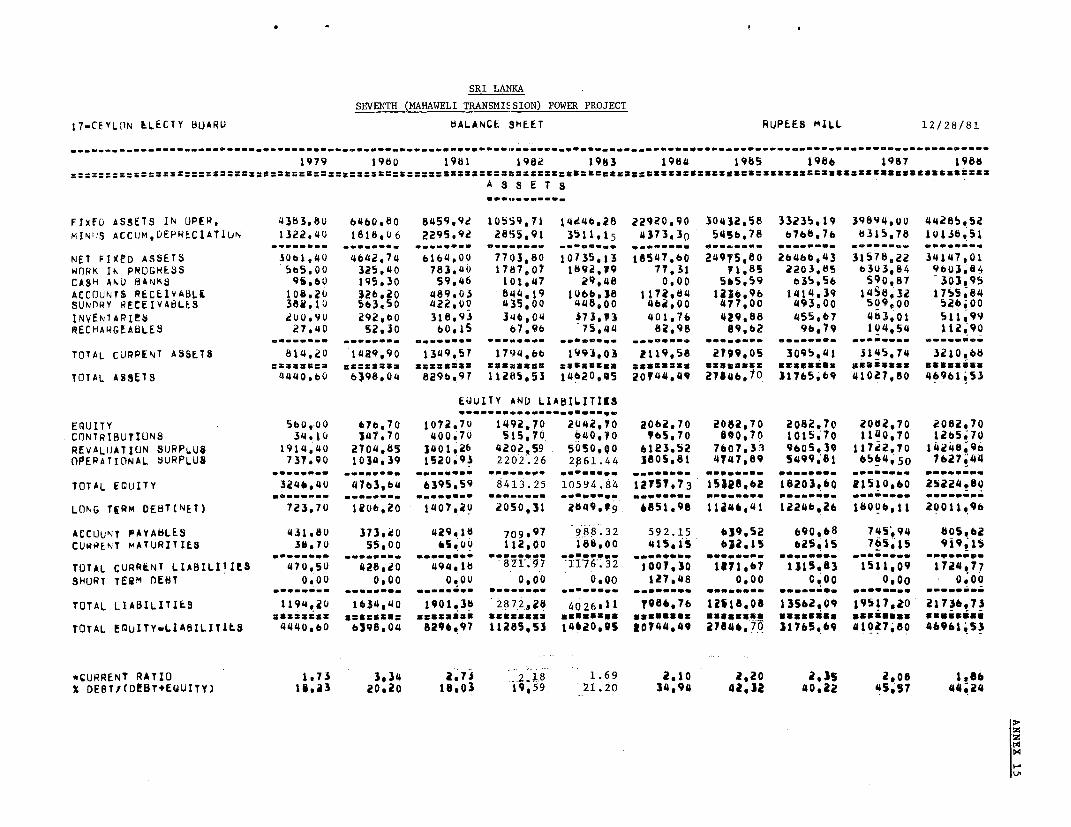
SRI LAN[KA
SEVENTH (MAHAWELI TRANSMI' SION) POWER PROJECT
17-CEYLON ELECTY bUARI) bALANCE SHEET RUPEES MILL 12/28/81
_ _ _ ---- _--...... ........ ....... -...... _-------- - W .- .. _....... . V..... ........ . _ .... ......... ........ ........ .. - ...
1979 1980 1981 1982 1983 1984 19b5 1966 1987 1988
A a S E T S
FIXED ASSETS IN OPER, 4383,80u b460.80 8459,9e 10559.71 14446.28 22920,90 30432,58 33235,19 39094,00 44285.52MINUJS ACCUM.DEPRECIATIUN 1322,40 1818,06 2295,92 2855,91 3511,15 4373,3Q 545,78 6768,76 8315,78 10138,51
,._._,_,,...... ...... _. V__ ....... 0--- .W....... . .. V__,, _.,.........,,,"_, .__,w ._-........._,
NET FIXED ASSETS 30bl,40 4642,74 6164,OU 7703,80 10735,13 18547.60 24975,80 26466,43 31578,22 34147,01WORK IN PROGRESS 5b5.00 325.40 783,40 1787,07 1892,9 77,31 71.85 2203.Hs 6303,84 9603,84CASH ANU BANKS 95,60 195.30 59,46 101,47 29,48 0.00 565,59 635656 590,87 303,95ACCOUNTS RECEIVABLi 106,20 326.20 489,03 844.19 1066,38 1172,84 1236.96 1414.39 14sa 32 1755,84SUNDRY RECEIVABLES 38il.10 563,50 422,00 435,00 448,00 462,00 877.00 493.00 509,00 652600INVENIAPIeS 200,90 29a,00 318.93 346,04 $73,93 401,76 429,88 455,67 463,01 511,99RECHARGtABLE5 27,40 52,30 60,15 67,96 75,44 82,98 89.62 96,79 104,54 112g90
,_,_...... _,-,_, ,... .... VV W .w .VW. VV. _._ . .aV.. ......….… ….....….
TOTAL CURPENT ASSETS 814,20 14R9,90 1349,57 17()4,b6 1993,03 2119.58 2799,05 3095,41 1145,74 3210.68
TOTAL AS569 4440,O6 6)98.04 829e,97 11286,53 14620,95 20144,49 27540,to 31765,69 41027,80 46961,53
EUUITY AND LIABILITIES07 ,.,,, . ..... .-_- .- w--V,
EQUITY 560,00 676,70 1072,7u 1492,70 2042, 0 2062,70 2082,70 2082.70 2082,70 20Q8270CONTRTBUTIONS 34.10 147,70 400.7Q 515,70 040,70 765,70 890,70 1015.70 1150,70 1265.70REVALUATION SURPLUS 1914,40 2704,65 3401,26 4202,59 5050,0 6123.52 7o07,33 960539 117e2,70 142'48,96OPERATIONAL SURPLUS 737,90 1034,39 1520,93 2202.26 2861.44 380S,81 4747,89 5499,81 6564,50 1627,44
TOTAL EQUlITY 3246,40 4763,64 6395,59 8413.25 10594.84 12757,73 15328,62 18203.60 21510,60 25224.609---__._........,_.,.*--.,..-.,, .............. ,,.W._... ._.,0 ....... _..W W. -_ W. ,, V. 0.. "v-- _,_ .
LONG TERM DEBT(NET) 123,70 1206,20 1407,20 2050,31 2649,g9 6851,98 11d46,41 12246,26 18006,11 20011 91
ACCOUNT PAYA8LES 431.80 373,20 429.10 709,97 988.32 592.15 639,52 690.68 745,94 a05,62CURRENT MATURITIES 38,70 55,00 65.O0 112,00 18Oo0 41S1i55 632,15 625.15 765.15 919 1'
mCC*fl.~~'e .. Wa.cfmfS f l*- .**CC maCCOO *CC.... ,ece. ,,,_,YCWC
TOTAL CURRtNT L.IABIL11ES 470,50 420.20 494,1l 8Z21-.97 '11-76'.32 1OOT30 187167 1315.83 1511,09 1724M77SHORT TEQM nEBT 0000 0,00 o0o0 0 00 0,00 127,48 0,00 0.00 0.00 0,00
*C...C. *ininC* Cefiflem . C CCCCCC oCOCCO CCC~~~~~~~~... VW CCOC.Wf a00Vm. WOWC.a
TOTAL LIABILITIES 1194,20 1634,40 1901.36 2872,2 4026,11 7986,76 12118,08 13562,09 19517,20 21736,73
TOTAL EQUITYuLIABILITILS 4440,60 6398,04 8296.97 11285,53 14620,9S 10744,49 27046,0, 31765.69 41027,80 46961,53
*CURRENT RATIO 1,73 3,34 2,73 2_i8 1. 69 210 2,20 2a,5 2,06 I,6o% DESTI(DEBT*EQUITY) 10.13 20.20 18,03 19,59 21.20 34,94 42,32 40,22 45.57 44i24
V.
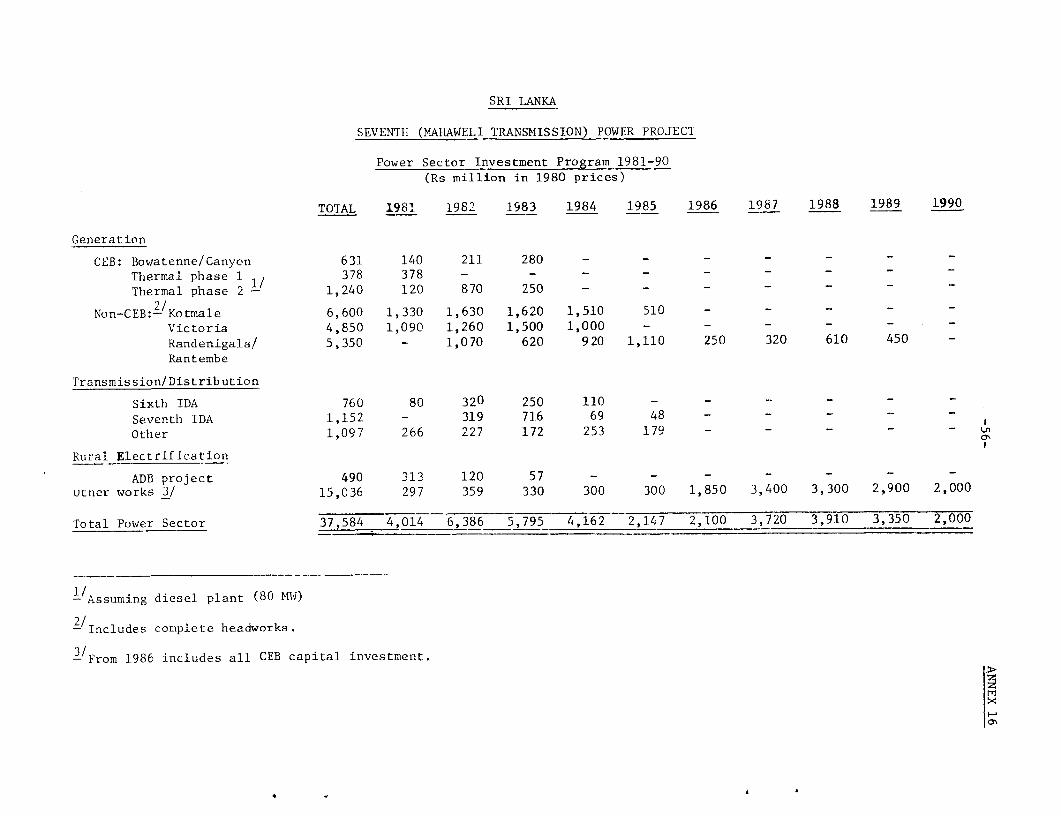
SRI LANKA
SEVENTH (MAHAWELI TRANSMISSION) POWER PROJECT
Power Sector Investment Program 1981-90
(Rs million in 1980 prices)
TOTAL 198' 1982 1983 1984 1985 1986 1987 1988 1989 1990
Generation
CEB: Bowatenne/Canyon 631 140 211 280 - - - - - - -
Thermal phase 1 378 378 - -
Thermal phase 2 1,240 120 870 250 - - - - - - -
Non-CEB:-/Kotmale 6,600 1,330 1,630 1,620 1,510 510 _ _ _ _
Victoria 4,850 1,090 1,260 1,500 1,000 - - - - -
Randenigala/ 5,350 - 1,070 620 920 1,110 250 320 610 450 -
Rantembe
Transmission/Distribution
Sixth IDA 760 80 320 250 110 - - - - -
Seventh IDA 1,152 - 319 716 69 48 - - - - -
Other 1,097 266 227 172 253 179 - - - - -
Rural Electrification
ADB project 490 313 120 57 - -utner works 3/ 15,036 297 359 330 300 300 1,850 3,400 3,300 2,900 2,000
Total Power Sector 37,584 4,014 6,386 5,795 4,162 2,147 2,100 3,720 3,910 3,350 2,000
-/Assuming diesel plant (80 MW4)
-/ Includes complete headworks.
-/ From 1986 includes all CEB capital investment.
0'
4 -~~~~~~~~~~~~~~~~~~~
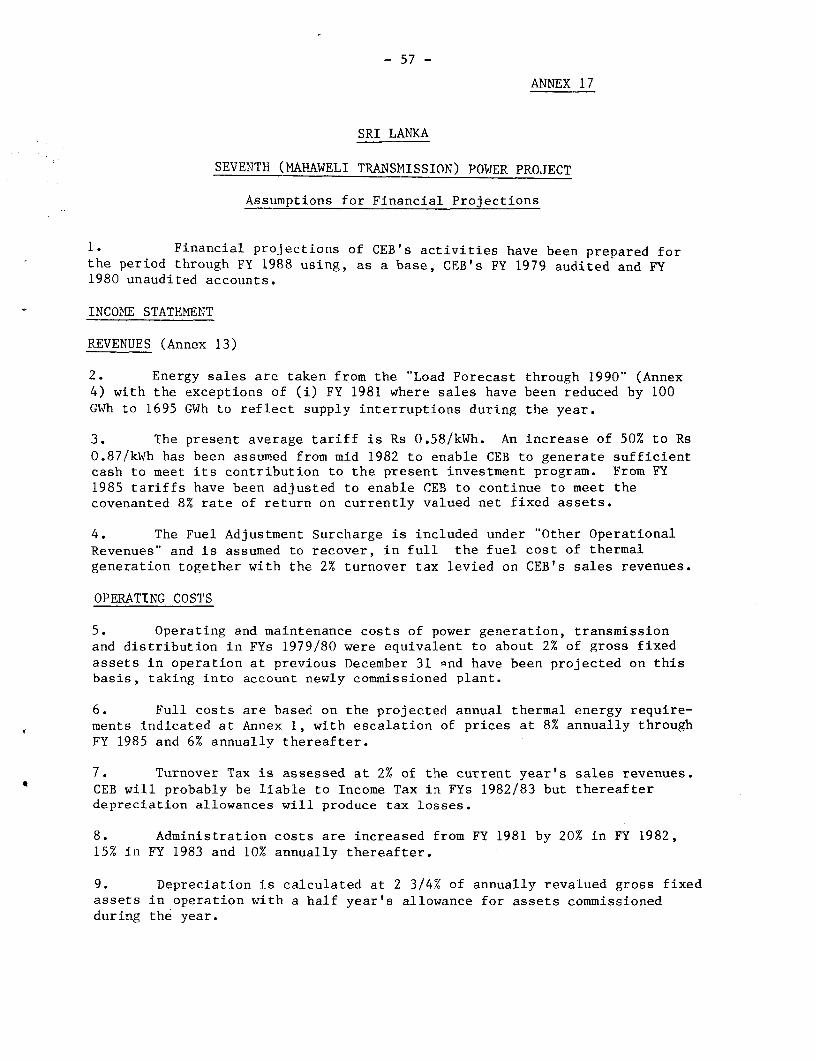
- 57 -
ANNEX 17
SRI LANKA
SEVENTH (MAHAWELI TRANSMISSION) POVER PROJECT
Assumptions for Financial Projections
1. Financial projections of CEB's activities have been prepared forthe period through FY 1988 using, as a base, CEB's FY 1979 audited and FY1980 unaudited accounts.
INCOME STATEMENT
REVENUES (Annex 13)
2. Energy sales are taken from the "Load Forecast through 1990" (Annex4) with the exceptions of (i) FY 1981 where sales have been reduced by 100GWh to 1695 GWh to reflect supply interruptions during the year.
3. The present average tariff is Rs 0.58/kWh. An increase of 50% to Rs0.87/kWh has been assumed from mid 1982 to enable CEB to generate sufficientcash to meet its contribution to the present investment program. From FY1985 tariffs have been adjusted to enable CEB to continue to meet thecovenanted 8% rate of return on currently valued net fixed assets.
4. The Fuel Adjustment Surcharge is included under "Other OperationalRevenues" and is assumed to recover, in full the fuel cost of thermalgeneration together with the 2% turnover tax levied on CEB's sales revenues.
OPERATING COSTS
5. Operating and maintenance costs of power generation, transmissionand distribution in FYs 1979/80 were equivalent to about 2% of gross fixedassets in operation at previous December 31 -nd have been projected on thisbasis, taking into account newly commissioned plant.
6. Full costs are based on the projected annual thermal energy require-ments indicated at Annex 1, with escalation of prices at 8% annually throughFY 1985 and 6% annually thereafter.
7. Turnover Tax is assessed at 2% of the current year's sales revenues.CEB will probably be liable to Income Tax in FYs 1982/83 but thereafterdepreciation allowances will produce tax losses.
8. Administration costs are increased from FY 1981 by 20% in FY 1982,15% in FY 1983 and 10% annually thereafter.
9. Depreciation is calculated at 2 3/4% of annually revalued gross fixedassets in operation with a half year's allowance for assets commissionedduring the year.
- 58 -
10. Annual contributions to CEB's Insurance Fund (1/10th of gross fixedassets) are included under operating and maintenance costs (paragraph 5).
11. Provision for bad and doubtful debts is a nominal RS 15 millionannually.
FLOW OF FUNDS STATEMENT (Annex 14)
12. CEB's investment program is set out in Annex 16: the positionthrough FY 1985 is as approved by GSL including the proposed 80 MW dieselproject. Beyond FY 1985 the investment program is very tentative and a blockprovision has been included in the years FY 1986 through FY 1988 based uponCEB's preliminary assessment of requirements, through FY 1990 at 1981 prices.
13. CEB's financing plan through FY 1985 comprises existing commitmentsby way of GSL equity/loan in respect of ongoing projects including the IDA-assisted sixth project, together with the onlending of US$47 million IDAUS$36 million and OPEC US$11 million) for 20 years including 3 years graceat 12% interest in respect of the proposed seventh project. GSL Equity ofRs800 million towards the cost of the 80 MW diesl project is included in FYs1982/83. The balance coming from CEB's internal resources. From FY 1986 GSLloans are assumed at 65% of the investment program (terms: 10 years, 10%interest). Consumer contributions of Rs.125 million annually are assumedthrough FY 1990.
14. Transfer of Mahaweli Assets
On completion of the various projects the power components will betransferred to CEB for operation and maintenance. Adjustments will be made inCEB's accounts to reflect these transfers, and will include an agreed proportion ofthe common costs (e.g. dams). Provisional sums included in the financialprojections are:
Rs Million Year
Victoria 4,250 1984Kotmale 5,000 1985Randenigala 3,600 1987
It is assumed that CEB will become responsible for servicing anequivalent amount of debt from the year following full commissioning of eachscheme. Final details of such transfers including the amount of any suchloans are still to be settled: they are provisionally assumed to berepayable at 10% interest over 25 years.
- 59 -
BALANCE SHEET (Annex 15)
Fixed Assets
15. CEB's fixed assets have been revalued to FY 1980 in accordance withthe movement of indices previously agreed with IDA. Thereafter, annualrevaluations have been projected based upon current guidelines of priceescalation for foreign and local goods: from FY 1981 through 1984 by 15%,13%, 11% and 10%, and by 8% annually thereafter.
16. Work-in-progress represents capital expenditure under the proposedproject and other CEB projects indicated at paragraph 12 above; transfershave been made to the fixed asset account on commissioning of new facilities.
Current Assets
17. The following assumptions have been made:
(a) Accounts receivable: equivalent to 3 months' billings.
(b) Inventories are to be reduced to "more reasonable levels" byDecember 31, 1982 1/ and thereafter maintained at these levels;
in the meantime the level at end FY 1980 is escalated annuallyusing current Bank international price guidelines.
(c) Sundry Receivables have been reduced in FY 1981 by the amountof GSL arrears in respect of local authority tariffs andprojected using the latest escalation rates.
(d) Rechargeable works outstanding have been escalated annuallyin accordance with the percentage issued for fixed assetrevaluation (paragraph 15).
Equity
18. Equity comprises CEB's initial capital, as increased from time totime by GSL grants towards construction costs (mainly rural electrification),income tax (paragraph 7), consumer contributions, revaluation surplus andretained earnings (operational surplus).
1/ Credit 1048-CE.
- 60 -
Long-term Debt
19. Long-term debt comprises (a) existing GSL loans to CEB includingthose made under onlending arrangements with IBRD, IDA, ADB, OPEC and theSaudi Fund (to cover foreign costs of previous and ongoing projects), and(b) loans required in accordance with paragraph 13 above to fund CEB'sinvestment program through 1988.
20. Current Liabilities comprise accounts payable, deposits and sundryitems which have been adusted annually for price escalation and currentmaturities of long-term loans (representing amortization due in the followingfiscal year).
-61-ANNEX 1o
SRI LANKA
SEVENTH (MAHAWELI TRANSMISSION) POWER PROJECT
(Ceylon Electricity Board)
Economic Analysis
Method
1. The proposed project constitutes a part of the transmission
expenditure necessary to transmit additional power from existing and futuregenerating stations to the load centers. It is an integral part of the totalpower sector investment program and can be justified only as part of thelatter rather than as an independent, self-contained project. The approachadopted in this report, therefore, is one of justification of the entirepower sector investment program in its present state, allowing the conclusionthat the part covered by the proposed project is implicitly justified.
2. The analysis is complicated by the fact that CEB, the authorityultimately responsible for supplying power at the retail level, controls onlythe smaller part of total sector investment. While account has been takenof power demand forecasts to a certain extent, the input of CEB into theplanning of the implementation of the Mahaweli Program has only recentlybegun to be felt more strongly. While a least-cost program, using the WASPcomputer model, has been completed recently, the investment sequenceavailable at the time of appraisal may not have been of a least-cost nature.This situation required an analysis of the overall economic feasibility ofthe only existing investment program by comparing its capital and currentcosts with the implicit benefits derived from the availability of additionalpower supply.
Economic Costs
3. Cost items are valued at CIF or equivalent border prices, whereavailable. The remaining local costs are split into labor and other localcost components, and adjusted by a shadow/market wage ratio of 0.67, and by astandard conversion factor of 0.91.
4. The foreign (CIF) and local (domestic price) components of newcapacity are estimated to be as follows:
Foreign (%) Local (%) of which Labor (%)
Gas turbines 95 5 2.5Diesel thermal 80 20 10Hydro 75 25 12.5Transmission & Distribution 68 32 25.5
-62-
5. Operating and maintenance expenditure is assumed to amount to 3% ofcumulative investment, with equal shares of labor and other local cost. Fuelcost of thermal plants is based on December 1980 international prices 1/CIF Colombo. The fuel cost amounts to Rs 1.45/kWh for diesel thermal plant,Rs. 2.04/kWh for gas turbines, and Rs. 1.35/kWh for steam plant.
Economic Benefits
6. Benefits of electricity supply, accruing to final consumers areassessed as the willingness to pay for a given quantity of energy forspecific purposes, expressed in CIF terms or border price equivalent.Analysis of this willingness to pay is based on (i) tariff revenue (ii)observed expenditure on alternative energy sources in the absence ofelectricity supply, and (iii) on sample interviews. The sum of revenue andconsumer surplus is estimated as the area under the derived demand curve forenergy required for output production or lighting. Low, medium and highestimates for user surplus are examined.
7. Domestic electricity consumption.
Almost 90% of Sri Lanka households are using kerosene lamps forlighting; in rural areas, this percentage rises to 97%. Domestic uses ofelectricity other than lighting are limited (with the exception of theColombo metropolitan area): about 85% of total domestic electricityconsumption is estimated to be used for lighting purposes. In the absenceof electricity supply, households would use kerosene: the total amount oflighting, however would be significantly lower due to the high cost of thekerosene alternative. About 15% of present total domestic electricity usecan be considered minimum lighting requirements. This portion is valued atthe economic cost of Rs 6.30 per kWh equivalent. The remainder ofconsumption is assumed to be valued at a price declining to Rs 1.37/kWh (theaverage 1982/83 domestic tariff revenue) at the margin: the average value ofthis portion is Rs 4.20 per kWh equivalent. These values are applied to CEB-supplied domestic consumption as well as to that part of the "bulk supply"to municipalities that is estimated to be domestic use.
8. The cost of kerosene lighting is arrived at as follows, assuming alamp with a light output of 60 W equivalent, used for 1000 hours per yearfor 5 years:
1/ Gas Oil : US$326.95 per tonne Fuel Oil : US$210.22 per tonne
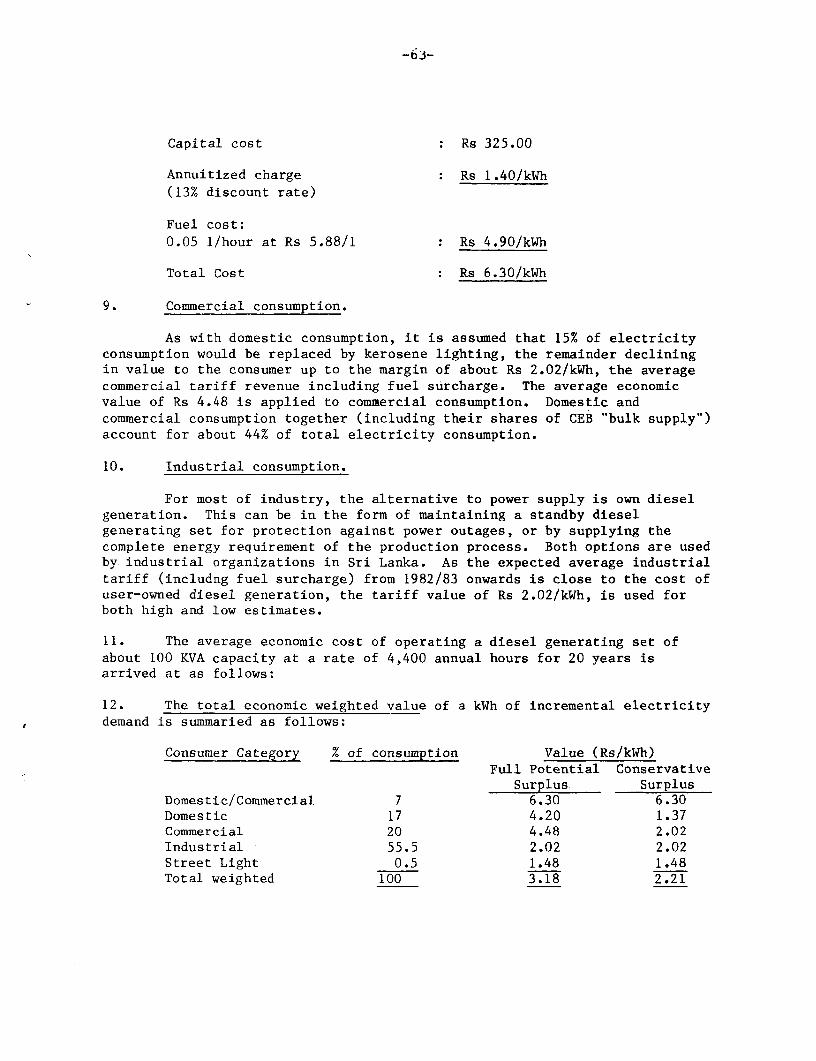
Capital cost Rs 325.00
Annuitized charge Rs 1.40/kWh
(13% discount rate)
Fuel cost:0.05 1/hour at Rs 5.88/1 : Rs 4.90/kWh
Total Cost : Rs 6.30/kWh
9. Commercial consumption.
As with domestic consumption, it is assumed that 15% of electricityconsumption would be replaced by kerosene lighting, the remainder decliningin value to the consumer up to the margin of about Rs 2.02/kWh, the averagecommercial tariff revenue including fuel surcharge. The average economicvalue of Rs 4.48 is applied to commercial consumption. Domestic andcommercial consumption together (including their shares of CEB "bulk supply")account for about 44% of total electricity consumption.
10. Industrial consumption.
For most of industry, the alternative to power supply is own dieselgeneration. This can be in the form of maintaining a standby dieselgenerating set for protection against power outages, or by supplying thecomplete energy requirement of the production process. Both options are usedby industrial organizations in Sri Lanka. As the expected average industrialtariff (includng fuel surcharge) from 1982/83 onwards is close to the cost ofuser-owned diesel generation, the tariff value of Rs 2.02/kWh, is used forboth high and low estimates.
11. The average economic cost of operating a diesel generating set ofabout 100 KVA capacity at a rate of 4,400 annual hours for 20 years isarrived at as follows:
12. The total economic weighted value of a kWh of incremental electricitydemand is summaried as follows:
Consumer Category % of consumption Value (Rs/kWh)Full Potential Conservative
Surplus SurplusDomestic/Commercial 7 6.30 6.30Domestic 17 4.20 1.37Commercial 20 4.48 2.02Industrial 55.5 2.02 2.02Street Light 0.5 1.48 1.48Total weighted 100 3.18 2.21
-64-
13. If tariff revenues are taken to be a proxy of the minimum benefit,the basic tariff as proposed for 1982/83 by CEB plus the average expected
fuel surcharge to be billed to the consumer is an appropriate measure forperiod of analysis. The weighted value of the 1981 tariff is summarized asfollows:
Consumer Category % of consumption Value (Rs/kWh)With Surcharge
Domestic 20 0.69Commercial 24 1.02Industrial 55.5 1.02
Street Light 0.5 0.75Weighted 0.96
However, the weighted value of the 182/83 tariff is expected to be Rs
1.90/kWh (including the new fuel surcharge).
Cost/Benefit Analysis
14. The entire power sector investment program as shown at the time ofappraisal is presented in Annex 16. The Mahaweli (non-CEB) hydro projectsof Kotmale, Victoria, Randenigala, and Rantembe are assumed to be guided bypower sector needs rather than irrigation requirements in theirimplementation and the total cost of the dams is included.
15. The economic costs of this investment program are compared to thebenefits arising from incremental sales 1/ made possible by this investment,using tariff as well as economic valuation of electricity supply and CEBestimates of demand. As a sensitivity analysis, the cost of the entireprogram is varied by 10% up and down, and the fuel price is assumed to risein real terms by 3% per year. All cost and benefit streams for the base caseand the delayed case are shown in Table 1. Local costs are presented afteradjustment to border prices. The exercise is conducted in terms of constant1980 prices. For purposes of comparison, benefits are also expressed interms of tariff revenue rather than in economic terms, implying a substantialunderestimate of benefits. Results are presented in Table 2.
1/ Estimated at the time of formulation of the investment program.
16. Benefits and costs are underestimated if the irrigation component ofthe Mahaweli program is taken into account. Additional costs would bedownstream irrigation investment expenditures, additional benefits theincreased net agricultural output resulting from irrigation. Table 2indicates that the power sector investment program including the completeMahaweli headworks is likely to be economically justified using electricitybenefits alone. The total power-cum-irrigation investment package istherefore likely to be justified.
r
.
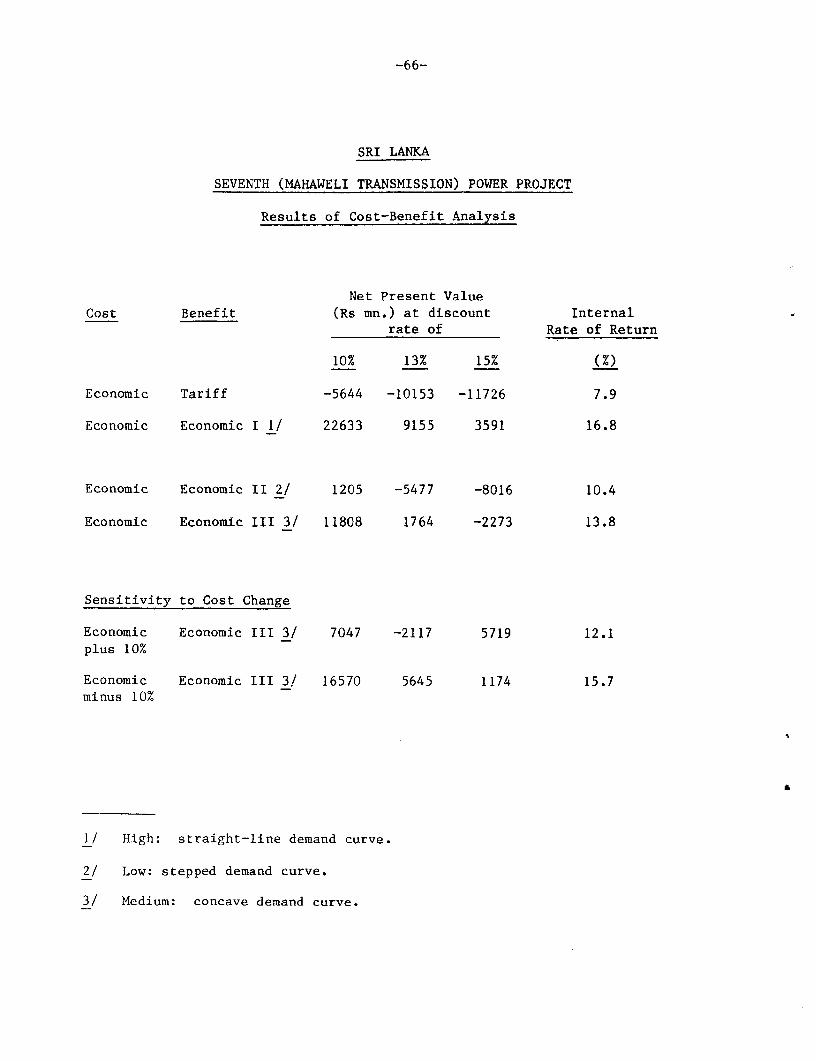
-66-
SRI LANKA
SEVENTH (MAHAWELI TRANSMISSION) POWER PROJECT
Results of Cost-Benefit Analysis
Net Present ValueCost Benefit (Rs mn.) at discount Internal
rate of Rate of Return
10% 13% 15% (%
Economic Tariff -5644 -10153 -11726 7.9
Economic Economic I 1/ 22633 9155 3591 16.8
Economic Economic II 2/ 1205 -5477 -8016 10.4
Economic Economic III 3/ 11808 1764 -2273 13.8
Sensitivity to Cost Change
Economic Economic III 3/ 7047 -2117 5719 12.1plus 10%
Economic Economic III 3/ 16570 5645 1174 15.7minus 10%
1
1/ High: straight-line demand curve.
2/ Low: stepped demand curve.
3/ Medium: concave demand curve.
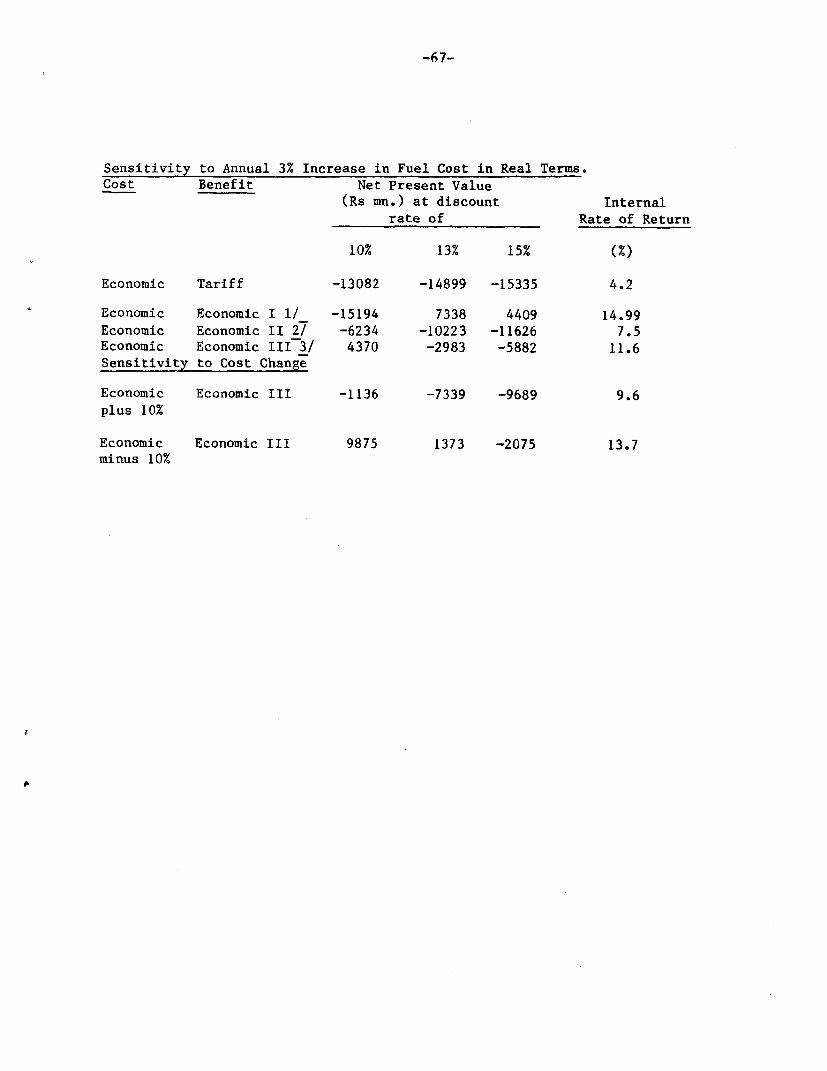
-67--
Sensitivity to Annual 3% Increase in Fuel Cost in Real Terms.
Cost Benefit Net Present Value(Rs mn.) at discount Internal
rate of Rate of Return
10% 13% 15% (%)
Economic Tariff -13082 -14899 -15335 4.2
Economic Economic I 1/ -15194 7338 4409 14.99
Economic Economic II 2/ -6234 -10223 -11626 7.5
Economic Economic III 3/ 4370 -2983 -5882 11.6
Sensitivity to Cost Change
Economic Economic III -1136 -7339 -9689 9.6
plus 10%
Economic Economic III 9875 1373 -2075 13.7
minus 10%
t
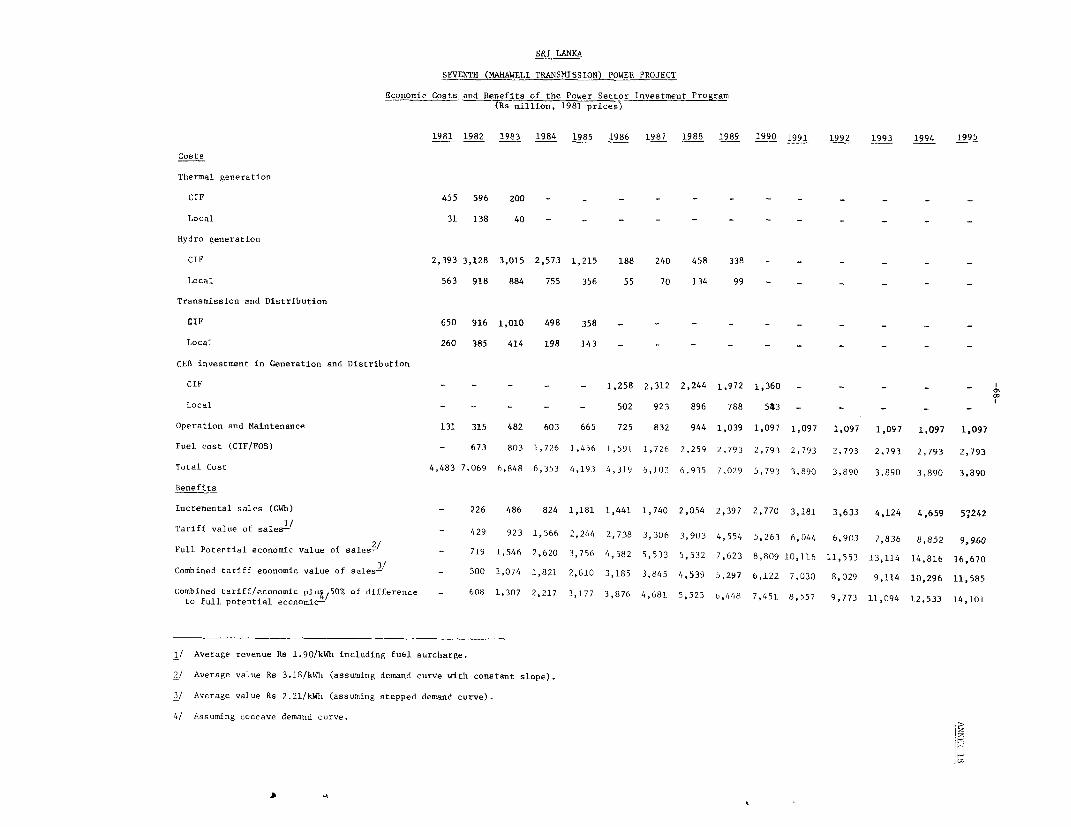
SRI LANKA
SEVENTH (MAHAWELI TRANSMISSION) POWER PROJECT
Economic Costs and Benefits of the Power Sector Investment Program
(Rs million, 1981 prices)
1981 1982 1983 1984 1985 1986 1987 1988 1989 1990 1991 1992 1993 1994 1995
Costs
Thermal generation
CIF 455 596 200 - - - - - - - - - - - -
Local 31 138 40 - - - - - - - - - - - -
Hydro generation
CIF 2,393 3,128 3,015 2,573 1,215 188 240 458 338 - - - - - -
Local 563 918 884 755 356 55 70 134 99 - _ - - - -
Transmission and Distribution
CIF 650 916 1,010 498 358 - - - - - - - - - -
Local 260 385 414 198 143 - - - - - - - - _
CEB investment in Generation and Distribution
CIF - - 1,258 2,312 2,244 1,972 1,360 - - - _ -
Local - - - 502 923 896 788 543 - - -
Operation and Maintenance 131 315 482 603 665 725 832 944 1,039 1,097 1,097 1,097 1,097 1,097 1,097
Fuel cost (CIF/FOB) - 673 803 1,726 1.456 1,591 1,726 2,259 2,793 2,793 2,793 2,793 2.793 2,793 2,793
Total Cost 4,483 7,069 6,848 6,353 4,193 4,319 6,103 6,935 7,029 5,793 3,890 3,890 3,890 3,890 3,890
Benefits
Incremental sales (GWh) - 226 486 824 1,181 1,441 1,740 2,054 2,397 2,770 3,181 3,633 4,124 4,659 5?242
Tariff value of sales- - 429 923 1,566 2,244 2,738 3,306 3,903 4,554 5,263 6,044 6,903 7,83b 8,852 9,960
2/Full Potential economic value of sales- - 719 1,546 2,620 3,756 4,582 5,533 5,532 7,623 8,809 10,116 11,553 13,114 14,816 16,670
Combined tariff economic valuie of sales-/ - 500 1,074 1,821 2,610 3,185 3,845 4,539 5,297 6,122 7,030 8,029 9,114 10,296 11,585
combined tariff/economic plu/50%O of difference - 608 1,307 2,217 3,177 3,876 4,681 5,525 6,448 7,451 8,557 9,773 11,094 12,533 14,101
to full potential economic-
1/ Average revenue Rs 1.90/kWh including fuel surcharge.
2/ Average value Rs 3.18/kIh (assuming demand curve with constant slope).
3/ Average value Rs 2.21/kWh (assuming stepped demand curve).
4/ Assuming concave demand curve.
jtw
-69- ANNEX 19
SRI LANKA
SEVENTH (MAHAWELI TRANSMISSION) POWER PROJECT
Related Documents and Information in the Project File
1. Ceylon Electricity Board: Review of ManagerialEffectiveness: Urwick International Ltd.,February 1981.
2. Ceylon Electricity Board: Project Report forMahaweli 220 kV and 132 kV Transmission Project:Preece Cardew and Rider, May 1981.

St I
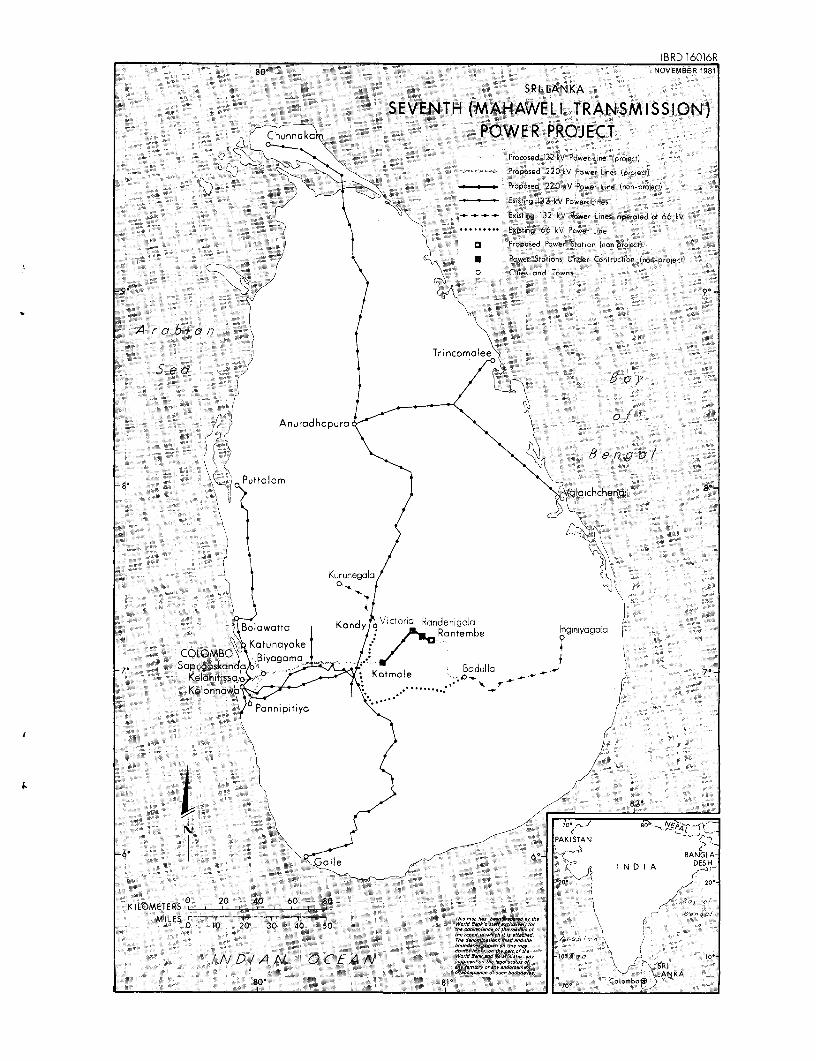
IBRD 16016R810- NOVEMBER 1981
SRI LANKA
SEVENTH (MAHAWELI TRANSMISSION)C unno a POWER PROJECT
C- s>\ - -Proposed 132 kV Power Line (prqect)
Proposed 220kV Power Lines (projectl
t 8 + , Proposed 220 kV Power Line (non-project)
Existing 132 kV Power Lines
Existing 132 kV Power Lines operoted ot 66 kV
-. .... -- Exising 66 kV Power Line
) T V n Proposed Power Station (non project)
U K CtA * Power Stations Urder Contruction (non-project)
D Cdtiee ornd Towns
-90 90
A rcbl'cn t
Are aba Trincomalee
Anuradhopuro o f
\ ) I> 1B e n g aPuttalcm la ichchenai 8°
> i ~~~Kurunegoal >
01~~~~~~~~~~~~~~~~~~(
olawatta Kandy c1OrIa Randenigaa Inginyagalc
COLOMBO Katunoyoke
-7- Sapuatss 9 Bodulla - 70Kotm aol e-.. _
Pannipitiya ( '
82'
70'. I
PAKISTAN
6'- EI~~~~~~~~~A NGLIA-_I'e | \ _ _ / 04_ X { I N D I A DESH
0 20 bo 80 40KILOMETERS 6 80
MILES ,w hai n'c/fIn,.I. r0rin. O 0 oOs
INVDIA N O C EA 10 A/ r to*r~~\SRIorarc^ee4filerSat;" ff >LANKA
80 i - wO .x.r .0.. ColomboJ