Embed Size (px)
Citation preview
Document of
The World Bank FIL COPYFOR OFFICIAL USE ONLY
Veport No.2830a-PH
PHILIPPINES
STAFF APPRAISAL REPORT
THIRD PORTS PROJECT
April 30, 1980
Projects DepartmentEast Asia and Pacific Regional Office
This document has a restricted distribution and may be used by recipients only in the performance oftheir official duties. Its contents may not otherwise be disclosed without World Bank authorization.
Pub
lic D
iscl
osur
e A
utho
rized
Pub
lic D
iscl
osur
e A
utho
rized
Pub
lic D
iscl
osur
e A
utho
rized
Pub
lic D
iscl
osur
e A
utho
rized
CURRENT EQUIVALENTS
-= Peso
P :- US$0.137
.k~.on = US$137,000
= P 7.30
WEIGHTS AND MEASURES
I mte() = 3.28 feet (ft)1 Ig -i2.r (km) 0.62 mile (mi)
(kg) = 2.2 pounds (lb)rL4i0t= 0.98 long ton (ton)
ABBREVIATIONS
ADB * Asian e . -- BankBOC - BureattBPW - Bureau w-Jt i ._
GR ross .. I 'IATCTP - lnter-Age - ;-S-: cal Committee on Transport PlanningILMLW - .iean Lowe-i erM. TC - linistri. -i:ort and CommunicationsNIH - Ministr', s -Lc HighwaysMPW - Ministry O. ic WorksMPWTC - Ministry of T>iU Works, Transportation and CommunicationsPAL - Philippine 3 L,nesPEA - ]?hilippine. :te AuthorityPMU - port mana&&. M titPNR - Philippine wisl RailwaysPPA - Philippine AuthorityPPDO - 1'lannin- e = ct Development OfficePTS - Phllpp.-- ort SurveyNEDA - National' -'c Development AuthorityNRT - net reg. onsNTSS - National ' t Systems Study
GOVERNMENT OFHIE REPUBLIC OF THE PHILIPPINES
FISCAL YEAR
January 1 to December 31
PHILIPPINES FOR OFFICIAL USE ONLY
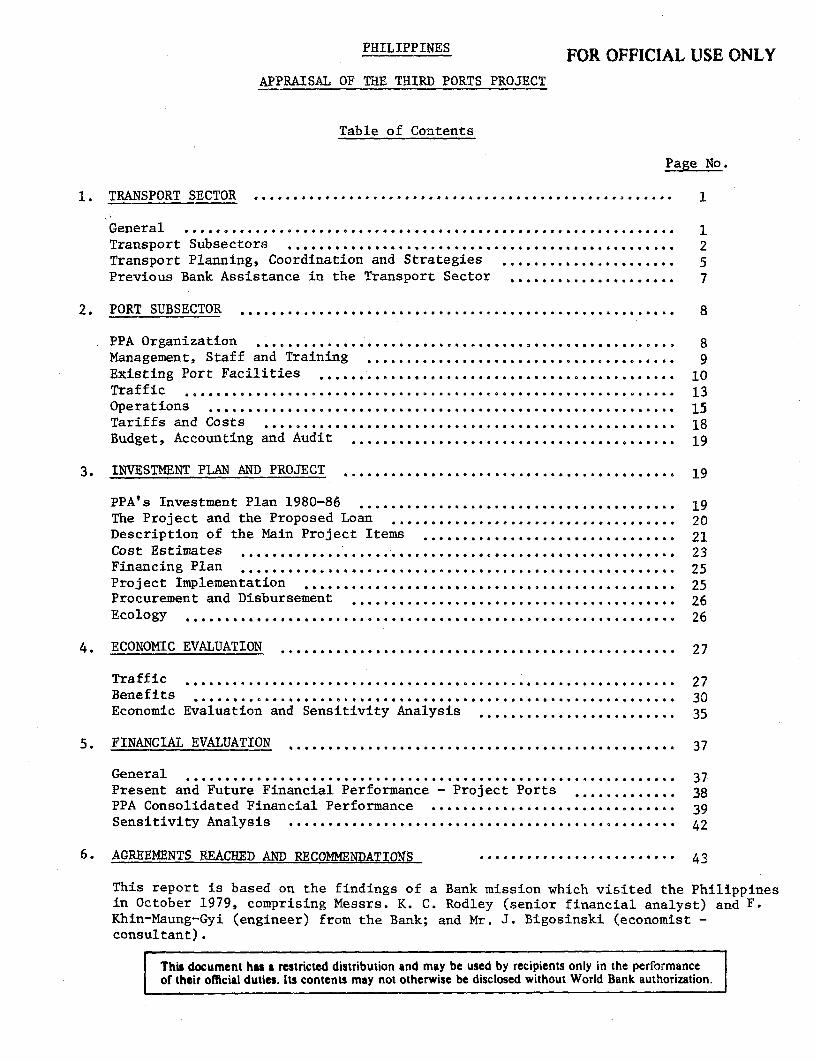
APPRAISAL OF THE THIRD PORTS PROJECT
Table of Contents
Page No.
1. TRANSPORT SECTOR ....................... 1
General ............................................................ 1Transport Subsectors ...................., 2Transport Planning, Coordination and Strategies ...................... 5Previous Bank Assistance in the Transport Sector ..................... 7
2. PORT SUBSECTOR ....................................................... 8
PPA Organization ................................ . . . 8Management, Staff and Training ........................................ Existing Port Facilities ........................................ 10Traffic .............................. 13Operations .............................. 15Tariffs and Costs .............................. 18Budget, Accounting and Audit ......................................... 19
3. INVESTMENT PLAN AND PROJECT .19
PPA's Investment Plan 1980-86 . -- 19The Project and the Proposed Loan .20Description of the Main Project Items . 21Cost Estimates ...................................................... 23Financing Plan .. ............................ 25Project Implementation .................................. 25Procurement and Disbursement ......... ....................... 26Ecology .................................. 26
4. ECONOMIC EVALUATION .................................. 27
Traffic ................................ 27Benefits .......,.. .............. 30Economic Evaluation and Sensitivity Analysis ....................... .. 35
5. FINANCIAL EVALUATION ................................................ 37
General .. 37Present and Future Financial Performance - Project Ports ... 38PPA Consolidated Financial Performance .. . 39Sensitivity Analysis .-------------...----..... 42
6. AGREEMENTS REACHED AND RECOMMENDATIONS -------------------- - 43
This report is based on the findings of a Bank mission which visited the Philippinesin October 1979, comprising Messrs. K. C. Rodley (senior financial analyst) and F.Khin-Maung-Gyi (engineer) from the Bank; and Mr. J. Bigosinski (economist -consultant).
This document has a restricted distribution and may be used by recipients only in the performanceof their official duties. Its contents may not otherwise be disclosed without World Bank authorization.

-2-
Page No.
TABLES IN TEXT
2.01 Philippine Ports Forecast Traffic Smmary ... ..................... 142.02 Project Ports Forecast Traffic Summary .......................... 153.01 PPA Investment Plan 1980-84 .l....... ... ... ...... .... ... . .. . .. . .. . 203.02 Project Cost Sumnary ....... 243.03 Project Financing Plan .. ............................... 254.01 Economic Rate of Return ............ .......... 364.02 Switch Value Analysis ***...................**g..... 364.03 Net Present Value .............................. 375.01 Summary Project Port Income & Expenditure Account 1979-86 ....... 385.02 Summary PPA Income & Expenditure Account 1980-86 ................ 395.03 Summary PPA Consolidated Balance Sheet 1980-86 .. 6................ 405.04 Summary PPA Consolidated Cash Flow Forecast 1980-84 ............. 415.05 Sensitivity Analysis ........... .0.0.0.0.o ............... ..... 43
ANNEXES
1. Outline Terms of Reference for Technical Assistance ............... 462. Supporting Tables, Charts and Maps ......................... $ .... 473. Selected Documents and Data Available in the Project File .... ..... 49
April 1980
PHILIPPINES
STAFF APPRAISAL REPORT
THIRD PORTS PROJECT
1. Transport Sector
A. General
1.01 In the last decade, t'he Philippines has made significant advances inthe transport field, far exceeding any previous ten-year period both in termsof funds expended and results achieved. Between 1968 and 1978, the totalpublic transport expenditures amounted to P 14 billion (US$1.9 billion)representing over 30% of total public investment outlays. Since 1975, annualpublic transport expenditures increased rapidly (although only representingabout 1.3% of GNP), with highways absorbing about 74% of the total; of theremainder, airports received 10%, ports 9% and railways 7%. These transportexpenditures for the development and improvement of thle hithierto neglectedtransport system were necessary to meet the increased demand for movement ofgoods and passengers in the seventies, which had resulted fromo higher income,population and industrial and agricultural production.
1.02 The 1978-81 projections for commodity flows and passenger trafficindicate a larger increase in inter-island movements of freight and passengersbetween the food deficit areas of Luzon and the agricultural surplus areasof Xindanao than for road transport within the major islands. Accordingly,the 1979-82 Investment Program allocates a greater share of total publictransport expenditures to the expansion of ports and airports; 19% for ports,14% for airports, 9% for railways, and 58% for highways. No significantpublic funds are allocated for shipping investment since it is largelyfinanced by the private sector.
1.03 The total transport investment tentatively allocated in the Govern-ment's indicative 1979-82 Investment Program is F 14,374 million(JS$1,942 million);/1 an increase of about one third over the previous four-year period. However, the transport share of total public investment willdecrease from the previous level of one third to about one fifth of the totalprogram; the power sector will receive an increased share of the allocation toimplement the Government's objective to reducing dependence on importedpetroleum by constructing hydro, nuclear, and geothermal power plants asalternative sources of electrical energy.
/1 A ten-year transport investment program is under preparation by theMinistry of Transport with the assistance of the National EconomicDevelopment Authority and foreign advisors.
-2-
1.04 Between 1970-76, transport developed somewhat faster than the economyas a whole: freight and passenger movements grew by about 8% and 7% p.a.respectively, while real GNP grew by 6%. Freight and passenger movements byinter-island shipping accounted for much of this increase, at 14% and 8%respectively, with road transport growing at a lesser pace: 4% for freightand 5% for passengers. The average annual target growth rate of GNP is 7.5%during 1978-85. In the light of the projected growth of the economy, bothroad freight and passenger transport is expected to grow at 8% during the sameperiod.
1.05 goad transport is the dominant mode within the two major islandsof Luzon and Mindanao, estimated to account for nearly 80% of passengertraffic; but it is estimated that the road's share of total freight traffichas decreased from 57% in 1970 to 44% in 1976. Although reliable data are notavailable, privately operated inter-island shipping, serving a populationscattered over hundreds of islands, appears to be the largest transport mode(about 54%) for freight traffic. The increased share of inter-island traffichas been due to the growing commerce between the food deficit areas of Luzonand the agricultural surplus areas of Mindanao. Relatively short inlanddistances have limited railways to a small fraction of total traffic.
B. Transport Subsectors (Map 14769)
Highways
1.06 The public road transport system in the Philippines is made up ofthree major interlocking components: (a) national; (b) provincial, municipaland city; and (c) barangay (mainly farm-to-market) roads. The total networkconsists of about 152,800 km of roads, of which 22,900 km are classified asnational, 29,000 km provincial, 13,400 km city and municipal, and 87,500 kmbarangay roads. National roads include about 122 km of toll expressways withgrade separated intersections north and south of Manila. Except for the tollroads, road classification is often arbitrary as it is not always based onfunction. In remote areas such as northeastern Luzon and many parts ofMindanao, national roads serve as penetration roads providing the only accessto the villages. In many parts of the country, provincial and barangay roadsare indistinguishable, both being characterized by low volume traffic servingthe limited influence areas to move agricultural inputs and outputs and toconnect the rural communities with administrative and market centers.
-3-
1.07 Despite Government efforts /1 since 1969 to develop a modern highwaynetwork, the system is still inadequate for the current level of traffic.Although sufficient in location and extent, for the most part, condition ofthe roads is deplorable, and missing bridges effectively isolate many ruralcommunities. Most unimproved roads are in poor condition due to: (a) defi-cient designs resulting in inadequate drainage, embankment and pavements; (b)lack of proper maintenance; (c) damage from frequent overloading (many of thetrunk roads were built long ago and intended to carry only a small number ofvehicles); and (d) insufficient funds to repair flood damage caused during therainy and typhoon seasons. Moreover, vehicle operating and travel costs aregenerally high, as only 42% of the national highways and 13% of the provincialroads are paved, (compared with 85% and 35% in Thailand).
Railways
1.08 The Government-owned Philippine National Railways (PNR) has a networkon Luzon totalling 1,060 km, of which 740 km of main line and 80 km of branchlines and sidings are operating. Most of PNR's track was relaid during the1960s with Japanese aid; the rest is in very poor condition. Management,maintenance and operations of the railways have been inadequate. Except inthe Bicol region, the main line is paralleled by highways for most of itslength and, as haulage distances for most commodities are relatively short,and commodities are in small shipments, the railway is not presentlycompetitive with trucks and buses. It is unlikely that this situation willchange in the near future.
1.09 The Government's present objective is to improve PNR operations topermit the railroad to cover at least current operating costs. Programs underthe 1971-76 Rehabilitation Plan have improved services and passenger andfreight traffic have increased somewhat since 1973. In 1977, PNR obtained aloan from the Asian Development Bank (ADB) to rehabilitate its Southern Line(about 450 km), which serves the area between Manila and Legaspi. A secondrailway, the privately owned Panay Railway operates an antiquated 117 km oftrack on Panay Island: it is presently unsafe but is undergoing minimumrehabilitation to permit limited services on Panay Island which will includethe transport of sugar to Iloilo port for export.
/1 Major road improvement activities began in 1969 following completion ofthe Philippine Transport Survey (PTS), a two-year study conducted underUNDP financing with the Bank acting as Executing Agency. The PTSrecommended improvement of about 6,000 km of national roads,reorganization of the highway administration, and improvments in roadmaintenance procedures. Most of the priority roads identified in the PTShave been or are being improved with local resources, supplemented byassistance from Japan, USAID, ADB and the Bank. Between 1969 and 1979about 4,800 km of national and 5,200 km of provincial roads have beenconstructed or improved.
-4-
Ports
1.10 There are 18 major and 76 minor national ports, and about 390municipal ports throughout the Philippine archipelago, plus over 200 privatepiers and wharves. Manila, the largest port, accounts for about 46% of the23 million tons of cargo handled each year by public ports. Most long-established public ports are located where natural protection is available butsedimentation problems occur in many ports. More modern private piers andwharves, which handle mainly petroleum products and iron ore, are generallylocated to take advantage of naturally deep water. Many public ports sufferfrom inadequate work areas and transit sheds, and poor maintenance. Thecumulative effect of these deficiencies is congestion which unduly restrictsthe movement of cargo, slows stevedoring and lengthens ship turn-around time.
1.11 In the past few years the Government has received assistance fromthe ADB for improvement of port facilities at Manila, Davao and Cotabato,from the Federal Republic of Germany for port works at Davao and Iligan, andfrom the IBRD for the expansion of the ports of Cagayan de Oro and GeneralSantos under Loan 939-PH (Second Ports Project). As a part of the project,the Bank supported the establishment of the Philippine Ports Authority (PPA)which was mandated to consolidate and assume the port-related functionswhich had previously been fragmented between the Bureau of Customs (BOC) andBureau of Public Works (BPW) in the former Ministry of Public Works,Transportation, and Communications (MPWTC). Since it became operational in1976, PPA has taken over the management and operation of all national ports,expanded its technical staff and improved accounting procedures with theassistance of Bank-financed consultants.
1.12 The Bank's objective in the port sector is to assist the PPA indeveloping a national port policy, increasing port capacity to meet industrialdevelopment in secondary urban growth centers, and improving administration,operations, and planning for all major national ports. PPA's currentInvestment Plan (1979-83) not only aims at increasing capacity at major ports,but also at consolidating ports of various sizes and functions in outlyingareas where improved overland mobility makes economies of scale and efficiencypossible. The selection of ports for future improvement has been determinedin the context of the traffic-patterns of the total transport network, thedevelopment potential of the hinterlands, and the natural conditions of theharbors. Details on the subsector are given in Chapter 2.
Inter-Island and Coastal Shipping
1.13 Despite its status as the most important transport mode for freight,the potential of inter-island and coastal shipping has not yet been fullyrealized, mainly due to inadequate port facilities and the antiquated localshipping fleet. There are about 480 inter-island vessels of over 100 grosstons, and many more smaller ships. In 1976, more than 34% of the inter-islandfleet and 41% of the ocean-going fleet were 25 or more years old. Mostsmaller ships are converted naval or military vessels, and over-loading ischaracteristic. There are about 50 Philippine inter-island vessel operators,
but the majority of the fleet is owned by only ten major firms. In additionto the inter-island fleet, there are smaller craft providing low cost, short-haul transport of agricultural products for local as well as inter-islandmarkets, and barges are used extensively to move raw or refined sugar, rice,and other produce. Coastal transport is frequently a logical alternative in
areas where cross-island road construction is made difficult by mountainousterrain; thus numerous roadsteads and shallow water ports have been developedwhere land access to communities is severely limited.
1.14 The increasing regional specialization in production patterns andrural development has given inter-island shipping a new impetus to play amajor role in the Government's plans for increased food production andregional balance in economic and social development. The growing need forfood in deficit areas has to be met by increased production in surplus areassuch as Mindanao. This in turn, requires efficient marine transport of bothagricultural inputs and outputs. In recognition of this need to improveinter-island shipping services, the Bank provided a loan of US$20 million in1974 for a shipping project. Since 1977 ten interisland container vesselshave been put into service by major operators financed locally and more areexpected as port facilities are improved.
Civil Aviation
1.15 Manila, Cebu and Zamboanga, Philippines' international airports areserved by 20 international and regional airlines, including Philippine AirLines (PAL). The latter provides international services, and is the prin-cipal carrier for 78 domestic airports operated by the Government. Domesticpassenger traffic has increased by about 12% p.a. over the past six years,while air freight is still insignificant. With the assistance of a US$26
million loan from ADB, the Manila International Airport is being rehabilitatedand extended to meet the traffic demand expected by 1983.
C. Transport Planning, Coordination and Strategies
1.16 Until mid-1979, transport planning had been the joint responsibiltyof the National Economic and Development Authority (NEDA) and the Ministryof Public Works (MPW). As a central planning agency, NEDA had overall respon-sibility for public capital investments through its Infrastructure Program andProject Office, which reviewed and approved investments proposed by eachtransport operating agency. NEDA was assisted in this task by the Inter-Agency Technical Committee on Transport Planning (IATCTP), staffed by repre-sentatives from each transport agency, including the MPH and MPW. IATCTPprepared standards and guidelines for the formation of agency plans for devel-opment and coordination of transport programs and projects. It also servedas a forum for the resolution of operational problems of transport agencies.
1.17 MPW, the other major participant in the joint planning activity,used its Planning and Project Development Office (PPDO) to undertakeregional planning studies on infrastructure investments and formulate
- 6 -
priorities for major infrastructure projects. PPDO maintained liaison withNEDA and provided the bulk of technical input to transport planning. TheBoard of Transportation (BOT), as a semi-detached unit of the MPW, alsohandled the quasi-judicial function of granting routes to transportcompanies and enforcing rates and regulations for their operations on thebasis of IATCTP policy guidelines.
1.18 In July 1979 the Ministry of Transport and Communications (MOTC) wascreated to undertake transport planning, coordination and regulation. Itbecame operational with a small staff drawn mainly from PPDO of MPW and BOT.The Ministry is still evolving and is in the process of defining itsfunctions, expanding its staff and preparing to take necessary steps toabsorb the transport planning functions now discharged by NEDA. However, itwill be some time before MOTC can assume full responsibility for transportplanning, coordination and regulation. In the interim, MOTC will continue tobe assisted by NEDA, IATCTP and expatriate advisors.
1.19 One of the important transport planning activities is the Govern-ment's National Transport Systems Study (NTSS) undertaken in preparation ofa ten-year transport investment program. As a result of the Bank's Trans-port Planning Mission's recommendations, several resident planning advisorswere appointed in 1977 to assist the Government under the Manila UrbanDevelopment Project (Loan 1282-PH) in carrying out this study. The advisorswere expected to assist individual line agencies and MPW with mattersconcerning transport policy, coordination and modal planning. However,completion of the transport study has been delayed due to changes in theadvisory staff, a high turn-over among the counterpart team, and the lengthyperiod required for data collection. Accordingly, the Bank's Fourth HighwayProject (Loan 1661-PH) included additional advisory services to allowcompletion of the first phase of the transport study by mid-1980. Completionof the entire study is not expected until late 1981.
1.20 Transport improvement programs are designed to promote the Govern-ment's objectives of (a) increasing food production and rural incomes;(b) promoting regional balance in socio-economic development by establishinggrowth poles away from Metropolitan Manila; and (c) expanding industrialproduction for domestic and foreign markets. To increase transport capacityso that it can meet the growing demand, broad strategies are being pursuedconcerning two main aspects: investment and operational.
1.21 Investment strategies embody two major elements: (a) transportsector and program review; and (b) strengthening the planning capabilitiesof operating agencies. At the center, MOTC/NEDA are assisted by foreignadvisors to undertake review and evaluation of operating agency proposals fortheir consistency with i. sectoral and overall development objectives such asagricultural and industrial development; ii. financial resource availability;iii. inter-modal efficiency; and iv. agency implementation capabilities.Needless to say, the task of analyzing least cost solutions for theachievement of the desired development objectives is a complex one. It willtake long, deliberate and persistent efforts on the part of the Government

planners to effectively analyze feasible alternatives (e.g., a greaterutilization of existing facilities in lieu of new investments) and assesssocio-economic effects of major investment projects in arriving at optimalinvestment choices. However, a good beginning has been made by the Governmentin a systematic collection of data and analysis with which to undertakecoordinated investment programming.
1.22 To enable MOTC/NEDA to carry out inter-modal planning functions, theanalytical capacity of transport agencies both at the center and at theregional and provincial levels must be greatly strengthened. The Philippinearchipelago, with its chain of over 7,000 islands, provides a strong case fordelegating major planning responsibilities to regions and provinces. It is atthis level where relevant data must be assembled to identify specific trans-port problems, examine alternatives in terms of costs and benefits and rankpriorities on the basis of the intimate local knowledge of the transportfacilities under their control. Effective transfer and strengthening of localplanning responsibilities can be accomplished only in the long term. However,the Government has clearly established the direction in which it intends tomove.
1.23 In order to reduce the need for capital expenditures or, at least,make it possible to postpone investment needs, the Government is making anincreasingly greater effort to improve the operational efficiency of exist-ing facilities and administrative procedures. Plans are currently beingformulated to improve vehicle operations in Metropolitan Manila through acomprehensive scheme of traffic management. Greater attention is beingfocussed on the maintenance of roads and ports, and on a restructuring ofthe management staffing and procedures for port operations and transportregulation. These operational improvements would make existing and futureinvestments more productive and would yield much higher benefit cost ratiosthan similar sized investments in new projects.
D. Previous Bank Assistance in the Transport Sector
1.24 The Bank Group's assistance to support the Government's efforts tomodernize and expand the transport sector included the First Port Loan(290-PH) in 1961 amounting to US$8.5 million which financed procurement ofdredging equipment. However, US$1.1 million of the loan amount was cancelleddue to failure to operate and maintain the dredgers in an efficient manner.In 1973, a Second Port Loan (939-PH) of US$6.1 million was provided to assistthe expansion of two important ports on Mindanao: Cagayan de Oro in the northand General Santos in the south. Project completion was delayed by threeyears mainly because of retendering, dredger mobilization difficulties andinadequate project supervision control by BPW.
1.25 The Bank's First Shipping project was prepared to help modernize theold inter-island fleet, provide technical assistance to strengthen planningand administrative capabilities in the maritime industry sector and formulatea ten-year investment program for inter-island shipping. Until recently,
- 8 -
implementation of this project has been delayed by institutional problems.They related to the uncertainty about how various financial institutions wouldhandle interest rate issues and subloan administration and appraisal,subborrowers' reluctance to assume foreign exchange risks, and a disagreementabout how ship safety inspection is to be undertaken. Some of these issuesare now being resolved, and accordingly, the rate of commitment has increasedsubstantially.
1.26 The highway sector has received the bulk of the Bank's lending fortransport in the Philippines: four loans (Loans 731-PH, 950-PH, 1353-PH and1661-PH) totalling US$271 million have been made for the improvement ofimportant sections of national highways and connecting feeder roads, and for acountry-wide maintenance organization for national roads, includingimprovement of workshops and procurement of maintenance equipment, spare partsand workshop machinery. These projects have also helped to develop thePhilippine contracting industry through experience in fulfilling a steadilyincreasing stream of contracts. Philippine consulting firms have also gainedvaluable experience through their association with foreign consultants on thedesign of the project roads.
2. PORT SUBSECTOR
PPA Organization
2.01 PPA is a quasi-government corporate body created by PresidentialDecree in 1974. An amending decree in 1975 widened PPA's powers andfunctions which require the authority to develop, maintain, operate,supervise and regulate port services and facilities of national ports in thePhilippines. PPA's governing board, responsible directly to the Minister ofPublic Works, comprises seven directors, five of whom are cabinet ministers.The private sector is represented by one director, and PPA's general manageris a member ex-officio. PPA is empowered inter-alia to fix rates andcharges, determine terms and conditions of service for its employees broadlyconsistent with Civil Service rules and regulations, adopt recurrent incomeand expenditure budgets and capital expenditure budgets, invest surplusfunds in Government securities and borrow money after consultation with theCentral Bank and the Department of Finance and with the approval of thePresident. Dues, which are defined in the enabling decree as includingharbor fees, tonnage and wharfage dues, berthing charges, port dues, and anyother dues or fees imposed by virtue of existing law or the decree, areincreased or decreased by the President upon the recommendation of PPA, toprovide a satisfactory return on the Authority's assets and adjustments maybe similarly made to dues so as to reflect the costs of providing theservices.
2.02 During 1977 two Presidential Decrees (Nos. 1177 and 1234) resultedin fundamental changes to PPA's financial autonomy with effect fromJanuary 1,1978 by requiring PPA (and other agencies) to: (i) remit all
- 9 -
revenues to Treasury for crediting to a Special Account in the Government'sCeneral Fund; (ii) obtain quarterly, in advance, budget allotmentauthorization from the Government's Budget Commission to enable PPA funds tobe released by Treasury to meet recurrent and capital expenditures; and(iii) maintain financial records in accordance with governmental budgetaccounting rules. The application of these regulations has in the pastresulted in reduction by the Budget Commission of PPA's spending powersbelow the levels approved by PPA's own board. Some relief from budgetaryconstraints has been available to PPA for financing certain capital worksthrough the utilization of surplus funds (termed "corporate") which it hadaccrued up to December 31, 1977. However, these funds are gradually beingdepleted. In addition to maintaining commercial accounting records, PPA isnow required to provide supplementary financial data in compliance withgovernment budgetary procedures.
2.03 PPA's full-time General Manager (and ex-officio Vice-Chairman ofthe Board), who exercises day-to-day control, is an experienced and competentadministrator. Chart 21268 shows PPA's organization.
2.04 Port Management Units (PMUs) have been established at major nationalports with each PMU exercising control over neighboring minor national ports.There also exist over 200 private piers and wharves in the Philippines
from which traffic PPA derives revenues. Since its treation PPA's approvalis required before any private port can be constructed or expanded. There are
also some 390 municipal ports most of which offer only basic and simplelanding facilities for small craft.
Management, Staff and Training
2.05 M4anagement is generally very satisfactory, but there remains aneed to develop certain areas, in particular strengthen development projectplanning and execution, and improve financial and operational informationavailable to management to assist in both day-to-day control and corporateplanning.
2.06 The experience gained by PPA through the Third Ports ProjectFeasibility Study should be consolidated by allocating PPA's project planningand supervision activities to permanently staffed units suitably interlinked.A permanent planning division staffed with experienced engineers, economistsand statisticians is necessary to fulfill PPA's wide responsibilities indeveloping Philippine ports. The supervision of major projects also willrequire a nucleus of full-time engineers for years to come. Appropriateorganizational structure changes are now being considered by PPA to achievethese goals. PPA agreed during negotiations to discuss proposed majorchanges with the Bank prior to implementation [para. 6.02(a)] The establish-ment of a hydrographic division is required in view of PPA's extensivedredging responsibilities and the cost of related staff training and equipmentis included in the proposed project. The cost of a civil engineering adviserfor the duration of project construction, and training courses abroad forMPW and PPA port engineers is also provided under the proposed loan.
- 10 -
2.07 More accurate and succinct data are required for effective manage-ment control and to assist in corporate planning. The Bank's appraisalrevealed the inadequacy and inaccuracy of some of PPA's statistical datamuch of which is derived from shipping and arrastre companies. Consequentlymany productivity indices computed for PPA ports are unreliable. Moreemphasis is needed on quality rather than on quantity and greater presenta-tional uniformity is required to enable more useful comparisons to bemade especially of data supplied by PMUs. The scope, content and accuracyof financial reporting also needs improving substantially. The proposedproject includes the cost of a port experienced economist and a managementaccountant to assist PPA staff in these areas. These experts would alsoassist in the determifiation of reliable productivity indices which wouldenable PPA and the Bank to subsequently agree on suitable operationaltargets for the project ports. Agreement on these targets will be reachedby no later than December 31, 1981 [para 6.02(b)].
2.08 PPA operates a training school which was established in 1975 withILO/NORAD assistance. Initially the school trained stevedore and wharflabor; subsequently PPA introduced various work-oriented training coursesfor lower and middle management operational and administrative staff.
Existing Port Facilities (Map 14860)
2.09 Cagayan De Oro (Map 14771). Cagayan de Oro has a 451 m long,23 m wide marginal reinforced-concrete wharf on piled foundations, of which291 m consists of an earlier existing facility which was recently repairedand upgraded when a 160 m new extension was added, both sections having adredged alongside depth of 8.5 m below MLLW. The new extension wascompleted under the Second Ports Project which also provided paved storageand working areas behind the wharves, as well as transit sheds, administra-tive and other buildings, fencing and gates, drainage and other servicefacilities.
2.10 The tidal range is less than 1 m and siltation is virtuallynonexistent along the present wharves. However, to the south, where the nextextension is proposed, are shallow log-ponds divided by rock bulkheads.Currently, these log ponds are leased to private companies. Some 200 squatterhuts are also present outside the south boundary fence of the port. The earlytermination of the log-pond leases and their removal, and the relocationsatisfactory to the Bank of all huts encroaching within the proposed projectarea by no later than June 30, 1981 was agreed with the Government duringnegotiations [para. 6.01(a)]. The city government is already taking actionto move site occupants to an available temporary site pending finalresettlement in permanent quarters. The cost of relocation is estimatedat $40,000 to be borne by the relevant government agencies.
2.11 Just outside the proposed project area, an oil company has a tankfarm and supply depot. The incoming supply pipes cross the project area andare to be relocated. This was confirmed with PPA during negotiations.
2.12 The partly salvaged and partly submerged wreck of a small warshiplies to the south of the port, about 430 m from the existing wharf. As it
- 11 -
lies in the path of the proposed construction, its removal is included inthe project.
2.13 The 500 m long access road to the proposed project site will be anextension of a newly paved road leading from the Iligan-Cagayan de Oro-Butuanhighway to the recently completed Agora Market. Early right-of-wayacquisition will be necessary; both this and a construction schedule wasagreed by the Government during negotiations [para. 6.01(b)].
2.14 Cebu (Map 14770). Cebu has a narrow marginal waterfront for cargohandling, open storage and roadway. The width varies from 28 to 45 m overan overall length of 3.8 km with alongside depths of water varying between3 to 6.5 m below MLLW. Most of the berths are in poor condition. Exceptfor a 9 m alongside depth foreign berth and one 6.5 m alongside depthdomestic berth, maximum depth is 5 m due to existing structural foundationlimitations. In addition, there are three finger piers, each 33 m wide and155 m long, with alongside depths varying from 3 to 5 m below MLLIJ, whichare all in very poor condition. Existing structural foundation limitationsof the piers do not allow increasing the dredged depths beyond 5 m belowMLLW.
2.15 Tidal range is 1.6 m maximum; the tides are diurnal and currentsare insignificant. Some maintenance dredging is necessary, but informationis insufficient to determine necessary frequency and quantity. PPA proposesto conduct observations and review maintenance dredging requirements by nolater than December 31, 1982. This was agreed during negotiations[para 6.02(c)].
2.16 Some wrecks lie in the areas to be dredged for an access channelto the proposed quay. As removal powers do not rest solely with PPA, removalof these wrecks, which is not included in the project, was agreed by theGovernment during negotiations [para. 6.01(c)].
2.17 Iloilo (Map 14772). Iloilo has two sections of port facilities:(a) a narrow 10 m wide marginal waterfront extending about 2 km along thewest bank of the Iloilo river used by domestic traffic; and (b) a deep waterwharf for foreign and large domestic vessels located on the Iloilo straitside.
2.18 The river front wharves are generally of very old mass concreteand reinforced concrete construction, said to be built at the turn of thecentury, plans of which are no longer available. Part of the wharves aredeck platforms supported on open timber shallow depth piled foundations,which do not permit dredging alongside depths beyond 5 m below MLLW. Thewharf structures need extensive rehabilitation, but this is considereduneconomic as a main city street and a railway track frequently used forpassenger traffic prevent further widening of the narrow wharf aprons.
- 12 -
2.19 Heavy siltation occurs in the river and past dredging has providedonly temporary improvement to the channel. Siltation would rapidly fillthe dredged channels until stability was reached when depths returned tobetween 3 m and 4 m below MLLW. A detailed study of the siltation phenomenais necessary to determine whether more effective and less expensive measurescan and should be taken to maintain existing depths for craft using PPA andother upriver facilities, e.g. small ship repair yards. However, as alreadystated, depths alongside the river wharves cannot exceed 5 m due to structurallimitations. The cost of such a study is included in the project. The meantidal range in the river and in the Iloilo strait is 1.6 m.
2.20 Built in 1968, the deepwater wharf located just beyond and southof the mouth of the Iloilo river, faces the Iloilo strait. It is areinforced concrete wharf with a deck 12 m wide and 345 m long, on rein-forced concrete piled foundations, having a maximum alongside depth of 9 mbelow MLLW. A 140 m long, 18 m wide transit shed is located on the wharfstructure. An open shed for passengers, a private warehouse, and a smallcargo equipment maintenance workshop make up the port buildings in thisarea, all of which are in good condition. Road access to the city, securitylighting, water supply and fencing also are adequate. The berth nearest tothe mouth of the Iloilo river is subject to heavy siltation, whilst furtherexpansion at the other end is not possible because of exposure to heavy waveaction and erosion.
2.21 The site of the proposed quay for Iloilo lies north of themouth of the Iloilo river, and faces the Iloilo strait. It will be locatednortheast of the suburb known as Barrio Obrero. Since early construction ofa 1-km long temporary access road will be necessary to transportconstruction materials and equipment from the city to the project site, itscost is included in the project. Prompt acquisition of the right-of-way,and the construction of the road was agreed by the Government duringnegotiations [para. 6.01(b)]. Funds are also provided in the project for apermanent road access, its alignment to be decided when the proposed urbandevelopment of the new area behind the new port facility has been finalized.During negotiations the Government confirmed that suitable arrangements willbe made to construct a railway spur line for the conveyance of export sugarto the proposed quay.
2.22 Zamboanga (Map 14773R). Zamboanga has a tee-head jetty which wasconstructed prior to 1939. Constructed in reinforced concrete on open piledfoundations, the main wharf is 270 m long and 12 m wide, accessible to theshore by a skewed approach jetty of similar construction, 22 m wide, 165 mlong on its western side and 125 m long on its eastern side. A reinforcedconcrete finger pier addition, 54 m long and 9 m wide, joins the jettyapproach structure midway on its eastern side. Behind the approach jettyand contiguous to the port land, is a reinforced concrete sheet-piled
- 13 -
marginal wharf 268 m long with a paved apron 35 m wide, completed in 1964and extending eastward of the approach jetty0 Depths at the outer berths ofthe main wharf of the tee-head range from 5.6 m to 8.8 m below MLLW, at theinner berths from 5 to 7.1; at the finger pier from 5 to 5.8 m; and at themarginal whar£ from 3.7 to 5 m. Because of tidal currents averaging 1.5knots, only minor siltation occurs in the jetty head area. The mean tidalrange is I m.
2.23 The proposed extension is to be built west of the existingfacilities in a shallow basin used by fishing vessels. This basin isprotected by a small breakwater structure. The Kawa Kawa Boulevard, runsclose to the breakwater and will serve future port traffic once the proposedextension is completed. As the basin will be reclaimed for the newextension, arrangements for the relocation of the fishing vessels to anothersite will have to be made by no later than June 30, 1981, i.e., prior to newconstruction commencing at site. Timely port access road construction,linking Kawa Kawa Boulevard, included in the project, will also benecessary. These actions were agreed with the Government duringnegotiations [para. 6.01(b) and (d)].
Traffic
2.24 Reliable traffic data for most of PPA's ports are not availableprior to PPA completing the takeover of ports in December 1977. Subsequentto 1977 data on port cargo are reasonably reliable, however, passengertraffic statistics are still inaccurate (see para. 2.36).
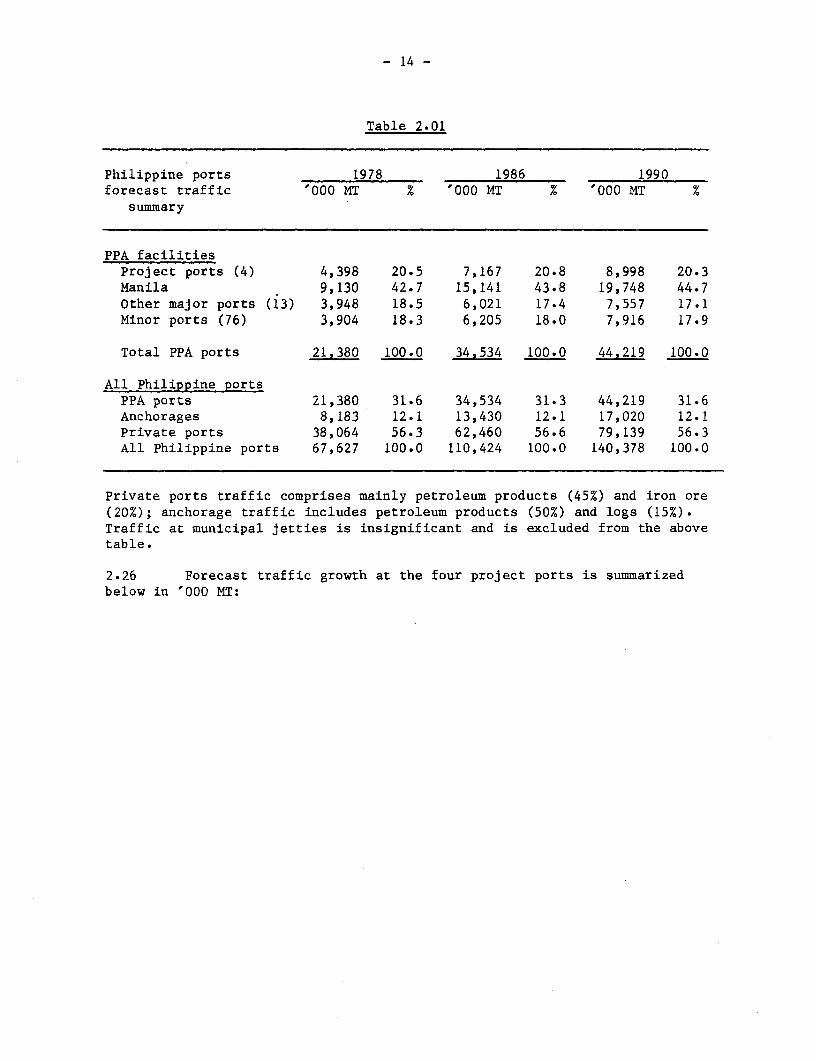
2.25 Cargo handled annually at all Philippine ports is expected to growfrom 67 million tons in 1978 to 110 million tons by 1986 and to 140 milliontons by 1990. PPA port facilities currently handle over 31% of totalPhilippine traffic and are expected to maintain this share. Details aregiven in Table 2.1 and summarized below:
- 14 -
Table 2.01
Philippine ports 1978 1986 1990forecast traffic '000 MT % '000 MT % '000 MT %
summary
PPA facilitiesProject ports (4) 4,398 20.5 7,167 20.8 8,998 20.3Manila 9,130 42.7 15,141 43.8 19,748 44.7Other major ports (13) 3,948 18.5 6,021 17.4 7,557 17.1Minor ports (76) 3,904 18.3 6,205 18.0 7,916 17.9
Total PPA ports 21,380 100.0 34,534 100.0 44,219 100.0
All Philippine portsPPA ports 21,380 31.6 34,534 31.3 44,219 31.6Anchorages 8,183 12.1 13,430 12.1 17,020 12.1private ports 38,064 56.3 62,460 56.6 79,139 56.3All Philippine ports 67,627 100.0 110,424 100.0 140,378 100.0
Private ports traffic comprises mainly petroleum products (45%) and iron ore(20%); anchorage traffic includes petroleum products (50%) and logs (15%).Traffic at municipal jetties is insignificant and is excluded from the abovetable.
2.26 Forecast traffic growth at the four project ports is summarizedbelow in '000 MT:

- 15 -
Table 2.02: PROJECT PORTS - FORECAST TRAFFIC SUMMARY('000 MT)
% increase1978 1986 1990 over 1978
Cagayan de OroForeign 103 252 322 213Domestic 525 815 1,024 95
Total 628 1,067 1,346 114
CebuForeign 120 285 489 307Domestic 2,209 3,359 4,154 88
Total 2,329 3,644 4,643 99
IloiloForeign 151 649 782 /a 418Domestic 620 858 1,066 72
Total 771 1,507 1,848 140
ZamboangaForeign 9 15 20 122Domestic 661 934 1,161 76
Total 670 949 1,181 76
/a Includes 213,000 tons of sugar currently handled atanchorage which will move across alongside berths from1984.
The above forecasts take into account major agricultural and forestry exports,including the extent to which they will be locally processed prior toshipment; import needs of these industries including fertilizers, machineryand construction materials; and consumer goods imports.
Operations
2.27 PPA is directly in charge of port administration, maintenance andsecurity at the project and other national ports, with the exception ofsecurity at Manila South Harbor which remains in the hands of the BOCpending a review of the situation by the Secretary of Defence. PPA does notemploy operational labor. Stevedoring and wharf cargo handling, and the
- 16 -
sorting, stacking and delivery to consignees of goods in PPA transit shedsare undertaken by private arrastre firms who supply all necessary mechanicalequipment. However, PPA staff monitor the activities of these companies toensure compliance with port regulations. Ship anchoring and berthingcontrol is exercised by PPA.
2.28 Most cargo is moved into and from the hold by ship's gear. Cargostored in sheds or open storage areas can remain free of charge in port forsix working days in the case of non-containerized foreign goods and twoworking days for domestic cargo. Foreign cargo in containers is allowedthree working days free storage. Penalty charges are then levied to induceconsignees to remove their goods promptly. PPA may also transfer non-delivered cargo to warehouse storage and charge consignees for removal coststhrough the arrastre operators. Ports operate 24 hours a day, though lessactivity occurs between 10 pm and 6 am as much of the cargo is currentlycarried by scheduled passenger-cargo vessels.
2.29 The Philippine Coast Guard is responsible for maritime andnavigational operations, communications with vessels at sea, lighthouses andother navigational aids. BOC carries out all customs activities within theport but has no control over the movement of goods within storage areas.PPA and arrastre working hours are adjusted to meet port needs. Goodworking relations prevail between PPA, BOC and the coast guard. Pilotage andtowage is by Pilots' Associations at the PMUs, subject to overall PPAsupervision.
2.30 Most of the cargo at the four project ports is handled by conven-tional break-bulk methods and operations are assisted by the use of pallets,forklifts, tractor/trailer units, mobile conveyors, etc. Between 1977 and1979 cellular container and side-loading RoRo ships have been introduced atCebu and Cagayan de Oro. Some of these and other ships also carry a rangeof non-standard boxes. On the more traditional interisland ships, efficientcargo handling is limited by the dominance of passenger needs in the shipdesign. Passenger decks cover much of the ship's length so that cargo canonly be handled from limited areas.
2.31 The designs of smaller ferries and local craft put further limitson cargo handling speeds. Passenger needs dominate the layout even moreand cargo is frequently carried in hatches below the passenger decks,reached by ladders. Movement to and from the shore is often by gangplankover the ship side or via small side-ports.
2.32 These constraints are compounded by narrow wharf aprons whichfurther hinder efficient and speedy cargo movements at all project portsexcept Cagayan de Oro. In Cebu, existing narrow marginal wharves can now bewidened by ten meters as the Philippine Estates Authority (PEA) recentlyagreed to allocate additional land to PPA for this purpose. However, atIloilo and Zamboanga, city development prevents any expansion of cargo
- 17 -
working areas at existing port sites. A further constraint, especially tothe improvement of existing wharves to cater for the expected growth incargo carried by larger vessels, is design limitations which preventdredging alongside most wharves below 5 m MLLW.
2.33 The proposed project focuses on providing additional cargo workingareas and deep water berths to handle expected growth in breakbulk cargoescarried in larger vessels and growth in container traffic which alsorequires deep water and larger land areas adjacent to the wharves for thehandling of containers. In addition, the proposed project will rehabilitateexisting marginal quay aprons at Cebu using the additional land recentlymade available. The nature and extent of productivity and other benefitsexpected from the proposed project are detailed in Chapter 4.
2.34 The large volume of passenger traffic on interisland vessels,which also mitigates against high cargo throughput, is expected to grow.Manifested passenger traffic in 1978 at the project ports was as follows:Cagayan de Oro 583,000; Cebu 3,527,000; Iloilo 1,828,000; and Zamboanga1,666,000.
2.35 The above figures are much lower than the actual numbers carried.Field surveys during 1979, showed underreporting of passengers in ships'manifests ranging between 60% and 200% in project ports. Several schemesdesigned to more effectively segregate passengers and cargo to facilitatefaster cargo working have been considered by PPA. However, most largeshipping companies are not convinced that the proposals are workable.Further studies both of the true volume and future trend of passengertraffic and suitable passenger facility improvement at PPA ports are clearlyneeded. Provision has been made for such studies in the proposed project.
2.36 The Loan Agreement under Loan 939-PH (Second Ports Project)provides that the number of cargo handling (arrastre) companies at eachproject port i.e. Cagayan de Oro and General Santos, be reduced to not morethan two. This measure was designed to avoid duplication of plant andequipment and diseconomies in operation and in the use of port labor. Priorto the creation of PPA, BOC reduced arrastre companies at Cagayan de Oro andGeneral Santos to one by encouraging the amalgamation of the numerous oper-ators. PPA eventually extended this policy to other ports.
2.37 The policy was recently challenged by the arrastre companies andthe dispute has been referred to a special committee set up by the Ministerof Public Works. An arrastre company in Cebu subsequently filed a courtsuit claiming that PPA has no power to determine the number of arrastrefirms operating in ports. Pending a decision by the court, the MinisterialCommittee has postponed consideration of the dispute.
2.38 There is clear evidence of operational improvements following thereduction of arrastre firms; however, shipowners have complained about themonopolistic attitude allegedly adopted by the sole arrastre organization
- 18 -
at Cagayan de Oro. The Bank considers that a port container complex, suchas proposed for Cebu, should be operated by only one arrastre firm in viewof the precise control over container movements and related cargo documenta-tion needed for efficient operation; and the need for the most economic useof expensive mechanical handling equipment. This conforms with the Govern-ment and PPA's policy embodied in a recent Presidential Decree governing theoperation of the Manila International Container Complex. At break-bulkberths, however, more than one arrastre firm could effectively be utilized,the exact number to be determined by the number and nature of berths at theport. During negotiations, the Government agreed that the number ofarrastre firms allowed to operate at the project ports be determined by PPAin consultation with the Bank (para. 6.01(e)].
Tariffs and Costs
2.39 Tariffs for all PPA ports are regulated by PPA subject toPresidential concurrence. Most existing tariff levels were inherited by PPAin 1974 and have remained unchanged, with the exception of charges made byarrastre companies for cargo handling services, which were increased by 25%in June 1979 with PPA's approval. Tariffs are not cost based and are verylow compared to other ports in Southeast Asia. Principal PPA rates aregiven in Table 2.2. Substantial revisions upward are required to enable PPAto generate an adequate level of cash to meet a reasonable portion of futureport development expenditures. PPA staff were trained in tariff settingtechniques by consultants financed under Loan 939-PH (Second Ports Project)and are capable of recalculating new tariffs. They will be assisted byUNCTAD experts in establishing new tariffs for the international containercomplex in Manila.
2.40 PPA's level of operating costs is reasonable. Staffing is notexcessive; in fact government agencies are now required to hold costs at aslow a level as possible without unduly impairing efficiency. Currentstaffing levels are now being reviewed by a team comprising experts from thePresidential Reorganization Committee, the Ministry of Public Works and alocal firm of management consultants.
2.41 Recent government budgetary constraints required PPA to curtailexpenditure, particularly port maintenance on which only P 22 millionwas expended in 1979 i.e., only 1.2% of gross fixed assets in service(excluding land). Consequently, PPA's overall operating ratio in 1979 was alow 53%. Maintenance expenditure and operating ratios are expected to riseduring 1980-86. Nevertheless the operating ratio is expected to rangebetween 57% and 68% with the exception of 1983 when the ratio will probablyslightly exceed 70%. These ratios indicate a satisfactory relationshipbetween expenditure and revenue.
- 19 -
Budget, Accounting and Audit
2.42 PPA prepares detailed annual operating and investment budgets incommercial format which are approved by the board. In addition, sinceJanuary 1, 1978, PPA has prepared annual cash budgets in conformity withGovernment budgetary regulations and quarterly cash budgets required to obtainBudget Commission sanction for release of PPA funds from its Special Accountwith the Treasury.
2.43 PPA's commercial accounting and costing systems were devised andintroduced with the assistance of consultants in 1977/78 financed under Loan939-PH (Second Ports Project). The system works well except that financialreporting to management needs to be improved (see para. 2.07).
2.44 PPA's governing decree provides for annual audit of the authority'saccounts by the Government's Commission on Audit. However, PPA may engage theservices of a private professional auditor or firm for the audit of itsaccounts in fulfillment of international contractual commitments of theauthority. Since PPA's creation, the Commission on Audit has promptly andsatisfactorily audited PPA's accounts. It was agreed during negotiations thataudited accounts for 1980 and thereafter be submitted to the Bank within sixmonths of each fiscal year end by auditors satisfactory to the Bank fpara.6.02(d)].
2.45 PPA operates an Internal Control Department the head of whichreports directly to the General Manager. The Department comprises two reviewand appraisal divisions, i.e., financial and operational management, employingten and seven staff respectively. The need for additional staff is beingreviewed (see para. 2.40).
3. INVESTMENT PLANI AND PROJECT
PPA's Investment Plan (1980-86)
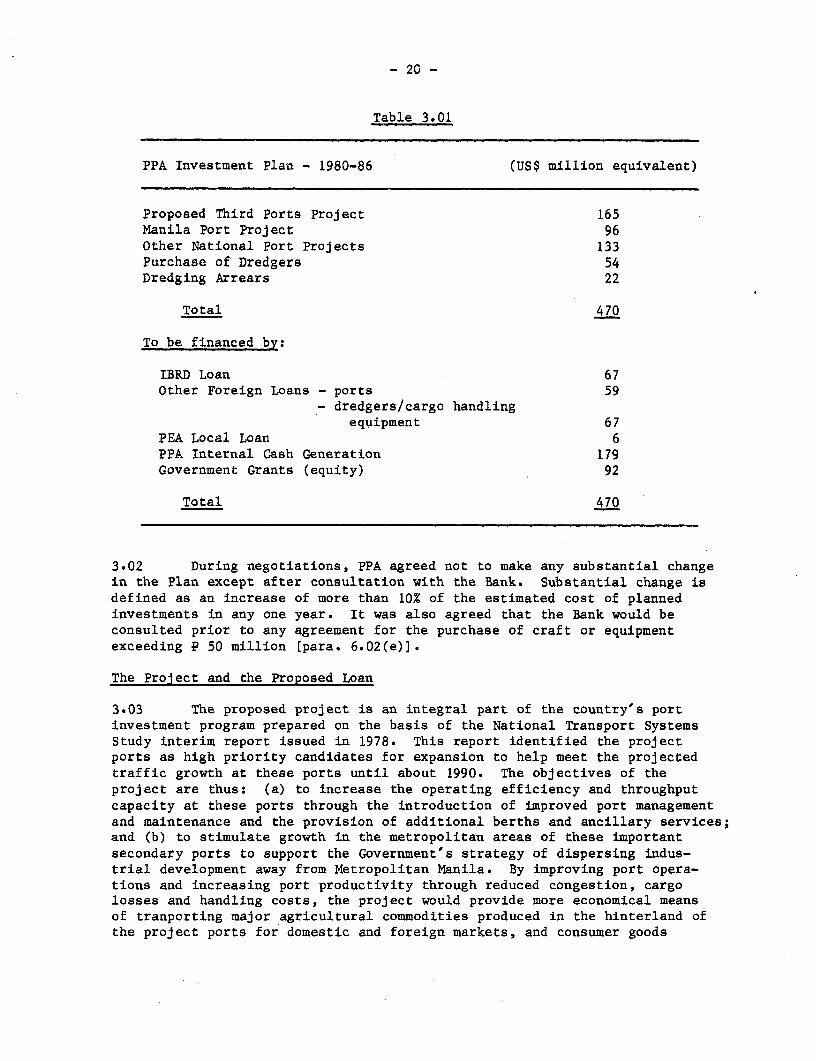
3.01 PPA's current Investment Plan covers the period 1980-86, andincludes major and minor projects at national ports identified as suitablefor investment. The Plan is indicative only insofar as about 50% ofprojected expenditure is concerned, relating to which neither feasibilitystudies nor preliminary engineering have yet commenced. A brief summary ofthe Plan and anticipated sources of finance are given below in Table 3.01.For purposes of this appraisal it is assumed that total Plan expenditureduring 1980-84 on other national port projects will amount to US$110 millioni.e. 17% less than the Plan provides, in view of possible national budgetaryand project technical supervisory staff constraints. The plan excludescapital works at municipal ports from which PPA does not derive anyrevenues. Such works will be constructed by MPW and be financed by theGovernment. Ownership of the municipal port assets after construction willnot be vested in PPA.
- 20 -
Table 3.01
PPA Investment Plan - 1980-86 (US$ million equivalent)
Proposed Third Ports Project 165Manila Port Project 96Other National Port Projects 133Purchase of Dredgers 54Dredging Arrears 22
Total 470
To be financed by:
IBRD Loan 67Other Foreign Loans - ports 59
- dredgers/cargo handlingequipment 67
PEA Local Loan 6PPA Internal Cash Generation 179Government Grants (equity) 92
Total 470
3.02 During negotiations, PPA agreed not to make any substantial changein the Plan except after consultation with the Bank. Substantial change isdefined as an increase of more than 10% of the estimated cost of plannedinvestments in any one year. It was also agreed that the Bank would beconsulted prior to any agreement for the purchase of craft or equipmentexceeding P 50 million [para. 6.02(e)].
The ProJect and the Proposed Loan
3.03 The proposed project is an integral part of the country's portinvestment program prepared on the basis of the National Transport SystemsStudy interim report issued in 1978. This report identified the projectports as high priority candidates for expansion to help meet the projectedtraffic growth at these ports until about 1990. The objectives of theproject are thus: (a) to increase the operating efficiency and throughputcapacity at these ports through the introduction of improved port managementand maintenance and the provision of additional berths and ancillary services;and (b) to stimulate growth in the metropolitan areas of these importantsecondary ports to support the Government's strategy of dispersing indus-trial development away from Metropolitan Manila. By improving port opera-tions and increasing port productivity through reduced congestion, cargolosses and handling costs, the project would provide more economical meansof tranporting major agricultural commodities produced in the hinterland ofthe project ports for domestic and foreign markets, and consumer goods
- 21 -
shipped from Manila for distribution in the influence areas of the projectports. The resulting increase in commerce between the major domesticmarkets near Metropolitan Manila and the project ports is expected tostimulate the economy of the project ports and their hinterland.
3.04 The project's major beneficiaries are interisland ship operatorswho have long suffered from inadequate port facilities with resultant slowturnaround time and high port costs which normally amount to 30% of shipoperating costs. Increased berth throughput of cargo per meter of quayreduces port costs per ton and permits more round voyages per ship peryear, and therefore fewer ships per route. The project will also encouragefurther investment in container vessels with resultant lower per tonshipping costs. Considering the high level of competition among shipoperators, a large portion of reduced operating costs is expected to bepassed on to shippers in the form of lower tariff or rebates, most of whichwould be passed on to the ultimate consumers. Resource cost savings to thecountry's economy are also considerable as the project would eliminate orreduce unnecessary costs associated with port operations.
3.05 The proposed project is based upon findings of port feasibilitystudies, financed under Loan 1048-PH (Shipping) and conducted by PPA and itsconsultants as modified by the Bank's appraisal conducted in October 1979.While it would have been desirable also to finance works at some minorports, it was generally felt by the government and the Bank that these havea somewhat lower priority and given resource constraints and inadequate dataon required improvements, should not be included in the project.
Description of the Main Project Items
3.06 The project consists of:
(a) at the port of Cagayan de Oro (Map 14771);
(i) 415 m of quay extension with an alongside depth of 10.5 mbelow MLLW, providing deep-water common user multipurposeberths;
(ii) one open transit shed 4,600 sq m for timber products storageand export, and one container freight station-cum-transitshed 5,500 sq m for the handling of container traffic;
(iii) ancillary works including surface roads and open areas total-ling about 46,000 sq m, services for water, electric supply,lighting, sewerage and drainage, weighbridges, separateaccess gate and security fencing;
(iv) engineering services for final engineering, bid evaluationand award and supervision of construction;
- 22 -
(b) At the port of Cebu (lIap 14770):
(i) dredging and disposal of about 460,000 cu m of spoil for theprovision of a deep water access navigation channel to adepth of 9.5 m below MLLW;
(ii) construction of 550 m of quay with an alongside depth of9.5 m below MLLW, providing deep-water common usermultipurpose berths;
(iii) one container freight station-cun-transit shed 7,800 sq m;
(iv) ancillary works including surface roads and open areas total-ling about 89,500 sq m, an administration building, equipmentand passenger sheds, and services for water, electricsupply, lighting, sewerage and drainage, weighbridges, accessgates and security fencing;
(v) rehabilitation and upgrading of existing marginal quayaprons and circulation roads, including provision of servicesfor water, electric supply, lighting, drainage and portperimeter security fencing;
(vi) engineering services for final engineering, bid evaluation andaward and supervision of construction;
(c) at the Port of Iloilo (MIap 14772)
(i) dredging of about 460,000 cu m of spoil, reclamation and fillof about 946,000 cu m and dike works, for the provision of anisland wharf terminal;
(ii) construction of 400 m of quay with an alongside depth of10.5 m below MLLW, providing deepwater common usermultipurpose berths;
(iii) one container freight station-cun-transit shed 6,000 sq m;
(iv) ancillary works including surfaced roads and open areastotalling about 77,000 sq m, an administration building, firestation, and services for water, electric supply, lighting,sewerage and drainage, weighbridges, access gate and securityfencing;
(v) engineering services for final engineering, bid evaluation andaward and supervision of construction;
(d) at the Port of Zamboanga (M4ap 14773R)
(i) dredging and reclamation of about 505,000 cu m of generalfill, and attendant dike works, in the proposed extension;
- 23 -
(ii) 220 m of quay extension with an alongside depth of 10 m belowMLLW, providing deep-water common user multipurpose berths;
(iii) one container freight station-cum-transit shed 5,500 sq m;
(iv) ancillary works including surfaced roads and open areastotalling about 100,400 sq m, an administration building,fire station, amenities building for port labor, equipmentshed, an office block for Customs and relevant Governmentagencies, and services for water, electric supply, lighting,sewerage and drainage, weighbridges, access gate and securityfencing;
(v) rehabilitation and repair of damaged sections of the existingtee-head jetty;
(vi) addition of a new 50 m pier with mooring dolphins, a newpassenger waiting shed and an embarkation area at theexisting small craft ferry basin;
(vii) engineering services for final engineering, bid evaluationand award and supervision of construction;
(e) provision of external access roads for the ports of Cagayan deOro, Iloilo and Zamboanga;
(f) technical assistance and training for:
(i) siltation and hydrographic studies at the project ports ofCebu and Iloilo and a study of seabed erosion at Cagayan deOro (Annex 1), a civil engineering adviser for the durationof project construction, and staff training for MPW and PPAengineers and for setting up a hydrographic survey unitwithin PPA;
(ii) the study of the effect which increased container serviceswill have on the number, type and scheduling of vessels forinterisland passenger sea transport, and consequent nationalport passenger facility development needs (Annex 1);
(iii) feasibility studies including detailed engineering, requiredfor a future ports project (Annex 1); and
(iv) improving PPA's management information system (Annex 1).
(g) provision of essential mechanical cargo handling equipment for theproject ports.
Cost Estimates
3.07 Total cost of the project is estimated at I 1,204.7 million(US$165 million equivalent) with a direct foreign exchange component of
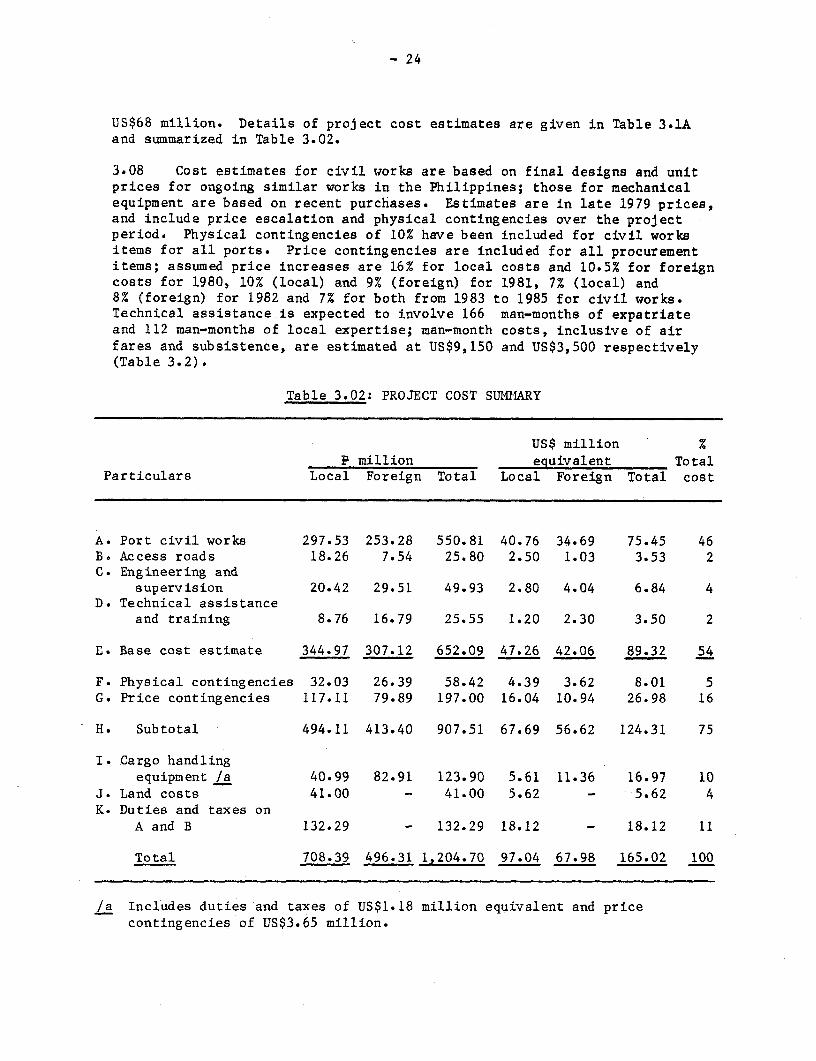
- 24
US$68 million. Details of project cost estimates are given in Table 3.1Aand summarized in Table 3.02.
3.08 Cost estimates for civil works are based on final designs and unitprices for ongoing similar works in the Philippines; those for mechanicalequipment are based on recent purchases. Estimates are in late 1979 prices,and include price escalation and physical contingencies over the projectperiod. Physical contingencies of 10% have been included for civil worksitems for all ports. Price contingencies are included for all procurementitems; assumed price increases are 16% for local costs and 10.5% for foreigncosts for 1980, 10% (local) and 9% (foreign) for 1981, 7% (local) and8% (foreign) for 1982 and 7% for both from 1983 to 1985 for civil works.Technical assistance is expected to involve 166 man-months of expatriateand 112 man-months of local expertise; man-month costs, inclusive of airfares and subsistence, are estimated at US$9,150 and US$3,500 respectively(Table 3.2).
Table 3.02: PROJECT COST SUMM9ARY
US$ million %P million equivalent Total
Particulars Local Foreign Total Local Foreign Total cost
A. Port civil works 297.53 253.28 550.81 40.76 34.69 75.45 46B. Access roads 18.26 7.54 25.80 2.50 1.03 3.53 2C. Engineering and
supervision 20.42 29.51 49.93 2.80 4.04 6.84 4D. Technical assistance
and training 8.76 16.79 25.55 1.20 2.30 3.50 2
E. Base cost estimate 344.97 307.12 652.09 47.26 42.06 89.32 54
F. Physical contingencies 32.03 26.39 58.42 4.39 3.62 8.01 5G. Price contingencies 117.11 79.89 197.00 16.04 10.94 26.98 16
H. Subtotal 494.11 413.40 907.51 67.69 56.62 124.31 75
I. Cargo handlingequipment /a 40.99 82.91 123.90 5.61 11.36 16.97 10
J. Land costs 41.00 - 41.00 5.62 - 5.62 4K. Duties and taxes on
A and B 132.29 - 132.29 18.12 - 18.12 11
Total 708.39 496.31 1,204.70 97.04 67.98 165.02 100
/a Includes duties and taxes of US$1.18 million equivalent and pricecontingencies of US$3.65 million.
- 25 -
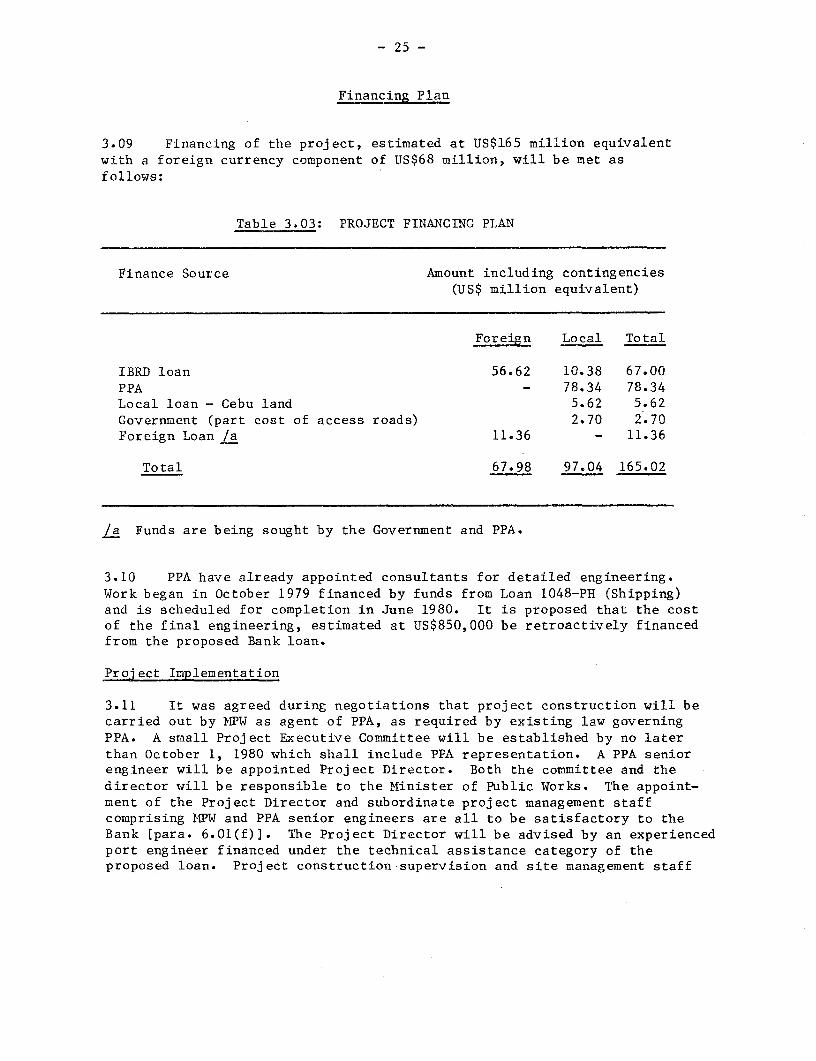
Financing Plan
3.09 Financing of the project, estimated at US$165 million equivalentwith a foreign currency component of US$68 million, will be met asfollows:
Table 3.03: PROJECT FINANCING PLAN
Finance Source Amount including contingencies(US$ million equivalent)
Foreign Local Total
IBRD loan 56.62 10.38 67.00PPA - 78.34 78.34Local loan - Cebu land 5.62 5.62Government (part cost of access roads) 2.70 2.70Foreign Loan /a 11.36 - 11.36
Total 67.98 97.04 165.02
/a Funds are being sought by the Government and PPA.
3.10 PPA have already appointed consultants for detailed engineering.Work began in October 1979 financed by funds from Loan 1048-PH (Shipping)and is scheduled for completion in June 1980. It is proposed that the costof the final engineering, estimated at US$850,000 be retroactively financedfrom the proposed Bank loan.
Project Implementation
3.11 It was agreed during negotiations that project construction will becarried out by I4PW as agent of PPA, as required by existing law governingPPA. A small Project Executive Committee will be established by no laterthan October 1, 1980 which shall include PPA representation. A PPA seniorengineer will be appointed Project Director. Both the committee and thedirector will be responsible to the Minister of Public Works. The appoint-ment of the Project Director and subordinate project management staffcomprising MPW and PPA senior engineers are all to be satisfactory to theBank [para. 6.01(f)]. The Project Director will be advised by an experiencedport engineer financed under the technical assistance category of theproposed loan. Project construction supervision and site management staff
- 26 -
will be assisted by consulting engineers acceptable to the Bank, upon termsand conditions, including provision for training engineering personnelsatisfactory to the Bank [para. 6.01(g)]. The appointment of foreign and/orlocal consultants/advisors for technical assistance and training shall alsobe upon terms and conditions satisfactory to the Bank [para. 6.02(f)].
Procurement and Disbursement
3.12 The project civil works would be executed under not more than four
civil engineering contracts, to be awarded on the basis of internationalcompetitive bidding, in accordance with Bank guidelines. The Government
intends to levy import duties on items procured for the project.
3.13 In order to accelerate the construction of civil works to be doneunder contract, and also to take advantage of favorable world prices ofcertain items of equipment (e.g. weighbridges) and materials (e.g. steelpiles and structural sections) which are part of the civil works, theGovernment intends to consider making early procurement of such directlyimported items common to the civil works of tle project ports. For thispurpose a notional sum of US$1.5 million will be provided as a separatecategory in the schedule of withdrawals of the proceeds of the loan in theLoan Agreement. The Government will seek the prior approval of the Bank onthe specific items prior to procurement. Disbursements will be 100% offoreign expenditures for such directly imported items.
3.14 The works are expected to be completed by the second quarter of1984, assuming effectiveness of the proposed loan by October 1, 1980. Theconstruction schedules shown in Charts 21269/70 have been agreed with PPA.
3.15 Disbursement for project civil works would be on the basis of 48%of total costs net of taxes. For consulting services, disbursement would beon the basis of actual cost; if local consultants are employed, disbursementwould be for 100% of local costs. Disbursements by the Bank are expected tobe completed by June 30, 1985. The estimated schedule of quarterlydisbursements, given in Table 3.3 is based on the assumption that theproposed loan would become effective by October 1, 1980.
3.16 Cargo handling equipment is to be procured by PPA with the aid ofa foreign loan now being sought by the Government and PPA. After purchase,PPA intends to lease the equipment to arrastre companies and has undertakento inform the Bank of the terms of the lease.
Ecology
3.17 None of the proposed works will affect the existing ecology of theports; reclamation dredging is envisaged for land-fill at the project sitesfor Cagayan de Oro, Iloilo and Zamboanga. In Cebu, most of the overlyinglayers on the sea bottom to be dredged out for the new approach channel are
- 27 -
not suitable as reclamation fill. Unsuitable dredged material will bedisposed of well outside the port area to designated areas of tidal flats onMactan Island, some 4 km away. Any suitable land-fill material found in thecourse of such dredging will be deposited in the future extension area northof the present project site.
3.18 The project ports do not handle or transfer crude oil or petroleumproducts, these being handled by oil companies at their specialized privateinstallations located well away from the public ports.
4. ECONOMIC EVALUATION
A. Traffic
General
4.01 Separate traffic forecasts were prepared for passengers, majorcommodities and commodity groups at each project port. Among commodityprojections, those for grain took into account production, consumption,grain surpluses and/or deficits in the hinterland of project ports, whileprojections of general cargo, including miscellaneous consumer goods,relied on income elasticity of demand indicators available for currenthousehold budget surveys. Impacts of economic programs and projects wereconsidered in projecting export and agricultural and industrial inputs. Baseyear data for passenger traffic was adjusted for underreporting and projectedbased on revised June 1979 population forecasts.
- 28 -
4.02 Both cargo and passenger forecasts relied on port area statisticsand route-specific origin/destination data. Efforts have been made toreconcile projections of major commodities known to move between the projectports, taking into account the interport and intermodal competition for portcargo. The projected passenger and commodity flows have been adapted to theneeds of port capacity analysis and project evaluation by classifying themaccording to direction, handling characteristics and port facilities.Detailed forecasts were prepared up to 1990; generalized projections wereused thereafter.
Cagavan de Oro
4.03 In 1978 the port of Cagayan de Oro handled 630,000 tons of cargo and583,000 passengers. Over 1.3 million tons of cargo and 1.1 millionpassengers are expected to move through the port in 1990 (Table 4.1). Notincluded in these totals for lack of concrete commitments by a fruitpacking company, is nearly 300,000 tons of potential container trafficnow handled over the company's own inadequate facilities across the bayfrom the port of Cagayan de Oro.
4.04 Domestic commerce, mostly consumer goods, accounts for 83% of thetotal port traffic. Corn shipped to the Cebu region is the single mostimportant product; the eventual need for bulk storage and handlingfacilities is being considered by PPA and the National Grain Authority.Foreign trade, 105,000 tons in 1978, will grow rapidly on the strength ofexport of wood products and new commodities such as cassava chips, sugar andchromite.
4.05 Container cargo, both domestic and foreign, as a percentage oftotal port traffic, will expand from 9% in 1979 to 36% in 1990. Even withoutthe potential container traffic referred to above, Cagayan de Oro alone amongthe project ports has a significant volume of outward container cargoes whichwill attract container vessels seeking return cargo.
Cebu
4.06 After Manila, Cebu is the most important public port and serves asthe distribution center of general cargo for the Visayas region. It alsoreceives large volumes of grain from Mindanao to supplement its ownproduction. Its foreign trade is now mostly transshipped via Manila butmuch of it will divert to Cebu when the new container terminal is constructed.
4.07 The port handled 2.3 million tons of cargo and 3.5 millionpassengers in 1978. These totals are expected to reach 4.6 million tons and6.9 million passengers by 1990 (Table 4.2).
4.08 Virtually all goods using the port are handled as general cargo.Container traffic, at 174,000 tons in 1978, is small but growing rapidlydespite the lack of specialized handling and storage facilities. It is
- 29 -
projected to reach 1.8 million tons by 1990. Without the project container-ization will level off at about 500,000 tons annually.
4.09 Separate traffic forecasts are provided in Table 4.2 for therehabilitation of the existing quay and for the proposed container andforeign trade terminal, the two main components of the Cebu port project.
Iloilo
4.10 The port of Iloilo is a domestic river port, with a wharflocated in the straits serving both foreign and domestic traffic, andanchorage facilities. In 1978, the port handled nearly 1.1 million tons ofcargo and 1.8 million passengers; this is expected to increase to 1.8million tons of cargo and 3.2 million passengers by 1990 (Table 4.3).
4.11 Already an important foreign trade port, Iloilo will handle sub-stantially higher volumes of sugar and its byproducts from new refineries inits hinterland. Sharp increases are also expected in grain and mineralexports. Construction materials, grains and consumer goods will continue todominate domestic seaborne commerce. There is a twice-daily passenger ferryservice to nearby Bacolod, and Iloilo is also linked by regular passengerservices to all major ports in the Philippines.
Zamboanga
4.12 This port serves several related functions including: (a) collec-tion and distribution of cargo to the neighboring islands; (b) connectionto other coastal urban centers of Mindanao; (c) stopover point forinterisland vessels plying between Manila and the ports of southeasternMindanao; and (d) terminal for local, coastal and interisland passengertravel.
4.13 The port handled 670,000 tons of cargo and 1,666,000 passengers in1978, which is projected to rise to 1.2 million tons of cargo and 3.2million passengers by 1990 (Table 4.4). Both cargo and passenger forecastsare based on Government expectations that conditions in the region which,until recently, has been troubled by civil disorders will remain stable.
4.14 Virtually all (99% in 1978) seaborne cargo is domestic; foreigncommerce is limited to barter trade with neighboring countries. Incomingcopra and cereals are the two most important products and accounted for 42%of the total in 1978. The rest consists of a wide range of consumerproducts and general cargo.
4.15 Approximately one half of passenger traffic is handled by anefficiently operated ferry service to nearby Isabela Island. Frequentpassenger services are also available to outlying islands of the SuluArchipelago, points along the coast of Mindanao and major ports elsewherein the Philippines.

- 30 -
B. Benefits
General
4.16 Quantifiable benefits attributed to proposed improvements inproject ports will consist of all or some of the following:
(a) ship time savings;
(b) avoidable cargo diversion costs;
(c) avoidable lighterage costs;
(d) lower cargo handling costs; and
(e) decrease in cargo losses including damages to containers.
Considering the high level of competition among ship operators, shipperswould benefit from reduced operating costs in the form of lower tariffs orrebates, most of which would be passed on to the ultimate consumers.
4.17 (a) Ship Time Savings
These include both the reduction in ship time while awaiting berthand lower "at berth" time due to improved cargo handling productivity.Estimates of ship time in port with and without the project were obtainedthrough the simulation of observed and expected values of operationalvariables for different levels and composition of port traffic.
4.18 Ship waiting and service time savings are estimated by weighingrepresentative values of major ship types using project ports. Thesevalues, range from P 4,700 per day for small passenger-cargo vessels toP 51,000 per day for foreign container feeder vessels. Higher thanrepresentative values were used for domestic container ships in Cebu andlower than representative values for foreign and domestic general cargoships at Zamboanga.
4.19 The appraisal also considered distribution of ship time savingsbetween domestic and foreign carriers. At present, three of the four projectports are served regularly by foreign ships. Some homogeneous products suchas fertilizer, molasses, sugar and minerals are carried by charter or trampvessels whose costs can be negotiated to reflect proposed port improvements.However, growing volumes of general cargo, bagged sugar and wood productsare or will be shipped in foreign liner and container ships. It is assumedthat only 50% of ship time benefits accruing to foreign owned general cargoand container vessels will be recaptured by the country while all the shiptime benefits for domestic vessels and charter foreign vessels accrue to thecountry.
(b) Avoidable Cargo Diversion Costs
4.20 The expected growth in project ports will be accompanied byincreases in ship waiting time and cost. As these costs become excessive,
- 31 -
ship owners will divert to other nearby and less congested ports when theaverage cost of ship turnaround time in a project port exceeds the cost ofdiversion and turnaround time in the port to which the ship will divert.If this alternative is not available or leads, in time, to unesceptablecongestion delays and costs in the receiving port, shipowners will resortto lighterage to minimize their costs.
4.21 The cost of ship diversion to other ports includes land transportcost and ship delays in receiving ports which are directly attributable todiverted traffic./l In the case of Iligan (para 4.29), the port which wouldrelieve congestion at Cagayan de Oro, there will also be need for otherwiseavoidable dredging in the berthing area.
(c) Avoidable Lighterage Costs
4.22 The lighterage system devised for economic evaluation is one thatminimizes the per ton cost of lightering. The optimization is attained byapplying trade-offs (a) between the annual cost of additional barges and theannual cost of ship waiting time at anchorage and (b) between the annual costof an additional lighter berth and the annual waiting time costs of bargesqueuing for a berth. The cost of this system is then adjusted by includingship service and waiting time to obtain total lighterage cost estimates.These costs, calculated for different traffic volumes, are presented inTable 4.5. The net difference between the lighterage and improved portcosts represents avoidable lighterage cost savings attributable to theproject.
(d) Cargo Handling Savings
4.23 Cargo handling productivity varies for different project portsdepending on available facilities and equipment, composition of cargo andship traffic and the level of on-the-wharf congestion. Base year data oncargo handling rates, adjusted to reflect expected changes in the abovevariables, are summarized in Table 4.6.
4.24 The table also shows changes in cargo handling rates resulting fromthe project. The proposed port improvements will be followed by significantincreases in cargo handling productivity in all ports except Cagayan de Oro,already operating efficiently as a result of recent improvements financedunder Loan 939-PH (Second Ports Project).
4.25 Cargo handling rates have been converted to cargo handling costs
to estimate savings attributable to the project, using an estimated cost ofP 170 per gang hour for container and P 110 per gang hour for general
/1 Diversion costs to the ships are minimal, or negative, and in most casesmay be avoided.
- 32 -
cargo operations. The labor component of cargo handling cost has beenadjusted by shadow pricing unskilled labor costs at 80% of their marketprice.
(e) Cargo Loss Savings
4.26 According to present estimates, cargo losses in project portsrange from P 8.4 per ton to P 14.0 per ton for conventional cargo andfrom P 1.7 per ton to P 2.7 per ton for container cargo. The value ofcargo shipped via the project ports is estimated at P 2,320 per ton. Forconventional cargo 50% of the loss is due to pilferage, 25% due to handlingand another 25% due to spoilage from lack of adequate storage. Similar lossallocation for container cargo is 10% for pilferage, 90% for handling andnone for storage. In addition, repair costs of container damages averageP 5.5 per ton of container cargo.
4.27 Proposed improvements will reduce cargo losses by: (a) providingpaved and/or sheltered areas for storage of perishable products (e.g.grain); (b) increasing the volume of container transport less vulnerable tocargo losses through handling, storage and pilferage; (c) reducingon-the-wharf congestion; and (d) increasing port security (fencing, lights,limited access) and eliminating double handling of lightered cargo. Theavailability of specialized cranes in Cebu will reduce damage to containershandled in that port. Estimates of cargo losses with and without proposedimprovements in project ports are presented in Table 4.7.
Cagayan de Oro: Benefits
4.28 Traffic growth at the port of Cagayan de Oro has exceeded allexpectations and there are indications of continued strong growth ahead(Table 4.4). Since Cagayan de Oro is already one of the best managed publicports in the Philippines, the opportunities for capacity increases throughoperational improvements are limited. If additional berths and shorefacilities under this project are not built, the port will become fullycongested by 1983.
4.29 To minimize ensuing waiting time costs, the shipowners will diverttheir ships to nearby less congested ports and, later, resort to lighterage.Initially traffic will be diverted, on a space available basis, to nearbyprivately owned general cargo berths. This will be accompanied by diversionto the more distant public port of Iligan, which will require some dredgingto accommodate diverted traffic. By 1988, Iligan too, will become fullycongested. Congestion relief benefits to Iligan's own traffic have not beenincluded in project benefits because of: (a) lack of adequate knowledgeregarding ship traffic in that port; and (b) uncertainty regarding the port'sfuture dredging policy. It is estimated that inclusion of these benefitswould raise the economic rate of return from 29% to 31%.
- 33 -
4.30 The project will reduce ship waiting time and eliminate the needfor less efficient and more costly alternative solutions described above.It will also result in minor cargo handling and cargo loss savings - minorbecause the port already operates efficiently and with due regard for safetyand security. Project benefits are summarized in Table 4.8; the analysis ofoptions available to shipowners to minimize ship waiting time costs ispresented in Table 4.9.
Cebu Benefits
4.31 The project consists of a new container and foreign trade terminaland the rehabilitation, including paving, widening and fencing of some1,100 m of the existing general cargo quay. The new terminal will reduceservice time and handling cost of foreign and container ships and theircargo. It will accelerate containerization of domestic breakbulk cargo anddivert foreign container cargo now transshipped via Manila, to Cebu withensuing savings in cargo handling costs and losses. Minor ship waiting timesavings will be realized during the early years of the project.
4.32 The principal benefits of the paving, widening and fencing of theexisting general quay will come from lower cargo handling costs and cargolosses due to damage and pilferage./I The project will also result in amore balanced distribution of cargo handling activities throughout the portarea.
4.33 A summary of project benefits is presented in Table 4.10. Table4.2 shows estimates of project-induced containerization and diversion ofport traffic.
Iloilo: Benefits
4.34 Lighterage already supplements deepwater berth facilities inIloilo. This trend will accelerate rapidly in the near-term future dueto the continued siltation in the river, berthing preference in the foreignport for passenger and container traffic and the expected growth in porttraffic./2 It is estimated that by 1984 virtually all deepwater cargotraffic except containers will be lightered.
/1 The unpaved quay section is used by small vessels whose opportunity costof time is low as evidenced by the fact that many stay in the port longerthan required for cargo handling operations. Because of this, ship ser-vice time savings resulting from the project will be largely illusoryand has not been considered in the appraisal.
12 Diversion to other ports is not a viable alternative for Iloilo. Culasi,the nearest public port accessible by reliable land transport, is located120 kms away, is subject to heavy siltation and has litle spare capacityfor diverted cargo.
- 34 -
4.35 Existing river berths can be used to handle part of the projectedlighter traffic. However, substantial investments will be needed forbarges, tugboats and service craft. Lighterage operations require doublehandling of cargo and incur high cargo losses due to damage and pilferage.The project will help avoid some of those cargo lighterage costs and reduceothers.
4.36 The project will also reduce service time and handling cost ofexisting container traffic and stimulate containerization of domestic generalcargo thereby ensuring savings in cargo handling costs and losses. Therelocation of the port to a new site will provide relief to city trafficcongestion and bring the port closer to the sources of major agriculturaland mineral exports and of demand for agricultural inputs./l Projectbenefits are summarized in Table 4.11.
Zamboanga Benefits
4.37 The present deepwater port is woefully inadequate for the handlingand storage of cargo. The narrow tee-head jetty with ships berthed on bothsides suffers from chronic congestion limiting the access by trucks and theuse of port equipment. There are no nearby storage facilities and cargolosses due to damage and pilferage are high. Because of space constraints,cargo and ship productivity are low and the prospects for operationalimprovements are limited. Indeed, since the port is working close to itspractical capacity, port productivity is expected to deteriorate further asthe volume of deepwater traffic continues to grow.
4.38 The project is specifically designed to improve the productivityof larger breakbulk ships and to attract container traffic./2 By expandingand improving cargo handling and storage facilities, the project will reduceship turnaround time and lower cargo handling costs and cargo losses. Itwill also eliminate the need for diversion of cargo to the nearby privateports and for eventual recourse to lighterage. Project benefits aresummarized in Table 4.12. The analysis of options available to shipowners tominimize ship waiting time costs is shown in Table 4.13.
4.39 The cargo handling and storage areas for the new project willrequire relocation of some shallow draft berths used by local, predominantlypassenger launch traffic. Substitute facilities have been provided as partof this project elsewhere in the port area. However, long-term future needs
/1 Relocation benefits have not been considered in the economic evaluationof the project.
/2 Smaller, shallow draft vessels cope with congestion by doublebanking andherring-bone style berthing. These measures are not practical forlarger vessels using ship's gear for cargo handling.
- 35 -
of passenger transport in this and other project ports have not been studiedand are not known. The project includes funds for a study of sea passengertransport and for feasibility studies for a fourth ports project (para 3.04).
C. Economic Evaluation and Sensitivity Analysis
Project Costs for Economic Evaluation
4.40 Engineering cost estimates were adjusted for economic evaluationas follows: (a) price contingencies, taxes and duties have been excluded;(b) an annual maintenance cost of 2% has been assumed for civil works and7.5% for equipment; (c) a project life of 25 years was used for civil worksexcept land assumed to have infinite life; the useful life of containerhandling equipment has been set at 15 years and other equipment at 10 years;and (d) unskilled labor cost has been shadow-priced at 80% of the marketcost. These costs are summarized in Table 4.14.
Economic Rates of Return and Sensitivity
4.41 An economic rate of return has been computed for each projectport. In Cebu, where the project's two main components - the container andforeign trade terminal and the quay rehabilitation - are functionallyindependent of each other, separate rates of return have been also computedfor each component.
4.42 The resulting rates of return are shown below. They range from17% for Cebu's container and foreign trade terminal to 45% for Iloilo's newdeepwater facilities. All project components are economically viable andeligible for Bank financing. The entire project shows a return of 30%.
4.43 Common elements of uncertainty in project appraisal such as costoverruns and benefit shortfalls, evaluated at levels of 15% and 25%, arealso shown in the Table. In neither case do they alter conclusionsregarding the project's economic viability.
4.44 Risks associated with the relocation of people occupyingthe proposed project site at Cagayan de Oro have been minimized by thecity government's advanced arrangements for relocation to an availablealternative site. Special organizational and staffing arrangements to bemade for project control and supervision, utilizing experienced MPW and PPAengineers to work with MPW, all to the satisfaction of the Bank, is expectedto ensure avoidance of implementation delays experienced in the previousBPW-implemented port project.
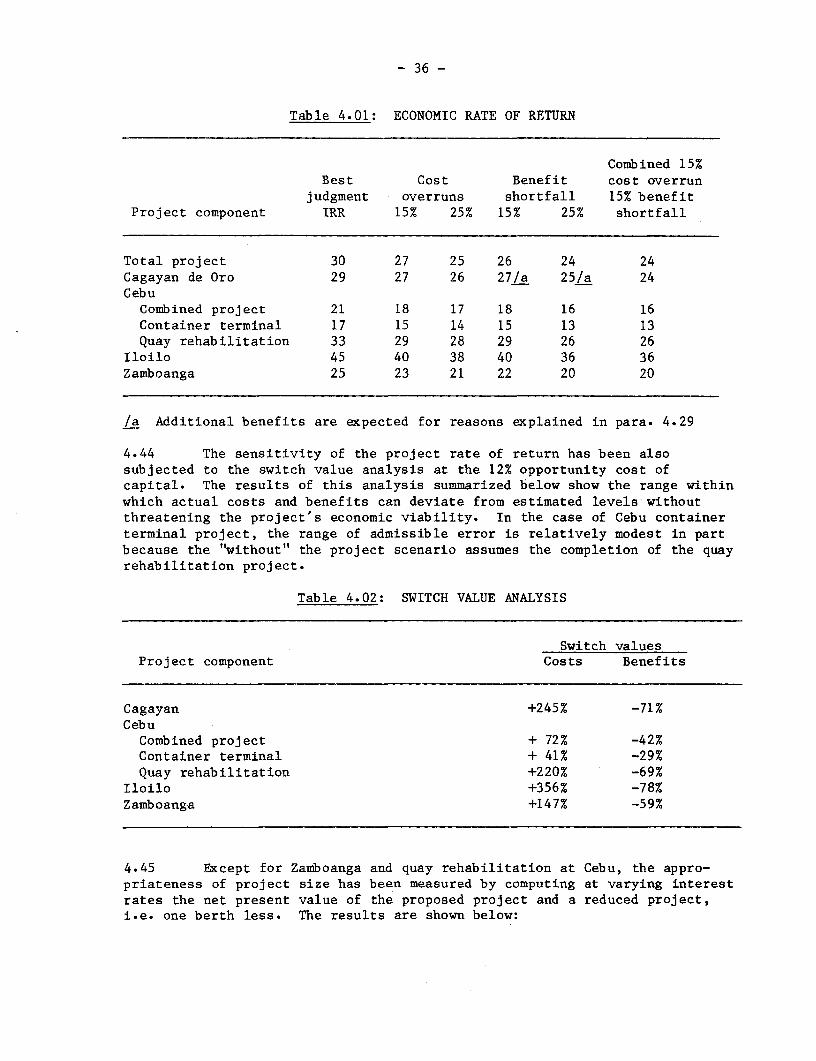
- 36 -
Table 4.01: ECONOMIC RATE OF RETURN
Combined 15%Best Cost Benefit cost overrun
judgment overruns shortfall 15% benefitProject component IRR 15% 25% 15% 25% shortfall
Total project 30 27 25 26 24 24Cagayan de Oro 29 27 26 27/a 25/a 24CebuCombined project 21 18 17 18 16 16Container terminal 17 15 14 15 13 13Quay rehabilitation 33 29 28 29 26 26
Iloilo 45 40 38 40 36 36Zamboanga 25 23 21 22 20 20
/a Additional benefits are expected for reasons explained in para. 4.29
4.44 The sensitivity of the project rate of return has been alsosubjected to the switch value analysis at the 12% opportunity cost ofcapital. The results of this analysis summarized below show the range withinwhich actual costs and benefits can deviate from estimated levels withoutthreatening the project's economic viability. In the case of Cebu containerterminal project, the range of admissible error is relatively modest in partbecause the "without" the project scenario assumes the completion of the quayrehabilitation project.
Table 4.02: SWITCH VALUE ANALYSIS
Switch valuesProject component Costs Benefits
Cagayan +245% -71%CebuCombined project + 72% -42%Container terminal + 41% -29%Quay rehabilitation +220% -69%
Iloilo +356% -78%Zamboanga +147% -59%
4.45 Except for Zamboanga and quay rehabilitation at Cebu, the appro-priateness of project size has been measured by computing at varying interestrates the net present value of the proposed project and a reduced project,i.e. one berth less. The results are shown below:
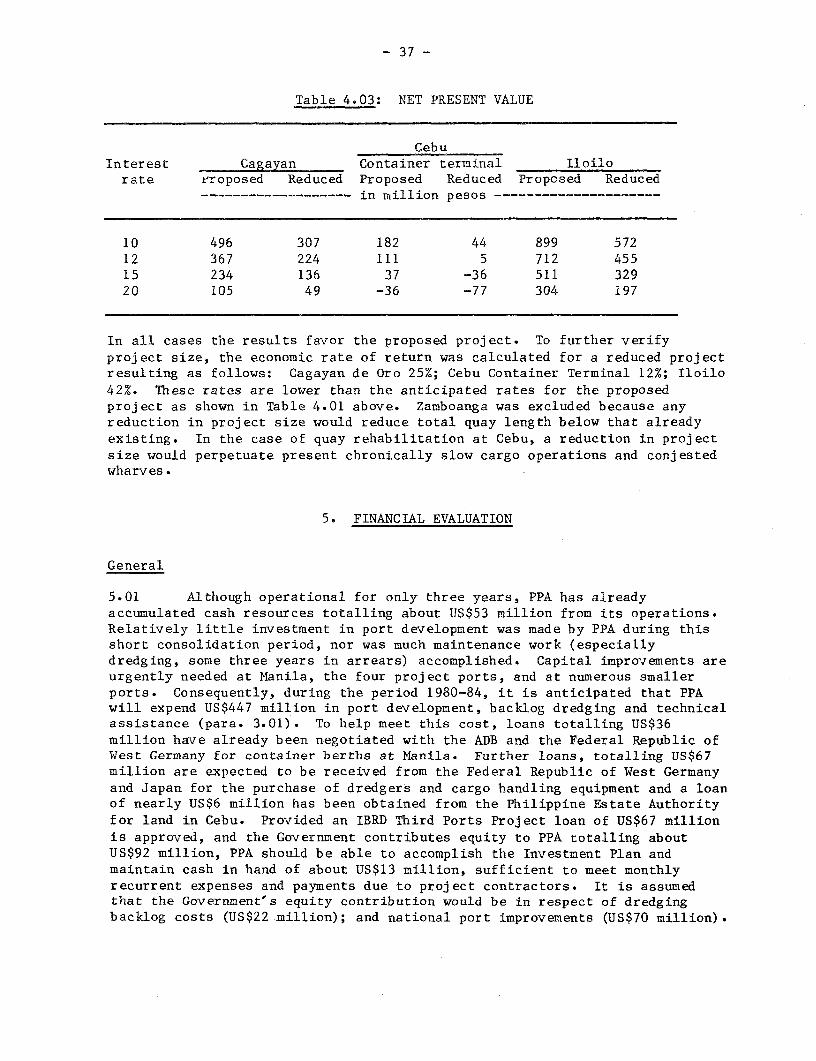
- 37 -
Table 4.03: NET PRESENT VALUE
CebuInterest Cagayan Container terminal Iloilorate eroposed Reduced Proposed Reduced Proposed Reduced
…in million pesos ---------------------
10 496 307 182 44 899 57212 367 224 111 5 712 45515 234 136 37 -36 511 32920 105 49 -36 -77 304 197
In all cases the results favor the proposed project. To further verifyproject size, the economic rate of return was calculated for a reduced projectresulting as follows: Cagayan de Oro 25%; Cebu Container Terminal 12%; Iloilo42%. These rates are lower than the anticipated rates for the proposedproject as shown in Table 4.01 above. Zamboanga was excluded because anyreduction in project size would reduce total quay length below that alreadyexisting. In the case of quay rehabilitation at Cebu, a reduction in projectsize would perpetuate present chronically slow cargo operations and conjestedwharves.
5. FINANCIAL EVALUATION
General
5.01 Although operational for only three years, PPA has alreadyaccumulated cash resources totalling about US$53 million from its operations.Relatively little investment in port development was made by PPA during thisshort consolidation period, nor was much maintenance work (especiallydredging, some three years in arrears) accomplished. Capital improvements areurgently needed at Manila, the four project ports, and at numerous smallerports. Consequently, during the period 1980-84, it is anticipated that PPAwill expend US$447 million in port development, backlog dredging and technicalassistance (para. 3.01). To help meet this cost, loans totalling US$36million have already been negotiated with the ADB and the Federal Republic ofWest Germany for container berths at Mlanila. Further loans, totalling US$67million are expected to be received from the Federal Republic of West Germanyand Japan for the purchase of dredgers and cargo handling equipment and a loanof nearly US$6 million has been obtained from the Philippine Estate Authorityfor land in Cebu. Provided an IBRD Third Ports Project loan of US$67 millionis approved, and the Government contributes equity to PPA totalling aboutUS$92 million, PPA should be able to accomplish the Investment Plan andmaintain cash in hand of about US$13 million, sufficient to meet monthlyrecurrent expenses and payments due to project contractors. It is assumedthat the Government's equity contribution would be in respect of dredgingbacklog costs (US$22 million); and national port improvements (US$70 million).
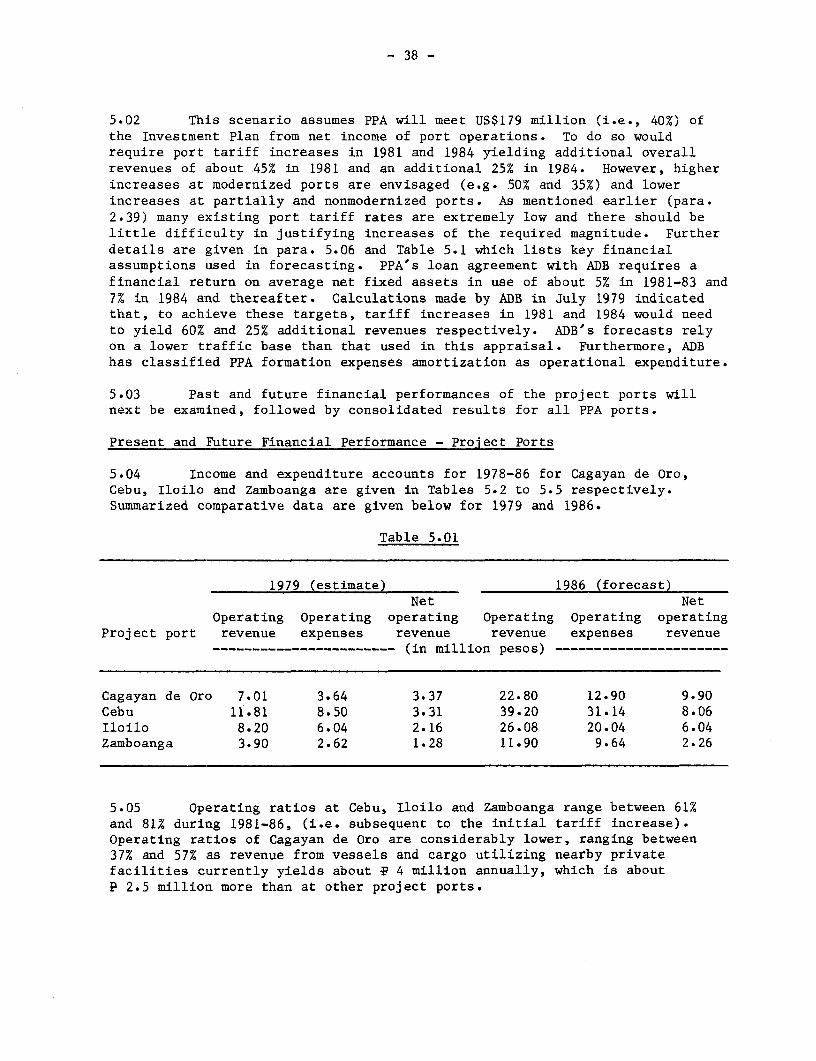
- 38 -
5.02 This scenario assumes PPA will meet US$179 million (i.e., 40%) ofthe Investment Plan from net income of port operations. To do so wouldrequire port tariff increases in 1981 and 1984 yielding additional overallrevenues of about 45% in 1981 and an additional 25% in 1984. However, higherincreases at modernized ports are envisaged (e.g. 50% and 35%) and lowerincreases at partially and nonmodernized ports. As mentioned earlier (para.2.39) many existing port tariff rates are extremely low and there should belittle difficulty in justifying increases of the required magnitude. Furtherdetails are given in para. 5.06 and Table 5.1 which lists key financialassumptions used in forecasting. PPA's loan agreement with ADB requires afinancial return on average net fixed assets in use of about 5% in 1981-83 and7% in 1984 and thereafter. Calculations made by ADB in July 1979 indicatedthat, to achieve these targets, tariff increases in 1981 and 1984 would needto yield 60% and 25% additional revenues respectively. ADB's forecasts relyon a lower traffic base than that used in this appraisal. Furthermore, ADBhas classified PPA formation expenses amortization as operational expenditure.
5.03 Past and future financial performances of the project ports willnext be examined, followed by consolidated results for all PPA ports.
Present and Future Financial Performance - Project Ports
5.04 Income and expenditure accounts for 1978-86 for Cagayan de Oro,Cebu, Iloilo and Zamboanga are given in Tables 5.2 to 5.5 respectively.Summarized comparative data are given below for 1979 and 1986.
Table 5.01
1979 (estimate) 1986 (forecast)Net Net
Operating Operating operating Operating Operating operatingProject port revenue expenses revenue revenue expenses revenue
----------------------- (in million pesos) ----------------------
Cagayan de Oro 7.01 3.64 3.37 22.80 12.90 9.90Cebu 11.81 8.50 3.31 39.20 31.14 8.06Iloilo 8.20 6.04 2.16 26.08 20.04 6.04Zamboanga 3.90 2.62 1.28 11.90 9.64 2.26
5.05 Operating ratios at Cebu, Iloilo and Zamboanga range between 61%and 81% during 1981-86, (i.e. subsequent to the initial tariff increase).Operating ratios of Cagayan de Oro are considerably lower, ranging between37% and 57% as revenue from vessels and cargo utilizing nearby privatefacilities currently yields about P 4 million annually, which is aboutP 2.5 million more than at other project ports.
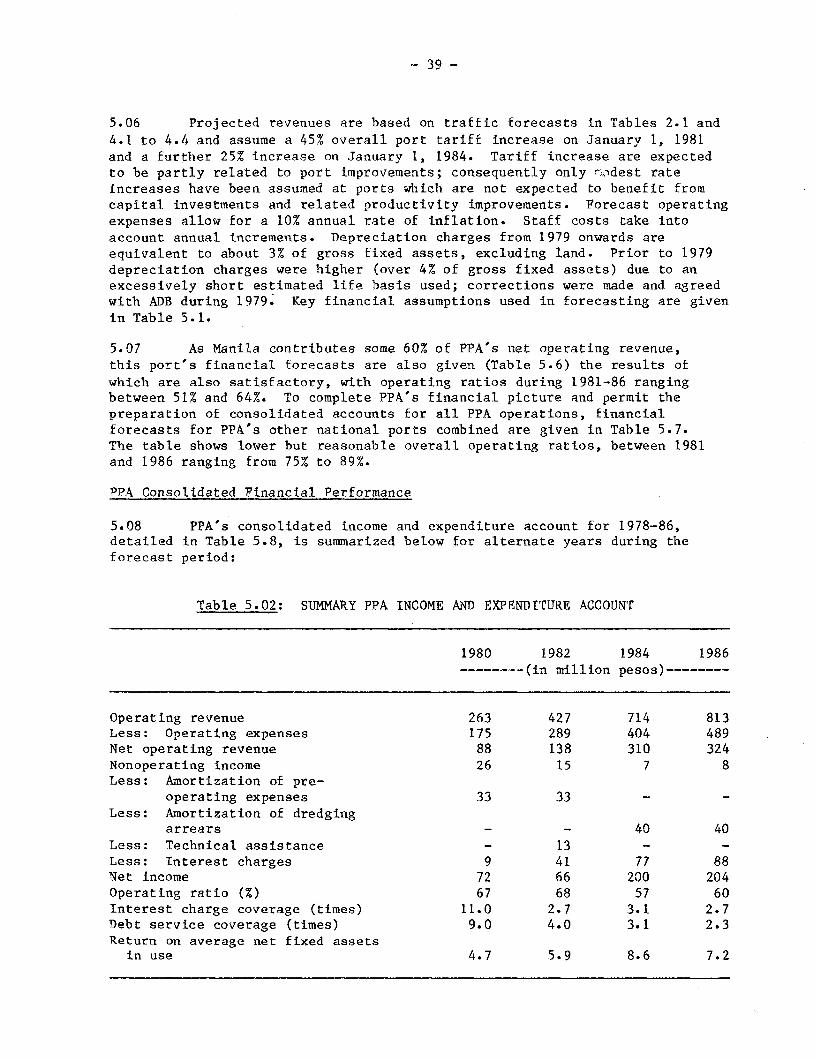
- 39 -
5.06 Projected revenues are based on traffic forecasts in Tables 2.1 and4.1 to 4.4 and assume a 45% overall port tariff increase on January 1, 1981and a further 25% increase on January 1, 1984. Tariff increase are expectedto be partly related to port improvements; consequently only rlEdest rateincreases have been assumed at ports which are not expected to benefit fromcapital investments and related productivity improvements. Forecast operatingexpenses allow for a 10% annual rate of inflation. Staff costs take intoaccount annual increments. Depreciation charges from 1979 onwards areequivalent to about 3% of gross fixed assets, excluding land. Prior to 1979depreciation charges were higher (over 4% of gross fixed assets) due to anexcessively short estimated life basis used; corrections were made and agreedwith ADB during 1979. Key financial assumptions used in forecasting are givenin Table 5.1.
5.07 As Manila contributes some 60% of PPA's net operating revenue,this port's financial forecasts are also given (Table 5.6) the results ofwhich are also satisfactory, with operating ratios during 1981-86 rangingbetween 51% and 64%. To complete PPA's financial picture and permit thepreparation of consolidated accounts for all PPA operations, financialforecasts for PPA's other national ports combined are given in Table 5.7.The table shows lower but reasonable overall operating ratios, between 1981and 1986 ranging from 75% to 89%.
PPA Consolidated Financial Performance
5.08 PPA's consolidated income and expenditure account for 1978-86,detailed in Table 5.8, is summarized below for alternate years during theforecast period:
Table 5.02: SUMMARY PPA INCOME AND EXPENDITURE ACCOUNT
1980 1982 1984 1986…(in million pesos)--------
Operating revenue 263 427 714 813Less: Operating expenses 175 289 404 489Net operating revenue 88 138 310 324Nonoperating income 26 15 7 8Less: Amortization of pre-
operating expenses 33 33 - -
Less: Amortization of dredgingarrears - - 40 40
Less: Technical assistance - 13 - -Less: Interest charges 9 41 77 88Net income 72 66 200 204Operating ratio (%) 67 68 57 60Interest charge coverage (times) 11.0 2.7 3.1 2.7Debt service coverage (times) 9.0 4.0 3.1 2.3Return on average net fixed assets
in use 4.7 5.9 8.6 7.2

- 40 -
5.09 Table 5.8 indicates that interest charges and total debt service areadequately covered during the period under review. Operating ratios aresatisfactory and a rate of return of at least 5% is achieved between 1981 and1983 and at least 7% in 1984 onwards, all as required under the ADB loan (seepara. 5.02).
5.10 PPA's consolidated balance sheet for 1978-86, given in Table 5.9is summarised below for alternate years:
Table 5.03
Summary PPA 1980 1982 1984 1986Consolidated Balance Sheet ------ (in million pesos) -----
Current assets 305 153 165 163Less: Current liabilities 56 141 69 104Net working capital 249 12 96 59Net fixed assets 2,136 3,541 4,470 5,065Other assets 81 172 93 14
Total assets 2.466 3.725 4,659 5.138
Long-term loans 193 1,032 1,307 1,374Equity 2,273 2,693 3,352 3,764
Total debt and equity 2.466 3,725 4.659 5,138
Current ratio (times) 5.4 1.1 2.4 1.5Debt/equity ratio 8/92 27/73 28/72 27/73
5.11 Table 5.9 shows that PPA's working capital and debt/equity ratioposition are expected to be satisfactory throughout the period. The currentratio never falls below 1.1 and the highest debt/equity ratio is a satisfac-tory 30/70.
5.12 A consolidated cash flow forecast for 1979-86 is given in
Table 5.10. The forecasts are summarized below for the investment period1980-84:
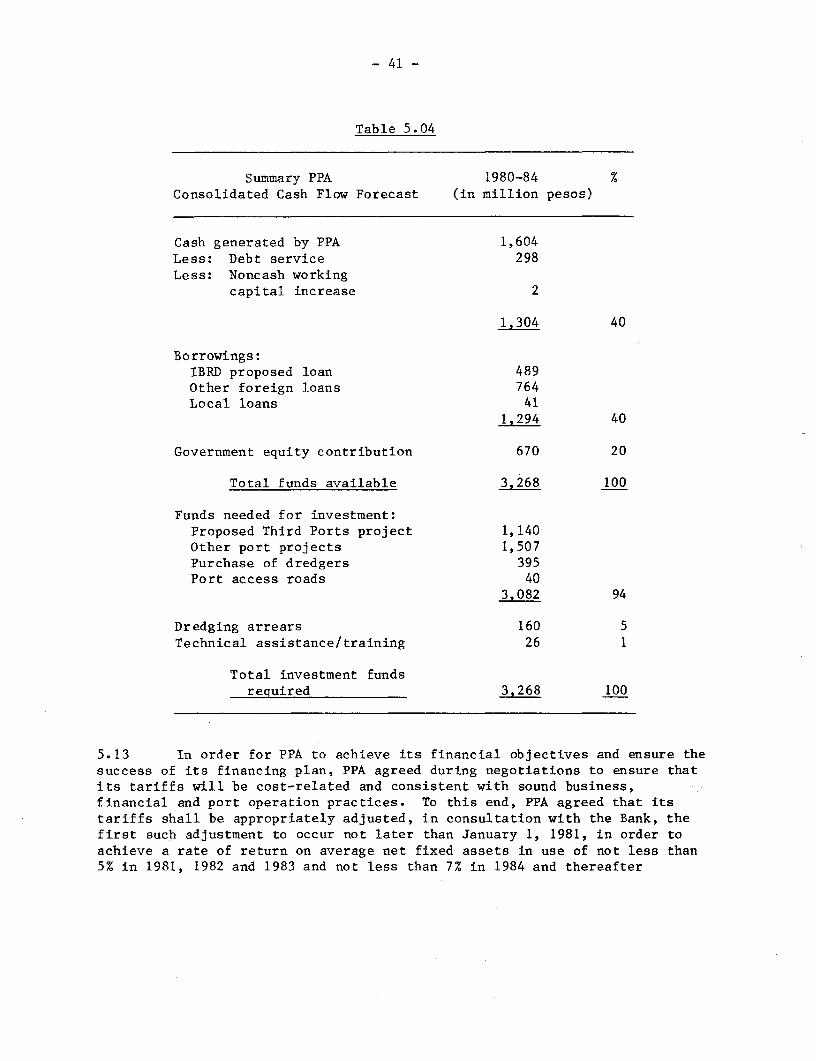
- 41 -
Table 5.04
Summary PPA 1980-84 %Consolidated Cash Flow Forecast (in million pesos)
Cash generated by PPA 1,604Less: Debt service 298Less: Noncash working
capital increase 2
1,304 40
Borrowings:IBRD proposed loan 489Other foreign loans 764Local loans 41
1,294 40
Government equity contribution 670 20
Total funds available 3 268 100
Funds needed for investment:Proposed Third Ports project 1,140Other port projects 1,507Purchase of dredgers 395Port access roads 40
3,082 94
Dredging arrears 160 5Technical assistance/training 26 1
Total investment fundsreguired 3,268 100
5.13 In order for PPA to achieve its financial objectives and ensure thesuccess of its financing plan, PPA agreed during negotiations to ensure thatits tariffs will be cost-related and consistent with sound business,financial and port operation practices. To this end, PPA agreed that itstariffs shall be appropriately adjusted, in consultation with the Bank, thefirst such adjustment to occur not later than January 1, 1981, in order toachieve a rate of return on average net fixed assets in use of not less than5% in 1981, 1982 and 1983 and not less than 7% in 1984 and thereafter
- 42 -
[para. 6.02(g)]. PPA further agreed (a) not to incur new debt if netrevenue falls below 1.75 times maximum debt service requirements for anysucceeding fiscal year [para. 6.02(h)]; and (b) not to increase theestimated cost of the Investment Plan by more than 10% of the plannedinvestment in any fiscal year without prior consultation with the Bank(para. 6.02(e)]. PPA also undertook not to enter into craft or equipmentpurchase agreements exceeding P 50 million in value without priorconsultation with the Bank [(para. 6.02(e)].
5.14 PPA's existing fixed assets are either new or were revalued in1976/77 and early rev,aluation is considered unnecessary. With the implemen-tation of the Investment Plan, more than two thirds of PPA's value of fixedassets in 1984 will relate to new facilities; consequently no estimate ofrevaluation is included in PPA's forecasts. The Loan Agreement contains acovenant requiring assets to be revalued at least once every five years inaccordance with sound and consistently maintained valuation methods (PPA hasagreed to an identical covenant with ADB). PPA assured the Bank duringnegotiations that the first such revaluation will occur no later than 1984[para. 6.02(i)I.
5.15 During negotiations, PPA also agreed to provide for insurance forsuch risks and in such amounts as are consistent with good commercialpractice [para. 6.02(j)].
Sensitivity Analysis
5.16 The following table shows the resultant decline in cash availableto PPA during 1981-84 in the event of: (a) operating expenses exceedingestimates by 10% annually; (b) revenues falling by 10% annually due tolower than forecast traffic growth; and (c) proposed project costs increasingby 10% overall. The table also indicates the effect of counter measures toincrease cash availability by (d) reducing minor port investments by 18%;(e) increasing Government grants by 18%; and (f) increasing tariffs by anadditional 10% in 1981. All of these measures are considered feasible. Asan alternative to all of the above counter measures, if PPA borrowed fromGovernment a loan of P 374 million covering the entire four-year cashdeficit arising from the sensitivity assumptions, PPA's debt/equity ratiowould only rise to a maximum of 34/66 (in 1983), which is satisfactory.
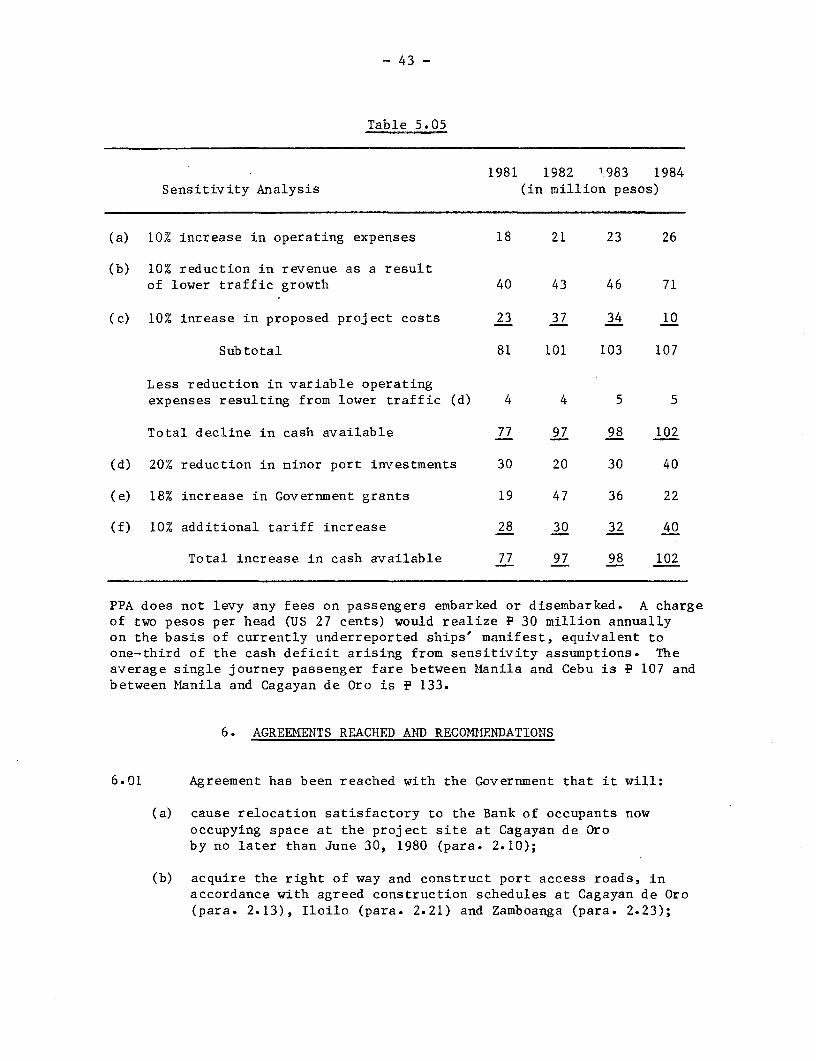
- 43 -
Table 5.05
1981 1982 1983 1984Sensitivity Analysis (in million pesos)
(a) 10% increase in operating expenses 18 21 23 26
(b) 10% reduction in revenue as a resultof lower traffic growth 40 43 46 71
(c) 10% inrease in proposed project costs 23 37 34 10
Subtotal 81 101 103 107
Less reduction in variable operatingexpenses resulting from lower traffic (d) 4 4 5 5
Total decline in cash available 77 97 98 102
(d) 20% reduction in minor port investments 30 20 30 40
(e) 18% increase in Government grants 19 47 36 22
(f) 10% additional tariff increase 28 30 32 40
Total increase in cash available 77 97 98 102
PPA does not levy any fees on passengers embarked or disembarked. A chargeof two pesos per head (US 27 cents) would realize P 30 million annuallyon the basis of currently underreported ships' manifest, equivalent toone-third of the cash deficit arising from sensitivity assumptions. Theaverage single journey passenger fare between Mlanila and Cebu is P 107 andbetween Manila and Cagayan de Oro is P 133.
6. AGREEMENTS REACHED ATD RECOMMENDATIONS
6.01 Agreement has been reached with the Government that it will:
(a) cause relocation satisfactory to the Bank of occupants nowoccupying space at the project site at Cagayan de Oroby no later than June 30, 1980 (para. 2.10);
(b) acquire the right of way and construct port access roads, inaccordance with agreed construction schedules at Cagayan de Oro(para. 2.13), Iloilo (para. 2.21) and Zamboanga (para. 2.23);
- 44 -
(c) cause the removal of wrecks in the proposed access channel tothe project at Cebu (para. 2.16);
(d) relocate a fishing vessel anchorage at Zamboanga by no laterthan June 30, 1981 (para. 2.23);
(e) cause PPA to determine the number of arrastre firms to operateat project ports in consultation with the Bank (para. 2.38);
(f) establish a Project Executive Committee and appoint projectmanagement staff satisfactory to the Bank (para. 3.11); and
(g) appoint consulting engineers acceptable to the Bank (para. 3.11).
6.02 Agreement has been reached with PPA that it will:
(a) discuss proposed major organizational structure changes withthe Bank prior to implementation (para. 2.06);
(b) agree with the Bank suitable operational targets for the projectports by no later than December 31, 1981 (para. 2.07);
(c) conduct siltation observations and review maintenance dredgingrequirements at Cebu no later than December 31, 1982 (para. 2.15);
(d) submit audited accounts to the Bank within six months of eachfiscal year end by auditors satisfactory to the Bank (para. 2.44);
(e) not undertake any change in the Investment Plan exceeding 10% ofthe planned investment in any fiscal year without priorconsultation with the Bank; and not enter into craft or equipmentpurchase agreements exceeding P 50 million in value withoutprior consultation with the Bank (para. 3.02);
(f) appoint consultants acceptable to the Bank (para. 3.11);
(g) earn agreed financial rates of return and adjust tariffs, in con-sultation with the Bank, by no later than January 1, 1981 (para.5.13);
(h) not incur new debt if net revenue falls below 1.75 times maximumdebt service (para. 5.13);
(i) revalue its fixed assets at least once every five years(para. 5.14); and
(j) provide for satisfactory insurance coverage (para. 5.15).
- 45 -
6.03 The proposed project is suitable for a Bank loan of US$67 millionequivalent to the Government for a term of 20 years, including a graceperiod of five years. The Government would relend the loan to PPA on Bankterms with an undertaking by PPA that it shall bear all foreign exchangerisks related to the proposed project.
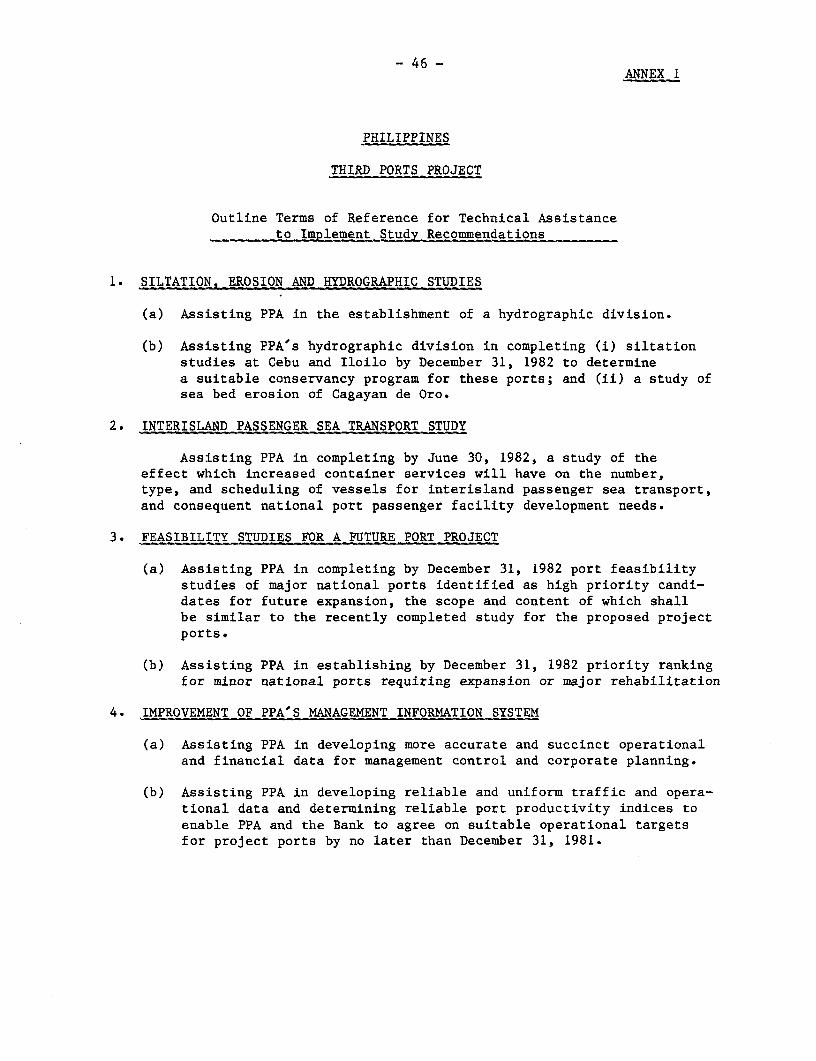
- 46 -ANNEX 1
PHILIPPINES
THIRD PORTS PROJECT
Outline Terms of Reference for Technical Assistanceto-Implement StudyRecommendations
1. SILTATION EROSION AND HYDROGRAPHIC STUDIES
(a) Assisting PPA in the establishment of a hydrographic division.
(b) Assisting PPA's hydrographic division in completing (i) siltationstudies at Cebu and Iloilo by December 31, 1982 to determinea suitable conservancy program for these ports; and (ii) a study ofsea bed erosion of Cagayan de Oro.
2. INTERISLAND PASSENGER SEA TRANSPORT STUDY
Assisting PPA in completing by June 30, 1982, a study of theeffect which increased container services will have on the number,type, and scheduling of vessels for interisland passenger sea transport,and consequent national port passenger facility development needs.
3. FEASIBILITY STUDIES FOR A FUTURE PORT PROJECT
(a) Assisting PPA in completing by December 31, 1982 port feasibilitystudies of major national ports identified as high priority candi-dates for future expansion, the scope and content of which shallbe similar to the recently completed study for the proposed projectports.
(b) Assisting PPA in establishing by December 31, 1982 priority rankingfor minor national ports requiring expansion or major rehabilitation
4. IMPROVEMENT OF PPA'S MANAGEMENT INFORMATION SYSTEM
(a) Assisting PPA in developing more accurate and succinct operationaland financial data for management control and corporate planning.
(b) Assisting PPA in developing reliable and uniform traffic and opera-tional data and determining reliable port productivity indices toenable PPA and the Bank to agree on suitable operational targetsfor project ports by no later than December 31, 1981.
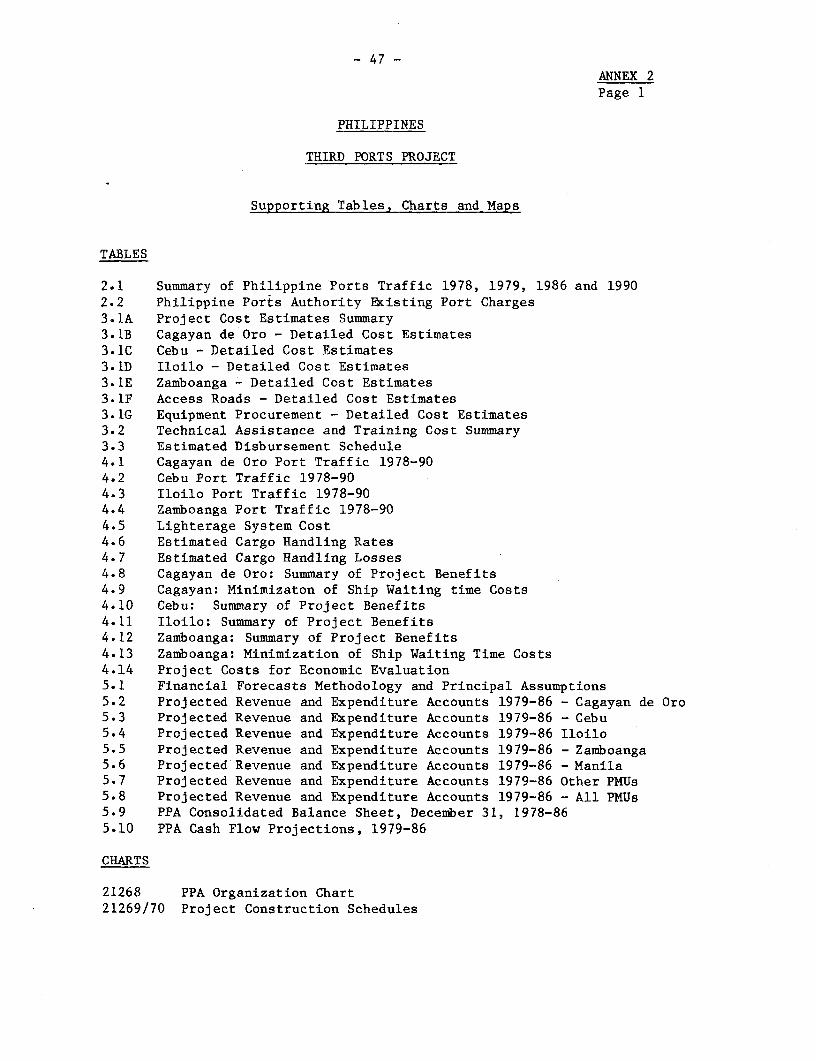
- 47 -ANNEX 2Page 1
PHILIPPINES
THIRD PORTS PROJECT
Supporting Tables, Charts and Maps
TABLES
2.1 Summary of Philippine Ports Traffic 1978, 1979, 1986 and 19902.2 Philippine Ports Authority Existing Port Charges3.1A Project Cost Estimates Summary3.1B Cagayan de Oro - Detailed Cost Estimates3.1C Cebu - Detailed Cost Estimates3.1D Iloilo - Detailed Cost Estimates3.1E Zamboanga - Detailed Cost Estimates3.1F Access Roads - Detailed Cost Estimates3.1G Equipment Procurement - Detailed Cost Estimates3.2 Technical Assistance and Training Cost Summary3.3 Estimated Disbursement Schedule4.1 Cagayan de Oro Port Traffic 1978-904.2 Cebu Port Traffic 1978-904.3 Iloilo Port Traffic 1978-904.4 Zamboanga Port Traffic 1978-904.5 Lighterage System Cost4.6 Estimated Cargo Handling Rates4.7 Estimated Cargo Handling Losses4.8 Cagayan de Oro: Summary of Project Benefits4.9 Cagayan: Minimizaton of Ship Waiting time Costs4.10 Cebu: Summary of Project Benefits4.11 Iloilo: Summary of Project Benefits4.12 Zamboanga: Summary of Project Benefits4.13 Zamboanga: Minimization of Ship Waiting Time Costs4.14 Project Costs for Economic Evaluation5.1 Financial Forecasts Methodology and Principal Assumptions5.2 Projected Revenue and Expenditure Accounts 1979-86 - Cagayan de Oro5.3 Projected Revenue and Expenditure Accounts 1979-86 - Cebu5.4 Projected Revenue and Expenditure Accounts 1979-86 Iloilo5.5 Projected Revenue and Expenditure Accounts 1979-86 - Zamboanga5.6 Projected Revenue and Expenditure Accounts 1979-86 - Manila5.7 Projected Revenue and Expenditure Accounts 1979-86 Other PMUs5.8 Projected Revenue and Expenditure Accounts 1979-86 - All PMUs5.9 PPA Consolidated Balance Sheet, December 31, 1978-865.10 PPA Cash Flow Projections, 1979-86
CHARTS
21268 PPA Organization Chart21269/70 Project Construction Schedules
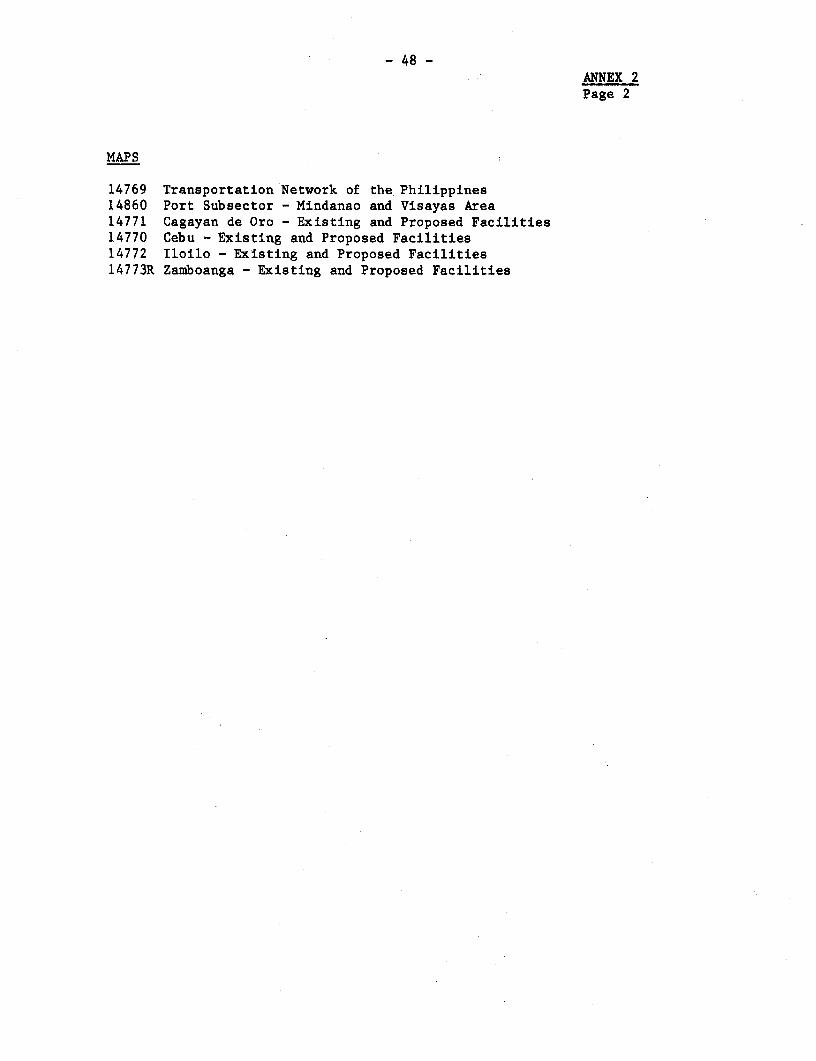
- 48 -ANNEX 2Page 2
MAPS
14769 Transportation Network of the Philippines14860 Port Subsector - Mindanao and Visayas Area14771 Cagayan de Oro - Existing and Proposed Facilities14770 Cebu - Existing and Proposed Facilities14772 Iloilo - Existing and Proposed Facilities14773R Zamboanga - Existing and Proposed Facilities
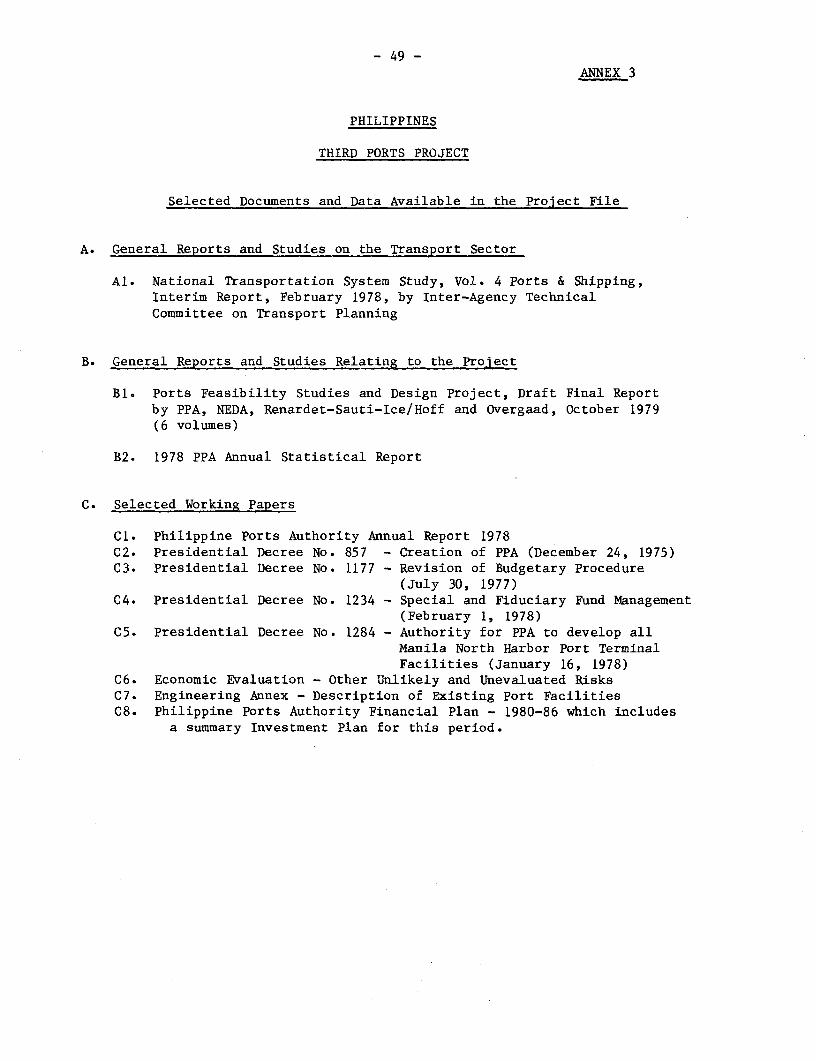
- 49 -ANNEX 3
PHILIPPINES
THIRD PORTS PROJECT
Selected Documents and Data Available in the Project File
A. General Reports and Studies on the Transport Sector
Al. National Transportation System Study, Vol. 4 Ports & Shipping,Interim Report, February 1978, by Inter-Agency TechnicalCommittee on Transport Planning
B. General Reports and Studies Relating to the Project
B1. Ports Feasibility Studies and Design Project, Draft Final Reportby PPA, NEDA, Renardet-Sauti-Ice/Hoff and Overgaad, October 1979(6 volumes)
B2. 1978 PPA Annual Statistical Report
C. Selected Working Papers
Cl. Philippine Ports Authority Annual Report 1978C2. Presidential Decree No. 857 - Creation of PPA (December 24, 1975)C3. Presidential Decree No. 1177 - Revision of Budgetary Procedure
(July 30, 1977)C4. Presidential Decree No. 1234 - Special and Fiduciary Fund Management
(February 1, 1978)C5. Presidential Decree No. 1284 - Authority for PPA to develop all
Manila North Harbor Port TerminalFacilities (January 16, 1978)
C6. Economic Evaluation - Other Unlikely and Unevaluated RisksC7. Engineering Annex - Description of Existing Port FacilitiesC8. Philippine Ports Authority Financial Plan - 1980-86 which includes
a summary Investment Plan for this period.
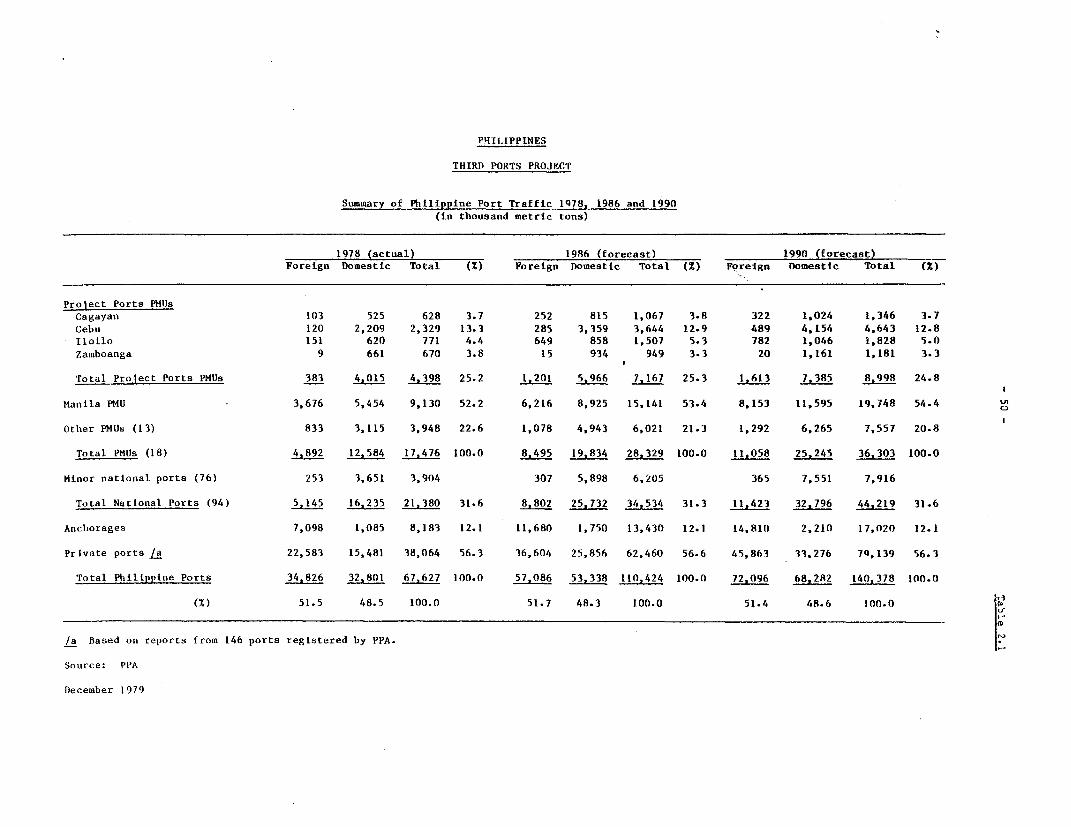
P11.IPPINES
THIRD PORTS PROJECT
Summary of Philippine Port Traffic 1q78, 1986 and 1990
(in thousand metric tons)
1978 (actual) 1986 (forecast) 1990 (forecast)
Foreign Domestic Total (X) Foreign Domestic Total (Z) Foreign Domestic Total (X)
Project Ports PMUsCagayan 103 525 628 3.7 252 815 1,067 3.8 322 1,024 1,346 3.7
Cebu 120 2,209 2,329 13.3 285 3,359 3,644 12.9 489 4,154 4,643 12.8
Iloilo 151 620 771 4.4 649 858 1,507 5.3 782 1,046 1,828 5.0
Zamboanga 9 661 670 3.8 15 934 949 3.3 20 1,161 1,181 3.3
Total Project Ports PMUs 383 4,015 4.398 25.2 1,201 5 7,167 25.3 1,613 7,385 8,998 24.8
Manila PMU - 3,676 5,454 9,130 52.2 6,216 8,925 15,141 53.4 8.153 11,595 19,748 54.4 o
Other PMUs (13) 833 3,115 3,948 22.6 1,078 4,943 6,021 21.3 1,292 6,265 7,557 20.8
Total PMUs (18) 4,892 12,584 17,476 100.0 8,495 19,834 28,329 100.0 11,058 25,245 36,303 100.0
Minor national ports (76) 253 3,651 3,904 307 5,898 6,205 365 7,551 7,916
Total National Ports (94) 5,145 16,235 21,380 31.6 8,802 25,732 34,534 31.3 11,423 32,796 44,219 31.6
Anchorages 7,098 1,085 8,183 12.1 11,680 1,750 13,430 12.1 14,810 2,210 17,020 12.1
Private ports /a 22,583 15,481 38,064 56.3 36,604 25,856 62,460 56.6 45,863 33,276 7Q,139 56.3
Total Philippine Ports 34,826 32,801 67,627 100.0 57.086 53,338 110,424 100.0 72,096 68,282 140,378 100.0
(x) 51.5 48.5 100.0 51.7 48.3 100.0 51.4 48.6 100.0 C
/a Based on reports from 146 ports registered by PPA.
Source: PPA
December 1979
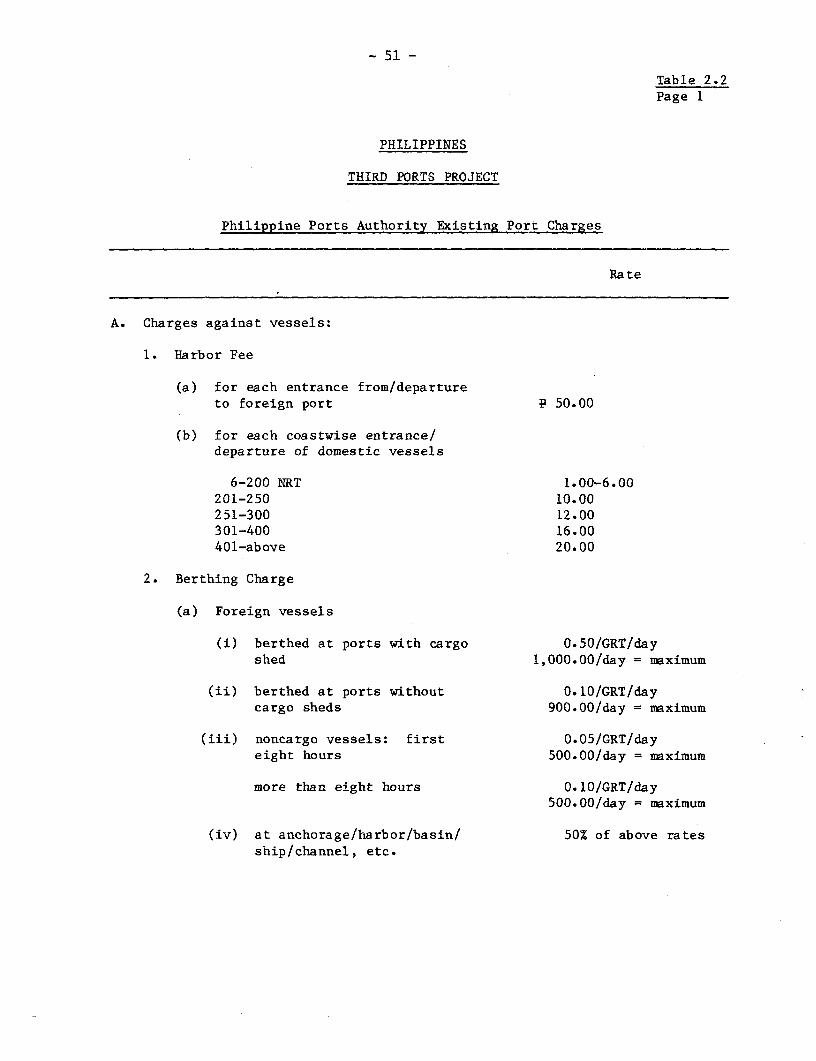
- 51 -
Table 2.2Page 1
PHILIPPINES
THIRD PORTS PROJECT
Philippine Ports Authority Existing Port Charges
Rate
A. Charges against vessels:
1. Harbor Fee
(a) for each entrance from/departureto foreign port P 50.00
(b) for each coastwise entrance/departure of domestic vessels
6-200 NRT 1.00-6.00201-250 10.00251-300 12.00301-400 16.00401-above 20.00
2. Berthing Charge
(a) Foreign vessels
(i) berthed at ports with cargo 0.50/GRT/dayshed 1,000.00/day = maximum
(ii) berthed at ports without 0.10/GRT/daycargo sheds 900.00/day = maximum
(iii) noncargo vessels: first 0.05/GRT/dayeight hours 500.00/day = maximum
more than eight hours 0.10/GRT/day500.00/day = maximum
(iv) at anchorage/harbor/basin/ 50% of above ratesship/channel, etc.
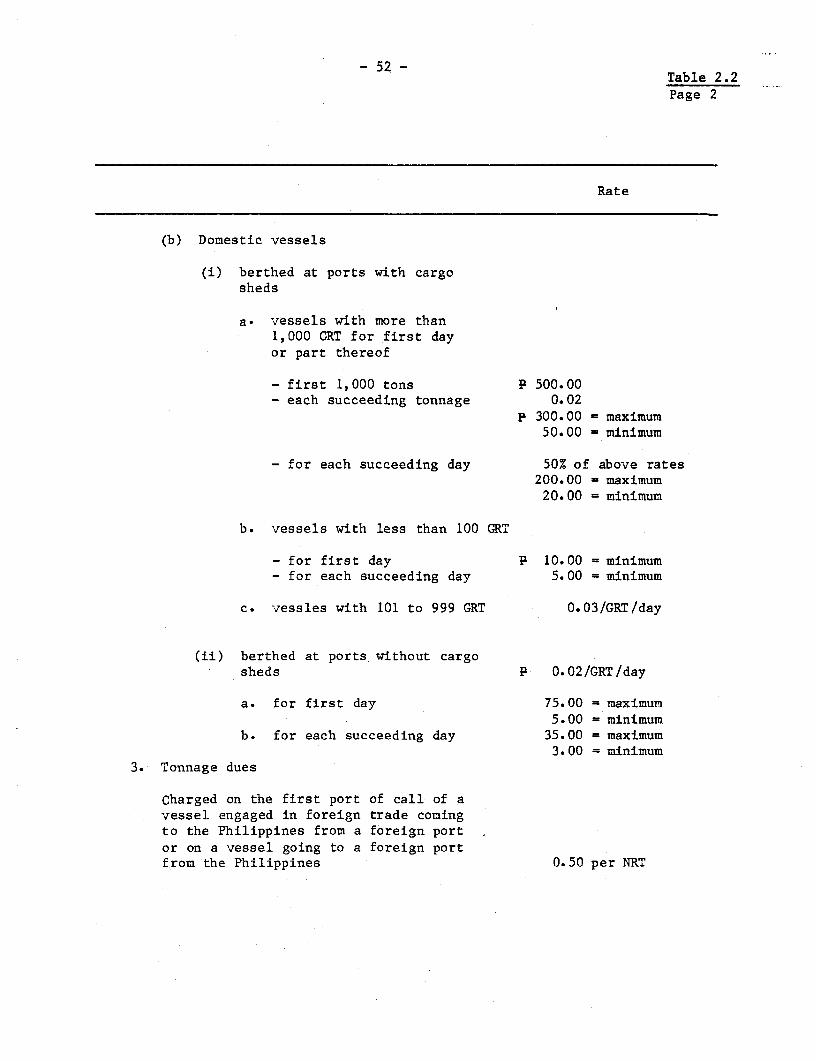
- 52 -Table 2.2Page 2
Rate
(b) Domestic vessels
(i) berthed at ports with cargosheds
a. vessels with more than1,000 CRT for first dayor part thereof
- first 1,000 tons E 500.00- each succeeding tonnage 0.02
P 300.00 = maximum50.00 = minimum
- for each succeeding day 50X of above rates200.00 = maximum20.00 = minimum
b. vessels with less than 100 GRT
- for first day P 10.00 = minimum- for each succeeding day 5.00 = minimum
c. vessles with 101 to 999 GRT 0.03/GRT/day
(ii) berthed at ports without cargosheds E 0.02/GRT/day
a. for first day 75.00 = maximum5.00 = minimum
b. for each succeeding day 35.00 = maximum3.00 = minimum
3. Tonnage dues
Charged on the first port of call of avessel engaged in foreign trade comingto the Philippines from a foreign portor on a vessel going to a foreign portfrom the Philippines 0.50 per NRT
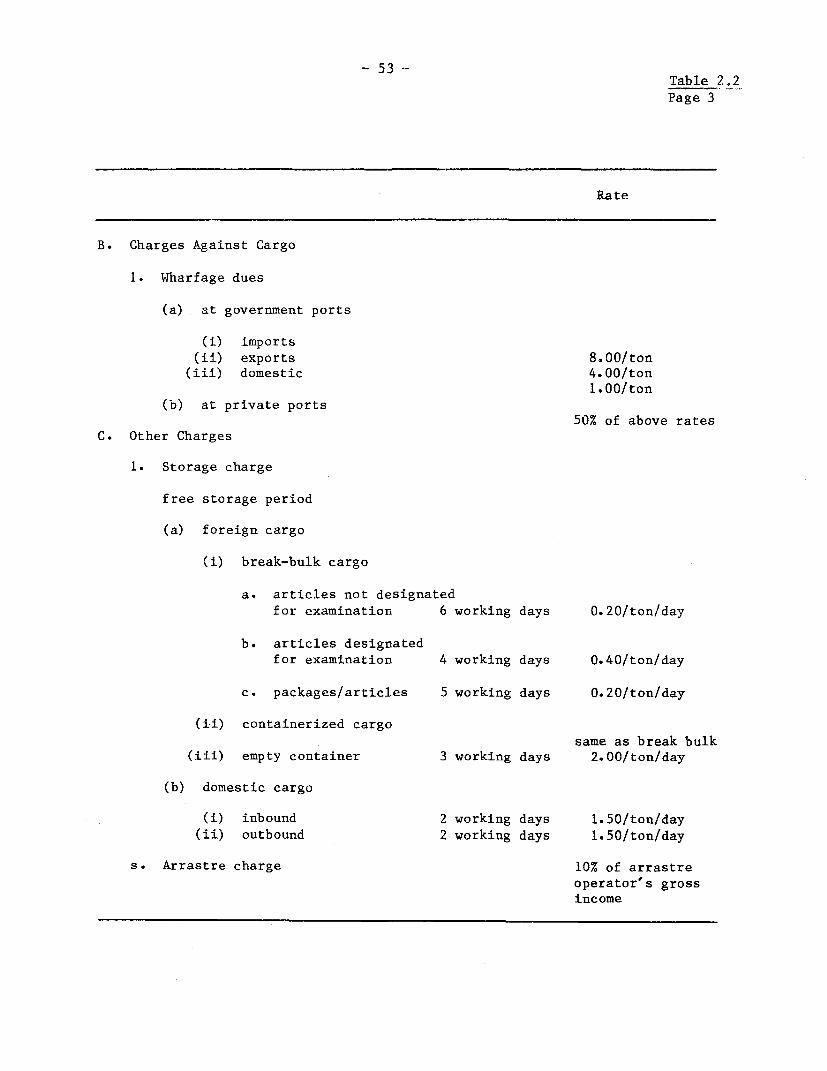
- 53 -Table 2.2Page 3
Rate
B. Charges Against Cargo
1. Wharfage dues
(a) at government ports
(i) imports(ii) exports 8.00/ton(iii) domestic 4.00/ton
1.00/ton(b) at private ports
50% of above ratesC. Other Charges
1. Storage charge
free storage period
(a) foreign cargo
(i) break-bulk cargo
a. articles not designatedfor examination 6 working days 0.20/ton/day
b. articles designatedfor examination 4 working days 0.40/ton/day
c. packages/articles 5 working days 0.20/ton/day
(ii) containerized cargosame as break bulk
(iii) empty container 3 working days 2.00/ton/day
(b) domestic cargo
(i) inbound 2 working days 1.50/ton/day(ii) outbound 2 working days 1.50/ton/day
s. Arrastre charge 10% of arrastreoperator's grossincome
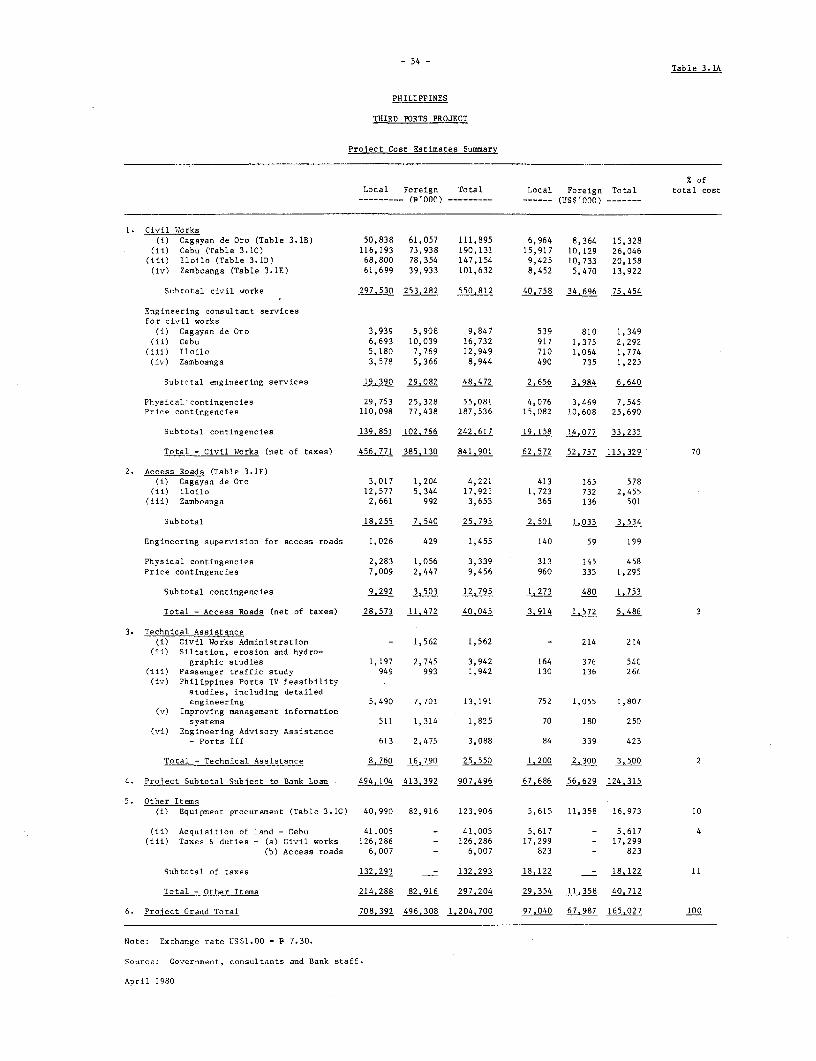
- 54 -Table 3.1A
PHILIPPINES
THIRD PORTS PROJECT
Project Cost Estimates Summary
X ofLocal Foreign Total Local Foreign Total total cost
--- (P0 00) … -- (US$'000) ------…
1. Civil Works(i) Cagayan de Oro (Table 3.1B) 50,838 61,057 111,895 6,964 8,364 15,328
(ii) Cebu (Table 3.LC) 116,193 73,938 190,131 15,917 10,129 26,046(iii) Iloilo (Table 3.1D) 68,800 78,354 147,154 9,425 10,733 20,158
(iv) Zamboanga (Table 3.LE) 61,699 39,933 101,632 8,452 5,470 13,922
Subtotal civil works 297,530 253,282 550.812 40,758 34.696 75.454
Engineering consultant servicesfor civil works
(i) Cagayan de Oro 3,939 5,908 9,847 539 810 1,349(ii) Cebu 6,693 10,039 16,732 917 1,375 2,292
(iii) Iloilo 5,180 7,769 12,949 710 1,064 1,774(iv) Zamboanga 3,578 5,366 8,944 490 735 1,225
Subtotal engineering services 19.390 29,082 48.472 2,656 3.984 6,640
Physical'contingencies 29,753 25,328 55,081 4,076 3,469 7,545Price contingencies 110,098 77,438 187,536 15,082 10,608 25,690
Subtotal contingencies 139.351 102.766 242.617 19,158 14.077 33,235
Total - Civil Works (net of taxes) 456.771 385,130 841.901 62,572 52,757 115.329 70
2. Access Roads (Table 3.1P)(i) Cagayan de Oro 3,017 1,204 4,221 413 165 578
(ii) Iloilo 12,577 5,344 17,921 1,723 732 2,455(iii) Zamboanga 2,661 992 3,653 365 136 501
Subtotal 18.255 7,540 25.795 2,501 1.033 3,534
Engineering supervision for access roads 1,026 429 1,455 140 59 199
Physical contingencies 2,283 1,056 3,339 313 145 458Price contingencies 7,009 2,447 9,456 960 335 1,295
Subtotal contingencies 9.292 3,503 12.795 1,273 480 1,753
Total - Access Roads (net of taxes) 28,573 11,472 40,045 3,914 1.572 5,486 3
3. Technical Assistance(i) Civil Works Administration - 1,562 1,562 - 214 214
(ii) Siltation, erosion and hydro-graphic studies 1,197 2,745 3,942 164 376 54C
(iii) Passenger traffic study 949 993 1,942 130 136 266(iv) Philippines Ports IV feasibility
studies, including detailedengineering 5,490 7,701 13,191 752 1,055 1,807
(v) Improving management informationsystems 511 1,314 1,825 70 180 250
(vi) Engineering Advisory Assistance- Ports III 613 2,475 3,088 84 339 423
Total - Technical Assistance 8.760 16,790 25,.550 1200 2,.300 3500 2
4. Project Subtotal Subject to Bank Loan 494,104 413,392 907,496 67.686 56,629 124,315
5. Other Items(i) Equipment procurement (Table 3.1G) 40,990 82,916 123,906 5,615 11,358 16,973 10
(ii) Acquisition of land - Cebu 41,005 - 41,005 5,617 - 5,617 4(iii) Taxes & duties - (a) Civil works 126,286 - 126,286 17,299 - 17,299
(b) Access roads 6,007 - 6,007 823 - 823
Subtotal of taxes 132,293 - 132,293 18,122 - 18122 11
Total - Other Items 214,288 82,916 297,204 29.354 11.358 40.712
6. Project Grand Total 708.392 496,308 1.204.,700 97,040 67.987 165.027 100
Note: Exchange rate US$1.00 = P 7.30.
Source: Government, consultants and Bank staff.
April 1980
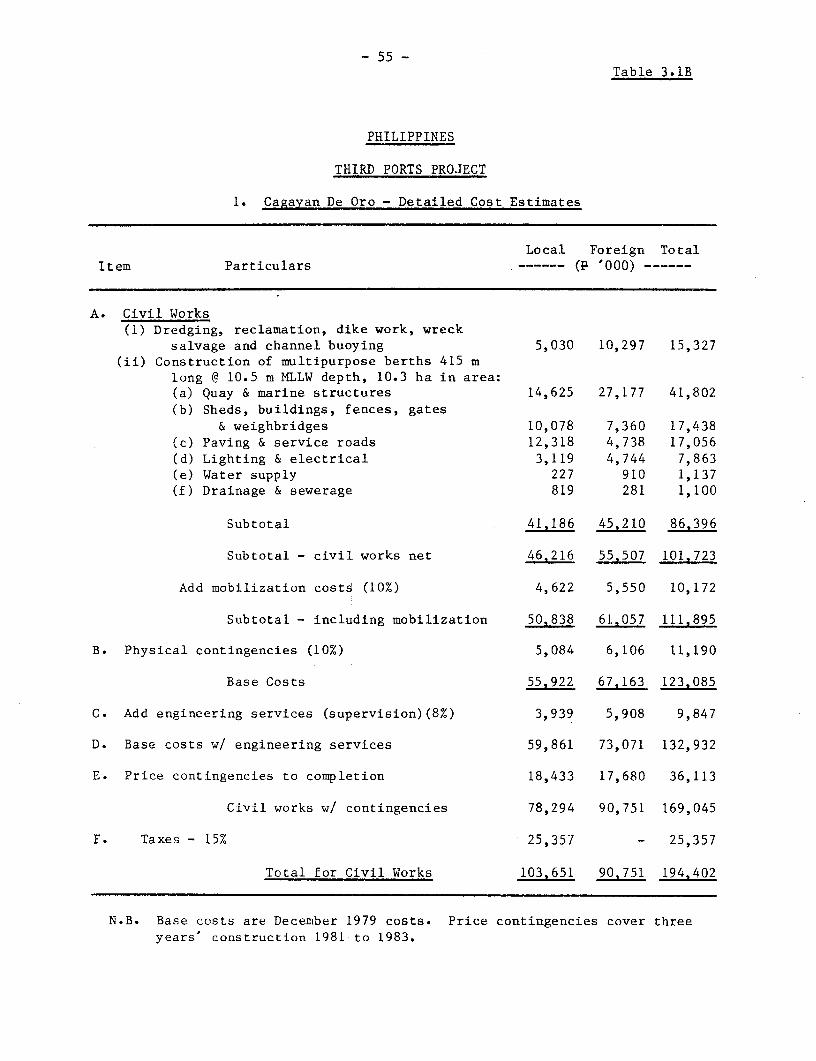
- 55 -Table 3.1B
PHILIPPINES
THIRD PORTS PROJECT
1. Cagayan De Oro - Detailed Cost Estimates
Local Foreign TotalItem Particulars -…- (p '000) ------
A. Civil Works(1) Dredging, reclamation, dike work, wreck
salvage and channel buoying 5,030 10,297 15,327(ii) Construction of multipurpose berths 415 m
long @ 10.5 m MLLW depth, 10.3 ha in area:(a) Quay & marine structures 14,625 27,177 41,802(b) Sheds, buildings, fences, gates
& weighbridges 10,078 7,360 17,438(c) Paving & service roads 12,318 4,738 17,056(d) Lighting & electrical 3,119 4,744 7,863(e) Water supply 227 910 1,137(f) Drainage & sewerage 819 281 1,100
Subtotal 41,186 45,210 86,396
Subtotal - civil works net 46J216 55.507 101.723
Add mobilization costs (10%) 4,622 5,550 10,172
Subtotal - including mobilization 50,838 61,057 111.895
B. Physical contingencies (10%) 5,084 6,106 11,190
Base Costs 55,922 67.163 123,085
C. Add engineering services (supervision)(8%) 3,939 5,908 9,847
D. Base costs w/ engineering services 59,861 73,071 132,932
E. Price contingencies to completion 18,433 17,680 36,113
Civil works w/ contingencies 78,294 90,751 169,045
F. Taxes - 15% 25,357 - 25,357
Total for Civil Works 103,651 90.751 194.402
N.B. Base costs are December 1979 costs. Price contingencies cover threeyears' construction 1981 to 1983.

- 56 -
Table 3.1C
PHILIPPINES
THIRD PORTS PROJECT
2. Cebu - Detailed Cost Estimates
Local Foreign TotalItem Particulars ------ (P '000) ------
A.1. Civil Works New Construction and Dredginp(i) Dredging and disposal of 460,000 cu m
of spoil, dike work and channel buoying 17,463 6,303 23,766(ii) New construction of composite multipurpose
berths 550 m long at -9.5 m depth atMLLil, 18 ha in area:(a) Quay & marine structures 21,358 24,955 46,313(b) Sheds, buildings, fences, gates
& weighbridges 12,027 7,161 19,188(c) Paving & service roads 26,248 12,038 38,286(d) Lighting & electrical 4,303 3,590 7,893(e) Water supply 1,479 816 2,295(f) Drainage & sewerage 1,309 433 1,742
Subtotal 66.724 48.993 115.717
Subtotal A 84.187 55.296 139.483
A.2 Civil Works Rehabilitation(i) New fendering system for about
1 km length 3,887 3,164 7,051(ii) Paving of 40 m to 50 m wide apron, curbs
and existing circulation roads,drainage, lighting and water supply 16,762 8,346 25,108
(iii) Port perimeter fencing enclosinga 38 ha existing port area andproviding gates 794 410 1,204
Subtotal 21.443 11.920 33,363
Subtotal civil works net 105.630 67.216 172,846
Add mobilization costs (10%) 10,563 6,722 17,285
Subtotal including mobilization 116.193 73,938 190.131
B. Physical contingencies (10%) 11,619 7,394 19,013
Base Costs 127.812 81.332 209.144
C. Add engineering services (supervision) - (8%) 6,693 10,039 16,732
D. Base costs wl engineering services 134,505 91,371 225,876
E. Price contingencies to completion 41,792 22,362 64,154
Subtotal 176.297 113.733 290,030
F. Taxes - 15% 43,505 - 43,505
Total for Civil tIlorks 219.802 113.733 333.535
N.B. Base costs are December 1979 costs. Price contingencies cover threeyears construction 1981 to 1983.
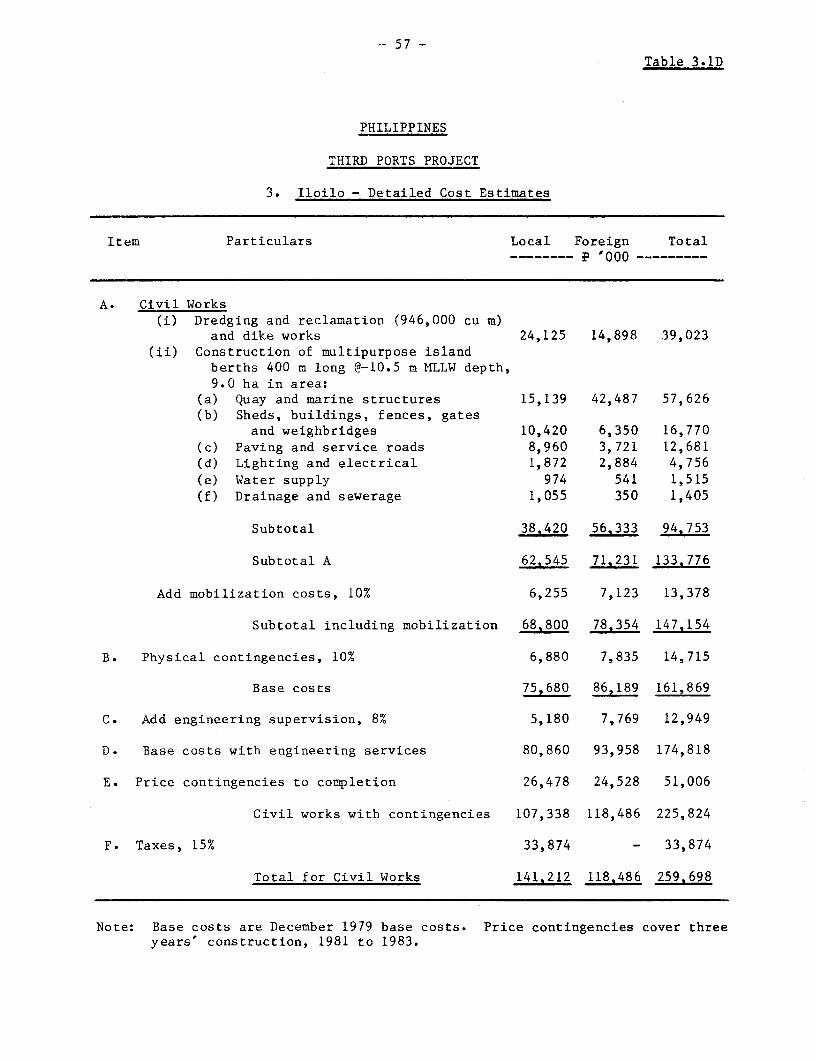
57 -
Table 3.1D
PHILIPPINES
THIRD PORTS PROJECT
3. Iloilo - Detailed Cost Estimates
Item Particulars Local Foreign Total---- -P -000 …
A. Civil Works(i) Dredging and reclamation (946,000 cu m)
and dike works 24,125 14,898 39,023(ii) Construction of multipurpose island
berths 400 m long @-10.5 m MLLW depth,9.0 ha in area:
(a) Quay and marine structures 15,139 42,487 57,626(b) Sheds, buildings, fences, gates
and weighbridges 10,420 6,350 16,770(c) Paving and service roads 8,960 3,721 12,681(d) Lighting and electrical 1,872 2,884 4,756(e) Water supply 974 541 1,515(f) Drainage and sewerage 1,055 350 1,405
Subtotal 38.420 56.333 94,753
Subtotal A 62,545 71.231 133.776
Add mobilization costs, 10% 6,255 7,123 13,378
Subtotal including mobilization 68.800 78,354 147,154
B. Physical contingencies, 10% 6,880 7,835 14,715
Base costs 75,680 86,189 161,869
C. Add engineering supervision, 8% 5,180 7,769 12,949
D. Base costs with engineering services 80,860 93,958 174,818
E. Price contingencies to completion 26,478 24,528 51,006
Civil works with contingencies 107,338 118,486 225,824
F. Taxes, 15% 33,874 - 33,874
Total for Civil Works 141,212 118,486 259.698
Note: Base costs are December 1979 base costs. Price contingencies cover threeyears' construction, 1981 to 1983.

- 58 -aobLe 3-1_
PHILIPPINES
THIRD PORTS PROJECT
4. Zamboanga - Detailed Cost Estimates
Local Foreign TotalItem Particulars -------- '00oo ---------
A.1 Civil works - new construction and dredging
(i) Dredging for reclamation (463,000 m3)and dike work 10,953 4,535 15,488
(ii) New construction of multipurpose deepwater quay 220 m long @-10 m depthat MLLW, 7.5 ha in area:
(a) Quay and marine structures 3,895 7,710 11,605(b) Sheds and building, fencing,
gates and weighbridges 10,488 7,683 18,171
(c) Paving and service roads 16,394 3,828 20,222(d) Lighting and electrical 2,316 3,572 5,888(e) Water supply 1,875 2,002 3,877(f) Drainage and sewerage 2,396 560 2,956(g) Channel and bridges 1,354 693 2,047
Subtotal of new construction 38,718 26,048 64,766
Subtotal A.1 49.671 30,583 80,254
A.2 Civil works - incorporation of existingT-iettv section 90 m length with newdeep water cuav 3,516 3,808 7,324
A.3 Civil works - ferry pier and dolphins 2,903 1,912 4,815
Subtotal A.1 to A.3 56290 36.303 92.393
Add mobilization costs (10%) 5,609 3,630 9,239
Subtotal civil works with mobilization 39,933 101. 632
B. Physical contingencies - 10% 6,170 3,993 10,163
Base costs 67,869 43,926 111,795
C. Add engineering services (supervision) - (8%) 3,578 5,366 8,944
D. Base costs with engineering services 71,447 49,292 120,739
E. Price contingencies to completion 23,395 12,868 36,263
Subtotal 94,842 62.160 157,002
F. Taxes - 15% 23,550 - 23,550
Total for civil works 118,392 62,160 180,552
N.B. Base costs are Decenber 1979 costs. Price contingencies cover threeyears' construction 1981 to 1983.
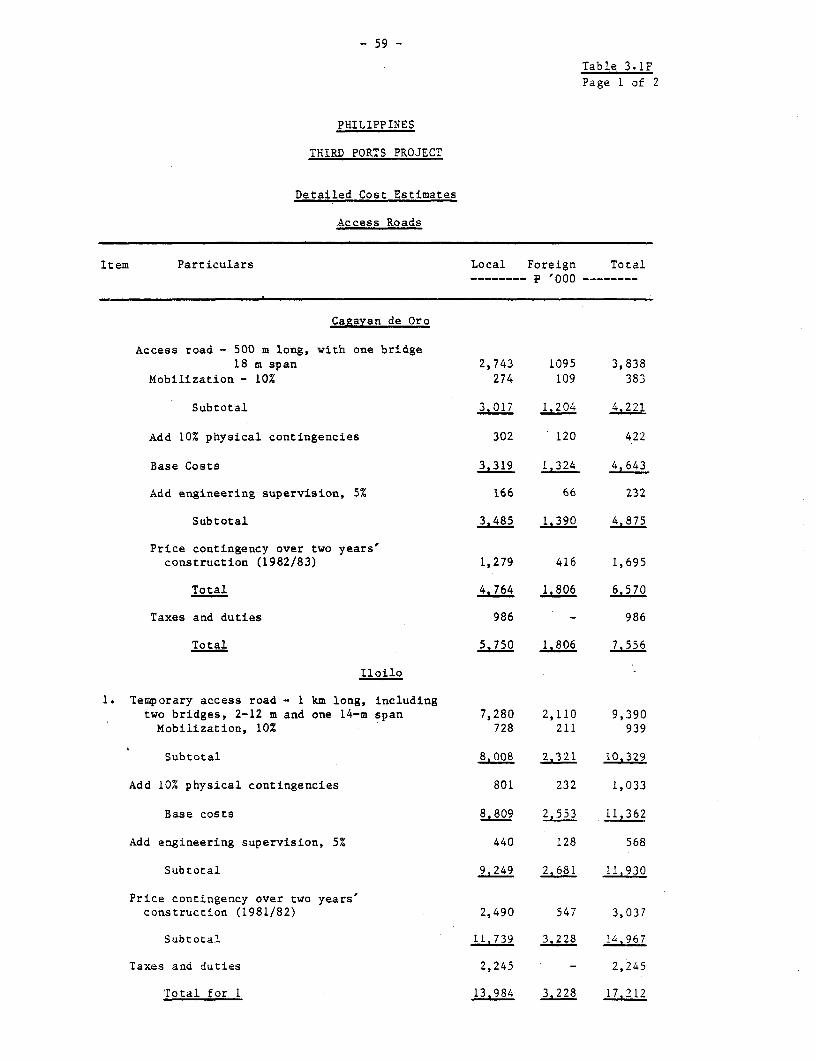
- 59 -
Table 3.1F
Page 1 of 2
PHILIPPINES
THIRD PORTS PROJECT
Detailed Cost Estimates
Access Roads
Item Particulars Local Foreign Total-- -- -P O O O --------
Cagayan de Oro
Access road - 500 m long, with one bridge18 m span 2,743 1095 3,838
Mobilization - 10% 274 109 383
Subtotal 3.017 1.204 4.221
Add 10% physical contingencies 302 120 422
Base Costs 3,319 1 4,643
Add engineering supervision, 5% 166 66 232
Subtotal 3,485 1,390 4.875
Price contingency over two years'construction (1982/83) 1,279 416 1,695
Total 4.764 1.806 6.570
Taxes and duties 986 - 986
Total 5.750 1.806 7,556
Iloilo -
1. Temporary access road - 1 km long, includingtwo bridges, 2-12 m and one 14-m span 7,280 2,110 9,390Mobilization, 10% 728 211 939
Subtotal 8.008 2.321 10.329
Add 10% physical contingencies 801 232 1,033
Base costs 8.809 2,553 11,362
Add engineering supervision, 5% 440 128 568
Subtotal 9.249 2.681 11.930
Price contingency over two years'construction (1981/82) 2,490 547 3,037
Subtotal 11.739 3.228 14.967
Taxes and duties 2,245 - 2,245
Total for 1 13.984 3.228 17,212
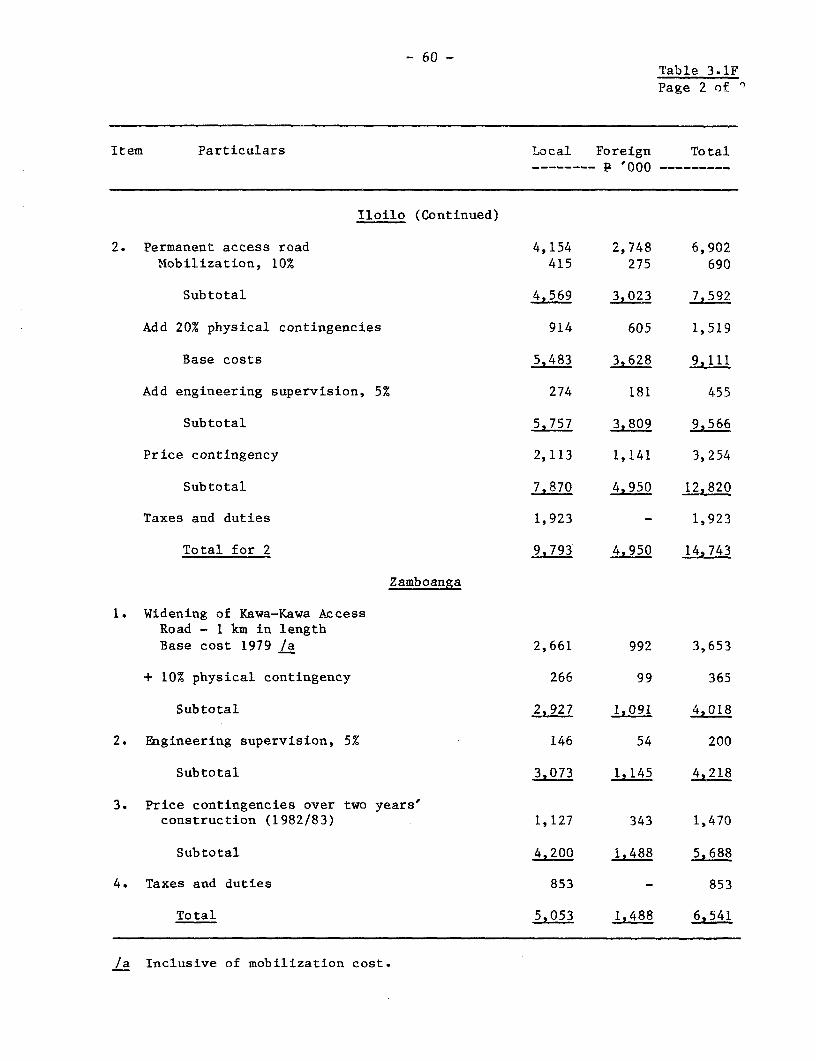
- 60 -Table 3.1FPage 2 of 2
Item Particulars Local Foreign Total--- --- P 000o ---------
Iloilo (Continued)
2. Permanent access road 4,154 2,748 6,902Mobilization, 10% 415 275 690
Subtotal 4?569 3,023 7,592
Add 20% physical contingencies 914 605 1,519
Base costs 5,483 3,628 9,111
Add engineering supervision, 5% 274 181 455
Subtotal 5,757 3,809 9?566
Price contingency 2,113 1,141 3,254
Subtotal 7,870 4,950 12,820
Taxes and duties 1,923 - 1,923
Total for 2 9,793 4,950 14,743
Zamboanga
1. Widening of Kawa-Kawa AccessRoad - 1 km in lengthBase cost 1979 /a 2,661 992 3,653
+ 10% physical contingency 266 99 365
Subtotal 2_927 1,091 4,018
2. Engineering supervision, 5% 146 54 200
Subtotal 3,073 1,145 4,218
3. Price contingencies over two years'construction (1982/83) 1,127 343 1,470
Subtotal 4,200 1,488 5,688
4. Taxes and duties 853 - 853
Total 5,053 1,488 6,541
/a Inclusive of mobilization cost.
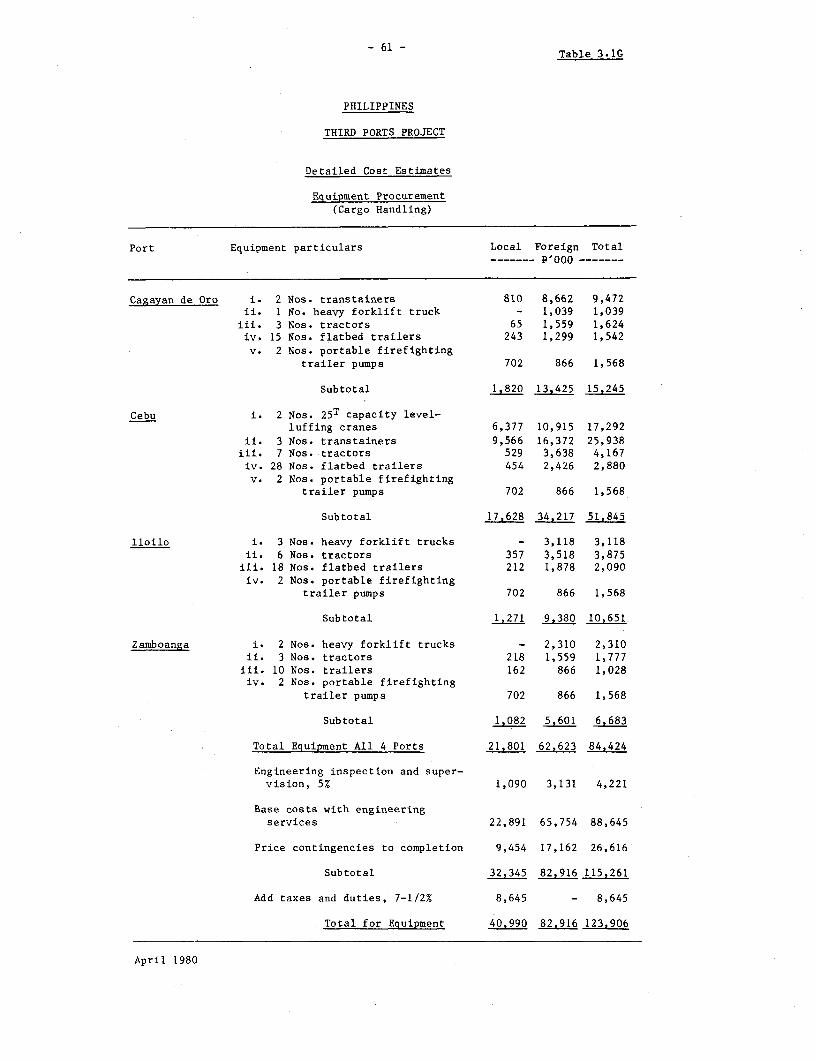
- 61 - Table 3.1G
PHILIPPINES
THIRD PORTS PROJECT
Detailed Cost Estimates
Equipment Procurement(Cargo Handling)
Port Equipment particulars Local Foreign Total______- POOO …
Cagayan de Oro i. 2 Nos. transtainers 810 8,662 9,472ii. 1 No. heavy forklift truck - 1,039 1,039
iii. 3 Nos. tractors 65 1,559 1,624iv. 15 Nos. flatbed trailers 243 1,299 1,542v. 2 Nos. portable firefighting
trailer pumps 702 866 1,568
Subtotal 1,820 13,425 15,245
Cebu i. 2 Nos. 25 T capacity level-luffing cranes 6,377 10,915 17,292
ii. 3 Nos. transtainers 9,566 16,372 25,938iii. 7 Nos. tractors 529 3,638 4,167iv. 28 Nos. flatbed trailers 454 2,426 2,880v. 2 Nos. portable firefighting
trailer pumps 702 866 1,568
Subtotal 17J628 34,217 51,845
Iloilo i. 3 Nos. heavy forklift trucks - 3,118 3,118ii. 6 Nos. tractors 357 3,518 3,875
iii. 18 Nos. flatbed trailers 212 1,878 2,090iv. 2 Nos. portable firefighting
trailer pumps 702 866 1,568
Subtotal 1,271 9.380 10,651
Zamboanga i. 2 Nos. heavy forklift trucks - 2,310 2,310ii. 3 Nos. tractors 218 1,559 1,777
iii. 10 Nos. trailers 162 866 1,028iv. 2 Nos. portable firefighting
trailer pumps 702 866 1,568
Subtotal 1.082 5,601 6,683
Total Equipment All 4 Ports 21,801 62,623 84,424
Engineering inspection and super-vision, 5% 1,090 3,131 4,221
Base costs with engineeringservices 22,891 65,754 88,645
Price contingencies to completion 9,454 17,162 26,616
Subtotal 32,345 82,916 115,261
Add taxes and duties, 7-1/2% 8,645 - 8,645
Total for Equipment 40,990 82,916 123,906
April 1980
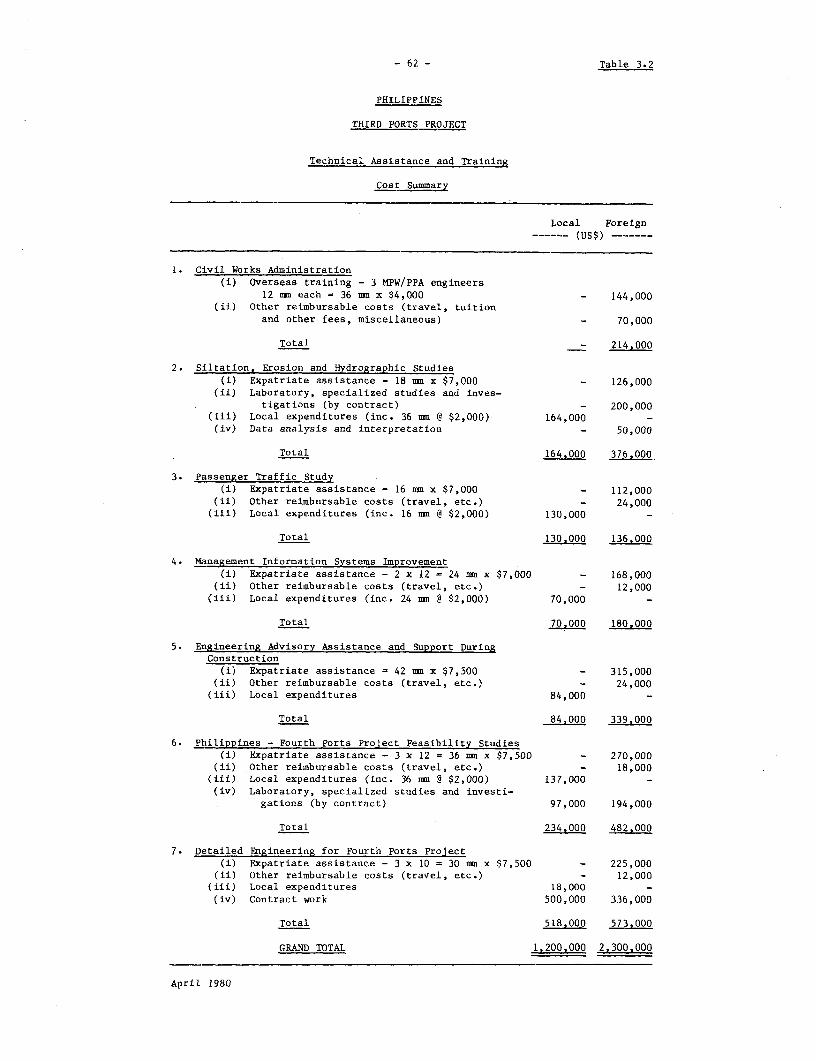
- 62 - Table 3.2
PHILIPPINES
THIRD PORTS PROJECT
Technical Assistance and Training
Cost Summary
Local Foreign-…- (US$) -…
1. Civil Works Administration(i) Overseas training - 3 MPW/PPA engineers
12 mm each = 36 mm x $4,000 - 144,000(ii) Other reimbursable costs (travel, tuition
and other fees, miscellaneous) - 70,000
Total - 214.000
2. Siltation, Erosion and Hydrographic Studies(i) Expatriate assistance - 18 mm x $7,000 - 126,000
(ii) Laboratory, specialized studies and inves-tigations (by contract) - 200,000
(iii) Local expenditures (inc. 36 mm @ $2,000) 164,000 -(iv) Data analysis and interpretation - 50,000
Total 164,000 376,000
3. Passenger Traffic Study(i) Expatriate assistance = 16 mm x $7,000 - 112,000
(ii) Other reimbursable costs (travel, etc.) - 24,000(iii) Local expenditures (inc. 16 mm @ $2,000) 130,000 -
Total 130.000 136,000
4. Management Information Systems Improvement(i) Expatriate assistance - 2 x 12 = 24 mm x $7,000 - 168,000
(ii) Other reimbursable costs (travel, etc.) - 12,000(iii) Local expenditures (inc. 24 mm @ $2,000) 70,000 -
Total 70,000 180.000
5. Engineering Advisory Assistance and Support DuringConstruction
(i) Expatriate assistance = 42 mm x $7,500 - 315,000(ii) Other reimbursable costs (travel, etc.) - 24,000(iii) Local expenditures 84,000 -
Total 84.000 339,000
6. Philippines - Fourth Ports Project Feasibility Studies(i) Expatriate assistance - 3 x 12 = 36 mm x $7,500 - 270,000
(ii) Other reimbursable costs (travel, etc.) - 18,000(iii) Local expenditures (inc. 36 mm @ $2,000) 137,000 -(iv) Laboratory, specialized studies and investi-
gations (by contract) 97,000 194,000
Total 234,000 482.000
7. Detailed Engineering for Fourth Ports Project(i) Expatriate assistance - 3 x 10 = 30 mm x $7,500 - 225,000
(ii) Other reimbursable costs (travel, etc.) - 12,000(iii) Local expenditures 18,000 -(iv) Contract work 500,000 336,000
Total 518.000 573,000
GRAND TOTAL 1,200.000 2,300,000
April 1980
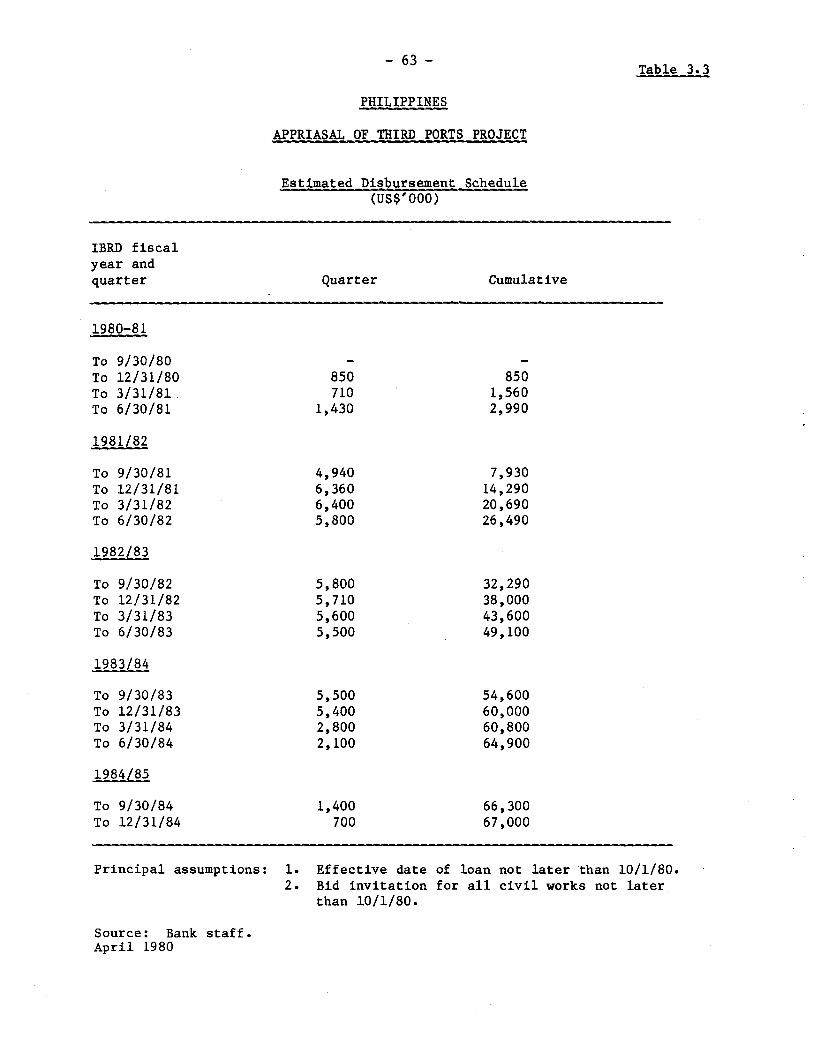
- 63 - Table 3.3
PHILIPPINES
APPRIASAL OF THIRD PORTS PROJECT
Estimated Disbursement Schedule(US $000)
IBRD fiscalyear andquarter Quarter Cumulative
1980-81
To 9/30/80To 12/31/80 850 850To 3/31/81. 710 1,560To 6/30/81 1,430 2,990
1981/82
To 9/30/81 4,940 7,930To 12/31/81 6,360 14,290To 3/31/82 6,400 20,690To 6/30/82 5,800 26,490
1982/83
To 9/30/82 5,800 32,290To 12/31/82 5,710 38,000To 3/31/83 5,600 43,600To 6/30/83 5,500 49,100
1983/84
To 9/30/83 5,500 54,600To 12/31/83 5,400 60,000To 3/31/84 2,800 60,800To 6/30/84 2,100 64,900
1984/85
To 9/30/84 1,400 66,300To 12/31/84 700 67,000
Principal assumptions: 1. Effective date of loan not later than 10/1/80.2. Bid invitation for all civil works not later
than 10/1/80.
Source: Bank staff.April 1980

- 64 - Table 4.1
PHILIPPINES
THIRD PORTS PROJECT
Cagayan Port Traffic('000 metric tons)
Actual Forecast (Calendar Years)1978 1980 1981 1982 1983 1984 1985 1986 1997 1988 1989 1990
Domestic Camao n-wardBottled cargo 21.4 21.4 22.8 24.2 25.8 27.5 29.3 31.2 33.2 35.4 37.7 40.2Fertilizers 25.1 29.1 31.7 33.6 36.1 38.8 41.7 44.9 48.2 51.8 55.7 59.9Industrial goods 9.5 10.9 11.7 12.6 13.5 14.5 15.7 16.9 18.3 19.7 21.3 23.0Other 141.1 151.0 159.9 169.2 176.2 189.8 201.0 213.0 225.8 239.3 253.7 268.9
Subtotal 197.1 212.4 225.6 239.6 254.6 270.6 287.7 305.0 325.5 346.2 368.1 342.0
Domestic Carto OutwardGrains 213.4 232.5 242.8 253.5 264.7 276.5 289.6 303-3 317.7 332.8 348.7 365.4Sugar 0.4 4.2 6.5 10.1 15.6 24.0 27.2 30.5 34.1 38.2 42.8 49.0Bottled cargo 20.6 21.0 22.3 23.8 25.4 27.0 28.8 30.7 32.& 34.9 37.2 39.7Other 93.7 104.3 110.1 116.2 122.7 129.9 136.9 144.3 152.2 160.7 169-7 179.1
Subtotal 328.1 362.0 381.7 403.6 428.4 457.4 482.5 508.8 536.8 366.6 598.4 632.2
Total Domestic Cargo 525.2 574.4 607.3 643.7 683.0 728.0 770.2 814.8 862.3 912.8 966.8 1.C24.2
Fore.in TradeImports 11.7 13.6 14.7 15.9 17.2 18.6 70.1 21.8 23.6 25.6 27.7 30.1Exports 93.1 159.8 169.8 180.6 192.2 204.8 217.1 230.3 244.3 259.4 275.5 292.6
Of which wood products 56.0 66.6 72.6 79.1 86.2 94.0 101.2 109.0 17.4 126.5 136.2 146.7
Total Foreign Trade 104.8 173.4 184.5 190.5 209.4 223.3 237.2 252.0 267.9 284.9 303.2 322.7
Total Cargo 630.0 747.8 791.8 839.7 892.4 951.3 1.007.4 1.066.8 1.130.2 1,197.7 1.270.0 1.346.9
Passengers ('000) 583 649 684 722 762 804 849 897 948 1,001 1,058 1,117
CaJro Prolections for Economic Evaluation /a('000 metric tons)
Main Berth TrafficCargo 912 967 1,026 1,089 1,157 1,230 1,306Passengers ('000) 707 752 800 851 904 961 1,020
Remaining Secondary Berth TrafficCargo 40 40 40 40 40 40 40Passengers ('000) 97 97 97 97 97 97 97
Without Prolect - Main Berth /bBreak Bulk
DomesticIn large ships 303 320 336 355 374 395 415In small ships 248 265 283 302 323 344 366
Subtotal 551 585 619 657 697 739 781
Foreign 179 178 176 174 170 167 161
Total 730 763 795 831 867 906 942
ContainerDomestic 225 240 256 272 290 310 330Foreign 45 59 75 93 114 136 161
Total 270 299 331 365 404 446 491
Total 1.000 1.062 1.126 1.196 1.271 1.352 1.433
With Proiect - Xain Berth /bBreak Bulk
DomesticIn large ships 303 320 336 355 374 395 415In small ships 248 265 283 302 323 344 366
Subtotal 551 585 619 657 697 739 781
Foreign 179 178 176 174 170 167 161
Total 730 763 795 831 867 906 942
ContainerDomestic 225 240 256 272 290 310 330Foreign 45 59 75 93 114 136 161
Total 270 299 331 365 404 446 491
Total 1.000 1,062 1.126 1,196 1.271 1.352 1.433
/a Totals may not add due to rounding./b For capacity analysis, passenger projections for main berth have been converted to cargo traffic vith 8 oassengers - 1 ton.
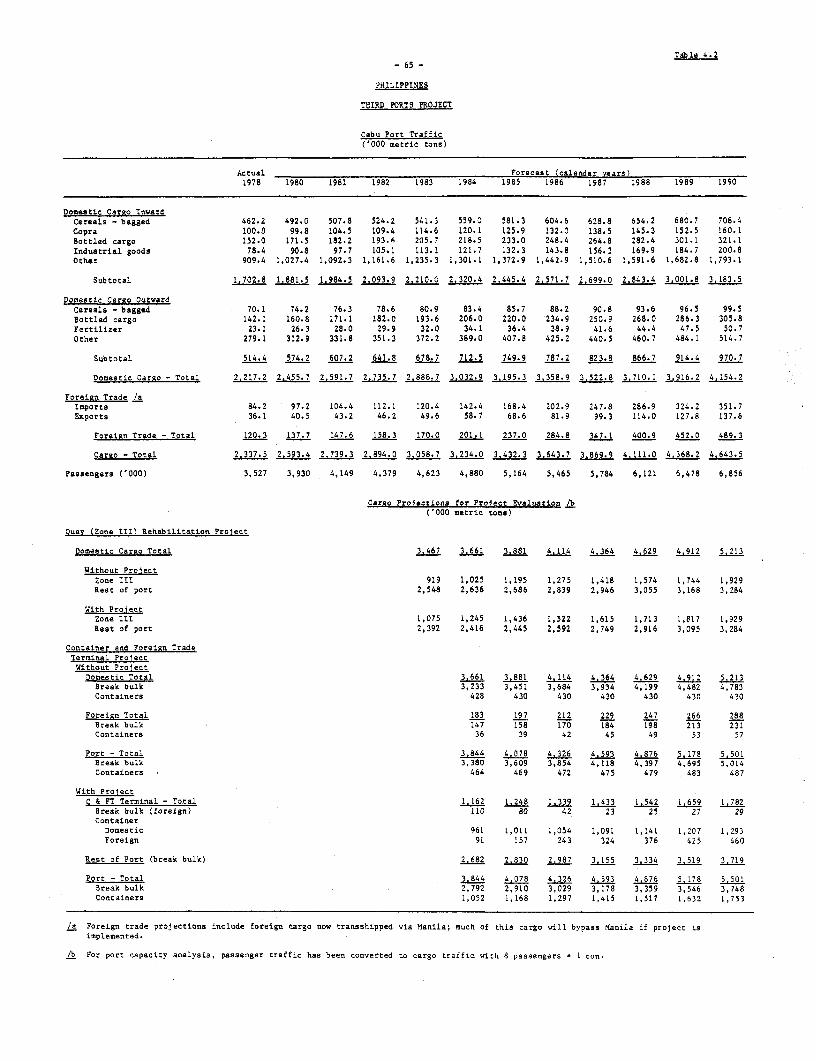
Table 4.2- 65 -
PHILIPPINES
THIRD PORTS PROJECT
Cebu Port Traffic('000 metric tons)
Actual Forecast (calendar years)1978 1980 1981 1982 1983 1984 1985 1986 1987 1988 1989 1990
Domestic Cargo InwardCereals - bagged 462.2 492.0 507.8 524.2 541.3 559.0 581.3 604.6 628.8 654.2 680.7 708.4Copra 100.8 99.8 104.5 109.4 114.6 120.1 125.9 132.0 138.5 145.3 152.5 160.1Bottled cargo 152.0 171.5 182.2 193.6 205.7 218.5 233.0 248.4 264.8 282.4 301.1 321.1Industrial goods 78.4 90.8 97.7 105.1 113.1 121.7 132.3 143.8 156.3 169.9 184.7 200.8Other 909.4 1,027.4 1,092.3 1,161.6 1,235.3 1,301.1 1,372.9 1,442.9 1,510.6 1,591.6 1,682.8 1,793.1
Subtotal 1.702.8 1J881.5 1.984.5 2.093.9 2,210.0 2.320.4 2.445.4 2.571.7 2,699.0 2.843.4 3.001.8 3,183.5
Dom,estic Careo OutwardCereals - bagged 70.1 74.2 76.3 78.6 80.9 83.4 85.7 88.2 90.8 93.6 96.5 99.5Bottled cargo 142.1 160.8 171.1 182.0 193.6 206.0 220.0 234.9 250.9 268.0 286.3 305.8Fertilizer 23.1 26.3 28.0 29.9 32.0 34.1 36.4 38.9 41.6 44.4 47.5 50.7Other 279.1 312.9 331.8 351.3 372.2 389.0 407.8 425.2 440.5 460.7 484.1 514.7
Subtotal 514.4 574.2 607.2 641.8 678.7 712.5 749.9 787.2 823.8 866.7 914.4 970.7
Domestic Cargo - Total 2,217.2 2.455.7 2.591.7 32.75.7 2.888.7 3.032.9 3.195.3 3.358.9 3.52Z.8 3.710.1 3,916.2 4,154.2
Foreign Trade /aImports 84.2 97.2 104.4 112.1 120.4 142.4 168.4 202.9 247.8 286.9 324.2 351.7Exports 36.1 40.5 43.2 46.2 49.6 58.7 68.6 81.9 99.3 114.0 127.8 137.6
Foreign Trade - Total 120.3 137.7 147.6 158.3 170.0 201.1 237.0 284.8 347.1 400.9 452.0 489.3
Cargo - Total 2.337.5 2.593.4 2.739.3 2.894.0 3,058.7 3,234.0 3.432.3 3,643.7 3,869.9 4,111.0 4.368.2 4.663.5
Passengers ('000) 3,527 3,930 4,149 4,379 4,623 4,880 5,164 5,465 5,784 6,121 6,478 6,856
Cargo Projections for Project Evaluation /b('000 metric tons)
Quay (Zone III) Rehabilitation Project
Domestic Cargo Total 3.467 3.661 3.881 4.114 4,364 4.629 4,912 5,213
Without ProjectZone III 919 1,025 1,195 1,275 1,418 1,574 1,744 1,929Rest of port 2,548 2,636 2,686 2,839 2,946 3,055 3,168 3,284
With Pro1ectZone III 1,075 1,245 1,436 1,522 1,615 1,713 1,817 1,929Rest of port 2,392 2,416 2,445 2,592 2,749 2,916 3,095 3,284
Container and Forei&n TradeTerminal ProjectWithout Prolect
Domestic Total 3.661 3.881 4.114 4.364 4.629 4,912 5.213Break bulk 3,233 3,451 3,684 3,934 4,199 4,482 4,783Containers 428 430 430 430 430 430 430
Foreign Total 183 197 212 229 247 266 288Break bulk 147 158 170 184 198 213 231Containers 36 39 42 45 49 53 57
Port - Total 3.844 4.078 4.326 4.593 4.876 5.178 5.501Break bulk 3,380 3,609 3,854 4,118 4,397 4,695 5,014Containers 464 469 472 475 479 483 487
With ProlectC & FT Terminal - Total 1.162 1.248 1.339 1.433 1.542 1.659 1,782
Break bulk (foreign) 110 80 42 23 25 27 29Container
Domestic 961 1,011 1,054 1,091 1,141 1,207 1,293Foreign 91 157 243 324 376 425 460
Rest of Port (break bulk) 2.682 2.830 2,987 3,155 3.334 3.519 3.719
Port - Total 3,844 4.078 4,326 4,593 4,876 5,178 5,501Break bulk 2,792 2,910 3,029 3,178 3,359 3,546 3.748Containers 1,052 1,168 1,297 1,415 1,517 1,632 1,753
/a Foreign trade projections include foreign cargo now transshipped via ltanila; much of this cargo will bypass Manila if project isimplemented.
/b For port capacity analysis, passenger traffic has been converted to cargo traffic with 8 passengers - I ton.
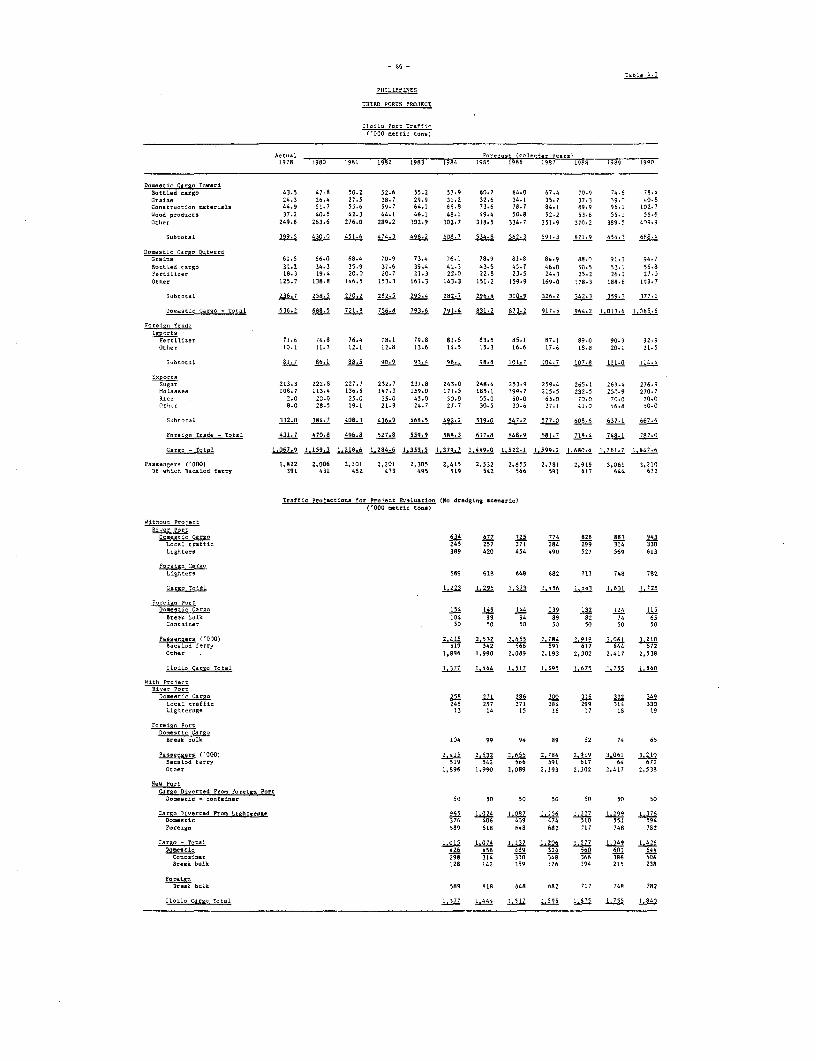
- 66 -
Table 4. 3
P.IL.PPINES
-HIRD PORTS PROJECT
Iloilo Port TraffIc7t000 octrlc tone)
Actual _ Forecast (calen.dar roers)1978 1980 1981 1982 1983 1984 19S5 6986 1987 1988 1989 1990
Doetenic Cargo Tc-ardBottled cacao 43.3 47.8 50.2 52.6 55.2 57.8 60.7 64.0 67.4 70.9 74.6 78.4Oraire 24.3 26.4 27.5 28.7 28.9 31.2 32.6 34.! 35.7 37.3 39.n .0.8Conseruction r t-rials 44.9 56.7 53.6 99.7 64.1 88.8 73.6 78.7 84.1 89.9 96.1 106.7Wood products 37.2 40.5 42.3 44.L 46.1 48.1 49.4 50.8 52.2 53.6 33.1 59.6Other 248.6 263.6 276.9 289.2 33.9 302.7 318.5 334.7 351.9 376.2 389.9 408.9
Subtotal 399.3 430.0 451.6 474.3 498.2 508.7 534.8 562.3 591.3 621.9 654.3 699.'
Iltoncto Cargo OutwardCra:ns 61.5 66.0 68.4 70.9 73.4 76.1 78.9 8.5 849 98.7 91.3 94.79o-tLed c-cSo 31.3 34.3 3559 37.6 39.4 41.3 43.5 41.7 48.0 59.9 53.1 55.9F-rtlioIr 18.3 19.4 20.0 20.7 21.5 22.6 22.8 23.3 24.3 25.2 26.1 27.0Other 125.7 138.8 146.5 153.3 161.3 143.3 251.3 158.9 169.0 178.5 188.8 198.7
Subtotal 236.7 258.5 270.2 282.5 295.4 282.7 296.4 310.8 326.2 342.5 359.3 377.2
Dooe-tio Car-o - r I 636.2 688.5 721.8 756.8 793.6 791.4 831.2 873.2 917.5 984.2 L.013.6 1.n65.6
o-ro-tn Tradcbr or a
FOrrLLtier 71.6 74.9 76.4 78.1 79.8 81.6 83.5 95.1 87.1 89.0 99.9 92.9other 10.1 11.3 12.1 12.8 13.6 14.5 15.3 16.6 67.6 18.8 920. 21.5
Subtota1 81.7 86.1 88.5 90.9 9354 96.1 98.8 101.7 604.7 107.8 111.0 114.4
CororcoSugar 213.3 232.8 227.7 232.7 237.8 243.0 248.4 253.9 259.4 265.L 269.4 276.9to Iaoseo 108.7 113.4 136.5 147.3 158.5 171.9 685.1 198.7 213.5 233.5 233.8 275.7
Rice 7.0 23.0 73.0 39.6 43.0 59.0 55.0 60.0 65.6 70.9 76.5 70.0ornerc 8.0 28.5 18.1 21.9 24.7 27.7 39.5 33.6 37.1 41.0 46.8 53.0
Subt-tal 333.6 384.7 408.3 436.9 466.5 492.2 519.0 547.2 577.0 608.6 637.1 667.6
Forelat Trade - Total 431.7 470.8 496.8 527.8 5598. 588.3 617.8 648.9 681.7 716.4 748.1 782.0
CacaR - Total 1.067.9 1159.3 1.218.6 1.284.6 1.353.5 L.379.7 1.449.0 1.522.1 1.599.2 1.680.4 1,761.7 1.847.6
-usoogero ('0006 1.822 2,006 2.101 2,201 2,305 2,415 2.532 2,655 2,78L 26919 3.061 3,210hf u .ic .. 1a.ld f-rty 39L 431 452 473 495 818 542 966 581 617 644 672
Traffic Praaortooa for r Prec alotien 6No dredgitg .... eriol1,005 cetric torga)
Withoon ProSertRiver PortDo.ea.lo Car-o 634 677 023 774 826 883 943
L.caI traffic 245 257 271 284 299 314 330LIhtoe 389 420 454 490 927 569 613
Forat.. CarRoLighter- 589 616 648 682 717 748 782
Cargo tral 1L223 1,285 1.373 1.456 1.543 1.631 1.725
Ft rueti FortDoes.oic Cr 654 148 144 139 132 124 115
Break bulb 104 99 94 89 82 74 65Cootauner 50 50 50 50 50 50 50
Puso.ge.r ('000) 2.415 2.532 2565 2.4 3.9L9 3.06L 3 210Bacolud ferry 518 542 91 617 4 672Orhrr 1,896 1,990 2.089 2,193 2,302 2,417 2,538
lo.ilo 5r- T-1a L 377 1.444i L.517 1L595 I P7 1,755 L.840
w01h Fro-octRiv-r PortDmeertoC Carr- 258 271 286 300 316 332 349
Local traffIc 245 257 271 284 299 314 330Llgbreroge 13 14 15 66 17 68 19
For-ton PortDomeg rtt Ca rRo
Break balk I14 99 94 89 82 74 65
PaoeenaaRa ('6001) 2j1 2,533 1.695 2.784 2.96 3.061 3.210tacaiod far00 519 542 566 691 617 64 672Other 1.896 1,980 2,089 2,193 2,302 2.417 2,538
Yev PortCarae Diverted Froc Poreteoc Porr
Doeeesti - ueoeasior 50 50 50 50 50 50 50
aroLo ivrd Fre i Leaht-. 965 1.024 1.087 61 127 1.298 1_37Do. lo376 466 438 474 310 851 584
Forei.g 598 6L8 648 682 717 748 782
Careo - Total 1.019 1.074 1.137 1.206 1277 1.349 1.426Dorlic 426 456 488 524 60 601 644
Cootaloer 298 314 330 348 366 386 406Break balk 128 642 659 176 194 215 238
F-i3reak bulk 589 618 648 682 767 748 782
Iloilo Cargo Total 1377 1.444 1.517 1.995 1_675 1.755 6.840
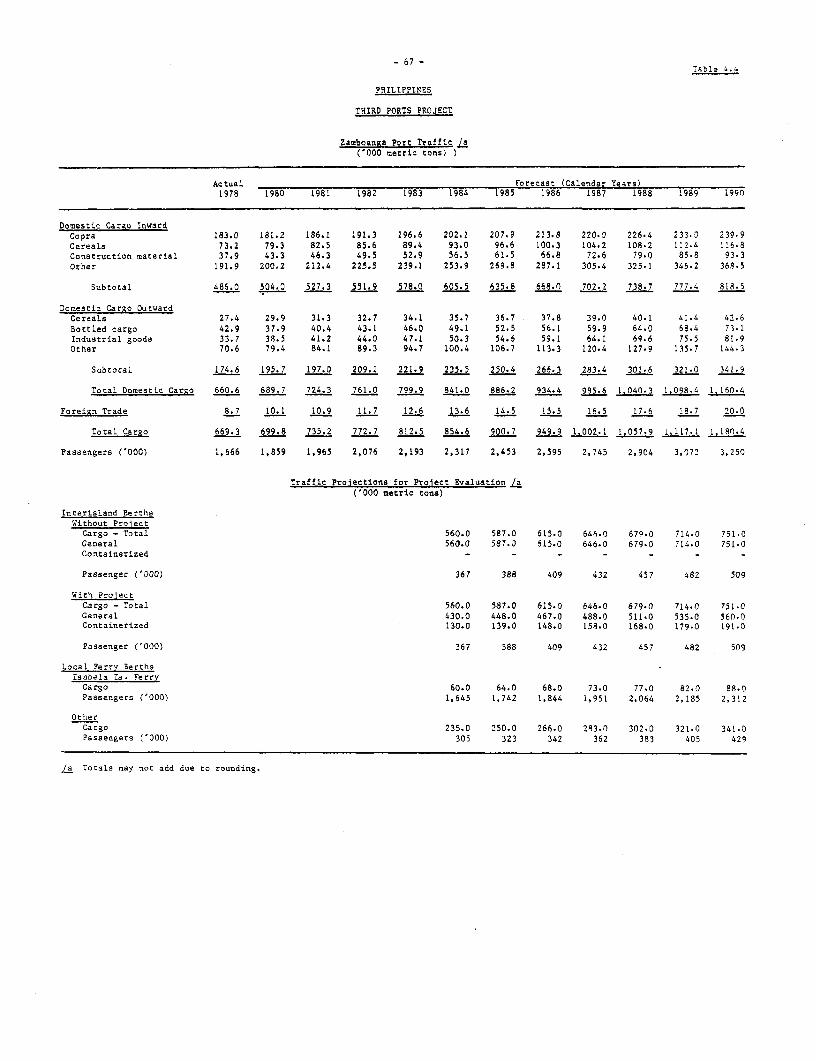
- 67 -Table 4.4
PHILlPPTNES
THIRD PORTS PROJECT
Zamboanza Port Traffic /a('000 metric tons) )
Actual Forecast (Calendar Years)1978 1980 198L 1982 1983 1984 1985 1986 1987 1988 1989 1990
Domestic Cargo InwardCopra .83.0 181.2 186.1 191.3 196.6 202.1 207.9 213.8 220.0 226.4 233.3 239.9Cereals 73.2 79.3 82.5 85.6 89.4 93.0 96.6 100.3 104.2 108.2 112.4 116.8Construction material 37.9 43.3 46.3 49.5 52.9 56.5 61.5 66.8 72.6 79.0 85.8 93.3Other 191.9 200.2 212.4 225.5 239.1 253.9 269.8 287.1 305.4 325.1 346.2 368.5
Subtotal 486.0 504.0 527.3 551.9 578.0 605.5 635.8 668.0 702.2 738.7 777.4 818.5
Domestic Cargo OutwardCereals 27.4 29.9 31.3 32.7 34.1 35.7 36.7 37.8 39.0 40.1 41.4 42.6Bottled cargo 42.9 37.9 40.4 43.1 46.0 49.1 52.5 56.1 59.9 64.0 68.4 73.1Industrial goods 33.7 38.5 41.2 44.0 47.1 50.3 54.6 59.1 64.1 69.6 75.5 81.9Other 70.6 79.4 84.1 89.3 94.7 100.4 106.7 113.3 120.4 127.9 135.7 144.3
Subrotacl 174.6 195.7 197.0 209.1 221.9 235.5 250.4 266.3 283.4 301.6 321.0 341.9
Total Domestic Cargo 660.6 689.7 724.3 761.0 799.9 841.0 886.2 934.4 985.6 1.040.3 1.098.4 1.160.4
Foreign Trade 8.7 10.1 10.9 11.7 12.6 13.6 14.5 15.5 16.5 17.6 18.7 20.0
Total Cargo 669.3 699.8 735.2 772.7 812.5 854.6 900.7 949.9 1.002.1 1.057.9 1.117.1 1,180.4
Passengers ('000) 1,666 1,859 1,965 2,076 2,193 2,317 2,453 2,595 2,745 2,904 3,072 3,250
Traffic Prolections for Project Evaluation /a('000 metric tons)
Interisland BerthsWithout ProjectCargo - Total 560.0 587.0 615.0 646.0 679.0 714.0 751.0General 560.0 587.0 615.0 646.0 679-0 714.0 751.0Containerized - -
Passenger ('000) 367 388 409 432 457 482 509
With ProiectCargo - Total 560.0 587.0 615.0 646.0 679.0 714.0 751-0General 430.0 448.0 467.0 488.0 511-0 535.0 560.0Containerized 130.0 139.0 148.0 158.0 168.0 179.0 191.0
Passenger ('000) 367 388 409 432 457 482 509
Local Ferry BerthsIsabela Ts. Ferry
Cargo 60.0 64.0 68.0 73.0 77.0 82.0 88.0Passengers ('000) 1,645 1,742 1,844 1,951 2,064 2,185 2,312
OtherCargo 235.0 250.0 266.0 283.0 302.0 321.0 341.0Passengers ('000) 305 323 342 362 383 405 429
/a Totals may not add due to rounding.
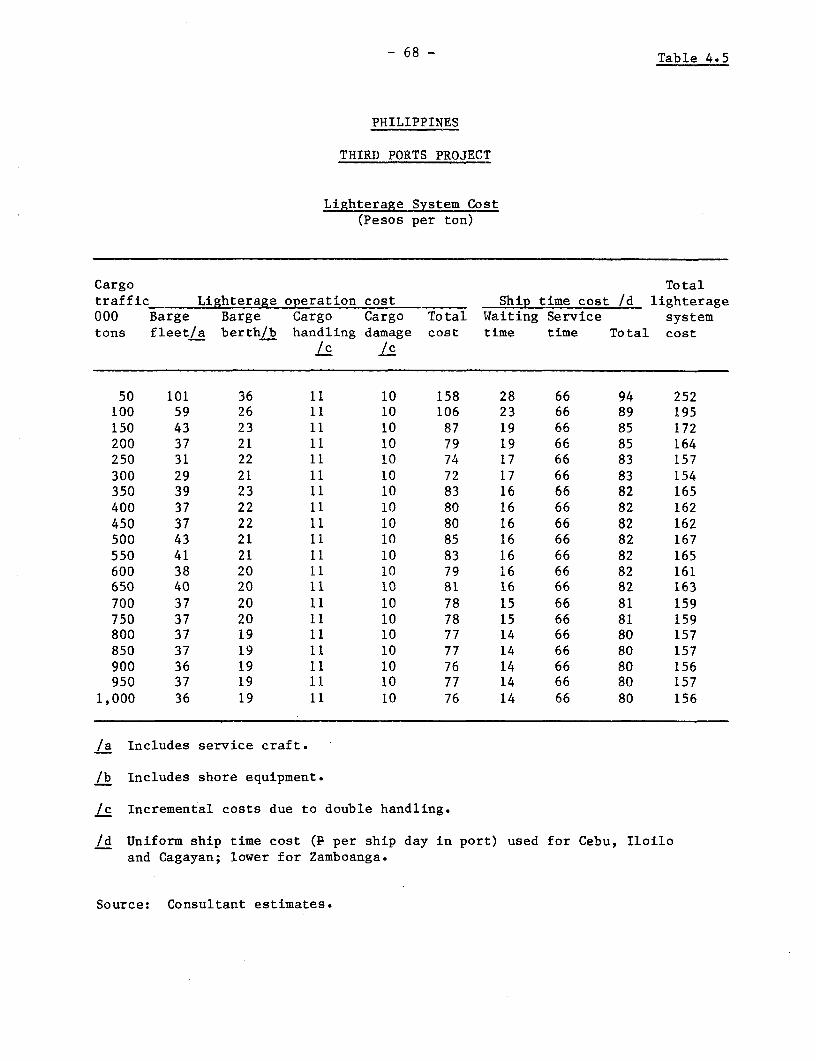
-68 - Table 4.5
PHILIPPINES
THIRD PORTS PROJECT
Lighterage System Cost(Pesos per ton)
Cargo Totaltraffic Lighterage operation cost Ship time cost /d lighterage000 Barge Barge Cargo Cargo Total Waiting Service systemtons fleet/a berth/b handling damage cost time time Total cost
/c /c
50 101 36 11 10 158 28 66 94 252100 59 26 11 10 106 23 66 89 195150 43 23 11 10 87 19 66 85 172200 37 21 11 10 79 19 66 85 164250 31 22 11 10 74 17 66 83 157300 29 21 11 10 72 17 66 83 154350 39 23 11 10 83 16 66 82 165400 37 22 11 10 80 16 66 82 162450 37 22 11 10 80 16 66 82 162500 43 21 11 10 85 16 66 82 167550 41 21 11 10 83 16 66 82 165600 38 20 11 10 79 16 66 82 161650 40 20 11 10 81 16 66 82 163700 37 20 11 10 78 15 66 81 159750 37 20 11 10 78 15 66 81 159800 37 19 11 10 77 14 66 80 157850 37 19 11 10 77 14 66 80 157900 36 19 11 10 76 14 66 80 156950 37 19 11 10 77 14 66 80 157
1,000 36 19 11 10 76 14 66 80 156
/a Includes service craft.
/b Includes shore equipment.
/c Incremental costs due to double handling.
/d Uniform ship time cost (P per ship day in port) used for Cebu, Iloiloand Cagayan; lower for Zamboanga.
Source: Consultant estimates.
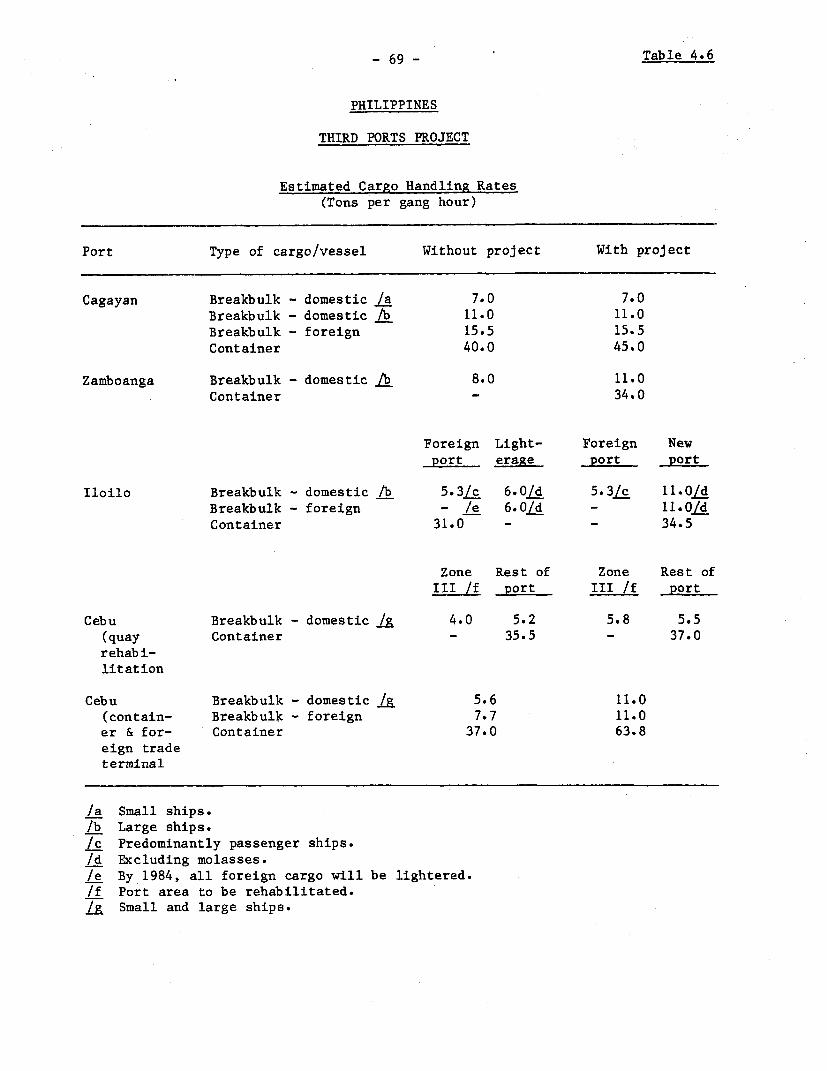
- 69 - Table 4.6
PHILIPPINES
THIRD PORTS PROJECT
Estimated Cargo Handling Rates(Tons per gang hour)
Port Type of cargo/vessel Without project With project
Cagayan Breakbulk - domestic /a 7.0 7.0Breakbulk - domestic lb 11.0 11.0Breakbulk - foreign 15.5 15.5Container 40.0 45.0
Zamboanga Breakbulk - domestic lb 8.0 11.0Container - 34.0
Foreign Light- Foreign Newport erage port port
Iloilo Breakbulk - domestic /b 5.3/c 6.01L 5.3/c 11.0/dBreakbulk - foreign - /e 6.0/d -11.0/d
Container 31.0 - - 34.5
Zone Rest of Zone Rest ofIII /f port III /f port
Cebu Breakbulk - domestic /A 4.0 5.2 5.8 5.5(quay Container - 35.5 - 37.0rehabi-litation
Cebu Breakbulk - domestic /R 5.6 11.0(contain- Breakbulk - foreign 7.7 11.0er & for- Container 37.0 63.8eign tradeterminal
/a Small ships.lb Large ships./c Predominantly passenger ships./d Excluding molasses./e By 1984, all foreign cargo will be lightered.If Port area to be rehabilitated./R Small and large ships.
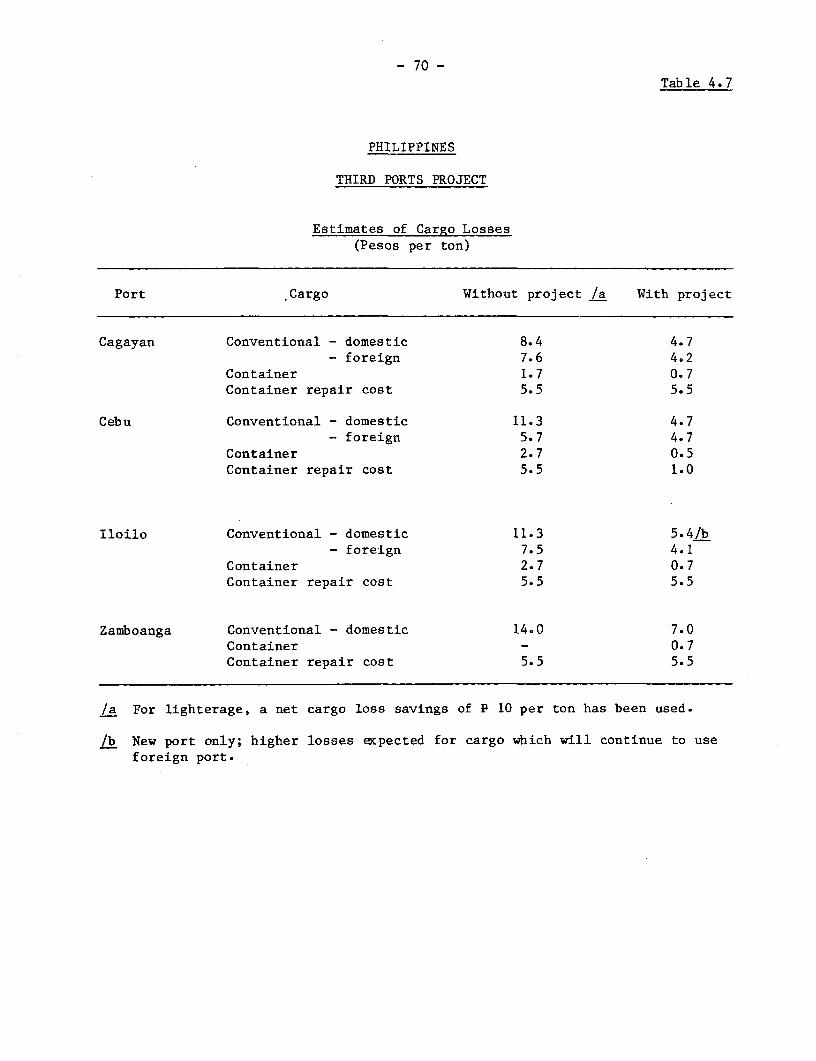
- 70 -Table 4.7
PHILIPPINES
THIRD PORTS PROJECT
Estimates of Cargo Losses(Pesos per ton)
Port Cargo Without project /a With project
Cagayan Conventional - domestic 8.4 4.7- foreign 7.6 4.2
Container 1.7 0.7Container repair cost 5.5 5.5
Cebu Conventional - domestic 11.3 4.7- foreign 5.7 4.7
Container 2.7 0.5Container repair cost 5.5 1.0
Iloilo Conventional - domestic 11.3 5.4/b- foreign 7.5 4.1
Container 2.7 0.7Container repair cost 5.5 5.5
Zamboanga Conventional - domestic 14.0 7.0Container - 0.7Container repair cost 5.5 5.5
/a For lighterage, a net cargo loss savings of P 10 per ton has been used.
/b New port only; higher losses expected for cargo which will continue to useforeign port.
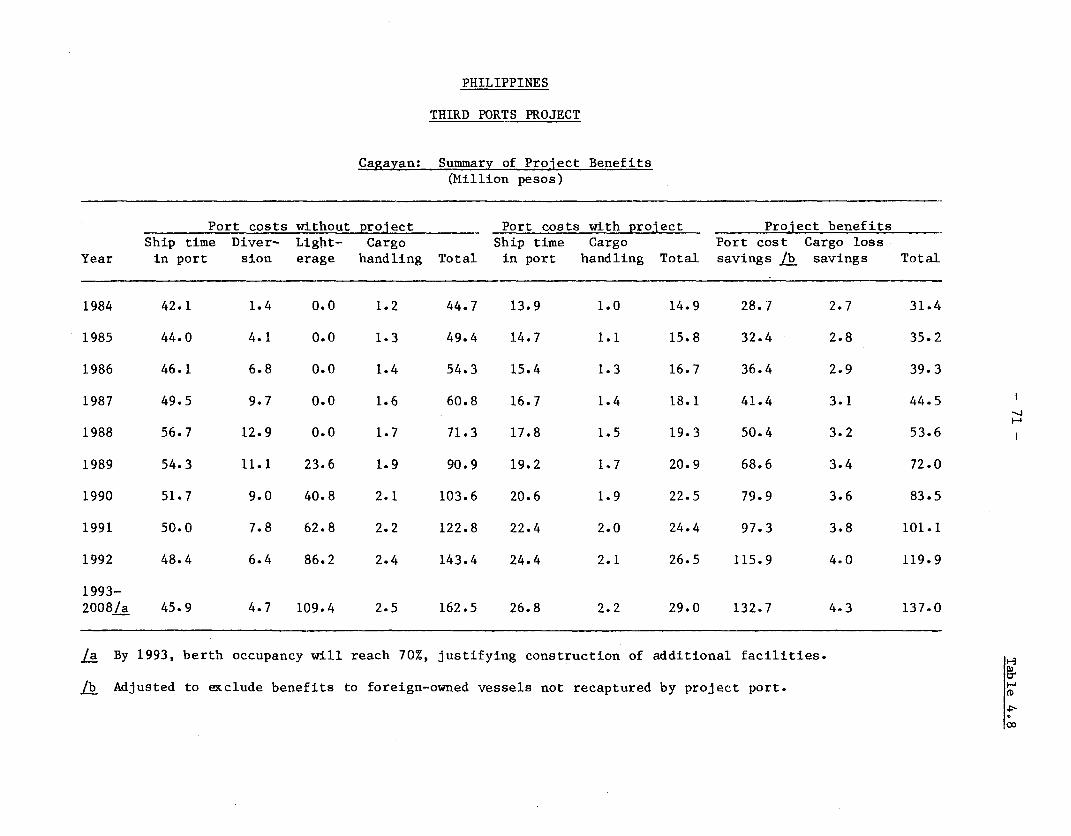
PHILIPPINES
THIRD PORTS PROJECT
Cagayan: Summary of Project Benefits
(Million pesos)
Port costs without project Port costs with project Project benefits
Ship time Diver- Light- Cargo Ship time Cargo Port cost Cargo loss
Year in port sion erage handling Total in port handling Total savings /b savings Total
1984 42.1 1.4 0.0 1.2 44.7 13.9 1.0 14.9 28.7 2.7 31.4
1985 44.0 4.1 0.0 1.3 49.4 14.7 1.1 15.8 32.4 2.8 35.2
1986 46.1 6.8 0.0 1.4 54.3 15.4 1.3 16.7 36.4 2.9 39.3
1987 49.5 9.7 0.0 1.6 60.8 16.7 1.4 18.1 41.4 3.1 44.5
1988 56.7 12.9 0.0 1.7 71.3 17.8 1.5 19.3 50.4 3.2 53.6
1989 54.3 11.1 23.6 1.9 90.9 19.2 1.7 20.9 68.6 3.4 72.0
1990 51.7 9.0 40.8 2.1 103.6 20.6 1.9 22.5 79.9 3.6 83.5
1991 50.0 7.8 62.8 2.2 122.8 22.4 2.0 24.4 97.3 3.8 101.1
1992 48.4 6.4 86.2 2.4 143.4 24.4 2.1 26.5 115.9 4.0 119.9
1993-2008/a 45.9 4.7 109.4 2.5 162.5 26.8 2.2 29.0 132.7 4.3 137.0
/a By 1993, berth occupancy will reach 70%, justifying construction of additional facilities.
/b Adjusted to exclude benefits to foreign-owned vessels not recaptured by project port. S
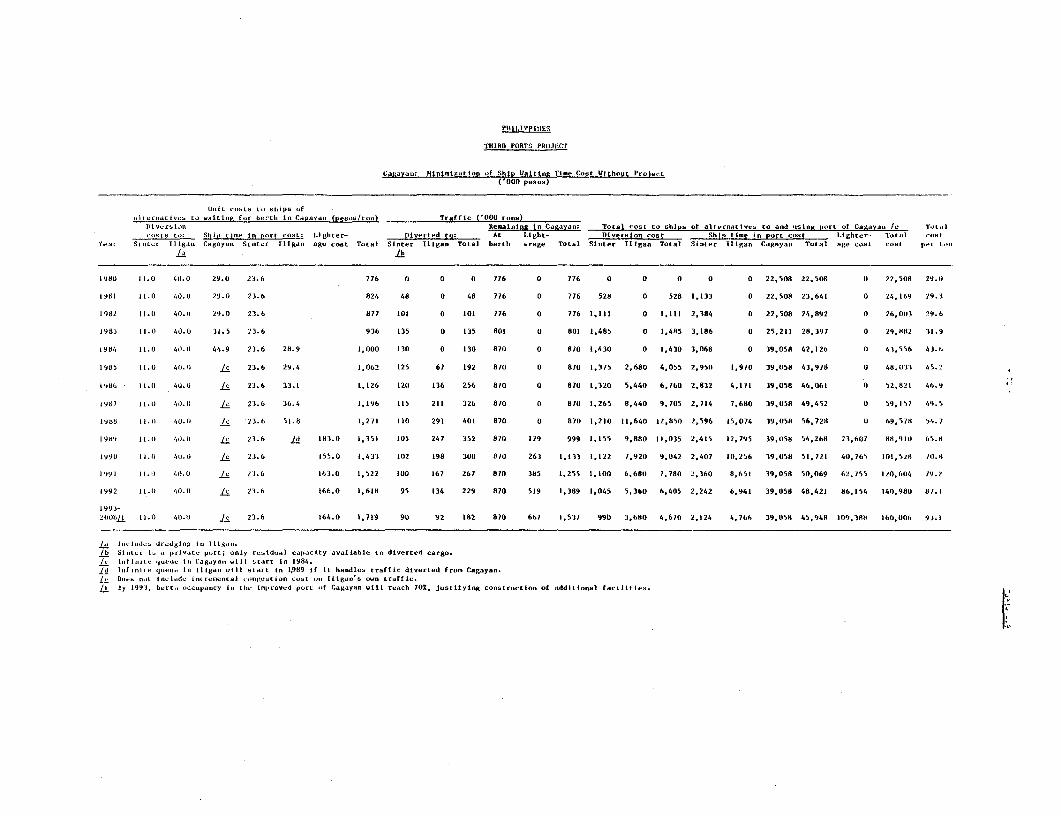
PHI1.IVPIIIES
THIRD PORTS PRO IeCT
Cagyvan: i,ithimzatios of Ship tlaittiF Time Cost Uitho.t Prolect('000 pesos)
UiL costs t0 ships ofaI icrCCiCttvcs to waiti.g for berth. in Cagayan (peso.tosn) Trafftc ('000 ton.)
Divorsilol Re-aInKit in Cagavan: Total cost tIC ships of alternallves to and f-rn # lpr 'If Caic:ya.1 le r.otl-OS tts : Ship ti,- in port COsL: Lighter- Dlverted to: At Light- Diversion cost ShIp time in port cost lighter- Total Cost
Y-or Sintcr lligan Cag.ya- Sint.r lliga- age coat Total Sinter iligan Total berth erage Total SI.ler lligan Total Stnter lligan CHgayan Total age cost colt per t-,
1980 11.0 4(0.0 29.0 23.6 776 0 0 0 776 0 776 0 0 0 0 0 22,508 22.508 0 22,508 29.0
1981 11.0 40.0 29.0 23.6 824 46 0 48 776 0 776 528 0 528 1,133 0 22.5038 23,641 0 24.169 29.3
1982 1i.0 40.1 29.0 23.6 877 101 0 101 776 0 776 1,11t 0 1.111 2,384 0 22,508 24.892 (I 26,0033 29.6
1983 11.0 40.0 31.5 23.6 936 135 0 135 801 0 801 1,485 0 1,4R5 3,186 0 25,211 28,3)7 0 29,882 31.9
1984 11.0 40). 0 44.9 23.6 28.9 1.000 130 0 130 870 0 870 1,430 0 1.430 3,068 0 39,058 42,126 0 41.556 43. t
1985 11.0 40.1) / 23.6 29.4 1,062 125 67 192 870 0 870 1,375 2,680 4.055 2,950 1,970 39,058 43,978 0 48.(133 45.2
19861 1t.0 4(1.11 O 23.6 33.1 L.tZ6 120 136 256 870 0 870 1,320 5,440 6.760 2,832 4,171 19.058 46.061 0 52.821 46.9
1987 11.0 40.1 ° 23.6 36.4 1.196 115 211 326 870 0 870 1,265 8,440 9.705 2,714 7,680 39,058 49.452 0 59,157 49.5
198 11.( 40.0 /c 23.6 51.8 1,271 110 291 401 870 0 870 1,210 11,640 12.850 2,596 15,074 39,058 56,728 0 69,578 54.7
199 11.0 40. i Ls 23.6 /d 183.0 1.351 105 247 352 870 129 999 1,155 9,880 11,035 2.415 12.795 39.3)58 54,268 23,607 88,9101 1,5.11
1990 11.(1 41.11 /c 23.6 155.0 1,433 102 198 301) 870 263 1.133 1,122 7.920 9,042 2,407 10.256 39.058 51,721 40,765 101,5Z8 /11.8
1991 11.0 4(1.() .L: 23.6 163.0 1,522 100 167 267 870 385 1,255 1,100 6.680 7,780 !,360 8,651 39,058 50.069 62.755 120,6014 79.Z
1992 11.0 40.(1 / 23.6 166.0 1,618 95 134 229 870 519 1,389 1,045 5.360 6,405 2.242 6.941 39,058 48,421 86,154 140,980 81.1
1993-l1)08Lj 11.0 40.0 ' 23.6 164.0 1,719 90 92 182 870 667 1,537 990 3,680 4,670 2,124 4,766 39,058 45,948 109,388t I 60,0)h 9J.I
/d ISCIOCIcs d-.dglog ill Iligon.
/b iotcr in o 1rAn-Le purti only r-sidoal capacity available to diverted cargo./A Inff,i eCICCOOc ICC Cag.yan will start in 1984./ Iofiol,e q--c I, MgIllgaC CCt1 tart In 1,989 if it handles traffic diverted from C.gayan.L, Does (Co
11 iCId. I-CIOoental CoOog±sIioI C CCt I llgan's o*I trolflic.
/I 8y 1993, bert, s1ccCCpO,-cy Iil t1hC c 11rov.d port of Cagayan will roach 701, JostLfying con.tr-,ctton of additIonal facIItIes.
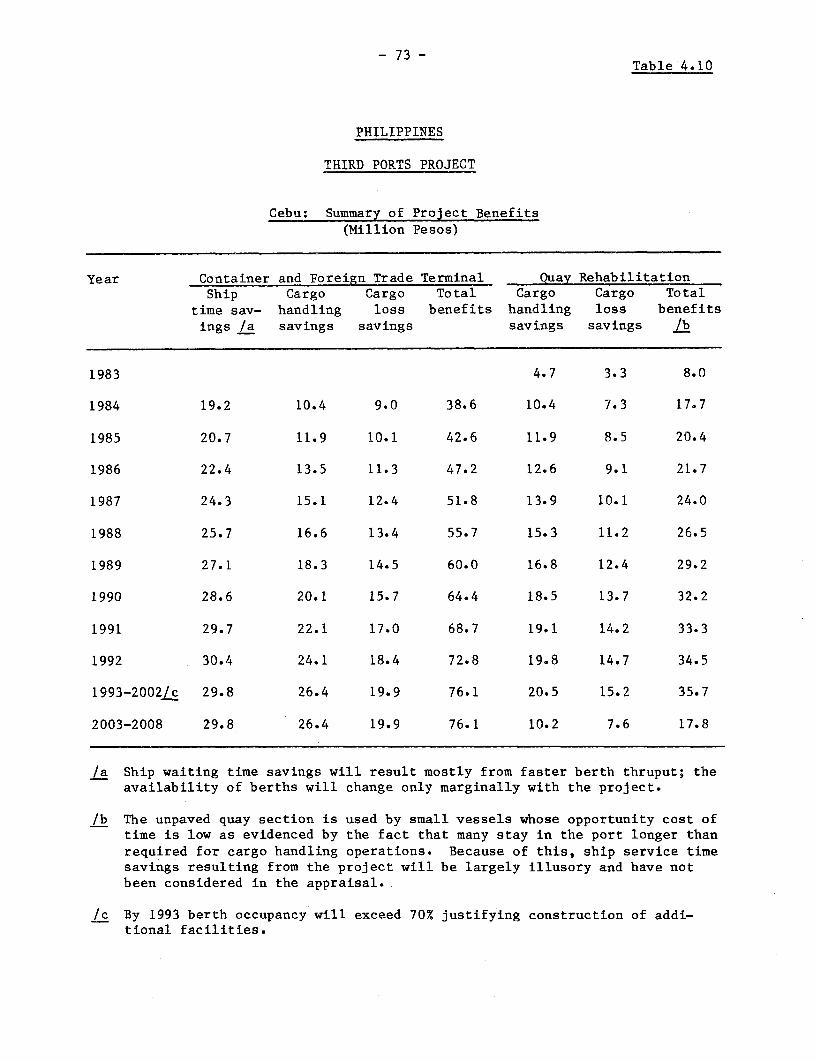
- 73 -Table 4.10
PHILIPPINES
THIRD PORTS PROJECT
Cebu: Summary of Project Benefits
(Million Pesos)
Year Container and Foreign Trade Terminal Quay RehabilitationShip Cargo Cargo Total Cargo Cargo Total
time sav- handling loss benefits handling loss benefitsings /a savings savings savings savings /b
1983 4.7 3.3 8.0
1984 19.2 10.4 9.0 38.6 10.4 7.3 17.7
1985 20.7 11.9 10.1 42.6 11.9 8.5 20.4
1986 22.4 13.5 11.3 47.2 12.6 9.1 21.7
1987 24.3 15.1 12.4 51.8 13.9 10.1 24.0
1988 25.7 16.6 13.4 55.7 15.3 11.2 26.5
1989 27.1 18.3 14.5 60.0 16.8 12.4 29.2
1990 28.6 20.1 15.7 64.4 18.5 13.7 32.2
1991 29.7 22.1 17.0 68.7 19.1 14.2 33.3
1992 30.4 24.1 18.4 72.8 19.8 14.7 34.5
1993-2002/c 29.8 26.4 19.9 76.1 20.5 15.2 35.7
2003-2008 29.8 26.4 19.9 76.1 10.2 7.6 17.8
/a Ship waiting time savings will result mostly from faster berth thruput; theavailability of berths will change only marginally with the project.
/b The unpaved quay section is used by small vessels whose opportunity cost oftime is low as evidenced by the fact that many stay in the port longer thanrequired for cargo handling operations. Because of this, ship service timesavings resulting from the project will be largely illusory and have notbeen considered in the appraisal.
tc By 1993 berth occupancy will exceed 70% justifying construction of addi-tional facilities.
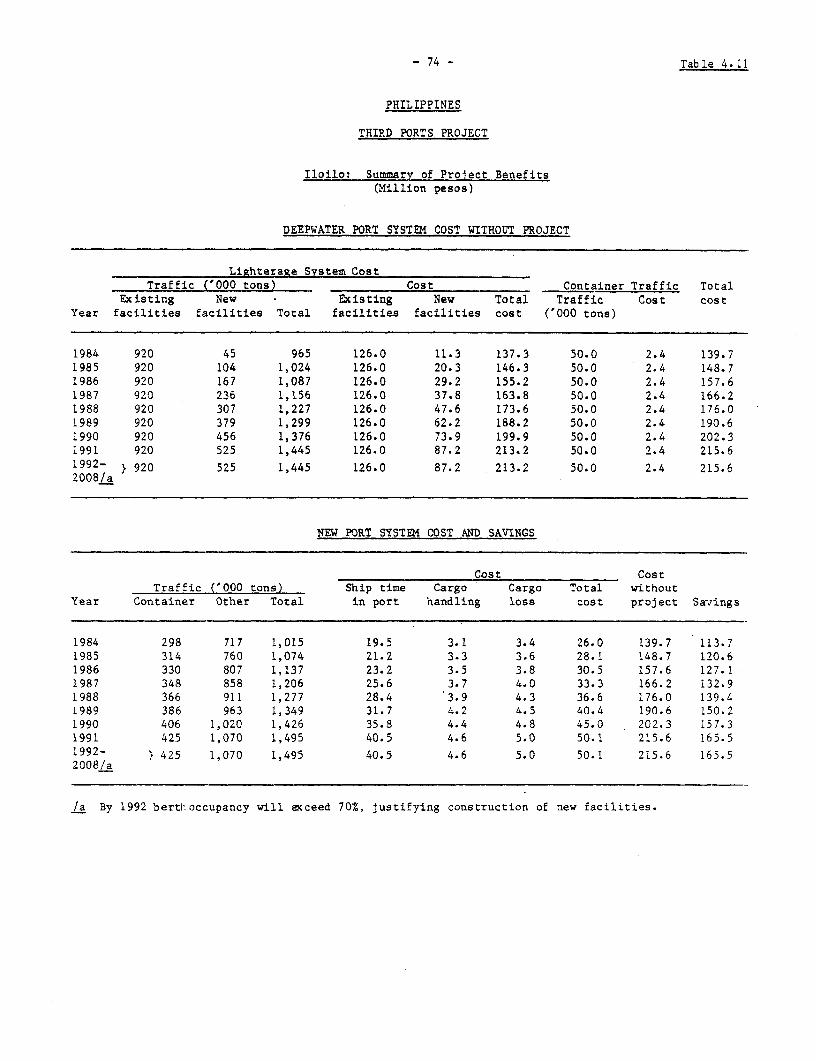
- 74 - Table 4.11
PHILIPPINES
THIRD PORTS PROJECT
Iloilo: Sumnary of Prolect Benefits(Million pesos)
DEEPWATER PORT SYSTEM COST WITHOUT PROJECT
Lighterage System CostTraffic ('000 tons) Cost Container Traffic Total
Existing New Existing New Total Traffic Cost costYear facilities facilities Total facilities facilities cost ('000 tons)
1984 920 45 965 126.0 11.3 137.3 50.0 2.4 139.71985 920 104 1,024 126.0 20.3 146.3 50.0 2.4 148.71986 920 167 1,087 126.0 29.2 155.2 50.0 2.4 157.61987 920 236 1,156 126.0 37.8 163.8 50.0 2.4 166.21988 920 307 1,227 126.0 47.6 173.6 50.0 2.4 176.01989 920 379 1,299 126.0 62.2 188.2 50.0 2.4 190.61990 920 456 1,376 126.0 73.9 199.9 50.0 2.4 202.31991 920 525 1,445 126.0 87.2 213.2 50.0 2.4 215.61992- } 920 525 1,445 126.0 87.2 213.2 50.0 2.4 215.62008/a
NEW PORT SYSTEM COST AND SAVINGS
Cost CostTraffic ('COO tons) Ship time Cargo Cargo Total without
Year Container Other Total in port handling loss cost project Savings
1984 298 717 1,015 19.5 3.1 3.4 26.0 139.7 113.71985 314 760 1,074 21.2 3.3 3.6 28.1 148.7 120.61986 330 807 1,137 23.2 3.5 3.8 30.5 157.6 127.11987 348 858 1,206 25.6 3.7 4.0 33.3 166.2 132.91988 366 911 1,277 28.4 3.9 4.3 36.6 176.0 139.41989 386 963 1,349 31.7 4.2 4.5 40.4 190.6 150.21990 406 1,020 1,426 35.8 4.4 4.8 45.0 202.3 157.31991 425 1,070 1,495 40.5 4.6 5.0 50.1 215.6 165.51992- } 425 1,070 1,495 40.5 4.6 5.0 50.1 215.6 165.52008/a
/a By 1992 bertl occupancy will exceed 70%, justifying construction of new facilities.
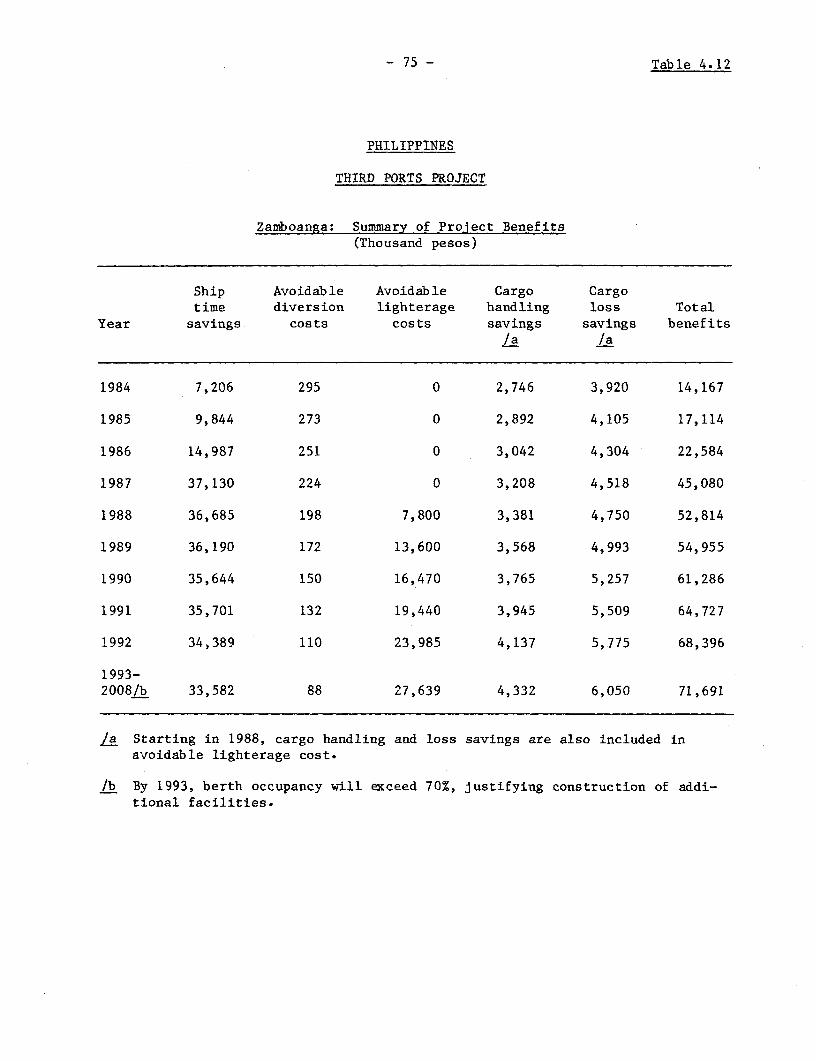
- 75 - Table 4,12
PHILIPPINES
THIRD PORTS PROJECT
Zamboanga: Summary of Project Benefits(Thousand pesos)
Ship Avoidable Avoidable Cargo Cargotime diversion lighterage handling loss Total
Year savings costs costs savings savings benefits/a /a
1984 7,206 295 0 2,746 3,920 14,167
1985 9,844 273 0 2,892 4,105 17,114
1986 14,987 251 0 3,042 4,304 22,584
1987 37,130 224 0 3,208 4,518 45,080
1988 36,685 198 7,800 3,381 4,750 52,814
1989 36,190 172 13,600 3,568 4,993 54,955
1990 35,644 150 16,470 3,765 5,257 61,286
1991 35,701 132 19,440 3,945 5,509 64,727
1992 34,389 110 23,985 4,137 5,775 68,396
1993-2008/b 33,582 88 27,639 4,332 6,050 71,691
/a Starting in 1988, cargo handling and loss savings are also included inavoidable lighterage cost.
/b By 1993, berth occupancy will exceed 70%, justifying construction of addi-tional facilities.
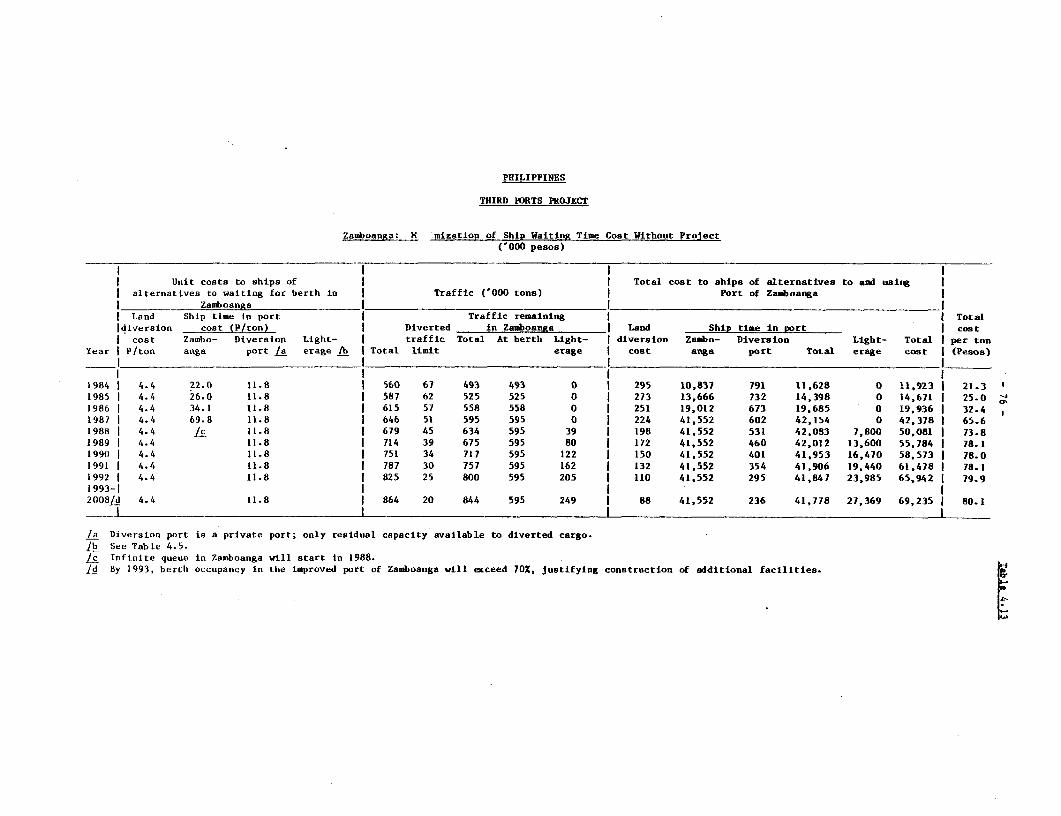
PHILIPPINES
THIRD PORTS PROJECT
Zamboanga: M mization of Ship Waiting Time Cost Without Project('000 pesos)
| Unit costs to ships of | I Total cost to ships of alternatives to and using l
| alternatives to waiting for berth in | Traffic ('000 tons) | Port of Zamboanga |Zamboanga I l l
| Land Ship time in port | Traffic remaining | | Totaltdiversion cost (FL/ton) I Diverted in Zamboanga I Land Ship time in port I cost
I cost Zambo- Diversion Light- I traffic Total At berth Light- I diversion Zambo- Diversion Light- Total I per tonYear | P/ton anga port la erage /b A Total limit erage I cost anga port Total erage cost (Pesos)
I ~~~~~~~~~~~~~~I I I1984 I 4.4 22.0 11.8 I 560 67 493 493 0 I 295 10,837 791 11,628 0 11,923 I 21.31985 I 4.4 26.0 11.8 I 587 62 525 525 0 I 273 13,666 732 14,398 0 14,671 I 25.0 o
1986 I 4.4 34.1 11.8 I 615 57 558 558 0 I 251 19,012 673 19,685 0 19,936 I 32.41987 I 4.4 69.8 11.8 I 646 51 595 595 0 I 224 41,552 602 42,154 0 42,378 I 65.61988 I 4.4 /c 11.8 I 679 45 634 595 39 I 198 41,552 531 42,083 7,800 50,081 I 73.81989 I 4.4 11.8 I 714 39 675 595 80 I 172 41,552 460 42,012 13,600 55,784 I 78.11990 I 4.4 11.8 I 751 34 717 595 122 I 150 41,552 401 41,953 16,470 58,573 I 78.01991 I 4.4 11.8 I 787 30 757 595 162 I 132 41,552 354 41,906 19,440 61,478 I 78.11992 I 4.4 11.8 I 825 25 800 595 205 I 110 41,552 295 41,847 23,985 65,942 I 79.91993-1 l2008/d 4.4 11.8 | 864 20 844 595 249 I 88 41,552 236 41,778 27,369 69,235 I 80.1
/a Diversion port is a private port; only residual capacity available to diverted cargo./b See Table 4.5./c Infinite queue in Zamboanga will start in 1988.Id By 1993, berth occupancy in the improved port of Zamboanga will exceed 70i, justifying construction of additional facilities.
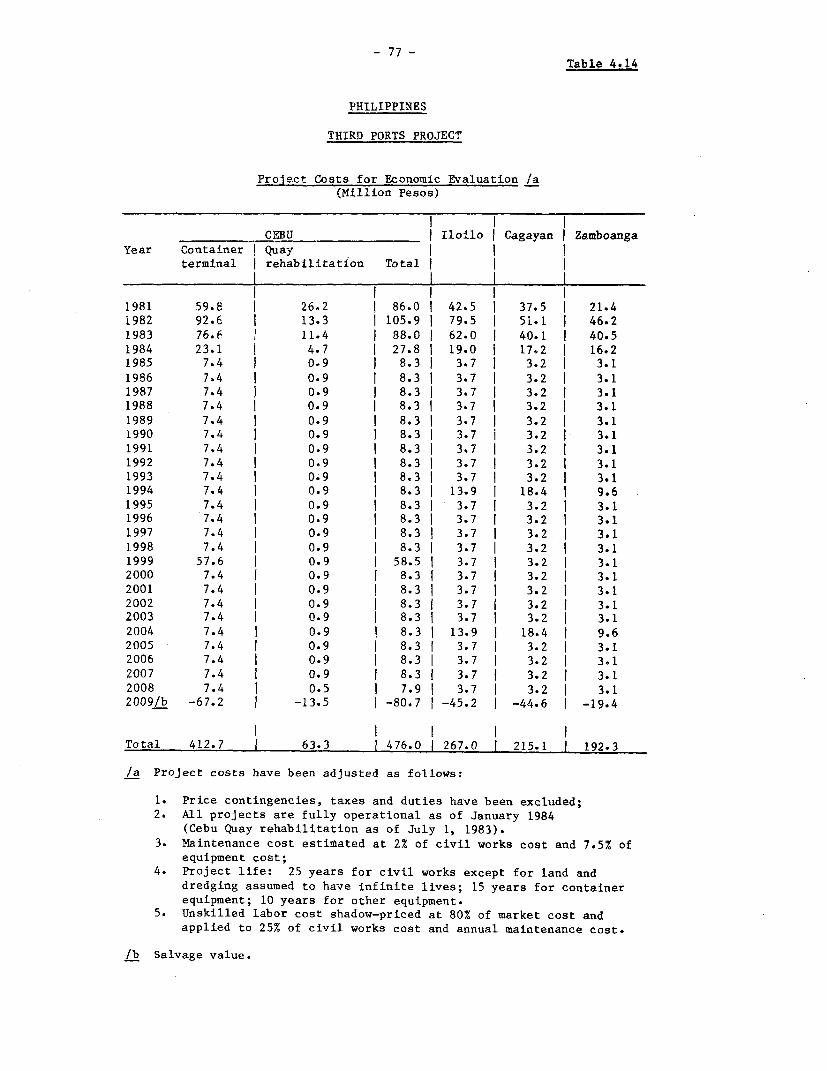
- 77 -
Table 4.14
PHILIPPINES
THIRD PORTS PROJECT
Prolect Costs for Economic Evaluation /a(Million Pesos)
CEBU | Iloilo | Cagayan | Zamboanga
Year Container Quayterminal | rehabilitation Total
_ _ _ _ _ 1 -_ _ _ _ _ 1 _ _ .1 _ _
1981 59.8 26.2 86.0 42.5 i 37.5 | 21.41982 92.6 I 13.3 I 105.9 I 79.5 I 51.1 I 46.21983 76.6 11.4 I 88.0 I 62.0 1 40.1 40.51984 23.1 I 4.7 | 27.8 | 19.0 | 17.2 | 16.21985 7.4 I 0.9 1 8.3 i 3.7 I 3.2 I 3.1
1986 7.4 I 0.9 I 8.3 I 3.7 I 3.2 I 3.11987 7.4 I 0.9 I 8.3 I 3.7 I 3.2 I 3.11988 7.4 I 0.9 I 8.3 I 3.7 I 3.2 1 3.1
1989 7.4 I 0.9 I 8.3 I 3.7 I 3.2 I 3.11990 7.4 I 0.9 I 8.3 I 3.7 I 3.2 I 3.1
1991 7.4 I 0.9 I 8.3 I 3.7 I 3.2 I 3.1
1992 7.4 I 0.9 1 8.3 I 3.7 I 3.2 I 3.11993 7.4 I 0.9 I 8.3 I 3.7 I 3.2 I 3.11994 7.4 I 0.9 I 8.3 I 13.9 I 18.4 I 9.6
1995 7.4 I 0.9 I 8.3 I 3.7 I 3.2 I 3.11996 7.4 I 0.9 I 8.3 I 3.7 I 3.2 I 3.11997 7.4 I 0.9 I 8.3 I 3.7 I 3.2 I 3.1
1998 7.4 0.9 I 8.3 I 3.7 I 3.2 I 3.11999 57.6 I 0.9 i 58.5 I 3.7 I 3.2 1 3.12000 7.4 I 0.9 I 8.3 I 3.7 I 3.2 I 3.12001 7.4 I 0.9 I 8.3 I 3.7 I 3.2 I 3.1
2002 7.4 I 0.9 I 8.3 I 3.7 I 3.2 1 3.12003 7.4 I 0.9 I 8.3 I 3.7 I 3.2 I 3.1
2004 7.4 I 0.9 I 8.3 I 13.9 1 18.4 I 9.62005 7.4 I 0.9 I 8.3 I 3.7 I 3.2 I 3.12006 7.4 I 0.9 8.3 I 3.7 I 3.2 I 3.1
2007 7.4 I 0.9 I 8.3 I 3.7 I 3.2 1 3.1
2008 7.4 I 0.5 I 7.9 I 3.7 I 3.2 I 3.12009/b -67.2 1 -13.5 j -80.7 1 -45.2 | -44.6 | -19.4
Total 412.7 1 63.3 | 476.0 | 267.0 | 215.1 i 192.3
/a Project costs have been adjusted as follows:
1. Price contingencies, taxes and duties have been excluded;2. All projects are fully operational as of January 1984
(Cebu Quay rehabilitation as of July 1, 1983).3. Maintenance cost estimated at 2% of civil works cost and 7.5% of
equipment cost;4. Project life: 25 years for civil works except for land and
dredging assumed to have infinite lives; 15 years for containerequipment; 10 years for other equipment.
5. Unskilled labor cost shadow-priced at 80% of market cost andapplied to 25% of civil works cost and annual maintenance cost.
/b Salvage value.
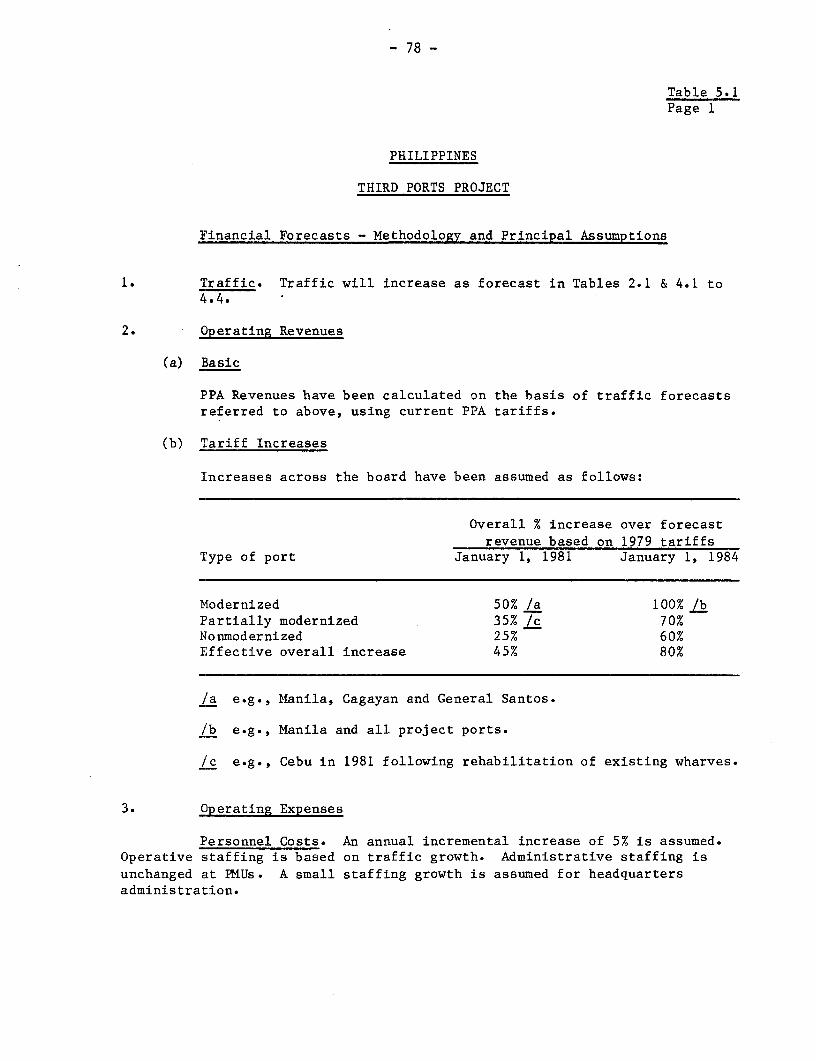
- 78 -
Table 5.1Page 1
PHILIPPINES
THIRD PORTS PROJECT
Financial Forecasts - Methodology and Principal Assumptions
1. Traffic. Traffic will increase as forecast in Tables 2.1 & 4.1 to4.4.
2. Operating Revenues
(a) Basic
PPA Revenues have been calculated on the basis of traffic forecastsreferred to above, using current PPA tariffs.
(b) Tariff Increases
Increases across the board have been assumed as follows:
Overall % increase over forecastrevenue based on 1979 tariffs
Type of port January 1, 1981 January 1, 1984
Modernized 50% /a 100% /bPartially modernized 35% /c 70%Nonmodernized 25% 60%Effective overall increase 45% 80%
/a e.g., Manila, Cagayan and General Santos.
/b e.g., Manila and all project ports.
/c e.g., Cebu in 1981 following rehabilitation of existing wharves.
3. Operating Expenses
Personnel Costs. An annual incremental increase of 5% is assumed.Operative staffing is based on traffic growth. Administrative staffing isunchanged at PMUs. A small staffing growth is assumed for headquartersadministration.
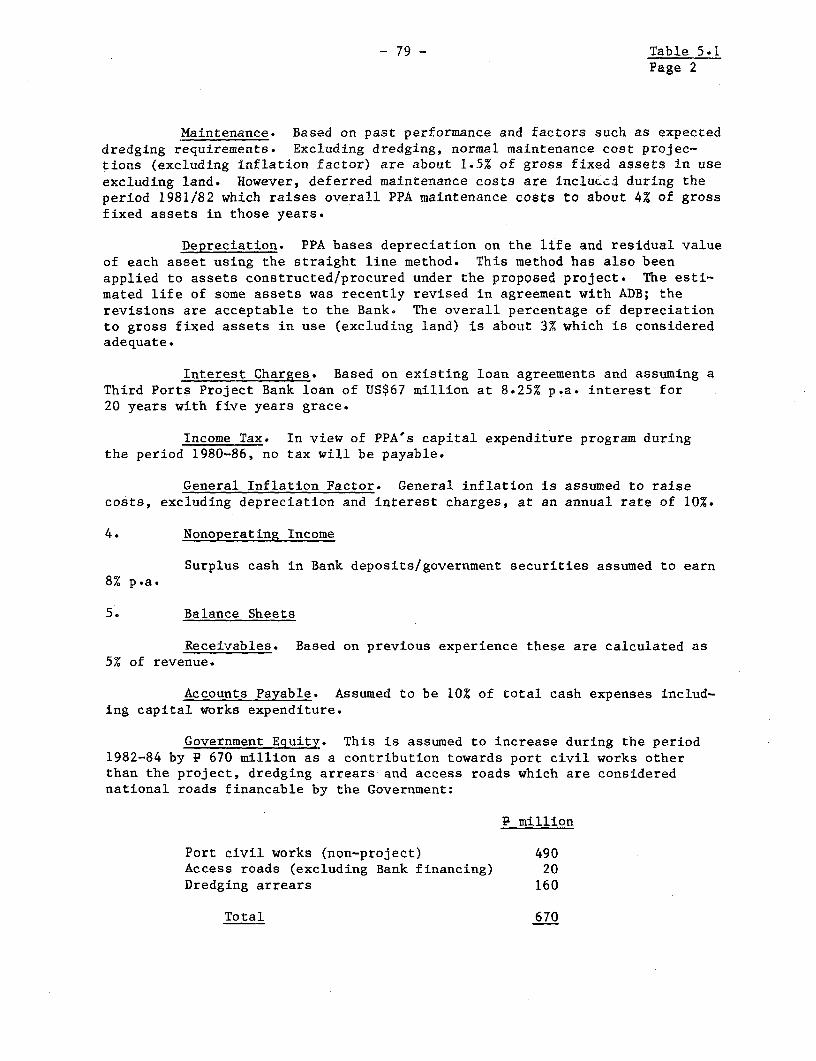
- 79 - Table 5.1Page 2
Maintenance. Based on past performance and factors such as expecteddredging requirements. Excluding dredging, normal maintenance cost projec-tions (excluding inflation factor) are about 1.5% of gross fixed assets in useexcluding land. However, deferred maintenance costs are inclueel during theperiod 1981/82 which raises overall PPA maintenance costs to about 4% of grossfixed assets in those years.
Depreciation. PPA bases depreciation on the life and residual valueof each asset using the straight line method. This method has also beenapplied to assets constructed/procured under the proposed project. The esti-mated life of some assets was recently revised in agreement with ADB; therevisions are acceptable to the Bank. The overall percentage of depreciationto gross fixed assets in use (excluding land) is about 3% which is consideredadequate.
Interest Charges. Based on existing loan agreements and assuming aThird Ports Project Bank loan of US$67 million at 8.25% p.a. interest for20 years with five years grace.
Income Tax. In view of PPA's capital expenditure program duringthe period 1980-86, no tax will be payable.
General Inflation Factor. General inflation is assumed to raisecosts, excluding depreciation and interest charges, at an annual rate of 10%.
4. Nonoperating Income
Surplus cash in Bank deposits/government securities assumed to earn8% p.a.
5. Balance Sheets
Receivables. Based on previous experience these are calculated as5% of revenue.
Accounts Payable. Assumed to be 10% of total cash expenses includ-ing capital works expenditure.
Government Equity. This is assumed to increase during the period1982-84 by P 670 million as a contribution towards port civil works otherthan the project, dredging arrears and access roads which are considerednational roads financable by the Government:
P million
Port civil works (non-project) 490Access roads (excluding Bank financing) 20Dredging arrears 160
Total 670
- 80 - Table 5.1
Page 3
Amortization of Dredging Arrears. Assumed to be P 40 million p.a.over 4 years commencing 1983.
Amortization of Preoperating Expenses. No change in present PPApolicy is assumed in respect of amortization of preoperating expenses.
6. Dredging Fleet/Cargo Handling Equipment
It is assumed that PPA's dredging fleet and cargo handling equip-ment (to be acquired) will be leased to operating companies which will beresponsible for maintenance to agreed standards, and will utilize the assetsfor PPA and private sector work. The lease terms will provide PPA with fundsadequate to meet interest on debt, asset depreciation and give a reasonablereturn on capital outlay. This sum has been computed as P 65 million in afull year of operation, excluding any necessary adjustments for future gene-ral inflation. PPA will pay the lessee at agreed rates for any dredgingperformed for PPA.
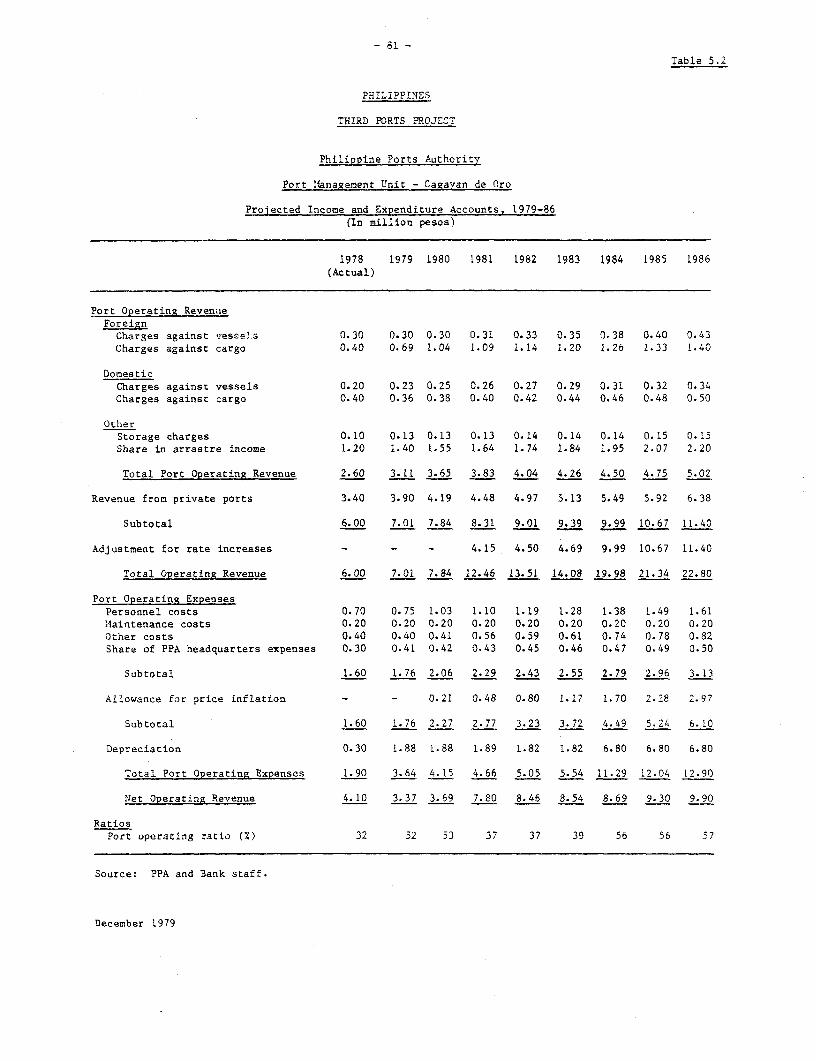
- 81 -
Table 5.2
PHILIPPINES
THIRD PORTS PROJECT
Philippine Ports Authority
Port Management Unit - Cagavan de Oro
Projected Income and Expenditure Accounts, 1979-86(In million pesos)
1978 1979 1980 1981 1982 1983 1984 1985 1986(Actual)
Port Operating Reven.seForeign
Charges against 7esns1s 0.30 0.30 0.30 0.31 0.33 0.35 0.38 0.40 0.43Charges against cargo 0.40 0.69 1.04 1.09 1.14 1.20 1.26 1.33 1.40
DomesticCharges against vessels 0.20 0.23 0.25 0.26 0.27 0.29 0.31 0.32 0.34Charges against cargo 0.40 0.36 0.38 0.40 0.42 0.44 0.46 0.48 0.50
OtherStorage charges 0.10 0.13 0.13 0.13 0.14 0.14 0.14 0.15 0.15Share in arrastre income 1.20 1.40 1.55 1.64 1.74 1.84 1.95 2.07 2.20
Total Port Operating Revenue 2.60 3.11 3.65 3.83 4.04 4.26 4.50 4.75 5.02
Revenue from private ports 3.40 3.90 4.19 4.48 4.97 5.13 5.49 5.92 6.38
Subtotal 6.00 7.01 7.84 8.31 9.01 9.39 9.99 10.67 11.40
Adjustment for rate increases - - - 4.15 4.50 4.69 9.99 10.67 11.40
Total Operating Revenue 6.00 7.01 7.84 12.46 13.51 14.08 19.98 21.34 22.80
Port Operating ExpensesPersonnel costs 0.70 0.75 1.03 1.10 1.19 1.28 1.38 1.49 1.61Maintenance costs 0.20 0.20 0.20 0.20 0.20 0.20 0.20 0.20 0.20Other costs 0.40 0.40 0.4i 0.56 0.59 0.61 0.74 0.78 0.82Share of PPA headquarters expenses 0.30 0.41 0.42 0.43 0.45 0.46 0.47 0.49 0.50
Subtotal 1.60 1.76 2.06 2.29 2.43 2.55 2.79 2.96 3.13
Allowance for price inflation - - 0.21 0.48 0.80 1.17 1.70 2.28 2.97
Subtotal 1.60 1.76 2.27 2.77 3.23 3.72 4.49 5.24 6.10
Depreciation 0.30 1.88 1.88 1.89 1.82 1.82 6.80 6.80 6.80
Total Port Operating Expenses 1.90 3.64 4.15 4.66 5.05 5.54 11.29 12.04 12.90
Net Operating Revenue 4.10 3.37 3.69 7.80 8.46 8.54 8.69 9.30 9.90
RatiosPort operating ratio (%) 32 52 53 37 37 39 56 56 57
Source: PPA and Bank staff.
December 1979
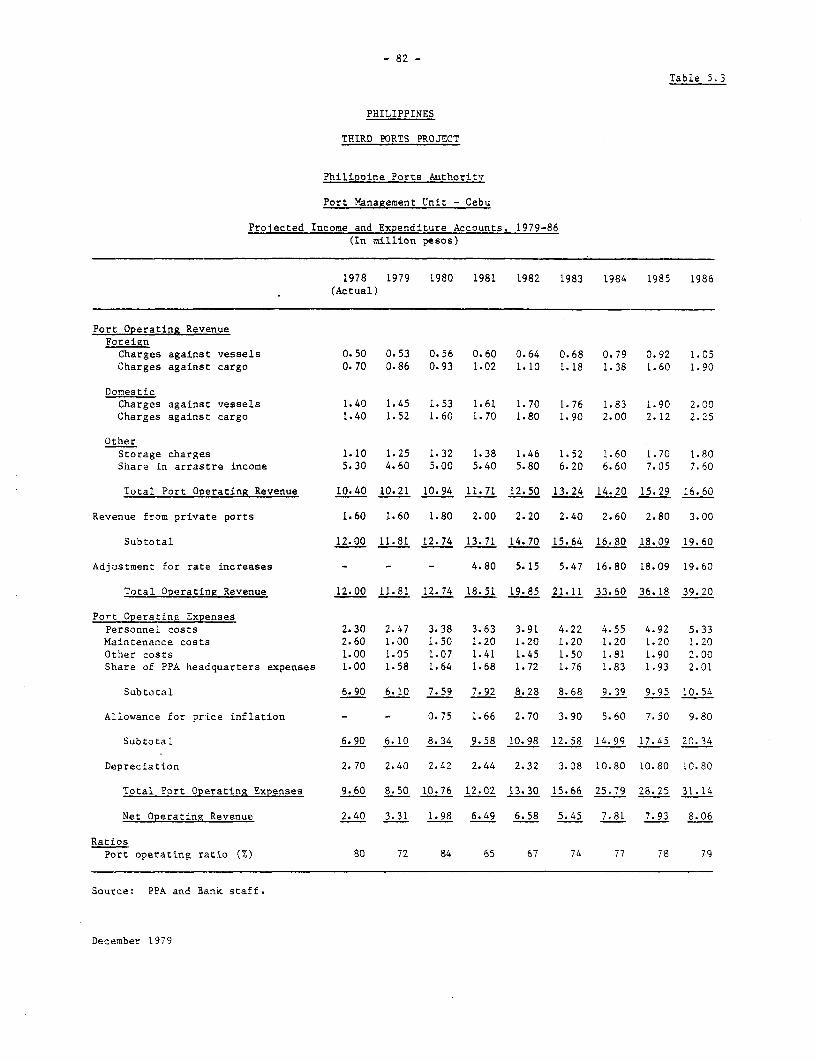
- 82 -
Table 5.3
PHILIPPINES
THIRD PORTS PROJECT
Philippine Ports Authority
Port Management Unit - Cebu
Prolected Income and Expenditure Accounts, 1979-86(In million pesos)
1978 1979 1980 1981 1982 1983 1984 1985 1986(Actual)
Port Operating RevenueForeignCharges against vessels 0.50 0.53 0.56 0.60 0.64 0.68 0.79 0.92 1.05Charges against cargo 0.70 0.86 0.93 1.02 1.10 1.18 1.38 1.60 1.90
DomesticCharges against vessels 1.40 1.45 1.53 1.61 1.70 1.76 1.83 1.90 2.00Charges against cargo 1.40 1.52 1.60 1.70 1.80 1.90 2.00 2.12 2.25
OtherStorage charges 1.10 1.25 1.32 1.38 1.46 1.52 1.60 1.70 1.80Share in arrastre income 5.30 4.60 5.00 5.40 5.80 6.20 6.60 7.05 7.60
Total Port Operating Revenue 10.40 10-21 10.94 11.71 12.50 13.24 14.20 15.29 16.60
Revenue from private ports 1.60 1.60 1.80 2.00 2.20 2.40 2.60 2.80 3.00
Subtotal 12.00 11.81 12.74 13.71 14.70 15.64 16.80 18.09 19.60
Adjustment for rate increases - - - 4.80 5.15 5.47 16.80 18.09 19.60
Total Operating Revenue 12.00 11.81 12.74 18.51 19.85 21.11 33.60 36.18 39.20
Port Operating ExpensesPersonnel costs 2.30 2.47 3.38 3.63 3.91 4.22 4.55 4.92 5.33Maintenance costs 2.60 1.00 1.50 1.20 1.20 1.20 1.20 1.20 1.20Other costs 1.00 1.05 1.07 1.41 1.45 1.50 1.81 1.90 2.00Share of PPA headquarters expenses 1.00 1.58 1.64 1.68 1.72 1.76 1.83 1.93 2.01
Subtotal 6.90 6.10 7.59 7.92 8.28 8.68 9.39 9.95 10.54
Allowance for price inflation - - 0.75 1.66 2.70 3.90 5.60 7.50 9.80
Subtotal 6.90 6.10 8.34 9.58 10.98 12.58 14.99 17.45 20.34
Depreciation 2.70 2.40 2.42 2.44 2.32 3.08 10.80 10.80 10.80
Total Port Operating Expenses 9.60 8.50 10.76 12.02 13.30 15.66 25.79 28.25 31.14
Net Operating Revenue 2.40 3.31 1.98 6.49 6.58 5.45 7.81 7.93 8.06
RatiosPort operating ratio (%) 80 72 84 65 67 74 77 78 79
Source: PPA and Bank staff.
December 1979
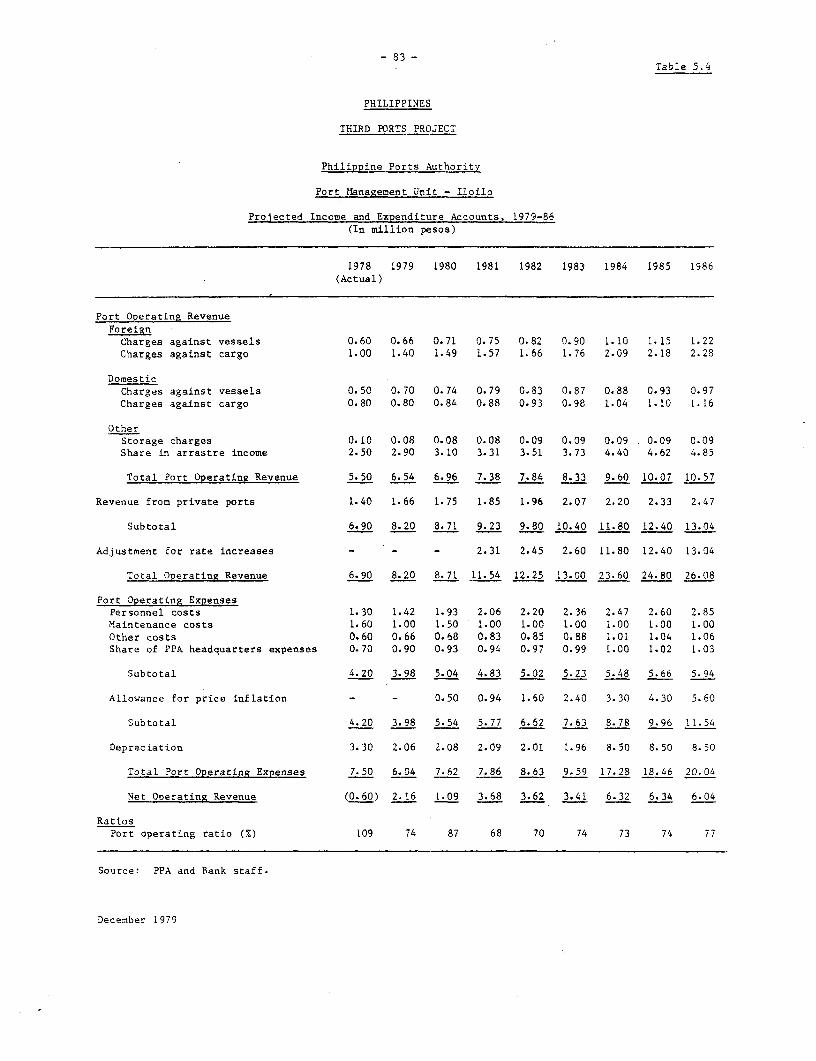
- 83 -Table 5.4
PHILIPPINES
THIRD PORTS PROJECT
Philippine Ports Authority
Port 11anagement Unit - Iloilo
Projected Income and Expenditure Accounts, 1979-86(In million pesos)
1978 1979 1980 1981 1982 1983 1984 1985 1986(Actual)
Port Operating RevenueForeignCharges against vessels 0.60 0.66 0.71 0.75 0.82 0.90 1.10 1.15 1.22Charges against cargo 1.00 1.40 1.49 1.57 1.66 1.76 2.09 2.18 2.28
DomesticCharges against vessels 0.50 0.70 0.74 0.79 0.83 0.87 0.88 0.93 0.97Charges against cargo 0.80 0.80 0.84 0.88 0.93 0.98 1.04 1.10 1.16
OtherStorage charges 0.10 0.08 0.08 0.08 0.09 0.09 0.09 0.09 0.09Share in arrastre income 2.50 2.90 3.10 3.31 3.51 3.73 4.40 4.62 4.85
Total Port Operating Revenue 5.50 6.54 6.96 7.38 7.84 8.33 9.60 10.07 10.57
Revenue from private ports 1.40 1.66 1.75 1.85 1.96 2.07 2.20 2.33 2.47
Subtotal 6.90 8.20 8.71 9.23 9.80 10.40 11.80 12.40 13.04
Adjustment for rate increases - - - 2.31 2.45 2.60 11.80 12.40 13.04
Total Operating Revenue 6.90 8.20 8.71 11.54 12.25 13.00 23.60 24.80 26.08
Port Operating ExpensesPersonnel costs 1.30 1.42 1.93 2.06 2.20 2.36 2.47 2.60 2.85Maintenance costs 1.60 1.00 1.50 1.00 1.00 1.00 1.00 1.00 1.00Other costs 0.60 0.66 0.68 0.83 0.85 0.88 1.01 1.04 1.06Share of PPA headquarters expenses 0.70 0.90 0.93 0.94 0.97 0.99 1.00 1.02 1.03
Subtotal 4.20 3.98 5.04 4.83 5.02 5.23 5.48 5.66 5.94
Allowance for price inflation - - 0.50 0.94 1.60 2.40 3.30 4.30 5.60
Subtotal 4.20 3.98 5.54 5.77 6.62 7.63 8.78 9.96 11.54
Depreciation 3.30 2.06 2.08 2.09 2.01 1.96 8.50 8.50 8.50
Total Port Operating Expenses 7.50 6.04 7.62 7.86 8.63 9.59 17.28 18.46 20.04
Net Operating Revenue (0.60) 2.16 1.09 3.68 3.62 3.41 6.32 6.34 6.04
RatiosPort operating ratio (%) 109 74 87 68 70 74 73 74 77
Source: PPA and Bank staff.
December 1979
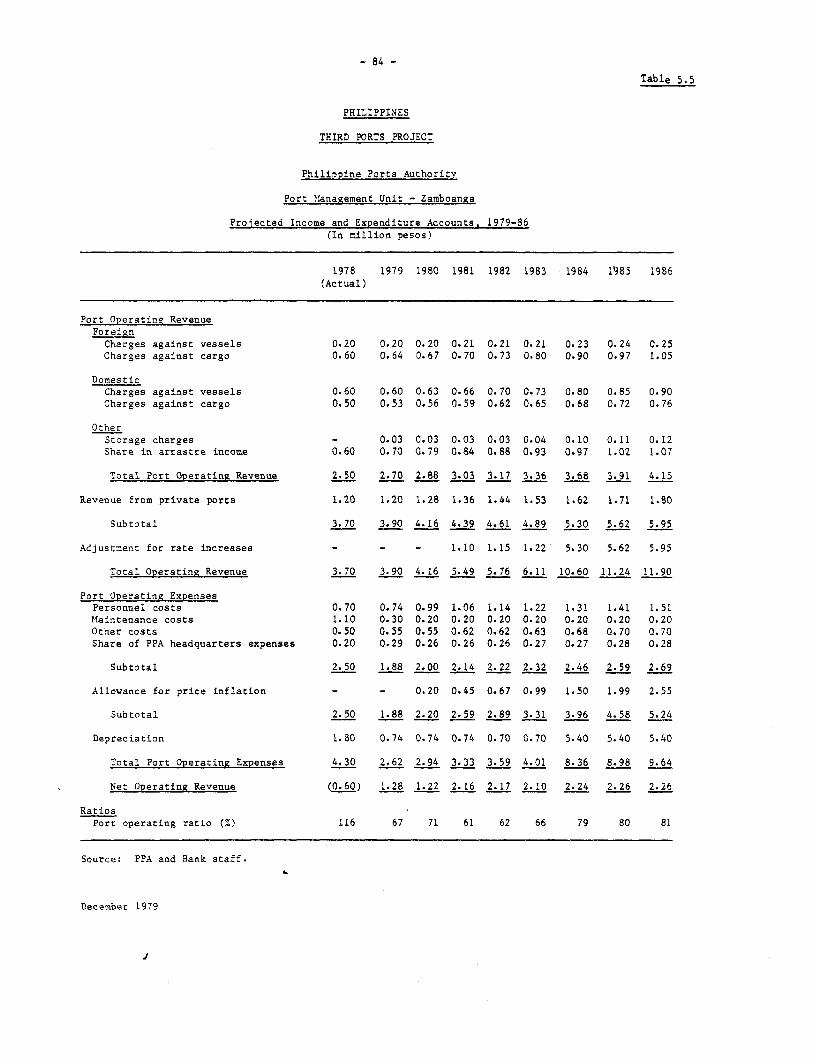
- 84 -
Table 5.5
PHILIPPINES
THIRD PORTS PROJECT
Philippine Ports Authority
Port Qlanagement Unit - Zamboanga
Prolected Income and Expenditure Accounts, 1979-86(In million pesos)
1978 1979 1980 1981 1982 1983 1984 1985 1986(Actual)
Port Operating RevenueForeian
Charges against vessels 0.20 0.20 0.20 0.21 0.21 0.21 0.23 0.24 0.25Charges against cargo 0.60 0.64 0.67 0.70 0.73 0.80 0.90 0.97 1.05
DomesticCharges against vessels 0.60 0.60 0.63 0.66 0.70 0.73 0.80 0.85 0.90Charges against cargo 0.50 0.53 0.56 0.59 0.62 0.65 0.68 0.72 0.76
OtherStorage charges - 0.03 0.03 0.03 0.03 0.04 0.10 0.11 0.12Share in arrastre income 0.60 0.70 0.79 0.84 0.88 0.93 0.97 1.02 1.07
Total Port OperatinR Revenue 2.50 2.70 2.88 3.03 3.17 3.36 3.68 3.91 4.15
Revenue from private ports 1.20 1.20 1.28 1.36 1.44 1.53 1.62 1.71 1.80
Subtotal 3.70 3.90 4.16 4.39 4.61 4.89 5.30 5.62 5.95
Adjustment for rate increases - - - 1.10 1.15 1.22 5.30 5.62 5.95
Total Operating Revenue 3.70 3.90 4.16 5.49 5.76 6.11 10.60 11.24 11.90
Port Operating ExpensesPersonnel costs 0.70 0.74 0.99 1.06 1.14 1.22 1.31 1.41 1.51Maintenance costs 1.10 0.30 0.20 0.20 0.20 0.20 0.20 0.20 0.20Other costs 0.50 0.55 0.55 0.62 0.62 0.63 0.68 0.70 0.70Share of PPA headquarters expenses 0.20 0.29 0.26 0.26 0.26 0.27 0.27 0.28 0.28
Subtotal 2.50 1.88 2.00 2.14 2.22 2.32 2.46 2.59 2.69
Allowance for price inflation - - 0.20 0.45 0.67 0.99 1.50 1.99 2.55
Subtotal 2.50 1.88 2.20 2.59 2.89 3.31 3.96 4.58 5.24
Depreciation 1.80 0.74 0.74 0.74 0.70 0.70 5.40 5.40 5.40
Total Port Operating Expenses 4.30 2.62 2.94 3.33 3.59 4.01 8.36 8.98 9.64
Net Operating Revenue (0.60) 1.28 1.22 2.16 2.17 2.10 2.24 2.26 2.26
RatiosPort operating ratio (%) 116 67 71 61 62 66 79 80 81
Source: PPA and Bank staff.
December 1979
l
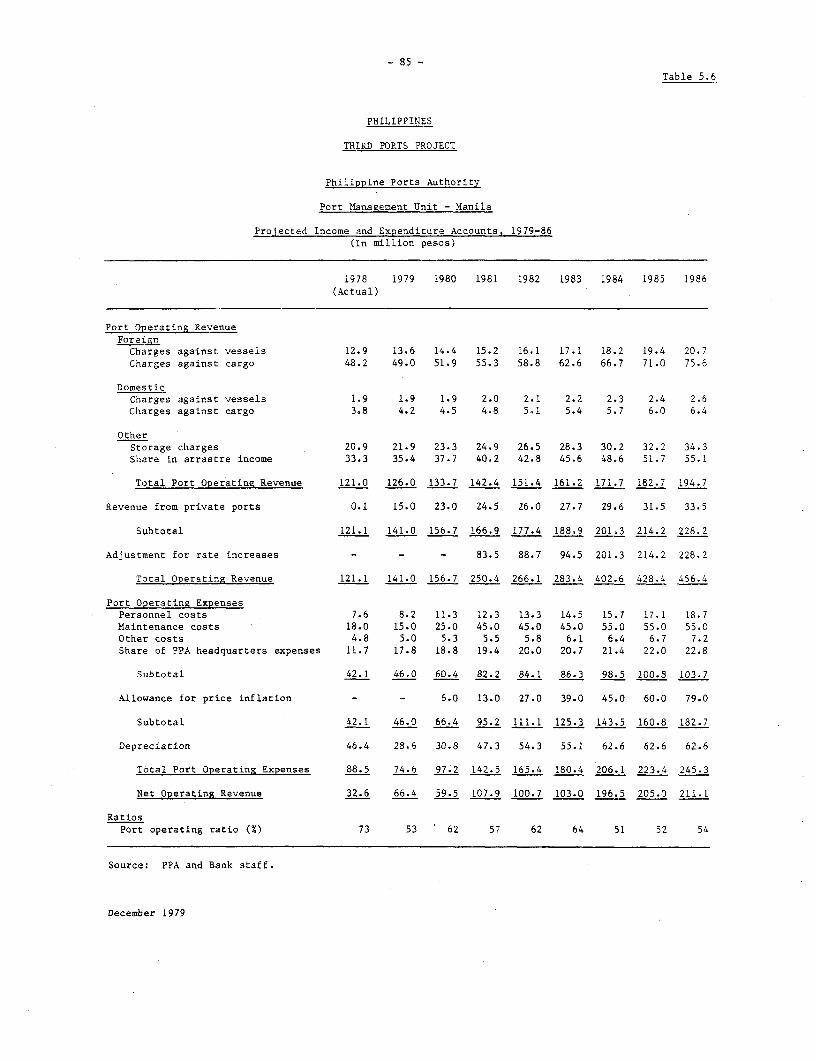
- 85 -
Table 5.6
PHILIPPINES
THIRD PORTS PROJECT
Philippine Ports Authority
Port Management Unit - Manila
Projected Income and Expenditure Accounts, 1979-86(In million pesos)
1978 1979 1980 1981 1982 1983 1984 1985 1986(Actual)
Port Operating RevenueForeignCharges against vessels 12.9 13.6 14.4 15.2 16.1 17.1 18.2 19.4 20.7Charges against cargo 48.2 49.0 51.9 55.3 58.8 62.6 66.7 71.0 75.6
DomesticCharges against vessels 1.9 1.9 1.9 2.0 2.1 2.2 2.3 2.4 2.6Charges against cargo 3.8 4.2 4.5 4.8 5.1 5.4 5.7 6.0 6.4
OtherStorage charges 20.9 21.9 23.3 24.9 26.5 28.3 30.2 32.2 34.3Share in arrastre income 33.3 35.4 37.7 40.2 42.8 45.6 48.6 51.7 55.1
Total Port Operating Revenue 121.0 126.0 133.7 142.4 151.4 161.2 171.7 182.7 194.7
Revenue from private ports 0.1 15.0 23.0 24.5 26.0 27.7 29.6 31.5 33.5
Subtotal 121.1 141.0 156.7 166.9 177.4 188.9 201.3 214.2 228.2
Adjustment for rate increases - - - 83.5 88.7 94.5 201.3 214.2 228.2
Total Operating Revenue 121.1 141.0 156.7 250.4 266.1 283.4 402.6 428.4 456.4
Port Operating ExpensesPersonnel costs 7.6 8.2 11.3 12.3 13.3 14.5 15.7 17.1 18.7Maintenance costs 18.0 15.0 25.0 45.0 45.0 45.0 55.0 55.0 55.0Other costs 4.8 5.0 5.3 5.5 5.8 6.1 6.4 6.7 7.2Share of PPA headquarters expenses 11.7 17.8 18.8 19.4 20.0 20.7 21.4 22.0 22.8
Suibtotal 42.1 46.0 60.4 82.2 84.1 86.3 98.5 100.8 103.7
Allowance for price inflation - - 6.0 13.0 27.0 39.0 45.0 60.0 79.0
Subtotal 42.1 46.0 66.4 95.2 111.1 125.3 143.5 160.8 182.7
Depreciation 46.4 28.6 30.8 47.3 54.3 55.1 62.6 62.6 62.6
Total Port Operating Expenses 88.5 74.6 97.2 142.5 165.4 180.4 206.1 223.4 245.3
Net Operating Revenue 32.6 66.4 59.5 107.9 100.7 103.0 196.5 205.0 211.1
RatiosPort operating ratio (x) 73 53 ' 62 57 62 64 51 52 54
Source: PPA and Bank staff.
December 1979

- 86 -
Table 5.7
PHILIPPINES
THIRD PORTS PROJECT
Philippine Ports Authority
Other Port Mana2ement Units
Projected Income and Expenditure Accounts, 1979-86(In million pesos)
1978 1979 1980 1981 1982 1983 1984 1985 1986(Actual)
Port Operating RevenueForeignCharges against vessels 3.60 3.67 3.70 3.74 3.80 3.85 3.90 3.97 4.04Charges against cargo 6.80 7.00 7.30 7.74 8.20 8.70 9.20 9.75 10.34
DomesticCharges against vessels 2.10 2.20 2.30 2.44 2.59 2.75 2.90 3.07 3.25Charges against cargo 3.30 3.40 3.60 3.82 4.05 4.30 4.56 4.83 5.12
OtherStorage charges 0.80 0.83 0.87 0.91 0.95 1.00 1.05 1.10 1.16Share in arrastre income 8.90 9.30 9.86 10.45 11.08 11.75 12.45 13.20 14.00
Total Port Operating Revenue 25.50 26.40 27.63 29.10 30.67 32.35 34.06 35.92 37.91
Revenue from private ports 42.50 42.60 44.70 47.40 50.20 53.20 56.40 59.80 63.40
Subtotal 68.00 69.00 72.33 76.50 80.87 85.55 90.46 95.72 101.31
Adjustment for rate increases - - - 26.77 28.30 29.95 62.19 65.80 69.65
Total Operating Revenue 68.00 69.00 72.33 103.27 109.17 115.50 152.65 161.52 170.96
Port Operating ExpensesPersonnel costs 9.50 10.12 13.70 14.54 15.47 16.46 17.53 18.63 19.91Maintenance costs 6.20 4.30 14.50 28.00 28.00 28.00 28.00 28.00 28.00Other costs 5.30 5.43 5.53 6.61 6.80 6.97 7.98 8.17 8.47Share of PPA headquarters expenses 2.60 3.92 4.02 4.04 4.07 4.11 4.16 4.23 4.27
Subtotal 23.60 23.77 37.75 53.19 54.34 55.54 57.67 59.03 60.65
Allowance for price inflation - - 3.77 11.00 17.00 25.00 30.00 38.00 46.00
Subtotal 23.60 23.77 41.52 64.19 71.34 80.54 87.67 97.03 106.65
Depreciation 13.00 8.60 10.40 18.50 22.00 23.50 28.00 35.50 44.50
Total Port Operating Expenses 36.60 32.37 51.92 82.69 93.34 104.04 115.67 132.53 151.15
Net Operating Revenue 31.40 36.63 20.41 20.58 15.83 11.46 36.98 28.99 19.81
RatiosPort operating ratio (x) 54 47 72 80 85 89 75 81 88
Source: PPA and Bank staff.
December 1979
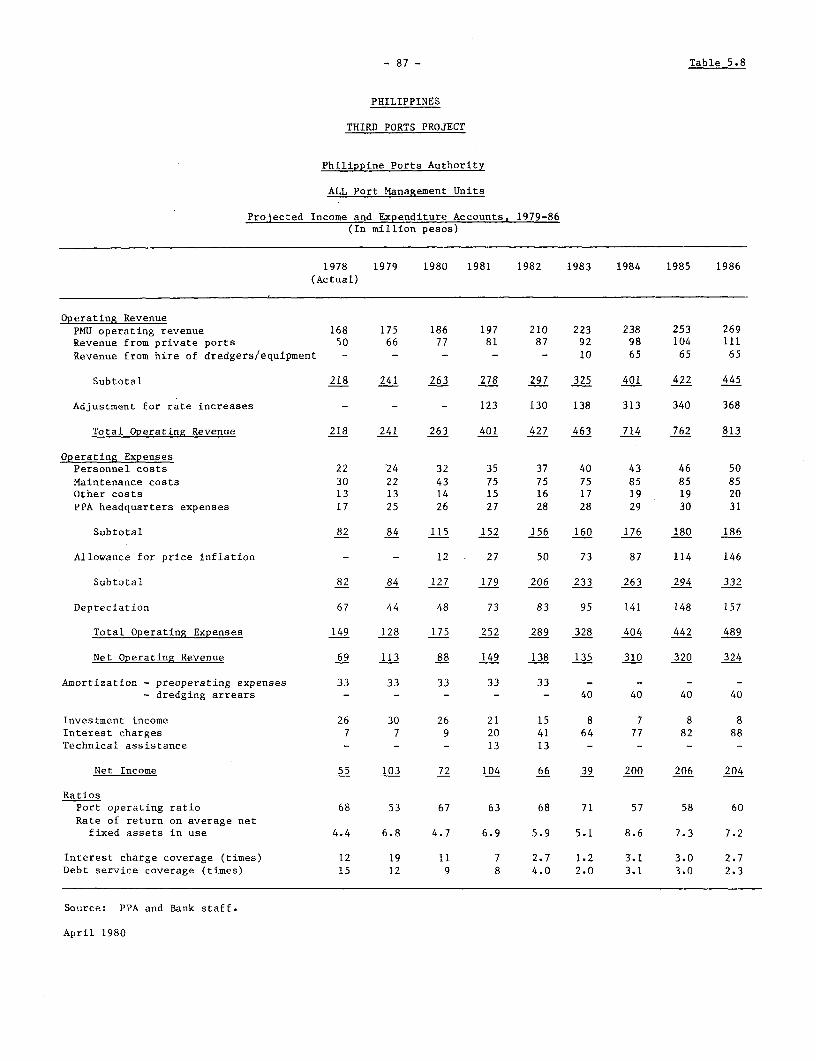
- 87 - Table 5.8
PHILIPPINES
THIRD PORTS PROJECT
Philippine Ports Authority
ALL Port Management Units
Projected Income and Expenditure Accounts, 1979-86(In million pesos)
1978 1979 1980 1981 1982 1983 1984 1985 1986(Actual)
Operating RevenuePMU operating revenue 168 175 186 197 210 223 238 253 269Revenue from private ports 50 66 77 81 87 92 98 104 111Revenue from hire of dredgers/equipment - - - - - 10 65 65 65
Subtotal 218 241 263 278 297 325 401 422 445
Adjustment for rate increases - - - 123 130 138 313 340 368
Total Operating Revenue 218 241 263 401 427 463 714 762 813
Operating ExpensesPersonnel costs 22 24 32 35 37 40 43 46 50Maintenance costs 30 22 43 75 75 75 85 85 85Other costs 13 13 14 15 16 17 19 19 20PPA headquarters expenses 17 25 26 27 28 28 29 30 31
Subtotal 82 84 115 152 156 160 176 180 186
Allowance for price inflation - - 12 27 50 73 87 114 146
Subtotal 82 84 127 179 206 233 263 294 332
Depreciation 67 44 48 73 83 95 141 148 157
Total Operating Expenses 149 128 175 252 289 328 404 442 489
Net Operating Revenue 69 113 88 149 138 135 310 320 324
Amortization - preoperating expenses 33 33 33 33 33 - - - -- dredging arrears - - - - - 40 40 40 40
Investment income 26 30 26 21 15 8 7 8 8Interest charges 7 7 9 20 41 64 77 82 88Technical assistance - - - 13 13 - - - -
Net Income 55 103 72 104 66 39 200 206 204
RatiosPort operating ratio 68 53 67 63 68 71 57 58 60Rate of return on average net
fixed assets in use 4.4 6.8 4.7 6.9 5.9 5.1 8.6 7.3 7.2
Interest charge coverage (times) 12 19 11 7 2.7 1.2 3.1 3.0 2.7Debt service coverage (times) 15 12 9 8 4.0 2.0 3.1 3.0 2.3
Source: PPA and Bank staff.
April 1980
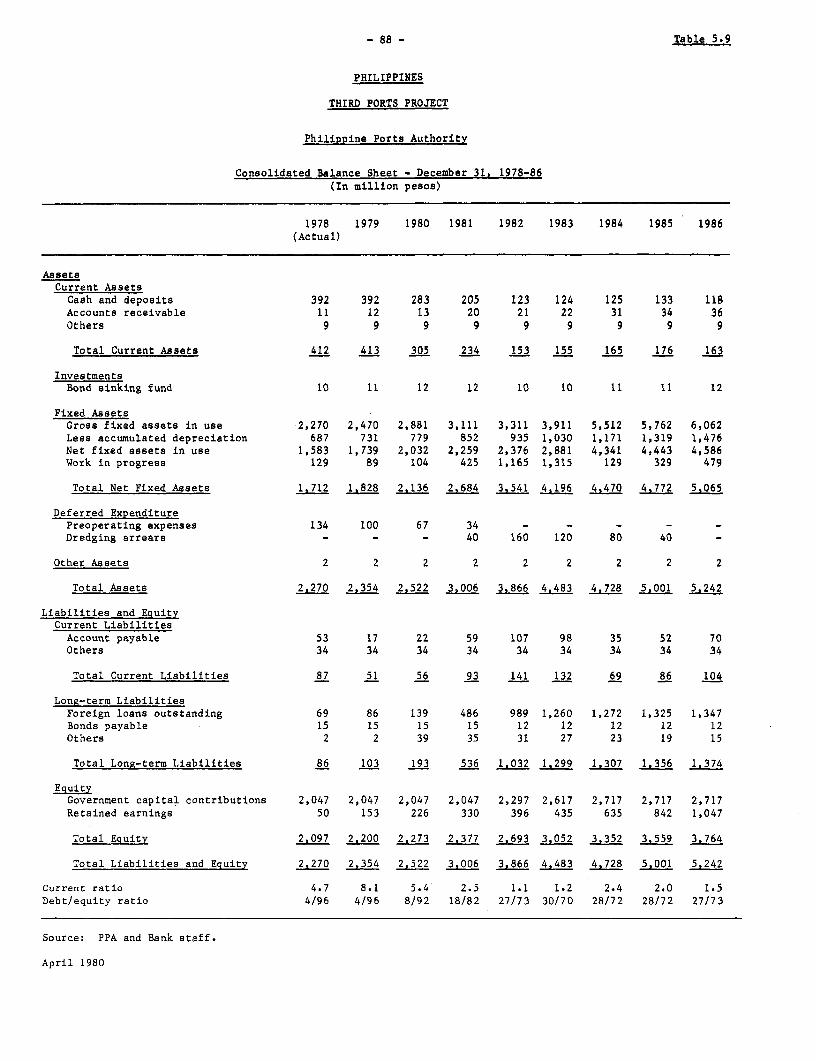
- 88 - Table 5.9
PHILIPPINES
THIRD PORTS PROJECT
Philippine Ports Authority
Consolidated Balance Sheet - December 31. 1978-86(In million pesos)
1978 1979 1980 1981 1982 1983 1984 1985 1986(Actual)
AssetsCurrent AssetsCash and deposits 392 392 283 205 123 124 125 133 118Accounts receivable 11 12 13 20 21 22 31 34 36Others 9 9 9 9 9 9 9 9 9
Total Current Assets 412 413 305 234 153 155 165 176 163
InvestmentsBond sinking fund 10 11 12 12 10 10 11 11 12
Fixed AssetsGross fixed assets in use 2,270 2,470 2,881 3,111 3,311 3,911 5,512 5,762 6,062Less accumulated depreciation 687 731 779 852 935 1,030 1,171 1,319 1,476Net fixed assets in use 1,583 1,739 2,032 2,259 2,376 2,881 4,341 4,443 4,586Work in progress 129 89 104 425 1,165 1,315 129 329 479
Total Net Fixed Assets 1,712 1.828 2,136 2,684 3,541 4.196 4,470 4,772 5,065
Deferred ExpenditurePreoperating expenses 134 100 67 34 - - - - -Dredging arrears - - - 40 160 120 80 40 -
Other Assets 2 2 2 2 2 2 2 2 2
Total Assets 2,270 2,354 2,522 3.006 3,866 4,483 4.728 5,001 5.242
Liabilities and EquityCurrent LiabilitiesAccount payable 53 17 22 59 107 98 35 52 70Others 34 34 34 34 34 34 34 34 34
Total Current Liabilities 87 51 56 93 141 132 69 86 104
Long-term LiabilitiesForeign loans outstanding 69 86 139 486 989 1,260 1,272 1,325 1,347Bonds payable 15 15 15 15 12 12 12 12 12Others 2 2 39 35 31 27 23 19 15
Total Long-term Liabilities 86 103 193 536 1,032 1,299 1,307 1,356 1,374
EquityGovernment capital contributions 2,047 2,047 2,047 2,047 2,297 2,617 2,717 2,717 2,717Retained earnings 50 153 226 330 396 435 635 842 1,047
Total Equity 2.097 2,200 2,273 2,377 2,693 3,052 3,352 3,559 3,764
Total Liabilities and Equity 2,270 2,354 2,522 3,006 3.866 4,483 4,728 5.001 5.242
Current ratio 4.7 8.1 5.4 2.5 1.1 1.2 2.4 2.0 1.5Debt/equity ratio 4/96 4/96 8/92 18/82 27/73 30/70 28/72 28/72 27/73
Source: PPA and Bank staff.
April 1980
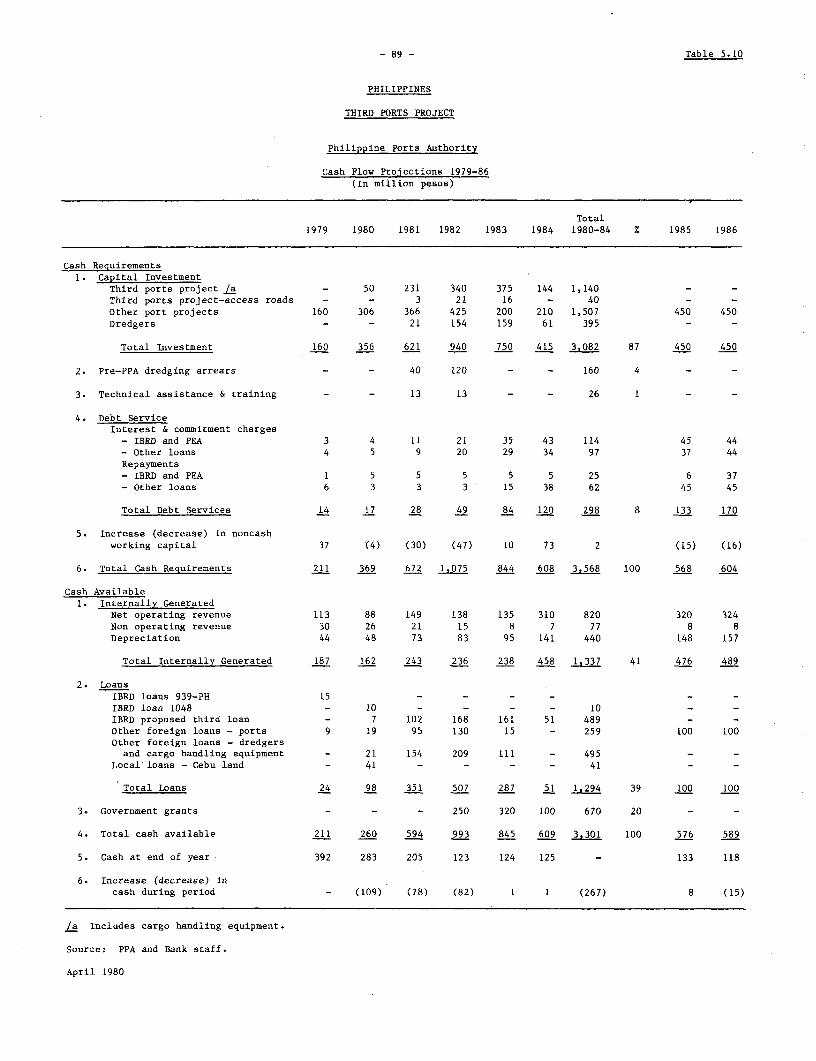
- 89- Table 5.10
PHILIPPINES
THIRD PORTS PROJECT
Philippine Ports Authority
Cash Flow Projections 1979-86(In million pesos)
Total1979 1980 1981 1982 1983 1984 1980-84 % 1985 1986
Cash Requirements1. Capital Investment
Third ports project /a - 50 231 340 375 144 1,140 - -Third ports project-access roads - - 3 21 16 - 40 - -Other port projects 160 306 366 425 200 210 1,507 450 450Dredgers - - 21 154 159 61 395 - -
Total Investment 160 356 621 940 750 415 3,082 87 450 450
2. Pre-PPA dredging arrears - - 40 120 - - 160 4 - -
3. Technical assistance & training - - 13 13 - - 26 1 - -
4. Debt ServiceInterest & commitment charges
- IBRD and PEA 3 4 11 21 35 43 114 45 44- Other loans 4 5 9 20 29 34 97 37 44Repayments- IBRD and PEA 1 5 5 5 5 5 25 6 37- other loans 6 3 3 3 15 38 62 45 45
Total Debt Services 14 17 28 49 84 120 298 8 133 170
5. Increase (decrease) in noncashworking capital 37 (4) (30) (47) 10 73 2 (15) (16)
6. Total Cash Requirements 211 369 672 1,075 844 608 3,568 100 568 604
Cash Available1. Internally Generated
Net operating revenue 113 88 149 138 135 310 820 320 324Non operating revenue 30 26 21 15 8 7 77 8 8Depreciation 44 48 73 83 95 141 440 148 157
Total Internally Generated 187 162 243 236 238 458 1,337 41 476 489
2. LoansIBRD loans 939-PH 15 - - - - - -IBRD loan 1048 - 10 - - - - 10 - -
IBRD proposed third loan - 7 102 168 161 51 489 - -Other foreign loans - ports 9 19 95 130 15 - 259 100 100Other foreign loans - dredgers
and cargo handling equipment - 21 154 209 111 - 495 - -Local loans - Cebu land - 41 - - - - 41 - -
Total Loans 24 98 351 507 287 51 1,294 39 100 100
3. Government grants - - - 250 320 100 670 20 - -
4. Total cash available 211 260 594 993 845 609 3,301 100 576 589
5. Cash at end of year 392 283 205 123 124 125 - 133 118
6. Increase (decrease) incash during period - (109) (78) (82) 1 1 (267) 8 (15)
/a Includes cargo handling equipment.
Source: PPA and Bank staff.
April 1980

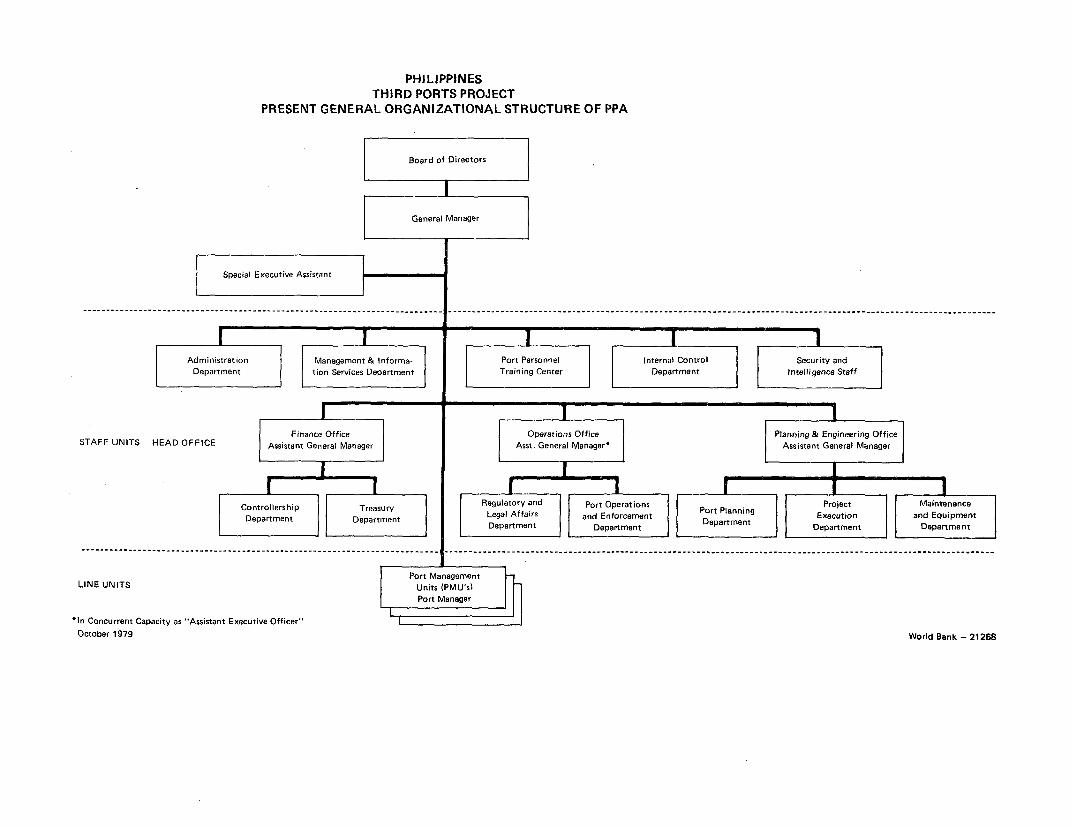
PHILIPPINESTHIRD PORTS PROJECT
PRESENT GENERAL ORGANIZATIONAL STRUCTURE OF PPA
Board of Directors jGeneral Manager
AdministrationM agmt & Informa Port Personnel internal Control Security andDepartment toSevcsDepartmen Training Center Department I ntellIi gence Staff
_ _ _ _ _ _ _ _ _ _ _ _ _ _ _ _ _ _ _ _ _ _ _ _ _ _ _ _ _ _ _ _ _ _
Finance Office Operations Office Planning & Engineering OfficeSTAFF UNITS - HEAD OFFICE Assistant General Manager Asst. General Manager- Assistant General Manager
Controllership Treasury Regulatory and Port Operations Port Planning Project Maintenance
Department Department Legal Affairs and Enforcement DearmetExecution and EquipmentDepartment Department Department Department
…-- - - - - - - - - - - - - - - - - - - - - - - - - - - - - - - - - - - - - - - - - - - - -- - - - - - - - - - - - - - - - - - - - - - - - - - - - - - - - - - - - - - - - - - - - - - -
Port ManagementLINE UNITS Units (PIVIsl
Port Manager
*In Concurrent Capacity as "Assistant Executive Officer"
October 1979 World Bank - 21268

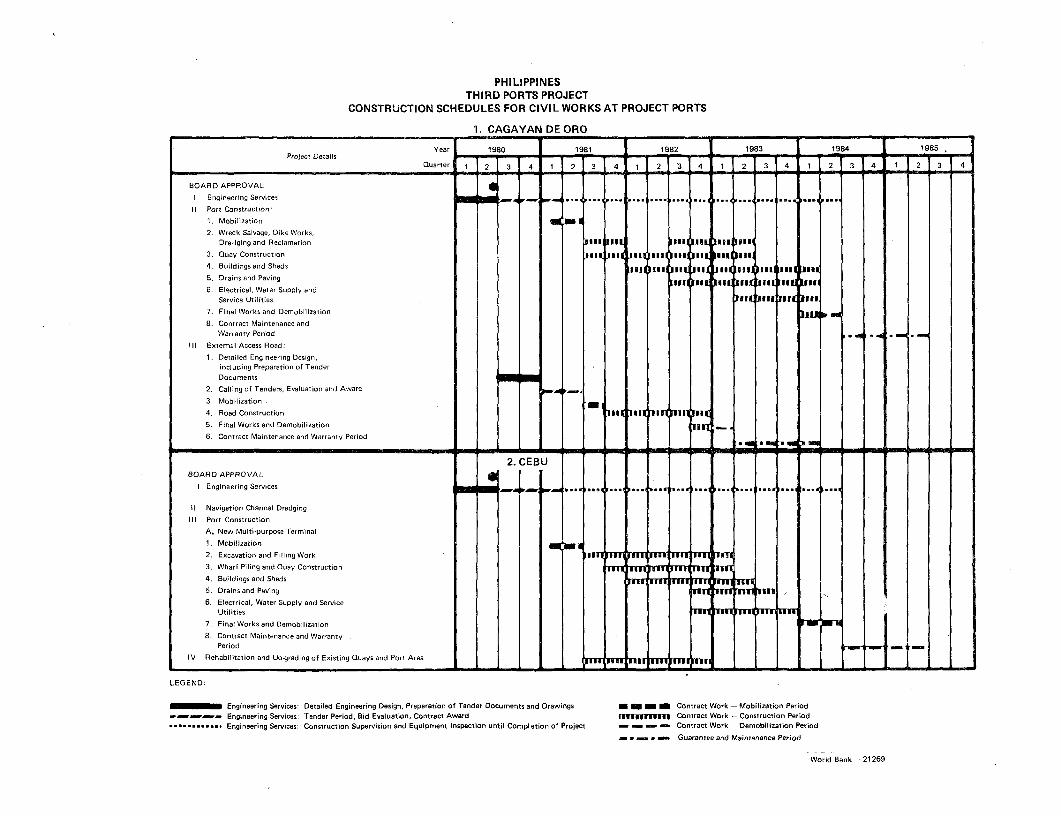
PHILIPPINESTHIRD PORTS PROJECT
CONSTRUCTION SCHEDULES FOR CIVIL WORKS AT PROJECT PORTS
1. CAGAYAN DE ORO
Year 1980 1981 1982 1983 1984 1985Project Details ---- --
Quarter 1 2 3 4 1 2 3 4 _ 2 3 4 1 2 3 4 1 2 3 4_ 1 2 3 4
BOARD APPROVALI Engineering Services _.................. .... ......... ......... ... ..... ........
1 Port Construction
1. Mobilization
2. Wreck Salvage, Dike Works,Dredging and Reclamation fi 9fi Billf Ni all Big
3. Quay Construction ili Jif 11 sol fff 11f IUI
4 Buildings and Sheds IIf *fll 9iii m [loll
5. Drains and Paving Sl f *, II* 1 (, *u J
6. Electrical, Water Supply andService Utilities 1IRIDIf1 poll
7. Final Works and Demobilization br e
8. Contract Maintenance andWarranty Period .: ._ . _
Ill External Access Road:
1. Detailed Engineering Design,including Preparation of TenderDocuments
2. Calling of Tenders, Evaluation and Award
3. Mobilization . m4. Road Construction IS SI S I t5. Final Works and Demobilization 11B. Connract Maintenance and Warranty Period
2. CEBUBOARD APPROVAL
I Engineering Services _, I. ... ... ...
B Navigation Channel Dredging
Ill Port Construction
A. New Multi-purpose Terminal
1. Mobilization2. Excavation and Filling Work l m l nn m 7T 3. Wharf Piling and Quay Construction ml IT11 [m In4. Buildings and Sheds In rrr m in m n
5. Drains and Paving m lt ev .6. Electrical, Water Supply and Service
Utilities l lT ui m T Ii7. Final Works and Demobilization
8. Contract Maintenance and WarrantyPeriod - -
IV Rehabilitation and Upgrading of Existing Quays and Port Area _ In _n 11__. _1_
LEGEND:
Engineering Services: Detailed Engineering Design, Preparation of Tender Documents and Drawings Contract Work - Mobilization PeriodEngineering Services: Tender Period, Bid Evaluation, Contract Award r,fuggnujM Contract Work - Construction Period
.---------- Engineering Services: Construction Supervision and Equipment Inspection until Completion of Project - _ _ - Contract Work - Demobilization Period_ . _, _ Guarantee and Maintenance Period
World Bank -21269

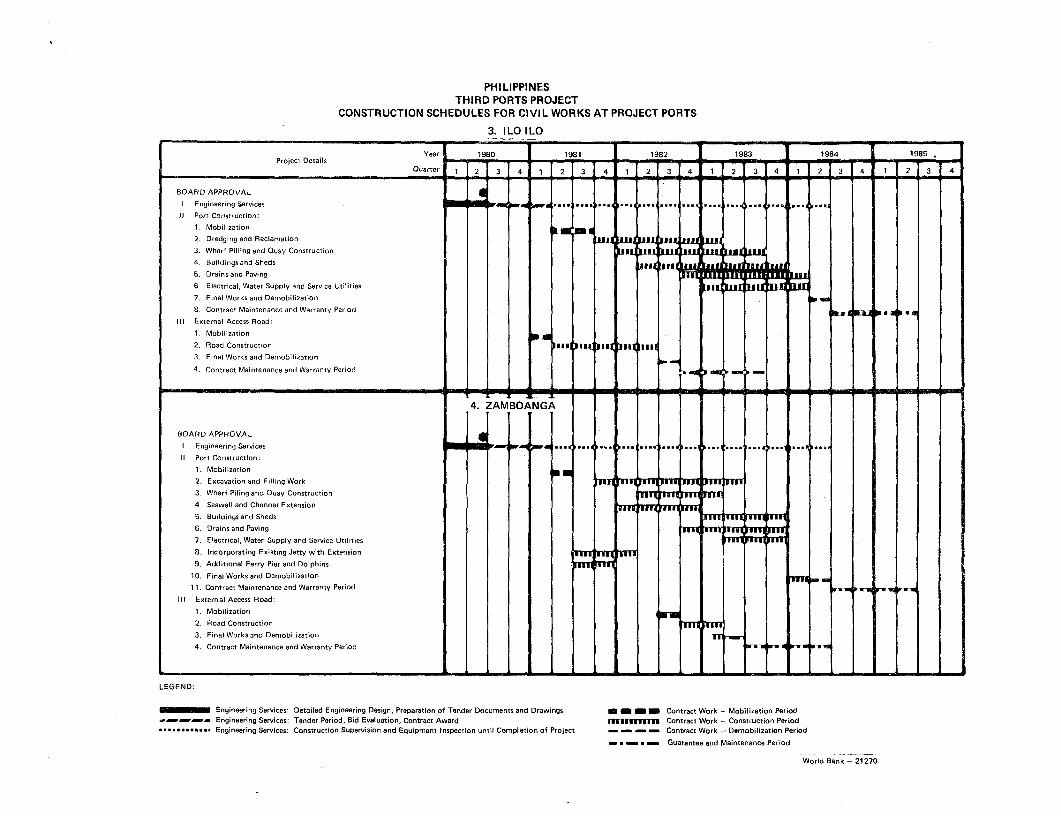
PHILIPPINESTHIRD PORTS PROJECT
CONSTRUCTION SCHEDULES FOR CIVIL WORKS AT PROJECT PORTS
3. ILOILO
Year 1980 1981 1982 1983 1984 1985Project Details -_ _ _ _ _
Quartel 1 2 3 4 1 2 3 4 1 2 3 4 1 2 3 4 1 2 3 4 1 2 3 4
BOARD APPROVAL
I Engineering Services _ . . . .. . ...11 Port Construction:
1. Mobilization _2. Dredging and Reclamation. _ nu llt|J " 0 MX
3. Wharf Pilling and Quay Construction 9fi" lJI til lu Us4. Buildings and Sheds l E.5. Drains and Paving I Imlm ik S. Electrical, Water Supply and Service Utilities iUL17. Final Works and Demobilization l up
S. Contract Maintenance and Warranty Period R * W t 1 a
IIl External Access Road:
1. Mobilization
2. Road Construction ii. *9 i 1 19 I3. Final Works and Demobilization
4. Contract Maintenance and Warranty Period _
- ----- mm~~~~~~-- m4 ---- 4. ZAMBOANGA
BOARD APPROVAL
I Engineering Services 0$~' pw- ... ...... 4 . ... I i, ... I I,... ....11 Port Construction:
1. Mobilization 'on
2. Excavation and Filling Work l j Fogel.
3. Wharf Piling and Quay Construction
4. Seawall and Channel Extension
S. Buildings and Sheds llilklll T m16. Drains and Paving [m M T VW7. Electrical, Water Supply and Service Utilities
8. Incorporating Existing Jetty with Extension
9. Additional Ferry Pier and Dolphins
10. Final Works and Demobilization Tm
11. Contract Maintenance and Warranty Period
Ill External Access Road:
1. Mobilization2. Road Construction ] I |T3. Final Works and Demobilization Tr4. Contract Maintenance and Warranty Period
t J~~~~~~~~~~ ELI'Tl I 11__M__ LEGEND
Engineering Services: Detailed Engineering Design, Preparation of Tender Documents and Drawings 1 Contract Work -Mobilization PeriodEngineering Services: Tender Period. Bid Evaluation, Contract Award omIn Contract Work - Construction Period
............. Engineering Services: Construction Supervision and Equipment Inspection until Completion of Project - Contract Work - Demobilization Period
_ . _ . _ Guarantee and Maintenance Period
World Bank -21270

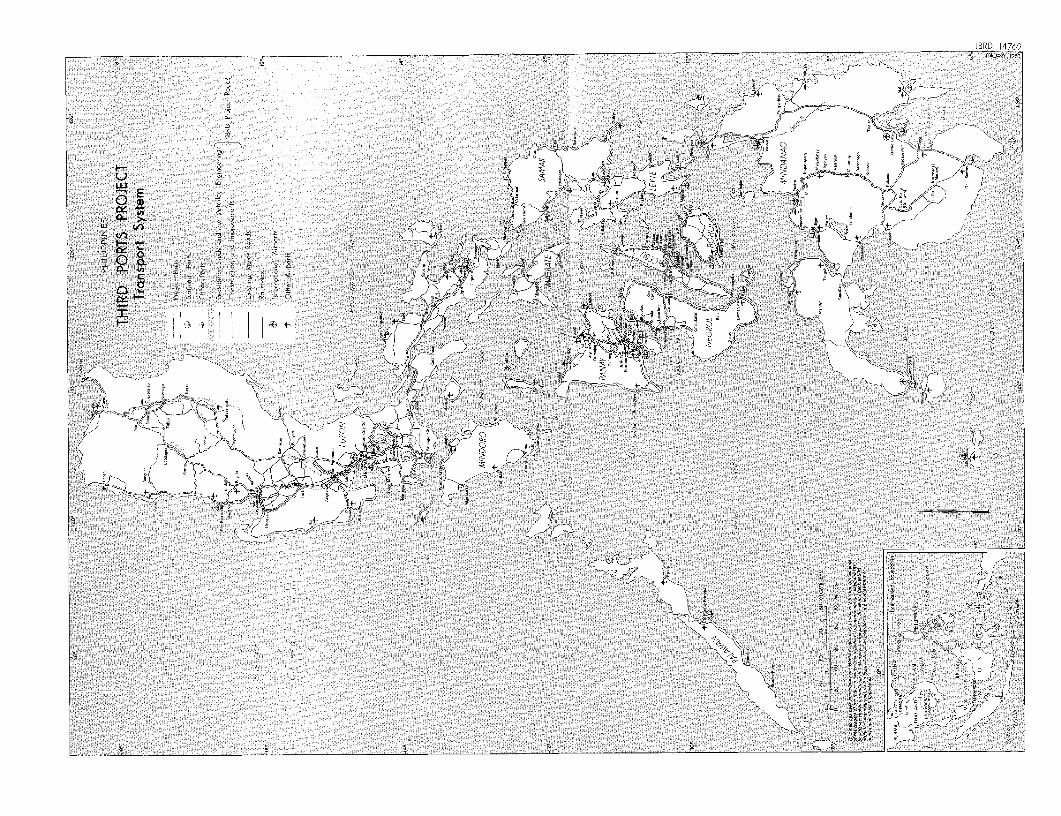
x °@ ¢ N b C , t SE~~~~~~~~~~~~~~~~~~~~~~~~~~~~~~~~~~~~~~~BWJRD 1479
~~~~~~~~~~~~~~~~~~~~~~~~~~~~~~~~~~~~~~~~~~i i) i ~ 4 ;~ ~rX9 1"_
| ; ,xf X ; |~~~~~~~~~~~~~~~~~~~~~~~~~~~~~~~~~~~~~~~~~~~~~~~~~f
L U Gmfff<,i
_ O ood ,i
ui 7< , 8g4 3 .2 _
k '>'v+ X1i b

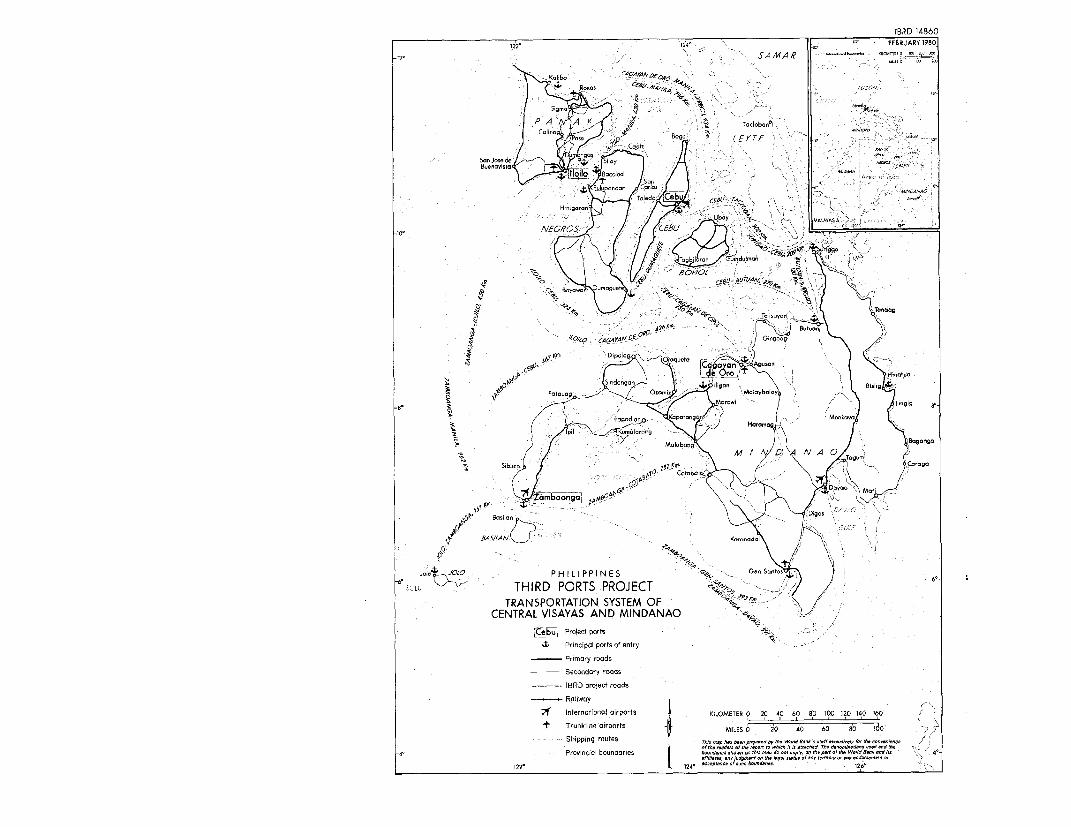
IBRD 14860122° 12° . FEBRUARY 1980-12°
' '' SAMA,R - . ,G
S.,b G !217AYAN,- , - 10
SonA toed'g < -: : z
Poss, O~ Bogo ~ I E YTE 0
Bu ... st 04 Sio1,000
Son~~~~b
; lugoroon fCarlo. 00004040 .v. A#A
. . -s; ! ~Toleo o Ce CE/JI ro- . t . > ,,
o-~~~~~~~~~~~~~~~~~~~~~~~~~~~515 ,V , AIEGR'OS
4'~~~~~ 0 - O<. Tolsyn Tdc
k ~~~~~'01- j2A6A O° D \ 7 Kr Dipoi.g ~ ~ ~ ~ ~ ~ enr
CE D1polog roqoeto -- .4'. | md
-0 50 S)odangon dcrrmof
J |ooop C ola bpio Moloy r M J
pCo BBagonga' < °$ '
M.1.1bon SAS8EAA/<J Kor0nrdaSib4o p950 otbts DSo' o
,o@ -- CJ zA -T NBAS SAASTE GOF 6'
CENTRAL VISAYAS AND MINDANAOCeu Project ports -
41 Principal ports of entry -- Primary roads
Secondory roras
IBRD project roads
Railway
in' sternJianosl airports KILOMETER 0 20 40 60 80 100 120 140 160t Trunkline airports r- MILCO o 2 60 80 io0
-- Shipping routes Tm00mp ns o.n p.d bro. word .o sozrroi,mnr a r n.nienc rj o0,,d-r 0t.pnn h,Oh 1-00t00WO. 700 d-.Wono. -,oe.n1d-4 ~. Provincial bounorsies 40,n ,esdoooOro npO,,,. d o - '
122- 124, o 010000600040,0 126.


P HI LI PPI NE S
THIRD PORTS PROJECTPORT OF CAGAYAN DE ORO EXPANSION
Pr"l-us ,-o t ( Ports, Zt~Loo 93q DH) <|/| \(r
Propos-d Th,Rd ̀orts P-0 /CO f c\ A ( /
* Fuiure expons,on / L i// o Fd S j\~ IC2Lf5ECTbN
Proposd f enr.s f-
'I Deptn .oo.ours D mele-s \NE/NCFTt
0 ITT 200
EST IN I ERS
Os~~~~~~~~~~~~~~~~~~~~~~~~OE
TRANSIT~ ~ ~ TRIAI
F' *~~~~~~~~~~~~R E
- I~~~~~~R k O* A
W \ q q 2 t/ /~~~~~~~~~~~~~~//FF
IATE D> ; CXXib
C F r Cw,.)N FR
0 t 0 fAlf lMt j FCARiGO MA NG5|
[' * n- --.
CigArs~~~~~~~~~~~t \F 005FGEF FOAE|12ali
C \ \ '\a \tA f , lRESID.' Al NPAVE
C-..-~ -d C
\ ~ ~~~ ~ ~~~~~~~~~~~ \\ I85 1° t OTIE R : _{
\, 9 y < X ; [ARG() R , , _~~~
\\f 1 _ f S j
.\ , . I I I I l j~~~~~/
EE51Den' Al t t t UNPAVED | l ' | \~~~~~X
Cont zmer ond . I I l l l . ;~~~~~~~~~~~~~~A
got ndoffce \ J l x
=-Neenore' 4 - XX /\\/N\\\guj\~~~~~~4
o 7 i t | < y---'~~~~~~xfi tV # #~~

I

IBPR 14770
P,, I L bIRAPI 1E90PHILIPPINES 7 >,<
THIRD PORTS PROJECT .AX 7 \
PORT OF CEBU EXPANSION
" fx slotg port irra-o' tt'z '5 >5 ' F po-d pr-j -cr orop ',
ttFotr 0 Oooloporerl r0
7 <k f >'> o
PropoSed rer med area
Rprp-sef fences eS.'SO
0--. Depth -orlo,rs i merOrs \,'
Por met,r of dredged oranol c' cO A
\ 7X OD \ oY -r, 5
GO 2? 300 400 ,- ) '. "
A ~~~~~~~~~~~~~~~~~~~~~~~~~~~~~0 >9 A -
M_ytRS _
"a P~ '
-co >,o, g
<~~~~~~~'V>0
-
9> ~~~~~~or>~~~~~ --Ž ,-~ ~ ~ ~ ~~~~7
C >~~~ 5,0 A>~ EN
At '~~~~~~~~~~~~~~~~~~~~~~~~~~~~~~~ <'~~~~~~~~~~~~~~~F,'
>7> oaa~~d k -/ -- > ~ 7'~3~S~ ~i -,/
4k~~~~~~~rap»O"o"opO
lb.1 "IT~~~~Popoo>,»o0Osr>,

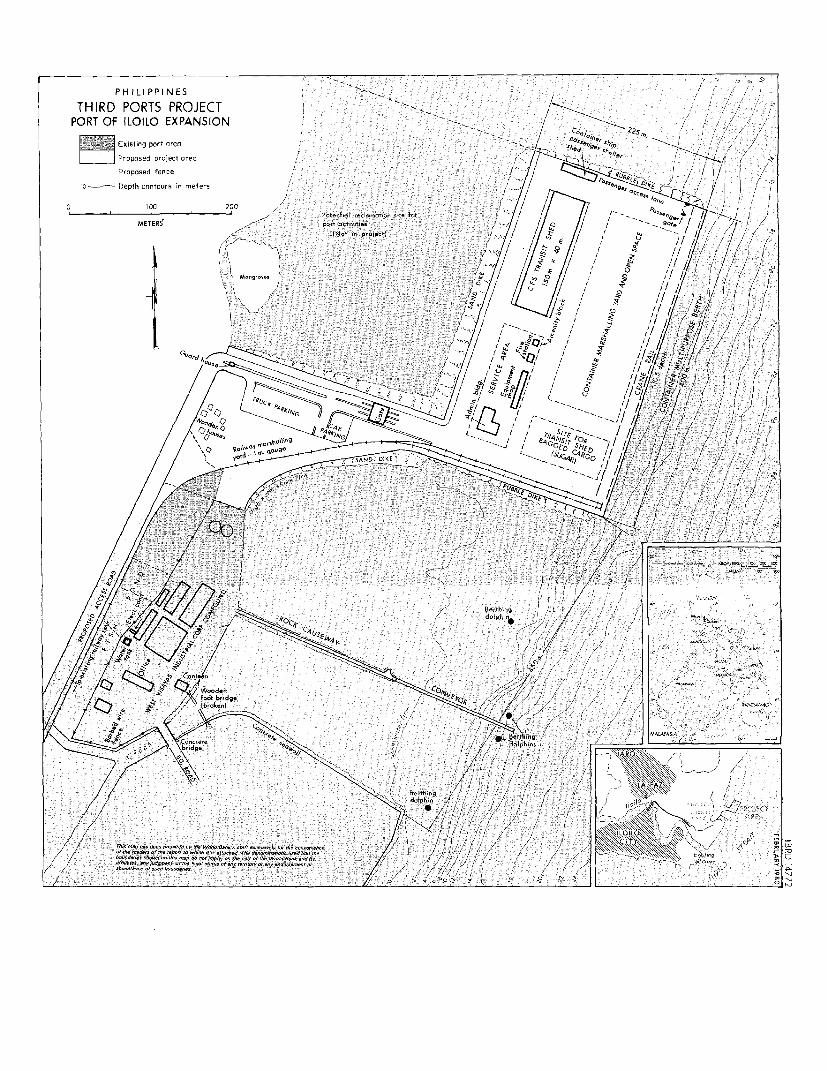
P H I L I P P I N ES
THIRD PORTS PROJECT - /7/PORT OF ILOILO EXPANSION
37TT- Existing port area -. 9,P/
Proposed project areaProposed fence /
ic --- Depth contours in reters / , e
0 lG200 0C
5 1o l7J 0 2 0 0 , P o te n tia l re lam. a tio n site for lrMETERf Post .ctiriti., ,!-r ,e- re' 1 /
ft-tt in er-iecti
2~~~~~~~~~~~~~~~~~~~~~~~~~~~~~~~~~~~~~~~~2
GEL) S'VE)0I (I
1~~~~~~~~~~~~~~~~~~~~~~~-2 / 7 _
00~~~~~~_ ~ ~ 0 1//~~/~
g A arr.eplsrorrscermun~ ~ ~ ~ ~ ~ ~ ~ ~ ~~~~~~~~~~~~~i7 /q/XjX> / | I' ' // c 4 =, o ¢.9 r S Z v/ / 7/ 7-_/,, /
b~ ~ ~ ~ ~ ~ ~ ~ ~ ~~~~~~~~~~~~/)/ ///"
B hrg~~~~~~~~~~~~./on 0 9 9
g.rthang / / 0' *' / /(
0'' 7 / 7~~~~~~~~00
/1 // / \ 9h~~~~~~~~~~~~~~~~~~~~~~~~~~~~~~~~~~~~~~~~~~~~~~~~~~~~~~~~~~~~~ ~~~~~~~~~~ -~~~~~I"01Tha h. ""IW b I 0. Wdd B.. .. 'r -N-', M.~ ~ ~ ~~~~/97/ 7// I IMOti -m An n srOsao rrewres.rtr arssr nrecr'r,rt '' / \ \ \<

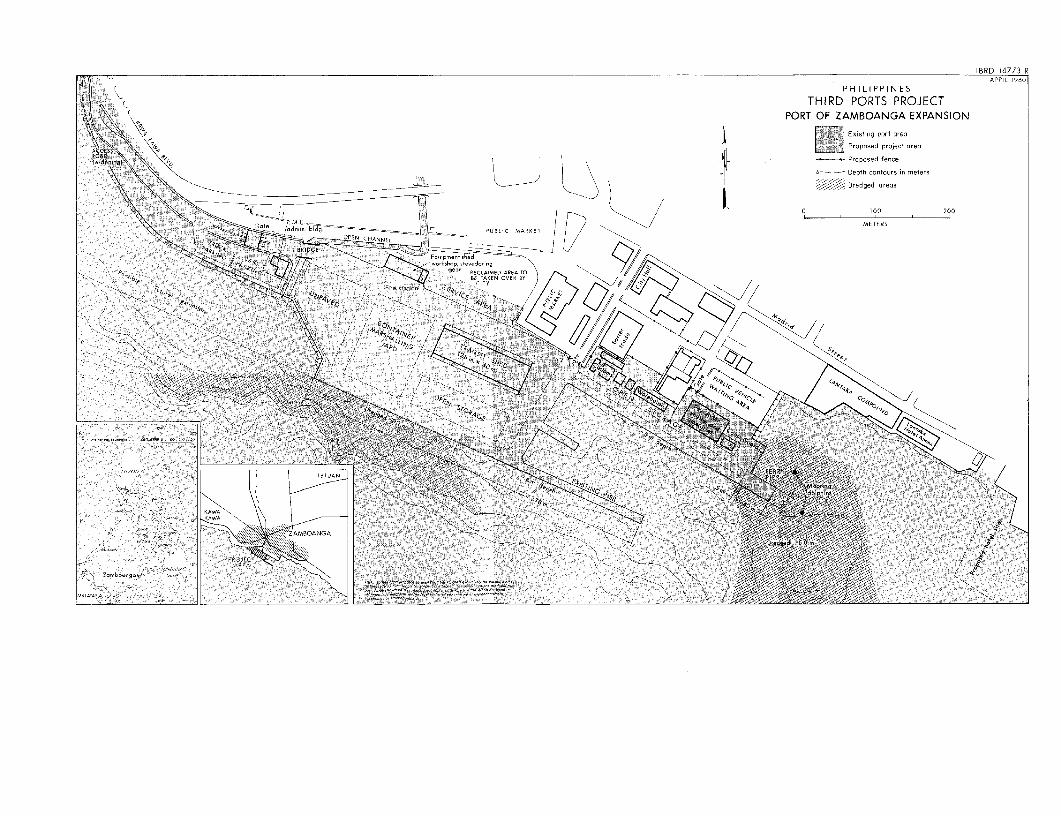
I BRD 14773RAFu L 1980
THIRD PORTS PROJECTPORT OF ZAMBOANGA EXPANSION
K Enisting port area
I ~~~~~~~~~~~~~~~~~~~~~~~~~~~~~~~~~~~~~~~~~~~~~~~Proposed project area
ard~~~~~~~~~~~~n~~~~~~ngl I iii- ~~~~~~~~~~~~~~~~~~~~~~~~~~~~~Proposed fenceJ1t ~ ~ ~ ~~~ - Depth Contours in m,eters
____ - <- ~~~~~~~~~~~~~~~~~~~~~~~~~~~~Dredged areas
co ~~~~~~~~~~~~~~~~~Ida. ~~~~~~~~~~~~~~~~~~~0 100 200
P-U PULI RE METERS
4e~~~ '4'-~~~~~ aear R~~~~~~~CLA,MCO~~~E AREA TO
Fi,.~~~~~~~~~~~~~c
-. >~~~~~' 'CA~~~~~~ -, Fire ~~~~~~COA, enC
'-j ~ ~ ~ ~ ~ ~ ~ ~ ~ , p -
~~~ *0 kp~~~~~~~~~~~~~ ~~~~--0,"
i'UANO
L _________________________________________~~~~~~~~~~~~~~~~~~~~
eeLe,~~~~~~~~~~~~~~KAWA ~ ~ ~ ~ ~ ~ ~ ~ ~ ~ ~ ~ ~ ~ ~ ~ ~ ~ ~ ~ ~ ~ ~ ~ ~~~~~<
CA COSIC ~0.,,,, ~ X0r5D•4t500r5§A