Embed Size (px)
Citation preview

Pakistan
Clean Fuels
ESM246
~~~. ~
_ ~ ~ ~ ~ ~ ~ ~ ' ______J___
_~~~~~~~~~~~~~~~~~~~~~~~~~~~~~~~~~~~~~~~~~~~~~~~~~~~~~f ,.1- _us,= -._
' m -- , -,;-'' t ';.'
Energy
Sector
Management
Assistance
Programme
L~AAA AD6J,LY1 Ii Report 246/01
October 2001
Pub
lic D
iscl
osur
e A
utho
rized
Pub
lic D
iscl
osur
e A
utho
rized
Pub
lic D
iscl
osur
e A
utho
rized
Pub
lic D
iscl
osur
e A
utho
rized

JOINT UNDP / WORLD BANKENERGY SECTOR MANAGEMENT ASSISTANCE PROGRAMME (ESMAP)
PURPOSE
The Joint UNDP/World Bank Energy Sector Management Assistance Programme(ESMAP) is a special global technical assistance program run as part of the World Bank'sEnergy, Mining and Telecommunications Department. ESMAP provides advice togovernments on sustainable energy development. Established with the support of UNDPand bilateral official donors in 1983, it focuses on the role of energy in the developmentprocess with the objective of contributing to poverty alleviation, improving living conditionsand preserving the environment in developing countries and transition economies.ESMAP centers its interventions on three priority areas: sector reform and restructuring;access to modern energy for the poorest; and promotion of sustainable energy practices.
GOVERNANCE AND OPERATIONS
ESMAP is governed by a Consultative Group (ESMAP CG) composed of representativesof the UNDP and World Bank, other donors, and development experts from regionsbenefiting from ESMAP's assistance. The ESMAP CG is chaired by a World Bank VicePresident, and advised by a Technical Advisory Group (TAG) of four independent energyexperts that reviews the Programme's strategic agenda, its work plan, and itsachievements. ESMAP relies on a cadre of engineers, energy planners, and economistsfrom the World Bank to conduct its activities under the guidance of the Manager ofESMAP, responsible for administering the Programme.
FUNDING
ESMAP is a cooperative effort supported over the years by the World Bank, the UNDPand other United Nations agencies, the European Union, the Organization of AmericanStates (OAS), the Latin American Energy Organization (OLADE), and public and privatedonors from countries including Australia, Belgium, Canada, Denmark, Germany, Finland,France, Iceland, Ireland, Italy, Japan, the Netherlands, New Zealand, Norway, Portugal,Sweden, Switzerland, the United Kingdom, and the United States of America.
FURTHER INFORMATION
An up-to-date listing of completed ESMAP projects is appended to this report. For furtherinformation, a copy of the ESMAP Annual Report, or copies of project reports, contact:
ESMAPc/o Energy and Water
The World Bank1818 H Street, NW
Washington, DC 20433U.S.A.

Pakistan Clean Fuels
October 2001
Joint UNDP/World Bank Energy Sector Management Assistance Programme(ESMAP)

Copyright © 2001The International Bank for Reconstructionand Development/THE WORLD BANK1818 H Street, N.W.Washington, D.C. 20433, U.S.A.
All rights reservedManufactured in the United States of AmericaFirst printing October 2001
ESMAP Reports are published to communicate the results of theESMAP's work to the development community with the least possibledelay. The typescript of the paper therefore has not been prepared inaccordance with the procedures appropriate to formal documents.Some sources cited in this paper may be informnal documents that arenot readily available.
The findings, interpretations, and conclusions expressed in thispaper are entirely those of the author(s) and should not be attributed inany manner to the World Bank, or its affiliated organizations, or tomembers of its Board of Executive Directors or the countries theyrepresent. The World Bank does not guarantee the accuracy of the dataincluded in this publication and accepts no responsibility whatsoeverfor any consequence of their use. The Boundaries, colors,denominations, other information shown on any map in this volume donot imply on the part of the World Bank Group any judgement on thelegal status of any territory or the endorsement or acceptance of suchboundaries.
The material in this publication is copyrighted. Requests forpermission to reproduce portions of it should be sent to the ESMAPManager at the address shown in the copyright notice above. ESMAPencourages dissemination of its work and will normally givepermission promptly and, when the reproduction is for noncomnmercialpurposes, without asking a fee.
"ESMAP Values your Feedback
If you have found this report useful, or would like toprovide comments on our reports and services, please
log on to our website at www.esmap.org and leaveyour feedback. In this way we can better understandour audience's needs and improve the quality of our
knowledge products. Thank you.
ESMAP Management"


Contents
Acknowledgments .......................................................... vii
Abbreviations and Acronyms .......................................................... viii
Units of Measure .......................................................... x
Glossary of Terms .......................................................... xi
Executive Summary .......................................................... 1
Clean-Fuels Workshops and Analysis ............................................................. ITransport Fuel Tax Policy ............................................................. 5
1. Background .......................................................... 9
The Link Between Fuel, Transport, and the Environment ...................................................... 10Lead ............................................................ 10Particulate Matter ............................................................ 13Other Pollutants ............................................................ 15Fuel Quality ............................................................. 16Fuel Quality Trend in Neighboring Countries and Implications for Pakistan .................. 19Downstream Petroleum Sector in Pakistan ............................................................ 20
Workshop ............................................................ 21Transport Fuel Tax Policy ............................................................ 22Structure of the Report ............................................................ 23
2. The Downstream Petroleum Sector .......................................................... 25
Role of the Government ............................................................ 25Product Pricing ............................................................ 26Economic Supply Zones ............................................................ 29
Other Agencies ............................................................. 29Refinery Configuration ............................................................ 30Selection of Crude -Oil ............................................................ 30Crude and Product Pipelines ............................................................ 31Overall Demand and Supply ..................................................................................... ............. 32
Gasoline ................................ 32Diesel ............................... 34Fuel Oil .35........ ................................... 35
Fuel Quality . 35
Hii
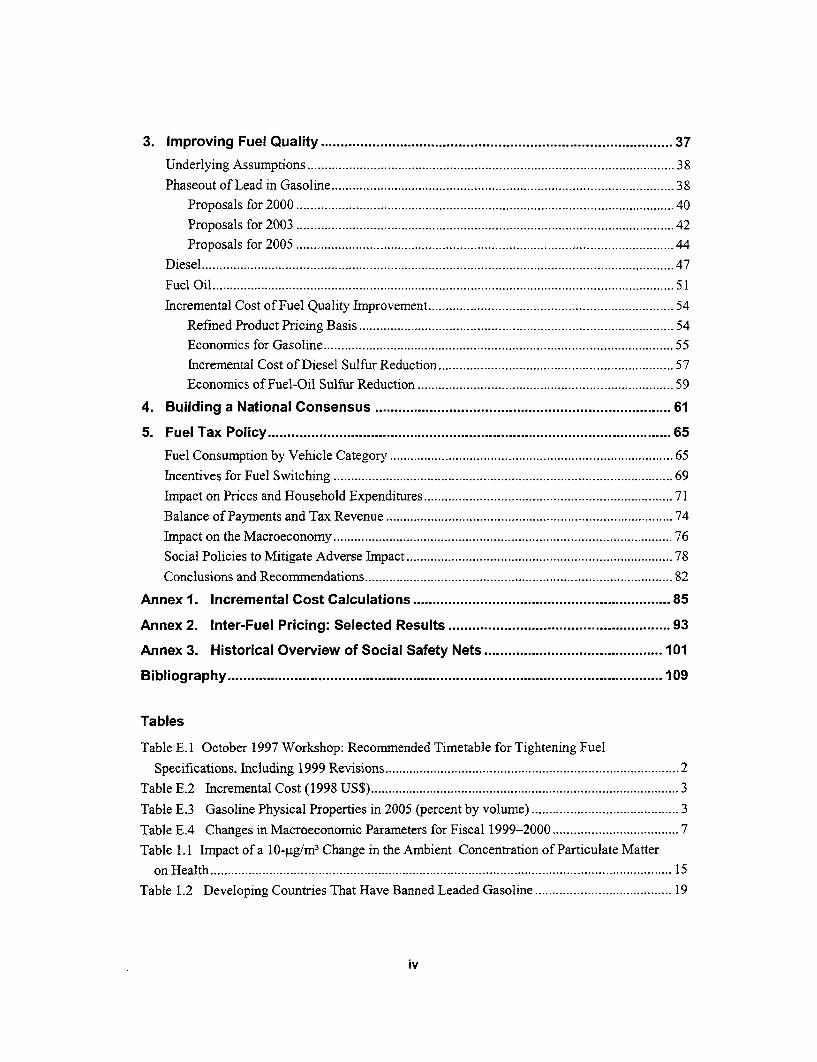
3. Improving Fuel Quality ................................................................. 37
Underlying Assumptions .................................................................... 38
Phaseout of Lead in Gasoline ................................................................... 38Proposals for 2000 ................................................................... 40Proposals for 2003 .................................................................... 42Proposals for 2005 ................................................................... 44
Diesel ................................................................... 47
Fuel Oil .51
Incremental Cost of Fuel Quality Improvement ................................................................... 54Refined Product Pricing Basis .................................................................... 54Economics for Gasoline ................................................................... 55
Incremental Cost of Diesel Sulfur Reduction ................................................................... 57Economics of Fuel-Oil Sulfur Reduction ................................................................... 59
4. Building a National Consensus . ................................................................. 61
5. Fuel Tax Policy ................................................................. 65
Fuel Consumption by Vehicle Category .................................................................... 65Incentives for Fuel Switching ..................................................................... 69Impact on Prices and Household Expenditures ................................................................... 71Balance of Payments and Tax Revenue ................................................................... 74Impact on the Macroeconomy ................................................................... 76Social Policies to Mitigate Adverse Impact .................................................................... 78Conclusions and Recommendations .................................................................... 82
Annex 1. Incremental Cost Calculations ................................................................. 85
Annex 2. Inter-Fuel Pricing: Selected Results ........................................................ 93
Annex 3. Historical Overview of Social Safety Nets . ............................ 101
Bibliography ................................................................. 109
Tables
Table E.1 October 1997 Workshop: Recommended Timetable for Tightening FuelSpecifications, Including 1999 Revisions .................................................................... 2
Table E.2 Incremental Cost (1998 US$) ................................................................... 3
Table E.3 Gasoline Physical Properties in 2005 (percent by volume) .......................................... 3Table E.4 Changes in Macroeconomic Parameters for Fiscal 1999-2000 .................................... 7Table 1.1 Impact of a 10-p_g/m 3 Change in the Ambient Concentration of Particulate Matter
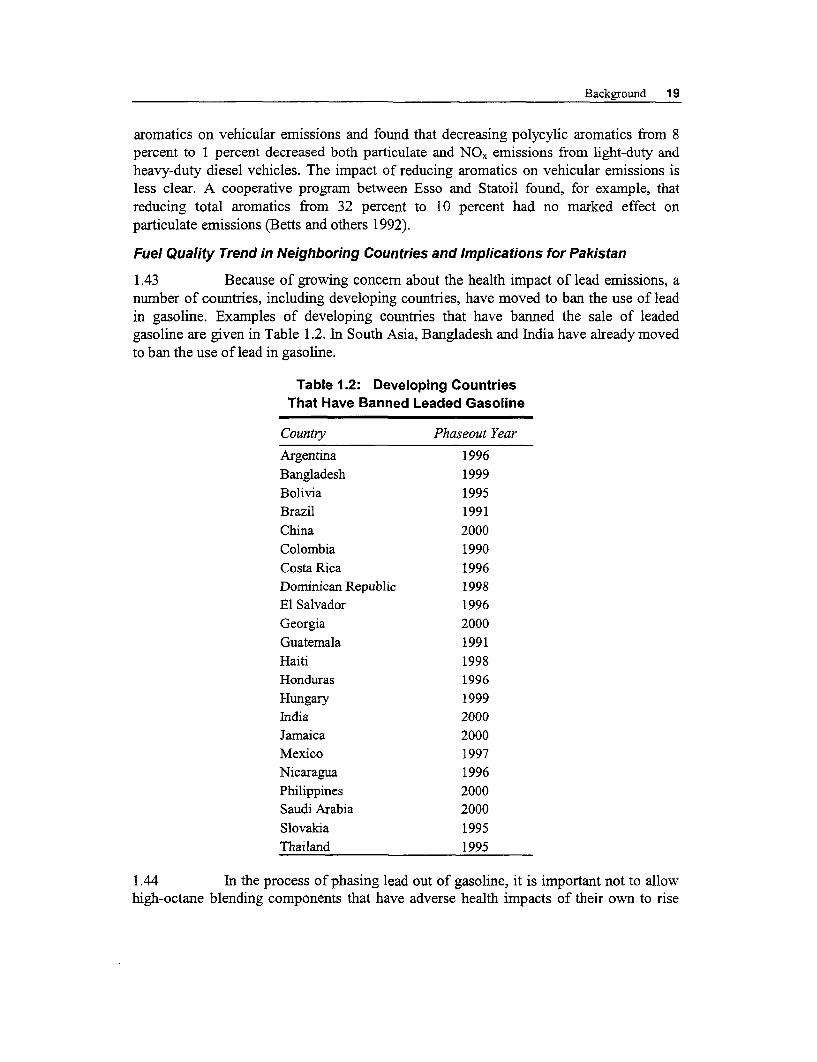
on Health .................................................................... 15Table 1.2 Developing Countries That Have Banned Leaded Gasoline ....................................... 19
iv
Table 1.3 October 1997 Workshop: Recommended Timetable for TighteningFuel Specifications, Including 1999 Revisions ............................................. 21
Table 2.1 Retail Prices (Rs per Liter) ............................................................. 27Table 2.2 Economic Supply Zones Post-PARCO startup ............................................................ 29Table 2.3 Configurations and Capacities of Refineries in Pakistan (thousand barrels per day) .30Table 2.4 Qualities of Low-Sulfur Crudes ............................................................. 31
Table 2.5 Pakistan Gasoline Demand Forecasts by Region (thousand tons per year) ................ 33Table 2.6 Pakistan Diesel Demand Forecasts by Region, 2000-2005 (thousand tons per year) 34Table 2.7 Pakistan Fuel Oil Demand Forecasts, by Region (thousand tons per year) ................ 35
Table 2.8 Middle Distillate Production ............................................................. 36Table 2.9 Fuel Oil Production ............................................................. 36Table 3.1 Scenarios Studied ............................................................. 37Table 3.2 Quality Parameters Used for Gasoline Blending Options ........................................... 38Table 3.3 Leaded and Clear RON Requirements ............................................................. 39Table 3.4 Refinery Gasoline Production in Pakistan, 1999 (Base Case) .40
Table 3.5 Refinery Gasoline Production, 2000 .41Table 3.6 Physical Properties of Gasoline in 2000 .42Table 3.7 Refinery Gasoline Production in 2003 .43Table 3.8 Physical Properties of Gasoline in 2003 .44Table 3.9 Refinery Gasoline Production in 2005, No Isomerization .45Table 3.10 Physical Properties of Gasoline in 2005, No Isomerization . .46Table 3.11 Refinery Gasoline Production in 2005 with Isomerization . .46Table 3.12 Impact of Isomerization on Gasoline Physical Properties in 2005 . .47Table 3.13 Specification Blending for Diesel, 2000 .. 48Table 3.14 Specification Blending for Diesel, 2003 .. 49Table 3.15 Specification Blending for Diesel, 2005 .. 50
Table 3.16 Fuel Oil Pools, 2000 .. 52Table 3.17 Fuel Oil Pools, 2003 .. 53Table 3.18 Fuel Oil Pools, 2005 .. 53Table 3.19 Gasoline Quality Improvement: Free-Market Pricing . ............................................. 56Table 3.20 Gasoline Quality Improvement: Cost to Pakistan Refineries . . 56Table 3.21 Costs of Isomerization in 2005 ........................................................ 57Table 3.22 Cost of Reducing Sulfur in Diesel Fuel .......................................... 58Table 3.23 Cost of Reducing Sulfur in Fuel Oil ....................................................... 59Table 4.1 Workshop Programs ....................................................... 61Table 5.1 Motor Vehicle Population in Pakistan ('000) ....................................................... 66Table 5.2 Results of Survey of 20 Refueling Stations in Karachi and Lahore ............................ 66Table 5.3 Survey of 150 Vehicle Owners in Karachi, Lahore, and Peshawar ............................ 67Table 5.4 Intra- and Inter-City Fuel Consumption ('000 metric tons) ........................................ 68
v

Table 5.5 Price Adjustments undeT Different Scenarios ............................................................. 71Table 5.6 Annual Household Private Transport Expenditures, by Income Quartile (rupees) .... 73
Table 5.7 Changes in Annual Household Expenditure in Scenario 1 ......................................... 73
Table 5.8 Changes in Annual Household Expenditure in Scenario 2 ......................................... 74
Table 5.9 Demand Elasticities for Gasoline and Diesel ............................................................. 75Table 5.10 Consumption of Gasoline and Diesel in Two Scenarios and Impact on Balance
of Payments and Tax Revenue in Fiscal 1999-2000 ................................................................. 75
Table 5.11 Changes in Macroeconomic Parameters for Fiscal 1999-2000 ................................ 77Table 5.12 Evaluation of Social Safety Net Programs ................................................................ 80Table 5.13 Impact of Changes in GST ................................................................... 82
Table A1.1 Gasoline Prices in Pakistan (1998 US$ per ton) ....................................................... 86Table A1.2 Diesel Prices in Pakistan (1998 US$ per ton) ........................................................... 86
Table A1.3 Fuel Oil Prices in Pakistan (1998 US$ per ton) ........................................................ 86
Table A1.4 Gasoline Quality Improvement: Free-Market Pricing .............................................. 87Table A1.5 Gasoline Quality Improvement: Cost to Pakistan Refineries ................................... 88
Table A 1.6 Cost of Installing Isomerization Units ................................................................... 89
Table A1.7 Impact of Isomerization in 2005 ................................................................... 89Table A1.8 Infrastructure Investment Costs for Diesel Sulfur Reduction (1998 US$ million).90Table A1.9 Cost of Diesel Sulfur Reduction ................................................................... 90Table A 1.10 Capital Investment Required for Middle Distillate Hydrodesulfurization ... 91Table Al.1 1 Cost of Fuel-Oil Sulfur Reduction, 1998 US$ million . . 91
Table Al.12 Flue Gas Desulfurization Economics ................................................................... 92Table A2.1 Impact of Fuel Price Changes on Sectoral Price Levels (Percent) ............. ............. 93
Table A2.2 Annual Urban Household Expenditures, by Income Quartile and Sector (rupees). 95Table A2.3 Annual Rural Household Expenditures by Income Quartile and Sector (rupees)... 97
Figures
Figure 1.1 Evolution of U.S. Diesel Particulate Emissions ........................................................ 18Figure 2.1 Regular Gasoline Price Breakdown for NRL/PRL .................................................... 28Figure 2.2 High-Speed Diesel Price Breakdown for NRL/PRL .................................................. 28
Figure 2.3 Demand for Petroleum Products ........................................................ 32Figure 2.4 Imports of Petroleum Products ........................................................ 33
Figure 3.5 Contribution to Sulfur Content of Overall Fuel Oil Pool, 2003 ................................ 52
vi

Acknowledgments
This report presents the results of a "Pakistan Clean Fuels" study undertaken by theEnergy Sector Management Assistance Programme (ESMAP), a joint program of theUnited Nations Development Programme (UNDP) and the World Bank. The financialassistance of the Government of the United Kingdom through ESMAP is gratefullyacknowledged.
The study was conducted under the guidance of Mr. G.A. Sabri, Director General (Oil) ofthe Pakistan Ministry of Petroleum and Natural Resources (MPNR), and Mr. Asif ShujaKhan, Director General of the Pakistan Environment Protection Agency (PEPA). Therefiners in Pakistan, fuel marketers, and the Hydrocarbon Development Institute ofPakistan (HDIP) contributed significantly to the analysis of clean fuels options carried outby Mike Webster, Phil Hunt, and Rizwan Sheikh of Chem Systems (U.K.) and presentedin Chapters 2 and 3. Professor Paul Stevens of the Centre for Energy, Petroleum, andMineral Law and Policy of the University of Dundee contributed to some of thediscussions found in Chapter 2. Hafiz Pasha, Zafar Ismail, Ejaz Rasheed, Alisha Ghaus-Pasha, and Sajjad Akhtar of the Social Policy Development Centre (SPDC) undertook thestudy described in Chapter 5. Historical product prices and production and consumptionfigures in this report were taken from Pakistan Energy Yearbook 2000, published jointlyby HDIP and MPNR.
This report was prepared by Masarni Kojima of the Policy Division, Oil, Gas andChemicals Departnent of the World Bank. The principal members of the ESMAP tearnwere Masami Kojima (task leader) and Robert Bacon of the Policy Division, Oil, Gas andChemicals Department. Other participants in this study from the World Bank includedRashid Aziz, Waqar Haider, Tjaarda Storm van Leeuwen, and Marc Heitner and of theSouth Asia Energy Unit; and Aziz Bouzaher of the South Asia Environment Unit. Thecomments of the reviewer, Kenneth Gwilliam of the Urban Development and TransportDepartment of the World Bank, and the editorial assistance provided by Chris Marquardtare gratefully acknowledged.
vii

Abbreviations and Acronyms
AJK Azak, Jammu, and KashmirAQIRP (U.S. Auto/Oil) Air Quality Improvement
Research ProgramARL Attock Refmery, LimitedASS Atta (wheat flour) Subsidy SchemeBOR Boards of RevenueCCR continuous catalyst regenerationCDC (U.S.) Centers for Disease Control and
PreventionCIF cost, insurance, and freight
CNG compressed natural gasCO carbon monoxide
CONCAWE Conservation of Clean Air and Water inEurope
DG Directorate GeneralEOBI Employees Old Age Benefits Institution
EPEFE European Programme on Emissions, Fuelsand Engine Technologies
ESMAP Energy Sector Management AssistanceProgramme
EU European UnionFBS Federal Bureau of StatisticsFCC fluidized catalytic crackingFGD flue gas desulfurizationFOB free on boardGDP gross domestic productGST general sales tax
HBFC House Building Finance CorporationHBL Habib Bank Limited
HDIP Hydrocarbon Development Institute ofPakistan
HIES Household Integrated Economic SurveyHOBC high-octane blending components
HSD high-speed dieselIFA Individual Financial AssistanceIMF International Monetary Fund
IQ intelligence quotientISPM integrated social policy and macroeconomic
(model)JICA Japan International Cooperation Agency
LP linear progranmmingLPG liquefied petroleum gas
viii

MPNR Ministry of Petroleum and NaturalResources
MTBE methyl tertiary-butyl etherNGO nongovemmental organizationNO2 nitrogen dioxideNO. oxides of nitrogenNRL National Refinery Limited
NRSP National Rural Support ProgramNWFP Northwest Frontier ProvinceOCAC Oil Company Advisory Committee
OEM original equipment manufacturerOMV Offenfuir Mehr Verantwortung
PARCO Pakistan Arab Refinery CompanyPBM Pakistan Bait-ul-Maal
PEPA Pakistan Environment Protection AgencyPIMS Process Industries Modeling System
PM particulate matterPMIo particles with an aerodynamic diameter less
than 10 micronsPM2.5 particles with an aerodynamic diameter less
than 2.5 micronsPRL Pakistan Refinery LimitedPSO Pakistan State OilRVP Reid vapor pressureSBP State Bank of PakistanS02 sulfur dioxideSO, oxides of sulfur
SPDC Social Policy and Development CentreTEL tetra-ethyl leadTSP total suspended particles
UNDP United Nations Development ProgrammeVKT vehicle kilometers traveledVOC volatile organic compoundWHO World Health OrganizationZOT Zulfiqarabad Oil Terminal
ix

Units of Measure
bpsd barrels per stream daydl deciliter
g/cc grams per cubic centimeterg/i grams per liter
GW gigawattkg kilogram
kg/m3 kilograms per cubic meterkm kilometer
kmlh kilometers per hourkPa thousand pascals
ktpa thousand (metric) tons per annumI liter
MON motor octane numberppm parts per millionpsia pounds per square inch absoluteRON research octane number
RONC research octane number clearRs Pakistani rupees
T90 temperature at which 90 percent of the fuel evaporatesktpsd thousand [metric] tons per stream day
tpa (metric) tons per annumvol% percent by volumewt% percent by weight
wt ppm parts per million by weightpig/m
3 mnicrograms per cubic meterpig/dl micrograms per deciliter
ptm micron (one-thousandth of a millimeter)
x
Glossary of Terms
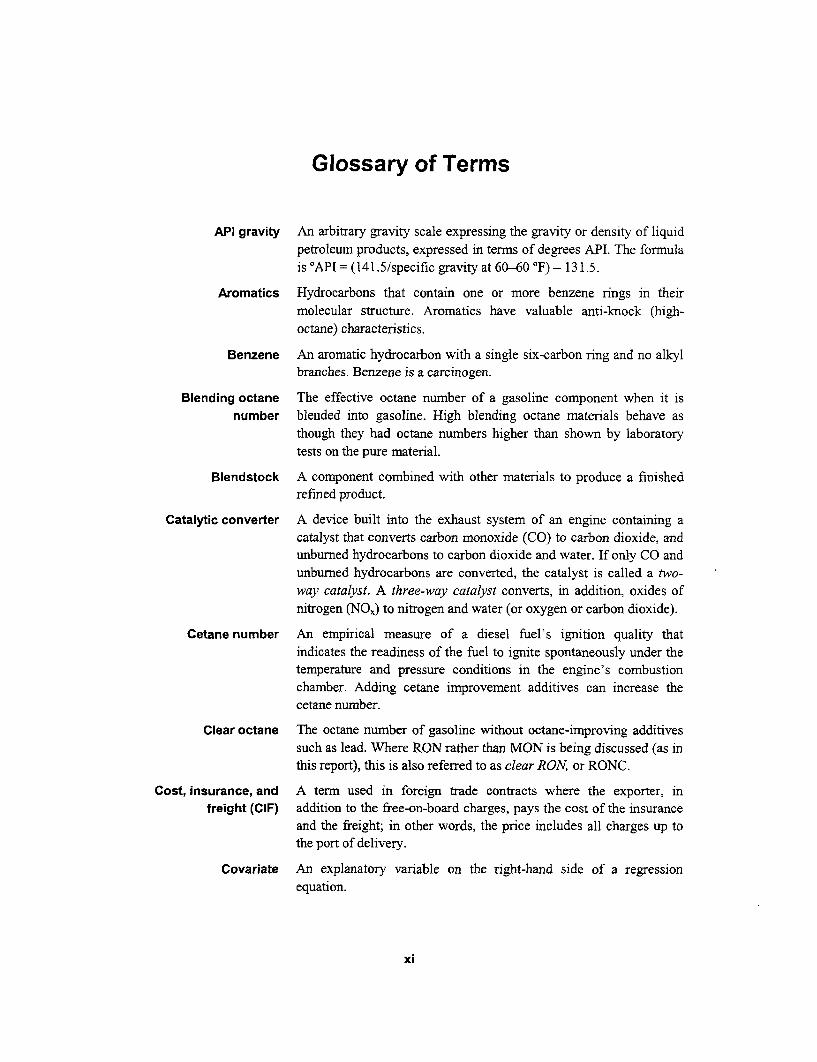
API gravity An arbitrary gravity scale expressing the gravity or density of liquidpetroleum products, expressed in terms of degrees API. The formulais °API = (141.5/specific gravity at 60-60 °F) -131.5.
Aromatics Hydrocarbons that contain one or more benzene rings in theirmolecular structure. Aromatics have valuable anti-knock (high-octane) characteristics.
Benzene An aromatic hydrocarbon with a single six-carbon ring and no alkylbranches. Benzene is a carcinogen.
Blending octane The effective octane number of a gasoline component when it isnumber blended into gasoline. High blending octane materials behave as
though they had octane numbers higher than shown by laboratorytests on the pure material.
Blendstock A component combined with other materials to produce a finishedrefined product.
Catalytic converter A device built into the exhaust system of an engine containing acatalyst that converts carbon monoxide (CO) to carbon dioxide, andunburned hydrocarbons to carbon dioxide and water. If only CO andunburned hydrocarbons are converted, the catalyst is called a two-way catalyst. A three-way catalyst converts, in addition, oxides ofnitrogen (NO,) to nitrogen and water (or oxygen or carbon dioxide).
Cetane number An empirical measure of a diesel fuel's ignition quality thatindicates the readiness of the fuel to ignite spontaneously under thetemperature and pressure conditions in the engine's combustionchamber. Adding cetane improvement additives can increase thecetane number.
Clear octane The octane number of gasoline without octane-improving additivessuch as lead. Where RON rather than MON is being discussed (as inthis report), this is also referred to as clear RON, or RONC.
Cost, insurance, and A term used in foreign trade contracts where the exporter, infreight (CIF) addition to the free-on-board charges, pays the cost of the insurance
and the freight; in other words, the price includes all charges up tothe port of delivery.
Covariate An explanatory variable on the right-hand side of a regressionequation.
xi

Cut point A temperature limit of a cut, which in tum is the portion of crude oilboiling within certain temperature limits.
Diluent Something that dilutes. MTBE, for example, contains no benzene,no sulfur, no aromatics, and no olefins. Adding MTBE thus"dilutes" all other components having benzene, sulfur, aromatics,and olefins.
Elasticity Percent change in quantity caused by a I percent change in price.
Fluidized catalytic A refinery process for converting heavy oils into lighter products,cracking (FCC) including gasoline.
Flash point The lowest temperature (under certain conditions) at which acombustible liquid will give off sufficient vapor to form a flamrnablemixture with air. Denotes the volatility of the product.
Fractionation The separation of crude oil into a number of components accordingto their boiling points.
Free on board (FOB) The basis of an export contract in which the seller pays for sendingthe goods to the port of shipment and loading them on to the ship oraircraft. The seller also pays for the insurance up to this point.
Heavy end The higher boiling point and density fraction of a petroleumfraction, as in the heavy end of diesel.
Hydrocarbons Organic compounds composed of carbon and hydrogen.
Hydroskimming Simple refineries with a reformer to increase octane of the gasolinefraction, but not other conversion process units.
Hydrotreating A refinery process in which a stream is treated with hydrogen toreduce the amount of sulfur, nitrogen, and other heteroatoms, and tosaturate double bonds (for example, in aromatics and diolefins). Theterms hydrotreating, hydroprocessing, and hydrodesulfurization areused rather loosely in the industry.
Hydrodesulfurization Removal of sulfur in a fuel in the presence of hydrogen.
Input-Output Analysis A mathematical procedure that takes account of the interdependenceamong the economy's industries and determines the amount ofoutput each industry must provide as inputs to the other industries inthe economy.
Isomerization A process for increasing the octane of light hydrocarbons byconverting them from straight-chain hydrocarbons to branchedhydrocarbons. Once-through isomerization refers to a processconfiguration where the products are not recycled (product recyclingincreases the octane further).
xii

Motor octane number The octane number of a fuel, determined when vehicles are operated(MON) at high speed or under highway driving conditions.
Naphtha A petroleum fraction in the range of C5 (hydrocarbons with fivecarbon atoms) to 216f degrees Celsius. Naphthas are majorconstituents of gasoline and generally need processing to makesuitable quality gasoline.
Octane number A measure of resistance to self-ignition (knocking) of a gasolinewhen mixed with air in an engine cylinder. The higher the octanenumber, the higher the anti-knock quality of the gasoline. In theUnited States, the word octane, as used at filling stations, refers toan average of MON and RON; it is also called the anti-knock index.Because MON is usually lower than RON, averaging the two resultsin a lower number, typically by 4 or 5. For example, "87 octane" inthe United States corresponds to 91 or 92 RON.
Olefins A class of hydrocarbons that have one double-bond in their carbonstructure.
Oxygenates Any organic compounds containing oxygen. Specifically for thepetroleum industry, oxygenates typically refer to alcohols and ethersused to boost octane or to reduce CO in engine exhausts.
Ozone A colorless gas, it is an allotropic form of oxygen in which themolecule is 03.
Polycyclic aromatics Aromatic compounds with more than one six-membered ring.(polycyclics) Polycyclics are carcinogens. The diesel fraction of FCC product is a
source of polycyclics.
Reformate A high-aromatic, high-octane product made in a reformer and usedto blend motor gasoline or aviation gasoline.
Reid vapor pressure A standardized measure of a fuel's volatility at a specified set of(RVP) conditions, with a higher value indicating a more volatile fuel. RVP
is usually measured in psia (pounds per square inch absolute) or kPa(thousand pascals).
Research octane The octane number of a fuel, determined when vehicles are operatednumber (RON) at low speed or under city driving conditions.
Severity The intensity of the operating conditions of a process unit, indicatedby the product's clear research octane number (RONC) in the caseof reformers.
Sour crude oil A crude oil containing high levels of sulfur.
Slate A crude (or product) slate refers to the mix of crudes (or products)making up the total that a refinery processes (or produces).
xiii

Translog equation Equation in which the dependent variable is regressed against aproduct of logarithms of two or more independent variables.
Tgo TemperatuTe at which 90 percent of fuel evaporates.
xiv

Executive Summary
1. The Pakistan Clean Fuels program was undertaken at the request of theMinistry of Petroleum and Natural Resources (MPNR) and the Ministry of Environment,Local Government, and Rural Development to examine the feasibility of therecommendations made at the Clean Fuels Workshop held in Islamabad in October1997.1 More specifically, the workshop participants proposed a timetable for phasing leadout of gasoline, increasing the average gasoline octane, and reducing sulfur in diesel andfuel oil. Other recommendations included measures to reduce vehicular emissions andcollect air quality data more systematically.
2. Pakistan remains one of the two countries in South Asia still using leadedgasoline widely, the other country being Sri Lanka. Given extensively documentedepidemiological evidence concerning the adverse impact of lead on public health,particularly on the intellectual development of children, lead elimination is the highestpriority for fuel quality improvement facing the Government of Pakistan. Anotherpollutant of concem is high ambient concentrations of fine particles. Reducing sulfur infuels helps to lower particulate concentrations because sulfur contributes to the formationof secondary particulates. The workshop recommendations address these two concerns.
3. This program also examined another aspect of particulate emissions.Diesel vehicles generally contribute much more to particulate emissions than gasolinevehicles. Historically, consumption of diesel by vehicles has exceeded that of gasoline inPakistan several-fold, in part because of the governnent's inter-fuel pricing policy, whichhas set the price of diesel at about one-half that of gasoline. This has encouraged theconversion of light-duty vehicles, which might otherwise run on gasoline, to diesel.Narrowing the price difference between gasoline and diesel would discourage vehicleowners from converting light-duty vehicles to diesel in the future, and would evenpromote replacement of diesel vehicles with gasoline vehicles at the time of vehicleretirement.
Clean-Fuels Workshops and Analysis
4. A "Clean Fuels Workshop" was held in Islamabad on 20-21 October 1997to examine how to improve the quality of fuels in Pakistan. Sponsored by the Ministry ofEnvironment, Local Government, and Rural Development, the Ministry of Petroleum andNatural Resources, and the World Bank, the workshop was attended by representativesfrom the Government of Pakistan, the downstream petroleum sector, universities,research institutions, and nongovernmental organizations (NGOs), and by specialists from
This report was completed in May 2001 and reflects the situation in Pakistan up until that point.

2 Pakistan Clean Fuels
other countries. The workshop participants recommended (1) tightened specifications forgasoline, diesel, and fuel oil, as well as (2) a timetable for implementing the newspecifications, as shown in Table E. 1. The timetable was modified in 1999.
Table E.1: October 1997 Workshop: Recommended Timetable for Tightening FuelSpecifications, Including 1999 Revisions
Specifications TimetableParameter Old New Proposed in 10/9 7 Revised in 1999
Gasoline lead, g/l 0.42 0.35 end-1998 2000
0.35 0.15 2003 2003
0.15 0.013 2005 2005
Gasoline research 80 87 Withdraw 80 RON by end 1998 2000octane number (RON) and replace with 87 RON
- 92 unleaded Introduce by end 1998 Post-PARCOstartup
Diesel sulfur, wt% 1.0 0.5 2000 2001
Fuel oil sulfur, wt/o 3.5 2.0 2000 2001
Notes: gll grams per liter; wtPo percent by weight; PARCO Pakistan Arab Refinery Company. - notapplicable.
5. At the October 1997 workshop, it was decided that the Government ofPakistan and the World Bank would undertake a joint techno-economic analysis of clean-fuels options and the feasibility of the above timetable. The requirements of securingfunding, as well as intemal developments in Pakistan, delayed the commencement of thestudy until mid-1999.
6. Industry-standard linear programming software was used to analyze theimpact of the recommended specifications on the downstream petroleum sector.Additional steps to limit benzene and total aromatics in gasoline were also examined. Theresults are surnmarized in Table E.2. The gasoline quality improvement steps are thesame as those indicated in Table E. 1. For diesel and fuel oil, the incremental cost given ineach year is that required to reduce diesel sulfur to 0.5 percent by weight (on a per-literbasis) and the national average of fuel oil sulfur to 2 percent by weight. The last columnshows the cost of installing isomerization units at three refineries to lower benzene andtotal aromatics in gasoline. A comparison of gasoline fuel quality with and withoutisomerization is given in Table E.3.

Executive Sunmary 3
Table E.2: Incremental Cost (1998 US$)
Parameter 2000 2003 2005 2005, low aromatics
Annual cost for gasoline (US$ million) 1.8 -5.5 1.5 7.2
Cost per liter of gasoline (US cents) 0.1 -0.3 0.1 0.4
Annual cost for diesel (US$ million) 16.7 22.0 24.2
Cost per liter of diesel (US cents) 0.3 0.3 0.3
Annual cost for fuel oil (US$ million) 104 105 114
Note: - not applicable.
Table E.3: Gasoline Physical Properties in 2005 (percent by volume)
Parameter ARL NRL PRL Dhodak PARCO
Benzene, without isomerization 4.6 4.2 4.3 3.6 4.0
Benzene, with isomerization 3.5 1.1 0.9 1.3 1.5
Total aromatics, without isomerization 41 38 39 32 32
Total aromatics, with isomerization 41 33 31 33 35
Notes: ARL Attock Refinery Limited; NRL National Refinery Limited; PRL Pakistan RefineryLimiited; PARCO Paldstan Arab Refinery Company; Dhodak is a condensate distillation unitlocated in Dhodak in the Punjab Province.
7. Two workshops were held in Islamabad at the end of March 2001 todiscuss the findings of the study and reach a consensus on what concrete steps to take inthe coming months. The target audience for the first workshop-hosted by the Ministry ofEnvironment, Local Government, and Rural Development-was stakeholders in theenvironment sector. Attending were representatives from the Pakistan EnviromnentProtection Agency, other government agencies, NGOs, universities, research institutions,and one refinery. The second workshop was organized by MPNR, aiming specifically atreviewing the technical details of the study findings with the refiners and oil marketingcompanies.
8. At the first of these two recent workshops, the findings of the study weresummarized as follows:
* The cost of eliminating lead in gasoline is surprisingly low because thePakistan Arab Refinery Company (PARCO) refinery, a new facilitycapable of producing high-octane blending components, has recently comeon stream. The incremental cost to consumers would be on the order of 0.5to 1 percent of the retail price, requiring little capital expenditure.
* In the process of eliminating lead, it would be important to introducelimits on benzene and aromatics. Levels of 5 percent benzene and 40-45percent total aromatics would be considered minimally acceptable byinternational standards, and Pakistan is in a position to impose these limitswithout additional capital expenditures.
4 Pakistan Clean Fuels
The incremental cost of reducing sulfur in diesel from 1 percent to 0.5percent, now considered minimally acceptable by international standards,is similarly low: about 1 percent of the retail price and requiring capitalexpenditures of about US$10 million (for storage tanks and otherinfrastructure requirements for blending domestically produced diesel withimported lower-sulfur [0.25 percent] diesel).
* The cost to Pakistan of reducing sulfur in fuel oil, in contrast, would besubstantial: more than US$100 million per annum as a result of importinglower-sulfur fuel oil. This argues for accelerating the switch from fuel oilto natural gas.
9. At the second workshop organized by MPNR, refiners and oil marketingcompany representatives supported the following two points highlighted during thepresentation of the study findings.
The incremental cost of eliminating lead in gasoline and reducing sulfur indiesel to 0.5 percent is surprisingly low, for the former because PARCOhas already made much of the investment needed to eliminate lead, and forthe latter because Pakistan relies heavily on imports.
* It is important to introduce limits on benzene and total aromatics, andPakistan can currently initiate 5 percent and 40-45 percent limits,respectively, without incurring any capital expenditures in the future at thetime of complete lead elimination. This is important for preventingbenzene from exceeding 5 percent if and when octane grades higher thanthe current 87 RON are introduced on a wide scale.
10. MPNR, the Ministry of Environment, Local Government, and RuralDevelopment, and the industry expressed strong interest in accelerating the timetable foreliminating lead in gasoline. In particular, the relatively low incremental cost of doing sowas seen as a unique opportunity for the Government of Pakistan to upgrade the qualityof petroleum products.
11. The second workshop concluded by proposing the following action items:
* The timetable for lead phaseout is to be accelerated, with the final date forlead elimination brought forward from the original date of 2005 to 2002 or2003. One option is to supply unleaded gasoline to all areas except thoseserved by Attock Refinery as soon as possible.
* The government will issue revised gasoline specifications, limitingbenzene to 5 percent and aromatics to 40-45 percent (precise level to befinalized).
* Because of the contract with Kuwait Petroleum Corporation, whichinformed Pakistan that it cannot supply 0.5-percent-sulfur diesel until June2002 (because of a fire at one of their refineries), Pakistan will switch to0.5-percent-sulfur diesel in June 2002. The logistics of importing 0.25-

Executive Summary 5
percent-sulfur diesel and blending with domestically produced dieselwould need to be finalized.
* Because the incremental cost of lowering sulfur in fuel oil is considerable,the government should accelerate switching from fuel oil to natural gasand consider supplying imported lower-sulfur fuel oil to fuel oil userslocated in or near densely populated areas.
Transport Fuel Tax Policy12. Following the refinery study, the second component of the Pakistan CleanFuels program addressed how to stem the conversion of light-duty vehicles from gasolineto diesel, and in fact reverse the trend so that the majority of light-duty vehicles aregasoline-powered.
13. Once lead is phased out of gasoline, particulate emissions from dieselvehicles would be expected to be the most serious pollutant affecting public health in thetransport sector. Diesel vehicles of the technology used in Pakistan emit much more fineparticles than gasoline vehicles. Further, emerging evidence suggests that dieselparticulate emissions are more harmful than those of gasoline vehicles.
14. Because the price of diesel has historically been about one-half that ofgasoline, some owners of gasoline cars even convert their vehicles to run on diesel. Over90 percent of diesel was used in the transport sector in the second half of the 1990s.While heavy-duty vehicles would be expected to continue to run on diesel irrespective ofthe inter-fuel price difference, encouraging light-duty vehicles used in urban centers torun on gasoline rather than diesel would confer significant health benefits.
15. One effective option, if it can be implemented successfully, isdifferentiated vehicle taxation, by which light-duty diesel vehicles are taxed considerablymore than their gasoline equivalents so as to make the purchase of the formereconomically unattractive. However, discussions held with provincial tax officialsindicated that such a tax scheme would not be feasible given the limitations of Pakistan'stax collection mechanism. Therefore, this study's scope was limited to examining the useof fuel tax policy to achieve the same objective. More specifically, this componentinvestigated two scenarios for narrowing the price difference between gasoline and dieselto the level where the owners of light-duty vehicles would be indifferent to the choice offuel. The two scenarios are as follows:
* Scenario 1: A 10 percent decrease in the price of gasoline and a 67 percentincrease in the price of diesel
* Scenario 2: A 29 percent decrease in the price of gasoline and a 10 percentincrease in the price of diesel.
If light-duty diesel vehicles used in intra-city transport were hypothetically converted togasoline as a result of the above price adjustments, this would represent diesel savings ofapproximately 250,000 metric tons. Even more important is preventing the future

6 Pakistan Clean Fuels
conversion of gasoline vehicles currently driven in urban centers (all except gasoline usedby two- and three-wheelers)--amounting to 700,000 metric tons-to diesel.
16. It is important to acknowledge the serious limitation of using only fuel taxpolicy to influence the choice of fuel, given the large price difference between gasolineand diesel that exists today. Diesel is used in freight transport, so that a marked rise in theprice of diesel affects heavy-duty diesel vehicles for which the pricing scheme is notintended, resulting in economy-wide inflation. If the poor are to be affecteddisproportionately by the impact of the diesel price rise, such a measure will beregressive. General inflation would also affect the balance of payments by making export-oriented and import-substitution sectors less competitive.
17. At the same time, however, Pakistan is an importer of diesel-so if theconsumption of diesel falls in response to a price increase, the petroleum-product importbill will be reduced. Further, government revenue will rise because of greater tax takefrom the sale of diesel, and this additional income can be used to mitigate some of theadverse effects of the diesel price increase.
18. Modeling was carried out to address the above questions by means ofinput-output analysis, using household survey data and the Integrated Social Policy andMacroeconomic model developed by the Social Policy and Development Center inKarachi. Scenario 1 was found to have a significant impact on the cost of living ofhouseholds, amounting to an increase of 1.4 percent of income on average. The impact ishigher for urban households (1.5 percent) than rural (1.3 percent). The impact isregressive, with the increase in household expenditure falling from 1.9 percent for thebottom income quartile to I percent for the top income quartile in rural areas, and from1.9 percent to 1.2 percent for the corresponding income groups in urban areas. Therefore,if scenario 1 is adopted as a policy, it may be necessary to try to mitigate the impact onlower-income groups by means of safety net measures. In contrast, the impact on the costof living was found to be generally negligible in scenario 2, with the increase expressed inpercentage of income remaining below 0.1 percent. The top income quartile in rural areasand the top two income quartiles in urban areas actually benefit as a result of a large fallin the price of gasoline.
19. The government's tax revenue was found to increase by approximately Rs45 billion2 in scenario 1, and to suffer a slight loss (Rs 3 billion) in scenario 2. Theimpacts on other economic parameters are shown in Table E.4.
2 A billion is 1,000 million.

Executive Summary 7
Table E.4: Changes in Macroeconomic Parameters for Fiscal 1999-2000
Macroeconomic variable Unit Scenario I Scenario 2
Gross domestic product (GDP) growth rate %, absolute -0.26 -0.02
Unemployment rate %, absolute 0.27 -0.03
Rate of inflation %, absolute 1.43 -0.08
Current account deficit % of GDP -0.47 0.07
Budget deficit % of GDP -1.03 0.1
Rate of depreciation of nominal exchange rate %, absolute 1.43 -0.03
Ratio of tax to gross domestic product %, absolute 1.29 -0.08
Incidence of poverty % of population 1 -0.05
20. Scenario 1 has major economy-wide consequences. It generates substantialadditional revenues (thereby reducing the budget deficit) and reduces importssignificantly (thereby improving the balance of payments) but at the cost of somewhatlower growth (due primarily to contraction of the road transport sector), significantlyhigher short-run inflation, and slightly higher unemployment. The impact on the cost ofliving is regressive, with the poor being the most severely affected. The poor areconservatively estimated to increase by almost 1.5 million.
21. Scenario 2 benefits the richer car-users considerably, and encouragesrather than discourages the use of private cars in urban areas. As such, it is not a desirablepolicy option. It does have more limited macroeconomic implications than scenario 1,achieving the same desired inter-fuel price difference but causing much smallerdislocation to the economy. There are some minor revenue losses and a small worseningin the balance of payments, but it marginally affects the poorer sections of society whileconferring some benefits to car owners.
22. The sharp diesel price hike contemplated in scenario 1 is likely to meetstiff resistance, especially because heavy-duty vehicles (which account for bulk of dieselconsumption) will have no option but to bear the higher input costs and raise transporttariffs. This highlights the limitation of not incorporating differentiated vehicle tax in theanalysis. It is proposed that the government match such a move with a countervailingrelief in the form of a large reduction in the standard general sales tax (GST) rate. A one-third reduction in the GST rate is estimated to lower the average burden of the tax by 1.4percent of income in urban areas and 1 percent in rural areas. This intervention isestimated to compensate for the negative impact stemming from fuel price changes byover 92 percent in urban areas and by over 77 percent in rural areas.
23. Such a counter-measure may or may not succeed. Its success will dependessentially on the perceived burden of GST and the extent to which the fall in the rate ofGST is accompanied by a corresponding fall in the prices of the essential goods andservices. On balance, the political feasibility of raising the diesel price sharply isconsidered low. If a differentiated vehicle tax scheme must be ruled out, scenario 2 may

8 Pakistan Clean Fuels
be a less disruptive strategy than scenario 1, but it may also have serious adverse effectson the transport sector.
24. The above findings suggest that fuel tax policy alone is a poor instrumentfor inducing a shift from diesel- to gasoline-powered vehicles. Although scenario 2 mayhave negligible economy-wide consequences, the transport sector in Pakistan is plaguedby urban congestion and inadequate provision for road maintenance. A move that willcertainly encourage greater urban private car use will further exacerbate the transportsector's problems, even if there are environmental gains to be made. These observationshighlight the importance of coordinating policies across environment, transport, andenergy sectors, and of using a number of policy instruments rather than just one toaddress environmental and transport problems.
1
Background
1.1 Deteriorating urban air quality is one of the most serious environmentalproblems facing Pakistan today.3 Poor air quality threatens human health and causes otherforms of enviromnental damage. Among the greatest contributors to air pollution arevehicle emissions, including highly damaging emissions of lead and fine particulatematter. As incomes grow, so too do the numbers and use of motor vehicles, potentiallyworsening pollution.
1.2 Airbome fine particles and lead are the pollutants receiving the mostattention from policymakers in Pakistan because of their serious adverse effects on publichealth. A recent investigation into the quality of air in three cities-Lahore, Rawalpindi,and Islamabad-found high concentrations of PM, 0 (particles smaller than 10 microns, or10 gtm), lead and oxides of nitrogen (NOJ). Air quality was monitored continuously for16 to 18 hours at 10 locations, all located on major roads. Of these, an average of close to900 micrograms of PMIo per cubic meter (Qg/m3 ) was recorded at eight locations, and theremaining two locations recorded an average of about 500 4g/m3, both of which areexceptionally high levels by any standards. Airborne lead varied between 0.7 and 10jig/n 3, again very high (JICA 2000).
1.3 Sources of PMIo include large industrial sources such as power plants,small industrial sources and commercial establishments, houses, refuse burning, andvehicles. Among vehicles, diesel vehicles and two-stroke engine gasoline vehicles are thetwo largest sources. As for lead, the combustion of leaded gasoline in vehicles is asignificant source, but other sources such as smelters and battery manufacturing andrecycling facilities can also be important. While this report focuses on the combustion ofoil products, especially in vehicles, it is important to bear in mind that an effective urbanair quality management strategy needs to address all major sources of emissions,including such often neglected but important sources as biomass, refuse buming, andresuspension of road dust (road dust thrown into the air).
3 This report was comnpleted in May 2001 and reflects the situation in Pakistan up until that point.
9
10 Pakistan Clean Fuels
1.4 This chapter provides background information to place in context thestudies undertaken in the Pakistan Clean Fuels program. It begins by giving an overviewof major pollutants with serious health effects. This is followed by a discussion on therole of fuel quality and its effects on emissions, especially from vehicles. Specialemphasis is placed on lead in gasoline and sulfur in fuels, two of the focal points of thePakistan Clean Fuels program. The chapter then describes the downstream petroleumsector in Pakistan, the quality of domestically refined fuels, and the role of inter-fuelpricing. It closes by outlining the rest of the report.
The Link Between Fuel, Transport, and the Environment
1.5 Fuel quality and vehicle emissions are closely linked, and they in turnaffect the level of air pollution. In developing a strategy for urban air qualitymanagement, it is important first to understand which pollutants are affecting publichealth the most in a given city. This in turn depends on the toxicity and the ambientconcentrations of each pollutant. The next step is to identify sources that are makingsignificant contributions to the pollutants of concern, and formulate plans for controllingthese sources. Because transport is typically one of the major contributors to urban airpollution, reducing vehicle emissions is generally an important part of a strategy formanaging urban air quality. One of the available options for reducing emissions in thetransport sector is fuel quality improvement. Improving the quality of gasoline byeliminating lead is a particularly effective measure for reducing the exposure of thegeneral public to airborne lead.
1.6 The pollutants of special concern in Pakistan are lead and fine particulatematter. Transport contributes to high ambient levels of both pollutants. Vehicles emit leadas a result of the combustion of leaded gasoline. Fine particles are emitted directly fromvehicles, and in addition are formed as a result of secondary formation4 from NO, andoxides of sulfur (SO,). Both gasoline- and diesel-fueled vehicles emit NO,. In the case ofgasoline, NO, emissions can be reduced by means of three-way catalytic converters, butcatalysts cannot be used if gasoline is leaded because lead permanently deactivates thecatalyst. The amount of SO,, emitted is directly proportional to the amount of sulfur in thefuel and is reduced by treating the fuel itself.
Lead
1.7 Lead is one of the highest-risk pollutants still widely used in gasoline inPakistan as a historically inexpensive octane5 enhancer. The combustion of leadedgasoline contributes to the majority of airborne lead in many cities where leaded gasoline
4 See paragraph 1.25.
5 Octane is a measure of resistance to self-ignition (knocking) of a gasoline when rnixed with air in anengine cylinder. The higher the octane number, the higher the anti-knock quality of the gasoline. In theUTnited States, octane refers to an average of MON and RON; because MON is usually lower thanRON, averaging the two results in a lower number, typically by 4 or 5. For example, -87 octane" in theUnited States corresponds to 91 or 92 RON.
Background 1 1
is still used. Anthropogenic sources of lead include not only lead in gasoline, but also thefollowing:
* Lead in drinking water, because of the historical use of lead in pipes forwater distribution
* Lead-based paint
* Stationary sources such as smelters and lead-battery recycling andmanufacturing facilities
* Activities such as mining
* Tobacco
* Food
* Lead-soldered beverage and food cans
* Dust and soil* Traditional cosmetics and medicines
* Lead-glazed ceramics.
1.8 The toxicity of lead has been known for centuries. At levels exceeding 70micrograms (.g) per deciliter (dl) of blood for children and 100 pLg/dl for adults, lead cancause paralysis, seizures, coma, and death. What have come to light only in the last twodecades, however, are the adverse health effects of lead even at levels previouslyconsidered safe. As a result of new research findings, health organizations such as theU.S. Centers for Disease Control and Prevention (CDC) have steadily revised theirguidelines for lead. Today, environmental intervention is recommended for blood leadlevels above 10 F.g/dl (WHO 1995a).
1.9 It should be noted that airborne lead settles on dust, falls on vegetation, andmay contaminate drinking water. Therefore, airborne lead cannot be delinked from leadfound in food and water. For nonsmoking adults, major sources of lead are food, water, andairborne lead, if the level of the latter is high. For children, in addition to food, water, andair, dust and soil constitute a significant exposure pathway. Any program to combat theadverse health effects of lead should attempt to estimate all significant sources of leadexposure so that effective steps can be taken to reduce exposure. Whatever additionalsources of lead emissions may exist, eliminating lead in gasoline is important. Unlike otherpollutants, such as hydrocarbons, lead does not degrade and continues to accumulate in theenvironment unless the continuing emissions of lead, including those from gasoline, arestopped.
1.10 An excellent overview of the health effects of lead can be found in a 1995World Health Organization (WHO) publication Environmental Health Criteria 165:Inorganic Lead (WHO 1995b).6 Most of the lead absorbed by the body is found in the
6 Unless indicated otherwise, all the infornation presented in this section on the health effects of lead istaken from this WHO publication.

12 Pakistan Clean Fuels
bones, and some is found in blood. Moreover, bone is a major storage site of lead, andserves as an endogenous source of lead even after exposure to environmental lead hasceased. During pregnancy (Silbergeld 1991) and in old age, lead from the bones is releasedinto the blood.
1.11 The absorption of lead from environmental sources is not a linear functionof the amount of lead intake. It depends on the chemical and physical state of the lead, andon factors such as the age, nutritional condition, and physiological status of the individual.For example, there is evidence that more lead is absorbed when dietary calcium intake islow or if there is iron deficiency. The amount of lead absorbed by the body increasessignificantly when the stomach is empty. The rate of absorption is also higher for childrenthan for adults. That is to say, poor, malnourished children are even more susceptible to leadpoisoning than others.
1.12 The largest body of observational studies on the health effects of leadconcerns its impact on the intellectual development, typically measured in terms ofintelligence quotient (IQ), and behavioral problems of children. There has been much publichealth interest in this issue because of mounting evidence that continual exposure ofchildren to even low levels of lead could have a negative impact on their intelligence. Asystematic review of 26 epidemiological studies can be found in Pocock and others (1994).The published studies can be divided into two broad categories: prospective and cross-sectional. Prospective studies collect data from the same group of children over a number ofyears, so as to identify whether there is a specific period in a child's intellectualdevelopment when exposure to lead is particularly damaging. Cross-sectional studiesattempt to correlate the "body burden" of lead with children's intelligence, both beingmeasured at the same time. If environmental exposure to lead before commencement of thestudy significantly affected the child's IQ, cross-sectional studies would not be in a positionto identify the causal link unless the level of environmental exposure to lead has beenconstant.
1.13 Because a large number of factors affect IQ, a multiple-regression analysiswith a large number of independent variables, of which lead is one, needs to be conductedin order to isolate the effect of lead. Increasing the sample size will increase markedly thestatistical significance of the results. The small sample size of any given study, coupled withthe complexity of identifying all the relevant covariates (factors affecting IQ, or independentvariables on the right-hand side of the equation), make it impossible to draw definitiveconclusions from any single study; a synthesis of a number of studies is needed to overcomethese impediments.
1.14 These limitations not withstanding, the studies that have been conductedstrongly support an inverse association between the body burden of lead and children's IQs.A reasonable rule of thumb appears to be that increasing the level of blood lead from 10,ug/dl to 20 jtg/dl causes an average decrement of about 1-2 IQ points.
1.15 A follow-up study by Bellinger and others (1992) found that there was anage of critical exposure. IQ was strongly and statistically negatively associated with thelevel of lead in blood measured at two years of age. This was also supported by a study
Background 13
conducted in the lead-smelting community of Port Pirie in Australia (Baghurst and others1992). The evidence from other prospective studies, however, is conflicting.
1.16 Unless the level of blood lead is extremely high, the impact of lead on agiven individual's IQ may not be noticeable. It is, however, a serious public health concemfor the community as a whole, because exposure to lead shifts the IQ distribution curve ofthe entire population, reducing average intelligence. It is difficult to estimate the economiccosts of loss in IQ, but they are doubtless substantial. Costs incurred include additionalremedial education, health care, and loss in productivity.
1.17 While the effect of lead on children's IQ is probably the most significanthealth impact of using leaded gasoline, there are others:
* Qualitative evidence indicates that lead may adversely affect thereproductive process in men and women, including increased frequency ofmiscarriages, although the results are conflicting below blood lead levelsof 30 ,ug/dl.
* Renal (kidney) function impairment has been correlated with blood leadlevels above 35 1Lg/dl.
* The effect of lead on the cardiovascular system has been studiedextensively. There appears to be a weak but positive association betweenlead in blood and blood pressure.
1.18 Finally, it should be noted that many, if not most, of the studies examiningthe health impact of lead have been undertaken in the United States, Australia, and Britain,where living conditions differ from those in Pakistan. Any deleterious effects of leadexposure, even at low levels, may be exacerbated when additional factors such as calciumor iron deficiency are present. Studies examining and quantifying the covariate effects oflead in combination with these factors are likely to underscore the importance of furtherlead reduction, and would be helpful in guiding policymakers.
Particulate Matter
1.19 Small particles remain in suspension for hours or days, are liable to travelconsiderable distances from the source, and enter the respiratory tract and reach the deeperparts of the lungs. PM1o represents the size range of particles likely to pass the nose andmouth. PM2.5 (particles smaller than 2.5 p.m) represents more closely the size range ofparticles able to reach the deeper parts of the respiratory tract.
1.20 A series of extensive studies, conducted mainly in the United States, hasdemonstrated clearer associations between particulate concentrations and small changesin a wide range of health indicators-mortality, hospital admissions, emergency roomvisits, time off school or work, respiratory symptoms, exacerbations of asthma, andchanges in lung function-than with other pollutants. Of the various health indicators, themeasurement of mortality is the most certain, having been particularly well studied withmore consistent results than those regarding the other indicators. Although thecomposition of PM1 o can vary widely from area to area and with time, the size of the

14 Pakistan Clean Fuels
estimated effects does not vary greatly with location. The WHO estimates that highambient concentrations of particulate matter are responsible for about half-a-millionpremature deaths worldwide every year.
1.21 In terms of health impact, PMIo is much more serious than total suspendedparticles (TSP), which include particulate matter of all sizes. Coarse, wind-blown particles,for example, are believed not to have a significant effect upon health. In the United States,federal TSP standards were superseded by PMIO standards in 1987, and there are nowadditional standards for PM2.5. In the case of vehicles, the majority of the particles emittedfall in the sub-micron range and, furthermore, are emitted near ground level where peoplelive and work. Therefore, vehicular particulate emissions are especially harmful to publichealth. Particles found in vehicle exhaust consist of a carbonaceous core, adsorbedhydrocarbons from engine oil and fuel, adsorbed sulfates and nitrates, water, and inorganicmaterials such as those produced by internal engine abrasion.
1.22 Recent studies have indicated that the number of particles to which theindividual is exposed could be more important than their mass. Whereas air qualitystandards for particulate matter are currently based on mass throughout the world, agrowing number of countries will introduce standards based on number rather thanweight in the medium term. Measures that reduce the mass of particles emitted do notnecessarily reduce the number of fine particles. For example, a recent study showed that athighway speeds the numbers of particles emitted were similar among the three gasoline- andfour diesel-vehicle types tested and remained unaffected by the quality of the fuels(Automotive Environment Analyst 1998), although at lower speeds the number of particlesin diesel emissions was considerably greater.
1.23 Traffic is a large contributor to fine particulate emissions. On a mass basis,diesel vehicles emit much more fine particulate matter than gasoline vehicles in general.In terms of the number of particles, the difference between light-duty gasoline and light-duty diesel vehicle emissions in one study was found to vary from a factor of over 2,000at 50 kilometers per hour (km/h) to 3 at 120 km/h. Although the number of particles ingasoline exhaust is up to three orders of magnitude smaller than that in diesel exhaust, thehealth impact may not be correspondingly smaller: in terms of size, a higher proportion ofgasoline particulate emissions may be of smaller size (less than I .tm) than dieselemissions (CONCAWE 1998). At the same time, there is a growing view that dieselexhaust poses a serious cancer risk, suggesting that diesel particulate emissions may beespecially harmful to public health.
1.24 A significant vehicular source of fine particles in South Asia is two- andthree-wheelers run by two-stroke engines. Because they are less expensive than othervehicles, two- and three-wheelers account for nearly one-half of all vehicles in Pakistan.Until recently new two-stroke engines emitted as much as an order of magnitude moreparticulate matter than four-stroke engines of similar size. When vehicle age,maintenance, lubricant, and fuel quality are taken into account, two-stroke engines inPakistan probably emit particulate matter at an even higher factor. Two-stroke enginestypically have a lower fuel efficiency than four-stroke engines, with as much as 15-40
Background 15
percent of the fuel-air mixture escaping the engine's combustion chamber unburned.These "scavenging losses" contain a high level of unburned gasoline and lubricant, whichincreases emissions of hydrocarbons and organic lead (which is even more damaging tohealth than the inorganic lead produced when gasoline lead additives combust). Some ofthe incompletely burned lubricant and heavier portions of gasoline are emitted as smalloil droplets, which in turn increase visible smoke and particulate emissions.
1.25 All combustion and metallurgical processes and many other industrialoperations lead to the emission of particles into the atmosphere. The particles emitteddirectly from a source are termed primary. Particles formed within the atmosphere, mostlyfrom the chemical oxidation of atmospheric gases, are termed secondary. NO, and SO.contribute to secondary particulate formation. The largest individual contributor to primaryparticles is incomplete combustion of fossil fuels and biomass. As a rough generalization,particles generated from combustion and condensation of vapors are mostly in the PM2.5fraction (that is, 2.5 microns or smaller), while particles from mechanical breakup ofsolids and liquids are larger. Poor fuel quality, inefficient combustion processes, and poorvehicle and equipment maintenance all contribute to particulate emissions.
1.26 The WHO no longer has guidelines for PM,( or PM2.5 on the grounds that athreshold for the onset of health effects could not be detected. Instead, the WHOrecommends that the figures given in Table 1.1 be used to determine acceptable risk. Thefigures represent the percentage increase in health indicators as a result of a 10-jig'm 3
increase in the ambient concentration of PM1 o and PM2.5. For example, an increase in theambient PM2.5 concentration of 10 .g/rm3 increases the mortality of the exposed populationby 1.5 percent.
Table 1.1: Impact of a 1 O-pg/m3 Change in the Ambient
Concentration of Particulate Matter on Health
% Change
Health Endpoint PM10 PM2.5
Daily mortality 0.70 ± 0.12 1.5 ± 0.4
Hospital admissions 0.84 ± 0.33 5
Bronchodilator use 0.34 ± 0.13 No value given
Symptom exacerbation 0.35 + 0.16 No value given
Cough 0.45 ± 0.23 No value givenPeak expiratory flow 0.013 i 0.004 No value givenSource: WHO (2000)
Other Pollutants
1.27 Carbon monoxide (CO) is a colorless, odorless gas that inhibits thecapacity of blood to carry oxygen to organs and tissues. High levels of CO can cause

16 Pakistan Clean Fuels
people with chronic heart disease to experience chest pain. Very high levels of CO canimpair vision, manual dexterity, and learning ability, and can cause death.
1.28 CO is a product of the incomplete combustion of fossil fuels. In mostcities gasoline-fueled vehicles account for most CO emissions. The level of CO emissionscan be reduced by incorporating oxygenates in gasoline for old vehicles and by usingoxidation catalysts.
1.29 Sulfur dioxide (SO2), one of the oxides of sulfur, reduces lung function inasthmatics and exacerbates respiratory problems in sensitive individuals. Sulfur oxidesare formed when fossil fuels containing sulfur are burned. These oxides contribute to acidrain and to the formation of secondary particles. The amount of sulfur emitted is directlyproportional to the amount of sulfur in the fuel. It can be reduced by treating the fuel, forexample, through hydrotreating, or by installing sulfur removal devices at the point ofemission, such as flue gas desulfurization units at power plants. Nitrogen dioxide (NO2),one of the oxides of nitrogen, causes changes in lung function in asthmatics. Nitrogenoxides are formed during combustion as nitrogen in the air reacts with oxygen at hightemperature. Like sulfur oxides, these oxides contribute to both acid rain and secondaryparticulate formation. Nitrogen oxides are also precursors of ground-level ozone.
1.30 Power plants and diesel- and gasoline-fueled vehicles emit nitrogenoxides. The amount of NO, formed can be reduced by controlling the peak combustiontemperature (for example, by recirculating exhaust gas in vehicles); reducing the amountof oxygen available during combustion; or converting NO, to oxygen-containinginorganic compounds and nitrogen (for example, by installing three-way catalyticconverters).
1.31 Ozone causes photochemical smog and has been associated with transienteffects on the human respiratory system, particularly the decline in pulmonary functionduring light to heavy exercise. Gasoline-fueled vehicles are a significant source ofvolatile organic compounds, which along with NO, are precursors of ozone. Ozoneabatement is complicated by nonlinear interactions among ozone precursors-the amountof ozone formed is not directly proportional to the ambient concentrations of volatileorganic compounds and NO, but is a complex function of a number of factors thatinclude the ratio of these two precursors. It is therefore important to collect relevant dataand understand the chemistry of ozone formation before selecting mitigation measures.
1.32 Another concern is airborne toxics, of which only limited data on ambientconcentrations are available. Toxic emissions from vehicles include benzene, polycyclicaromatics (aromatics with more than one six-membered ring), 1,3-butadiene, andaldehydes. 1,3-butadiene is a potent carcinogen. Benzene, another carcinogen, isincreasingly targeted for reduction in gasoline.
Fuel Quality
1.33 There are complex interactions between fuels, vehicle technology, testdriving cycles, and reference fuels with regard to their relative influences on vehicleemissions. A given vehicle will show different emission levels depending on the test-
Background 17
driving cycle. Therefore, it is important to bear in mind that changing fuel specificationswill not necessarily affect all vehicles in the same way.
1.34 A number of fuel parameters affect vehicle emissions. For gasoline, theyinclude volatility, distillation temperature profile, and the amount of lead, sulfur, benzene,total aromatics,7 olefins, and oxygen-containing compounds commonly referred to asoxygenates. For diesel, they include the distillation temperature profile, density, cetane,and the amount of sulfur and aromatic-particularly polycyclic aromatic-compounds.
1.35 Lead is one pollutant whose removal from gasoline will have animmediate impact on emissions from all vehicles. As noted previously, in Pakistan, wherethere are a large number of two-stroke engine two- and three-wheelers, some of the leadis emitted uncombusted. Because the resulting emissions of organic lead are even moredamaging to public health than the inorganic lead that is formed when gasoline leadadditives combust, the need to phase out lead in gasoline becomes all the more urgent.Lead also acts as a permanent poison for catalytic converters, which are by far the mosteffective means of reducing emissions of CO, hydrocarbons, and NO,. As long asgasoline is leaded, there is no way of taking advantage of this exhaust control technology,which is now widely used in a large number of countries.
1.36 Experience elsewhere has demonstrated that gasoline lead eliminationshould be carried out within the broader context of an integrated approach to air pollutionmanagement. This is because gasoline components that are added to compensate for theoctane shortfall after lead removal can have harmful effects of their own. Concernsinclude increased emissions of carcinogens such as benzene (from higher-severityreformer operation).
1.37 Sulfur in gasoline acts as a (temporary) poison for catalytic converters.Vehicle manufacturers recommend that the level of sulfur in gasoline be kept below 500parts per million by weight (wt ppm), and preferably below 100 wt ppm. The impact ofreducing sulfur on the performance of catalytic converters is non-linear, with emissionsdecreasing more rapidly below 100-150 wt ppm.
1.38 Benzene is emitted from gasoline as a result of evaporation8 and asunconverted benzene from the exhaust pipe. Alkyl-aromatics (all aromatics other thanbenzene) also dealkylate during combustion and a fraction is emitted as benzene. Benzenein gasoline contributes much more to the overall benzene emissions than non-benzenearomatics: it takes roughly an order of magnitude more alkyl aromatics than benzeneitself in gasoline to result in the same amount of benzene emissions from the tailpipe, andonly benzene itself can contribute to evaporative emissions.
7 Total aromatics refers to all aromatics, as opposed to specific aromnatic compounds such as benzene orxylenes.
s There are three sources of evaporation: during refaeling, as the engine cools after being shut off, and inresponse to the rising temperature during the day.

18 Pakistan Clean Fuels
1.39 Aromatics with two or more alkyl groups are photochemically reactive andcontribute to ozone formation. Therefore, the photochemical reactivity of aromatics andtheir decomposition to benzene are the two primary environmental concems leading tolimits on the amount of aromatics in gasoline. Ozone does not appear to be a problem incities in Pakistan. In the United States, for vehicles equipped with catalytic converters,the U.S. Auto/Oil Air Quality Improvement Research Program (AQIRP) found thatdecreasing total aromatics from 45 percent to 20 percent had no significant impact onozone formation (Auto/Oil AQIRP 1997). For vehicles not equipped with catalyticconverters, increasing aromatics in gasoline increases NO, emissions-which, asdescribed earlier, are a precursor for both ozone and secondary fine particulate formation.Another component of gasoline with a related concern is olefins. Olefins arephotochemically reactive and are ozone precursors. In addition, at elevated levels olefinsincrease the emissions of NO,.
1.40 Oxygenates such as ethers and alcohols have high blending octanenumbers and facilitate combustion in vehicles not equipped with oxygen sensors. Theyalso dilute gasoline, thereby decreasing the amount of undesirable gasoline componentssuch as benzene and total aromatics. Oxygenates are more miscible with water thangasoline, however, and contamination with ground and drinking water with methyltertiary butyl ether (MTBE), the most extensively used oxygenate, is a growing concem inthe United States.
1.41 Sulfur in diesel was reduced to 500 wt ppm in 1993 in the United Statesand 1996 in the European Union (EU) to control particulate emissions. This limit wasmandated only after significant progress was made in vehicle technology to reducecarbonaceous contributions to exhaust particulate emissions, so that the sulfatecomponent of particulate emissions became important. This is illustrated in Figure 1.1. Ifthe sulfate contribution to total particulate emissions is small, reducing sulfur in dieselsignificantly would not be effective in lowering overall particulate emissions.
Figure 1.1: Evolution of U.S. Diesel Particulate Emissions
o 0.6
4! 0.5 _ _ _ _ _ _ _ _ _ _ _ _ _ _ _ _ _ _
30.4 I carbon soot &oL organics* 0.3-
IN sulfateo 0.2 -0.1 _ - _ __
1988- 1991- 1994- 1994-E 0.25% 0.25% 0.25% 0.05%o) sulfur sulfur sulfur sulfur
1.42 The European auto/oil program (the European Programme on Emissions,Fuels and Engine Technologies, or EPEFE) examined the impact of varying polycyclic
Background 19
aromatics on vehicular emissions and found that decreasing polycylic aromatics from 8percent to 1 percent decreased both particulate and NO, emissions from light-duty andheavy-duty diesel vehicles. The impact of reducing aromatics on vehicular emissions isless clear. A cooperative program between Esso and Statoil found, for example, thatreducing total aromatics from 32 percent to 10 percent had no marked effect onparticulate emissions (Betts and others 1992).
Fuel Quality Trend in Neighboring Countries and Implications for Pakistan
1.43 Because of growing concern about the health impact of lead emissions, anumber of countries, including developing countries, have moved to ban the use of leadin gasoline. Examples of developing countries that have banned the sale of leadedgasoline are given in Table 1.2. In South Asia, Bangladesh and India have already movedto ban the use of lead in gasoline.
Table 1.2: Developing CountriesThat Have Banned Leaded Gasoline
Country Phaseout Year
Argentina 1996Bangladesh 1999Bolivia 1995Brazil 1991China 2000Colombia 1990Costa Rica 1996Dominican Republic 1998El Salvador 1996Georgia 2000Guatemala 1991Haiti 1998Honduras 1996Hungary 1999India 2000Jamaica 2000Mexico 1997Nicaragua 1996Philippines 2000Saudi Arabia 2000Slovakia 1995Thailand 1995
1.44 In the process of phasing lead out of gasoline, it is important not to allowhigh-octane blending components that have adverse health impacts of their own to rise

20 Pakistan Clean Fuels
too high in concentration in order to compensate for the octane shortfall. Thesecomponents include olefins and benzene. Because the refineries in Pakistan do not havefluidized catalytic cracking (FCC) units, the levels of olefins and sulfur in gasoline arevery low. This is because FCC naphtha-which is what FCC units produce-is the mostimportant source of olefins and sulfur in gasoline.
1.45 The principal source of octane from domestically produced gasoline inPakistan is reformate, which is rich in aromatics. There is a danger that relying tooheavily on reformate to increase the octane of unleaded gasoline would result inunacceptably high levels of benzene. Addressing benzene and total aromatics is theprincipal challenge facing Pakistan as it moves to eliminate lead in gasoline.
1.46 Pakistan has historically marketed two grades of gasoline: 80 researchoctane number (RON) and 87 RON. In 2000, 80 RON was withdrawn and replaced with87 RON. It is worth pointing out that modem gasoline vehicles require at least 91-92RON gasoline for optimal performance. The 87-RON grade of gasoline should continueto be adequate for the current vehicles in the fleet in Pakistan and for the two- and three-wheeled vehicles. Although eliminating the 80-RON gasoline in favor of a single 87-RON grade is a step in the right direction, further increases in octane will be required inthe fuiture to service the requirements of more modem vehicles.
1.47 The current limit on sulfur in diesel is 1 percent by weight, ranking amongthe highest in the world. While there is a need to understand the relative share of sulfateand carbonaceous components in particulate emissions from diesel engines, at 1 percentsulfur is likely to be making an appreciable contribution. In South Asia, India has loweredthe limit to 0.25 percent, and Bangladesh has switched to importing only 0.5-percent-sulfur diesel. In the rest of Asia, Singapore and Thailand have limited sulfur in diesel to0.05 percent, and the Philippines and India plan to do so by 2004 and 2005, respectively.
Downstream Petroleum Sector in Pakistan
1.48 Pakistan consumed about 18 million tons of petroleum products in fiscal1999-2000. Of this, three domestic refineries were producing less than 6 million tonsbefore the startup of a new, fourth refinery (run by the Pakistan Arab Refinery Company,or PARCO) in 2000. The balance, mainly diesel and fuel oil, is imported. Demand fordiesel and fuel oil far exceeds that for gasoline. The estimated demand for the threerefined products studied in this report is 1.4 million, 7.4 million, and 9.5 million tons forgasoline, diesel, and fuel oil, respectively in 2000.
1.49 The principal players in the downstream petroleum sector in Pakistan arefour refineries, a condensate distillation unit, and five oil marketing companies. The fourrefineries are as follows:
* Attock Refinery Limited (ARL) located in Rawalpindi
* National Refinery Limited (NRL) in Karachi
* PARCO in Mahmood Kot in the Punjab Province
* Pakistan Refinery Limited (PRL) in Karachi

Background 21
The condensate distillation unit is located in Dhodak in the province of Punjab.
1.50 Subsequent to PARCO's startup, the 80-RON-grade gasoline produced bylocal refineries with 0.42 grams of lead per liter (gll) of gasoline was eliminated andreplaced by 87 RON with 0.35 g/l of lead. With the exception of ARL, the sulfur level indiesel produced by the local refineries is close to 1 percent, and in fuel oil above 3percent.
Workshop
1.51 To examine ways of introducing cleaner fuels in Pakistan, a "Clean FuelsWorkshop" was held in Islamabad on 20-21 October 1997. Sponsored by the Ministry ofEnvironment, Local Government, and Rural Development, the Ministry of Petroleum andNatural Resources (MPNR), and the World Bank, the workshop was attended byrepresentatives from the Government of Pakistan, the downstream petroleum sector,universities, research institutions, and nongovernmental organizations (NGOs), and byspecialists from other countries. Workshop participants recommended an action plan fortightening the specifications for gasoline, diesel, and fuel oil, shown in Table 1.3:October 1997 Workshop: Recommended Timetable for Tightening Fuel Specifications,Including 1999 Revisions. The timetable was modified in 1999.
Table 1.3: October 1997 Workshop: Recommended Timetable for Tightening FuelSpecifications, Including 1999 Revisions
Specifications TimetableParameter Old New Proposed in 10/97 Revised in 1999
Gasoline lead, g/l 0.42 0.35 end-1998 2000
0.35 0.15 2003 2003
0.15 0.013 2005 2005
Gasoline RON 80 87 Withdraw 80 RON by end-1998 2000and replace with 87 RON
- 92 unleaded Introduce by end-1998 Post-PARCOstartup
Diesel sulfur, wt% 1.0 0.5 2000 2001
Fuel oil sulfur, wt% 3.5 2.0 2000 2001
Note: g/l grams per liter; RON research octane number; wt%/o percent by weight. - not applicable.
1.52 At the October 1997 workshop, it was decided that the Government ofPakistan and the World Bank would undertake a joint techno-economic analysis of clean-fuels options and the feasibility of the above timetable. The requirements of securingfunding as well as internal developments in Pakistan delayed the commencement of thestudy until mid-1999.

22 Pakistan Clean Fuels
Transport Fuel Tax Policy
1.53 Once lead is phased out of gasoline in Pakistan, emissions from dieselvehicles would be expected to be much more harmful to public health than those fromgasoline vehicles. Diesel vehicles of the technology used in Pakistan emit much more fineparticles than gasoline vehicles. Further, as mentioned earlier, emerging evidencesuggests that diesel particulate emissions are carcinogenic.
1.54 The consumption of diesel in the transport sector in Pakistan hashistorically far exceeded that of gasoline, in part because of the large price differencebetween gasoline and diesel in favor of the latter. As a result, some owners of gasolinecars even convert their vehicles to run on diesel to take advantage of the considerablylower price of diesel. Over 90 percent of high-speed diesel (HSD) was used in thetransport sector in the second half of the 1990s. In the last 10 years the ratio of the priceof regular gasoline to that of HSD has varied between the low of 1.64 in 1997 and thehigh of 2.3 in 1998, with the most recent price adjustment in March 2001 giving a ratio of1.97.
1.55 Diesel vehicles are inherently more expensive than their gasolineequivalent. While heavy-duty diesel vehicles such as large trucks and buses will continueto run on diesel irrespective of the inter-fuel price differences, light-duty vehiclescurrently running on diesel might eventually switch to gasoline if the price differencebetween these two fuels were narrowed. Moreover, and equally important, such priceadjustments will prevent future owners of gasoline vehicles from switching to diesel.
1.56 However, raising the price of diesel to narrow the price gap betweengasoline and HSD has other consequences. Diesel is used in freight transport, so that amarked rise in the price of diesel could result in economy-wide inflation. If the poor wereaffected disproportionately by the impact of the diesel price rise, such a measure would beregressive. General inflation would also affect the balance of payments by making export-oriented and import-substitution sectors less competitive. At the same time, becausePakistan is a net importer of diesel, if the consumption of diesel falls in response to aprice increase, the petroleum product import bill will be reduced. Further, the governmentrevenue will rise because of greater tax take from the sale of diesel, and this additionalincome can be used to mitigate some of the adverse effects of the diesel price increase.
1.57 Another consideration is that diesel used for inter-city transport, whereemissions occur outside heavily populated centers, do not greatly affect public health,because two conditions need to be met for vehicular emissions to cause damage: highambient concentrations of harmful pollutants and exposure of the general public to thepollutants. In the extreme, if all light-duty delivery vans switch to diesel, but are drivenmost of the time outside of urban centers, fuel switching from gasoline to diesel wouldnot be a serious concern. Therefore, it is important to ensure that the vehicles beingtargeted are driven primarily in cities and not used for inter-city transport.

Background 23
1.58 To address the above issues, a study was undertaken to examine twoscenarios for narrowing the gap between the gasoline and HSD prices to obtain the first-order estimates of the impact on household expenditures and macroeconomic parameters.
Structure of the Report1.59 This report has two parts. The first concerns fuel quality improvement,specifically addressing the recommendations of the October 1997 workshop. Chapter 2contains a detailed description of the downstream petroleum sector in Pakistan. This isfollowed in Chapter 3 by an examination of specific options for implementing therecommended fuel quality specifications, and of the incremental costs of doing so.Chapter 4 reports the outcomes of the workshops held in Islamabad in March 2001 todiscuss the findings of the study and agree upon a follow-up action plan.
1.60 The second part concerns Pakistan's fuel tax policy, which has historicallypriced diesel far below gasoline. Chapter 5 examines how the relative prices of gasolineand diesel can be adjusted to discourage the conversion of light-duty vehicles to diesel,and what the impact of such price adjustments may be on the overall economy and ondifferent income groups.


2The Downstream Petroleum Sector
2.1 The downstream petroleum sector in Pakistan consists of four refineriesand a condensate unit, historically three-and now five-oil marketing companies, andnumerous retail outlets. There are three types of retail outlets: (a) those wholly owned byoil marketing companies; (b) franchisees to which the oil marketing companies providethe license, land, and equipment; and (c) franchisees to which the oil marketingcompanies provide only the license and land. The three historical oil-marketingcompanies are the Pakistan State Oil Company (PSO), Shell Pakistan, and Caltex Oil(Pakistan). The governnent owns 25 percent of PSO directly and another 74 percent isowned by government-controlled funds. The Shell affiliate owns 52 percent of Shell.Caltex is a wholly owned subsidiary. PSO controls the majority of the market. Morerecently, PARCO and ARL launched their own marketing companies.
2.2 Among the refineries, NRL is majority government-owned, while thegovernment has a 35 percent stake in ARL. The new PARCO refinery commencedoperations in October 2000, the major shareholders being the Government of Pakistan (60percent), Intemational Petroleum Investment Company of Abu Dhabi (30 percent), andOMV of Austria (10 percent).
Role of the Government2.3 MPNR is actively involved in the downstream petroleum sector,particularly the office of the DG Oil. The DG Oil is responsible for managing the marketand allocating crude and products as well as for regulating the sector. This involvescontrolling various operational aspects of the industry by, for example, allowing ARL touse domestic crude from the southern oil fields in the face of shortages in the north. Italso involves governing financial arrangements in the sector (for example, ruling on howthe development surcharge on feedstock for NRL's lube-oil refinery should be treated).This regulatory power arises from legislation allowing the DG Oil to issue such decisions.For example, the DG Oil is empowered to determine the terms of access to infrastructureif the parties concerned-that is, the owner and the supplicant-are unable to agree toaccess terms in the normal course of commercial negotiations.
25

26 Pakistan Clean Fuels
Product Pricing
2.4 The DG Oil sets the margins at all stages in the supply chain. With theexception of lubricants, oil products are sold at fixed sales prices. (Recent prices ofgasoline, kerosene, and diesel, set by the government, are given in Table 2.1.) Thegovernment maintains a policy of pan-territorial energy pricing-that is, uniform pricingacross the country. The origins of the policy lie in the past when a key political imperativewas to promote the unity of Pakistan. At a time when most electricity was produced in thenorth and most oil products were produced in the south, pan-territorial pricing was seenas a means of balancing supply and demand. For oil products, pan-territorial pricing isachieved through the freight pool whose cross-subsidy mechanism allows products sent todistant destinations to be priced on a common basis with those closer to source. Thebasing point for the system is the city of Multan in Punjab Province. Previously, becausethe area to the south of Multan represented the majority of product consumption, thefreight pool generated a surplus. However, as northern consumption grew, so too did thefreight bill. The freight pool has now run into deficit-some Rs 5 billion9 in 1999. Someof the deficit arises from the increase in product demand in the north, requiring support;but freight rates tend to be high and the system is also open to some abuse, namely,misreporting of transport of products.' 0
2.5 Oil product taxation provides the government with a significant amount ofits current revenue. The development surcharges on all petroleum products haveamounted to 10-15 percent of total revenue. The ex-refinery price is based on an importparity price. Added to this are customs duties (unchanged since 1992) together with themargin allowed to the distributors and the commission allowed to the dealers. All threeelements are set directly by the government and together determine the prescribed price.To the prescribed price is added the inland freight margin (to equalize delivery costs on anational basis) and finally the development surcharge. Figure 2.1 and Figure 2.2 illustratehow these components have changed over time for regular gasoline and high-speed dieselproduced at the coastal refineries.
2.6 A significant source of dispute is what is actually meant by import parityprices. The industry's current view is that the prices used are not true parity prices forboth imported crude and products, and that the current system places the downstreamsector at a disadvantage. The dispute is symptomatic of a system heavily dependent uponprice regulation.
9 A billion is 1,000 million.
o An anecdotal illustration: A product sold near Karachi may be reported as having been transportedfrom Karachi to Baluchistan (a province in west and southwest Pakistan), while in reality the recipientin Baluchistan smuggles products from Iran in place of the "officially" delivered product.

The Downstream Petroleum Sector 27
Table 2.1: Retail Prices (Rs per Liter)
Date Gasolinel HSD Kerosene Gasoline/HSD Price Ratio APgasoIine.diesel
28.10.1992 10.85 5.05 4.95 2.15 5.80
14.06.1993 10.85 5.56 5.45 1.95 5.29
19.08.1993 13.13 6.12 6.00 2.15 7.01
13.02.1995 13.22 6.12 6.00 2.16 7.10
26.02.1995 13.13 6.12 6.00 2.15 7.01
14.06.1995 13.75 6.5 6.25 2.12 7.25
27.06.1995 13.75 6.5 6.25 2.12 7.25
28.10.1995 14.71 6.96 6.69 2.11 7.75
12.02.1996 14.71 7.17 6.89 2.05 7.54
14.03.1996 14.71 7.46 6.41 1.97 7.25
14.04.1996 14.91 7.46 7.26 2.00 7.45
12.06.1996 14.69 7.11 7.26 2.07 7.58
21.07.1996 14.54 7.11 6.91 2.05 7.43
12.09.1996 15.42 7.11 7.25 2.17 8.31
04.10.1996 15.42 7.45 7.25 2.07 7.97
07.10.1996 15.85 8.02 7.82 1.98 7.83
22.10.1996 16.51 8.8 8.60 1.88 7.71
13.11.1996 16.81 9.44 9.29 1.78 7.37
05.12.1996 16.81 9.93 9.74 1.69 6.88
09.01.1997 16.81 10.27 10.08 1.64 6.54
19.01.1997 17.23 10.27 10.08 1.68 6.96
04.02.1997 17.23 9.66 9.44 1.78 7.57
15.10.1997 17.75 9.66 9.44 1.84 8.09
18.07.1998 22.19 9.66 9.44 2.30 12.53
19.05.1999 24.40 10.66 10.50 2.29 13.74
11.12.1999 27.00 11.50 11.25 2.35 15.50
20.03.2000 27.50 12.80 11.25 2.15 14.70
22.09.2000 30.00 15.25 14.00 1.97 14.75
30.12.2000 32.25 18.25 16.50 1.77 14.00
14.03.2001 30.00 15.40 15.25 1.95 14.60
Note: HSD high-speed diesel.'Price of regular gasoline (80 RON) until it was withdrawn in 2000; prices starting on 22 September 2000 arefor 87 RON.2 Price difference between gasoline and diesel in rupees.

28 Pakistan Clean Fuels
Figure 2.1: Regular Gasoline Price Breakdown for NRLUPRL
35_ *GST
307 23 Freight
25-4 J20i -UF J 1 1|1 f o Development
201 E t 1 surcharge0.
" 15- F _ ¢ _ l 11 1|1 . I O Dealer15 -A U Distribution10
5 0 Customs
0 HlT i a Ex-refineryN C) l Uw cD 1- CO 0 0 0 0m p 4m 4m as ( a) at Z o o0 0 0 0 0 C 0 C CC 0 0vF F F F F F F F N N*) co t co co co 1. w NI co N
00 CA 0 CD aw CO eD 0 w 0N I 0 N F F . . VF F
Figure 2.2: High-Speed Diesel Price Breakdown for NRLUPRL
* GST2018-w 1 8 ~~~~~~~~~~~0 Freight
74, 1 2 - 1 l El DevelopmentCL 1 0 - fii ii i1 l f l surcharge
6 Dealer
42 7 * Distribution
N (m le Lo CD V_c CD 0 00 0 a 0 0 0 0 0 o 0 Customs0 0 0 0 0 0 0 0s 0 0F F F F F N N
0 0a U) c a m co CD . o CD 0Ex-refinery1 0 N o cs - _ F
2.7 The profitability of the downstream sector is set nearly entirely bygovernment regulation. The government sets the ex-refmery price to provide a rate ofreturn ranging between 10 and 40 percent on the paid-up capital of the three oldrefineries. Given the age of the refinery companies and hence their comparatively lowcapital levels, this has created a problem that has ruled out any serious investment,compounded by the 0.5 percent turnover tax that has to be paid irrespective ofprofitability. It is significant that whereas NRL's fuel refinery made only a Rs 22.9million profit in 1998, its lube oil operations made a profit of Rs 468.9 million.

The Downstream Petroleum Sector 29
2.8 PARCO falls under a different dispensation. The government hasguaranteed a minimal return of 25 percent on equity. Another incentive provided toPARCO is an average allowance of Rs 1,200 per ton in the product pricing to compensatefor the cost of in-land freight from Karachi to Multan.
Economic Supply Zones
2.9 This report divides the market in Pakistan into three supply zones toillustrate how supply and demand can be balanced. NRL and PRL fall under Zone 1,PARCO and Dhodak under Zone 2, and ARL under Zone 3, as shown in Table 2.2. Priorto the startup of PARCO, the two zones covered the coastal refineries and ARL.
Table 2.2: Economic Supply Zones Post-PARCO startup
Zone Refinery Geographical Demarcation
1 NRL + PRL Karachi + Sindh + Balochistan +- 20% of S. Punjab (up to Rahim Yar Khan)
2 PARCO (and 80% of S. Punjab + 50% of C. Punjab (up to Machike)Dhodak)
3 ARL 50% of C. Punjab + N. Punjab + NWFP + AJK
Notes: S. Punjab South Punjab; C. Punjab Central Punjab; N. Punjab North Punjab; NWFP NorthwestFrontier Province; AJK Azad, Jammu, Kashrnir.
Other Agencies
2.10 The Fuel Purchase Committee, which comprises representatives from thegovernment and the oil marketing companies, purchases crude oils. The conmmitteedetermines quantities and sources for the next year in advance on the basis of requestsfrom the refineries. Product importation is arranged under the same method as crudeimports, on a government-to-government basis determined by the committee's decisions.The allocation of products to the oil marketing companies-both domestically producedand imported-is determined on a basis administered by the Oil Company AdvisoryCommittee (OCAC), which is based in Karachi and made up of representatives from therefineries and oil marketing companies.
2.11 Whereas blending of products is carried out by the oil marketingcompanies, monitoring is the responsibility of the government through the HydrocarbonDevelopment Institute of Pakistan (HDIP), although the HDIP's function is simply to testsamples. Responsibility for sample collection and any subsequent action lies with theMiPNR; deputy commissioners in the provinces are also empowered to take samples.HDIP has technical service agreements with all registered lube oil plants to providequality control. At the dealer-retail level, there have historically been serious problemswith adulteration (for example, of gasoline with kerosene) with implications for fuelquality. The HDIP reports that between 1995 and 1998, close to 20 percent of gasolineand diesel samples tested failed to meet the required specifications.

30 Pakistan Clean Fuels
Refinery Configuration
2.12 The configurations and capacities of the four refineries are given in Table2.3. The ARL, NRL, and PRL facilities are hydroskimming refineries with semi-regenerative reformers. PARCO has a continuous catalyst regeneration (CCR) reformercapable of operating at 100 RON. This reformer needs to be operated at full capacity togenerate sufficient hydrogen for the Dieselmax unit, which converts vacuum gas oil intolow-sulfur diesel and fuel oil blend components. NRL has units for vacuum distillation andlube-base oil refining. In addition, approximately 1,000 barrels per day of reformate isdiverted to aromatics manufacture. At PRL, the full-range naphtha and kerosene arehydrotreated. None of the refineries has middle-distillate hydrodesulfurization.
Table 2.3: Configurations and Capacities of Refineries in Pakistan(thousand barrels per day)
Refinery Crude distillation Reformer Dieselmax Visbreaker Lubes
ARL 67.0 3.8 - - -
NRL 49.9 2.8 - - 3.8*
PARCO 35.0 5.0 22.5 15.6 -
PRL 100.0 14.8 - - -
* Equivalent to 180,000 tons per year of lubricants.Note: - not applicable.
Selection of Crude Oil
2.13 ARL processes northern and southern domestic crudes. This involves anaverage of 130 trucks arriving every day, with four times that number in transit at any time.The crude slate consists of a mixture of more than 40 different crudes ranging in densityfrom 12 to 68 °API gravity. The domestic crudes have a high wax content, but tend to havea low sulfur content. Prior to ARL's recent expansion, the coastal refineries were requiredto process at least 25 percent local southem crudes. Because of the increase in ARL's crudeoil demand after the expansion, some of the southern crudes are also transported to ARL byroad and the coastal refineries have been importing additional quantities to balance thisreduction in supply. The coastal refineries process Abu Dhabi, Iranian and Arabian lightcrudes. By covenant (see first bullet point below), PARCO will consume at least 40 percentAbu Dhabi crudes (Upper Zakum and/or Murban crudes), the balance being Arabian Light.
2.14 Although switching to low-sulfur crude is one way of achieving lower-sulfurdiesel and fuel oil, the crude mix is difficult to change for Pakistan refineries for thefollowing reasons:
Pakistan has a long history of close relationships with the Arab Gulfcountries. These relationships result in some preferential commercialtermns for crude oil purchases. In the case of the PARCO refinery, theinvestment by Abu Dhabi is tied to processing at least 40 percent AbuDhabi crude oil.

The Downstream Petroleum Sector 31
As Pakistan is inherently deficient in diesel and fuel oil, the yields fromthe Arabian crude oils are ideally suited for Pakistan.
All the refineries in Pakistan were designed to run Arabian Light crude oil. The closest low-sulfur crudes are either in North or West Africa or from Malaysia. Apart from having alower sulfur content, these crude oils have different yield slates (higher gasoline productionwould be especially undesirable given the gasoline surplus on the domestic market inPakistan in coming years), and none are suitable for processing to lubricants at NRL, asshown in Table 2.4. Even if Pakistan were to import these crudes, it would have to bear (a)the higher cost of the crude oil, (b) the incremental freight cost (around US$12 per ton fromWest Africa versus less than USS3 per ton from the Arabian Gulf), and (c) investment inmodifications to the refineries.
Table 2.4: Qualities of Low-Sulfur Crudes
Crude oil Arab Light Bonny Medium Brega Minas
Region Middle East West Africa North Africa Far East
Crude specific gravity (g/cc) 0.9 0.9 0.8 0.9
Crude sulfur (wt%) 1.9 0.2 0.2 0.1
C4 and lighter (wt% yield) 0.9 0.4 1.9 0.3
Naphtha C5 to 175°C (wt% yield) 19.0 9.1 28.8 10.2
Middle distillates, 175-350'C (wt% yield) 31.0 48.2 33.6 29.4
Residue, 350°C+ (wt% yield) 49.2 42.4 35.9 60.2
Sulfur in middle distillates, 175-350C (wt%) 0.9 0.1 0.1 0.0
Sulfur in residue, 350'C+ (wt%) 3.2 0.4 0.5 0.1
Suitable for lubricants? Yes No No No
Note: g/cc grams per cubic centimeter.
2.15 Individual refineries, however, may decide that it would make sense undercertain circumstances to switch to low-sulfur crude oils. For example, PRL has suggestedthe option of processing 80 percent Omani crude (which is limited in availability) and 20percent domestic crude which would enable the refinery to produce diesel withapproximately 0.5 percent sulfur and fuel oil with less than 2 percent sulfur.
Crude and Product Pipelines
2.16 PARCO receives crude by the existing pipeline. The pipeline is nearly 20years old and was carrying white products until PARCO came on stream. The bulk of theimported diesel used to be shipped to PARCO's pumping station and storage at Korangiin Karachi, from which it was pumped to the up-country depots. Since the startup ofPARCO refinery at the end of 2000, this pipeline has been used for transporting crude oil,reducing the diesel-handling capacity of the pipeline from the previous 4.2-4.5 milliontons to 1-1.5 million tons per year.
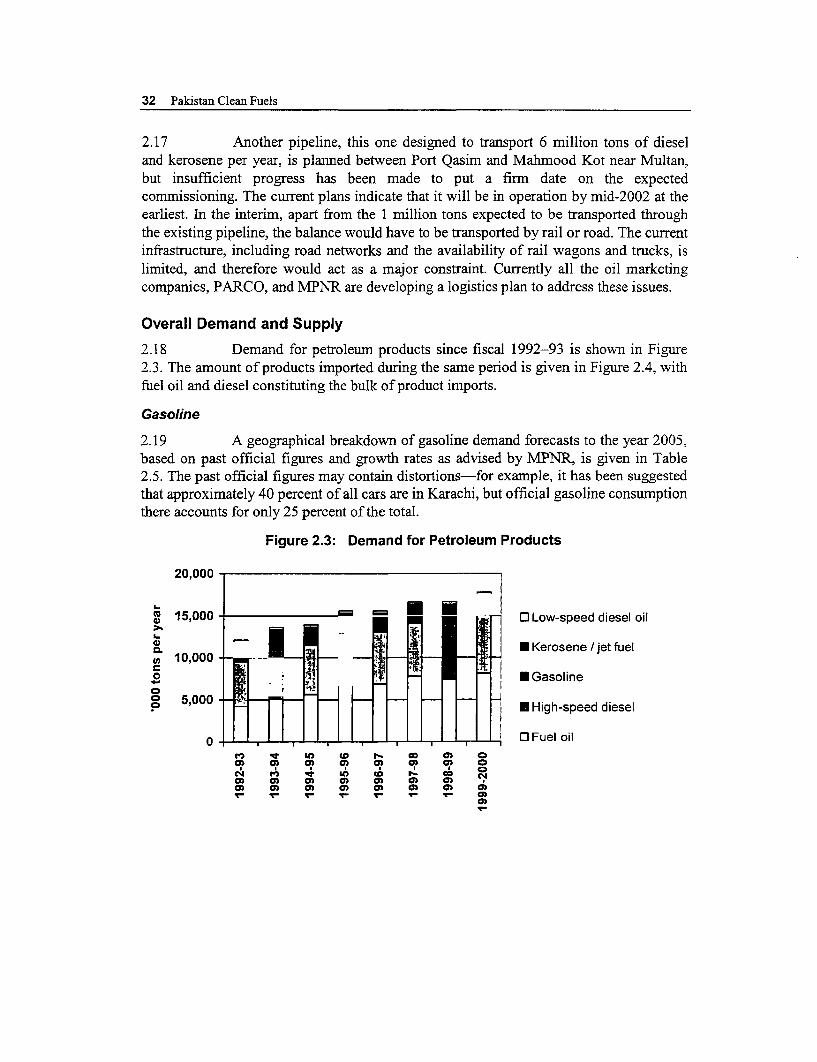
32 Pakistan Clean Fuels
2.17 Another pipeline, this one designed to transport 6 million tons of dieseland kerosene per year, is planned between Port Qasim and Mahmood Kot near Multan,but insufficient progress has been made to put a firm date on the expectedcommissioning. The current plans indicate that it will be in operation by mid-2002 at theearliest. In the interim, apart from the 1 million tons expected to be transported throughthe existing pipeline, the balance would have to be transported by rail or road. The currentinfrastructure, including road networks and the availability of rail wagons and trucks, islimited, and therefore would act as a major constraint. Currently all the oil marketingcompanies, PARCO, and MPNR are developing a logistics plan to address these issues.
Overall Demand and Supply
2.18 Demand for petroleum products since fiscal 1992-93 is shown in Figure2.3. The amount of products imported during the same period is given in Figure 2.4, withfuel oil and diesel constituting the bulk of product imports.
Gasoline
2.19 A geographical breakdown of gasoline demand forecasts to the year 2005,based on past official figures and growth rates as advised by MPNR, is given in Table2.5. The past official figures may contain distortions-for example, it has been suggestedthat approximately 40 percent of all cars are in Karachi, but official gasoline consumptionthere accounts for only 25 percent of the total.
Figure 2.3: Demand for Petroleum Products
20,000 -
' 15,000 - OLow-speed diesel oil
0.0 U Kerosene /jet fuel
0 10,000 E~~~~~ ~~~~Gasoline
o 5,000 - High-speed diesel
aw~~~~~~~~~~~~~ Fue oil O ON n at U7 ED0 0 e) 0) 0) cn 0) 0le 0 o I- co C I
CM - w o - co0) 0) 0) 0) 0) a) a)0) 0) 0) 0) 0) 0) 0) 0)
CD

The Downstream Petroleum Sector 33
Figure 2.4: Imports of Petroleum Products
15,0001
Cu 10,000 Gasoline
o High octaneC ~~~~~~~~~~~~~~~components
0o 5,000- | 11 11 | | | a | . Kerosene
* High speed diesel
0 E Fuel oilX t e to s e~~~~o m CDO 0~ (0 as .o 0 0a 0
0) 0) ) 0) 0) 0 0) N I, I I
a ) 0) 0 0 ) 0) 0)C) CD 0D 0D 0) 0D 0Y) 0)
Table 2.5: Pakistan Gasoline Demand Forecasts by Region(thousand tons per year)
Year Karachi Sindh Balochistan S. Punjab C Punjab N. Punjab NWFP AJK Total
2000 356 125 19 78 421 230 104 33 1,367
2003 378 132 21 82 446 244 111 35 1,450
2005 388 136 21 84 458 250 114 36 1,487
Notes: S. Punjab South Punjab; C. Punjab Central Punjab; N. Punjab North Punjab; NWFP Northwest FrontierProvince; AMK Azad, Jannmu, Kashmir.
2.20 Punjab is forecast to consume more than one-half of the total gasoline inPakistan owing to its relatively large population, geographic size, and economy. Theoverall demand for Punjab has been broken down into south, central, and north regionsbased primarily on the approximate population distribution for these regions within theprovince. This breakdown is required to evaluate the impact of gasoline production fromPARCO refinery on the overall gasoline pool and the demand/supply situation within theeconomic supply zones illustrated in Table 2.2.
2.21 From 2000 onwards, the commissioning of the PARCO refinery isexpected to switch Pakistan from having an overall gasoline/naphtha deficit to a surplus.More specifically, the production from PARCO will add about 710,000 tons per year ofgasoline to Pakistan's gasoline pool, resulting in a substantial surplus.
2.22 The Government of Pakistan is currently promoting compressed naturalgas (CNG) and liquefied petroleum gas (LPG) as cleaner altemative fuels on a significant

34 Pakistan Clean Fuels
scale. In 1999, there were about 40,000 CNG vehicles, increasing to 100,000 by the endof 2000. Because the government's fuel tax policy makes gasoline much more expensivethan CNG or diesel, CNG replaces mainly gasoline; thus a successful CNG program willreduce demand for gasoline and further skew the balance between supply and demand.
Diesel
2.23 Diesel is consumed mainly in four sectors: power, industry, transport, and"other government."'l On the basis of indications from various consumers in thesesectors, OCAC develops forecasts on behalf of MPNR. Since there is flexibility, both inrefinery processing and blending, to adjust the split between diesel and keroseneproduction, the demand for all the middle distillates-kerosene, jet fuel, and diesel-isshown in Table 2.6.
Table 2.6 Pakistan Diesel Demand Forecasts by Region, 2000-2005(thousand tons per year)
Year Product Karachi Sindh Balochistan S. Punjab C. Punjab N Punjab NWFP AJK Total
2000 Diesel 833 1,010 340 598 2,679 701 861 341 7,362
Jet fuels 498 3 16 5 173 89 37 0 821
Kerosene 51 30 23 17 209 78 75 24 508
2003 Diesel 1,013 1,229 416 727 3,260 853 1,047 414 8,956
Jet fuels 525 3 17 5 186 96 40 2 872
Kerosene 50 30 23 16 206 77 74 24 500
2005 Diesel 1,155 1,401 471 829 3,716 972 1,194 473 10,211
Jet fuels 548 3 18 5 197 102 43 0 916
Kerosene 50 30 23 16 205 76 73 24 496
Notes: S. Punjab South Punjab; C. Punjab Central Punjab; N. Punjab North Punjab; NWFP Northwest FrontierProvince; AJK Azad, Janunu, Kashn-mir.
2.24 This study has used the forecasts for middle distillates to ensureconsistency with the overall government's planning process. It is, however, worth notingthat the forecasts for growth in demand for middle distillates appear somewhat optimistic,particularly in comparison with recent historical trends. Most of the demand growth isdue to the 7 percent annual growth assumed in the transport sector. Even if the actualdemand growth is lower than the official forecasts, the ongoing heavy dependence onimports would continue, and the recommended mechanism relating to the diesel qualityimprovements would remain valid.
2.25 Total domestic supply of diesel was 1.4 million tons per year beforePARCO came onstream in late 2000; it will rise to 2.5 million tons per year once PARCO
In Pakistan, in the context of fuel consumption, the "other government" sector refers to public sectorinstitutions, primarily the armed forces.

The Downstream Petroleum Sector 35
becomes fully operational. An additional 1.1 million tons per year ofjet fuel and keroseneare produced.
Fuel Oil
2.26 Although demand for fuel oil increased at close to 10 percent per year in1992-1999, the annual rate of growth is anticipated to fall to around 2 percent in thisdecade. Most of the new power-generation plants will be based on natural gas rather thanfuel oil owing to ambitious gas development plans to capitalize on recent gas discoveriesin Pakistan. Currently around three-quarters of the total fuel oil is consumed in the powersector, with the balance being used by the cement and other industries (where the issue ofsulfur in fuel is not an environmental concern).
2.27 MPNR expects the total demand for fuel oil to reach around 11 milliontons by 2009-2010. Fuel oil consumption in each province is expected to grow, as theinfrastructure and the new electricity transmission grid was developed with furtherprojects in mind. Demand projections are shown in Table 2.7.
Table 2.7: Pakistan Fuel Oil Demand Forecasts, by Region(thousand tons per year)
Year Karachi Sindh Balochistan S. Punjab C. Punjab N. Punjab NWFP AJK Total
2000 1,985 555 1,865 3,994 501 166 349 31 9,446
2003 2,083 582 1,956 4,190 526 174 366 33 9,909
2005 2,173 607 2,041 4,372 548 182 382 34 10,340
Notes: S. Punjab South Punjab; C. Punjab Central Punjab; N. Punjab North Punjab; NWFP NorthwestFrontier Province; AJK Azad, Jamuu, Kashmir.Source: Calculations by Chem Systems based on MPNR statistics and projections.
2.28 The total production of fuel oil from the domestic refineries was around2.0 million tons in fiscal 1999-2000; the balance of around 6.1 million tons wasimported. Despite commencement of PARCO's operations in late 2000, imports of theorder of around 7 million tons will still be required, reaching a level of around 7.2 milliontons by 2010.
Fuel Quality
2.29 The majority of gasoline sold is the 87-RON grade with 0.35 g/l of lead.The two sources of octane are reformate and MTBE (MTBE has not been used since thePARCO startup). The levels of sulfur and olefins in gasoline are low.
2.30 The quantity and quality of diesel produced is shown in Table 2.8. (For theremainder of this report, ktpa is used as an acronym for "thousand [metric] tons perannum.") With the exception of ARL diesel, the level of sulfur in diesel is close to 1percent. Because of the large quantity of 1-percent-sulfur diesel produced at PARCO, thenational average for domestically produced diesel is 0.9 percent. This can be loweredsomewhat by blending kerosene into diesel.

36 Pakistan Clean Fuels
Table 2.8: Middle Distillate Production
D i e s e l Jet fuel/kerosene
Refinery ktpa % sulfur ktpa % sulfur
NRL 570 0.9 496 0.16
PRL 584 0.9 406 0.16
ARL 217 0.2 137 0.05
PARCO 1,142 1.0 668 0.17
Dhodak 10 0.5 13 0.10
TotalwithoutPARCO 1,381 0.8 1,053 0.14
Total with PARCO 2,523 0.9 1,721 0.15
2.31 Currently all the fuel oil being produced in Pakistan contains over 3.0percent sulfur, apart from a relatively small quantity produced at ARL with 1.2 percentsulfur. Because none of the refineries in Pakistan has residue desulfurization, theyproduce relatively high-sulfur fuel oil owing to their sour crude oil slate. Residue desul-furization would require significant capital investment, however, so the government willin the near-to-medium term rely on importing low-sulfur (1 percent) fuel oil to achieve itsobjective of bringing down the sulfur level in the overall fuel-oil pool. Although Pakistancurrently also imports 1-percent-sulfur fuel oil, it is for dedicated use by one of the powerplants located up-country near Multan. All the other fuel oil imports are of 3.5 percentsulfur. The sulfur in the domestic fuel oil pool is expected to increase from 2.9 percent toaround 3.1 percent with the startup of PARCO, as shown in Table 2.9.
Table 2.9: Fuel Oil Production
Refinery Production (ktpa) Wt% sulfur
NRI 634 3.3
PRL 959 3.2
ARL 350 1.2
Total without PARCO 1,942 2.9
PARCO 1,341 3.5
Total with PARCO 3,283 3.1
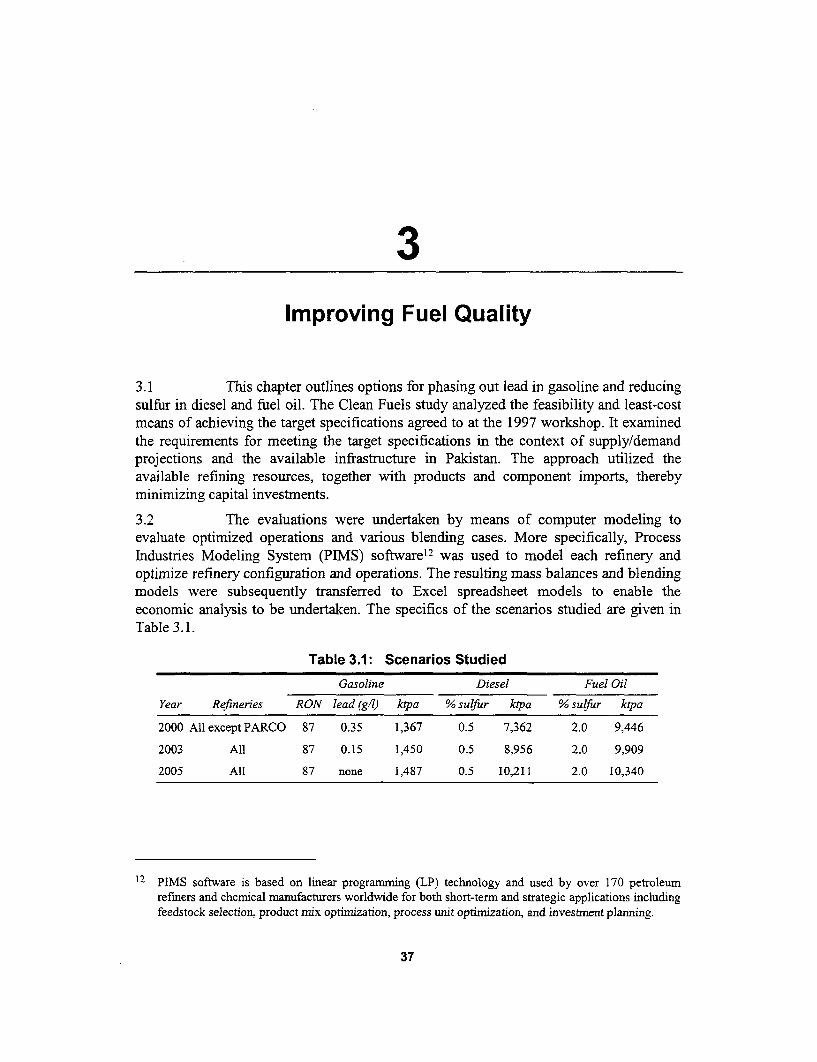
3Improving Fuel Quality
3.1 This chapter outlines options for phasing out lead in gasoline and reducingsulfur in diesel and fuel oil. The Clean Fuels study analyzed the feasibility and least-costmeans of achieving the target specifications agreed to at the 1997 workshop. It examinedthe requirements for meeting the target specifications in the context of supply/demandprojections and the available infrastructure in Pakistan. The approach utilized theavailable refining resources, together with products and component imports, therebyminimizing capital investments.
3.2 The evaluations were undertaken by means of computer modeling toevaluate optimized operations and various blending cases. More specifically, ProcessIndustnres Modeling System (PIMS) software'2 was used to model each refinery andoptimize refinery configuration and operations. The resulting mass balances and blendingmodels were subsequently transferred to Excel spreadsheet models to enable theeconomic analysis to be undertaken. The specifics of the scenarios studied are given inTable 3.1.
Table 3.1: Scenarios StudiedGasoline Diesel Fuel Oil
Year Refineries RON lead (g/l) ktpa % sulfur ktpa % sulfur ktpa
2000 All except PARCO 87 0.35 1,367 0.5 7,362 2.0 9,446
2003 All 87 0.15 1,450 0.5 8,956 2.0 9,909
2005 All 87 none 1,487 0.5 10,211 2.0 10,340
12 PIMS software is based on linear progranmming (LP) technology and used by over 170 petroleumrefmers and chemical manufacturers worldwide for both short-term and strategic applications includingfeedstock selection, product rmix optimization, process unit optimization, and investment planning.
37

38 Pakistan Clean Fuels
Underlying Assumptions
3.3 The refineries' respective capacities for processing crude oil were assumedto remain constant for the purpose of this analysis. The evaluations were based on datathe refineries provided on a calendar-year basis. The economic supply zones forindividual refineries, defined in Chapter 2, were used to assess regional supply anddemand balances. In case of regional surpluses or deficits, the lowest-cost inter-regionaltransfer options were adopted.
3.4 The analyses were carried out for 2000, 2003, and 2005. For the year 2000,the study assumed that PARCO was not yet operational. (Cost assumptions are detailed inAnnex 1.) Capital expenditures were annualized by taking 20 percent of the capital cost.It is important to bear in mind that the proposed schemes are designed to minimize theincremental cost of improving fuel quality for Pakistan as a whole, and not necessarily ateach individual refinery.
3.5 The base case for gasoline represents the legal limits and the octane splitin 1999: 40 percent 80 RON with 0.42 g/l of lead and 60 percent 87 RON with 0.64 g/l.Up to 15 percent by volume of MTBE was assumed to be permissible in gasoline (similarto the amount of MTBE in reformulated gasoline in the United States). On the basis ofinformation received from ARL, NRL, and PRL, the reformers at these refineries wereassumed to be capable of operating at 95-RON severity. Finally, Table 3.2 gives physicalparameters assumed in estimating the quality of the blended gasoline.
Table 3.2: Quality Parameters Used for Gasoline Blending Options
Specific Gravity R VP Benzene Total AromaticsComponent (g/cc) (psia) (volYo) (volY)
Light naphtha 0.68 10.0 1.5 2Full-range naphtha 0.72 9.0 1.0 6
Reformate (95 RONC or below) 0.82 6.0 6.0 60
Reformnate with isomerization (95RONC or below) 0.82 6.0 1.5 60
PARCO reformate (100 RONC) 0.84 4.8 7.0 65PARCO reformate with
isomerization (100 RONC) 0.84 4.8 2.0 65MTBE 0.75 7.4 0.0 0.0
Notes: RONC research octane number clear; g/cc gramns per cubic centimeter; RVP Reid vaporpressure; psia pounds per square inch absolute; vol% percent by volume.
Phaseout of Lead in Gasoline
3.6 The two changes in gasoline specifications that impact the refineries are(a) the elimination of the 80-RON grade in favor of 87 RON in 2000 and (b) the phaseoutof lead addition from 0.42g/l in 1999 to lead-free in 2005.

Improving Fuel Quality 39
The required clear (lead-free) octane requirements of the overall pool of gasoline blendcomponents, corresponding to changes in gasoline specifications, are shown in Table 3.3.
Table 3.3: Leaded and Clear RON Requirements
Year Minimum RON Maximum Lead (g/l) Minimum RONof Unleaded Gasoline
1999 80 0.42 73
2000 87 0.35 79
2003 87 0.15 82
2005 87 0.013 87
3.7 The most significant changes are as follows:
* From 1999 to 2000, the clear-octane (RONC) requirements of the overallgasoline pool increase by around 6 points as a consequence of the increasein product octane levels and the reduction in lead content. The 80-RONgrade with a lead content of 0.42 g/l can be produced by adding lead to arelatively naphthenic straight-run naphtha-as was practiced in Dhodak,and in ARL until the new naphtha reformer was commissioned. The 87-RON grade with a lead content of no more than 0.35 g/l requires blendingreformate and/or other high-octane blending components such as MTBEinto the gasoline.
In 2003, reducing the allowable lead to 0.15 g/l requires a 3-point clear-RON increase of the gasoline pool.
* In 2005, the reduction from 0.15 g/l lead to lead-free will require a further5-point clear-RON increase in the gasoline pool. This large increase is onaccount of the significant impact of the initial 0.15 g/l of lead gasoline.
3.8 Table 3.4 presents a summary of the average Pakistan gasoline pool withvarious levels of lead additions, and with the refineries operating at current reformerseverities (referred to as the "base case"). The table highlights the quality limitations ofthe current blending regimes. Only PARCO is judged able to achieve the required 87-RONC level. Dhodak has the lowest octane, reflecting its dependence on straight-runnaphtha.
3.9 The key considerations for phasing out gasoline and increasing pool octaneare as follows:
In 2000, prior to commissioning of PARCO, the clear octane of the overallgasoline pool is estimated to average 72.9 RONC, rising to 82.6 RON withthe addition of 0.35 g/l lead and 83.5 RON with the addition of 0.42 g/llead. The latter corresponds to a product mix of 40 percent 80 RON and 60percent 87 RON. Only ARL would come close to the required 87 RON ata lead level of 0.35 g/l.

40 Paidstan Clean Fuels
Table 3.4: Refinery Gasoline Production in Pakistan, 1999 (Base Case)
RON with lead content of:
Refine,y bpsd ktpa RONC 0.15 g/l 0.35 g/1 0.42 g/l
NRL 8,700 327 70.8 77.1 80.1 80.9
PRL 6,582 250 70.8 79.1 82.0 82.8ARL 10,000 396 78.2 83.8 86.5 87.5
Dhodak 1,823 70 62.0 70.5 75.4 76.7
Total without PARCO 27,105 1,043 72.9 79.6 82.6 83.5
PARCO 17,063 711 87.2 89.8 92.6 93.1
Total with PARCO 44,168 1,754 78.4 83.5 86.5 87.2
Note: bpsd barrels per stream day.
* In 2003, the overall octane increases because of PARCO, and also becauseof the elimination of full-range naphtha from ARL's gasoline pool. WhenPARCO runs at near capacity, the 1999 RONC of the total pool isestimated to rise to 78.4 as a result of the 100 RONC of the CCRreformate produced by PARCO. Owing to the increase in ARL's gasolineoctane, there will be an additional 3.5 octane points at ARL, bringing theoverall pool octane to around 79.3. Therefore, the total octane deficiencywill be around 3 points against the target of 82 RONC (87 RON at 0.15 g/llead).
By 2005, when all gasoline is to be lead-free, the estimated octanedeficiency is around 7 points. This assumes all refineries except PARCOwill be operating their reformers at 95 RON, which will increase the clear-octane pool from 79.3 to around 80.4. The surplus gasoline productioncapacity will provide the flexibility necessary to back out some of the low-octane naphtha, especially at NRL and PRL, replacing it with high-octanereformate or finished gasoline from PARCO. At the inland locations thereis a logistical incentive to achieve as close a practical balance betweenproduction and demand as possible.
The proposals for meeting the higher clear-octane requirements in 2000, 2003, and 2005 aredescribed next.
Proposals for 2000
3.10 The following blending operations and reforner severity are suggested forthe year-2000 scenario.
* NRL, PRL, and Dhodak blend imported MTBE to a maximum of 15percent by volume (vol%).
* Dhodak adds refornate from PRL in addition to imported MTBE to itsgasoline.
* ARL avoids blending full-range naphtha into gasoline as much as possible.By so doing, ARL increases the naphtha splitter cut-point such that all full-
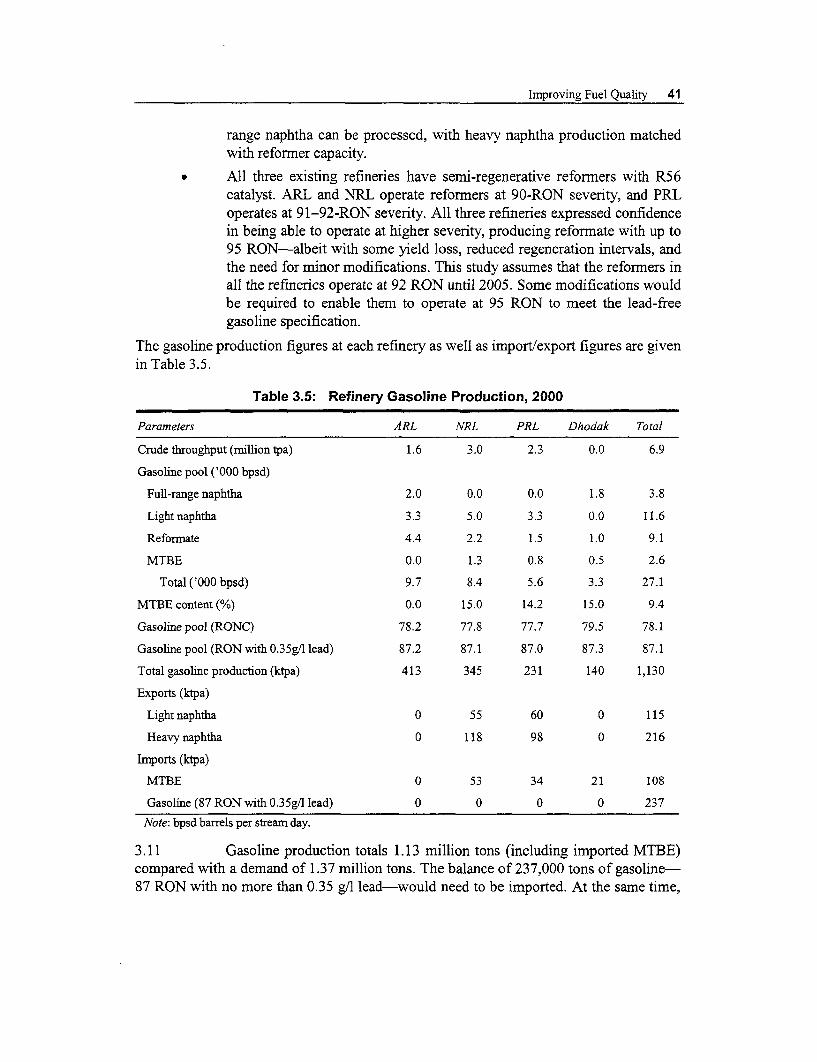
Improving Fuel Quality 41
range naphtha can be processed, with heavy naphtha production matchedwith reformer capacity.
All three existing refineries have semi-regenerative reformers with R56catalyst. ARL and NRL operate reformers at 90-RON severity, and PRLoperates at 91-92-RON severity. All three refineries expressed confidencein being able to operate at higher severity, producing reformate with up to95 RON-albeit with some yield loss, reduced regeneration intervals, andthe need for minor modifications. This study assumes that the reformers inall the refineries operate at 92 RON until 2005. Some modifications wouldbe required to enable them to operate at 95 RON to meet the lead-freegasoline specification.
The gasoline production figures at each refinery as well as import/export figures are givenin Table 3.5.
Table 3.5: Refinery Gasoline Production, 2000
Parameters ARL NRL PRL Dhodak Total
Crude throughput (million tpa) 1.6 3.0 2.3 0.0 6.9
Gasoline pool ('000 bpsd)
Full-range naphtha 2.0 0.0 0.0 1.8 3.8
Light naphtha 3.3 5.0 3.3 0.0 11.6
Refornate 4.4 2.2 1.5 1.0 9.1
MTBE 0.0 1.3 0.8 0.5 2.6
Total ('000 bpsd) 9.7 8.4 5.6 3.3 27.1
MTBE content (%) 0.0 15.0 14.2 15.0 9.4
Gasoline pool (RONC) 78.2 77.8 77.7 79.5 78.1
Gasoline pool (RON with 0.35g/l lead) 87.2 87.1 87.0 87.3 87.1
Total gasoline production (ktpa) 413 345 231 140 1,130
Exports (ktpa)
Light naphtha 0 55 60 0 115
Heavy naphtha 0 118 98 0 216
Inports (ktpa)
MTBE 0 53 34 21 108
Gasoline (87 RON with 0.35g/l lead) 0 0 0 0 237Note: bpsd barrels per stream day.
3.11 Gasoline production totals 1.13 million tons (including imported MTBE)compared with a demand of 1.37 million tons. The balance of 237,000 tons of gasoline-87 RON with no more than 0.35 g/l lead-would need to be imported. At the same time,

42 Pakistan Clean Fuels
a surplus of 331,000 tons of naphtha would need to be exported. Imports of around110,000 tons of MTBE would be required for blending at NRL, PRL, and Dhodak.
3.12 The physical properties of the above gasoline are illustrated in Table 3.6.The Reid vapor pressure (RVP) here and in all other scenarios remains below 9 poundsper square inch absolute (psia), which is acceptable given that ozone is not a serious airpollution concern in Pakistan. The amount of benzene in gasoline ranges between 2.4 and3.4 percent, with an average of 2.8 percent. The amount of total aromatics varies between17 and 29 percent, averaging 22 percent. As expected, ARL, which does not use MTBEin gasoline, has the highest benzene and total aromatics levels, since reformate is the onlysource of octane. The average sulfur content is estimated to be in the vicinity of 100 wtppm, which is good by any international standards. The reason for such a low level ofsulfur is that the only sulfur-rich streams in the gasoline pool are the light and full-rangenaphthas, and the most significant source of sulfur in gasoline in other countries, namelyFCC gasoline, is not present in Pakistan.
Table 3.6: Physical Properties of Gasoline in 2000
Parameter APIL NRL PRL Dhodak
RVP (psia) 8.0 8.6 8.6 7.9
Benzene (vol%) 3.4 2.4 2.5 2.4
Total aromatics (vol%) 29 17 17 22
Proposals for 2003
3.13 PARCO is assumed to be operating at full capacity by 2003. PARCO willneed to operate its CCR reformer at almost nameplate capacity in order to producesufficient hydrogen for its Dieselmax unit. Maximnizing the production of diesel isconsidered a priority, but the use of the reformer as a source of hydrogen results in asubstantial gasoline surplus within its supply zone. As the government has agreed to buythis surplus gasoline from PARCO, it would have to incur significant costs to transport alarge portion of this excess gasoline to Karachi for exports.
3.14 The other factor that will influence the overall gasoline pool is the reducednaphtha production at ARL owing to the reduction in domestic crude oil availability fromthe southern fields and also to the overall crude oil getting heavier with age of the fields.This will eliminate any full-range naphtha being blended into the gasoline pool (as wasdone in 2000). This change in crude slate will in turn reduce the amount of gasolineproduced at ARL, and the overall RON of the gasoline at ARL will increase from 78.2 in2000 to around 81.7.
3.15 The "optimum" scheme for 2003 focuses on minimization of internalfreight and purchase/transfer of high-octane blending components. The proposed blendingpattern is outlined in Table 3.7. The key features are as follows:

Improving Fuel Quality 43
* PARCO operates the reformer at 100-RON severity, thereby allowing theDieselmax unit to operate at full capacity. Some of the 100-RONCreformate from PARCO is transferred to Dhodak for blending.
* The gasoline production at the coastal refineries is cut back to produceonly the quantity required to meet the balance of demand in (EconomicSupply) Zone 1 after PARCO's gasoline has been consumed.
Table 3.7: Refinery Gasoline Production in 2003
Parameter ARL NRL PRL Dhodak PARCO Total
Crude throughput (nillion tpa) 1.5 3.0 2.3 0.0 4.7 11.5
Gasoline pool ('000 bpsd)
Full-range naphtha 0.0 0.0 0.0 1.8 0.0 1.8
Light naphtha 3.5 0.8 0.5 0.0 7.2 12.0
Refornate 4.3 1.5 1.1 0.0 0.0 7.0
Reformate (100 RON from 0.0 0.0 0.0 2.4 10.1 12.5PARCO)
Total ('000 bpsd) 7.8 2.3 1.6 4.2 17.3 33.3
Gasohne pool (RONC) 81.8 81.9 82.0 83.2 85.4 83.8
Gasoline pool (RON with 0.15g/1 87.3 87.0 87.0 87.3 90.0 88.7lead)
Total gasoline production (ktpa) 336 100 71 186 757 1,450
Exports (ktpa)
Light naphtha 0 183 142 0 0 325
Heavy naphtha 0 77 63 0 0 140
Refonmate 0 30 66 0 0 96
3.16 Exports of leaded gasoline would be difficult, considering that most of thedeveloping countries that could potentially have been a home for this gasoline are movingtoward low- or no-lead gasoline. Therefore, the option to cut back on gasoline productionto match demand and export the blendstocks as naphtha or as gasoline would depend onthe relative price differentials prevailing at the time. This study assumes that rather thanexporting blended (and leaded) gasoline, exporting gasoline blendstocks (reformate andnaphtha) would be more feasible.
3.17 Gasoline production at NRL and PRL falls to around 170,000 tons, with acorresponding increase in naphtha exports (relative to the year 2000) of approximately134,000 tons to reach a total of around 465,000 tons. In addition to this naphtha, about96,000 tons of reformate would also need to be exported from these refineries. As theoverall supply needs to match demand, the inherent assumption is that deficit in any zonewill be met by supplies from other zones with a surplus.

44 Pakistan Clean Fuels
3.18 The physical properties of the above gasoline are illustrated in Table 3.8.As a result of lead phasedown and elimination of MTBE, which served as a significantsource of octane in 2000, the level of benzene in gasoline increases to 4.5 percent onaverage, which is high by international standards. Total aromatics amount to an averageof 38 percent.
Table 3.8: Physical Properties of Gasoline in 2003
Parameter ARL NRL PRL Dhodak PARCO
RVP (psia) 7.8 7.4 7.4 6.7 7.1
Benzene (vol%) 4.0 4.5 4.5 4.4 4.7
Total aromatics (vol%) 34 41 41 40 39
Proposals for 2005
3.19 The combination of the country moving to lead-free gasoline and demandincreasing to around 1.5 million tons will require supplementing the octane pool. This canbe done by importing high-octane components and/or by investing in C5/C6(hydrocarbons with five and six carbon atoms, respectively) isomerization units toupgrade the light naphtha into higher-octane isomerate. Two scenarios, with and withoutisomerization, are discussed.
2005, No Isomerization
3.20 Achieving the no-lead specification in Pakistan without the use ofisomerate requires that the following issues be addressed:
* Even if the reformers at ARL, NRL, and PRL are run at 95 RON severity,the overall pool octane is only 80.4 RON. One of the options to enhancethe octane pool would be to cut back on the production from the coastalrefineries, while all the inland refineries will have to produce on-specgasoline.
* The RONC of Dhodak is 62. Despite blending MTBE to 15 percent, thedesired RONC of 87 cannot be achieved. Therefore, some reformate fromPARCO will have to be transferred to Dhodak to compensate for thisoctane deficit at Dhodak.
* ARL will be able to achieve a two-point increase over the 82 RON in 2003if the reformer is operated at 95 RON. However, it will still fall short ofthe target octane of 87 RONC. This target can be achieved by eitherblending MTBE or by moving some 100-RON reformate from PARCO.The latter is reconmmended because it is easier logistically, and will alsoassist PARCO in reducing the benzene and total aromatics content in itsgasoline (see below).
* After moving reformate to Dhodak and ARL, the octane deficit at PARCOwill have to be fulfilled by MTBE blending at PARCO. As mentioned
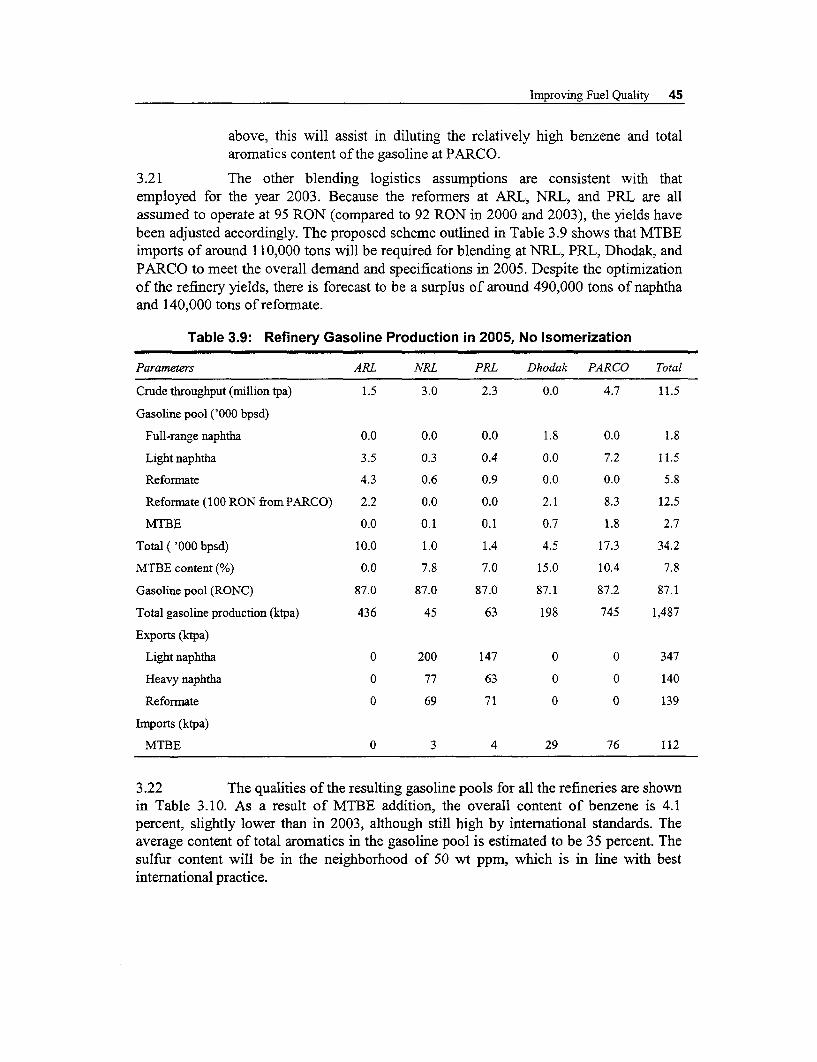
Improving Fuel Quality 45
above, this will assist in diluting the relatively high benzene and totalaromatics content of the gasoline at PARCO.
3.21 The other blending logistics assumptions are consistent with thatemployed for the year 2003. Because the reformers at ARL, NRL, and PRL are allassumed to operate at 95 RON (compared to 92 RON in 2000 and 2003), the yields havebeen adjusted accordingly. The proposed scheme outlined in Table 3.9 shows that MTBEimports of around 110,000 tons will be required for blending at NRL, PRL, Dhodak, andPARCO to meet the overall demand and specifications in 2005. Despite the optimizationof the refinery yields, there is forecast to be a surplus of around 490,000 tons of naphthaand 140,000 tons of reformate.
Table 3.9: Refinery Gasoline Production in 2005, No Isomerization
Parameters ARL NRL PRL Dhodak PARCO Total
Crude throughput (million tpa) 1.5 3.0 2.3 0.0 4.7 11.5
Gasoline pool ('000 bpsd)
Full-range naphtha 0.0 0.0 0.0 1.8 0.0 1.8
Light naphtha 3.5 0.3 0.4 0.0 7.2 11.5
Reformate 4.3 0.6 0.9 0.0 0.0 5.8
Reformate (100 RON from PARCO) 2.2 0.0 0.0 2.1 8.3 12.5
MTBE 0.0 0.1 0.1 0.7 1.8 2.7
Total ( '000 bpsd) 10.0 1.0 1.4 4.5 17.3 34.2
MTBE content (%) 0.0 7.8 7.0 15.0 10.4 7.8
Gasoline pool (RONC) 87.0 87.0 87.0 87.1 87.2 87.1
Total gasoline production (ktpa) 436 45 63 198 745 1,487
Exports (ktpa)
Light naphtha 0 200 147 0 0 347
Heavy naphtha 0 77 63 0 0 140
Reformate 0 69 71 0 0 139
Imports (ktpa)
MTBE 0 3 4 29 76 112
3.22 The qualities of the resulting gasoline pools for all the refineries are shownin Table 3.10. As a result of MTBE addition, the overall content of benzene is 4.1percent, slightly lower than in 2003, although still high by international standards. Theaverage content of total aromatics in the gasoline pool is estimated to be 35 percent. Thesulfur content will be in the neighborhood of 50 wt ppm, which is in line with bestinternational practice.

46 Pakistan Clean Fuels
Table 3.10: Physical Properties of Gasoline in 2005, No Isomerization
Parameter ARL NRL PRL Dhodak PARCO
RVP (psia) 7.2 7.3 7.3 6.9 7.4
Benzene (vol%) 4.6 4.2 4.3 3.6 4.0
Total arornatics (vol%) 41 38 39 32 32
2005, Isomerization
3.23 A gasoline production profile incorporating isomenzation in the year 2005has been developed as a way of lowering benzene and aromatics levels. Selection of themost appropriate isomerization technology is beyond the scope of this study, andtherefore a representative octane enhancement estimate has been used from publicdomain data (Maples 1993). This case assumes that three, relatively small-scaleisomerization units are installed at NRL, PRL, and PARCO. Some economies of scalecan be enjoyed if, rather than building smaller isomerization plants (650 and 1,050 barrelsper stream day [bpsd] at NRL and PRL, respectively), a larger (around 2,000 bpsd)isomerization facility is established at either NRL or PRL, with the correspondingnaphtha/isomerate transfer mechanism.
3.24 As shown in Table 3.11, installing isomerization units reduced theimported MTBE volumes by approximately 87,000 tons, naphtha exports by 54,000 tons,and reformate exports by 34,000 tons.
Table 3.11: Refinery Gasoline Production in 2005 with Isomerization
Parameters ARL NRL PRL Dhodak PARCO Total
Crude throughput (million tpa) 1.5 3.0 2.3 0.0 4.7 11.5
Gasoline pool (ktpsd)
Full-range naphtha 0.0 0.0 0.0 1.8 0.0 1.8
Light naphtha 3.5 0.3 0.3 0.0 4.2 8.3
Isomerate 0.0 0.5 1.0 0.0 3.0 4.5
Reformate 4.3 1.0 1.3 0.0 0.0 6.5
Reformate(lOORONfromPARCO) 2.2 0.0 0.0 2.2 8.1 12.5
MTBE 0.0 0.0 0.0 0.6 0.0 0.6
Total ('000 bpsd) 10.0 1.8 2.6 4.6 15.3 34.3
MTBE content (percent by volume) 0.0 0.0 0.0 13.0 0.0 1.7
Gasoline pool (RONC) 87.0 86.0 86.9 87.0 87.1 87.0
Total gasoline production (ktpa) 436 76 112 202 662 1,488
Exports (ktpa)
Light naphtha 0 180 112 0 0 292
Heavy naphtha 0 77 63 0 0 140
Reformate 0 54 51 0 0 105
Imports (ktpa)MTBE 0 0 0 25 0 25
Note: ktpsd thousand [rnetric] tons per stream day.

Improving Fuel Quality 47
3.25 Table 3.12 shows a comparison of gasoline quality with and without use ofisomerate. With the exception of ARL, which is not using isomerate in 2005, gasolinefrom the other refineries will see a fall in the amount of benzene, averaging 2.0 percentnationally. In the case of the isomerization option, total aromatics increase slightly atDhodak and PARCO because of the phaseout of MTBE, which acts as a diluent.
Table 3.12: Impact of Isomerization on Gasoline Physical Properties in 2005
Parameter Unit ARL NRL PRL Dhodak PARCO
RVP, without isomerization psia 7.2 7.3 7.3 6.9 7.4
RVP, with isomerization psia 7.2 8.7 9.0 6.9 7.9
Benzene, without isomerization vol% 4.6 4.2 4.3 3.6 4.0
Benzene, with isomerization vol% 3.5 1.1 0.9 1.3 1.5
Total aromnatics, without isomerization vol% 41 38 39 32 32
Total aromatics, with isomerization vol% 41 33 31 33 35
Diesel
3.26 The proposed plan involves reducing the limit on sulfur in diesel from 1percent to 0.5 percent. The local refineries will continue to produce relatively higher-sulfur diesel owing to the nature of the crude and the processing hardware.
3.27 The following altematives are available to reduce this sulfur level:
* Import both 0.5-percent- and 0.25-percent-sulfur diesel, and invest indiesel blending facilities
* Install distillate hydrotreating at the refineries
* Modify the crude mix, and import low-sulfur crudes.
Although installing distillate hydrotreating would reduce the sulfur levels to less than0.05 percent, it is an expensive option requiring a capital investment of at least US$205million, and as such is not considered an immediate or a short-term option for Pakistan.However, because Pakistan may want to pursue this option under the longer-term strategyto align itself with best intemational practice, preliminary economic assessment isprovided in Annex 1. The crude mix is difficult to modify for the reasons give in Chapter2. Therefore, this study focuses on imported diesel quality as a near-term strategy for fuelquality improvement.
3.28 The limit on sulfur of 0.5 percent can be achieved by blending the dieselproduced from the local refineries and surplus kerosene with sufficient imported 0.25-percent-sulfur diesel to achieve the target specification. The balance can be imported as0.5-percent-sulfur diesel.
3.29 Currently there is no infrastructure to support this blending operation andnew facilities would be required. Storage at Keamari would be used to handle imported0.5-percent-sulfur diesel to serve the Karachi and Balochistan markets by road. Any

48 Pakistan Clean Fuels
residual storage capacity can be used for intermediate storage prior to transfer to aproposed blending facility. This blending facility could be established in the KorangiIndustrial Area, which would be connected via pipelines to the refineries and the PARCOpipeline.
3.30 In the year 2000, Pakistan imported an estimated 6 million tons of diesel(see Table 3.13). Even if all of these imports were of 0.5-percent-sulfur diesel, the overallPakistan pool sulfur level would still be slightly higher than the desired 0.5 percent. Theoverall specification of 0.5 percent sulfur in the respective zone-wise pools could havebeen met by importing around 4 million tons of 0.5-percent-sulfur diesel and around 2million tons of 0.25-percent-sulfur diesel.
Table 3.13: Specification Blending for Diesel, 2000
Zone I Zone 2 TotalSupply/demand ktpa % sulfur ktpa % sulfur ktpa % sulfur
Demand 4,656 - 2,706 - 7,362 -
NRL production 570 0.90 - - 570 0.90
PRL production 584 0.90 - - 584 0.90
Dhodak production 10 0.50 - - 10 0.50
ARL production - - 217 0.20 217 0.20
Total domestic supply 1,164 0.90 217 0.20 1,381 0.79
Imports
0.5% sulfur 1,692 0.50 2,489 0.50 4,181 0.50
0.25% sulfur 1,800 0.25 0 0 1,800 0.25
Imports 3,492 0.37 2,489 0.50 5,981 0.42
Supply 4,656 0.50 2,706 0.48 7,362 0.49
Note: - not applicable.
3.31 The diesel blending becomes more complex in 2003 as a consequence ofadding the even-higher-sulfur diesel produced at PARCO to the overall pool in Pakistan.(While Dieselmax produces low-sulfur diesel, the diesel pool at PARCO comprises othercomponents high in sulfur.) By 2003, kerosene would also be substantially in surplusowing to the forecast reduction in demand. Therefore, refineries could either alter thedistillation cut points in order to yield more diesel and relatively less kerosene, or blendkerosene up to the maximum allowable 20 percent or so (remaining within the flash pointlimits). If these blending modifications are not undertaken, the total imports are forecastto exceed 6 million tons. This blending of kerosene into diesel would reduce the dieselimports by the same quantity in 2003. The addition of kerosene would also reduce thesulfur level in the domestic diesel pool by around 0.1 percent, to 0.8 percent.
3.32 Even if the refineries carry out the blending of lower-sulfur kerosene,substantial imports of 0.5- and 0.25-percent-sulfur diesel will still be required to meet the

Improving Fuel Quality 49
overall 0.5-percent-sulfur requirements. Blending around 4 million tons of 0.25-percent-sulfur diesel and 2 million tons of 0.5-percent-sulfur diesel with the domestically pro-duced diesel will be required. It is assumed that the demand in Karachi will be met solelyby imports of 0.5-percent-sulfur diesel. The proposed scheme is given in Table 3.14.
Table 3.14: Specification Blending for Diesel, 2003
Zone I Zone 2 Zone 3 TotalSupply/demand ktpa % sulfur ktpa % sulfur ktpa % sulfur ktpa % sulfur
From Refineries
NRL 687 0.77 - - - - 687 0.77
PRL 716 0.76 - - - - 716 0.76
PARCO - - 1,415 0.94 - - 1,415 0.94
Dhodak - - 10 0.49 - - 10 0.49
ARL - - - - 217 0.20 217 0.20
Total 1,403 0.77 1,426 0.94 217 0.20 3,046 0.81
Interzone transfers
FromZone I - - 1,116 0.50 0 - - -
FromZone 2 0 - - - 2,830 0.50 - -
Imports
For specification blend 1,500 0.25 2,500 0.25 0 0.25 4,000 0.25
Only for Karachi 1,013 0.50 0 0.00 0 0.00 1,013 0.50
Balance imports 0 0.50 0 0.50 897 0.50 897 0.50
Supply 3,916 0.50 5,041 0.50 3,944 0.48 8,956 0.49
Demand 2,800 - 2,212 - 3,944 - 8,956 -
Surplus for interzone transfer 1,116 0.50 2,830 0.50 0 - -
Note: - not applicable.
3.33 The main blending would be carried out at Karachi and Mahmood Kotowing to the availability of the required infrastructure and the adjacent refineries. Around1.1 million tons of blended diesel would be transported from Karachi to Zone 2. Similarlythe surplus of around 2.8 million tons from Zone 2 would have to be transported to Zone3. This should result in an overall balance, least freight cost, and all regions in Pakistanhaving access to low-sulfur diesel.
3.34 A similar approach is adopted to achieve the diesel balance in 2005, bothin terms of overall demand as well as specifications. The surpluses from Zones 1 and 2fall significantly owing to the growth in demand in these regions. The results are shownin Table 3.15.
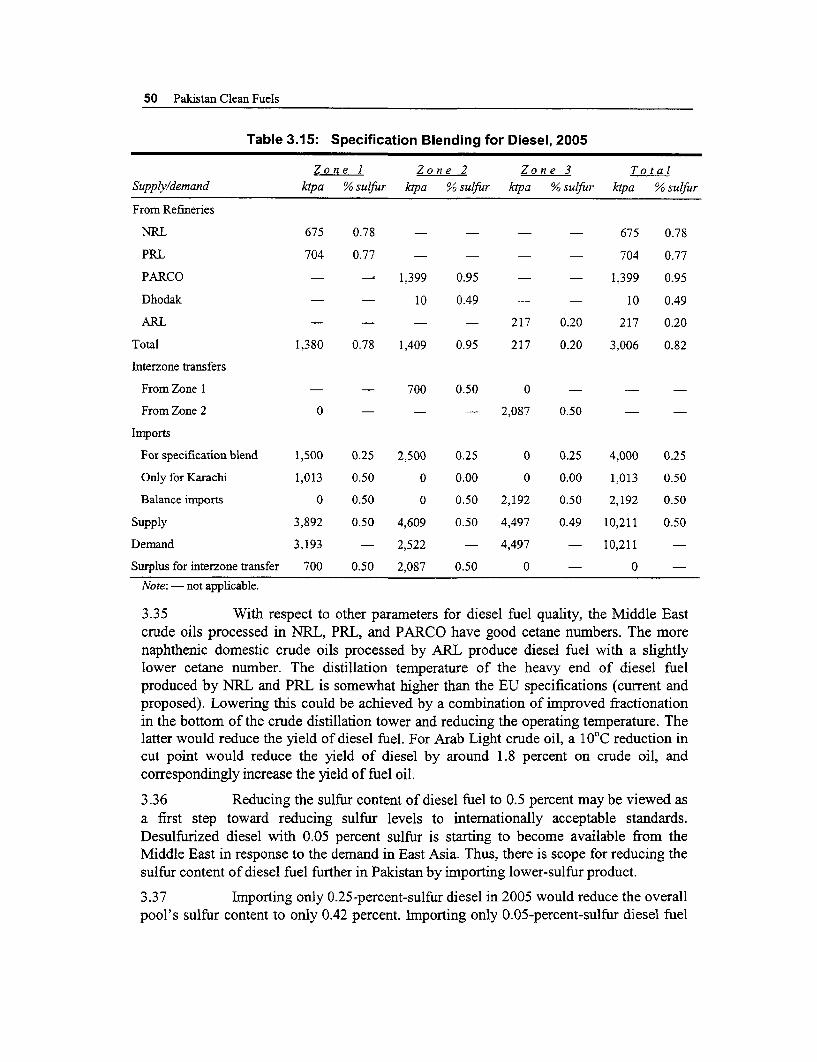
50 Pakistan Clean Fuels
Table 3.15: Specification Blending for Diesel, 2005
Zone I Zone 2 Zone 3 Total
Supply/demand ktpa % sulfur ktpa % sulfiur ktpa % sulfur ktpa % sulfur
From Refineries
NRL 675 0.78 675 0.78
PRL 704 0.77 - - - - 704 0.77
PARCO - - 1,399 0.95 - - 1,399 0.95
Dhodak - - 10 0.49 - - 10 0.49
ARL - - - - 217 0.20 217 0.20
Total 1,380 0.78 1,409 0.95 217 0.20 3,006 0.82
Interzone transfers
FromZone I - - 700 0.50 0 - - -
From Zone 2 0 - - - 2,087 0.50 - -
Imports
For specification blend 1,500 0.25 2,500 0.25 0 0.25 4,000 0.25
Only for Karachi 1,013 0.50 0 0.00 0 0.00 1,013 0.50
Balance imports 0 0.50 0 0.50 2,192 0.50 2,192 0.50
Supply 3,892 0.50 4,609 0.50 4,497 0.49 10,211 0.50
Demand 3,193 - 2,522 - 4,497 - 10,211 -
Surplus for interzone transfer 700 0.50 2,087 0.50 0 - 0 -
Note: - not applicable.
3.35 With respect to other parameters for diesel fuel quality, the Middle Eastcrude oils processed in NRL, PRL, and PARCO have good cetane numbers. The morenaphthenic domestic crude oils processed by ARL produce diesel fuel with a slightlylower cetane number. The distillation temperature of the heavy end of diesel fuelproduced by NRL and PRL is somewhat higher than the EU specifications (current andproposed). Lowering this could be achieved by a combination of improved fractionationin the bottom of the crude distillation tower and reducing the operating temperature. Thelatter would reduce the yield of diesel fuel. For Arab Light crude oil, a 10°C reduction incut point would reduce the yield of diesel by around 1.8 percent on crude oil, andcorrespondingly increase the yield of fuel oil.
3.36 Reducing the sulfur content of diesel fuel to 0.5 percent may be viewed asa first step toward reducing sulfur levels to internationally acceptable standards.Desulfurized diesel with 0.05 percent sulfur is starting to become available from theMiddle East in response to the demand in East Asia. Thus, there is scope for reducing thesulfur content of diesel fuel further in Pakistan by importing lower-sulfur product.
3.37 Importing only 0.25-percent-sulfur diesel in 2005 would reduce the overallpool's sulfur content to only 0.42 percent. Importing only 0.05-percent-sulfur diesel fuel

Improving Fuel Quality 51
would reduce the overall pool to 0.28 percent sulfur. Any further reduction in sulfurwould therefore require investment in hydrodesulfurization in the refineries in Pakistan,especially at NRL, PRL, and PARCO, which process higher-sulfur crude oils.
Fuel Oil
3.38 This study did not consider the option of setting a limit of 2 percent onsulfur in fuel oil throughout Pakistan because the local refineries would not be able toproduce lower-sulfur fuel oil without sizable investment in hydrodesulfurization. Instead,the study focused on the following:
* Achieving the planned reduction in average sulfur content of the fuel oil to2 percent (in line with the government's stated target, but not through adirect mandate on fuel quality). This is expected to be achieved byimporting both low- and high-sulfur fuel oils.
* Optimizing the allocation of fuel oil, by ensuring that the lower-sulfurproduct is utilized where possible in the more environmentally sensitiveregions (for example, by setting tighter emission standards or a limit onsulfur for those industries operating in densely populated areas).
This study did not evaluate residue hydrotreating because it is an extremely expensiveoption that would not be feasible for Pakistan's relatively small refineries.
3.39 The alternatives available to reduce sulfur levels in fuel oil and sulfuremissions in general are to:
* Modify the crude mix, and import low-sulfur crudes
* Install flue gas desulfurization (FGD) at the larger power plants
* Increase the use of natural gas.
3.40 To understand the impact of changing the crude mix, in addition to thefactors discussed in Chapter 2, it is informative to look at the contribution to the overallpool's sulfur content in 2003 as illustrated in Figure 3.5. NRL is confined by the need toproduce lubricants (as discussed earlier), and PARCO is limited by the requirement toprocess 40 percent Abu Dhabi crude. As a result, their contribution to the overall sulfurpool of lower-sulfur fuel oil refined from low-sulfur crudes would be small. Therefore,switching to lower-sulfur crudes was not considered in this study. FGD is discussed inAnnex 1.

52 Pakistan Clean Fuels
Figure 3.5: Contribution to Sulfur Contentof Overall Fuel Oil Pool, 2003
NRL ARL8% A2%
PARCOJ,16% Imports
64%
3.41 To lower the overall content of sulfur in fuel oil, the recommended optionis to import lower-sulfur fuel oil, albeit at a substantial incremental cost. Theprioritization of supply to the various consumers could be based on the relative proximityto urban centers. It is worth noting that 4 of the 14 power plants consume around 80percent of the total fuel oil consumed by the sector.
3.42 Table 3.16 shows the fuel oil balances and import levels required in eachzone to reduce the overall pool's sulfur content to 2 percent in the year 2000. Over two-thirds of fuel oil imported would need to contain only I percent sulfur to achieve anational average of 2 percent.
Table 3.16: Fuel Oil Pools, 2000
Zone 1 Zone 2 Total
Supply/Demand ktpa % sulfur ktpa % sulfur ktpa
Demand 8,750 - 696 - 9,446
Supply
Production
NRL 634 3.3 - - 634
PRL 959 3.2 - - 959
ARL - - 350 1.2 350
Imports
3.5% sulfur 2,158 3.5 246 3.5 2,404
1.0% sulfur 5,000 1.0 100 1.0 5,100
Total supply 8,750 2.0 696 2.0 9,446
Note: - not apphcable.

Improving Fuel Quality 53
3.43 By 2003, PARCO is assumed to be fully operational, and the supply zonesaltered to incorporate its supplies. The other impact on supply will come from someadditional fuel oil produced at ARL, as the domestic southem crudes are expected to getheavier (i.e., yielding more fuel) over time. The demand and supply for the three zonesare presented in Table 3.17 and Table 3.18 for 2003 and 2005, respectively. In 2003,despite importing only 1 -percent-sulfur fuel oil, Zone 2 will have an overall sulfur levelslightly above the 2 percent target because of the relatively high-sulfur fuel oil producedat PARCO.
Table 3.17: Fuel Oil Pools, 2003
Zone I Zone 2 Zone 3 Total
Supply/demand ktpa % sulfur ktpa % sulfur ktpa % sulfur ktpa
Demand 5,459 - 3,614 - 836 - 9,909
Supply
Production
NRL 780 3.3 - - - - 780
PRL 1,000 3.2 - - - - 1,000
PARCO - - 1,540 3.5 - - 1,540
ARL - - - - 483 1.2 483
Imports
3.5% sulfur 660 3.5 0 - 300 3.5 960
1.0% sulfuir 3,019 1.0 2,074 1.0 53 1.0 5,146
Total supply 5,459 2.0 3,614 2.1 836 2.0 9,909
Note: - not applicable.
Table 3.18: Fuel Oil Pools, 2005
Zone I Zone 2 Zone 3 Total
Supply/demand ktpa % sulfur ktpa % sulfur ktpa % sulfur ktpa
Demand 5,696 3,772 872 10,340
Supply
Production
NRL 870 3.3 - - - - 870
PRL 1,020 3.2 - - - - 1,020
PARCO - - 1,540 3.5 - - 1,540
ARL - - - - 550 1.2 550
Imports
3.5% sulfur 500 3.5 0 - 300 3.5 800
1.0% sulfur 3,306 1.0 2,232 1.0 22 1.0 5,560
Total supply 5,696 2.0 3,772 2.0 872 2.0 10,340Note: - not applicable.

54 Pakistan Clean Fuels
Incremental Cost of Fuel Quality Improvement3.44 Calculations were carried out to assess the overall impact of the fuelquality improvement initiatives on Pakistan. Those required for making individualinvestment decisions were not undertaken, since the objective of this study was tocompute the order-of-magnitude incremental cost for Pakistan as a whole withoutoptimizing investment at each refinery. Wherever possible, recommended solutions havefocused on making the best use of the existing facilities, rather than embarking on largecapital expenditure programs. The methodology adopted has been directed towarddeveloping least-cost options that are practical and relatively easy to implement.
3.45 The following step-by-step approach was taken to deternine the economicimpact of the fuel quality improvements recommended in the foregoing sections:
Step 1 Establish a "market parity" pricing mechanism that is representative of thegrades/qualities of refined products being considered.
Step 2 Evaluate the overall incremental octane requirements for gasoline and theimport requirements for lower-sulfur diesel and fuel oil.
Step 3 Compare these estimates with the "base case." The base case assumesmeeting the forecast demand volumes for the selected reference years(2000, 2003, and 2005) for each product, but retaining the product qualityspecifications in place in the year 1999. Thus, under the base case gasolinequality would remain at 80 and 87 RON with a lead content of 0.42 and0.64 g/l, respectively. The limits on sulfur in diesel and fuel oil wouldcontinue to remain at a maximum of 1.0 and 3.5 percent by weight,respectively.
Step 4 Estimate the incremental cost for the recommended cases.
3.46 The required capital investments were also estimated and reported, theoverall objective being to minimize them so as to cover only the required improvements.Although the economics and attractiveness of these individual projects were notcalculated for the purpose of this study, the projects are considered likely to offer modest,rather than high, economic returns. More details are given in Annex 1.
Refined Product Pricing Basis
3.47 The price forecasts used in this study were those developed by ChemSystems (U.K.). This study assumed a slightly declining trend in crude oil price (inconstant dollars); the refined products also show a similar trend. A forecast improvementin refining margins and tightening demand-supply situation will result in prices increasingin real terms during 2001-02, and then following the crude oil price trend beyond 2003-04. It should be noted that the incremental cost of fuel quality improvement dependsprimarily on the price differences between various grades of the finished petroleumproducts rather than the absolute price levels. Annex 1 explains the development ofappropriate prices for gasoline, diesel, and fuel oil corresponding to the Pakistan marketon the basis of Chem Systems' price forecasts.

Improving Fuel Quality 55
3.48 Over the past decade, the rising price of lead has converged with the costof producing octane in refineries or buying octane through the use of high-octaneblendstocks such as MTBE. As a result, there is currently little economic motivation toadd lead. This is demonstrated in Table A1. I of Annex 1.
3.49 This study assumed a price difference of US$1.70 per ton between 0.5-and 1.0-percent-sulfur diesel fuels, and of US$2.50 per ton between 0.5- and 0.25-percent-sulfur diesels. For fuel oil, the difference between 3.5 and 1.0 percent sulfur wasassumed to amount to US$20 per ton.
Economics for Gasoline
3.50 The gasoline economic evaluations were undertaken on the basis of thefollowing distinct, but related, methodologies:
* Free-market pricing: Evaluating the cost of introducing higher-qualitygrades (higher octane and lower lead), based on free-market pricing, andalso expressed per liter of (domestically consumed) gasoline.
* Cost to Pakistan: A single-year snapshot of the net impact of imports,exports, and annualized capital expenditures (taken as 20 percent ofcapital).
* Isomerization economics: Comparison of the annualized capitalexpenditures versus non-capital alternatives (such as importing MTBE),taking account of the net impact on imports, exports, and operating costs.
3.51 The first two cases were undertaken for 2000, 2003, and 2005 comparedagainst a 1999 reference grade structure (but based on the demand of the year beingevaluated). The isomerization economics were carried out for 2005 only, because themain implication is the level of benzene and total aromatics in the unleaded gasolineproduced. The startup of PARCO in the year 2000 complicates this study because itbrings in a significant boost in octane supply capabilities compared to the 1999 referenceyear. The incremental costs for all the three years in this study are based on the 1999gasoline octane and quality structure rather than that following the Parco startup.
3.52 The free-market pricing scenario is shown in Table 3.19. The comparisonshows that the net cost of introducing higher-octane gasoline should be largely offset bythe savings through reductions in the cost of lead purchases.
3.53 The recommended plan in this study requires some additional storage atNRL and PRL for naphtha and MTBE. Furthermore, when lead is eliminated, furtherinvestment would be required to revamp the reformers at all refineries other than PARCOso as to produce 95-RONC reformate rather than the current 92. The estimated capitalinvestment requirement associated with these initiatives is US$2 million for storagefacilities at NRL and PRL, and US$9 million for reformer modifications at ARL, NRL,and PRL. The overall incremental cost to the refineries in Pakistan is shown in Table3.20.

56 Pakistan Clean Fuels
Table 3.19: Gasoline Quality Improvement:Free-Market Pricing
Parameter 2000 2003 2005
Demand (ktpa) 1,367 1,450 1,487
Base-case RONC 73 73 73
Reconmnended case RONC 79 82 87
Incremental RONC 6 9 14
Total octane cost (US$ million) 9.0 14.4 22.9
Total lead savings (US$ million) -5.0 -13.0 -18.0
Net cost impact (US$ nrillion) 4.0 1.4 4.9
Cost per liter (US cents) 0.3 0.1 0.3
Note: 1998 U.S. dollars and cents.
Table 3.20: Gasoline Quality Improvement: Cost to Pakistan Refineries
Parameter 2000 2003 2005
Change in imports Gasoline MTBE Total Gasoline MTBE Total Gasoline MTBE Total
Incremental import costs (US$ 0.5 11.9 12.4 0 0 0 0 27.1 27.1million)
Change in exports Reformate Naphtha Reformate Naphtha
Incremental export revenues 0.0 -6.2 -6.2 60.1 47.9 12.2 43.2 -50.7 -7.5(US$ million)
Total impact (USS million) 6.2 12.2 19.6
Incremental freight cost (US$ 0.2 -5.1 -2.3million)
Total lead savings (US$ -5.0 -13.0 -18.0million)
Charge for capital investment
Naphtha and MTBE 0.4 0.4 0.4storage at NRL and PRL(US$ million)
Revamp reformers at 1.8NRL,PRL and ARL toproduce 95 RON (US$million)
Net impact (US$ million) 1.8 -5.5 1.5
Cost per liter (US cents) 0.1 -0.3 0.1
Note: 1998 U.S. dollars and cents.

Improving Fuel Quality 57
3.54 Although Pakistan will be able to eliminate lead completely by 2005, someimported MTBE will still be required at NRL, PRL and PARCO. This will also dependon the Govermment of Pakistan's decision on whether to impose benzene and aromaticsspecifications comparable to those in other Asian countries. Incorporating isomerizationwill assist in reducing the amount of naphtha and reformate exports at relatively lesscompetitive prices; it will also result in reduced MTBE imports. An estimate of thecapital investment and operating costs for installing isomerization units at NRL, PRL andPARCO is outlined in Table A1.6. The total capital cost, including naphtha hydrotreatersand naphtha splitter modifications, is US$56 million. The incremental cost of installingisomerization units in 2005 is shown in Table 3.21. The table shows that there is littleincentive to install isomerization purely on economic grounds. The main reason is that thecapacities of the units are very small and therefore lack suitable economies of scale.However, installing isomerization units would achieve a dilution of the overall benzeneand aromatics in the gasoline blend, although at a significant cost.
Table 3.21: Costs of Isomerization in 2005
Parameter No Isomerization Isomerization Change
Savings in MTBE imports cost (US$ million) -21
Change in exports Reformate Naphtha Reformate Naphtha
Exports revenue reduction (USS rnillion) -26 -71 -19 -63 14
Total impact (US$ million) - - - - -6.8
Reduction in freight cost (US$ million) - 1.6 - 0.3 -1.3
Charge for capital investment
Naphtha and MTBE storage at NRL and PRL - 0.4 - 0.4 0.0(US$ rnillion/year)
Revamp reformers at NRL,PRL, and ARL to - 1.8 - 1.8 0.0produce 95 RON (US$ million/year)
Isomerization - - - 11.1 11.1
Incremental capital charge (US$ million/year) - - - - 11.1
Isomerization operating cost (US$ million/year) - - - - 2.6
Net impact (US$ million) - - - - 5.7
Cost per liter (US cents) - - - - 0.3
Note: 1998 U.S. dollars and cents. - not applicable.
Incremental Cost of Diesel Sulfur Reduction
3.55 Key observations concerning the financial impact of the options developedfor achieving the desired reduction in sulfur to 0.5 percent from around 1 percent are asfollows:

58 Pakistan Clean Fuels
The volume of imports is forecast to remain at almost the same levelbetween 2000 and 2003, because production from PARCO is estimated tobe almost equal to the growth in demand over this period.
* In order to maintain the quality of diesel at 0.5 percent sulfur, more thantwice the volume of 0.25-percent-sulfur diesel as compared to 2000 willneed to be imported in 2003 and 2005. This reflects the high level of sulfurin diesel from PARCO.
* Blending facilities and interconnecting piping will be required to ensure aconsistent supply of the desired-quality diesel to all of Pakistan. This isbecause the domestic refineries will continue to produce relatively high-sulfur diesel, whereas imports will be of much better quality.
3.56 As shown in Annex 1 in Table A1.8, a total investment of approximatelyUS$10 million will be required to construct the infrastructure for blending the high-sulfur, domestically produced diesel with lower-sulfur imported diesel to achieve thedesired uniform specification of 0.5 percent sulfur in Pakistan. In order to estimate theannualized costs for implementing the diesel quality initiatives, 20 percent of thisinvestment has been included. The total incremental cost consists of the additional costsof importing better quality diesel and the charge on this investment. A summary is givenin Table 3.22.
Table 3.22: Cost of Reducing Sulfur in Diesel Fuel
Year Parameter Cost
2000 Incremental imports cost (US$ mnillion) 14.7
Annualized capital (US$ million) 2.0
Total cost (US$ million) 16.7
Cost per liter (US cents) 0.3
2003 Incremental imports cost (US$ million) 20.0
Annualized capital (USS million) 2.0
Total cost (US$ million) 22.0
Cost per liter (US cents) 0.3
2005 Incremental imports cost (US$ million) 22.2
Annualized capital (US$ million) 2.0
Total cost (US$ million) 24.2
Cost per liter (US cents) 0.3
Note: 1998 U.S. dollars and cents.
3.57 As discussed earlier, any more-stringent specifications beyond 2005 wouldrequire investment in diesel hydrodesulfurization at the NRL, PRL, and PARCOrefineries. An order-of-magnitude estimate of the total capital cost is US$205 million, asshown in Table Al.10 in Annex 1, resulting in desulfurizing 3 million tons per year of

Improving Fuel Quality 59
diesel down to 0.05 percent sulfur. The achievement of even lower sulfur levels,combined with de-aromatization, would require more severe hydrotreatment and involveup to 30 percent more capital investment. In the case of NRL and PRL, which depend onthe small semi-regenerative reformers for hydrogen production, hydrogen availabilitywould be tight. A hydrogen shortage in turn could result in the possible need foradditional investment for hydrogen production. This would also be true for PARCO, asthe hydrogen production is balanced between the production from the reformer andconsumption by Dieselmax unit.
3.58 A comparison of discounted cash-flow analysis between a 0.5-percent-sulfur diesel pool without investment in hydrodesulfurization and a 0.25-percent-sulfurpool with investment in hydrodesulfurization shows that, assuming a 10 percent discountrate, the total discounted cost is around US$226 million over the period 2003-2015. Theeconomic incentive of only US$2.5 per ton (0.5 versus 0.25 percent sulfur) is notsufficient to impact the overall situation. Therefore, any investment inhydrodesulfurization would have to be based on environmental considerations rather oneconomic ones.
Economics of Fuel-Oil Sulfur Reduction
3.59 The cost of lowering the sulfur content in fuel oil to 2 percent averagedover Pakistan is substantial. The results are given in Table 3.23. A comparison ofinstalling an FGD unit at a power plant and using lower-sulfur fuel oil is given in TableA1.12 in Annex 1. The cost of installing an FGD unit is also substantial, and may notrepresent a more attractive solution than importing lower-sulfur fuel oil. More analysis isneeded to evaluate the two options on a plant-by-plant basis.
Table 3.23: Cost of Reducing Sulfur in Fuel Oil
Year Parameter 3.5% Sulfur 1% Sulfur Total Cost(ktpa) (ktpa) (ktpa) (1998 US$ million)
2000 Base-case imports 7,504 0 7,504 457
Proposed-case imports 2,404 5,100 7,504 561
Cost differential - - - -104
2003 Base-case imnports 6,106 0 6,106 451
Proposed-case imports 960 5,146 6,106 556
Cost differential - - - -105
2005 Base-case imports 6,360 0 6,360 430
Proposed-case imnports 800 5,560 6,360 544
Cost differential - - - -114
Note: - not applicable.


4
Building a National Consensus
4.1 Two workshops were held in Islamabad at the end of March 2001 todiscuss the findings of the study described in Chapter 3 and reach a consensus on whatconcrete steps to take in the coming months. The target audience for the first workshop,hosted by the Ministry of Environment, Local Govenment, and Rural Development, wasstakeholders in the environment sector. Attending the workshop were representativesfrom the Pakistan Environment Protection Agency (PEPA), other government agencies,NGOs, universities, research institutions, and one refinery. The second workshop wasorganized by MPNR, aiming specifically to go over the technical details of the studyfindings with the refiners and oil marketing companies. The workshop programs aregiven in Table 4.1.
Table 4.1: Workshop Programs
Topic Speaker
26 March 2001: Ministry of Environment, Local Government, and Rural DevelopmentOpening remarks Mr. Sheikh Ghazanfar Hussain, Additional Secretary,
Ministry of Environment, Local Government, andRural Development
Urban Air Quality Management in Pakistan Mr. Asif S. Khan, Director General, PEPARole of Energy Conservation in Clean Air Mr. Arif Allauddin, Managing Director, ENERCON
Pakistan Clean Fuels Masami Kojima, World Bank
Mitigating Emissions from Two-Stroke- Masami Kojima, World BankEngine Vehicles
Concluding Remarks Mr. Arif Allauddin, Managing Director, ENERCON29 March 2001, Ministry of Petroleum and Natural Resources
Introduction Mr. G.A. Sabri, Director General (Oil), MPNR
Clean Fuels Study Mr. Phil Hunt, Chem SystemsDiscussion and Responses Secretary Abdullah Yusuf, and representatives from
refineries and oil marketing companies
61
62 Pakistan Clean Fuels
4.2 At the first workshop, the findings of the study were summarized asfollows:
* The cost of eliminating lead in gasoline is surprisingly low becausePARCO, a new refinery capable of producing high-octane blendingcomponents, has recently come on stream. The incremental cost toconsumers would be on the order of 0.5 to 1 percent of the retail price,requiring little capital expenditure.
* In the process of eliminating lead, it would be important to introducelimits on benzene and aromatics. Five percent benzene and 40-45 percenttotal aromatics would be considered minimally acceptable by internationalstandards, and Pakistan is in a position to impose these limits withoutadditional capital expenditures.
* The incremental cost of reducing sulfur in diesel from 1 percent to the 0.5percent now considered minimally acceptable by international standards issimilarly low-about 1 percent of the retail price and requiring capitalexpenditures of about US$ 10 million.'3
* The cost to Pakistan of reducing sulfur in fuel oil, in contrast, would besubstantial: more than US$100 million per annum as a result of importinglower-sulfur fuel oil. This argues all the more for accelerating the switchfrom fuel oil to natural gas.
High levels of lead in blood and even in milk were highlighted at this workshop. Theneed for the government to demonstrate its commitment to cleaner fuels by acting uponthe Clean Fuels Program was reiterated.
4.3 At the workshop organized by MPNR, Chem Systems gave a presentationthat focused on two points:
* The incremental cost of eliminating lead in gasoline and reducing sulfur indiesel to 0.5 percent is surprisingly low, for the former because PARCOhas already made much of the investment needed to eliminate lead, and forthe latter because Pakistan relies heavily on imports.
* It is important to introduce limits on benzene and total aromatics, andPakistan can immediately initiate limits of 5 percent and 40-45 percent,respectively, without incurring any capital expenditures in the future at thetime of complete lead elimination. This is important for preventingbenzene from exceeding 5 percent if and when octane grades higher thanthe current 87 RON are introduced on a wide scale.
4.4 MPNR, the Ministry of Environment, and industry representativesexpressed strong interest in accelerating the timetable for eliminating lead in gasoline. In
13 The expenditures would be for storage tanks and other infrastructure requirements for blendingdomestically produced diesel with imported lower-sulfur (0.25 percent) diesel.

Building National Consensus 63
particular, the relatively low incremental cost of doing so was seen as a uniqueopportunity for the Government of Pakistan to upgrade the quality of petroleum products.
4.5 Mr. Yusuf, Secretary of the MPNR, asked if, given this situation, Pakistancould accelerate lead phaseout. Chem Systems responded that, given the relatively lowlead-time and modest investment required, Pakistan should in fact be able to eliminatelead in gasoline in one to two years. Nearly all representatives from refineries andmarketing companies responded that they were in a position to switch entirely tounleaded gasoline. The workshop concluded with the following action items:
* The timetable for lead phaseout is to be accelerated, with the final date forlead elimination brought forward from the original date of 2005 to 2002 or2003. One option is to supply unleaded gasoline to all areas except thoseserved by ARL as soon as possible.
* The government will issue revised gasoline specifications, limitingbenzene to 5 percent and aromatics to 40-45 percent (precise level to befinalized).
* Because of the contract with Kuwait Petroleum Corporation, whichinformed Pakistan that they cannot supply 0.5-percent-sulfur diesel untilJune 2002 (because of a fire at one of their refineries), Pakistan will switchto 0.5-percent-sulfur diesel in June 2002. The logistics of importing 0.25-percent-sulfur diesel and blending with domestically produced dieselwould need to be finalized.
* Because the incremental cost of lowering sulfur in fuel oil is considerable,the government should accelerate switching from fuel oil to natural gas,and consider supplying imported lower-sulfur fuel oil to fuel oil userslocated near densely populated areas.

5
Fuel Tax Policy
5.1 The consumption of diesel fuel in Pakistan has historically exceeded thatof gasoline several-fold, as illustrated in Figure 2.3 (see Chapter 2). The bulk of diesel isused in the transport sector. In fiscal 1999-2000, for example, vehicles are reported tohave consumed 94.5 percent of HSD (HDIP and MPNR 2000), and the consumption ofHSD in the transport sector exceeded that of gasoline by more than a factor of five. Manylight-duty vehicles that might otherwise run on gasoline are powered by diesel to takeadvantage of the considerably lower retail price of diesel. If a large price differencebetween HSD and gasoline continues to be maintained, an increasing proportion of light-duty vehicles may eventually switch to diesel from gasoline.
5.2 To reverse this trend, two mechanisms for reducing the inter-fuel pricedifference between gasoline and HSD may be considered:
* Decrease the price of gasoline by a small amount, and increase the price ofHSD by a large amount.
* Decrease the price of gasoline by a large amount, and increase the price ofHSD by a small amount.
The magnitude of the price adjustments will be determined by the price levels that wouldmake the owners of light-duty vehicles indifferent to the choice of fuel on economicgrounds. This chapter summarizes the findings of the analysis.
Fuel Consumption by Vehicle Category5.3 Data on the number of vehicles are generated by provincial governmentsand is available in summary form in the annual Economic Survey. Estimates by vehicletype are presented in Table 5.1. The three types of light-duty vehicles that can run oneither gasoline or diesel-delivery vans, taxis, and jeeps-recorded an annual growth rateof over 8 percent (as much as 13 percent in the case of delivery vans) during the lastdecade.
65
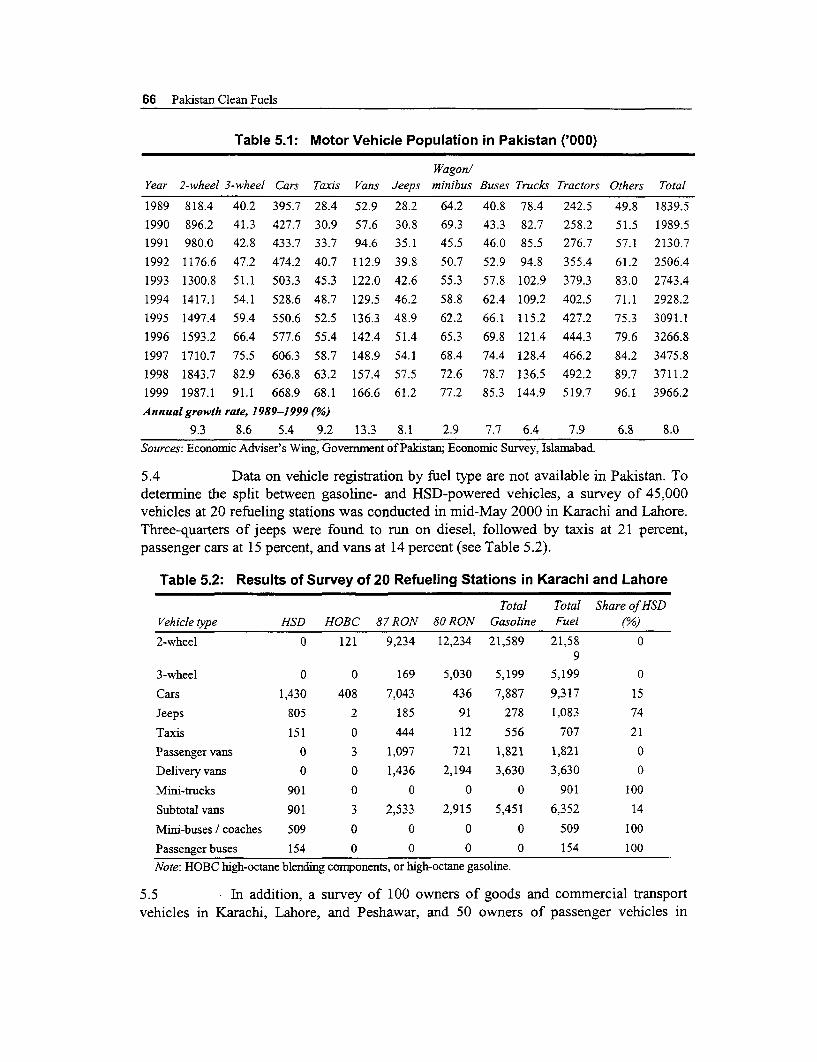
66 Pakistan Clean Fuels
Table 5.1: Motor Vehicle Population in Pakistan ('000)
WagonlYear 2-wheel 3-wheel Cars Taxis Vans Jeeps minibus Buses Trucks Tractors Others Total
1989 818.4 40.2 395.7 28.4 52.9 28.2 64.2 40.8 78.4 242.5 49.8 1839.5
1990 896.2 41.3 427.7 30.9 57.6 30.8 69.3 43.3 82.7 258.2 51.5 1989.51991 980.0 42.8 433.7 33.7 94.6 35.1 45.5 46.0 85.5 276.7 57.1 2130.7
1992 1176.6 47.2 474.2 40.7 112.9 39.8 50.7 52.9 94.8 355.4 61.2 2506.4
1993 1300.8 51.1 503.3 45.3 122.0 42.6 55.3 57.8 102.9 379.3 83.0 2743.4
1994 1417.1 54.1 528.6 48.7 129.5 46.2 58.8 62.4 109.2 402.5 71.1 2928.2
1995 1497.4 59.4 550.6 52.5 136.3 48.9 62.2 66.1 115.2 427.2 75.3 3091.1
1996 1593.2 66.4 577.6 55.4 142.4 51.4 65.3 69.8 121.4 444.3 79.6 3266.8
1997 1710.7 75.5 606.3 58.7 148.9 54.1 68.4 74.4 128.4 466.2 84.2 3475.8
1998 1843.7 82.9 636.8 63.2 157.4 57.5 72.6 78.7 136.5 492.2 89.7 3711.2
1999 1987.1 91.1 668.9 68.1 166.6 61.2 77.2 85.3 144.9 519.7 96.1 3966.2
Annual growth rate, 1989-1999 (%0)
9.3 8.6 5.4 9.2 13.3 8.1 2.9 7.7 6.4 7.9 6.8 8.0Sources: Economnic Adviser's Wing, Government of Pakistan; Economic Survey, Islarnabad.
5.4 Data on vehicle registration by fuel type are not available in Pakistan. Todetermine the split between gasoline- and HSD-powered vehicles, a survey of 45,000vehicles at 20 refueling stations was conducted in mid-May 2000 in Karachi and Lahore.Three-quarters of jeeps were found to run on diesel, followed by taxis at 21 percent,passenger cars at 15 percent, and vans at 14 percent (see Table 5.2).
Table 5.2: Results of Survey of 20 Refueling Stations in Karachi and Lahore
Total Total Share of HSDVehicle type HSD HOBC 87 RON 80 RON Gasoline Fuel (%)
2-wheel 0 121 9,234 12,234 21,589 21,58 09
3-wheel 0 0 169 5,030 5,199 5,199 0
Cars 1,430 408 7,043 436 7,887 9,317 15
Jeeps 805 2 185 91 278 1,083 74
Taxis 151 0 444 112 556 707 21
Passenger vans 0 3 1,097 721 1,821 1,821 0
Delivery vans 0 0 1,436 2,194 3,630 3,630 0
Mini-trucks 901 0 0 0 0 901 100
Subtotal vans 901 3 2,533 2,915 5,451 6,352 14
Mini-buses / coaches 509 0 0 0 0 509 100
Passenger buses 154 0 0 0 0 154 100Note: HOBC high-octane blending components, or high-octane gasoline.
5.5 In addition, a survey of 100 owners of goods and commercial transportvehicles in Karachi, Lahore, and Peshawar, and 50 owners of passenger vehicles in

Fuel Tax Policy 67
Karachi and Lahore was conducted to collect data on costs and reasons for fuel switching(see Table 5.3). The data collected were used to cross-check the data provided by vehiclemanufacturers and dealers. The data shown should be interpreted with caution because ofthe small sample size and varying engine capacity. The fuel economy of three-wheelersappears to be very low, and may reflect incorrect recollections by the vehicle ownersinterviewed. In the car and taxi categories, diesel yields higher fuel economy thangasoline, and this trend is consistent with the general observation that diesel is a moreefficient automotive fuel. In the van category, the reverse trend seen is a functionprimarily of vehicle weight and engine size, where diesel vehicles have much largercapacities. When the fuel economy and daily vehicle kilometers traveled (VKT) data wereused in conjunction with the vehicle population data given in Table 5.1 to computeoverall consumption of HSD in the transport sector, the total amounts computed for fiscal1997-1998 and 1998-1999 came within 3 percent of the actual consumption figures.
Table 5.3: Survey of 150 Vehicle Owners in Karachi, Lahore, and Peshawar
Vehicle Type, by Fuel and Number of Vehicle Usage Average ConversionConversion Status Vehicles (km/day) FuelEconomy Cost (rupees)
Cars 18
Gasoline 6 29 10 km/iHSD 1 49 13 km/i -
HSD, converted 3 25 15 kmn/l 39,333CNG, converted 5 52 14 km/m3 19,700LPG, converted 3 47 15 krn/kg 10,400
Taxis 12Gasoline 3 92 11 knn/I
HSD 1 164 19 kn/1 -
HSD, converted 2 77 12 knm/I 34,000CNG, converted 2 173 18 kmim3 26,500LPG, converted 4 160 16 kn/kg 4,667
Three-wheelers, gasoline 4 136 13 kmlIPassenger vans 16
Mini-buses, HSD 13 170 6 kmn/ISuzuki, gasoline 3 257 10 kin/I
Delivery vans 60Suzulci, gasoline 47 57 10 km/iMazda, HSD 13 III 9 kn/I
Mini trucks, HSD 40 91 6 krn/INote: - not applicable.
5.6 Estimates of annual VKT by fuel type for each vehicle category and thetotal amount of fuel consumed in inter-city and intra-city transport were made on thebasis of data from two sources: (a) the aforementioned survey of 150 vehicle owners, and(b) interviews with officials of various transport owners' associations and provincial
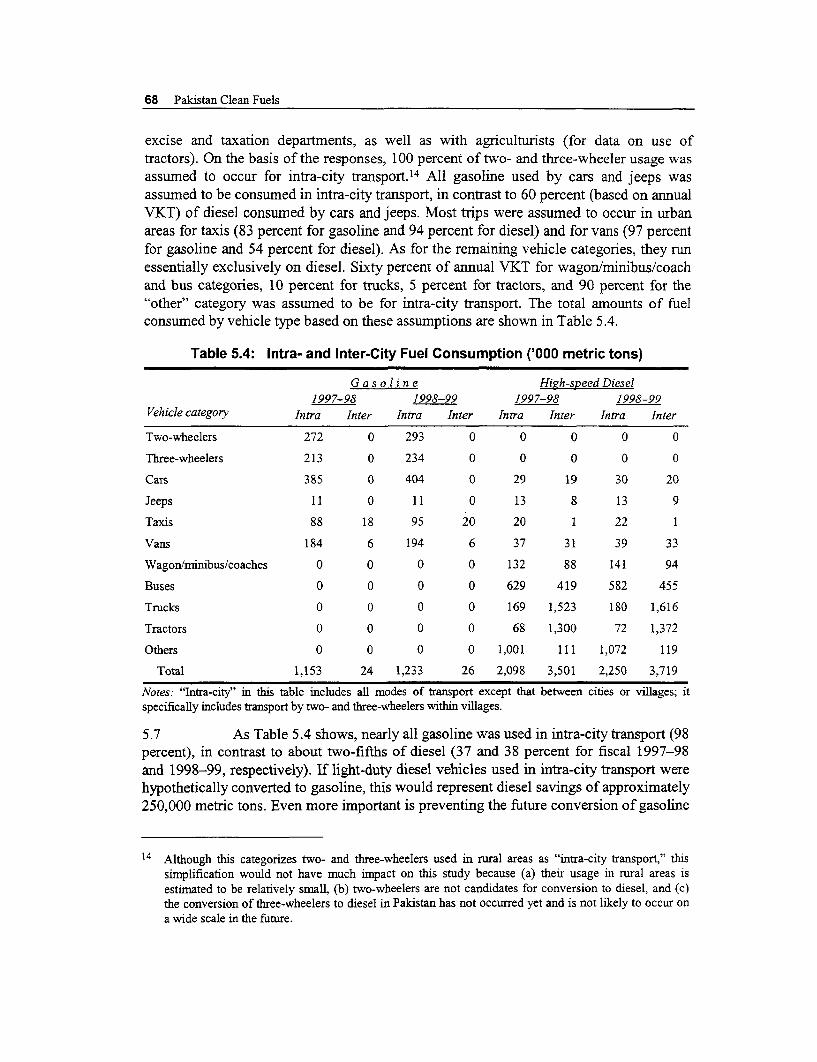
68 Pakistan Clean Fuels
excise and taxation departments, as well as with agriculturists (for data on use oftractors). On the basis of the responses, 100 percent of two- and three-wheeler usage wasassumed to occur for intra-city transport. 14 All gasoline used by cars and jeeps wasassumed to be consumed in intra-city transport, in contrast to 60 percent (based on annualVKT) of diesel consumed by cars and jeeps. Most trips were assumed to occur in urbanareas for taxis (83 percent for gasoline and 94 percent for diesel) and for vans (97 percentfor gasoline and 54 percent for diesel). As for the remaining vehicle categories, they runessentially exclusively on diesel. Sixty percent of annual VKT for wagon/minibus/coachand bus categories, 10 percent for trucks, 5 percent for tractors, and 90 percent for the"other" category was assumed to be for intra-city transport. The total amounts of fuelconsumed by vehicle type based on these assumptions are shown in Table 5.4.
Table 5.4: Intra- and Inter-City Fuel Consumption ('000 metric tons)
G a s o I i n e High-speed Diesel1997-98 1998-99 1997-98 1998-99
Vehicle category Intra Inter Intra Inter Intra Inter Intra Inter
Two-wheelers 272 0 293 0 0 0 0 0
Three-wheelers 213 0 234 0 0 0 0 0
Cars 385 0 404 0 29 19 30 20
Jeeps I 0 o 11 0 13 8 13 9
Taxis 88 18 95 20 20 1 22 1
Vans 184 6 194 6 37 31 39 33
Wagon/minibus/coaches 0 0 0 0 132 88 141 94
Buses 0 0 0 0 629 419 582 455
Trucks 0 0 0 0 169 1,523 180 1,616
Tractors 0 0 0 0 68 1,300 72 1,372
Others 0 0 0 0 1,001 11I 1,072 119
Total 1,153 24 1,233 26 2,098 3,501 2,250 3,719
Notes: "Intra-city" in this table includes all modes of transport except that between cities or villages; itspecifically includes transport by two- and three-wheelers within villages.
5.7 As Table 5.4 shows, nearly all gasoline was used in intra-city transport (98percent), in contrast to about two-fifths of diesel (37 and 38 percent for fiscal 1997-98and 1998-99, respectively). If light-duty diesel vehicles used in intra-city transport werehypothetically converted to gasoline, this would represent diesel savings of approximately250,000 metric tons. Even more important is preventing the future conversion of gasoline
14 Although this categorizes two- and three-wheelers used in rural areas as "intra-city transport," thissimplification would not have much impact on this study because (a) their usage in rural areas isestimated to be relatively small, (b) two-wheelers are not candidates for conversion to diesel, and (c)the conversion of three-wheelers to diesel in Pakistan has not occurred yet and is not likely to occur ona wide scale in the future.
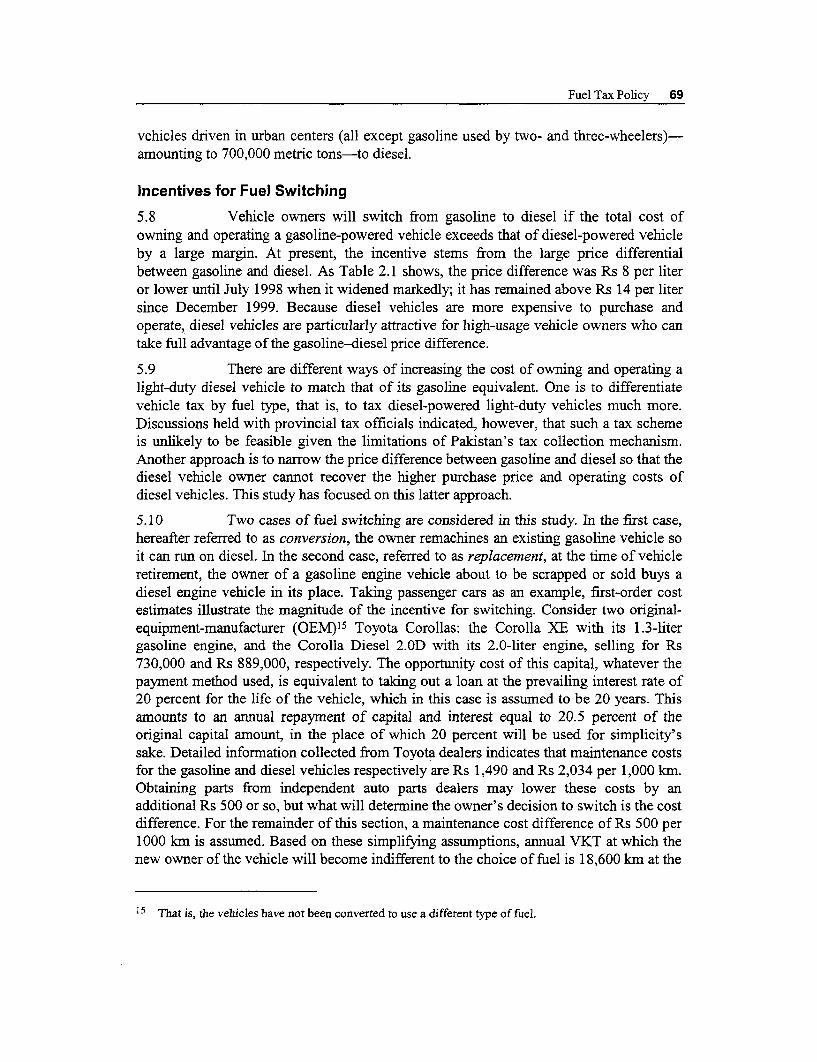
Fuel Tax Policy 69
vehicles driven in urban centers (all except gasoline used by two- and three-wheelers)-amounting to 700,000 metric tons-to diesel.
Incentives for Fuel Switching5.8 Vehicle owners will switch from gasoline to diesel if the total cost ofowning and operating a gasoline-powered vehicle exceeds that of diesel-powered vehicleby a large margin. At present, the incentive stems from the large price differentialbetween gasoline and diesel. As Table 2.1 shows, the price difference was Rs 8 per literor lower until July 1998 when it widened markedly; it has remained above Rs 14 per litersince December 1999. Because diesel vehicles are more expensive to purchase andoperate, diesel vehicles are particularly attractive for high-usage vehicle owners who cantake full advantage of the gasoline-diesel price difference.
5.9 There are different ways of increasing the cost of owning and operating alight-duty diesel vehicle to match that of its gasoline equivalent. One is to differentiatevehicle tax by fuel type, that is, to tax diesel-powered light-duty vehicles much more.Discussions held with provincial tax officials indicated, however, that such a tax schemeis unlikely to be feasible given the limitations of Pakistan's tax collection mechanism.Another approach is to narrow the price difference between gasoline and diesel so that thediesel vehicle owner cannot recover the higher purchase price and operating costs ofdiesel vehicles. This study has focused on this latter approach.
5.10 Two cases of fuel switching are considered in this study. In the first case,hereafter referred to as conversion, the owner remachines an existing gasoline vehicle soit can run on diesel. In the second case, referred to as replacement, at the time of vehicleretirement, the owner of a gasoline engine vehicle about to be scrapped or sold buys adiesel engine vehicle in its place. Taking passenger cars as an example, first-order costestimates illustrate the magnitude of the incentive for switching. Consider two original-equipment-manufacturer (OEM)15 Toyota Corollas: the Corolla XE with its 1.3-litergasoline engine, and the Corolla Diesel 2.OD with its 2.0-liter engine, selling for Rs730,000 and Rs 889,000, respectively. The opportunity cost of this capital, whatever thepayment method used, is equivalent to taking out a loan at the prevailing interest rate of20 percent for the life of the vehicle, which in this case is assumed to be 20 years. Thisamounts to an annual repayment of capital and interest equal to 20.5 percent of theoriginal capital amount, in the place of which 20 percent will be used for simplicity'ssake. Detailed information collected from Toyota dealers indicates that maintenance costsfor the gasoline and diesel vehicles respectively are Rs 1,490 and Rs 2,034 per 1,000 km.Obtaining parts from independent auto parts dealers may lower these costs by anadditional Rs 500 or so, but what will determine the owner's decision to switch is the costdifference. For the remainder of this section, a maintenance cost difference of Rs 500 per1000 km is assumed. Based on these simplifying assumptions, annual VKT at which thenew owner of the vehicle will become indifferent to the choice of fuel is 18,600 km at the
15 That is, the vehicles have not been converted to use a different type of fuel.

70 Palistan Clean Fuels
retail fuel prices in mid-2000, and 21,000 km at the retail fuel prices after the most recentprice adjustment of March 2001. These correspond approximately to daily VKT of 60 to70 kin, which many commercial operators (for example, taxi drivers) exceed.
5.11 Even more attractive to many vehicle owners is converting an existinggasoline vehicle. At an annualized conversion cost of Rs 10,000, converting to dieselbecomes attractive above annual VKT of 6,000 to 7,000 km. The objective of a fuel taxpolicy that narrows the price differential between gasoline and diesel would be to increasethe threshold annual VKT above which it becomes attractive to switch to diesel. If thethreshold levels are raised considerably as a result, only the owners of extensively drivenvehicles would consider conversion to diesel.
5.12 The approach used in this study is to increase the threshold level forconversion three-fold and determine the fuel price adjustments needed. Two scenarioswere considered:
* Decrease the retail price of gasoline by 10 percent, and increase the priceof HSD by a large amount.
Increase the price of HSD by 10 percent, and reduce the price of gasolineby a large amount.
The base prices used were those for 87-RON gasoline and HSD between March andSeptember 2000. The calculations assumed an annualized conversion cost of Rs 10,000and annualized capital cost (for the purchase of new vehicles) of Rs 150,000 and Rs180,000 for gasoline and diesel, respectively. The final set of numbers selected for theremainder of this study is as follows:
* Scenario 1: A 10 percent fall in the price of gasoline and a 67 percentincrease in the price of diesel. Compared to the base prices of Rs 29.50and Rs 12.80 per liter for gasoline and diesel, respectively, thecorresponding new prices are Rs 26.55 and Rs 21.38 per liter, narrowingthe price difference on a per-liter basis to within 20 percent.
* Scenario 2: A 29 percent fall in the price of gasoline and a 10 percentincrease in the price of diesel. The resulting prices are Rs 20.95 and Rs14.08 per liter for gasoline and diesel, respectively, narrowing the pricedifference to within one-third.
These numbers correspond to a threshold annual VKM of (a) about 19,000 km in the caseof converting an existing gasoline vehicle to diesel and (b) 55,000-60,000 km in the caseof replacing a gasoline vehicle with a diesel one at the time of vehicle retirement.(Because of the large number of assumptions made, it should be borne in mind that thesecalculations are for illustrative purposes only and give only first-order estimates.) Theimpact of varying assumptions on the price changes required is shown in Table 5.5.

Fuel Tax Policy 71
Table 5.5: Price Adjustments under Different Scenarios
Corresponding Fuel Economy Retailprice Annual VKT Price chanze required (%)Fuel Scenario (km/l) (Rslliter) (km) Conversion Replacement
Gasoline 1 9 29.50 19,000 -10 -10
Diesel 1 11 12.80 19,000 65 -25
Gasoline 2 9 29.50 19,000 -30 2
Diesel 2 11 12.80 19,000 10 10
Gasoline 1 9 30.00 19,000 -10 -10
Diesel 1 11 15.40 19,000 41 -34
Gasoline 2 9 30.00 19,000 -23 9
Diesel 2 11 15.40 19,000 10 10
Gasoline 1 10 29.50 19,000 -10 -10
Diesel 1 12 12.80 19,000 53 -46
Gasoline 2 10 29.50 19,000 -25 10
Diesel 2 12 12.80 19,000 10 10
Gasoline 1 9 29.50 25,000 -10 -10
Diesel 1 11 12.80 25,000 76 7
Gasoline 2 9 29.50 25,000 -34 -9
Diesel 2 11 12.80 25,000 10 10
Impact on Prices and Household Expenditures
5.13 The study examined the impact of changes in fuel prices outlined in theabove two scenarios on household expenditures by means of input-output analysis andusing household expenditure survey results. The input-output table used is the onedeveloped by the Federal Bureau of Statistics (FBS) in Pakistan in collaboration with theInstitute of Social Studies in the Netherlands. The economy is classified into 86 sectorsand the coefficients relate to fiscal 1989-90. The most recent Household IntegratedEconomic Survey (HIES) of the FBS for fiscal 1996-97 provided data on householdexpenditures. The calculations were carried out in terms of percentage changes, andrelative prices were not adjusted between fiscal 1989-90 (input-output table), fiscal1996-97 (HIES), and March to September 2000 (base prices for gasoline and diesel), onaccount of the approximate nature of the calculations.
5.14 The impact of changing fuel prices on changes in prices of goods andservices is estimated by inverting the matrix I-A T, where I is the identity matrix and AT isthe transpose of the input-output matrix, and multiplying the resulting matrix by a columnvector f with zero entries for all sectors except the petroleum refining sector. Because theinput-output table has only one coefficient for the petroleum sector, the entry for this

72 Pakistan Clean Fuels
sector corresponds to the weighted price change in fuel prices. The column vector AP,which indicates the resulting changes in sectoral price levels, is given by
Ap (I-AT)-' f.
5.15 The results of these calculations are given in Table A2.1 in Annex 2. Inscenario 1, there is a marked increase in the average price of refined products: 33 percent.In scenario 2, general price increases are small, even in the petroleum sector where theaverage price increases by less than 2 percent. It should be noted that the accuracy of theresults is limited by the fact that the input-output coefficients are a decade old andsignificant changes may have occurred in the coefficients in the intervening years.Further, fuel price changes are assumed to have no impact on the input-outputcoefficients, wages, and other components of value added.
5.16 Increasing the price of diesel will increase input prices for majorproduction sectors. The tradable sectors will therefore face increased foreign competitionas a result of the higher input costs. Pakistan's major exports include rice, cotton,fisheries, cotton yarn, cotton cloth, manufactured textile goods, knitwear, garments,carpets, leather and leather products, surgical instruments, and sports goods. The majorimport substitution sectors include wheat, crude oil and natural gas, vegetable oil (facingcompetition from imported palm oil and soya bean oil), sugar, pharmaceuticals, fertilizersand pesticides, chemicals, metal products, machinery, and equipment. Table A2.1 showsthat the impact of scenario 1 ranges from a price increase of more than 3 percent forfisheries to about 1 percent for cotton in the production sectors, and from more than 3.5percent for machinery to about 1 percent for sugar in import substitution sectors. Incontrast, the impact of scenario 2 is negligibly small. These results suggest that, whereasthere may be little need for corrective policy action in scenario 2, preserving thecompetitiveness of the domestic industry in scenario 1 may require a small devaluation ofthe national currency.
5.17 Household consumption of the goods in the sectors represented in theinput-output table was calculated for income quartiles in urban and rural areas. Theestimates of consumption by sector are based on a primary data set obtained from theFBS. The average annual expenditures by sector are given in Table A2.2 and Table A2.3,respectively, for urban and rural households. The estimates of private transport-relatedexpenditures are made separately because the input-output table contains onlyexpenditures on public transport. The relative shares of gasoline and HSD in the privatetransport-related expenditures are taken from the results of the survey of vehicles carriedout at refueling stations undertaken in this study. The results are shown in Table 5.6.
5.18 To estimate the impact of price increases on household expenditures,quantities of goods consumed are assumed to be unaffected by the price changes as a firstapproximation. For each scenario, the impact on household expenditures minus savings inprivate transport-related expenditures, arising from the fall in the price of gasoline, iscomputed. The impact of fuel price changes on household expenditures in the twoscenarios is shown in Table 5.7 and Table 5.8.

Fuel Tax Policy 73
Table 5.6: Annual Household Private Transport Expenditures,by Income Quartile (rupees)
Item Location 15' Quartile 2 nd Quartile 3td Quartile 4th Quartile All
Gasoline/HSD purchase Urban 6 100 589 4,560 1,270
Lubricants and oils Urban 4 18 97 626 180
Private transport expenditure Urban 10 118 687 5,187 1,451
Gasoline/HSD purchase Rural 3 20 75 593 172
Lubricants and oils Rural 1 5 18 126 37
Private transport expenditure Rural 4 25 94 719 210
Gasoline/HSD purchase All 4 32 188 1,783 500
Lubricants and oils All I 10 45 267 80
Private transport expenditure All 4 42 233 2,050 580
Notes: Urban first quartile up to Rs 39,600 per annum; second quartile between Rs 39,600 and 57,600; thirdquartile between Rs 57,600 and 90,000; fourth quartile above Rs 90,000. Rural first quartile up to Rs 30,000per annum; second quartile between Rs 30,000 and 44,436; third quartile between Rs 44,436 and 67,800;fourth quartile above Rs 67,800. All (countrywide) first quartile up to Rs 32,400 per annum; second quartilebetween Rs 32,400 and 48,000; third quartile between Rs 48,000 and 73,704; fourth quartile above Rs 73,704.
Table 5.7: Changes in Annual Household Expenditure in Scenario I
Rise in household Fall in private AverageHousehold expenditure on goods transport Net impact on income (Rs per Impact as%category and services (Rs) expenditure (Rs) expenditure (Rs) annum) of income
Rural 812 (9) 803 62,641 1.3
1st Quartile 415 0 415 21,855 1.9
2nd Quartile 610 (1) 609 36,712 1.7
3rd Quartile 804 (4) 800 53,032 1.5
4b Quartile 1,436 (30) 1,406 140,274 1.0
Urban 1,171 (64) 1,107 75,339 1.5
1st Quartile 567 0 567 29,960 1.9
2nd Quartile 864 (5) 859 47,459 1.8
3rd Quartile 1,206 (29) 1,177 71,175 1.7
4b Quartile 2,092 (228) 1,864 156,746 1.2
All groups 919 (25) 894 66,435 1.4
Notes: Urban first quartile up to Rs 39,600 per annun,; second quartile between Rs 39,600 and 57,600; thirdquartile between Rs 57,600 and 90,000; fourti quartile above Rs 90,000. Rural first quartile up to Rs 30,000per annun,; second quartile between Rs 30,000 and 44,436; third quartile between Rs 44,436 and 67,800;fourth quartile above Rs 67,800.

74 Pakistan Clean Fuels
Table 5.8 Changes in Annual Household Expenditure in Scenario 2
Rise in household Fall in private Average
Household expenditure on goods transport Net impact on income (Rs per Impact as%category and services (Rs) expenditure (Rs) expenditure (Rs) annum) ofincome
Rural 47 (34) 13 62,641 0
lst Quartile 23 (1) 22 21,855 0.10
2nd Quartile 34 (4) 30 36,712 0.08
3rd Quartile 45 (15) 30 53,032 0.06
4h Quartile 89 (119) (30) 140,274 -0.02
Urban 87 (254) (167) 75,339 -0.22
lstQuartile 31 (1) 30 29,960 0.10
2nd Quartile 49 (20) 29 47,459 0.06
3 Quartile 76 (118) (58) 71,175 -0.08
4h Quartile 196 (912) (716) 156,746 -0.46
All groups 59 (100) (41) 66,435 -0.06
Notes: Urban first quartle up to Rs 39,600 per annum; second quartile between Rs 39,600 and 57,600; thirdquartile between Rs 57,600 and 90,000; fourth quartile above Rs 90,000. Rural first quartile up to Rs 30,000per annum; second quartile between Rs 30,000 and 44,436; third quartile between Rs 44,436 and 67,800;fourth quartile above Rs 67,800.
5.19 Scenario 1 is seen to have a significant impact on the cost of living ofhouseholds, amounting to an increase of 1.4 percent of income on average. The impact ishigher for urban households (1.5 percent) than for rural (1.3 percent). The impact isregressive, with the increase in household expenditure falling from 1.9 percent for thebottom income quartile to 1 percent for the top income quartile in rural areas, and from1.9 percent to 1.2 percent for the corresponding income groups in urban areas. Therefore,if scenario 1 is adopted as a policy, it may be necessary to try to mitigate the impact onlower income groups by means of safety-net measures.
5.20 In contrast, the impact on the cost of living is generally negligible inscenario 2, with the increase expressed in percentage of income remaining less than 0.1percent. The top income quartile in rural areas, and the top two income quartiles in urbanareas, actually benefit as a result of a large fall in the price of gasoline.
Balance of Payments and Tax Revenue
5.21 To estimate the impact of fuel price changes on macro-economicparameters, the study analyzed the impact of price changes on aggregate quantities offuels consumed. Elasticities of demand for gasoline and diesel were estimated usingtranslog equations and are summarized in Table 5.9. Both fuels have an income elasticityin the neighborhood of 1.3. Own price elasticities are also comparable at between -0.2and -0.3.

Fuel Tax Policy 75
Table 5.9: Demand Elasticities for Gasoline and Diesel
Parameter Gasoline HSD
Own price -0.22 -0.26
Income (gross national product) 1.3 1.4
5.22 On the basis of the translog demand equations, the study estimatedaggregate fuel demands in response to fuel price changes for the two scenarios. As Table5.10 shows, consumption of diesel falls markedly in scenario 1. Because Pakistan is animporter of diesel, a fall in the consumption of diesel would yield import-bill savings.Taking the refining sector after PARCO becomes fully operational, Pakistan becomes anexporter of gasoline blending components, so that a rise in consumption of gasolinewould mean less exports. Making a simplifying assumption that the difference in gasolineconsumption in metric tons would all have been exported in the base case, and takingaverage free-on-board (FOB) prices of gasoline and HSD in fiscal 1999-2000, net importbill savings were also computed. In scenario 2, the import bill increases because the fallin the consumption of diesel is small while the increase in the consumption of gasoline isrelatively large.
Table 5.10: Consumption of Gasoline and Diesel in Two Scenariosand Impact on Balance of Payments and Tax Revenue in Fiscal 1999-2000
Fuel Scenario I Scenario 2
Gasoline consumption relative to base (%) +16 +10
HSD consumption relative to base (% change) -18 -1
Net import bill savings (US$ million) 175 -14
Change in total tax revenue (Rs rnillion) 45,426 -3,202
Change in customs/excise duty -100 209
Change in sales tax 5,654 -116
Change in development surcharge 39,873 -3,295
5.23 The petroleum sector is a major source of revenue in the form of exciseduty, customs duty, general sales tax (GST), and the petroleum development surcharge.Therefore, changes in revenue from petroleum products can have significant implicationsfor the government budget. The tax rates used in this study were those that were in placein the year 2000, consisting of a customs duty on imports or an excise duty on locallyrefined products which was levied at a flat rate of Rs 0.88 per liter of gasoline and Rs0.25 per liter of diesel; a GST of 15 percent of the retail price, and a developmentsurcharge consisting of a fixed levy and a variable surcharge. The impact on thegovernment's tax revenue is shown in Table 5.10. Scenario 1 leads to an increase in taxrevenue of over Rs 45 billion. There is some loss of revenue, about Rs 3 billion, inscenario 2.
76 Pakistan Clean Fuels
Impact on the Macroeconomy
5.24 Using the above findings it is possible to estimate macroeconomicimplications of changes in fuel prices. For this purpose, the Social Policy DevelopmentCentre's (SPDC). Integrated Social Policy and Macroeconomic (ISPM) model was used.The model has two principal components, macroeconomy with 165 equations and socialdevelopment with 100 equations. The 64 exogenous variables driving the model consistof 22 blocks, which can be divided into two groups as follows:
* Macroeconomy: production, index of economic infrastructure, inputdemand and unemployment, macroeconomic expenditure, internationaltrade, monetary and price blocks, federal revenue, federal expenditure,federal deficit, provincial revenue, provincial expenditure, provincial andtotal budget deficit, local revenue, local expenditure, and index of fiscalefforts
* Social development: human capital index, public health index, poverty,unemployment of educated workers, gender inequality, and malnutrition.
5.25 Most of the variables are policy-related and enable the model to analyzethe consequences of key policy changes. Some of the policy-related variables are asfollows:
* Real effective exchange rate
* Interest rates
* Intergovernmental fiscal relations
* New taxation
* Level of petroleum development surcharges
* Defense expenditure
* Cost recovery in different services
* Subsidies
* Grants by federal and provincial governments.
The outputs of this model for some of the key parameters are shown in Table 5.11. Theimpact of scenario 2 is small and, given the approximate nature of this analysis, can beconsidered to be not significantly different from zero for all intents and purposes. Theimpact of scenario 1, however, is significant, and is discussed in some depth below.
5.26 GDP growth. The short-run shock to the economy of a large rise in theprice of diesel is likely to appear in the form of a contraction in the road transport sectorequivalent to about 0.5 percent of the GDP. However, simulation using themacroeconomic model shows that the overall impact on the GDP is a reduction of about0.26 percent. Part of the negative shock is mitigated by generation of significantly highertax revenues, some of which are used to fmnance a higher level of public investment in theeconomy, which in turn contributes to growth.

Fuel Tax Policy 77
Table 5.11: Changes in Macroeconomic Parameters for Fiscal 1999-2000
Macroeconomic variable Unit Scenario ! Scenario 2
GDP growth rate %, absolute -0.26 -0.02
Unemployment rate %, absolute 0.27 -0.03
Rate of inflation %, absolute 1.43 -0.08
Current account deficit % of GDP -0.47 0.07
Budget deficit % of GDP -1.03 0.1
Rate of depreciation of nominal exchange rate %, absolute 1.43 -0.03
Ratio of tax to gross domestic product %, absolute 1.29 -0.08
Incidence of poverty % of population 1 -0.05
5.27 Unemployment. The unemployment rate in the economy is higher by about0.27 percent. This is partly the consequence of a lower GDP growth and partly because ofsome labor displacement in the road transport sector, a sector that is relatively labor-intensive.
5.28 Rate of inflation. The inflation rate is higher by 1.43 percent, exceedingsomewhat the initial cost-push shock on the economy of about 1.35 percent. One mayexpect a priori that higher tax revenues would lead to a smaller fiscal deficit, lessgovernment borrowing from the banking system, less monetary expansion and, therefore,less inflation. However, part of this effect is neutralized by greater monetary expansionfrom the foreign sector resulting from the improvement in the current account deficit ofthe balance of payments. In addition, the model keeps the real effective exchange rateconstant in all scenarios, resulting in greater depreciation of the nominal exchange rate inscenario I and adding to inflation.
5.29 Current account deficit. There is a positive shock on the economy becauseof the reduction in the import bills on petroleum products, equivalent to about 0.40percent of the GDP. The actual improvement is larger, closer to 0.47 percent of the GDP.This is due to the additional depreciation of the nominal exchange rate, which stimulatesexports.
5.30 Budget deficit. The budget deficit declines by about 1 percent of the GDP.The initial shock is an improvement in tax-revenues-to-GDP ratio of about 1.36 percent,but this is partly used for higher public expenditure on development and external debtservicing (due to higher depreciation of the currency), leading to a less-than-corresponding reduction in the fiscal deficit.
5.31 Incidence of poverty. The SPDC model has a poverty block from which itis possible to derive the implications of different scenarios on the level of poverty inPakistan. The poverty line is defined as the minimum income level required to fulfillbasic nutritional requirements (as set by calorie intake) and other basic needs. Thepoverty module in the SPDC model contains household-level GDP, per capita GDP,economy-wide human capital index, food price index, real remittances (cash plus in-kind

78 Pakistan Clean Fuels
payments) in rupees per capital, and open (as opposed to hidden) unemployment. Itappears that the impact of the shocks due to the change in fuel prices is to raise theincidence of poverty by 1 percent from its present level of about 34 percent. This isprimarily due to the resulting lower per capita income, higher inflation, and higherunemployment rate.
Social Policies to Mitigate Adverse Impact5.32 Because the impact of changing fuel prices is regressive with an adverseimpact on low income households, potentially increasing the number of poor families byas many as 1.5 million, it would be worthwhile formulating a social policy package tomitigate the impact on low-income groups.
5.33 A review of existing social safety nets in Pakistan is given in Annex 3.The principal form of cash transfers to the poor is through the publicly administeredZakat system (along with private charitable contributions). The Ushr is also designed tosubsidize the poor in rural areas but it has floundered on grounds of inadequatecollections. Cash transfers have acquired importance more recently by the launching ofthe cash-based Atta (wheat flour) Subsidy Scheme (ASS) through the Bait-ul-Maal. Atraditional social safety net has been the generalized wheat subsidy, a primary source ofexpenditure by both federal and provincial governments.
5.34 In the area of social security, the federal government operates an insurancescheme for elderly retired employees through a semi-autonomous institution, theEmployees Old Age Benefits Institution (EOBI). The coverage of workers under thisscheme remains limited. There are proposals for more elaborate private pensions schemeswith matching employer contributions and tax breaks by government. The HouseBuilding Finance Corporation (HBFC) continues to operate a subsidized housing-financescheme.
5.35 Among commercial banks and other institutions such as the SmallBusiness Finance Corporation and the Pakistan Poverty Alleviation Fund, plans are afootto launch ambitious micro-credit schemes for self-employment. This is considered pivotalin the creation of opportunities, especially for educated youth at a time when employmentprospects have significantly worsened. However, experience with such schemes (such asthe Yellow Cab scheme16 ) has not been encouraging because of poor targeting and highdefault rates in repayment of loans. Perhaps the largest operational micro-credit scheme isa joint venture of the commercial bank, Habib Bank Limited (HBL), and a largenongovernmental organization, the National Rural Support Program (NRSP). HBLprovides the bulk credit line and NRSP undertakes retail lending operations.
16 A scheme devised initially to provide self-employment and subsequently expanded to generateemployment and improve public transport. The scheme provided credit for the purchase of taxis,initially, and subsequently mini-buses, passenger coaches, and-more latterly-mini-trucks, trucks, andtrailers.
Fuel Tax Policy 79
5.36 These social safety net programs have been evaluated on the basis of anumber of standard criteria (Pasha and others 2000) and the results are shown in Table5.12. Briefly stated, the criteria are as follows:
Targeting efficiency is a measure of the extent to which a program'sexpenditure actually reaches poor people rather than relatively well-offsegments of the population.
* The extent of the program coverage is the proportion of poor householdsthat receive benefits from the program.
* The ease of access is the level of transactions costs imposed on eligiblehouseholds in accessing to the program, as indicated by the simplicity andtransparency of procedures, documentation requirements, and the level ofdiscretion enjoyed by program officials in benefit disbursement.
* The share of program expenditures dedicated to benefits is measured byhow much of the program budget is spent on benefits rather than onadministrative costs.
* The adequacy of support is the extent to which the benefit reduces thepoverty of a recipient.
* The income equivalence of transfer is the extent to which the transfer isequivalent to a cash transfer and does not distort consumption choices ofbeneficiaries.
* The absence of negative incentive effects considers the fact that anti-poverty interventions can give disincentives for seeking employment orincreasing income.
* The extent of self-financing/progressive financing concerns the fiscalsustainability of the program.
* The degree of independence from private transfers addresses whether thetransfer displaces corresponding transfers by households or private sectorentities.
* The degree of impact on development attempts to assess the program'sdirect or indirect contribution to development.
5.37 By and large, the existing social security instruments in operation have alimited targeting efficiency, inadequate coverage levels, a low-to-medium degree of easeof access, a high level of administration and related costs, and a low level of fiscalsustainability. Programs that perform somewhat better on these criteria are Zakat, EOBIsocial security, and the micro-credit scheme. Altogether, public expenditure on socialsafety nets is estimated at Rs 12 billion, or 0.4 percent of GDP.

80 Pakistan Clean Fuels
Table 5.12: Evaluation of Social Safety Net Programs
Bait-ul- Wheat HBL - Score summarvCriterion Zakat Maal Ushr Subsidy EOBI HBFC NRSP H M L
Targeting Efficiency M M M L H L M 1 4 2
Program Coverage L L L H L L L 1 0 6
Ease of Access M M M H L L L 1 3 3
Share of program H H H L H L M 4 1 2expenditure of benefits
Adequacy of support M M L H M M M 1 5 1
Income equivalence of H H H M H M H 5 2 0transfer
Absence of negative M M L L L M H 1 3 3incentive effects
Extent of self-financing/ H L M L M H L 2 2 3progressive financing
Degree of independence L M M M M M H 1 5 1from private transfers
Degree of impacton L L L L L M H 1 1 5development
Summary of scores
High 3 2 2 3 3 1 4
Medium 4 5 4 2 3 5 3
Low 3 3 4 5 4 4 3
Notes: H high, M medium, L low.
5.38 Because the existing social safety nets have neither the coverage nor theability to target the poor to effectively mitigate the negative impact of fuel price changesin scenario 1, a very broad-based, comprehensive instrument that can reach all strata ofthe population may be needed. If the negative impact of the fuel price increase is to befully neutralized, the magnitude of intervention will be sizeable, implying a significantincrease in the existing outlays on social safety nets. There is a genuine danger that thismay further lower the targeting efficiency of the intervention by increasing leakages. Theoverhead cost to government for providing the safety net should be low so that most ofthe gains in tax revenues in scenario 1 can be used to compensate the affectedhouseholds. As such a key feature of the intervention should be that it reaches the affectedpopulation easily with little need for targeting and with minimal cost, preferably throughchanges in prices that impact on all households.
5.39 The need for social safety net intervention is much less of an issue inscenario 2. If anything, there is need for some taxation of the richest segment of urbanhouseholds to offset the benefit of a significant fall in the price of gasoline price. One

Fuel Tax Policy 81
possible targeted intervention is a 5 percent surcharge on personal income tax liabilitiesbeyond a certain minimum level of taxable income (for example, Rs 100,000 per annum).
5.40 Given the above considerations, it is proposed that for scenario 1, insteadof direct intervention through a social safety net, fiscal policy may prove more effectivein compensating for most of the increase in the cost of living of households. The tax reliefshould benefit especially low-income households in both urban and rural areas. Over andabove this, if part of the adverse impact remains uncompensated for, then specific directintervention through social safety nets may be used. In that case the most appropriateinstrument to reach the poorest of the poor is Zakat.
5.41 One fiscal policy instrument that is broad-based, comprehensive, and largeenough to compensate for the sizable increase in the cost of living of households-andthat at the same time provides a disproportionate amount of relief to lower incomegroups-is the GST. The GST is levied on a wide range of goods and services. Theincidence of GST is regressive: the tax base declines sharply as income increases both inurban and rural areas. Although the standard GST rate is 15 percent, the effective rate iscloser to 12 percent because of lack of proper application of the tax at all stages of valueadded, especially the retail stage, and because of tax evasion. As such, the effectiveburden of the tax falls from about 4.9 percent of the income of the lowest quartile to 3.6percent in urban areas and from 5 percent to 2 percent in rural areas. As part of thealleviation strategy, it is suggested that the GST rate be reduced to 10 percent from thecurrent 15 percent. As shown in Table 5.13, the rate reduction will lower the average taxburden by 1.36 percent of income in urban areas and 1 percent in rural areas. Thisintervention will effectively compensate for more than 92 percent of the negative impactstemming from fuel price changes in urban areas, and more than 77 percent in rural areas.
5.42 For compensation of the residual burden (after relief due to lower GST)additional instruments with stronger targeting features are required. In particular, tocompensate for the residual burden on the bottom income quartile, which is in the rangeof 0.2 percent of income in both the urban and rural areas, it is suggested that the monthlyZakat allowance be enhanced by Rs 50.
5.43 The aforementioned social safety net package is unlikely to put a netburden on the exchequer because it can be financed by the extra revenues generatedthrough the petroleum-development surcharge. The loss in GST revenue due to nominalrate reduction from 15 percent to 10 percent (estimated to be in the range of Rs 38billion) and enhanced expenditure on Zakat and Ushr (about Rs 1 billion) can be financedout of the revenue gain of Rs 45 billion. As such, the proposed package is also fiscallysustainable. An increase in the price of HSD by as much as 67 percent is likely to be metby strong opposition, and the only way to pre-empt such opposition would be to announcean equally significant move for tax relief such as a one-third reduction in the standardGST rate.

82 Pakistan Clean Fuels
Table 5.13: Impact of Changes in GST
Item Location 15' Quartile 2nd Quartile 3rd Quartile 4th Quartile All
Tax base for GST(Rs) Urban 12,200 18,115 25,839 47,557 25,670
Tax base as % of income Urban 40.7 38.2 36.3 30.3 34.1
Incidence of GST (%) Urban 4.88 4.58 4.36 3.64 4.09
Reduction in incidence of Urban -1.63 -1.53 -1.45 -1.21 -1.36GST (%)
Incidence of fuel price Urban 1.89 1.81 1.65 1.19 1.47changes (%)
Residual burden of fuel price Urban 0.26 0.28 0.2 -0.02 0.11changes (%)
Tax base for GST (Rs) Rural 9,038 12,873 16,507 23,701 15,450
Taxbaseas%ofincome Rural 41.4 35.1 31.1 16.9 24.7
Incidence of GST (%) Rural 4.97 4.21 3.73 2.03 2.96
Reduction in incidence of Rural -1.66 -1.4 -1.24 -0.68 -0.99GST (%)
Incidence of fuel price Rural 1.9 1.66 1.51 1 1.28changes (%)
Residual burden of fuel price Rural 0.24 0.26 0.27 0.32 0.29changes (%)
Note: The incidence of GST is computed at an effective rate of 12 percent. The reduction in the incidence ofGST is based on a reduction of one-third.
Conclusions and Recommendations
5.44 The study finds that gasoline can substitute for only about 11 percent ofthe intra-city consumption of HSD, which is equivalent to only about 4 percent of totalHSD consumption. A continuing wide gap between gasoline and diesel prices, however,could encourage further fuel switching from gasoline and diesel, with as much as 700,000metric tons of gasoline currently consumed in urban centers potentially converting todiesel. In order to encourage as many light-duty vehicle owners as possible to switch backto, or remain with, gasoline, two options were considered: scenario 1, which involves alarge increase (67 percent) in HSD price and a small decrease (10 percent) in gasolineprice; and scenario 2, which involves a small increase in diesel price (10 percent) and alarge decrease (29 percent) in gasoline price.
5.45 Scenario 1 has major economy-wide consequences. Because diesel is usedin freight transport, a marked rise in its price affects heavy-duty diesel vehicles for whichthe pricing scheme is not intended, resulting in economy-wide inflation. Scenario 1generates substantial additional revenues (thereby reducing the budget deficit) andreduces imports significantly (thereby improving the balance of payments) at the cost ofsomewhat lower growth (due primarily to contraction of the road transport sector),significantly higher short-run inflation, and slightly higher unemployment. The impact on

Fuel Tax Policy 83
the cost of living is regressive, with the poor being the most severely affected. The poorare conservatively estimated to increase in number by almost 1.5 million.
5.46 Scenario 2 benefits the richer car users considerably, and encourages ratherthan discourages the use of private cars in urban areas. It has limited macroeconomicimplications compared to scenario 1, achieving the same desired fuel indifferencebetween HSD and gasoline among vehicle owners but causing much smaller dislocationto the economy. There are some minor revenue losses and a small worsening in thebalance of payments, but it marginally affects the poorer sections of society whileconferring some benefits to car owners. The adverse political implication of the formercan be countered relatively easily.
5.47 The sharp diesel price hike contemplated in scenario 1 is likely to meetstiff resistance, especially because heavy-duty vehicles (which account for bulk of dieselconsumption) will have no option but to bear the higher input costs and raise transporttariffs. This highlights the limitation of not incorporating differentiated vehicle tax in theanalysis. The government can match the diesel price increase with a countervailing reliefin the form of a large reduction in the standard GST rate. Such a counter-measure may ormay not prove to be successful. Its success will depend essentially on the perceivedburden of GST and the extent to which the fall in the rate of GST is accompanied by acorresponding fall in the prices of the essential goods and services. On balance, thepolitical feasibility of raising the HSD price sharply is considered low. If a differentiatedvehicle tax scheme must be ruled out, Scenario 2 may be a less disruptive strategy,although it may also have serious adverse effects on the transport sector.
5.48 The findings presented in this chapter suggest that fuel tax policy alone isa poor instrumnent for inducing a shift from diesel to gasoline. While scenario 2 may havenegligible economy-wide consequences, the transport sector in Pakistan is plagued byurban congestion and inadequate provision for road maintenance. A move that willcertainly encourage greater urban private car use will further exacerbate problemsencountered in the transport sector, even if there are environmental gains to be made.These observations highlight the importance of coordinating policies across environment,transport, and energy sectors, and of using several policy instruments rather than just oneto address environmental and transport problems.


Annex 1. Incremental Cost Calculations
Al. 1 This annex explains the following aspects of the incremental costcalculations used in the Clean Fuels study:
* Pricing basis
* The economics of improving gasoline quality
* The economics of reducing sulfur in diesel
* The economics of reducing sulfur in fuel oil.
Pricing Basis
A1.2 An octane value17 of US$1.10 per ton18 was used to determine the pricesof the grades of gasoline in Pakistan. For the surplus naphtha and reformate blendstocksthat will be exported, the appropriate reference price is free-on-board (FOB) Singaporeminus freight,19 while the prices of all the other gasoline grades that are imported arebased on Arab Gulf prices plus the relevant freight costs. Marine insurance at 0.5 percenthas been added to arrive at the cost, insurance, and freight (CIF) prices.
A1.3 As the domestic market will continue to have leaded gasoline, the price ofleaded gasoline is calculated as the sum of the value of unleaded gasoline and the cost oflead added. The price of leaded gasoline is therefore a function of both the value of theclear octane and the cost of lead blended. Gasoline prices in Pakistan used in this studyare shown in Table Al.1.
A1.4 The differential between 0.5- and 1.0-percent-sulfur gasoil20 for FOBSingapore has not varied significantly over the last decade despite the large variations incrude oil price. For the study, the overall average of US$1.70 per ton has been used. For areduction to 0.25 percent sulfur, a differential of US$2.50 per ton with respect to 0.5percent sulfur has been selected. The resulting prices are presented in Table A1.2.
A1.5 Finally, on the basis of historical data, the study used a price differentialfor FOB Singapore of US$12 per ton between 3.5- and 1.0-percent-sulfur fuel oil. Thisdifferential would be equivalent to approximately US$19-20 per ton based on FOB Arab
17 The octane value is the dollar amount payable for every increase in octane per ton of gasoline.
8 For this annex, all dollar amounts are in 1998 U.S. dollars.
19 FOB Singapore is the price quoted in Singapore for goods to be exported from Singapore. Freight hererefers to freight charges from Pakistan to Singapore.
20 Gasoil is an intermediate distillate produced used for diesel fuel, for heating fuel, and sometimes asfeedstock.
85
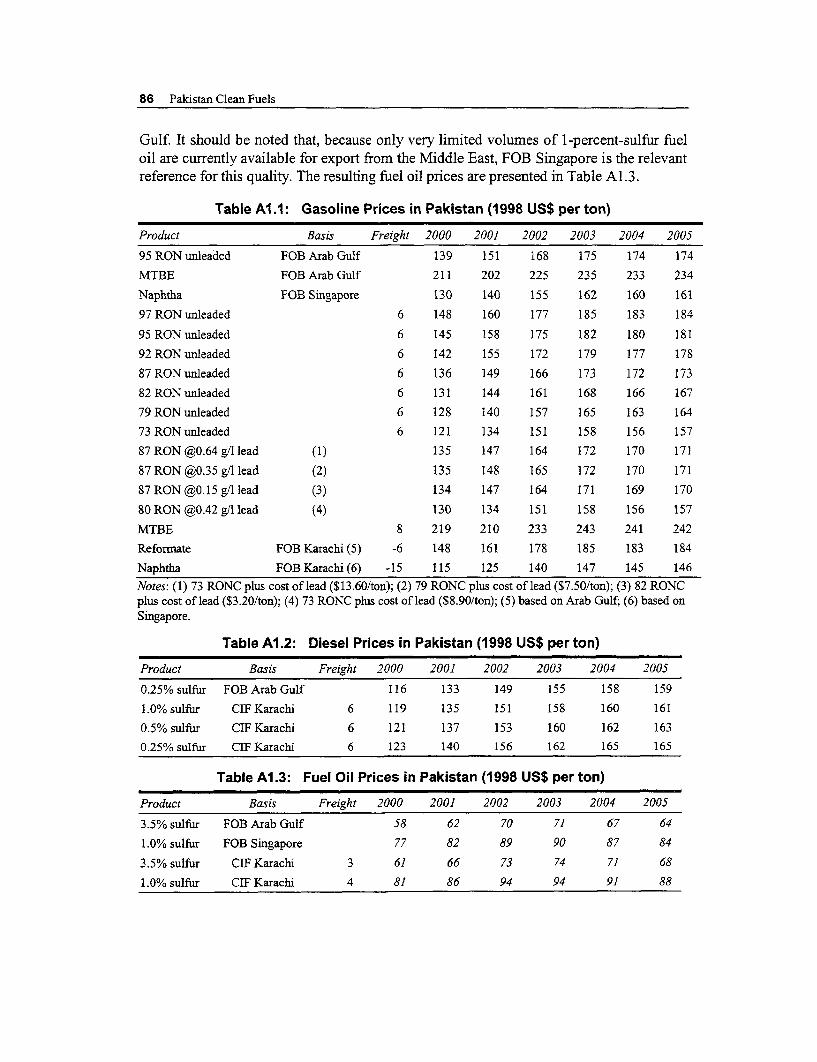
86 Pakistan Clean Fuels
Gulf. It should be noted that, because only very limited volumes of 1 -percent-sulfur fueloil are currently available for export from the Middle East, FOB Singapore is the relevantreference for this quality. The resulting fuel oil prices are presented in Table A1.3.
Table A1.1 : Gasoline Prices in Pakistan (1998 US$ per ton)
Product Basis Freight 2000 2001 2002 2003 2004 2005
95 RON unleaded FOB Arab Gulf 139 151 168 175 174 174
MTBE FOB Arab Gulf 211 202 225 235 233 234
Naphtha FOB Singapore 130 140 155 162 160 161
97 RON unleaded 6 148 160 177 185 183 184
95 RON unleaded 6 145 158 175 182 180 181
92RONunleaded 6 142 155 172 179 177 178
87 RON unleaded 6 136 149 166 173 172 173
82 RON unleaded 6 131 144 161 168 166 167
79RONunleaded 6 128 140 157 165 163 164
73 RON unleaded 6 121 134 151 158 156 157
87 RON @ 0.64 g/I lead (1) 135 147 164 172 170 171
87 RON @0.35 g/l lead (2) 135 148 165 172 170 171
87 RON @ 0.15 g/l lead (3) 134 147 164 171 169 170
80 RON @0.42 g/l lead (4) 130 134 151 158 156 157
MTBE 8 219 210 233 243 241 242
Reformate FOB Karachi (5) -6 148 161 178 185 183 184
Naphtha FOB Karachi (6) -15 115 125 140 147 145 146Notes: (1) 73 RONC plus cost of lead ($13.60/ton); (2) 79 RONC plus cost of lead ($7.50/ton); (3) 82 RONCplus cost of lead ($3.20/ton); (4) 73 RONC plus cost of lead ($8.90/ton); (5) based on Arab Gulf; (6) based onSingapore.
Table A1.2: Diesel Prices in Pakistan (1998 US$ per ton)
Product Basis Freight 2000 2001 2002 2003 2004 2005
0.25% sulfur FOB Arab Gulf 116 133 149 155 158 159
1.0% sulfur CIF Karachi 6 119 135 151 158 160 161
0.5% sulfur CIF Karachi 6 121 137 153 160 162 163
0.25% sulfur CIF Karachi 6 123 140 156 162 165 165
Table A1.3: Fuel Oil Prices in Pakistan (1998 US$ per ton)
Product Basis Freight 2000 2001 2002 2003 2004 2005
3.5% sulfur FOB Arab Gulf 58 62 70 71 67 64
1.0% sulfur FOB Singapore 77 82 89 90 87 84
3.5% sulfur CIF Karachi 3 61 66 73 74 71 68
1.0% sulfur CIF Karachi 4 81 86 94 94 91 88

Annex 1 87
Economics of Gasoline Quality ImprovementA1.6 The free-market pricing scenario is illustrated in Table A1.4. The cost oftetraethyl lead (TEL) was taken to be US$6,400 per ton. At a lead concentration of 39.4percent in TEL, this translates to US$16,244 per ton of lead. Gasoline density is assumedto be equivalent to 1,312 liters per ton of gasoline. Capital costs are annualized by taking20 percent of the total capital.
Table AI.4: Gasoline Quality Improvement: Free-Market Pricing
Parameter 2000 2003 2005
Demand (ktpa) 1,367 1,450 1,487
Specifications
Base-case specifications 80 RON @0.42 g/l lead
87 RON @0.64 g/l lead
Reconmmended specifications 87 RON @0.35 g/l lead 87 RON @0.15 g/l lead 87 RON lead-free
Base-case RONC 73 73 73
Recommended RONC 79 82 87
Incremental octane 6 9 14
Cost per octane ton (US$) 1.1 1.1 1.1
Total cost (US$ million) 9.0 14.4 22.9
Lead required (thousand tons)
Base case 0.84 1.08 1.11
Recommended case 0.53 0.28 0.00
Reduction 0.31 0.80 1.11
Cost of lead (US$ per ton) 16,244 16,244 16,244
Total savings (US$ million) -5.0 -13.0 -18.0
Net cost impact (US$ million) 4.0 1.4 4.9
Cost per liter (US cents) 0.26 0.07 0.26
Note: 1998 U.S. dollars and cents.
A1.7 Table A1.5 shows the cost to Pakistan of adjusting refinery throughputs,imports, and exports; investing in additional storage for naphtha and MTBE; and makingminor modifications to the reformers at ARL, NRL, and PRL to be able to run at 95 RONseverity.
A1.8 An estimate of the capital investment and operating costs for installingisomerization units at NRL, PARCO, and PRL is outlined in Table A1.6. The resultingcost comparison is presented in Table A1.7.

88 Pakistan Clean Fuels
Table A1.5: Gasoline Quality Improvement: Cost to Pakistan RefineriesParameter 2000 2003 2005
Demand (ktpa) 1,367 1,450 1,487
Change in Imports Gasoline MTBE Total Gasoline MTBE Total Gasoline MTBE Total
Base case (ktpa) 236 54 0 0 0 0
Recommended case (ktpa) 236 108 0 0 0 112
Incremental amount (ktpa) -0.4 54 0 0 0 112
Price (CIF Karachi, $/ton)
Base case 133 219 243 0 242
Recommended case 135 219 171 243 173 242
Incremental import costs (US$ 0.5 11.9 12.4 0 0 0 0 27 27million)
Change in exports Reformate Naphtha Reformate Naphtha
Base case (ktpa) 0 277 421 140 374 140
Recommended case (ktpa) 0 331 96 465 139 487
Incremental exports (ktpa) 0 54 -325 325 -235 347
Price (FOB Karachi, $/ton) 148 115 185 147 184 146
Incremental export revenues 0.0 -6.2 -6.2 60.1 -47.9 12.2 43.2 -50.7 -7.5(US$ million)
Total impact (US$ million) 6.2 12.2 19.6
Additional freight charge (US$million)
Additional MTBE to 0.2 1.3Dhodak/PARCO
PARCO reformate to ARL 0.4
No requirements to move -5.1 -4.0PARCO's reformate for export
Incremental freight cost (US$ 0.2 -5.1 -2.3million)
Lead required (thousand tons)
Base case 0.84 1.08 1.1
Recommended case 0.53 0.28 0.0
Lead reduced 0.31 0.80 1.1
Cost per ton lead (USS per ton) 16,244 16,244 16,244
Total savings (US$ million) -5.0 -13.0 -18.0
Charge for capital investment
Naphtha and MTBE storage at 0.4 OA 0.4NRL and PRL (US$ million)l
Revamp reformers at NRL, 1.8PRL and ARL to produce 95RON
2
Net impact (US$ million) 1.8 -5.5 1.5
Cost per liter (US cents) 0.12 -0.29 0.08
Note: 1998 U.S. dollars and cents.'Total capital cost US$2 million.2 Total capital cost USS9 million.

Annex 1 89
Table A1.6: Cost of Installing Isomerization Units
Refinery Item Capacity Investment(bpsd) (US$ million)
NRL Once-through isomerization 600 7
Light naphtha hydrotreater 600 5
Modifications to naphtha splitter 2
Total capital cost 14
Incremental operating costs, per year 0.3
PRL Once-through isomerization 1,100 9
Modifications to naphtha splitter 2
Total capital cost 11
Incremental operating costs, per year 0.6
PARCO Once-through isomerization 3,100 17
Light naphtha hydrotreater 3,100 12
Modifications to naphtha splitter 2
Total capital cost 31
Incremental operating costs, per year 1.7Note: 1998 U.S. dollars and cents.
Table A1.7 Impact of Isomerization in 2005
Parameter No Isomerization Isomerization Change
Change in MTBE imports (ktpa) 112 25 -87
Price (CIF Karachi, US$/ton) 242
Savings in MTBE imports cost (US$ million) -21
Change in exports Reformate Naphtha Reformate Naphtha
Exports 139 487 105 432
Price (FOB Karachi ($/ton) 184 146 184 146
Exports revenue reduction (US$ million) -26 -71 -19 -63 14
Total impact (US$ million) -6.8
Reduction in freight cost (US$ million) 1.6 0.3 -1.3
Charge for capital investment (US$ million/year)
Naphtha and MTBE storage at NRL and PRL 0.4 0.4 0.0
Revamp reformers at NRL,PRL and ARL to 1.8 1.8 0.0produce 95 RON
Isomnerization 11.1 11.1
Incremental capital charge (US$ million/year) 11.1
Isomerization operating cost (US$ million/year) 2.6
Net impact (US$ million) 5.7
Cost per liter (US cents) 0.3Note: 1998 U.S. dollars and cents.

90 Pakistan Clean Fuels
Economics of Diesel Sulfur Reduction
A1.9 Approximately US$10 million investment would be required to constructthe infrastructure for blending the high-sulfur, domestically produced diesel with lower-sulfur imported diesel to achieve the desired uniform specification of 0.5 percent sulfur inPakistan. The figures are given in Table A1.8. The incremental cost of lowering sulfur indiesel would consist of the additional cost of importing lower-sulfur diesel and theannualized cost of capital. The results are shown in Table A1.9.
Table A1.8: Infrastructure Investment Costs for Diesel Sulfur Reduction(1998 US$ million)
Item Investment Cost
Buffer storage at Korangi for blending 5
65,000 ton storage at Zulfiqarabad Oil Terminal (ZOT) 3
Pipeline between buffer storage and refineries 2
Total 10
Table A1.9: Cost of Diesel Sulfur Reduction
Sulfur Cost (1998
Year Parameter 1% 0.50% 0.25% Total US$ million)
2000 Imports (ktpa)
Base case 5,981 0 0 5,981 711
Proposed case 0 4,181 1,800 5,981 726
Incremental irnports cost 14.7
Annualized capital (US$ million) 2.0
Total cost (US$ million) 16.7
Cost per liter (US cents) 0.2
2003 Irnports (ktpa)
Base case 5,910 0 0 5,910 933
Proposed case 0 1,910 4,000 5,910 953
Incremental imports cost 20.0
Annualized capital (US$ mnillion) 2.0
Total cost (US$ million) 22.0
Cost per liter (US cents) 0.3
2005 Imports (ktpa)
Base case 7,205 0 0 7,205 1,161
Proposed case 0 3,205 4,000 7,205 1,183
Incremental imports cost 22.2
Annualized capital (US$ million) 2.0
Total cost (US$ million) 24.2
Cost per liter (US cents) 0.3
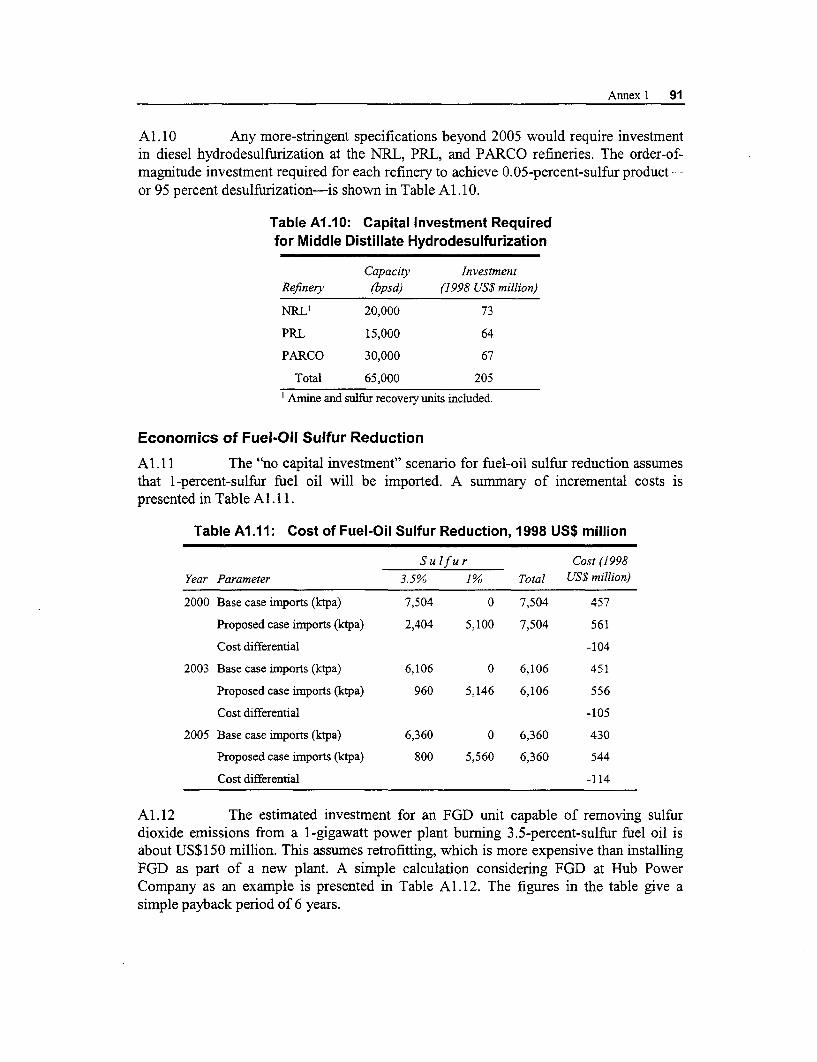
Annex 1 91
A1.10 Any more-stringent specifications beyond 2005 would require investmentin diesel hydrodesulfurization at the NRL, PRL, and PARCO refineries. The order-of-magnitude investment required for each refinery to achieve 0.05-percent-sulfur product-or 95 percent desulfurization-is shown in Table A1.10.
Table A1.10: Capital Investment Requiredfor Middle Distillate Hydrodesulfurization
Capacity InvestmentRefinery (bpsd) (1998 US$ million)
NRLI 20,000 73
PRL 15,000 64
PARCO 30,000 67
Total 65,000 205
IAmiine and sulfur recovery units included.
Economics of Fuel-Oil Sulfur Reduction
A1.11 The "no capital investment" scenario for fuel-oil sulfur reduction assumesthat 1-percent-sulfur fuel oil will be imported. A summary of incremental costs ispresented in Table Al . 1.
Table A1.11: Cost of Fuel-Oil Sulfur Reduction, 1998 US$ million
S u lf u r Cost (1998
Year Parameter 3.5% 1% Total US$ million)
2000 Base case imports (ktpa) 7,504 0 7,504 457
Proposed case imports (ktpa) 2,404 5,100 7,504 561
Cost differential -104
2003 Base case imports (ktpa) 6,106 0 6,106 451
Proposed case imports (ktpa) 960 5,146 6,106 556
Cost differential -105
2005 Base case imports (ktpa) 6,360 0 6,360 430
Proposed case imports (ktpa) 800 5,560 6,360 544
Cost differential -114
Al.12 The estimated investment for an FGD unit capable of removing sulfurdioxide emissions from a 1-gigawatt power plant burning 3.5-percent-sulfur fuel oil isabout US$150 million. This assumes retrofitting, which is more expensive than installingFGD as part of a new plant. A simple calculation considering FGD at Hub PowerCompany as an example is presented in Table A1.12. The figures in the table give asimple payback period of 6 years.

92 Pakistan Clean Fuels
Table A1.12: Flue Gas Desulfurization Economics
Parameter Value Unit
Capacity 1.0 gigawatt
Cost (retrofit) 150 US$ million
Capacity 1.3 gigawatt
Fuel oil consumed 1,440 ktpa
FGD cost 175 US$ rnillion
Fuel oil price difference 20 US$/ton
Incremental fuel oil cost 29 US$ mnillion
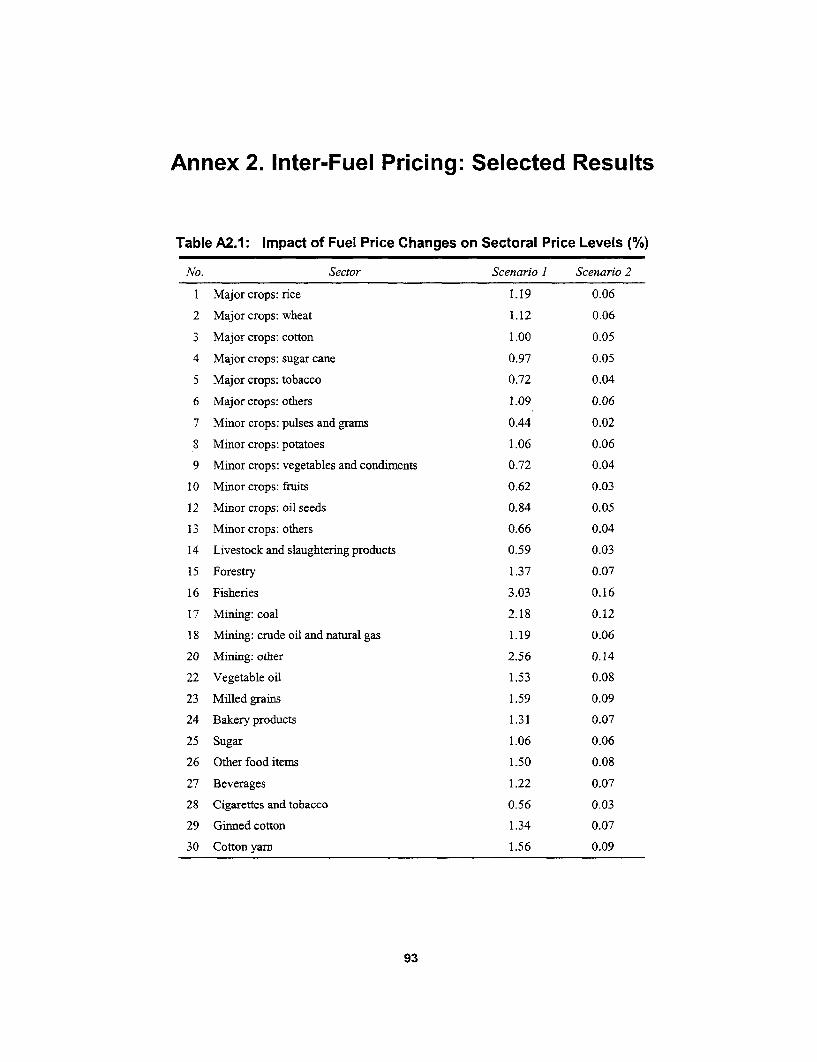
Annex 2. Inter-Fuel Pricing: Selected Results
Table A2.1: Impact of Fuel Price Changes on Sectoral Price Levels (%)
No. Sector Scenario I Scenario 2
I Major crops: rice 1.19 0.06
2 Major crops: wheat 1.12 0.06
3 Major crops: cotton 1.00 0.05
4 Major crops: sugar cane 0.97 0.05
5 Major crops: tobacco 0.72 0.04
6 Major crops: others 1.09 0.06
7 Minor crops: pulses and grams 0.44 0.02
8 Minor crops: potatoes 1.06 0.06
9 Minor crops: vegetables and condiments 0.72 0.04
10 Minor crops: fruits 0.62 0.03
12 Minor crops: oil seeds 0.84 0.05
13 Minor crops: others 0.66 0.04
14 Livestock and slaughtering products 0.59 0.03
15 Forestry 1.37 0.07
16 Fisheries 3.03 0.16
17 Mining: coal 2.18 0.12
18 Mining: crude oil and natural gas 1.19 0.06
20 Mining: other 2.56 0.14
22 Vegetable oil 1.53 0.08
23 Milled grains 1.59 0.09
24 Bakery products 1.31 0.07
25 Sugar 1.06 0.06
26 Other food items 1.50 0.08
27 Beverages 1.22 0.07
28 Cigarettes and tobacco 0.56 0.03
29 Ginned cotton 1.34 0.07
30 Cotton yam 1.56 0.09
93

94 Pakistan Clean Fuels
No. Sector Scenario ] Scenario 2
31 Cotton cloth 1.81 0.10
32 Art silk 1.78 0.10
33 Made-up textile goods 1.19 0.06
34 Knitwear 1.62 0.09
35 Carpets 1.75 0.10
36 Garments 1.78 0.10
37 Other textile products 1.62 0.09
38 Leather and leather products 1.28 0.07
39 Footwear 0.94 0.05
40 Wood, wood products, and furniture 1.65 0.09
41 Paper and printing 1.75 0.10
42 Pharmaceuticals 1.75 0.10
43 Fertilizers and pesticides 1.72 0.10
44 Chemicals, consumer products 1.75 0.10
45 Refined petroleum products 33.01 1.80
46 Rubber and plastic products 1.81 0.10
47 Other chemicals 2.62 0.14
48 Bricks 1.28 0.07
49 Cement 6.12 0.33
50 Other non-metallic mineral product 1.87 0.10
51 Basic metal products 3.09 0.17
52 Metal products 1.93 0.11
53 Non-electrical machinery 3.55 0.19
54 Electrical equipment 2.09 0.11
55 Transport equipment 2.28 0.12
56 Surgical instruments 2.59 0.14
57 Handicrafts 1.31 0.07
58 Sports goods 1.93 0.11
59 Jewelry (precious metals) 1.34 0.07
60 Other manufacturing products 1.59 0.09
61 Electricity, water works, and supply 3.59 0.20
62 Gas supply 0.72 0.04
64 Construction and land improvement 2.43 0.13
65 Trade: wholesale 1.15 0.06
66 Trade: retail 0.41 0.02

Annex 2 95
No. Sector Scenario I Scenario 2
67 Hotels and restaurants 1.40 0.08
68 Transport: railway 8.64 0.47
69 Transport: road 8.76 0.47
70 Transport: water 2.25 0.12
71 Transport: air 9.36 0.51
72 Transport other and storage 1.34 0.07
73 Communication 0.40 0.02
74 Banking: central monetary authority 0.50 0.03
75 Banking: scheduled and cooperative bank 0.44 0.02
76 Banking: other credit institutions 0.16 0.01
77 Banking: nominal industry 0.37 0.01
78 Insurance 0.28 0.01
79 Real estate services 1.43 0.08
80 Ownership of dwellings 0.37 0.02
81 Business services 3.62 0.20
82 Public administration and defense 2.34 0.13
83 Education 0.34 0.01
84 Health care 0.78 0.04
85 Social and cultural services 1.06 0.06
86 Personal and household services 0.84 0.05
Table A2.2: Annual Urban Household Expenditures,by Income Quartile and Sector (rupees)
No. Sector I" Quartile 2 nd Quartile 3d Quartile 4rh Quartile Aggregate
1 Major crops: rice 635 1,042 1,408 1,918 1,244
2 Major crops. wheat 443 459 584 879 587
6 Major crops: other 2 6 5 18 8
7 Minor crops: pulses and grams 595 795 1,010 1,257 911
8 Minor crops: potatoes 400 565 643 767 592
9 Minor crops: vegetables and condiments 2,276 3,214 4,077 5,362 3,715
10 Minor crops: fruits 504 869 1,348 2,919 1,392
13 Minor crops: other 143 181 267 321 227
14 Livestock and slaughtering products 4,909 7,463 10,795 18,335 10,283
15 Forestry 667 576 535 352 534

96 Pakistan Clean Fuels
No. Sector 15' Quartile 2nd Quartile 3 ,d Quartile 4 th Quartile Aggregate
16 Fisheries 132 254 307 563 311
20 Mining: other 31 53 48 77 52
22 Manufacturing: vegetable oils 1,956 2,708 3,543 4,543 3,174
23 Manufacturing: milled grains 2,957 4,315 5,300 5,557 4,526
24 Manufacturing: bakery products 317 600 1,020 2,679 1,135
25 Manufacturing: sugar 1,182 1,590 1,981 2,489 1,804
26 Manufacturing: other food items 894 1,395 2,066 4,212 2,116
27 Manufacturing: beverages 69 132 227 778 295
28 Manufacturing: cigarettes and tobacco 490 784 1,046 1,730 1,004
31 Manufacturing: cotton cloth 753 1,122 1,527 2,222 1,397
33 Manufacturing: nade-up textile goods 171 283 445 822 426
35 Manufacturing: carpets 0 4 8 52 16
36 Manufacturing: ganrnents 204 320 532 1,006 510
37 Manufacturing: other textile products 1,564 2,314 3,233 4,872 2,975
38 Manufacturing: leather and leather 3 4 13 45 16products
39 Manufacturing: footwear 411 643 933 1,509 867
40 Manufacturing: wood, wood products 48 85 165 568 212and furniture
42 Manufacturing: pharmaceuticals 509 710 1,102 2,221 1,122
44 Manufacturing: chenicals, consumner 1,714 2,497 3,490 5,451 3,264
products
46 Manufacturing: rubber and plastic 182 269 333 690 364
products
47 Manufacturing: other chemnicals 267 313 379 789 432
50 Manufacturing: other non-metallic 138 213 297 568 301mnineral products
52 Manufacturing: metal products 60 74 123 214 117
53 Manufacturing: non-electrical machinery 9 13 32 67 30
54 Manufacturing: electrical equipment 177 320 565 1,164 549
56 Manufacturing: surgical instruments 2 10 9 14 9
60 Manufacturing: other manufactured 167 267 454 833 425products
61 Electricity water works and supply 1,296 1,952 2,629 4,420 2,552
62 Gas supply 501 994 1,401 2,212 1,267
64 Construction and land improvement 196 279 492 1,210 536

Annex 2 97
No. Sector 15' Quartile 2 d Quartile 3rd Quartile 4th Quartile Aggregate
66 Trade: retail 3 50 183 987 297
67 Hotels and restaurants 753 846 1,148 2,316 1,253
68 Transport: railway 19 35 39 175 66
69 Transport: road 908 1,564 2,248 3,686 2,084
71 Transport: air 0 0 2 140 34
72 Transport: other and storage 18 15 27 36 24
73 Communication 85 231 595 2,717 883
76 Banking: other credit institutions 9 27 23 47 26
78 Insurance 0 4 15 81 24
79 Real estate services 6,869 10,465 14,891 29,208 15,190
81 Business services 0 30 5 60 23
82 Public administration and defense 116 196 284 784 339
83 Education 1,129 2,243 4,190 9,763 4265
84 Health care 446 593 799 1,477 821
85 Social and cultural services 7 22 48 152 56
86 Personal and household services 1,024 2,011 3,167 7,910 3,473
Average household income 29,960 47,459 71,175 156746 75,339
Average household expenditures 38,366 58,119 82,577 144,604 80,169
Notes: First quartile up to Rs 39,600 per annum; second quartile between Rs 39,600 and 57,600; third quartilebetween Rs 57,600 and 90,000; fourth quartile above Rs 90,000.
Table A2.3: Annual Rural Household Expendituresby Income Quartile and Sector (rupees)
No. Sector P Quartile 2" Quartile 3 rd Quartile 4th Quartile Aggregate
I Major crops: rice 484 807 1,064 1,373 925
2 Major crops. wheat 1487 2,027 2,856 4,189 2,628
6 Major crops: other 23 71 113 180 96
7 Minor crops: pulses and gramns 577 758 917 1,183 855
8 Minor crops: potatoes 405 560 672 822 612
9 Minor crops: vegetables and condiments 1931 2,682 3,303 4,143 2,999
10 Minor crops: fruits 361 575 866 1,369 788
13 Minorcrops: other 384 318 690 438 459
14 Livestock and slaughtering products 4154 6,254 8,810 13,838 8,219
15 Forestry 1139 1,493 1,783 2,198 1,646

98 Pakistan Clean Fuels
No. Sector I"t Quartile 2nd Quartile 3d Quartile 4Ih Quartile Aggregate
16 Fisheries 104 167 180 181 157
20 Mining: other 28 37 42 52 40
22 Manufacturing: vegetable oils 1750 2,323 2,634 3,009 2,417
23 Manufacturing: milled grains 1815 2,776 3,185 2,992 2,672
24 Manufacturng: bakery products 159 290 381 710 382
25 Manufacturing: sugar 1274 1,767 2,255 2,992 2,061
26 Manufacturing: other food items 1,102 1,900 3,212 6,356 3,125
27 Manufacturing: beverages 25 65 140 237 116
28 Manufacturing: cigarettes and tobacco 509 785 964 1,244 870
31 Manufacturing: cotton cloth 541 782 960 1,277 885
33 Manufacturing: made-up textile goods 170 243 319 592 329
35 Manufacturing: carpets 1 1 5 8 4
36 Manufacturing: garments 128 183 257 362 232
37 Manufacturing: other textile products 1,356 2,002 2,531 3,490 2,331
38 Manufacturing: leather and leather 2 4 7 26 10products
39 Manufacturing: footwear 326 504 697 1,048 640
40 Manufacturing: wood, wood products 61 89 141 393 170and furniture
42 Manufacturing: pharmaceuticals 532 681 1,090 1,474 941
44 Manufacturing: chemicals, consumer 1,300 1,825 2,203 2,959 2,061products
46 Manufacturing: rubber and plastic 162 211 286 407 266products
47 Manufacturing: other chemicals 204 244 290 392 282
50 Manufacturing: other non-metallic 105 151 213 307 193mineral products
52 Manufacturing: metal products 32 54 67 120 68
53 Manufacturing: non-electrical machinery 8 15 46 50 30
54 Manufactuing: electrical equipment 138 254 419 950 438
56 Manufacturing: surgical instruments 2 2 7 8 5
60 Manufacturing: other manufactured 95 173 257 469 247products
61 Electricity water works and supply 547 834 1,235 1,820 1,103
62 Gas supply 30 58 105 223 103
64 Construction and land improvement 200 303 486 1,321 575

Annex 2 99
No. Sector I" Quartile 2nd Quartile 3rd Quartile 4 th Quartile Aggregate
66 Trade: retail 2 4 10 50 16
67 Hotels and restaurants 258 252 333 456 325
68 Transport: railway 6 23 40 79 37
69 Transport: road 706 1,122 1,422 5,012 2,056
71 Transport: air 0 0 0 47 12
72 Transport: other and storage 9 16 28 40 23
73 Communication 19 45 104 277 111
76 Banking: other credit institutions 2 4 19 3 7
78 Insurance 3 6 6 6 5
79 Real estate services 2,838 3,676 4,446 5,852 4,185
81 Business services 2 10 42 338 98
82 Public administration and defense 32 49 84 129 73
83 Education 767 1,411 2,408 5,992 2,630
84 Health care 310 592 726 1,243 712
85 Social and cultural services 1 7 7 17 8
86 Personal and household services 711 1,336 1,887 3,001 1,720
Average household income 21,855 36,712 53,032 140,274 62,641
Average household expenditures 29,320 42,744 56,582 83,864 52,837
Notes: First quartile up to Rs 30,000 per annum; second quartile between Rs 30,000 and 44,436; third quartilebetween Rs 44,436 and 67,800; fourth quartile above Rs 67,800.

Annex 3. Historical Overview of Social Safety Nets
A3. 1 Pakistan currently has a number of social safety nets in operation:
* Zakat
* Bait-ul-Maal
* Ushr
* Wheat Subsidy
* Employees Old Age Benefits Institution
* Housing Finance by the Housing Building Finance Corporation
* Micro-Credit Scheme of HBL-NRSP
Zakat
A3.2 The Zakat and Ushr Ordinance was passed in 1980. Zakat is a form ofcharity religiously mandated under Islam and officially collected only from SunniMuslims. An autonomous Zakat council administers the Central Zakat Fund maintainedby the State Bank of Pakistan (SBP), which does not form part of the federal consolidatedfund. This council is supported by the Zakat and Ushr wing of the Ministry of ReligiousAffairs. Disbursement in the provinces is regulated by the provincial Zakat councils. Themost important tier is the local Zakat committee, which identifies the Mustahqin (theneedy and the indigent). It is estimated that there are about 1.5 million Mustahqin atpresent. These committees, of which there are about 39,000, have seven elected, non-official, unpaid members. Each committee can spend up to 10 percent of its allocatedfunds on administration.
A3.3 Compulsory deductions for Zakat are made once a year from SunniMuslims at the rate of 2.5 percent on the value of specified financial assets. Collections infiscal 1997-98 are estimated at Rs 4.1 billion, a drop from the peak of Rs 4.7 billioncollected in fiscal 1993-94. More than half the revenue comes from a tax on savings bankaccounts and about 16 percent from fixed deposits. A judgment by the Supreme Court hasallowed all sects to file a declaration seeking exemption from payment of Zakat on financialassets, putting in jeopardy the mechanism of compulsory deductions and therefore affectingthe level of contributions.
A3.4 The Central Zakat Fund retains a portion of the proceeds, which it invests ona non-interest basis. The outstanding cash balance in January 1997 was almost Rs 11billion. Provincial disbursements are based on population, although this criterion is notstrictly followed. Distribution of funds by the provincial Zakat council is formula-driven,with 60 percent going to local Zakat committees and the remaining 40 percent to
101

102 Pakistan Clean Fuels
institutions such as deeni madaris (religious schools), public hospitals, and vocationaltraining institutions.
A3.5 Those eligible to receive Zakat, either directly or indirectly, include needy,indigent, and poor people (especially widows and orphans) and people with handicaps ordisabilities. Local Zakat committees give two main types of support: a monthly subsistenceallowance of Rs 250 to each Mustahqin with an additional Rs 50 per child, and arehabilitation grant of up to Rs 3,000. These two grants constitute about 70 percent of thesupport. Grants for Jahez (marriage dowry), educational, and medical expenses make up theremaining 30 percent. All payments are made through banks.
A3.6 Zakat performs well on a number of criteria. The support provided in theform of subsistence allowance appears to be adequate. According to one estimate, thisallowance is about three times the average income gap of people living in poverty (WorldBank 1995). Since the allowance is in cash, this is equivalent in welfare terms to an increasein income of the same amount. Administration costs as a whole are low, primarily becauseof voluntary inputs provided by members of the local committees. One of the strongestpoints in favor of the Zakat is its access to an earmarked source of revenue, althoughcontributions are likely to be adversely affected by the Supreme Court judgment oncompulsory deductions. Reliance on a specific source not only ensures sustainability, butthe nature of the tax (on financial assets) is such that the burden falls mostly on upper-income households. As a result, the Zakat has the potential of playing a strong redistributiverole.
A3.7 Problems with the Zakat include its targeting efficiency. There is conflictingevidence, with some studies showing that about half the benefits go to the lowest quintile ofhouseholds in 1991 (World Bank 1995, Jehle 1995), whereas Shirazi (1996) shows that asmuch as 94 percent of Zakat (official and private) is received by families in the lowestquintile of the income distribution. Access to the benefit is another problem. A number ofstages are involved in defining a Mustahqin, and there is inevitably some patronageinvolved at the local level. The number of Mustahqin has grown slowly despite thesignificant increase in the number of people below the poverty line. With only 1.5 millionMustahqin, it is clear that the program covers only a small proportion of poor households.This demonstrates inadequate access and program coverage.
A3 .8 Being a recurring cash transfer, Zakat runs the risk of creating a state ofdependency among recipients and reducing the incentive to search for productive work.However, most of the Mustahqin are widows and the disabled who are not in a position tojoin the labor force.
A3.9 Also at issue is the interaction with private transfers. To the extent that Zakatis deducted at source, there is the possibility that private transfers may be correspondinglyreduced. This has been the basis for the argument that Zakat paymnents should be largelyvoluntary.

Annex 3 103
Bait-ul-MaalA3.10 Pakistan Bait-ul-Maal (PBM) was established in February 1992 under theprovisions of the Pakistan Bait-ul-Maal Act of 1991, mainly to provide assistance to thosein need (such as minorities) who are not covered by Zakat. PBM is administered by anautonomous board of management consisting of the chair (Ameen), five non-officialmembers (appointed by the federal government) and three official members. At about 2percent of total funds, administrative costs are low.
A3.11 Funds for the PBM come essentially in the forn of non-lapsable grants21from the federal government. Originally, the grants came from the proceeds of the exciseduty on bank advances, but since this duty was abolished in fiscal 1997-98 funding hasfallen sharply from Rs 1 billion in fiscal 1996-97 to Rs 0.2 billion in fiscal 1998-99. ThePBM also receives small grants from the Central Zakat Fund and provincial and localgovernments.
A3.12 PBM provides two main benefits: the Individual Financial Assistance (IFA)scheme, which disbursed Rs 14 million to about 5,000 beneficiaries in fiscal 1997-98; andthe Food Subsidy Scheme (FSS), renamed the Atta Subsidy Scheme (ASS). In fiscal 1997-98, ASS provided a monthly cash stipend of Rs 200 to about 240,000 families, consisting of29 percent widows, 19 percent disabled people or invalids, and the remaining 52 percentfamilies living below the poverty line. The total disbursement was Rs 0.6 billion. Until1994, PBM ran a food stamp scheme, now abandoned, that reached 4.2 million people.
A3.13 Applying for assistance from PBM is a time-consuming procedure. Threelocal people (including a local Zakat committee member) must attest to the accuracy of theapplication form, which is then processed both at the district and provincial levels.However, the prime minister and other high-level functionaries can sanction amounts inopen kutcheries (public gatherings) or elsewhere for individual financial assistance.
A3.14 PBM's limited coverage is one of its biggest problems. With only 240,000people receiving the atta subsidy, it is clear that subventions from PBM make only a minordent on poverty in Pakistan. There is also a likelihood of overlap with recipients of Zakat.Unlike the Zakat, PBM no longer has any identifiable source of income. Its exclusivereliance now on budgetary support makes it particularly vulnerable to changing fiscalconditions, as has been demonstrated by the steep fall in government contributions in fiscal1998-99. Transparency also appears to be a serious problem in terms of the level ofdiscretion that exists with high-level functionaries in allocating funds from PBM, oneexample being the recent arrest of a former chief minister of Punjab on allegations ofembezzlement of funds from PBM.
21 These funds do not lapse at the end of each year; instead, unutilized amounts are added to the funds forthe next year.

104 Pakistan Clean Fuels
Ushr
A3.15 A religious tax, Ushr, is levied under the Zakat and Ushr Ordinance onagricultural produce exceeding 948 kilograms (kg) of wheat, or the equivalent value ofother crops. Like Zakat, it is paid by Sunni Muslims. According to religious statutes, therate of Ushr is 5 percent of the value of crops at a farm site for irrigated land and 10 percentin the case of non-irrigated (barani) land. Even though a uniform rate of 5 percent is beingapplied in practice, the revenue potential of the tax is sizeable. The administration of theUshr by local committees, with voluntary inputs by members, minimizes overhead costsand increases the share of program benefits. Subventions to the poor are in the form of cashtransfers.
A3.16 Unlike Zakat, the collection and distribution of Ushr are completelydecentralized down to the local Zakat committees. Collection began in 1983, and revenuespeaked at Rs 0.3 billion in fiscal 1984-85. Since then, the local committees have largelyfailed in the task of assessment and collection and, at present, are collecting less than Rs 10million across the whole of Pakistan. An attempt was made in the Finance Act of 1990 totransfer collection responsibility to the provincial Boards of Revenue (BOR), but thisproposal has not been effectively implemented. The Ushr, which has the potential tobecome a major source of help to poverty-stricken rural households, is essentially moribundtoday.
A3.17 The issue is whether (a) the tax should be revived and its collectionimproved through a stronger tax administration (by involvement of provincial BOR) or (b)the focus should be on development instead of the agricultural income tax as emphasized bythe International Monetary Fund (RIF). If the objective is to develop social safety nets inrural areas, where poverty is high and likely to increase, then development of Ushr is clearlya better strategy. Like Zakat, it has the potential to emerge as a significant redistributivemechanism. The problem with the agricultural income tax is that its revenue accrues to theprovincial consolidated fund and may be used for purposes other than poverty alleviation.
Wheat Subsidy
A3.18 The wheat subsidy has the merit of being a generalized intervention, with noproblem of program coverage, except perhaps of rural households living in inaccessibleareas. At the federal level, the subsidy consists of the difference between the import priceand the issue price to mills. At the provincial level the subsidy is represented by thedifference between the procurement price offered to domestic farmers and the issue priceplus the transport and incidental costs. In fiscal 1997-98 the subsidy bill was Rs 4.2 billionto the federal govemment and Rs 7.0 billion to the four provincial governments combined.The total subsidy has varied from year to year, with a peak of over Rs 11 billion in fiscal1997-98 and a trough of less than Rs 1 billion in fiscal 1993-94.
A3.19 There is potentially a high degree of wastage because of target inefficiency.One question is how much of the subsidy actually gets through to consumers in the form oflower prices and how much is captured by mill owners, middlemen, and corrupt officials.There is evidence that the wheat subsidy does not contribute much to lowering prices

Annex 3 105
(Zaman 1996). Wheat availability, which is regulated, can be manipulated. Anotherquestion is whether the subsidized wheat prices could affect the domestic producers bylowering farm incomes, particularly those of small farmers.
A3.20 Even if some of the benefits of the subsidy trickle through to consumers,because it is a general, population-wide subsidy (in the absence of rationing), a major shareof the benefit is likely to accrue to upper-income households. Based on the consumptionpatterns of atta in the country, it is estimated that almost 85 percent of the consumption isby households in the upper four quintiles. This is a measure of the potential extent ofprogram leakage.
A3.21 There are serious concerns about the negative incentive effects of the wheatsubsidy, including the impact on the level of domestic wheat production, to the extent that itkeeps farm-gate prices low. It has also been alleged that rent-seeking2 2 in access to wheatquotas from the food department has led to substantial over-investmnent in milling capacity.The dependency of the wheat subsidy on federal and provincial budgets and the governmentcommitment to phase it out as part of the IMF program indicate that the source of financingis highly uncertain.
Employees Old Age Benefits Institution
A3.22 The Employees Old Age Benefits Institution (EOBI) started functioning asan autonomous body at the federal level under the Employees Old Age Benefits Act of1976. Applicable to all enterprises with 10 or more employees, it aims to provide pensionsto workers who earn less than Rs 3,000 a month. EOBI takes care of all the functionsincluding collection of employer contributions, investment of funds, and payment ofpensions through banks. It has a network of offices from which employers can get thenecessary forms. Overhead costs are estimated at less than 1 percent of the pension fund.
A3.23 Policymaking and overall supervision of the institution rests with a 19-member board of trustees, with representation from federal ministries, provincial labordepartments, employers, and employees. The secretary of the Federal Ministry of Labor actsas the chair. The institution's accounts are subject to audit both by the government and anextemal auditor.
A3.24 Employers pay periodic contributions (at 5 percent of wages) for theirregistered workers. By June 1997, more than 37,000 employers were making contributionsfor 1.2 million registered workers. The annual growth rate in contributions in the 1990s was6 percent, and the annual income from such contributions is currently estimated at about Rs1 billion. The federal government traditionally gives a grant of up to Rs 1 billion from thebudget each year, although it was slashed for the first time in fiscal 1997-98 because offiscal constraints. Even so, EOBI has built up a fund of over Rs 27 billion.
22 The use of real resources to obtain access to goods or services whose supply is restricted by law orpolicy.

106 Pakistan Clean Fuels
A3.25 Anyone who has worked for at least 15 years and is 60 years of age (55 yearsfor women) is eligible for a monthly pension provided the employer makes the EOBIcontributions. The amount of pension is determined by a formula based on the number ofyears worked. The minimum an individual receives is Rs 675. There is provision for areduced pension for retirement before the age of 60, a pension for invalids for the durationof the illness, a survivor's pension, and old age grants. Currently 128,000 workers arereceiving pensions, and the annual amount paid out by EOBI in pensions or other benefits isabout Rs 1 billion.
A3.26 The only form of social security currently available to low-paid workers inPakistan is the EOBI. Targeting efficiency has been enhanced by limiting the coverage toworkers with wages below Rs 3,000 per month. The program coverage is low: the 1.2million registered workers make up only 20 percent of the total employees in urban areas.This is due partly to the preponderance of small establishments (employing fewer than tenpeople) in the country. It is also probably the result of large-scale evasion by employers(although theoretically a worker can prevent this by registering directly). This scheme canbe extended without its financial viability being affected significantly because of the rapidlyexpanding labor force and a large proportion of young workers.
A3.27 The pension scheme also has some negative impacts. First, because allcontributions are made by employers ad valorem, they add to the cost of hiring labor(although this may be reflected in a lower wage rate), they therefore have an anti-employment bias. In this sense, they go against the interests of the very group that they aredesigned to protect. Second, informal social security at the joint household level is widelyprevalent in Pakistan. Pension payments from EOBI may, therefore, at least partiallysubstitute for private transfers among members of a household (for example, a working sonsupporting a retired father).
Housing Finance by the Housing Building Finance Corporation
A3.28 Established in 1952 under an act of parliament, the Housing BuildingFinance Corporation (HBFC) now has 11 zonal offices and 58 district offices throughoutthe country. It provides financial assistance for house construction and purchase to lowerand middle income groups. The original subsidized credit provided by the SBP has beendiscontinued, and the sole source of funding for the program is the amount recovered frompast loans. This amounts to about Rs 2 billion annually. To be eligible for a HBFC loan, anapplicant should have a clear land title and be able to pay off the loan in regularinstallments. The average interest rate is 13 percent, with the interest rate rising with thesize of loan.
A3.29 Since January 1999, the maximum limit for a HBFC loan has been raised toRs 2 million. During 1997, HBFC disbursed Rs 1.3 billion to more than 9,000 borrowers.Fifty-five percent of the loans during the last five years were below Rs 100,000, 40 percentwere between Rs 100,000 and Rs 200,000, and the remaining 5 percent were above Rs200,000. Default rates are as high as 30 percent.

Annex 3 107
A3.30 All the symptoms of bad financial intermediation are present with HBFC.These include a distorted pattern of lending (bias toward large cities and for medium-sizedloans), high overhead costs, low rates of recovery, and the resulting inability to compete inthe capital market for funds. To become effective in improving housing conditions for thepoor, HBFC needs substantial revamping.
Micro-Credit Scheme of HBL-NRSP
A3.31 Registered in November 1991 as a non-profit public company under theCompanies Ordinance 1984, the National Rural Support Program (NRSP) operates in 13rural areas of Pakistan. It replicates the successful programs of Aga Khan Rural SupportProgram in the northern areas and rural micro-credit programs of Grameen Bank inBangladesh. The program aims to reduce poverty among small farmers and landlesslaborers through micro-credit rural financing with community participation. TheGovernment of Pakistan has provided a Rs 500 million grant to set up an endowment fundand, since July 1997, NRSP has obtained access to a credit line facility with Habib BankLimited (HBL).
A3.32 NRSP's partnership with Habib Bank is a breakthrough in the rural micro-credit financing history of Pakistan. Between July 1997 and November 1998, creditdisbursement increased from Rs 0.1 billion to almost Rs 1 billion, and the number ofborrowers rose from 23,000 to 52,000 in almost 4,000 community organizations. One-fourth of the expected loan is initially pledged by the borrower as collateral. Peer pressureand social reputation of the individual and the community organization are effectively usedas a collateral tool. Even though the annual rate of interest is 18 to 20 percent, the recoveryrate is high. This has been achieved by developing an effective credit disbursementprocedure.
A3.33 The credit disbursement procedure has eight well-defined steps. The firststep is the introduction of the credit program to rural communities and community-basedorganizations through field visits by social organizers of NRSP. This is followed byidentification of needs involving both a social and technical appraisal. The remaining stepsinvolve the determination of terms and conditions of the credit and subsequentdisbursement.
A3.34 The NRSP has clearly developed an effective procedure for disbursement ofcredit, which has enabled a high rate of recovery of loans from low-income communities atmarket interest rates. It has also promoted the overall process of community mobilizationand higher savings. An important question is whether the field staff, especially the socialorganizers, has the capacity to expand the program. With Habib Bank funding available,NRSP's operations can be broadened if staff capacity is increased and communitiesmobilized.


Bibliography
Auto/Oil Air Quality Improvement Research Program. 1997. Program Final Report. January.
Automotive Environment Analyst. December 1998. "Ultrafine PM Similar for Gasoline andDiesel," 47:5.
Baghurst, P. A., A.J. McMichael, N.R. Wigg, G.V. Vimpani, E.F. Robertson, R.J. Roberts, andS-L Tong. 1992. "Environmental exposure to lead and children's intelligence at the ageof seven years." New EngI. J. Med. 327(18):1279-84.
Bellinger, D. C., K.M. Stiles, and H.L. Needleman. 1992. "Low-level lead exposure, intelligenceand academic achievement: a long-term follow-up study." Pediatrics 90(6): 855-61.
Betts, W.E., S.A Fl0ysand, and F. Kvinge. 1992. "The Influence of Diesel Fuel Properties onParticulate Emissions in European Cars." SAE (Society of Automotive Engineers)Technical Papers Series 922190.
CONCAWE (Conservation of Clean Air and Water in Europe). February 1998. Study of theNumber, Size and Mass of Exhaust Particles Emitted from European Diesel andGasoline Vehicles under Steady-State and European Driving Cycle Conditions. Reportno. 98/51. Brussels.
HDIP and MPNR (Hydrocarbon Development Institute of Pakistan and the Ministry ofPetroleum and Natural Resources). January 2001. Pakistan Energy Yearbook 2000.Islamabad, Pakistan.
JICA (Japan International Cooperation Agency). 2000. Investigation of Air and Water Quality(Lahore, Rawalpindi, Islamabad). March. Hagler Bailly Pakistan for JICA.
Jehle, G.A. 1994. "Zakat and Inequality: Some Evidence from Pakistan." Review of Income andWealth 40(2): 205-206.
Maples, Robert E. 1993. Petroleum Refinery Process Economics. Tulsa, Okalahoma: PennWellBooks.
Pasha, Hafiz A., Jafarey Sumaira, and Hari Ram Lohano. April 2000. Evaluation of the SocialSafety Nets in Pakistan. Research Report No. 32. Karachi: Social Policy andDevelopment Centre.
Pocock, S. J., M. Smith, and P. Baghurst. 1994. "Environmental Lead and Children'sIntelligence: A Systematic Review of the Epidemiological Evidence." British MedicalJournal 309:1189-97.
Shirazi, Naseem Shah. 1996. "Targeting, Coverage and Contribution of Zakat to HouseholdsThe Case of Pakistan." Journal of Economic Cooperation Among Islamic Countries17:3-4: 165-186.
109

110 Pakistan Clean Fuels
Silbergeld, E. K. 1991. "Lead in Bone: Implications for Toxicology During Pregnancy andLactation." Environmental Health Perspectives 91:63-70.
World Bank. 1995. "Pakistan Poverty Assessment." Washington D.C.: Country OperationsDivision, Country Department 1, South Asia Region.
World Health Organization. 1995a. Lead and Health. Regional Office for Europe, Geneva
1995b. Environmental Health Criteria 165. Inorganic Lead. Geneva.
2000. Chapter 3: "Health-based Guidelines" in Guidelines for Air Quality. Geneva.
Zaman, A. 1996. Wheat Subsidy: An Economic Review to Determine Welfare and BudgetaryEffects. Karachi: Arshad Zaman Associates (Pvt.) Ltd.
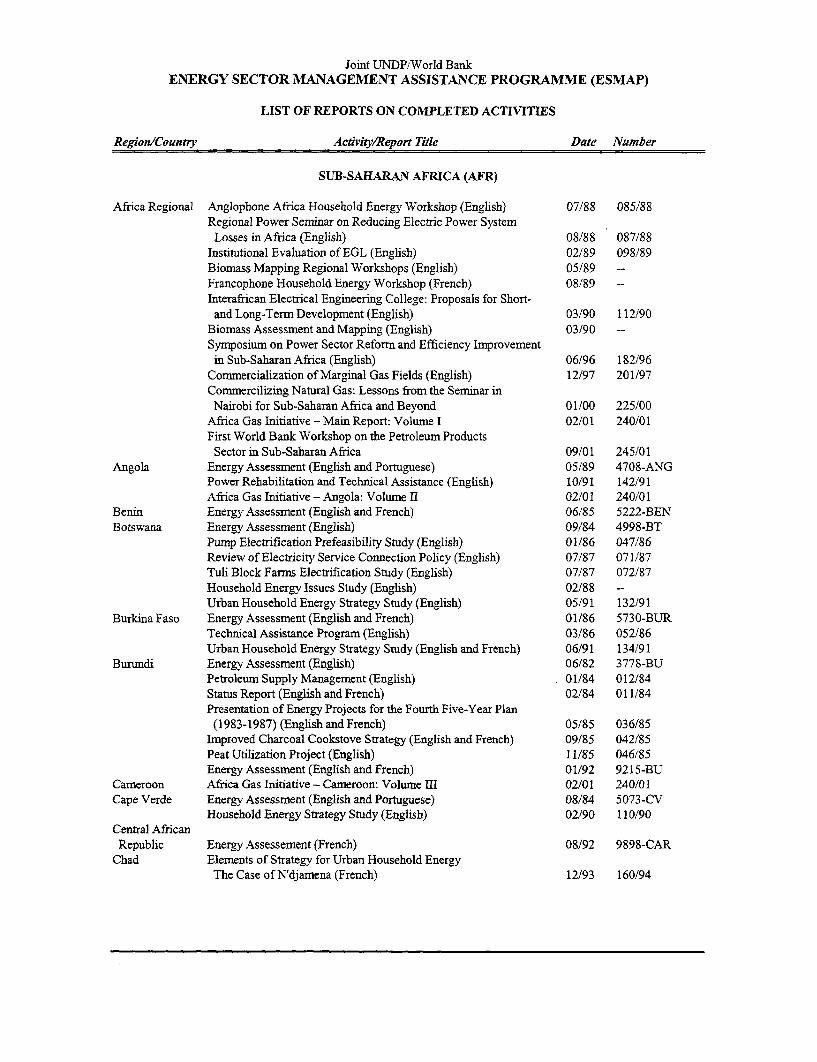
Joint UNDP/World BankENERGY SECTOR MANAGEMENT ASSISTANCE PROGRAMME (ESMAP)
LIST OF REPORTS ON COMPLETED ACTIVITIS
Region/Country Activity/Report Title Date Number
SUB-SAHARAN AFRICA (AFR)
Africa Regional Anglophone Africa Household Energy Workshop (English) 07,/88 085/88Regional Power Seminar on Reducing Electric Power System
Losses in Africa (English) 08/88 087/88Institutional Evaluation of EGL (English) 02/89 098/89Biomass Mapping Regional Workshops (English) 05/89 --Francophone Household Energy Workshop (French) 08/89 --
Interafrican Electrical Engineering College: Proposals for Short-and Long-Term Development (English) 03/90 112/90
Biomass Assessment and Mapping (English) 03/90 --Syrnposium on Power Sector Reform and Efficiency Improvement
in Sub-Saharan Africa (English) 06/96 182/96Commercialization of Marginal Gas Fields (English) 12/97 201/97Commercilizing Natural Gas: Lessons from the Seminar in
Nairobi for Sub-Saharan Africa and Beyond 01/00 225/00Africa Gas Initiative - Main Report: Volume I 02/01 240/01First World Bank Workshop on the Petroleum Products
Sector in Sub-Saharan Africa 09/01 245/01Angola Energy Assessment (English and Portuguese) 05/89 4708-ANG
Power Rehabilitation and Technical Assistance (English) 10/91 142/91Africa Gas Initiative - Angola: Volume II 02/01 240/01
Benin Energy Assessment (English and French) 06185 5222-BENBotswana Energy Assessment (English) 09/84 4998-BT
Pump Electrification Prefeasibility Study (English) 01/86 047/86Review of Electricity Service Connection Policy (English) 07/87 071/87Tuli Block Farms Electrification Study (English) 07/87 072/87Household Energy Issues Study (English) 02/88 --Urban Household Energy Strategy Study (English) 05/91 132/91
Burkina Faso Energy Assessment (English and French) 01/86 5730-BURTechnical Assistance Program (English) 03/86 052/86Urban Household Energy Strategy Study (English and French) 06/91 134/91
Burundi Energy Assessment (English) 06/82 3778-BUPetroleum Supply Management (English) 01/84 012/84Status Report (English and French) 02/84 011/84Presentation of Energy Projects for the Fourth Five-Year Plan
(1983-1987) (English and French) 05/85 036/85Improved Charcoal Cookstove Strategy (English and French) 09/85 042/85Peat Utilization Project (English) 11/85 046/85Energy Assessment (English and French) 01/92 9215-BU
Cameroon Africa Gas Initiative - Cameroon: Volume III 02/01 240/01Cape Verde Energy Assessment (English and Portuguese) 08/84 5073-CV
Household Energy Strategy Study (English) 02/90 110/90Central AfricanRepublic Energy Assessement (French) 08/92 9898-CAR
Chad Elements of Strategy for Urban Household EnergyThe Case of N'djamena (French) 12/93 160/94

Region/Country Activity/Report Title Date Number
Comoros Energy Assessment (English and French) 01/88 7104-COMIn Search of Better Ways to Develop Solar Markets:
The Case of Comoros 05/00 230/00Congo Energy Assessment (English) 01/88 6420-COB
Power Development Plan (English and French) 03/90 106/90Africa Gas Initiative - Congo: Volume IV 02/01 240/01
C6te d'Ivoire Energy Assessment (English and French) 04/85 5250-IVCImproved Biomass Utilization (English and French) 04/87 069/87
- Power System Efficiency Study (English) 12/87 -
Power Sector Efficiency Study (French) 02/92 140/91Project of Energy Efficiency in Buildings (English) 09/95 175/95Africa Gas Initiative - C6te d'Ivoire: Volume V 02/01 240/01
Ethiopia Energy Assessment (English) 07/84 4741-ETPower System Efficiency Study (English) 10/85 045/85Agricultural Residue Briquetting Pilot Project (English) 12/86 062/86Bagasse Study (English) 12/86 063/86Cooking Efficiency Project (English) 12/87 --Energy Assessment (English) 02/96 179/96
Gabon Energy Assessment (English) 07/88 6915-GAAfrica Gas Initiative - Gabon: Volume VI 02/01 240/01
The Gambia Energy Assessment (English) 11/83 4743-GMSolar Water Heating Retrofit Project (English) 02/85 030/85Solar Photovoltaic Applications (English) 03/85 032/85Petroleum Supply Management Assistance (English) 04/85 035/85
Ghana Energy Assessment (English) 11/86 6234-GHEnergy Rationalization in the Industrial Sector (English) 06/88 084/88Sawmill Residues Utilization Study (English) 11/88 074/87Industrial Energy Efficiency (English) 11/92 148/92
Guinea Energy Assessment (English) 11/86 6137-GUIHousehold Energy Strategy (English and French) 01/94 163/94
Guinea-Bissau Energy Assessment (English and Portuguese) 08/84 5083-GUBRecommnended Technical Assistance Projects (English &
Portuguese) 04/85 033/85Management Options for the Electric Power and Water Supply
Subsectors (English) 02/90 100/90Power and Water Institutional Restructuring (French) 04/91 118/91
Kenya Energy Assessment (English) 05/82 3800-KEPower System Efficiency Study (English) 03/84 014/84Status Report (English) 05/84 016/84Coal Conversion Action Plan (English) 02/87 --Solar Water Heating Study (English) 02/87 066/87Peri-Urban Woodfuel Development (English) 10/87 076/87Power Master Plan (English) 11/87 --
Power Loss Reduction Study (English) 09/96 186/96Implementation Manual: Financing Mechanisms for Solar
Electric Equipment 07/00 231/00Lesotho Energy Assessment (English) 01/84 4676-LSOLiberia Energy Assessment (English) 12/84 5279-LBR
Recommnended Technical Assistance Projects (English) 06/85 038/85Power System Efficiency Study (English) 12/87 081/87
Madagascar Energy Assessment (English) 01/87 5700-MAGPower System Efficiency Study (English and French) 12/87 075/87

-3-
Region/Country Activity/Report Title Date Number
Madagascar Environmental Impact of Woodfuels (French) 10/95 176/95Malawi Energy Assessment (English) 08/82 3903-MAL
Technical Assistance to Improve the Efficiency of FuelwoodUse in the Tobacco Industry (English) 11/83 009/83
Status Report (English) 01/84 013/84Mali Energy Assessment (English and French) 11/91 8423-MLI
Household Energy Strategy (English and French) 03/92 147/92Islarnic Republicof Mauritania Energy Assessment (English and French) 04/85 5224-MAU
Household Energy Strategy Study (English and French) 07/90 123/90Mauritius Energy Assessment (English) 12/81 3510-MAS
Status Report (English) 10/83 008/83Power System Efficiency Audit (English) 05/87 070/87Bagasse Power Potential (English) 10/87 077/87Energy Sector Review (English) 12/94 3643-MAS
Mozambique Energy Assessment (English) 01/87 6128-MOZHousehold Electricity Utilization Study (English) 03/90 113/90Electricity Tariffs Study (English) 06/96 181/96Samnple Survey of Low Voltage Electricity Customers 06/97 195/97
Namnibia Energy Assessment (English) 03/93 11320-NAMNiger Energy Assessment (French) 05/84 4642-NIR
Status Report (English and French) 02/86 051/86Improved Stoves Project (English and French) 12/87 080/87Household Energy Conservation and Substitution (English
and French) 01/88 082/88Nigeria Energy Assessment (English) 08/83 4440-UNI
Energy Assessment (English) 07/93 11672 -UNIRwanda Energy Assessment (English) 06/82 3779-RW
Status Report (English and French) 05/84 017/84Improved Charcoal Cookstove Strategy (English and French) 08/86 059/86Improved Charcoal Production Techniques (English and French) 02/87 065/87Energy Assessment (English and French) 07/91 8017-RWCommercialization of Inproved Charcoal Stoves and Carbonization
Techniques Mid-Term Progress Report (English and French) 12/91 141/91SADC SADC Regional Power Interconnection Study, Vols. I-IV (English) 12/93 -
SADCC SADCC Regional Sector: Regional Capacity-Building Programfor Energy Surveys and Policy Analysis (English) 11/91 --
Sao Tomeand Principe Energy Assessment (English) 10/85 5803-STP
Senegal Energy Assessment (English) 07/83 4182-SEStatus Report (English and French) 10/84 025/84Industrial Energy Conservation Study (English) 05/85 037/85Preparatory Assistance for Donor Meeting (English and French) 04/86 056/86Urban Household Energy Strategy (English) 02/89 096/89Industrial Energy Conservation Program (English) 05/94 165/94
Seychelles Energy Assessment (English) 01/84 4693-SEYElectric Power System Efficiency Study (English) 08/84 021/84
Sierra Leone Energy Assessment (English) 10/87 6597-SLSomalia Energy Assessment (English) 12/85 5796-SORepublic of
South Africa Options for the Structure and Regulation of NaturalGas Industry (English) 05/95 172/95

- 4 -
Region/Country Activity/Report Title Date Number
Sudan Management Assistance to the Ministry of Energy and Mining 05/83 003/83Energy Assessment (English) 07/83 451 1-SUPower System Efficiency Study (English) 06/84 018,'84Status Report (English) 11/84 026/84Wood Energy/Forestry Feasibility (English) 07/87 073/87
Swaziland Energy Assessment (English) 02/87 6262-SWHousehold Energy Strategy Study 10/97 198/97
Tanzania Energy Assessment (English) 11/84 4969-TAPeri-Urban Woodfuels Feasibility Study (English) 08/88 086/88Tobacco Curing Efficiency Study (English) 05/89 102/89Remote Sensing and Mapping of Woodlands (English) 06/90 --Industrial Energy Efficiency Technical Assistance (English) 08/90 122/90Power Loss Reduction Volume 1: Transmnission and Distribution
SystemTechnical Loss Reduction and Network Development(English) 06/98 204A/98
Power Loss Reduction Volume 2: Reduction of Non-TechnicalLosses (English) 06/98 204B/98
Togo Energy Assessment (English) 06/85 5221-TOWood Recovery in the Nangbeto Lake (English and French) 04/86 055/86Power Efficiency Imnprovement (English and French) 12/87 078/87
Uganda Energy Assessment (English) 07/83 4453-UGStatus Report (English) 08/84 020/84Institutional Review of the Energy Sector (English) 01/85 029/85Energy Efficiency in Tobacco Curing Industry (English) 02/86 049/86Fuelwood/Forestry Feasibility Study (English) 03/86 053/86Power System Efficiency Study (English) 12/88 092/88Energy Efficiency Improvement in the Brick and
Tile Industry (English) 02/89 097/89Tobacco Curing Pilot Project (English) 03/89 UNDP Terminal
ReportEnergy Assessment (English) 12/96 193/96Rural Electrification Strategy Study 09/99 221/99
Zaire Energy Assessment (English) 05/86 5837-ZRZambia Energy Assessment (English) 01/83 4110-ZA
Status Report (English) 08/85 039/85Energy Sector Institutional Review (English) 11/86 060/86Power Subsector Efficiency Study (English) 02/89 093/88Eneigy Strategy Study (English) 02/89 094/88Urban Household Energy Strategy Study (English) 08/90 121/90
Zirbabwe Energy Assessment (English) 06/82 3765-ZIMPower System Efficiency Study (English) 06/83 005/83Status Report (English) 08/84 019/84Power Sector Management Assistance Project (English) 04/85 034/85Power Sector Management Institution Building (English) 09/89Petroleum Management Assistance (English) 12/89 109/89Charcoal Utilization Prefeasibility Study (English) 06/90 119/90Integrated Energy Strategy Evaluation (English) 01192 8768-ZIMEnergy Efficiency Technical Assistance Project:
Strategic Framework for a National Energy EfficiencyImprovement Program (English) 04/94 --
Capacity Building for the National Energy EfficiencyImprovement Programme (NEEIP) (English) 12/94 --

Region/Country Activit/RWeport Title Date Number
Zimbabwe Rural Electrification Study 03/00 228/00
EAST ASIA AND PACIFIC (EAP)
Asia Regional Pacific Household and Rural Energy Seminar (English) 11/90 --
China County-Level Rural Energy Assessments (English) 05/89 101/89Fuelwood Forestry Preinvestment Study (English) 12/89 105/89Strategic Options for Power Sector Reform in China (English) 07/93 156/93Energy Efficiency and Pollution Control in Township andVillage Enterprises (TVE) Industry (English) 11/94 168/94
Energy for Rural Development in China: An Assessment Basedon a Joint Chinese/ESMAP Study in Six Counties (English) 06/96 183196
Improving the Technical Efficiency of Decentralized PowerCompanies 09/99 222/999
Fiji Energy Assessment (English) 06/83 4462-FIJIndonesia Energy Assessment (English) 11/81 3543-IND
Status Report (English) 09/84 022/84Power Generation Efficiency Study (English) 02/86 050/86Energy Efficiency in the Brick, Tile andLime Industries (English) 04/87 067/87
Diesel Generating Plant Efficiency Study (English) 12/88 095/88Urban Household Energy Strategy Study (English) 02/90 107/90Biomass Gasifier Preinvestment Study Vols. I & II (English) 12/90 124/90Prospects for Biomass Power Generation with Emphasis on
Palm Oil, Sugar, Rubberwood and Plywood Residues (English) 11/94 167/94Lao PDR Urban Electricity Demand Assessment Study (English) 03/93 154/93
Institutional Development for Off-Grid Electrification 06/99 215/99Malaysia Sabah Power System Efficiency Study (English) 03/87 068/87
Gas Utilization Study (English) 09/91 9645-MAMyanmar Energy Assessment (English) 06/85 5416-BAPapua NewGuinea Energy Assessment (English) 06/82 3882-PNG
Status Report (English) 07/83 006/83Energy Strategy Paper (English) -- --Institutional Review in the Energy Sector (English) 10/84 023/84Power Tariff Study (English) 10/84 024/84
Philippines Commercial Potential for Power Production fromAgricultural Residues (English) 12/93 157/93
Energy Conservation Study (English) 08/94 --
Strengthening the Non-Conventional and Rural EnergyDevelopment Program in the Philippines:A Policy Framework and Action Plan 08/01 243/01
Solomon Islands Energy Assessment (English) 06/83 4404-SOLEnergy Assessment (English) 01/92 979-SOL
South Pacific Petroleum Transport in the South Pacific (English) 05/86 --Thailand Energy Assessment (English) 09/85 5793-TH
Rural Energy Issues and Options (English) 09/85 044/85Accelerated Dissemination of Improved Stoves and
Charcoal Kilns (English) 09/87 079/87Northeast Region Village Forestry and Woodfuels
Preinvestment Study (English) 02/88 083/88
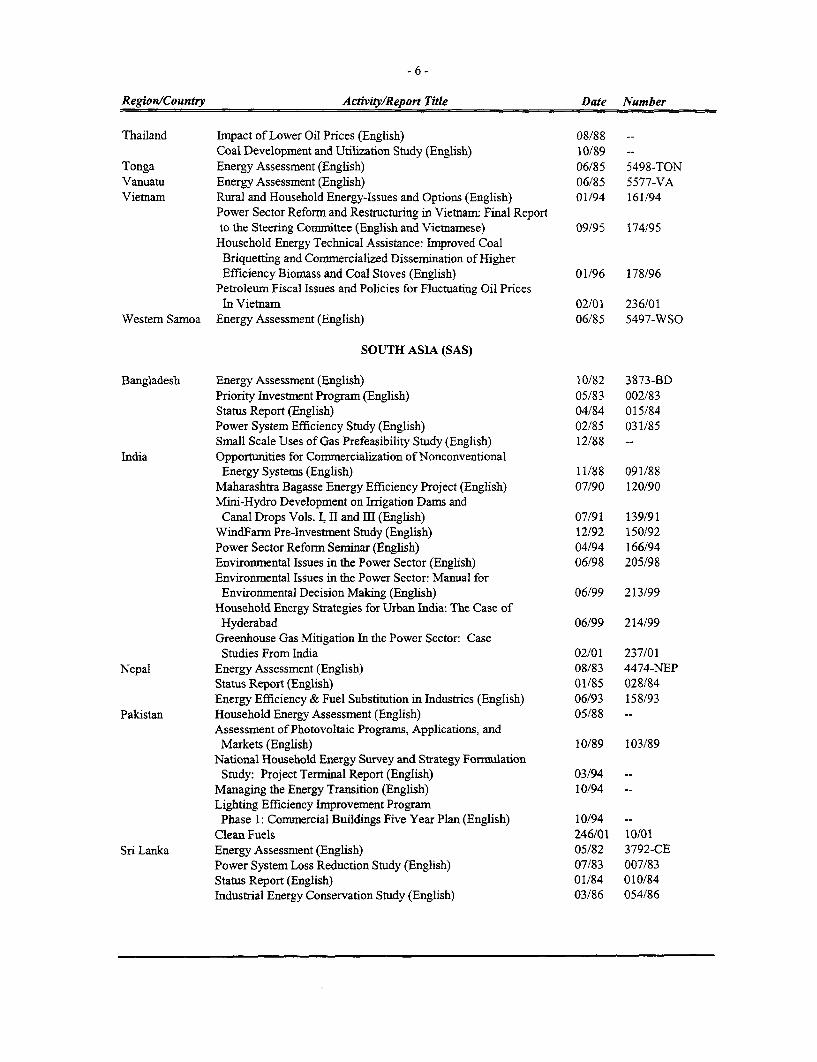
- 6 -
Region/Country Activity/Report Title Date Number
Thailand Irnpact of Lower Oil Prices (English) 08/88 --
Coal Development and Utilization Study (English) 10/89Tonga Energy Assessment (English) 06/85 5498-TONVanuatu Energy Assessment (English) 06/85 5577-VAVietnam Rural and Household Energy-Issues and Options (English) 01/94 161/94
Power Sector Reform and Restructuring in Vietnam: Final Reportto the Steering Committee (English and Vietnamese) 09/95 174/95Household Energy Technical Assistance: Improved CoalBriquetting and Commercialized Dissemination of HigherEfficiency Biomass and Coal Stoves (English) 01/96 178/96
Petroleum Fiscal Issues and Policies for Fluctuating Oil PricesIn Vietnam 02/01 236/01
Western Samoa Energy Assessment (English) 06/85 5497-WSO
SOUTH ASIA (SAS)
Bangladesh Energy Assessment (English) 10/82 3873-BDPriority Investment Program (English) 05/83 002/83Status Report (English) 04/84 015/84Power System Efficiency Study (English) 02/85 031/85Small Scale Uses of Gas Prefeasibility Study (English) 12/88 --
India Opportunities for Commercialization of NonconventionalEnergy Systems (English) 11/88 091/88
Maharashtra Bagasse Energy Efficiency Project (English) 07/90 120/90Mini-Hydro Development on Irrigation Dams and
Canal Drops Vols. I, II and III (English) 07/91 139/91WindFarm Pre-Investment Study (English) 12/92 150/92Power Sector Reform Seminar (English) 04/94 166/94Environmental Issues in the Power Sector (English) 06/98 205/98Environmental Issues in the Power Sector: Manual for
Enviromnental Decision Making (English) 06/99 213/99Household Energy Strategies for Urban India: The Case ofHyderabad 06/99 214/99
Greenhouse Gas Mitigation In the Power Sector: CaseStudies From India 02/01 237/01
Nepal Energy Assessment (English) 08/83 4474-NEPStatus Report (English) 01/85 028/84Energy Efficiency & Fuel Substitution in Industries (English) 06/93 158/93
Pakistan Household Energy Assessment (English) 05/88 --Assessment of Photovoltaic Programs, Applications, andMarkets (English) 10/89 103/89
National Household Energy Survey and Strategy FormulationStudy: Project Terminal Report (English) 03/94 --
Managing the Energy Transition (English) 10/94Lighting Efficiency Improvement ProgramPhase 1: Commercial Buildings Five Year Plan (English) 10/94 --
Clean Fuels 246/01 10/01Sri Lanka Energy Assessment (English) 05/82 3792-CE
Power System Loss Reduction Study (English) 07/83 007/83Status Report (English) 01/84 010/84Industrial Energy Conservation Study (English) 03/86 054/86

- 7 -
Region/Country Activity/Report Title Date Number
EUROPE AND CENTRAL ASIA (ECA)
Bulgaria Natural Gas Policies and Issues (English) 10/96 188/96Central Asia andThe Caucasus Cleaner Transport Fuels in Central Asia and the Caucasus 08/01 242/01Central andEastern Europe Power Sector Reform in Selected Countries 07/97 196/97
Increasing the Efficiency of Heating Systems in Central andEastern Europe and the Former Soviet Union 08/00 234/00
The Future of Natural Gas in Eastern Europe (English) 08/92 149/92Kazakhstan Natural Gas Investment Study, Volumes 1, 2 & 3 12/97 199/97Kazakhstan &Kyrgyzstan Opportunities for Renewable Energy Development 11/97 16855-KAZPoland Energy Sector Restructuring Program Vols. I-V (English) 01/93 153/93
Natural Gas Upstream Policy (English and Polish) 08/98 206/98Energy Sector Restructuring Program: Establishing the EnergyRegulation Authority 10/98 208/98
Portugal Energy Assessment (English) 04/84 4824-PORomania Natural Gas Development Strategy (English) 12/96 192/96Slovenia Workshop on Private Participation in the Power Sector (English) 02/99 211/99Turkey Energy Assessment (English) 03/83 3877-TU
Energy and the Environment: Issues and Options Paper 04/00 229/00
MIDDLE EAST AND NORTH AFRICA (MNA)
Arab Republicof Egypt Energy Assessment (English) 10/96 189/96
Energy Assessment (English and French) 03/84 41 57-MORStatus Report (English and French) 01/86 048/86
Morocco Energy Sector Institutional Development Study (English and French) 07/95 173/95Natural Gas Pricing Study (French) 10/98 209/98Gas Development Plan Phase II (French) 02/99 210/99
Syria Energy Assessment (English) 05/86 5822-SYRElectric Power Efficiency Study (English) 09/88 089/88Energy Efficiency Improvement in the Cement Sector (English) 04/89 099/89Energy Efficiency Improvement in the Fertilizer Sector (English) 06/90 115/90
Tunisia Fuel Substitution (English and French) 03/90 --Power Efficiency Study (English and French) 02/92 136/91Energy Management Strategy in the Residential and
Tertiary Sectors (English) 04/92 146/92Renewable Energy Strategy Study, Volume I (French) 11/96 190A/96Renewable Energy Strategy Study, Volume II (French) 11/96 190B/96
Yemen Energy Assessment (English) 12/84 4892-YAREnergy Investment Priorities (English) 02/87 6376-YARHousehold Energy Strategy Study Phase I (English) 03/91 126/91
LATIN AMERICA AND THE CARIBBEAN (LAC)
LAC Regional Regional Seminar on Electric Power System Loss Reduction

-8 -
Region/Country Activiy/lReport Title Date Number
LAC Regional in the Caribbean (English) 07/89 --Elimination of Lead in Gasoline in Latin America andthe Caribbean (English and Spanish) 04/97 194/97
Elimnination of Lead in Gasoline in Latin America andthe Caribbean - Status Report (English and Spanish) 12/97 200/97
Harmonization of Fuels Specifications in Latin America andthe Caribbean (English and Spanish) 06/98 203/98
Bolivia Energy Assessment (English) 04/83 4213-BONational Energy Plan (English) 12/87 --La Paz Private Power Technical Assistance (English) 11/90 111/90Prefeasibility Evaluation Rural Electrification and DemandAssessment (English and Spanish) 04/91 129/91
National Energy Plan (Spanish) 08/91 131/91Private Power Generation and Transrmission (English) 01/92 137/91Natural Gas Distribution: Economnics and Regulation (English) 03/92 125/92Natural Gas Sector Policies and Issues (English and Spanish) 12/93 164/93Household Rural Energy Strategy (English and Spanish) 01/94 162/94Preparation of Capitalization of the Hydrocarbon Sector 12/96 191/96Introducing Comnpetition into the Electricity Supply Industry inDeveloping Countries: Lessons from Bolivia 08/00 233/00
Final Report on Operational Activities Rural Energy and EnergyEfficiency 08/00 235/00
Oil Industry Training for Indigenous People: The BolivianExperience (English and Spanish) 09/01 244/01
Brazil Energy Efficiency & Conservation: Strategic Partnership forEnergy Efficiency in Brazil (English) 01/95 170/95
Hydro and Thermnal Power Sector Study 09/97 197/97Rural Electrification with Renewable Energy Systems in the
Northeast: A Preinvestment Study 07/00 232/00Chile Energy Sector Review (English) 08/88 7129-CHColombia Energy Strategy Paper (English) 12/86 --
Power Sector Restructuring (English) 11/94 169/94Energy Efficiency Report for the Commercial
and Public Sector (English) 06/96 184/96Costa Rica Energy Assessment (English and Spanish) 01/84 4655-CR
Recommended Technical Assistance Projects (English) 11/84 027/84Forest Residues Utilization Study (English and Spanish) 02/90 108/90
DonunicanRepublic Energy Assessment (English) 05/91 8234-DO
Ecuador Energy Assessment (Spanish) 12/85 5865-ECEnergy Strategy Phase I (Spanish) 07/88 --
Energy Strategy (English) 04/91 --
Private Minihydropower Development Study (English) 11/92 --
Energy Pricing Subsidies and Interfuel Substitution (English) 08/94 11798-ECEnergy Pricing, Poverty and Social Mitigation (English) 08/94 12831-EC
Guatemala Issues and Options in the Energy Sector (English) 09/93 12160-GUHaiti Energy Assessment (English and French) 06/82 3672-HA
Status Report (English and French) 08/85 041/85Household Energy Strategy (English and French) 12/91 143/91
Honduras Energy Assessment (English) 08/87 6476-HOPetroleum Supply Management (English) 03/91 128191
Jamaica Energy Assessment (English) 04/85 5466-JM

-9-
Region/Country Activity/Report Title Date Number
Jamaica Petroleum Procurement, Refining, andDistribution Study (English) 11/86 061/86
Energy Efficiency Building Code Phase I (English) 03/88 -
Energy Efficiency Standards and Labels Phase I (English) 03/88 --
Management Information System Phase I (English) 03/88 --
Charcoal Production Project (English) 09/88 090/88FIDCO Sawmill Residues Utilization Study (English) 09/88 088/88Energy Sector Strategy and Investment Planning Study (English) 07/92 135/92
Mexico Improved Charcoal Production Within Forest Management forthe State of Veracruz (English and Spanish) 08/91 138/91
Energy Efficiency Management Technical Assistance to theComision Nacional para el Ahorro de Energia (CONAE) (English) 04/96 180/96
Energy Environment Review 05/01 241/01Panama Power System Efficiency Study (English) 06/83 004/83Paraguay Energy Assessment (English) 10/84 5145-PA
Recommended Technical Assistance Projects (English) 09/85 --
Status Report (English and Spanish) 09/85 043/85Peru Energy Assessment (English) 01/84 4677-PE
Status Report (English) 08/85 040/85Proposal for a Stove Dissemination Program in
the Sierra (English and Spanish) 02/87 064/87Energy Strategy (English and Spanish) 12/90 -
Study of Energy Taxation and Liberalizationof the Hydrocarbons Sector (English and Spanish) 120/93 159/93
Reform and Privatization in the HydrocarbonSector (English and Spanish) 07/99 216/99
Rural Electrification 02/01 238/01Saint Lucia Energy Assessment (English) 09/84 5111-SLUSt. Vincent andthe Grenadines Energy Assessment (English) 09/84 5103-STV
Sub Andean Environmental and Social Regulation of Oil and GasOperations in Sensitive Areas of the Sub-Andean Basin(English and Spanish) 07/99 217/99
Trinidad andTobago Energy Assessment (English) 12/85 5930-TR
GLOBAL
Energy End Use Efficiency: Research and Strategy (English) 11/89 --
Women and Energy--A Resource GuideThe International Network: Policies and Experience (English) 04/90 --
Guidelines for Utility Customer Management andMetering (English and Spanish) 07/91 --
Assessment of Personal Computer Models for EnergyPlanning in Developing Countries (English) 10/91 --
Long-Term Gas Contracts Principles and Applications (English) 02/93 152/93Comparative Behavior of Firms Under Public and Private
Ownership (English) 05/93 155/93Development of Regional Electric Power Networks (English) 10/94 --Roundtable on Energy Efficiency (English) 02/95 171/95

Region/Country Activity/Report Title Date Number
Global Assessing Pollution Abatement Policies with a Case Studyof Ankara (English) 11/95 177/95
A Synopsis of the Third Annual Roundtable on Independent PowerProjects: Rhetoric and Reality (English) 08/96 187/96
Rural Energy and Development Roundtable (English) 05/98 202/98A Synopsis of the Second Roundtable on Energy Efficiency:
Institutional and Financial Delivery Mechanisms (English) 09/98 207/98The Effect of a Shadow Price on Carbon Emission in the
Energy Portfolio of the World Bank: A CarbonBackcasting Exercise (English) 02/99 212/99
Increasing the Efficiency of Gas Distribution Phase 1:Case Studies and Thematic Data Sheets 07/99 218/99
Global Energy Sector Reform in Developing Countries:A Scorecard 07/99 219/99
Global Lighting Services for the Poor Phase II: TextMarketing of Small "Solar" Batteries for RuralElectrification Purposes 08/99 220/99
A Review of the Renewable Energy Activities of the UNDP/World Bank Energy Sector Management AssistanceProgranmme 1993 to 1998 11/99 223/99
Energy, Transportation and Environment: Policy Options forEnvironmental Improvement 12/99 224/99
Privatization, Competition and Regulation in the British ElectricityIndustry, With Implications for Developing Countries 02/00 226/00
Reducing the Cost of Grid Extension for Rural Electrification 02/00 227/00Undeveloped Oil and Gas Fields in the Industrializing World 02/01 239/01
10/24/01


LESM AD1sEhl ,ILI 'L1
The World Bank
1818 H Street, NW
Washington, DC 20433 USA
Tel.: 1.202.458.2321 Fax.: 1.202.522.3018
Internet: www.esmap.org
Email: [email protected]
4~~~~~~~~~~~~~~~~~~~~~~~~~~~~~
A joint UNDP/World Bank Programme