Embed Size (px)
Citation preview

Policy, Research, and External Affairs 6 S c' 8)
WORKING PAPERS
International Trade
International Economics DepartmentThe World Bank
August 1990WPS 483
An Evaluationof the Main Elements
in the Leading Proposalsto Phase Out
the Multi-FibreArrangement
Refik Erzanand
Paula Holmes
Two approaches took the lead in the negotiations to dismantlethe Multi-Fibre Arrangement kMFA): (1) a phaseout within theframework of the MFA, proposed by developing countries, theEC, Japan, and the Nordic countries, and (2) a new transitionalstructure relying on global quotas with country allotments forcurrentquota holders, suggested by theUnited States andCanada. COVI
The Policy, Research, and Extemal Affairs Complex disyibutes PRE Working Papers to disscminate the findings of woik in progress andto encoage the exchange of ideas among Bank staff aM all others interested in development issues. Thes papers carry the names ofthe authors. reflect ony their views, and should be used and cited accordingly. The findings, interpretations, and canclusions ae theauthors own. They should not be attributed to the World Bank, its Board of Directors, its mnagemnent, or any of its member countries.
Pub
lic D
iscl
osur
e A
utho
rized
Pub
lic D
iscl
osur
e A
utho
rized
Pub
lic D
iscl
osur
e A
utho
rized
Pub
lic D
iscl
osur
e A
utho
rized
Pub
lic D
iscl
osur
e A
utho
rized
Pub
lic D
iscl
osur
e A
utho
rized
Pub
lic D
iscl
osur
e A
utho
rized
Pub
lic D
iscl
osur
e A
utho
rized

Policy, Research, and External Affclra
International Trade
WPS 483
This paper- a product of the International Trade Division, Intemnational Economics Department- is partof a larger effort in PRE to provide technical support to the developing countries in the Uruguay Round ofMultilateral Trade Negotiations under the auspices of the GATT and to contribute to the analysis ofsubstantial issues therein that pertain to the broad development objectives of the World Bank. Copies ofthis paper are available free from the World Bank, 1818 H Street NW, Washington, DC 20433. Pleasecontact Grace Ilogon, room S8-038, extension 33732 (46 pages, including tables).
Under both scenarios, accelerated quota growth degree of processing), or some criterion pertain-is the main device for phaseout. Country quotas, ing to the historical record, such as quota use.in the first approach, and global quotas in thesecond, will have to expand in such a way to The historical record reveals that growth inavoid a "shock" when they are abolished at the highly utilized (that is, filled and binding) quotasend of the phaseout. was significantly lower compared with unfilled
quotas. Phaseout scenarios based on quotaTo negotiate a quota-growth scenario- growth may have to take into consideration this
whether this be in the framework of the MFA or distinction to achieve an effective relaxation. Inthrough global quotas - the parties need points this context, scrapping unfilled quotas in stages,of departure, such as base-year quota levels or depending on their use record, would hasten thequota growth rates. The guideline in the MFA dismantling of the MFA by allowing the concen-was a 6 percent annual quota growth. Develop- tration of efforts to deal with binding quotas.ing countries consider this a concession obtainedfrom industrial markets and request it as the An MFA-based phaseout is appealing tominimum base-year quota growth rate. many developing countries because, in principle,
the "acquired rights" of the exporters can beIn fact, there were large variations in quota preserved. Not for long, however. When
growth across products and suppliers, as well as substantial quota expansions take place, as theacross markets, and on the whole quotas ex- quotas on efficient suppliers become redundant,panded at a significantly lower rate. For the quota holdings will be worthless. Interestinglyphaseout, the negotiating parties may therefore enough, an accelerated quota growth not differ-consider allowing some differentiation in quota entiated across suppliers, as suggested by thegrowth rates, particularly across product catego- developing countries, would do exactly that.ries.
There is one important virtue in a phaseoutThe second most important element in the based on the current structure of the MFA. Not
phaseout proposals - beside expanding quotas only are the mechanisms in place familiar to theand abolishing them at the end of the phaseout negotiating parties, but so are the magnitudes ofperiod - is scrapping them along the way most of the parameters: current quota levels,according to some predetermined criteria and quota growth rates over the last few years, andscheme. In the proposals, this is defined in terms their vse ratios. If this approach is adopted,of country characteristics (such as new entrants however, the parties have to make a concertedand least developed countries), specific products, effort to keep in mind that this is not an exten-product characteristics (such as type of fibers or sion of the MFA, but its abolition.
The PRE Working Paper Series dissenPinates the fidings of work under way in the Bank's Policy, Reserch, and ExtemalAffairs Complex .An objective of the series is toget theserfindings out quickly, even if presentations are lessdthan fully polished.The rmdings, interpretations, and conclusions in these papers do not necessarily represe-nt official Bank policy.
Produced by the PRE Dissemination Center

TABLE OF CONTENTS
Page
I. INTRODUCTION 1
II. PHASEOUT PROPOSALS TABLED 6
- Industrial Country Proposals 6- Developing Country Proposals 11
III. HISTORICAL QUOTA GROWTH RATES 16
- The European Commun'ty 16
- The United States 18- A Common Denominator? 19
IV. A PHASEOUT WITHIN THE FRAMEWORK OF THE MFA 23
- An Accelerated Quota Growth 24- Stage-wise Scrapping of Quotas 29- Quota Utilizatiot, Rates and Quota Growth 29- Stage-wise Scrapping of Underutilized Quotas 30- Stage-wise Quota Scrapping Ba3ed on Other Criteria 32
V. A PHASEOUT BASED ON GLOBAL QUOTAS 35
VI. CONCLUSIONS 43
REFERENCES 46
AN EVALUATION OF THE MAIN ELEMENTS IN THE LEADINGPROPOSALS TO PHASE OUT THE MULTI-FIBRE ARRANGEMENT
Refik Erzan and Paula HolmesThe World Bank**
I. INTRODUCTION
The Multi-Fibre Arrangement (MFA) is a framework of "voluntary export
restraints" regulating textile and clothing exports of most developing countries
entering nearly all major industrial markets.' The main instruments of the MFA
are bilaterally negotiated quotas in narrowly defined product categories.
Although the first MFA was signed in 1974, its origins go back to 1937, when
the US imposed restrictions on Japanese textiles under the guise of a
"gentlemen's agreement". Ir- the 1960s, similar but more encompassing arrangements
on cotton textiles were concluded which were extended to include the major
developing country suppliers.
The 1974 MFA was consequently extended three times, and currently
covers products made of wool, silk, vegetable fibers and man-made fibers, as well
as cotton (see, e.g., Goto's (1989) survey). More than half of all textile
fibers, textiles and clothing imported from developing countries by industrial
nations are subject to MFA quotas (see Erzan, Goto and Holmes (1990)). The MFA
** The views expressed in this note are those of the authors and do notnecessarily reflect the views of the World Bank. In particular, the argumentsand examples presented in the paper have no prejudice whatsoever as to theposition of any country or territory or any grouping of such, or any otherinstitution.
The authors gratefully acknowledge valuable comments by Bela Balassa,Don Keesing, Kala Krishna and Paul Meo on an earlier draft. The authors aresolely responsible for the remaining errors and imperfections.
1 See Raffaelli (1990) for a complete list of developed and developingcountry signatories of the MFA, and bilateral restraint agreements concludedaccordingly.

2
is one of the most comprehensive and discriminatory deformations of the
international trading s"stem: it discriminates against developing countries' most
important manufactures in a selective manner, and it prescribes managed trade.
While the MFA contradicts both the letter and the spirit of the GATT (General
Agreement on Tariffs and Trade), the latter has until now endorsed this
derogation.
The current MFA (MFA IV) is due to expire on July 31, 1991, seven
months after the scheduled conclusion for the Uruguay Round of Multilateral
Trade Negotiations under the auspices of the GATT. One of the factors which
convinced the developing countries to take an active part in this round of
negotiations, and which enabled the inclusion of new areas such as services in
the negotiating agenda, was an agreement on finding ways to dismantle the MFA.
The Punta del Este Declaration of September 1986 which formally launched the
Uruguay Round stipulated that "[N]egotiations in the area of textiles and
clothing shall aim to formulate modalities that would permit the eventual
integration of this sector into GATT on the basis of strengthened GATT rules and
disciplines, thereby also contributing to the objective of further liberalization
of trade.'
In earlv 1989, the negotiations regarding modalities for integrating
textiles and clothing into the GATT started. It was agreed in April that the
MFA restrictions, and its rules and provisions which are inconsistent with the
GATT should be phased out beginning in 1991, with the conclusion of the Round.
Following a transitionary period, trade in textiles and clothing would be

3
integrated into the GATT proper.2 The Contracting Parties were asked to table
their proposals to achieve this result, and since then a number of proposals have
been circulated for discussion and eventually for negotiation. While we shall
summarize these proposals, a conceptual typology is useful to discuss them.
Following Wolf (1990), various approaches in eliminating the MFA can
be grouped into three broad categories: "i) liberalization within the framework
of the MFA, ii) an immediate fall-back onto a revised GATT; and iii) hybrid
schemes, such as tariff quotas and auctioned quotas, which modify the KFe', while
still maintaining features of it" (p. 225). The proposals tabled by the
developing countries, as well as the EC, the Nordic countries and Japan, fall
largely into the first category, i.e., a phaseout within the framework of the
MFA. A pure case is Sweden, which ai- junced that it would terminate all its
bilateral quotas when the current MFA expires in July 1991. The US and Canadian
proposals, on the other hand, depict a new transitional structure mainly relying
on global quotas. Although the numerous proposals contain many other elements
concerning the complex provisions of the MFA, there is an increasing polarization
around the MFA-based phaseout versus the global quota-based transitional
structures. The conciliatory Swiss suggestion that each country can be allowed
to cdhoose its own way apparently has not reduced this polarization in the
negotiations.
2 The GATT-consistent instruments are tariffs with bound rates. Temporarymeasures are allowed only in exceptional and well-defined situations, and aresubject to strict procedures.

4
A *'orough evaluation of alternative approaches to returning textiles
and clothing to normal GATT trading rules is found in articles by Bagchi,
Raffaelli, Sampson and Takacs, ana Wolf in a recent World Bank publication
entitled Textiles Trade and the DeveloRing Countries: Eliminating the MFA in
the 1990s (Hamilton, ed., (1990)). The analyses in the volume cover almost all
important conceptual aspects of the current phaseout proposals despite the fact
that they were tabled at about the time of thei book's publication.3 The study
concluded that "irreversibility, simplicity, flexibility and some degree of
continuity is the formula for abolishing the MFA".
Besides giving a very brief account of recent phaseout proposals,
the purpose of this paper is to investigate the main instruments and suggested
parameters of the two leading approaches by exploring their implementation with
actual data, with all the detail and practical problems that are involved. Under
both s,cenarios, whether the HFA till be phased out within its cvrrent framework
or there will be a new transitional structure with global quotas - - quotas would
remain to be the central instrument. In the first case, country quotas, in the
other case, global quotas will have to expand in such a way to avoid a "shock"
when they are abolished at the end of the phaseout. According to the outstanding
proposal on global quotas, current quota holders will have allotments during the
phaseout period. Depending on the choice of base year quota levels, growth
rates, etc., there will be losers and gainers in terms of these transitional
quota allotments. By applying the proposals to actual data, this paper focuses
3 This is not a complete coincidence; the volume is the result of aworkshop in June 1989 which brought together researchers, textile experts andnegotiators.

5
on their modi operandi, raising some critical issues that must be addressed
during the course of the negotiations.
The paper is organized in the following manner. Section II gives
a brief account of the phaseout pruposals tabled by developed and developing
countries. In Section III, the historical MFA quota growth in the EC and the
US is analyzed. Past quota growth is a key input for an agreement on any
phaseout scenario based on transitionary quotas. Section IV depicts a phaseout
within the framework of the MFA which relies on accelerated quota growth based
on the historical record. Also considered is a stage-wise scrapping of
underutilized quotas which would hasten the elimination of the restrictions.
Section V deals with a phaseouC based on global quotas along the lines of the
US proposal. We investigated the immediate consequences of this proposed shift
by applying it to the US market. Finally, Section VI underlines some of the
critical issues the negotiators might have to address in their future
consideration of the two leading proposals. We distit.guish the differences
between the way MFA-based versus global quota-based phaseouts .-ld affect trade
during the transition period. As important in determining the nature of the
regime, however, are the parameters that would have to be agreed upon.

6
II. PHASEOUT PROPOSALS TABLED
The main elements of the proposals to phase out the MFA which were
submitted to the Negotiating Group on Textiles and Clothing are summarized in
this Section. Some of the earlier statements are omitted, and amendments to
outstanding proposals are merged with the initial proposals. We ordered the
presentation in the following manner: First we took up industrial country
proposals, then those tabled by the developing countries; within each group we
followed the chronological order of the submissions.
Industrial Country ProRosals
In July 1989, the ZQ proposed that from August 1. 1991, existing MFA
restrictions should be progressively and gradually eliminated in stages,
contingent on strengthened GATT safeguard rules. However, it has been insistent
that the phaseout should include a transitional safeguard mechanism against cases
of market disruption which would allow emergency actions and bilaterally agreed
selective quotas.4 Accordingly, during an injury investigation, if a preliminary
determination were made that a large increase in imports from a specific country
was causing serious injury to domestic producers, consultations would be held
within ten working days to reach bilateral agreement on the level of that
country's exports to the EC. If agreement is not reached, the imr-.rter would
be able to unilaterally impose a temporary quota on imports from that country.
4 "Selectivity" or discrimination in safeguards is a long standing requestof the EC, not only in the context of the MFA. Wolf (1990) warns that 'thereis a danger that the price of liberalizing the MFA would be acceptance of someo' its basic features within the GATT itself".

7
If injury were determined at the conclusion of the investigation, the two
parties would enter into consultations, but the importer would be able to apply
safeguard measures in the meantime. The resulting measures would be temporary,
and remain in place for a certain number (as yet undetermined) of months. Least
developed countries would be exempt from the transitional safeguard measures.
In June 1990, the EC submitted a communication further clarifying
its position. The phaseout would take place in stages within the framework of
the MFA. At each stage, a certain percent (to be yet decided) of the total
volume of existing quotas would be abolished. The participants could choose to
phase out quotas by type of fiber, type of product, by country, by
'liberalization of certain types of trade," or a combination of these methods.
Remaining quotas would be subject to escalating growth rates. Regarding
transitional safeguards, the EC proposed that they should be based on a
multilaterally agreed test for real risk or actual market disruption. The EC
has not yet taken a position on the duration of the phaseout.
Finland: on behalf of Nordic countries, in December 1989, proposed
using the current MFA regime and the axisting quotas as a point of departure
for the phaseout of the MFA; beginning on ;.ugust 1, 1991 and ending no later
than December 31, 1999. Components of the phaseout would include special
safeguards for textiles and clothing; a faster phaseout for the least developed
and small suppliers; immediate removal of aggregate quotas and quotas on items
with no domest'Jc production; immediate elimination of quotas that were less than
50 percent filled; and at an early stage, removal of the quotas on handloomed
items, handicrafts, and children's clothing. The proposal envisaged an

8
accelerated quota growth for the remaining products under restrictions. Proposed
yearly growth rates for the eight year period were, consequently, 7, 8, 10, 12.
14, 16, 18 and 20 percent.
In February 1990, Japan proposed ending the MFA as it expires in
July 1991, with the stipulation that any existin- bilateral quotas could remain
until the end of 1991. The transition of textile and clothing trade to GATT's
general safeguards provisions should take no longer than 8 years (i.e., the end
of 1999) through yearly liberalizations of -he restrictions and by the imposition
of more stringent transitional. measures. The proposal suggested that quota
levels should be determined by adopting the actual import or quota level as the
base and multiplying it by a factor that increased each year. It also contained
provisions for increased flexibility in enforcing the quotas.5 As for
transitional measures, the proposal envisaged the formation of a multilateral
surveillance board, like the current GATT Textiles Surveillance Body. On a case-
by-case basis, this board would authorize transitional measures, i.e., temporary
quotas. As the phaseout proceeds, the board would make it more difficult to
'nvoke transitional measures.
The United States tabled two alternative yet related proposals in
February 1990, both based on global quotas for MFA product categories; envisaging
a ten year phaseout. Nonetheless, the US noted that it was prepared 'to
5 The "flexibility" provisions of the MFA, i.e., "swing", "carry-over" and"carry-forward", allow use of unutilized portions of quotas across productcategories and over time, within certain limits.
9
continue work in [the Negotiating Group on Textiles and Clothing] on a system
extrapolaced from the M-A, as suggested by many participants".
The US proposal comprised global quotas with a comprehc_Isive volume
limit for each MFA category. Thie total quantity for each item would then be
divided between allocations for current quota holders, and a common basket for
the rest of the world (excluding Canada and Israel which have free trade
agreements with the US). The global basket wculd expand annually with a growth
factor which would be differentiated according to the "sensitivity" of the
product group. It was envisaged that there would only be a couple of sensitivity
classes for ;;il products; quotas on some categories deemed non-sensitive would
be abolished. The base level of each global quota would be determined by the
actual average US imports, plus some margin. Current MFA quota holders would
be entitled to allocations within the global quotas. These would be based on
each country's share in total imports, but limited to 15 percent of the global
quota in each category. While exporters would contir.4e to administer their own
quota allocations, the global basket would be run by the importing country.
The original US proposal envisaged that the country allocations would
shrink by 10 percent (of the initial base quota) annually, with this reduction
transferred to the global basket. The scheme would result in having only a
global basket at the end of the phaseout, with no country allocations. in a
recent modification to its proposal, in May 1990, the US declared that the
minimum exporter quota allocations would stay constant during the duration of
the phaseout. Consequently, the global basket would grow more slowly than

10
originally envisaged. The recent communique explicitly stated that the "country
minimum guarantees would be fully tradeable among exporting countries."
The initial US proposal of February 1990 also contained an
alternative approach relying on global tariff-quotas. However, this was
described in a sketchy manner and has not been articulated since.6 The basic
setup would be the same as described above, but this approach "... would feature
a two-tier tariff system with country allocations and a global basket for the
lower tier (with lower tariffs), shifting over time toward the global basket.
Imports within the qu&ntitative limits of the lower tier would enter at
applicable duty rates. However, additional imports above and beyond these
quantitative limits would be permitted at substantially higher penalty tariff
rates".
Canada's March 1990 proposal for terminating the MFA upon its
expiration foresaw special safeguard measures for the transition period that
should be patterned after GATT's Article XIX, with two temporary derogations:
i) substituting the concept of market disruption (or real risk thereof)7 for
Article XIX's serious injury concept, and ii) eliminating the Article XIX
requirement for compensation due to an exporter if a safeguard measure is put
in place.
6 The US communique of May 1990 does not take up the global tariff-quotaapproach.
7 "Market disruption (or real risk thereof)" is quite different from the"serious injury" concept. It is an MFA invention according to which a specificsupplier's "low prices", i.e., its competitiveness, can be a cause of marketdisruption. Hence, it is a selective, discriminatory mechanism.

11
The special safeguard measures would be applied to global quotas on
specific products. The global quotas would be progressively liberalized by
gradually removing items from the global quota list and by providing minimum
growth rates for items under quota. "Special treatment" would be given to least
developed countries.
DeveloRing Country Proposals
At a very early stage, in February 1988, Pakistan suggested a four
phase process to integrate textiles and clothing into the GATT. In the first
phase, restrictions on non-apparel products would be removed, and the criteria
of "low prices" for invoking "market disruption" would be scrapped. In the
second phase, restrictions on apparel would be applied only in accordance with
Article 3 of the MFA, which provides for measures taken when market disruption
occurs. In the third phase, these restrictions would be activated only with the
approval of the Textiles Surveillance Body, in cases when actual market
disruption had been established. In the final phase, all restrictions on
apparel would also be eliminated.
India's October 1989 proposal for a phaseout envisaged that upon
the expiration of MFA IV, the restrictions on the following would be eliminated
immediately: imports from least developed countries, new fibers added under MFA
IV, handloomed and handicraft products, group and aggregate quotas, and quotas
with less than 50 per cent utilization. India proposed that the quotas on the
other products should be scrapped in five years: 20 percent of them each year;

12
and the quotas remaining in place should grow by 15, 20, 25, 30 and 35 percent
each year. Safeguards during the phaseout would be GATT Article XIX safeguards
provisions.
Bangladesh, on behalf of the least developed countries, in November
1989, proposed that all existing restrictions facing least developed countries,
should have an accelerated phaseout. Also no transitional regimes should apply
to them. Furthermore, they should be exempt from any new safeguard measures.
In December 1989, Indonesia, acting also on behalf of Malaysia, the
PhilioRines, Singapore, and Thailand, proposed that the transition period begin
in August 1991, and end by the year 2000. Their proposal called for an immediate
removal of quotas on vegetable fibers, silk blends, handloomed and handicraft
products, and items not produced in the importing countries. They also requested
the removal of some of the special, restrictive provisions of the MFA (antisurge
provisions, outward processing traffic limits, group and aggregate quotas, and
the basket extractor mechanism). The proposal envisaged that the phaseout would
take place by expanding the remaining quotas at progressively increasing growth
rates, starting with a minimum of 6 percent, accompanied by greater flexibility
provisions.
In December 1989, the International Te2:tiles and Clothing Bureau
(ITCB), the major grouping of textile and clothing exporting developing countries

13
and territories, made its proposal.8 The ITCB proposal envisages a phaseout
within the existing structure of the MFA. This would take place through a
progressive quota elimination based orn type of fiber and degree of processing,
as well as a minimum growth rate of 6 percent from the base quota levels. Quota
expansion would accelerate throughout the transition, and new entrants and cotton
and wool producing countries would enjoy higher quota growth rates in their
native products.
The minimum viable production9 concept would be eliminated, as would
other restrictions (such as limits on outward processing traffic and aggregate
and group quotas). Limits on flexibility provisions would be removed. While
ITCB had no objections to strict and well defined transitional safeguard measures
for categories remaining under restrictions, they proposed that normal GATT
safeguards apply to items not currently covered by quotas, and those liberalized
during the transitionary period.
The ITCB proposed least developed countries receive "special
treatment". Also certain products, such as children's clothing, handlooms,
handmade and folkcraft products, and products with no domestic production,
would be subject to preferential treatment.
8 ITCB consists of 21 developing countries and territor-.es: Argentina,Bangladesh, Brazil, Colombia, China, Egypt, El Salvador, India, Indonesia,Jamaica, Rep. of Korea, Macao, Maldives, Mexico, Pakistan, Peru, Hong Kong, SriLanka, Turkey, Uruguay and Yugoslavia.
9 Minimum -fable production is a Nordic concept based on national securityconcerns.

14
In June 1990, ITCB tabled "a framework for phasing out MFA
restrictions" which articulated its previous proposal. It laid down a six-year,
four-stage phaseout: the first and second stages extending 2 years each, and the
third and fourth stages one year each. Annual volumes of quotas expiring on July
31, 1991 would constitute the base levels. In the first year of the phaseout,
they would expand at least 6 percent "provided that such increase shall in no
case be at a rate lower than that established in the bilateral agreement
applicable immediately before the commencement of this Agreement". In the second
year, the increase would be 8 percent, and in the following years, 11, 15, 20
and 25 percent. Two percentage points would be added to these growth rates for
the cotton products of cotton producers. By the end of the sixth year, all
quotas would be scrapped.
The proposed scheme includes a detailed list of products defined in
terms of the new "Harmonized Commodity Description and Coding System" for
progressive elimination of quotas over the four stages. The "special treatment"
which would be accorded to least developed countries and to some products
envisaged in ITCB's initial proposal is also spelled out. All restrictions on
them would be abolished at the very start of the phaseout. Together with these,
all restrictions on products made of vegetable fibers, their blends, and silk
blends -- items which were put under restriction in MFA IV -- would be scrapped.
Also quotas on small producers, defined as those which account for less than
one percent of total textile and clothing imports in a market, would be abolished
upfront. Finally, the proposal articulated the flexibility provisions, the
transitional safeguard measures, and the monitoring 'body which would supervise
the implementation of the phaseout.
15
Hong Kong's proposal of December 1989 to phase out all quota
restrictions on textiles and clothing was along the lines of the ITCB and the
Nordic proposals. In a phaseout based on export control within the MFA
framework rather than a new transitional system, Hong Kong suggested a greater
market access for all exporting countries, including the major suppliers. Hong
Kong had a preference for India's five year phaseout period.

16
III. HISTORICAL QUOTA GROWTH RATES
To negotiate a quota growth factor, whether this be in the framework
of the MFA or through global quotas, the parties need points of departure. The
guideline in the MFA was a 6 percent annual quota growth. Developing countries
considered this a concession obtained from industrial markets, and envisaged in
their phaseout proposals that the minimum base year quota growth rate would be
6 percent. In fact, however, there were large variations in quota growth across
products and suppliers, as well as across markets, and on the whole quotas
expanded at a significantly lower rate. In this Section we study the US and EC's
quota growth in the most recent years for which we have data. Our examination
underlines a number of measurement problems. Although they are simplistic, they
are relevant to the negotiations.
EC
Since the EC publishes its MFA quotas in advance, we have the figures
up to 1991. Our computations based on these unadjusted rates -- not adjusted
for revisions and application of the flexibility provisions -- indicate that
overall growth of quotas had a 2.7 per cent annual average for the period 1983
to 1986. This is in terms of total metric tons for all MFA categories and
suppliers. The average was roughly the same, 2.8 percent, for the 1987-1991
period.
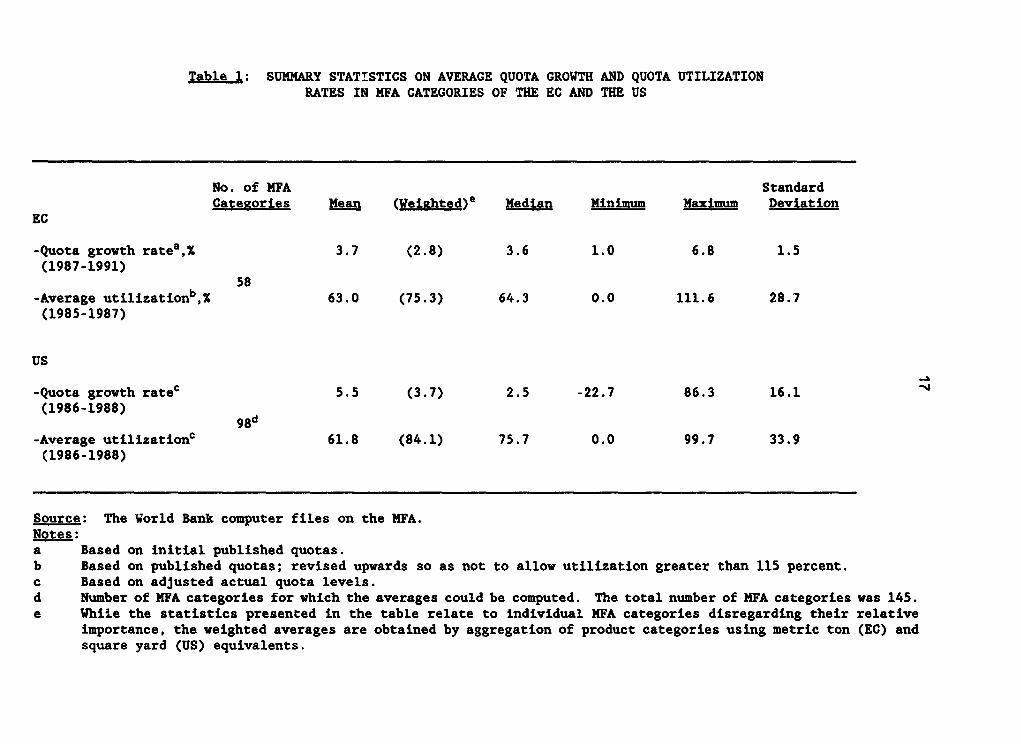
Table 1: SUMMARY STATISTICS ON AVERAGE QUOTA GROWTH AND QUOTA UTILIZATION
RATES IN MFA CATEGORIES OF THE EC AND THE US
No. of MFA Standard
Categories Mean (Weighted)e Median Minimum Maximum Deviation
EC
-Quota growth ratea,X 3.7 (2.8) 3.6 1.0 6.8 1.5
(1987-1991)58
-Average utilizationb,% 63.0 (75.3) 64.3 0.0 111.6 28.7
(1985-1987)
us
-Quota growth ratec 5.5 (3.7) 2.5 -22.7 86.3 16.1
(1986-1988)98d
-Average utilizationC 61.8 (84.1) 75.7 0.0 99.7 33.9
(1986-1988)
Source: The World Bank computer files on the MFA.
Notes:a Based on initial published quotas.
b Based on published quotas; revised upwards so as not to allow utilization greater than 115 percent.
c Based on adjusted actual quota levels.
d Number of MFA categories for which the averages could be computed. The total number of MFA categories was 145.
e While the statistics presented in the table relate to individual MFA categories disregarding their relative
importance, the weighted averages are obtained by aggregation of product categories using metric ton (EC) and
square yard (US) equivalents.

18
Initial quotas are often subject to adjustments. In the case of the
EC, these are published in the EC Journals as they occur, but to our knowledge
are not incorporated into any statistical series. To take into account these
adjustments to some extent, we revised the quotas upwards when shipments exceeded
the volumes of the initial quotas. With this adjustment, we arrived at a 3.9
percent averr.ge annual growth for the 1983-1986 period. This is 1.2 percentage
points greeter than the unadjusted figure, nevertheless, considerably lower than
the 6 percent mark.
In the more detailed presentation of EC quota growth (Tables 1 and
2), we used the 1987-1991 published quotas. While this somewhat underestimates
actual quota growth, our choice is based on the fact that this is a consistent
series during which the same quotas prevailed. The overall (weighted) averag2
annual growth rate was 2.8 percent, but this rate varied from 1.0 to 6.8 percent
across the MFA categories. Table 2 reveals that the range for quota growth by
exporter was between 0.8 percent (China) and 7.3 percent (Sri Lanka).
US
Unlike the EC, the US does not publish its MFA quotas in advance,
but the annual adjustments in quota levels are incorporated in the published
statistics. Consequently, av ilable quota growth rates for MFA IV stop short
of 1991, and we analyzed only 1986 to 1988. ts many new quotas were introduced
during this period, to arrive at a consistent estimate for overall quota growth,
we based our computations on bilateral quotas which were in place in all the
three years: 1986, 1987 and 1988. With this qualification, the (weighted)

19
average annual quota growth turned out to be 3.7 percent.10 The variation across
product groups and suppliers was erratic. Across products, the range was from
minus 23 to (plus) 86 percent (Table 1); and across suppliers (Table 2), the
figures were even more erratic with major quota reductions as well as expansions.
To sum up the major measurement problems, we should repeat that: i)
which years to take as benchmark, ii) how to incorporate quota adjustments, and
iii) how to deal with discontinuities/new quotas, made quite a difference.
A Common Denominator?
We observed that there was no quota growth rate which came close to
a common denominator across markets, across product groups or suppliers.
Nevertheless, developing countries interpret the somewhat fictitious 6 percent
quota growth guideline inscribed in the MFA as a concession obtained from the
industrial countries. Certainly this is a bargaining chip in the negotiations.
However, more realistically, .veloping countries like to consider the actual
growth of their quotas in various markets -- similar to their sheer quota levels
-- as an acquired right. This is certainly not without qualification. Quota
growth rates were closely and inversely related to quota levels, and the
performance of the exporters in filling them (see Erzan, Goto and Holmes (1990)).
Hence, large and efficient exporters (with the exception of some politically
motivated cases), have experienced major declines in their quota growth.
10 Given the new quotas imposed during this period, the 3.7 percent annualquota growth rate is an overstatement of the developments in the US.

20
The counterpart of the "acquired rights" argument from the importing
industrial countries' point of view is the "sensitivity" of the products
involved, and the size and potency of the suppliers. Hence, the differentiation
in quota growth rates across products presumably reflected adjustment problems,
while differentiation across suppliers checked the "risk of injury" by avoiding
import surges.
The current proposals either explicitly or implicitly endorse a
differentiation in quota growth rates across products. The US proposal envisages
that there would be a couple of sensitivity classes, while the developing
countries, by mentioning minimum growth rates, seem to accept an eventual
variation. Across suppliers, however, the only exceptions are for least
developed countries and the proposal requesting higher quota expansion rates for
new entrants and (cotton products of) cotton producers and (wool products of)
wool producers.
Other than these exceptions, neither the developed nor the developing
countries propose to discriminate among the suppliers in terms of quota expansion
rates. Indirectly, however, the suggestions concerning a transitory selective
safeguards mechanism --- such as the one emphasized by the EC -- would likely
boil down to lower quota growth rates for the large and efficient suppliers.
Nevertheless, keeping this as an ad hoc mechanism rather than building it into
the phaseout scenarios might make sense.

21
Table 2: PAST QUOTA GROWTH AND UTILIZATION RATES,AND PROJECTIONS UNDER ACCELERATED QUOTA GROWTH - PHASEOUT SCENARIOS, PERCENT
Market: US
1986-1988 1986-1988 A phaseout scenarioaverage quota average with accelerated quotautilization quota growth growth:b annual average
Exporter ratea rate' quota growth rate
Bangladesh 93.9 15.92 35.6Brazil 60.6 47.48 31.7Burma 37.8 6.00 23.1China 94.6 9.35 24.5Colombia 25.4 324.00 37.9Costa Rica 57.9 .. 10.5Dominican Republic 50.2 .. 15.5Egypt 93.7 19.17 28.7El Salvador 79.1 0.00 3.9Guam 91.1 3.70 15.9Guatemala 20.7 3.70 15.5Haiti 84.2 -11.73 4.5Hong Kong 93.3 3.04 14.7India 96.1 13.98 30.2Indonesia 94.7 -5.89 21.0Jamaica 55.9 .. 13.1Korea, Rep. of 86.5 4.91 15.5Macao 72.7 5.19 23.0Malaysia 60.7 32.47 30.2Mauritius 80.2 14.11 21.5Mexico 55.3 10.11 24.3Nepal 49.8 6.06 26.2Pakistan 82.3 -0.94 20.7Panama 32.0 -9.91 3.9Peru 19.0 9.48 24.1Philippines 79.4 10.56 32.9Poland 15.6 .. 15.5Romania 43.9 0.25 16.2Singapore 67.0 1.81 18.4Sri Lanka 92.4 -18.14 18.5Taiwan (China) 82.0 5.18 21.5Thailand 78.4 6.50 22.6Trinidad and Tobago 0.7 .. 14.1Turkey 95.4 2.60 16.6United Arab Emirates 100.0 .. 15.5Uruguay 77.9 -4.65Yugoslavia 87.4 2.15
All courtries above 84.1 3.7 2.
.int.)
22
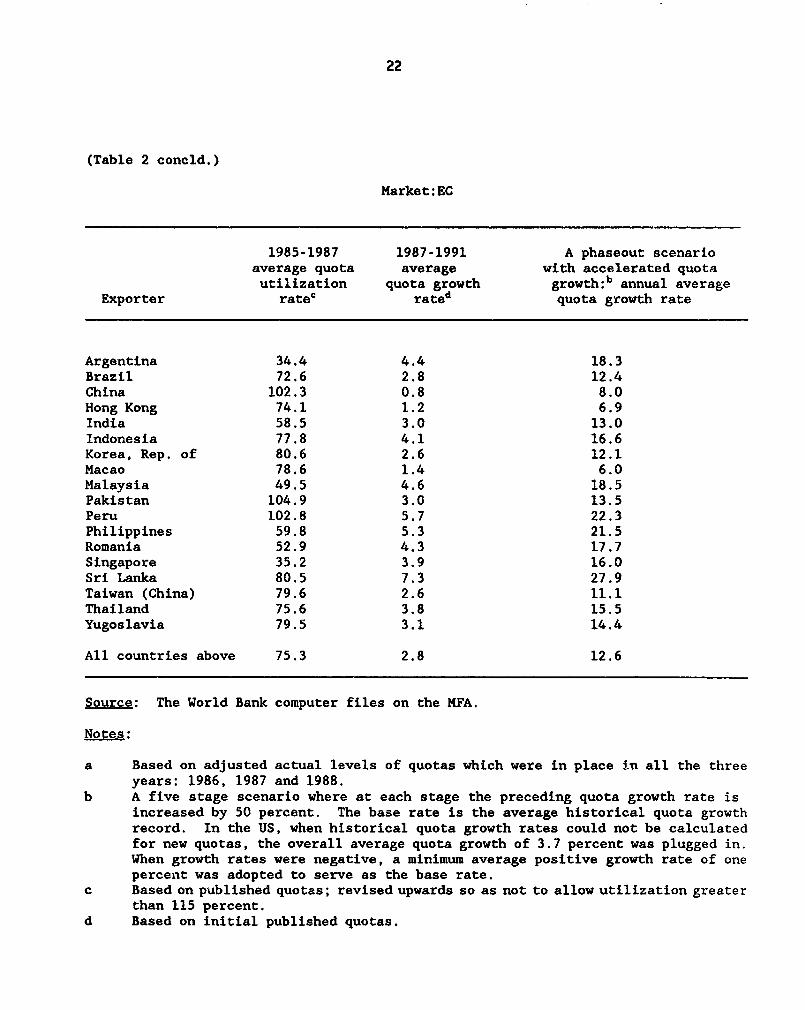
(Table 2 concld.)
Market:EC
1985-1987 1987-1991 A phaseout scenarioaverage quota average with accelerated quotautilization quota growth growth:b annual average
Exporter rate' rated quota growth rate
Argentina 34.4 4.4 18.3Brazil 72.6 2.8 12.4China 102.3 0.8 8.0Hong Kong 74.1 1.2 6.9India 58.5 3.0 13.0Indonesia 77.8 4.1 16.6Korea, Rep. of 80.6 2.6 12.1Macao 78.6 1.4 6.0Malaysia 49.5 4.6 18.5Pakistan 104.9 3.0 13.5Peru 102.8 5.7 22.3Philippines 59.8 5.3 21.5Romania 52.9 4.3 17.7Singapore 35.2 3.9 16.0Sri Lanka 80.5 7.3 27.9Taiwan (China) 79.6 2.6 11.1Thailand 75.6 3.8 15.5Yugoslavia 79.5 3.1 14.4
All countries above 75.3 2.8 12.6
Source: The World Bank computer files on the MFA.
Notes:
a Based on adjusted actual levels of quotas which were in place in all the threeyears: 1986, 1987 and 1988.
b A five stage scenario where at each stage the preceding quota growth rate isincreased by 50 percent. The base rate is the average historical quota growthrecord. In the US, when historical quota growth rates could not be calculatedfor new quotas, the overall average quota growth of 3.7 percent was plugged in.When growth rates were negative, a minimum average positive growth rate of onepercent was adopted to serve as the base rate.
c Based on published quotas; revised upwards so as not to allow utilization greaterthan 115 percent.
d Based on initial published quotas.

23
IV. A PHASEOUT WITHIN THE FRAMEWORK OF THE MFA
We observed that modalities of a phaseout within the framework of
the MFA had four elements: (i) measures to increase the "flexibility" of the
application of the MFA -- flexibility in both the specific and general usage of
the term, ii) upfront removal of the restrictions on some specifically defined
products and suppliers (mostly dealing with the smaller and poorer exporters),
iii) acceleration of the quota growth rates, and iv) elimination of quotas in
stages according to a set of predetermined criteria. The latter was defined in
terms of country (such as new entrants, least developed countries), specific
products or product characteristics (such as type of fibers or degree of
processing), or based on some criteria pertaining to the historical record, such
as quota utilization.
Since implementation of the quota elimination proposals would still
leave the bulk of the quotas intact, the main element in such a transition would
come from accelerated quota growth. The quotas would have to expand in such a
way to avoid a "shock" when they are abolished at the end of the phaseout. A
"phaseout" without radical quota growth would therefore be a mere extension of
the MFA.
It is evident from our presentation in the previous Section that a
single base rate to which some growth factor will be applied for all product
groups, all markets and suppliers is very unlikely. There will have to be at
least some differentiation by product characteristics.

24
An Accelerated Quota Growth
For demonstration purposes we took the extreme case of adherence to
the current regime by adopting the actual historical growth rates of individual
quotas as the basis for furtner expansion. Hence, we al'lowed for differentiation
in quota growth rates across products, suppliers and markets. Using the 1987-
1991 average quota growth rates for the EC, and the 1986-1988 rates for the US,
we applied a growth formula in five stages starting in 1992 which can be
intevpreted to cover a 5- or a 10-year period (with two years for each stage in
the 'Latter). We first rounded up the historical quota growth rates (per product
and supplier) to the nearest percentage point. Then, at each stage we increased
the quota growth rate by 50 percent of the previous stage's growth rate. As the
overall historical quota growth record is about 3 to 4 percent, this formula,
if applied to the aggregate of existing quotas, would nearly double the level
in 5 years (an effect which appeared not totally unacceptable to the negotiating
parties). In the case of the US, where quotas had an erratic pattern, we adopted
a number of assumptions to arrive at the base year quota level and quota
growth."'
As an example, Table 3 depicts Indonesia in the EC market. The
largest textile product Indonesia has under MFA quotas in the EC is fabrics of
man-made fibers. Indonesia's 1991 quota for this category is about ten thousand
11 For quotas which were introduced in 1987, we took the 1987-1988 growthrates; for those introduced in 1988, we imposed the overall US average for 1986-1988; in the case of negative growth, we plugged ir. 1.0 percent; and finally,we imposed a 10 percent ceiling for quota growth rate. With these rates, wefirst hypothetically moved on to 1991, the base year for quota volumes.

25
metric ton equivalent. While quota utilization in this item exceeded 100
percent, quota growth was limited to 3 percent. In our exercise, we take this
as a base rate, and increase it by 50 percent. Hence, in stage I the quota
expands by 4.5 percent over the initial quota, and in stage II by 6.8 percent
over the quota level of stage I, and so on. In this example, by the end of stage
V, the average annual growth rate goes up from the initial 3 percent to 11.7
percent. Accordingly, at the fifth stage, if each stage lasted one year, the
volume of the quota would be 74 percent greater than the base year (1991) quota.
In case each stage covered a two year period, and the scheme stretched over 10
years, the annual average quota gtowth rate would be the same (11.7 percent).
However, the quota for the tenth year would be around 200 percent greater than
the base year quota. 1 2
We applied the above formula to all bilateral MFA quotas in the EC
and the US. The results are summarized by exporter in the last column of Table
2. In the case of the EC, it yielded an overall average annual growth rate of
12.6 percent over the span of the five stages. This average for Hong Kong's
quotas was 7 percent, for China 8 percent and on the higher end, 28 percent for
Sri Lanka. Across products, annual average growth rates were from 8 to 27
percent. In the case of the US, the overall average turned out to be 22.2
percent, while acro-s its suppliers this rate varied from 4 percent (El Salvador
and Panama) to 36 percent (Bangladesh).
12 If the average annual growth rate, 11.7 percent, is applied cumulativelyover 10 years, the resulting increase would be approximately 200 percent.

TabLe 3: AN ILLUSTRATIVE EXAMPLE FORAN ACCELERATED QUOTA GROWTH-PHASEOUT SCENARIO a
Market: EC Exporter: Indonesia
End of Arnuat1985-1987 stage when 1987-1991 Five stage acceterpted Quota votume. thousand metric tons average
NFA category avg. quota quota witl avg. quota ouots growth .X 1991 Stage Stage Stage Stage Stage quotautiLization be scrapped growth I II III IV V base I 11 III IV V growth
3:fabrics of man- 115.0 V 3.0 4.5 6.8 10.1 15.2 22.8 10.03 10.48 11.18 12.32 14.19 (17.42] 11.7made fibers
6:outer garments, 81.4 IV 6.0 9.0 i3.5 20.3 30.4 45.6 3.51 3.83 4.35 5.23 (6.821 9.92 23.1woven
7:outer garments, 54.4 1 6.0 9.0 13.5 20.3 30.4 45.6 0.93 (1.021 1.15 1.39 1,81 2.63 23.1knitted or crocheted P
8:undergarments 82.8 IV 6.0 9.0 13.5 20.3 30.4 45.6 1.81 1.97 2.23 2.69 t3.501 51 10 23.1men's and boys'
All above 77.8 4.1 - - - - - 16.28 17.29 18.92 21.62 26.32 35.07 16.6
Source: The World Bank craputer files on the MFA
Notes:a See notes to Table 2.b At each stage, the preceding quota growth rate is increased by 50 percent. The base rate is the 1987-1991 quota growth.c In the case of quota scrapping, the brackets indicate the last quota anmont.

27
The summary tables we provide are admittedly of very limited use.
On the other hand, the detailed spreadsheets which depict for each supplier the
expansion in its individual bilateral quotas under alternative assumptions were
considered useful inputs by the negotiators. The main lesson we draw from this
exercise is that, for all practical purposes, it may be necessary to agree on
a stylized profile of base year quota growth. By examining growth in individual
quotas, product categories and suppliers which fall into ranges such as up to
2 percent, between 2 and 4, 4 and 6, and 6 and 8, and above 8 percent can be
tabulated. If items can be assigned to such categories, the phasing out could
start with rounding up the individual quota growth rates in these categories,
which would then serve as the base rate for further quota expansion.
The prominent developing country proposal subscribes to a (minimum)
6 percent fixed base ye_r growth rate. As there is no differentiation across
suppliers and products, the calculation of the resulting average growth in quotas
is straightforward and requires no actual data. Applying the expansion formula
we used above (with a multiplicative factor of 50 percent) gives an annual
average growth rate of 23.1 percent. Nominally, this is almost equivalent to
the aggregate result we got for the US, 22.2 percent (and nearly double the
projection for the EC, 12.6 percent).'3 But effectively, it implies a far
greater expansion in import volumes. In the scenario we simulated, which was
13 Actually, our scenario for the US which adopts historical quota growthrates -- with an overall average of 3.7 percent -- would yield a lower quotaexpansion compared to the scenario with a 6 percent base year growth. What makethe two scenarios come up with similar aggregate growth rates are the assumptionswe adopt in dealing with individual quotas. For any quota that had a negativegrowth, we plug in one percent as base year increase. Furthermore, we round uphistorical quota growth rates to the nearest percentage point.

28
based on historical quota growth rates, the high quota growth record of smaller
suppliers and less "sensitive" products were further inflated in an accelerated
fashion. In the aggregate, this compensated for the major suppliers' and
"sensitive" products' lower quota growth record. While developments in actual
shipments of the former group would in most cases fall short of the quota limit
expansions, in the latter group, quotas would be largely filled. Therefore, the
resulting shipments would be considerably less than what would take place if a
fixed base year quota growth were applied across the board.
Finally, some practical points. In the example above, the quota
growth rate expanded with a constant multiplicative factor (50 percent or 1.5)
which yielded an accelerated quota growth. The recent communique of the
developing countries (ITCB) submitted in June proposes growth rates of 6, 8, 11,
15, 20 and 25 percent for the six-year phaseout. These rates imply an almost
constant multiplicative growth factor of about 33 percent (or 1.33)." The
proposal would yield an annual average quota growth of 14 percent, and increase
the quota level by 120 percent by the end of 6 years.
A more radical quota expansion would result from formulae with an
accelerated expansion of the quota growth factor itself (such as a 50 percent
increase in the quota growth rate in stage I followed by a 60 percent increase
in the next stage). Although this is a simplistic point, it should be underlined
that an additive (as suggested by some countries), rather than a multiplicative
constant growth factor would yield a declining rate of quota growth over the span
14 The implicit growth rate multipliers are 1.33, 1.38, 1.36, 1.33 and 1.25from the second to the sixth year.

29
of the stages. Also, growth induced by such formulae would be at a slower pace
in categories with a relatively higher growth record. Certainly, it is
worthwhile to consider a number of alternative formulae. The acceleration
principle is the critical test.
State-wise ScraDini of Ouotas
An alternative to abolishing all quotas at the end of the phasing-
out period is scrapping some of the quotas along the way according to some
predetermined scheme. This could follow specific product lists or could be based
on product characteristics such as type of fibers or degree of p:ocessing as
proposed by some countries. Here we shall demonstrate that quota utilization
rates is also an extremely relevant criterion in this respect, which also has
a precedence. In MFA IV, developed countries agreed to scrap underutilized
quotas, and there were some positive developments in this respect, particularly
in the EC. Therefore, this need not be considered a new element in the
negotiations to phase out the MFA.15
QOoca Utilization Rates and Ouota Growth
In certain cases, well before quotas are filled, they have a chilling
effect on exports, mainly due to inefficiencies in quota administration. 16
Nevertheless, utilization rates are a good proxy for the actual restrictiveness
15 Alternatively, scrapping underutilized quotas may be generalized underthe Uruguay Round negotiations on non-tariff barriers.
16 See Kumar and Khanna (1990) concerning India.

30
of quotas. Consequently, expansions in underutilized quotas would often not
imply any relaxation in the regime. That is to say, it is not a major
concession.
The overall quota utilization rate in the EC during the 1985-1987
period was 75 percent, and in the case of the US (for 1986-1988), 91 percent (see
Table 2). When we discussed past and prospective quota growth in the previous
Sections, we did not distinguish between highly utilized (binding) quotas and
underutilized ones. When this distinction is made, we observe a major difference
in their past growth rate. We defined binding quotas arbitrarily as those with
utilization rates 90 percent or above. In the EC, while the overall average
annual growth in published quotas (1987 to 1991) was 2.8 percent, for those that
were binding (in 1987), this rate was half that, 1.4 percent. The situation
was similar in the US during the 1986-1988 period. While the overall average
quota growth was 3.7 percent annually, those which were binding increased by only
2 percent annually. These differences are quite instructive. The importing
countries are much more careful in expanding those quotas which are actual
effective restraints.
Stage-Wise ScraRDing of Underutilized Ouotas
What is the value of, for instance, a 10 percent annual quota growth
when the quotas in that item were only half filled over the past three years?
It is clear that the overall average quota growth we projected in our exercise
for the five stage span of the phase out, 12.6 percent for the EC and 22.2
percent for the US, is partly filled with air.

31
What if some quotas were then scrapped at each stage depending on
their utilization record? To avoid perverse incentives, this has to follow a
predetermined scheme based on past performance during an agreed period. To
demonstrate the point, we used the same data set as in the previous exercise.
For the EC, we adopted as a 'benchmark' the average utilization rates in the
1985-1987 period, and for the US, the 1986-1988 period.
Our illustrative scheme for scrapping the unutilized quotas is the
following. In the beginning of 1992, the first year of phaseout stage I, we
scrapped all individual bilateral quotas which had a utilization less than 50
percent in the benchmark year. Similarly, at the beginning of stage II, we
dropped all quotas with utilization of less than 60 percent (in the benchmark
year). Repeating this procedure, in the final stage, stage V, only those quotas
which had a utilization rate above 90 percent are left. These are scrapped at
the end of stage V.
The quota-scrapping scenario can be followed in Table 3 which depicts
Indonesia in the EC market. Among the four MFA categories, the quota on the one
with the lowest quota utilization, 54 percent, knitted or crocheted outer
garments, would drop by the end of stage I. Quotas for two categories with
utilization rates around 80 percent (women outer garments and men's and boys'
undergarments) would drop by the end of stage IV. Finally, the quota on fabrics
of man-made fibers, which was fully utilized, would last until the end of the
phaseout.
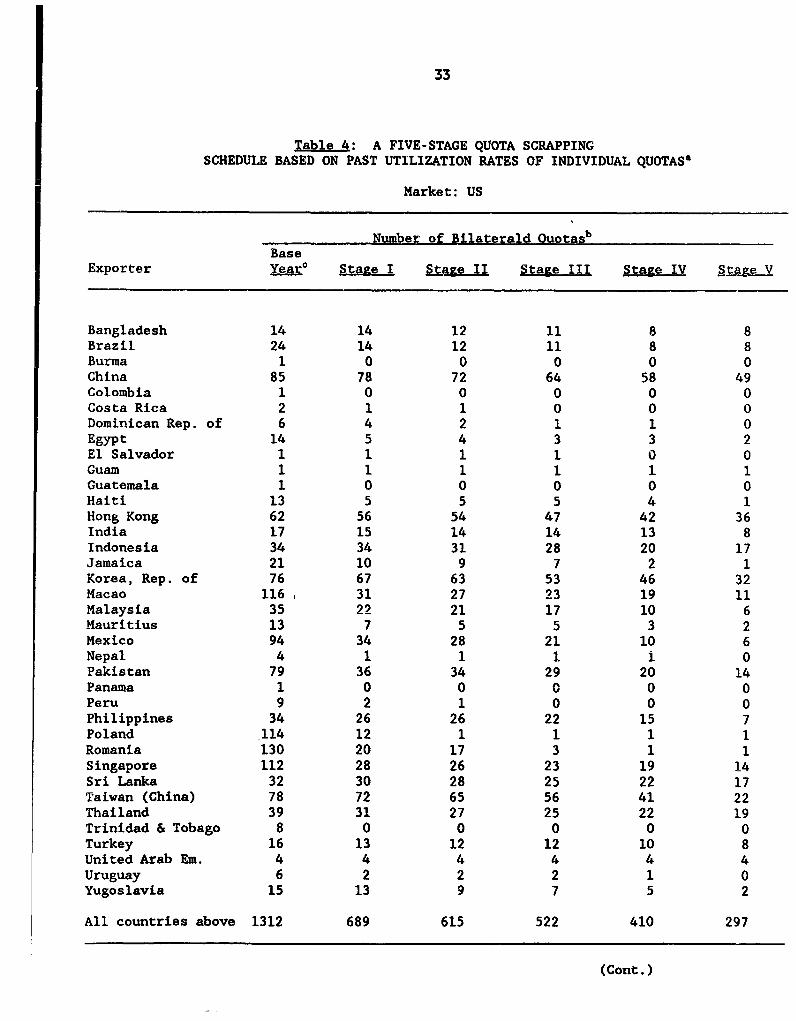
Table 4 summarizes the results of applying this scrapping schedule
to all exporters subject to quotas in the US and the EC. The first column gives
the number of bilateral quotas at the base year. To follow up our previous

32
example, Indonesia in the EC, this number is four. In the five consecutive
stages, the number of remaining quotas are, respectively, 4, 3, 3, 3 and 1. For
the efficient suppliers which have been filling most of their quotas, there would
be relatively less quota scrapping, especially in the earlier stages.
Nevertheless, for all exporters, the number of quotas imposed on them would
diminish considerably. The overall effect of this scheme would be a drastic
reduction in the number of bilateral quotas, by 66 percent (from 259 to 89) in
the EC, and by 77 percent (from 1,312 to 297) in the US, from the base year to
the last stage of the phaseout.
We should emphasize again that the main issue with underutilized
quotas is not that there should necessarily be a rigid schedule in scrapping
them. The point is that a quota growth scenario which does not address the
issue of underutilized quotas leads to inaccurate representations as to the
effective relaxation of the regime.
Stage-Wise Ouota Scrapping Based on Other Criteria
We did not try scenarios using other criteria for stage-wise quota
scrapping. However, to the extent that product categories or suppliers can be
classified by some common characteristics -- and the stage at which the quotas
would be dropped are determined.-- it is a matter of inserting this information
and rerunning the exercise. There might be some practical difficulties involved,
however, because while MFA categories distinguish prolucts by their level of
processing, in certain markets, notably in the EC, product groups can cover goods
made from different fibers.
33
Table 4: A FIVE-STAGE QUOTA SCRAPPINGSCHEDULE BASED ON PAST UTILIZATION RATES OF INDIVIDUAL QUOTAS'
Market: US
Number of Bilaterald QuotasBase
Exporter Yeare Stage I Stage II Stage III t_g ft.IV tS V
Bangladesh 14 14 12 11 8 8
Brazil 24 14 12 11 8 8
Burma 1 0 0 0 0 0
China 85 78 72 64 58 49
Colombia 1 0 0 0 0 0
Costa Rica 2 1 1 0 0 0
Dominican Rep. of 6 4 2 1 1 0
Egypt 14 5 4 3 3 2
El Salvador 1 1 1 1 0 0
Guam 1 1 1 1 1 1
Guatemala 1 0 0 0 0 0
Haiti 13 5 5 5 4 1
Hong Kong 62 56 54 47 42 36
India 17 15 14 14 13 8
Indonesia 34 34 31 28 20 17
Jamaica 21 10 9 7 2 1
Korea, Rep. of 76 67 63 53 46 32Macao 116 31 27 23 19 11Malaysia 35 22 21 17 10 6
Mauritius 13 7 5 5 3 2
Mexico 94 34 28 21 10 6
Nepal 4 1 1 1 1 0
Pakistan 79 36 34 29 20 14
Panama 1 0 0 0 0 0
Peru 9 2 1 0 0 0
Philippines 34 26 26 22 15 7
Poland 114 12 1 1 1 1
Romania 130 20 17 3 1 1
Singapore 112 28 26 23 19 14
Sri Lanka 32 30 28 25 22 17
Taiwan (China) 78 72 65 56 41 22
Thailand 39 31 27 25 22 19
Trinidad & Tobago 8 0 0 0 0 0
Turkey 16 13 12 12 10 8
United Arab Em. 4 4 4 4 4 4
Uruguay 6 2 2 2 1 0
Yugoslavia 15 13 9 7 5 2
All countries above 1312 689 615 522 410 297
(Cont.)

34
'Table 4 concld.)
Market: EC
Numbe.. r_of oral Ouotasbbase
Exporter IQUdAX Stage II eI StagII Sta-e IV Stage V
krgentina 3 1 1 1 1 1orazil 9 6 4 3 2 2China 19 19 18 17 15 14Hong Kong 28 22 20 14 11 9India 11 7 4 2 2 2Indonesia 4 4 3 3 3 1Korea Rep. of 40 27 23 21 18 14Macao 20 15 12 10 7 6Malaysia 6 4 2 0 0 0Pakistan 6 6 6 6 6 3Peru 2 2 2 2 2 1Philippines 11 6 5 3 1 1Romania 28 18 16 16 11 9Singapore 7 1 0 0 0 0Sri Lanka 4 4 4 3 1 1Taiwan (China) 36 28 23 19 16 14,ailand 14 12 10 10 9 8
Yugoslavia 11 9 8 6 5 3
All countries above 259 191 161 136 110 89
Source: The World Bank computer files on the MFA.
Notes:
At stage 1, all quotas with historical average utilization rates below 50 percent arescrapped. In stage II, the seme is applied to quotas with utilization rates below 60percent; and so on. In stage V, only those quotas with utilization ratios above 90percent remain. By the end of this stage, all quotas are abolished. For the US, theutilization rates used are the averages for 1986-1988; for the EC, 1985-1987.Number of bilateral quotas exclude aggregate group quotas.For the US, the base year is 1988 actual quotas.For the EC, the base year is 1991 published quotas.

35
V. A PHASEOUT BASED ON GLOBAL QUOTAS
The leading alternative to phasing out the MFA within its current
structure is a new transitional mechanism based on global quotas proposed by the
US. We applied this proposed mechanism using the US data to get some idea of
its immediate consequences.
Briefly, the proposal envisages a ten year phaseout, starting with
a shift to global quotas which would expand gradually. The current quota holders
under the MFA would be entitled to allocations within the global quotas. These
allocations would be based on actual import market shares, but limited to 15
percent of the global quota in each product category.
We constructed global quotas for each MFA category based on the
average volume of US imports during the period 1987 to 1989, as suggested in the
US communique of May 1990. Using square yard equivalents (SYE), we then computed
the aggregate quota for each exporter. We compared these volumes with their
actual quota holdings in 1988 (rather than 1989 due to the lag in data input).
The first column in Table 5 gives the percentage change in exporters' quotas due
to this shift in the base. Then we limited the exporters' shares to 15 percent
of total imports in each product. The third column in Table 5 gives the
resulting percentage reduction in aggregate quota volumes. Current quota
holders, taken together, would lose about 31 percent of their quotas due to the

36
Table 5: CHANGE IN AGGREGATE QUOTA VOLUMES FOR CURRENTQUOTA HOLDERS UNDER THE US PROPOSAL OF GLOBAL QUOTAS
The US market, change from 1988. percent
orter Change due to new Change due to cappinganked by quota allocation based quotas at 15% of Totalelative loss on actual shipments' import shareb Change
uam -100.0 0.0 -100.0'rinidad & Tobago -99.5 -0.0 -99.5)oland -89.5 0.0 -89.5.owiania -78.5 0.0 -78.5eru -73.0 -0.0 -73.0anama -71.9 0.0 -71.9aailand -66.0 -7.5 -68.6apan -54.3 -30.5 -68.2,urma -66.5 0.0 -66.5aiti -65.2 0.0 -65.2Pt -64.5 0.0 -64.5aysia -63.5 -1.0 -63.9
amaica -57.2 -5.0 -59.3'olombia -59.0 0.0 -59.0.exico -58.0 -0.8 -58.3.acao -58.0 -0.0 -58.0;ingapore -52.4 -0.6 -52.7ugoslavia -50.7 -0.0 -50.7epal -45.5 0.0 -45.5.orea, Rep. of -20.4 -31.2 -45.2'aiwan (China) -22.4 -26.9 -43.2ong Kong -27.8 -21.3 -43.2Philippines -35.3 -12.1 -43.1zechoslovakia -41.5 -0.0 -41.5,razil -36.7 -5.1 -39.9ungary -38.0 0.0 -38.0Salvador -37.7 0.0 -37.7
'akistan -32.0 -6.5 -36.4China 1.3 -33.3 -32.4.auritius -24.7 0.0 -24.7ermany, E. -23.7 0.0 -23.7,angladesh -18.9 0.0 -18.9ruguay -8.0 0.0 -8.0osta Rica -5.3 -0.0 -5.3India 16.5 -17.2 -3.5'ominican Republic 11.0 -0.3 10.7donesia 42.6 -5.9 34.2ited Arab Emirates 34.7 0.0 34.7i Lanka 42.6 -0.0 42.6rkey 68.6 -0.2 68.2atemala 99.9 0.0 99.9
1 Countries Above -30.9 -19.5 -44.3
(Cont.)

37
(Table 5 concld.)
Source: The World Bank computer files on the MFA
Notes:
a The new quotas are set equal to the average of actual shipmentsduring 1987 to 1989. The aggregations are based on square yard equivalents.
b The new country quotas are limited to a maximum of 15 percent of tifimport share for each MFA group.

38
new allocation based on actual shipments, and their quotas would suffer another
decline of 20 percent, transferred to the unallocated basket, as a result of the
maximum import market share constraint. Their overall quota loss in the first
year would add up to 44 percent of their initial quota holdings.
On a country by country basis, from Table S it appears that almost
all current quota holders would lose quota allocations due to the proposed
transitional system. Most of the quota losses would be due to the shift in the
base for quota allotments to the actual (1987-1989 average) shipments. The
difference between old quota volumes and average shipment levels stems from
quotas that were not filled by the exporters.17 Countries that were "efficient"
in filling their quotas would have smaller percentage quota losses as a result
of this shift. Some countries would experience large quota losses due to the
15 percent capping provision. These are the major suppliers which hold very
large shares of the US imports of certain items -- China, K3rea, Japan, Taiwan,
and Hong Kong.
The case of the six countries which appeared to make quota gains from
the proposed transition -- the Dominican Republic, Indonesia, United Arab
Emirates, Sri Lanka, Turkey, and Guatemala -- relates to a statistical
shortcoming in our computations. New quotas imposed in 1989 affected large
quantities of these countries' exports. This in turn inflated their 1987-1989
average shipments subject to restrictions. If we could use the 1989 quotas as
17 Obviously, eliminating unfilled quotas is a potential, rather than anactu..l loss to the exporters.

39
the basis of our comparison for initial quota holdings rather than 1988, these
countries would also show quota losses.
While the proposed transition to global quotas would reduce the
reserved allocations, it should be remembered that loss in guaranteed quotas need
not imply any loss in export volume or market share for an individual supplier.
The efficient suppliers, after filling their own quotas, would also dip into the
unallocated basket. For all exporters taken together, however, the transition
to global quotas in this case is a major increase in the restrictiveness of the
system.
To demonstrate this point, we have undertaken a numerical exercise.
During 1988, the total amount of textile and clothing quotas in the US market
was 11.2 billion SYE. As some suppliers did not fill their quotas, the overall
imports against these allotments were 7.3 billion SYE. Nevertheless, the US was
committed to absorb the full amount, 11.2 billion SYE, from these countries.
On top of that, the US imported 3.6 billion SYE of textiles and clothing in the
same categories from non-restricted exporters, mainly industrial countries. If
we add the two, i.e., total quota holdings in 1988 plus imports from non-
restricted countries, we arrive at 14.8 billion SYE which is the ceiling for
"allowable" imports. As the volume of the global quotas would be based on actual
shipments alone, exclusion of the unfilled portion of quotas, 3.9 billion SYE
(11.2 less 7.3), represents the loss in allowable imports.
Table 6 ranks the exporters according to their relative quota share
losses computed in line with the exercise described above. In parentheses are

40
the shares of the suppliers in actual quota holdings. In the second column,
the shares are adjusted by adding imports from the non-restricted countries to
the denominator. These are then compared with the reserved shares in the new
global quota, before and after applying the 15 percent capping provision. The
results and the ranking of exporters in terms of their relative losses closely
resemble those in Table 5.
Finally, we should note that, for demonstrative purposes, we adopted
a conservative interpretation of the US proposal. In fact, the May 1990
modification to the initial proposal stated that "[T]he quotas for each product
would be set at the average level of the last three years of total imports (1987-
1989) plus an additional increment which would be applicable to all countries
utilizing the modality and which would be multilaterally negotiated". If these
"additional increments" would turn out to be substantial rather than incremental,
the overall restrictiveness of the proposed approach could vanish.

Table 6: CHANGE IN RELATIVE QUOTA SHARES FOR CURRENT QUOTA HOLDERSUNDER THE US PROPOSAL OF GLOBAL QUOTAS
The US market, base year 1988, percent
Share in Share in Charte due Change dueExporter 1988 1988 actual new quota to shift to to capping Totalranked by Actual Adjusted average allocation new base at 15X changerelative quota quota quota shipments: after (II-I)/I (III-ID)/II (III-I)/Ishare loss share sharea the new baseb capping at 15X
0 I II III IV V VI
Guam (0.05) 0.04 0.00 0.00 -100.0 0.0 -100.0Trinidad & Tobago (0.31) 0.24 0.00 0.00 -99.3 -0.0 -99.5Poland (1.29) 0.98 0.13 0.13 -86.5 0.0 -89.5Romania (1.53) 1.16 0.32 0.32 -72.4 0.0 -78.5Peru (1.06) 0.81 0.28 0.28 -65.2 -0.0 -73.0Panama (0.05) 0.04 0.01 0.01 -63.8 0.0 -71.9Thailand (2.86) 2.17 0.95 0.88 -56.3 -7.5 -o8.6Japan (5.63) 4.27 2.51 1.75 -41.1 -30.5 -59.1Mexico (6.65) 5.04 2.72 2.70 -46.0 -0.8 -58.3Burma (0.05) 0.04 0.02 0.02 -56.9 0.0 -56.9Haiti (0.74) 0.56 0.25 0.25 -55.3 0.0 -55.3Egypt (2.11) 1.60 0.73 0.73 -54.3 0.0 -54.3Malaysia (3.66) 2.78 1.31 1.29 -53.0 -1.0 -53.5Singapore (2.98) 2.26 1.38 1.37 -38.8 -0.6 -52.7Yugoslavia (0.65) 0.50 0.31 0.31 -36.5 -0.0 -50.7Jamaica (1.52) 1.15 0.63 0.60 -44.9 -5.0 -47.6Colombia (0.05) 0.04 0.02 0.02 -47.3 0.0 -47.3Macao (1.50) 1.14 0.62 0.62 -45.9 -0.0 -45.9Nepal (0.17) 0.13 0.09 0.09 -29.9 0.0 -45.5Taiwan (China) (13.93) 10.56 10.55 7.72 -0.1 -26.9 -43.2Philippines (3.63) 2.75 2.29 2.01 -16.7 -12.1 -43.1Pakistan (3.81) 2.89 2.53 2.36 -12.4 -6.5 -36.4Korea, Rep. of (11.39) 8.64 8.85 6.09 2.5 -31.2 -29.5Hong Kong (11.21) 8.50 7.90 6.22 -7.1 -21.3 -26.8
(Cont.)

(Table 6 concld.)
Mauritius (0.41) 0.31 0.30 0.30 -3.1 0.0 -24.7Czechoslovakia (0.00) 0.00 0.00 0.00 -24.7 -0.0 -24.7Brazll (2.35) 1.78 1.45 1.38 -18.5 -5.1 -22.6Hungary (0.32) 0.24 0.19 0.19 -20.2 0.0 -20.2El Salvador (0.35) 0.27 0.21 0.21 -19.8 0.0 -19.8China (11.72) 8.88 11.58 7.73 30.4 -33.3 -13.0Uruguay (0.06) 0.05 0.06 0.06 1A.3 0.0 -8.0Germany, E. (0.01) 0.01 0.01 0.01 -1.8 0.0 -1.8Bangladesh (1.29) 0.98 1.02 1.02 4.4 0.0 4.4Costa Rica (0.19) 0.15 0.18 1.18 21.8 -0.0 21.8India (2.34) 1.77 2.66 2.20 50.0 -17.2 24.2United Arab Emirates (0.08) 0.06 0.10 0.10 73.4 0.0 34-'Dominican Republic (0.61) 0.46 0.66 0.66 42.9 -0.3 42.5Sri Lanka (0.82) 0.62 1.15 1.15 83.6 -0.0 42.6Turkey (0.69) 0.52 1.13 1.12 116.9 -0.2 68.2Indonesia (1.62) 1.23 2.26 2.12 83.5 -5.9 72.7Guatemala (0.05) 0.04 0.11 0.11 157.3 0.0 157.3
All Countries Above (100.00) 75.83 67.49 54.33 -11.0 -19.5 -44.3
Rest of the World - 24.17 32.51 45.67 34.5 40.5 46.8
World - 100.00 100.00 100.00 0.0 0.0 0.0
Source: The World Bank computer files on the MFA.
Notes:
a In the denominator, actual shipments from the rest of the world in 1988 are added to actual quota holdings.b Based on 1987-1989 actual average shipments.

43
VI. CONCLUSIONS
Accelerated quota growth is the main device to phaseout the MFA under
both leading proposals, that within the framework of MFA or a transitional
structure based on global quotas. According to the first approach, country
quotas, in the other, global quotas will have to expand in such a way to avoid
a "shock' when they are abolished at the end of the phaseout. To negotiate a
quota growth scenario, the parties need points of departure, such as base year
quota levels, quota growth rates, etc. The guideline in the MFA was a 6 percent
annual quota growth. Developing countries consider this a concession obtained
from industrial markets, and request it as the minimum base year quota growth
rate. In fact, however, there were large variations in quota growth across
products and suppliers, as well as across markets; and on the whole quotas
expanded at a significantly lower rate. For the phaseout, the negotiating
parties may, therefore, consider to allow some differentiation in quota growth
rates, particularly across product categories.
The historical record reveals that growth in highly utilized, i.e.,
filled and binding quotas was significantly lower compared to unfilled quotas.
Phaseout scenarios based on quota growth may have to take into consideration this
distinction to achieve an effective relaxation. In this context, scrapping
unfilled quotas in stages, depending on their utilization record, would hasten
the dismantling of the MFA by allowing the concentration of efforts to deal with
binding quotas.

44
There are some inherent differences in the way an MFA-based versus
a global quota-based phaseout would affect trade during the transitionary period.
One is the obvious fact that a global quota encompasses previously unrestricted
suppliers. Secondly, the first-come-first-serve principle gives a relatively
free hand to the efficient suppliers. Hence whatever happens in terms of losing
or gaining quota allocations due to the shift co the global quota based
structure, on an individual basis, countries may end up increasing their export
volumes and market shares.
Global quotas introduce non-selectivity to the system. While this
is a desirable element from the economic efficiency point of view, it has an
equity aspect. It allows the importing countries to continue exercising their
"historical rights" by determining the volume of trade, while denying (or
diluting) the "guaranteed" market shares of individual exporters. This is a loss
mainly for the inefficient suppliers whose performance is closely related to the
existence of country quotas. Moreover, to the extent that global quotas are
administered by the importing countries (the global basket in the US proposal),
the exporters lose the possibility to appropriate quota rents.
An important distinction is that, while some exporters would be
considerably worse-off under the US proposal based on global quotas, the overall
restrictiveness of this transitory regime is related to (a conservative
interpretation of) its suggested parameters rather than the inherent nature of
this modality. In fact, global quotas could be set up quite generously, with
a significant margin above the current import levels.

45
An MFA-based phaseout is appealing to many developing countries
because, in principle, the "acquired rights" of the exporters can be preserved.
Not for long, however. If the developing countries get their way and extract
an agreement from industrial countries on substantial quota expansions -- which
is necessary for a phaseout -- as the quotas on efficient suppliers become
redundant, quota holdings will be worthless. Interestingly enough, an
accelerated quota growth not differentiated across suppliers, as suggested by
the developing countries, would do exactly that.
We see one important virtue in a phaseout based on the current
structure of the MFA. That is, not only the mechanisms in place are familiar
to the negotiating parties, but so are the magnitudes of most of the parameters
involved. The record on current quota levels, quota growth rates over the last
few years, and their utilization ratios provide a basis for a decision on the
most important elements of this phaseout based on the present structure of the
MFA. If this approach is adopted, however, the parties have to make a concerted
effort to keep in mind that this is not an extension of the MFA, but its
abolition.

46
REFERENCES
Bagchi, Sanjoy (1990), "Textiles in the Uruguay Round: Alternative Modalitiesfor Integration into GATT," Ch. 10 in Hamilton, ed., (1990), pp. 238-262.
Erzan, Refik, Junichi Goto and Paula Holmes (1990), "Effects of the Multi-FibreArrangement on Developing Countries' Trade: An Empirical Investigation,"Ch. 4 in Hamilton, ed., (1990), pp. 46-62.
GATT, various restricted communications of the Contracting Parties submitted tothe Negotiating Group on Textiles and Clothing.
Goto, Junichi (1989), "The Multi-Fibre Arrangement and Effects on DevelopingCountries," The World Bank Research Observer, Vol. 4, No. 2, pp. 203-227.
Hamilton, Carl B., ed., (1990), Textiles Trade and the Developing Countries:Eliminating the Multi-Fibre Arrangement in the 1990s, The World BankWashington, D.C.
Hamilton, Carl B. and Will Martin (1990), "Introduction" to Hamilton, ed.,(1990), pp. 1-7.
Kumar, Rajiv and Sri Ram Khanna (1990), "India, the Multi-Fibre Arrangement andthe Uruguay Round," Ch. 8 in Hamilton, ed., (1990), pp. 182-212.
Raffaelli, Marcelo (1990), "Some Considerations on the Multi-Fibre Arrangement:Past, Present and Future," Ch. 11 in Hamilton, ed., (1990), pp. 263-291.
Sampson, Gary and Wendy Takacs (1990), "Returning Textiles Trade to the NormalWorkings of GATT: A Practical Proposal for Reform," Ch. 12 in Hamilton,ed., (1990) pp. 292-308.
Wolf, Martin (1990), "How to Cut the Textile Knot: Alternative Paths toLiberalization of the MFA," Ch. 9 in Hamilton, ed., (1990), pp. 215-237.
(Disk Grace IV/PHASEOUT.MFA)

ERE Working Paper Series
ContactDO AuthALhnoor Xpapr
WPS469 Modeling Economic Behavior in J. Barry Smith August 1990 M. AbundoPeru's Informal Urban Retail Sector Morton Stelcner 36820
WPS470 What Do Alternative Measures of Alexander J. Yeats August 1990 J. EppsComparative Advantage Reveal 33710About the Composition of DevelopingCountries' Exports?
WPS471 The Determinants of Farm Gershon Feder August 1990 C. SpoonerInvestment and Residential Lawrence J. Lau 30464Construction in Post-Reform China Justin Lin
Xiaopeng Luo
WPS472 Gains in the Education of Peruvian Elizabeth M. King August 1990 C. CristobalWomen, 1940 to 1980 Rosemary Bellew 33640
WPS473 Adjustment, Investment, and the Riocardo Faini August 1990 R. SuguiReal Exchange Rate in Developing Jaime de Meio 37951Countries
WPS474 Methods for Measuring the Effect Anne Maasland August 1990 P. Dixonof Adjustment Policies on Income 39175Distribution
WPS475 Does Divestiture Manter? A Ahmed Galal August 1990 G. Orraca-TettehFramework for Learning from Experience 37646
WPS476 Health Insurance in Sub-Saharan Ronald J. Vogel August 1990 K. BrownAfrica: A Survey and Analysis 35073
WPS477 Private Participation in the Delivery Thelma A. Triche August 1990 M. Dhokaiof Guinea's Water Supply Services 33970
WPS478 Interrelations Among Child Mortality, John Marcotte August 1990 S. CochraneBreastfeeding, and Fertility in John B. Casterline 33222Egypt, 1975-80
WPS479 Conversion Factors: A Discussion Michael Hee August1990 E. Zamoraof Altemate Rates and Corresponding 33706Weights
WPS480 An Evaluation of Neutral Trade Policy Jaime de Melo August 1990 R. SuguiIncentives Under Increasing Returns David Roland-Holst 37951to Scale
WPS481 The Effects of Trade Reforms on James Tybout August 1990 R. SuguiScale and Technical Efficiency: Jaime de Melo 37951New Evidence from Chile Vitorio Corbo
WPS482 Membership in the CFA Zone: Shantayanan Devarajan August 1990 R. SuguiOdyssean Journey or Trojan Horse? Jaime de Melo 37951

PRE Working Paper Seriva
Contactilia ALAho D fbor p afge
WPS483 An Evaluation of the Main Elements Refik Erzan .August 1990 G. Ilogonin the Leading Proposals to Phase Paula Holmes 33732Out the Multi-Fibre Arrangement
WPS484 Stock Markets, Growth, and Policy Ross Levine August 1990 R. Levine39175