Embed Size (px)
Citation preview

Why so idle?Why so idle?
5th Ethiopia Economic Update
Wages and Employment in a Crowded Labor Market
Pub
lic D
iscl
osur
e A
utho
rized
Pub
lic D
iscl
osur
e A
utho
rized
Pub
lic D
iscl
osur
e A
utho
rized
Pub
lic D
iscl
osur
e A
utho
rized


5TH ETHIOPIA ECONOMIC UPDATE
WHY SO IDLE? WAGES AND EMPLOYMENT IN A CROWDED LABOR MARKET
December 19, 2016

iii
ACKNOWLEDGEMENTS ...............................................................................................................................v
LIST OF ABBREVIATIONS ...........................................................................................................................vii
EXECUTIVE SUMMARY ................................................................................................................................ix
RECENT ECONOMIC DEVELOPMENTS AND OUTLOOK ...................................................................... 1The Short View ..........................................................................................................................................................1The Long View: Lessons Learned from Monetary Policy in China (1987–2006)......................................................11The Future View: Challenges and Outlook ..............................................................................................................20
TRENDS AND CONSTRAINTS IN URBAN LABOR MARKETS IN ETHIOPIA ................................... 27Introduction ............................................................................................................................................................27A Profile of the Labor Market in Urban Ethiopia .....................................................................................................29Labor Market Trends ...............................................................................................................................................33Constraints in Urban Labor Markets: Explaining High Unemployment ..................................................................37Short Summary and Recommendations ...................................................................................................................43Annex 1: Ethiopia: Selected Economic Indicators (High Frequency) .......................................................................45Annex 2: Ethiopia: Selected Economic and Social Indicators (Annual Frequency) ...................................................46Annex 3: Self-employment in Urban Labor Markets in Ethiopia .............................................................................49Annex 4: Changes in the Composition of the Labor Force .......................................................................................50Annex 5: What Explains Real Wage Trends ..............................................................................................................52
REFERENCES ................................................................................................................................................... 57
LIST OF FIGURESFigure 1.1: Economic Activity ..................................................................................................................................2Figure 1.2: Monetary Sector .....................................................................................................................................5Figure 1.3: Fiscal Sector ............................................................................................................................................8Figure 1.4: External Sector .....................................................................................................................................10Figure 1.5: Inflation, Broad Money Growth and the Exchange Rate in China ........................................................16Figure 1.6: Drought Assessment .............................................................................................................................23Figure 1.7: Economic Outlook: Selected Projections to 2018 .................................................................................25Figure 2.1: Unemployment and Wages ...................................................................................................................30Figure 2.2: A profile of Urban Labor Markets .........................................................................................................31Figure 2.3: Three Types in Urban Labor Markets ....................................................................................................32
TABLE OF CONTENTS
5TH ETHIOPIA ECONOMIC UPDATE – WHY SO IDLE? WAGES AND EMPLOYMENT IN A CROWDED LABOR MARKETiv
Figure 2.4: Trends in Employment in Urban Ethiopia ............................................................................................34Figure 2.5: A more educated Workforce but little Structural Change ......................................................................35Figure 2.6: Nominal and Real Wage Trends ............................................................................................................36Figure 2.7: Real Wage Trends by sector, Sub-sector and Wage Level ........................................................................36Figure 2.8: Queueing, Temporary Employment and Unemployment .....................................................................38Figure 2.9: Wage Distribution of Workers with Different Education Levels ............................................................39Figure 2.10: Job Search, Constraints, and Vacancies .................................................................................................41Figure A1.1: The Trade-off between Wage and Self-employment, 2014 .....................................................................49Figure A2: An Increasingly Educated Public Sector ................................................................................................51Figure A5.1: Oaxaca Blinder Decomposition of the Real Hourly Wage .....................................................................53Figure A5.2: Labor Costs and labor Productivity in the Manufacturing Sector ..........................................................55
LIST OF TABLESTable 1.1: Comparison of Monetary Policy Instruments in Developing Countries ................................................18Table 1.2: Crop Production All Seasons including Commercial Farms (in Million Quintals) ................................21Table 1.3: Livestock Population Growth in 2015/16 .............................................................................................22Table 1.4: Macro-fiscal Outlook Indicators, 2012 to 2018 ....................................................................................26Table 2.1: City-level Migration Rates and Unemployment (marginal effects) ........................................................43Table A5.2: Earnings and Productivity, Regression Results all Cities ........................................................................56
LIST OF BOXESBox 1.1: Monetary Policy Instruments: Evidence from other Developing Countries ...........................................18Box 2.1: What does Decomposing Wage Trends Entail? ......................................................................................52Box 2.2: Measuring Labor Productivity ..............................................................................................................54
v
ACKNOWLEDGEMENTS
The World Bank greatly appreciates the close collaboration with the Government of Ethiopia (the Ministry of Finance and Economic
Cooperation, in particular) in the preparation of this report. The report was prepared by Michael Geiger (Sr. Economist and Co-TTL), Mesfin Girma (Economist and Co-TTL), Ruth Hill (Sr. Poverty Economist) and Carolina Mejia-Mantilla (Poverty Economist). Contributors to the report were: Zerihun Getachew (Research Analyst), Steven Pennings (Research Economist), and Eyasu Tsehaye (Poverty
Economist). Gelila Woodeneh (Communications Officer) reviewed the document and provided editorial content. Boris Balabanov (Online Communications Associate) designed the report cover. The report was prepared under the overall guidance of Albert Zeufack (Chief Economist for Africa), Kevin Carey (Acting Practice Manager), and Carrie Turk (Country Director). The peer reviewers were: Vinaya Swaroop (Global Lead for Growth and Lead Economist), Dino Merotto (Lead Economist), and Chandana Kularatne (Sr. Economist).

vii
LIST OF ABBREVIATIONS
CBE Commercial Bank of EthiopiaCPI Consumer Price IndexCSA Central Statistical AgencyDBE Development Bank of EthiopiaEDRI Ethiopian Development Research
InstituteEGTE Ethiopian Grain Trade EnterpriseFDI Foreign Direct Investment GDP Gross Domestic Product GoE Government of EthiopiaGTP Growth and Transformation PlanIFC International Finance CorporationILO International Labor OrganizationIMF International Monetary Fund LEAP Livelihood Early Assessment
ProgramNBE National Bank of EthiopiaMAD Mean Absolute Deviation
OMO Open Market OperationsPBC Peoples Bank of ChinaPPP Purchasing Power ParityPSNP Productive Safety Net ProgramPV Present ValueREER Real Effective Exchange RateRMB Yuan RenminbiSOCB State-owned Commercial BankSOE State-owned EnterpriseSSA Sub Saharan AfricaTFP Total Factor ProductivityToT Terms of TradeTVET Technical and Vocational Education
TrainingUEUS Urban Employment and
Unemployment SurveyVAT Value Added Taxy/y Year Over Year


ix
EXECUTIVE SUMMARY
Recent Economic Developments
Strong economic growth continued in 2014/15. While the drought slowed down growth in 2015/16 the economy still expanded by 8 percent, which is a sign of increased economic resilience. The Ethiopian economy grew by 8 in 2015/16 due to the recent drought affecting agricultural production with spillovers on the trade sector. Construction and services sectors account for most of the growth from the supply side. On the demand side, growth is driven by investment followed by private consumption. Economic growth over the past years was accompanied by a reduction of unemployment, although it remained high. Urban unem-ployment in the formal sector declined over the last decade, albeit slowly, and was reduced from 23 percent in 2004 to 17 percent in 2015. The urban economy is dominated by the manufacturing, construction, and services sectors with some unskilled labor migration from rural areas. Chapter 2 of this report will analyze these issues in more detail.
Low inflation is another sign of economic resilience and inflation is remarkable stable; it stood at 5.6 percent in October 2016. While inflation rose temporarily above ten percent over the past year, it is remarkably stable given the recent drought situation. Inflation entered to double digits in June 2015 and increased to 11.8 percent one year ago in October 2015; since then it has declined and reached 5.6 percent in October 2016. Reasons for the relatively low inflationary impact are related to high levels of cereal stock reserves that were used during the drought and increased wheat imports.
The fiscal deficit was virtually unchanged in 2014/15 and 2015/16. The general government fiscal deficit (excluding SOEs) remained modest at 2.4 percent in 2015/16 similar to the preceding year despite spending to finance drought affected areas. An increase in revenue collection, mainly from non-tax sources, compensated the increase in total expenditure and helped to contain the fiscal deficit. An increase in non-tax revenues was the result of larger than expected collection of state dividends from state-owned enterprises and windfall gains to the Fuel Stabilization Fund. On the expenditure side, the general government spend-ing stance was relaxed only marginally in 2015/16 despite additional spending for drought relief and strong capital budget execution.
Exports have had their worst performance in the last decade and the current account balance remained large. The chronic current account deficit (including official transfers) continued to deteriorate in 2015/16. The deficit reached 10.4 percent of GDP in 2015/16 improved slightly from 11.5 percent in 2014/15. This was caused by the large imbalance in import and export of goods and services, which has reached to 19.8 percent of GDP. Goods exports were disappointing due to both volume and price effects in 2014/15—but a slight pick-up in volumes again in 2015/16—and an appreciating real (effective) exchange rate. The downward trend in exports now continues over the last four years. Export of goods dropped by 3.7 percent in 2015/16.
5TH ETHIOPIA ECONOMIC UPDATE – WHY SO IDLE? WAGES AND EMPLOYMENT IN A CROWDED LABOR MARKETx
This is a good moment to re-consider the monetary policy strategy in Ethiopia. First, inflation has come down to below 10 percent levels after relatively high inflation rates between 2011 and 2013. Current success in controlling inflation will keep inflation expectations at bay in the medium-term. Maintaining low levels of reserve money and broad money growth within a clear monetary policy strategy that outlines appro-priate forward-looking institutional reforms would further cement the public’s view of successful fighting of inflation in Ethiopia. Second, an improved monetary policy framework is a prerequisite for an exchange rate regime geared towards more competitiveness. This is to be able to effectively combat any inflationary pressures arising from a devaluing currency. A look at the Chinese experience of monetary policy making (between 1987 and 2006) in Chapter 1 aims to extract lessons for strengthening the current monetary policy set-up in Ethiopia for such a longer-term and low inflation strategy.
A low inflation environment is important to keep real wages stable and ensure that returns on edu-cation in urban labor markets are positive and to avoid the erosion of the purchasing power of wages for workers of all levels of education. Urban labor markets are discussed in detail in Chapter 2. Inflation is an important part of the wage trends observed over time in urban labor markets. High rates of inflation were a factor in the erosion of the value of real wages in the public sector in the past; and it is because of past inflation that nominal wages for public servants had to be adjusted significantly in 2014/15. Given that the public sector is such a major employer this affects the returns on education in urban labor markets, and also seems to have an effect on private sector wages.
Economic Outlook and Challenges
It was to be expected that Ethiopia’s strong economic growth would slow down in 2015/16 due to the recent drought. The drought caused by the El-Niño phenomenon affected the economy negatively through reductions in food production. While there was some uncertainty about the actual impact of the drought, preliminary actual figures from the Government for 2015/16 show now that the growth rate was 8 percent, in line with. With this, the growth impact is lower than originally envisaged; according to Government crop data released by the CSA in July 2016 there was a less than expected agriculture production impact; this is due to good crop production during the second season harvest of 2015/16.
Positive growth moment will still remain. A decade of remarkable double digit growth rates helped the economy to cope well with the most recent challenges encountered in 2015/16. In fact, the ability to keep growth positive is a remarkable achievement for the Government. In similar occasions in the past, for instance in 1997/98 and 2002/03 the country has experienced negative GDP growth. In 1998 growth dropped to –3.5 percent from 3 percent in the previous year. Similarly, in 2003 it dropped to –2.2 percent from 1.5 percent previous year. Medium-term economic growth can be unaffected from the drought since the rains set in normally again in 2016/17. In addition, the completion of the Addis Ababa – Djibouti rail-way line, significantly eases trade logistics related constraints. The commencement of new industrial parks (Hawassa and Bole-Lemi Phase II) and the increasing capacity in power generation with the completion of transmission lines to neighboring countries (Sudan and Kenya) are also expected to improve the export performance and stimulate growth in the short- to medium-term. On the other hand, potential negative economic effects of the current unrest are a risk to the outlook.
Economic growth is still expected to drive further reductions in poverty. Despite the poor rains and the associated lower agricultural production, the overall economic growth effect was modest. And growth

ExEcutivE Summary xi
has been an important driver of poverty reduction in the last decade with each percent of growth reduc-ing poverty by 0.55 percent. Based on this, the proportion of households living below the poverty line of US$1.9 purchasing power parity (PPP) is estimated to decline from its estimated level of 27.2 percent in 2015 to 24.6 percent in 2018.
Yet, poverty may fall less than predicted. This is due to the fact that the areas most badly affected by the drought are the poorest parts of the country. The impact of the inadequate rains has not been equal across the country. The areas most affected are the poorest parts of the country where many households are poor or live just above the poverty line. Drought-induced harvest losses in these areas cause large increases in poverty. The poverty head-count ratio estimate based on growth elasticity does not take such regional variations into account. When district-specific data on estimated crop losses are used, the rate of poverty reduction is potentially slower.
The overvalued real effective exchange rate contributes to the weak export performance. The real effective exchange rate (REER) has appreciated in cumulative terms by 84 percent since the nominal devalu-ation in October 2010. However, the speed of appreciation has slowed down over the past 6 months. While the appreciation between July and August 2015 was 24 percent (y/y), this has slowed to 8 percent in June 2016 (i.e. slowdown in the rate of appreciation). This is primarily the work of two factors: first, a relative decline in the rate of domestic inflation, and second, the depreciation of the U.S. dollar relative to other cur-rencies since January 2016. Since the Birr is pegged against the U.S. dollar the Birr also remained appreciated against other currencies. Still, the Birr remains overvalued, which is hurting international competitiveness. An overvalued currency does not help to improve export competitiveness and is a concern for the economy, especially with exports falling for three consecutive years.
Competitiveness also depends on labor productivity. The analysis undertaken in Chapter 2 shows that increasing labor productivity is key not just for competitiveness, but for making urban labor markets work more efficiently. Productivity of unskilled labor is currently very low, close to the minimum caloric require-ments, so that wages cannot fall to clear the urban labor market.
A Functioning Labor Market for Poverty Reduction and Competitive Export Sectors
Rapid economic growth since 2004 was driven by public infrastructure investment and supported by a conducive external environment; in addition, a modest shift in labor from agriculture to services and construction explains up to a quarter of Ethiopia’s per capita growth over the past decade (World Bank 2015e). But while structural change contributed to economic growth in the past, it was not sufficiently inclusive and needs to contribute much more to poverty reduction in the future. The urban space plays a key role to advance structural change in Ethiopia, as centers of innovation and industrial development. Well-functioning and efficient urban labor markets are a key ingredient for this transformation to take place, and to ensure that its benefits reach all segments of the population. Yet, unemployment in Ethiopia is by and large an urban phenomenon, particularly in Addis Ababa.
Increasing the efficiency of urban labor markets in Ethiopia is not only key for structural trans-formation but also for overall economic development. This Economic Update will describe the nature of urban labor markets in Ethiopia and show how several factors contribute to curb their efficiency. Unemployment levels are high, even among those with limited education. This can be explained in part by low labor productivity in the private sector. Low productivity in the private sector translates into very
5TH ETHIOPIA ECONOMIC UPDATE – WHY SO IDLE? WAGES AND EMPLOYMENT IN A CROWDED LABOR MARKETxii
low wage levels for the less skilled, preventing wages from adjusting to clear the market. These issues are aggravated by the high costs of searching for a job in Ethiopian cities and the rural-urban migration influx. Finally, there is evidence that there are not enough opportunity for those with primary and secondary education in urban Ethiopia.
Understanding the nature of urban labor markets is important for a successful transition to a manufacturing and service-oriented economy and to further reduce poverty. Urban labor markets differ from rural markets in several aspects: in large urban centers, wage employment is more important than self-employment, underemployment is lower but unemployment rates are high (particularly among the young, moderately educated population). Almost half of wage employees are employed by the public sector. The dominant sector in urban areas is the service sector, and it increases in importance among the educated and also in smaller towns. Manufacturing is more important in larger cities and among the unskilled.
Many urban labor market trends are moving in the right direction although there has been little change in the structure of urban labor markets over time. Labor participation is increasing, and unem-ployment and underemployment are falling. Ethiopia’s labor force is becoming increasingly educated. Wage employment is becoming slightly more prevalent, particularly in Addis Ababa. The gender gap in labor participation (13 percentage points) as well as the proportion of wage employment in total employment is similar to countries with similar economic development. New jobs being created equally by the private and public sector and in proportion with the existing sectorial composition of the labor force.
Real wage trends in urban Ethiopia have not reflected the increasing educational quality of the workforce, although improvements were observed from 2012 to 2014. Wages are higher for those with more education—in 2014 wages were more than double for those with a degree compared to those with a secondary education—but returns on education (changes in worker compensation related to worker characteristics such as education) have fallen over the last decade. The decline in wages at the beginning of the decade was somewhat compensated for, although not fully, by increasing wages in the last two years (2012–2014). These changes may in part reflect changes in worker productivity, but they are also likely a reflection of changes in the nominal public sector wage structure, which affects private sector wages given its importance as an employer in urban labor markets.
Unemployment has fallen but remains high. Evidence suggests this is not fully explained by college-educated workers queuing for high quality jobs. There is evidence that while waiting for a high quality job educated individuals take temporary low-skilled jobs to finance the relatively high costs of searching for a permanent job. The temporary jobs that are taken are those that low-skilled individuals would otherwise take contributing to higher unemployment among low-skilled workers. However the magnitude of the crowding out is relatively small and this phenomenon on its own does not explain unemployment entirely. For those with little education, low labor productivity in unskilled jobs causes wages to be low, barely covering basic needs. This prevents wages from falling to fully clear the market.
Higher levels of productivity are needed in low-skilled jobs. Within the unskilled labor segment, increases in productivity are desperately needed in order to ensure that the marginal product of labor increases above the nutrition-based wage. This will ensure that wages can adjust as needed in order to clear the market.
Although jobs are being created faster than growth in the urban workforce, not enough jobs are being created for those with primary and secondary education. By analyzing how the demand for labor compares to the supply of labor in Addis Ababa, it becomes clear that there are not enough job opportunities for those with primary and secondary education levels. This might have been aggravated by the increasing
ExEcutivE Summary xiii
migration from rural to urban areas. Existing data suggests that individuals living in cities with a higher migration are more likely to be unemployed, although this may simply reflect local economic conditions.
There is a need for both faster job creation and investments in skills for non-graduates. More and better job opportunities for those with secondary and primary education are required. This segment of the market is in desperate need of high-productivity employment creation. Although low-skilled workers are more likely to be employed in manufacturing and construction than high-skilled workers, the service sec-tor is still the primary employer of those with little education; growth in the service sector will be needed for job-growth for non-graduates. Investments in skills of those in the job market are also needed. Many employers report delays in finding employees with the right skills and report needing to invest in training. This will likely require investments in on-the-job training as much as in formal training programs.
The high costs associated with job searches also contribute to high unemployment rates. Improving the technology used in job searches can help alleviate the high costs. The nature of the job search—search-ing for vacancies posted on physical job boards at specific points in the city—entails high transportation costs for the unemployed, accounting for almost 25 percent of their monthly expenditure. Increasing access to information on job vacancies throughout the city through the use of technology can reduce the cost of searching. Targeted safety nets and labor market programs can also help reduce unemployment by investing in the skills of the unemployed, funding the cost of search, and improving the quality of matching.
Policy Recommendations
This Economic Update offers five policy recommendations to enhance urban labor markets:
1. Encourage firm creation and firm growth that creates jobs for non-graduates. This will require a focus on growth in services such as hospitality, as well as in construction and manufacturing, areas as these are sectors that are more likely to hire non-graduates. It will also require a focus on interventions that reduce costs associated with hiring non-graduates, such as certification of skills for secondary workers.
2. Increase labor productivity in the low-skill population segment by addressing constraints faced by firms in accessing capital (financial and physical) to ensure that the marginal product of labor increases above the nutrition-based wage.
3. Invest further in job training and technical training programs to build the skills of those in the job market: both for low-skilled workers to increase their productivity and for those with higher levels of education to increase their skill base.
4. Introduce targeted urban safety nets and labor market programs to invest in skills of low-skilled employ-ees and the unemployed, and provide financial support to enable their job search.
5. Enhance the use of ICT to provide information on job vacancies throughout the city and reduce the cost of job search.

1
RECENT ECONOMIC DEVELOPMENTS AND OUTLOOK
1
The Short View
Real Sector
Strong economic growth continued in 2014/15.1
While the drought slowed down growth in 2015/16 the economy still expanded by 8 percent, which is a sign of increased economic resilience. After double digit growth in 2014/15, Ethiopia’s economic growth slowed down in 2015/16 due to the recent drought. Real GDP grew by 8 percent in 2015/16 compared to 10.4 percent growth in 2014/15. Still, Ethiopia’s economy was among the fastest growing in the world showing how well the economy passed through adverse shocks. The growth nevertheless falls short of the Government’s own target set out in the Growth and Transformation Plan II (GTP II), which projected at 11.4 percent. Overall, the five year GTP I period (2010/11 to 2014/15) achieved a very high growth rate of 10.1 percent per year, on average.
When considering the last dozen years since 2004, real GDP growth averaged 10.5 percent. This translated into an average per capita (in dollar terms) growth of 7.9 percent, which is equivalent to the annual per capita growth rate needed for Ethiopia to reach middle-income status by 2025.
The slowdown in the economic activity is mainly explained by lower agricultural produc-tion and associated negative spillovers on other sectors. The drought caused by the El-Niño phenom-enon caused lower crop production during the main (meher) harvest season. Main season grain production declined by 1.3 percent (Figure 1.2), however, recovery in the small (belg) season production compensated the decline and led to the overall crop production growth of 2.4 percent in 2015/16; still, this is significantly lower than the 6.2 percent growth in 2014/15. Yet, actual crop production is much better than what was originally expected at the time of the drought. The drought also affected other sectors indirectly, for instance, trade and hotels.
From the supply side, the GDP growth in 2015/16 is explained by construction and the services sectors. The construction sub-sector con-tributed 2.1 percentage points to growth, while the manufacturing contribution relatively increased to 0.9 percentage points. Within services, trade and hotels, at 2.2 percentage points, were the leading sub-sectors to drive GDP growth (Figure 1.1.1). Services growth is also reflected in the growth of the transport and communication sub-sector with a contribution of 0.7 percentage point of GDP. Ethiopian Airlines
Strong economic growth continued in 2014/15, but the drought slowed down Ethiopia’s growth to 8 percent in 2015/16. Inflation was temporarily back into double digits over the past year—after more than two years in single digit territory—but declined again to 5.6 percent in October 2016. While tight monetary policy continued, which kept non-food price inflation in single digit, food prices are also on the declining trend. On the fiscal side, the general government fiscal policy stance continued to be cautious. Improvements in tax collection pushed government revenues and grants up and the general government spending stance was relaxed only marginally. Goods exports were disappointing (again) in 2014/15 on account of both volume and price effects while volume increase in 2015/16 did not help lower export earnings. Exports thereby continue their downward trend seen over the last three years. The real effective exchange rate continued to appreciate, which hurts the export performance.
1 The Ethiopian Fiscal Year ranges over 12 months from July 8 to July 7. This note draws upon official national accounts data produced by the Government of Ethiopia. The growth rates quoted are expressed in factor prices.

5TH ETHIOPIA ECONOMIC UPDATE – WHY SO IDLE? WAGES AND EMPLOYMENT IN A CROWDED LABOR MARKET2
FIGURE 1.1: Economic Activity1) Real GDP Growth (Supply Side) 2) Crop Production Growth, percent
3) Ethiopian Airlines Activity Growth 4) Real GDP Growth (Demand Side)
2009
/10
2008
/09
2007
/08
2010
/11
2011
/12
2012
/13
2013
/14
2014
/15
2015
/16
Cargo Passengers
2011/12 2012/13 2013/14 2014/15 2015/16
5) Urban Unemployment Rate, percent
0
5
10
15
25
20
–1
1
3
5
7
9
11
2011/12 2012/13 2013/14 2014/15 2015/16
Cereal Pulses Oilseeds Grains
Agriculture Manufacturing ConstructionOther industry Trade & hotel Transport & commun.Other services GDP
–10%
–5%
0%
5%
10%
15%
20%
2008
/09
2009
/10
2010
/11
2011
/12
2012
/13
2013
/14
2014
/15
2015
/16
–5
0
5
10
15
20
25
30
35
40
–10%
–5%
0%
5%
10%
15%
20%
Private Cons InvestmentPublic Cons Net exportStat disc GDP
Apr-
04
Mar
-05
May
-09
May
-10
Mar
-11
Mar
-12
Jun-
13
Apr-
14
Apr-
15
22.920.6 20.4
18.9 18.0 17.516.5 17.4 16.8
2.2 3.1 2.3 2.60.9
0.50.7
0.7 0.8
0.9
1.3
1.91.5
2.2
2.1
0.3
0.2
0.00.1
2.2
2.23.8
3.4
2.2
0.5
0.7 0.60.6
0.7
1.7
1.1 1.51.1
1.1
8.79.9 10.3 10.4
8.0
Source: 1.1; 1.4: MOFED, 1.3: Ethiopian Airlines, 1.2; 1.4: CSA.
rEcEnt Economic DEvElopmEntS anD outlook 3
growth continued with passenger traffic up by 19.5 and cargo services by 12.4 percent in 2015/16 fol-lowing an expansion of its network and improved capacity. (Figure 1.1.3).
On the demand side, investment followed by private consumption accounted for most of GDP growth in 2015/16. (Figure 1.1.4). Total investment contributed 5.9 percentage points to GDP growth in 2015/16, while private consumption growth contribu-tion was 1.5 percentage points. The contribution of public consumption increased significantly (1.0 per-centage point) compared to the previous year which could be a result of the Government’s increased spend-ing to mitigate the effects of the drought. On the other hand, the growth contribution of net export dragged down growth with –0.8 percentage points of GDP as a result of lower export earnings against a fast increase in imports. It is noteworthy that the demand side data consists of large statistical discrepancies in 2014/15 and 2015/16, a factor that was absent in earlier years. It is not clear what is driving this.
Within investment, both private and public sources drove growth rates in 2015/16. This is evi-denced by a variety of indicators: (1) Private invest-ment grew by 25 percent despite public investment declined by 6 percent.2 (2) Domestic credit stock (including credit from the Development Bank of Ethiopia (DBE)) grew by 25 percent in 2015/16. (3) Private transfers (which is a source of private consumption and investment), increased by 0.7 per-centage points of GDP in 2015/16, and the level has reached to its historical average (8.3 percent vs. a decade average of 8.2 percent). (4) Foreign direct investment (FDI) improved increasing from 3.4 to 4.2 percent of GDP in 2015/16 and now reached to US$3.0 billion.
Economic growth over the past years was accompanied by a reduction of unemployment, although it remained high. Urban unemployment in the formal sector declined over the last decade, albeit slowly, and was reduced from 23 percent in 2004 to 17 percent in 2015 (Figure 1.1.5). However, the rate of unemployment is large compared to the Sub-Saharan
Africa (SSA) average of 11 percent, yet better than South Africa (25 percent), Namibia (30 percent) and Botswana (18 percent). More policies are needed to translate the growth dividend into employment gen-eration activities in urban areas. The urban economy is dominated by the manufacturing, construction, and services sectors with some unskilled labor migration from rural areas. Chapter 2 of this report will analyze these issues in more detail.
Monetary Sector
Inflation is remarkable stable given the recent drought and even declining; it stood at 5.6 percent in October 2016. While inflation rose temporarily above ten percent over the past year, it is remarkably stable given the recent drought situation. Inflation entered to double digits in June 2015 and increased to 11.8 percent one year ago in October 2015; since then it has declined and reached 5.6 percent in October 2016. Food inflation, which constituted about 53 percent of the average household consump-tion basket, continued to be a major driver of inflation at 3.4 percent, down sharply from its three-year peak of 16.2 percent in October 2015 (Figure 1.2.1). The food price inflation was originally expected to rise sharply due to expected reductions in crop produc-tion arising from the major drought earlier this year. Reasons for the relatively lower de facto inflationary impact are related to the stabilization of prices through large-scale import of wheat, better balancing of sup-ply and demand through strategic cereal reserves, and tighter monetary policy (see Chapter 1C for details). The global slowdown in commodity prices also con-tributed to lower inflation of tradable goods.
Some food-related commodities still show some inflationary pressures, and non-food prices
2 Data availability limit sectoral decomposition of growth and jobs creation. However, there is evidence from the 2014 Poverty Assessment that over the past decade every percent economic growth reduced poverty by 0.55 percent. But the recent Systematic Country Diagnostic (SCD) found that advances in shared prosperity are less clear cut because the bottom 10 percent of the population have actually not benefitted from growth and poverty reduction and became poorer from 2005 to 2011.

5TH ETHIOPIA ECONOMIC UPDATE – WHY SO IDLE? WAGES AND EMPLOYMENT IN A CROWDED LABOR MARKET4
increased moderately. There were some commodi-ties with inflationary tendencies, including increases in sweets, bread and cereals, meat, dairy products and non-alcoholic beverages, which recorded an inflation rate more than 9 percent and above. On the other hand, oils and fats and the ‘other foods’ cat-egory showed deflationary tendencies over the past five months through October 2016 (Figure 1.2.2). In contrast, non-food inflation was around an aver-age of 8.0 percent in the last twelve months against 7.0 percent in October 2015 (the recent lowest rate). The relative slowdown in non-food inflation is poten-tially supported by the decline in the global price of fuel since January 2015 and a lagged effect of tighter monetary policy over the past year.
A low inflation environment is important to keep real wages stable and ensure that returns on education in urban labor markets are posi-tive. Urban labor markets are discussed in detail in Chapter 2. Inflation is an important part of wage trends observed over time in urban labor markets. High rates of inflation were a factor in the erosion of the value of real wages in the public sector in the past; and it is because of past inflation that nominal wages for public servants had to be adjusted signifi-cantly in 2014/15. Given the public sector is such a major employer—as will be shown in Chapter 2—this affects the returns on education in urban labor markets, and also seems to have an effect on private sector wages. In addition, private sector wages take about five months to adjust to rapid increases in prices and there is limited room for wages to fall at the low end of the market, so high inflation can result in higher unemployment.
Tight monetary policy, measured by reserve money growth, is in line with the NBE annual tar-get and helped to keep non-food price inflation low. Reserve money (the nominal anchor) growth is by and large consistent with the NBE annual growth target of 16 percent. The reserve money growth (annual aver-age of about 10 percent through June 2016) was quite low compared to the estimated nominal GDP growth (18 percent in 2015/16), which helped to stabilize
inflation (Figure 1.2.3). Nonfood inflation is usually affected by the lagged impact of monetary policy and inflation expectations. On the other hand, the real deposit rate remained in negative territory while the real lending rate tends towards zero, following the ris-ing overall inflation trend (Figure 1.2.4).
But broad money is growing relatively faster, and the growth of credit to state-owned enterprises (SOEs) is the major contributor to that effect. Looking at broad money growth, it shows a moderate declining pattern from 30 percent in November 2014 to 20 percent in June 2016, though it still remained high. Net domestic credit growth played a leading role in broad money growth; while public sector credit growth continues to be the main driver (increasing by 22 percent), credit to the private sector picked up to 33 percent in June 2016 but its share remained still low. Domestic credit to the SOEs increased by 18 per-cent (year-on-year) in June 2016 (Figure 1.2.5). The share of public enterprises in total outstanding domes-tic credit slightly moved to 61 percent while the share of private sector credit is 30 percent at the end of June 2016. The share of net central government credit in total domestic credit increased by 2 percentage point to 10 percent (Figure 1.2.6) as the money printing continues in order to finance the budget deficit (see next section, Figure 1.3.2), which has a potential to create inflationary pressure with some lags.
Keeping inflation low in the future requires continued monetary discipline in a coherent, for-ward-looking monetary policy framework. Current success in controlling inflation will keep inflation expectations at bay in the medium-term. Maintaining low levels of reserve money and broad money growth within a clear monetary policy strategy that outlines appropriate forward-looking institutional reforms would further cement the public’s view of success-ful fighting of inflation in Ethiopia. Section B of this Chapter will look at the Chinese experience of mon-etary policy making (between 1987 and 2006) with an aim to extract lessons for strengthening the current monetary policy set-up in Ethiopia for such a longer-term and low inflation strategy.

rEcEnt Economic DEvElopmEntS anD outlook 5
FIGURE 1.2: Monetary Sector
Source: 2.1–2.2: CSA, 2.3–2.4: CSA and NBE, and 2.5–2.6 NBE.Note: 1.6: Monetary survey data is used, which excludes DBE in private credits.
Sep-
09De
c-09
Mar
-10
Jun-
10Se
p-10
Dec-
10M
ar-1
1Ju
n-11
Sep-
11De
c-11
Mar
-12
Jun-
12Se
p-12
Dec-
12M
ar-1
3Ju
n-13
Sep-
13De
c-13
Mar
-14
Jun-
14Se
p-14
Dec-
14M
ar-1
5Ju
n-15
Sep-
15De
c-15
Mar
-16
Jun-
16
2009/10 2010/11 2011/12 2012/13 2013/14 2014/15 2015/16
21 27 2942
52 58 62 64 61
41 37 3221
119 9 8 10
37 36 40 37 37 33 30 28 30
0%
5%
10%
15%
20%1) Inflation (y/y, %) 2) Major Food Items Inflation, (y/y,%)
3) Broad Money, Reserve money & Inflation (%, y/y) 4) Real Interest Rates (%)
2009
/10
2008
/09
2007
/08
2010
/11
2011
/12
2012
/13
2013
/14
2014
/15
2015
/16
5) Broad Money Growth (M2, y/y, %)
General Food Non-food
Net Foreign assets Net Domestic creditOther items (net) Broad money (M2)
SOEs CG credit Private credit
–10%
–5%
0%
5%
10%
15%
30%
25%
20%
6) Composition of Domestic Credit Stock (%)
0%
10%
20%
30%
40%
50%
60%
70%
80%
90%
100%
–50%
–30%
–10%
10%
30%
50%
70%
90%
Sep-
11De
c-11
Mar
-12
Jun-
12Se
p-12
Dec-
12M
ar-1
3Ju
n-13
Sep-
13De
c-13
Mar
-14
Jun-
14Se
p-14
Dec-
14M
ar-1
5Ju
n-15
Sep-
15De
c-15
Mar
-16
Jun-
16
Jun-
10Se
p-10
Dec-
10M
ar-1
1Ju
n-11
Sep-
11De
c-11
Mar
-12
Jun-
12Se
p-12
Dec-
12M
ar-1
3Ju
n-13
Sep-
13De
c-13
Mar
-14
Jun-
14Se
p-14
Dec-
14M
ar-1
5Ju
n-15
Sep-
15De
c-15
Mar
-16
Jun-
16
Reserve money In�ation (y/y)Real maximum lending rate Real deposit rate
Broad money (M2)
–12%–7%–2%
3%8%
13%18%23%28%33%38%43%
–40
–30
–20
–10
0
10
20
Jan-
13
Apr-
13
Jul-1
3
Oct-
13
Jan-
14
Apr-
14
Jul-1
4
Oct-
14
Jan-
15
Apr-
15
Jul-1
5
Oct-
15
Jan-
16
Apr-
16
Jul-1
6
Oct-
16
Jun-
13
Sep-
13
Dec-
13
Mar
-14
Jun-
14
Sep-
14
Dec-
14
Mar
-15
Jun-
15
Sep-
15
Dec-
15
Mar
-16
Jun-
16
Sep-
16
Bread and Cereals MeatMilk, cheese and eggs FruitVegetables Sugar, jam, honey, chocolate

5TH ETHIOPIA ECONOMIC UPDATE – WHY SO IDLE? WAGES AND EMPLOYMENT IN A CROWDED LABOR MARKET6
Fiscal Sector
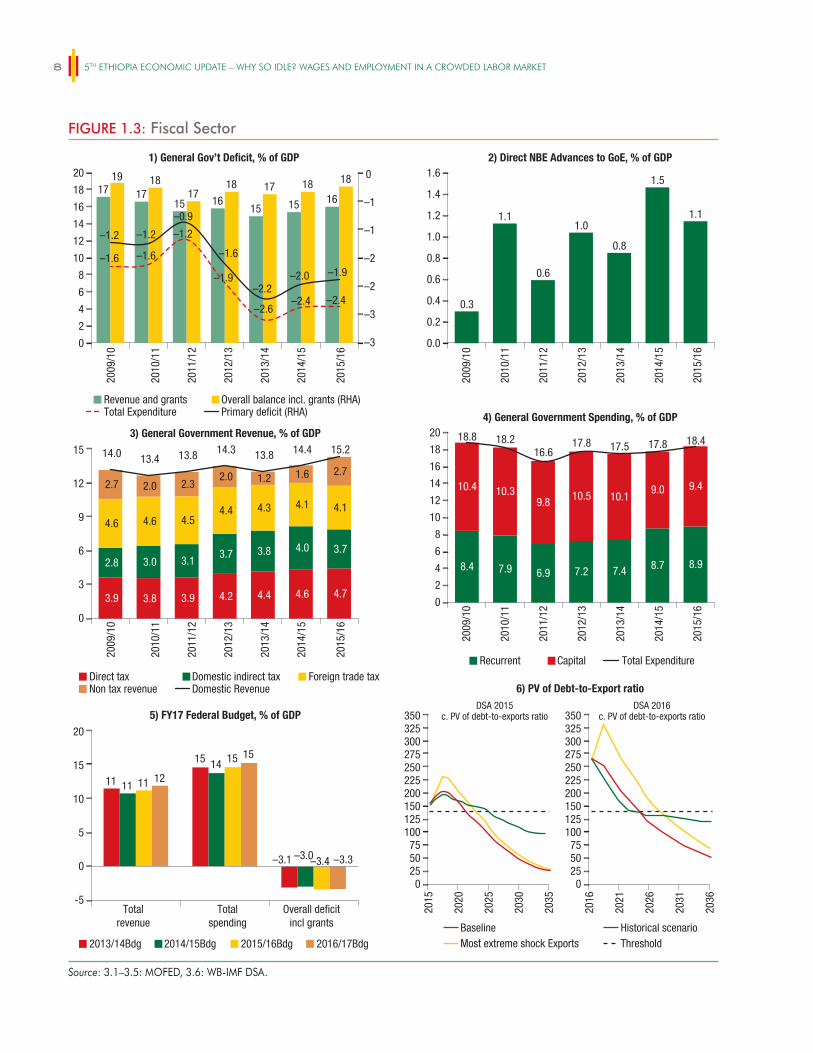
In FY 2015/16, the general government fiscal policy stance continued to be cautious. The general govern-ment fiscal deficit (excluding SOEs) remained modest at 2.4 percent in 2015/16 similar to the preceding year despite additional spending to finance drought affected areas. The deficit level is far lower than the government target of 3.0 percent. An increase in rev-enue collection, mainly from non-tax sources, com-pensated the increase in total expenditure and helped to contain the fiscal deficit (Figure 1.3.1). Looking at the financing side, the deficit was covered by exter-nal and domestic borrowing (1.7 and 1.6 percent of GDP, respectively), and through the repayment of cash balances and residuals (totaling 1.0 percent of GDP). A large portion of domestic financing relied on borrowing from non-bank sources through the sale of T-bills. Direct advances issued from the National Bank to the central treasury slowed down to 1.1 per-cent GDP in 2015/16 from 1.5 percent of GDP in 2014/15 (Figure 1.3.2).
Improvements in non-tax revenue collection pushed government revenues and grants up to 16.0 percent of GDP in 2015/16. This is an increase of 0.6 percentage points from 15.4 percent in 2014/15 (Figure 1.3.3). The general government revenue per-formance showed improvement mainly because of an increase in non-tax revenues. This increase was 1.1 per-centage points of GDP in 2015/16 and the result of larger than expected collection of state dividends from state-owned enterprises and windfall gains to the Fuel Stabilization Fund3 (in the context of declining oil prices since January 2015). Collection from for-eign trade taxes showed no change to 2014/15 at 4.1 while direct taxes increased by 0.1 percentage point to 4.7 percent of GDP. Domestic indirect taxes, however, declined by 0.4 percentage points of GDP mainly on account of low outturn of VAT collection from locally manufactured goods (declined by 16 percent). Products that contributed to the declined VAT collection include fuel products (–5 percent) on account of low oil prices, cotton products (–16 percent) possibly linked to the
drought, non-metallic minerals (–24 percent) as a result of low demand for cement from the construction sec-tor, and machine and spare parts (–36 percent) due to low foreign exchange allocations that constraint input imports. Meanwhile, external grants declined by 0.2 percentage points of GDP in 2015/16.
The general government spending stance was relaxed only marginally in 2015/16 despite addi-tional spending for drought relief. Total expenditure increased from 17.8 to 18.4 percent of GDP from 2014/15 to 2015/16. This is the result of increased in both recurrent expenditure and capital spending. In the middle of the fiscal year, the federal govern-ment approved Birr 18 billion (or US$0.85 billion, or 1.2 percent of GDP) additional budget, of which 82 percent (or US$0.7 billion, or 1.0 percent of GDP) was devoted to support the rural population affected by the drought. The additional budget is financed mainly from the Fuel Stabilization Fund (to the tune of Birr 12.5 billion) and the remain-ing comes from profit and residual surplus of public financial institutions. Under recurrent spending, pro-poor and other sectors (excluding defense and debt service) increased by 0.2 percentage points of GDP. On the other hand, the capital spending-to-GDP ratio rose by about 0.4 percentage points to 9.4 percent in 2015/16. Capital expenditure accounted for more than half of total general government expenditure but showed a relative increase in most of the economic and social sector spending. Among other things, agricul-ture, natural resources/water, and education spending increased by 0.3 percentage points of GDP each while urban development spending increased by 0.2 percent-age points. Yet, road construction spending declined by 0.6 percentage points of GDP in 2015/16.
3 The Fuel Stabilization Fund is a resource collected from the price dif-ferential between the global oil price and domestic prices of fuel. However, there were cases in which the domestic fuel price was kept low relative to global price and the Fund subsidizes through borrowing from the Commercial Bank of Ethiopia (CBE). Currently, the Fund has benefit-ted from global oil prices declines and has accumulated a large sum of money, which is not fully passed through to consumers. The Fund was utilized to cover part of the cost for civil salary increases (Birr 3.0 billion) in 2014/15 and to finance part of the supplementary budget to support drought affected areas (Birr 12.5 billion) in 2015/16.

rEcEnt Economic DEvElopmEntS anD outlook 7
Generally, the gap between recurrent and capital spending has narrowed further since last year to a now almost equal distribution. The gap has narrowed down to 8.9 vs. 9.4 percent of GDP in 2015/16 compared to 7.4 vs. 10.1 percent of GDP in 2013/14, respectively (Figure 1.3.4). The public sec-tor salary increases contributed to the adjustment of the balance between capital and recurrent expenditure where low levels of recurrent expenditure raised some concern over the public sector efficiency, especially in regions. Keeping the balance between recurrent and capital budget is important to meet the running cost of additional capital expenditure of public sector projects, to fund the operations of the exiting produc-tive assets and to ensure effective service delivery in general. Evidence showed that Ethiopia’s r-coefficient4 was falling over time indicating underfunding of recur-rent costs, which raised concern of the sustainability of public sector services [PER 2015].
Looking forward, the federal government bud-get deficit5 envisages a marginal improvement to 3.3 percent of GDP in 2016/17.6 The expenditure budget increase is similar to the increase in revenues as a share of nominal GDP and as a result the deficit remained the same as last year. Federal government revenue and grants reached 11.9 percent of GDP. Total federal gov-ernment expenditure increased to 15.2 percent of GDP. The federal recurrent spending budget accounted for 25 percent while the allocation for federal capital spend-ing budget constituted 39 percent and the remaining 36 percent was allocated towards the regional subsidy. The Federal government budget deficit (3.3 percent of GDP) is expected to be financed through domestic financing of 2.0 percent of GDP and external borrow-ing (mainly concessional) of 1.4 percent (Figure 1.3.5).
Ethiopia’s external debt risk remained at ‘moder-ate’ while vulnerabilities increased in 2015/16. The vulnerabilities of the debt risk arose from the worsening in the fundamentals related to the drought —despite the government’s ability to successfully cope with the drought situation—and the difficult global price envi-ronment for key commodity exports. Exports contin-ued to underperform relative to projections owing to
a weak external environment; and the supply shock from the drought meant foregone agriculture produc-tion to export as well as additional food imports. As a result, debt sustainability indicators have deteriorated on account of poor export performance over the past three years and faster-than-anticipated disbursements of non-concessional loans, contracted during FY13 and FY14. The present value (PV) of debt to export ratio continued to deteriorate in FY 2015 (Figure 1.3.6); in addition, the indicator that shows the debt servic-ing capacity in FY16 came very close to the policy dependent threshold. To enhance debt sustainability, it remains essential to promote the growth and diversifica-tion of exports. Ensuring an appropriate pace of public borrowing—especially from external, non-concessional sources—is also critical to ensuring that public invest-ment does not undermine debt sustainability.
External Sector
The chronic current account deficit continued to be high in 2015/16 mainly due to trade imbalances, but showed a slight improvement. The current account deficit (including official transfers) reached 10.4 per-cent of GDP lower than 11.5 percent in 2014/15. This was caused by the large imbalance in import and export of goods and services, which registered a deficit of 19.8 percent of GDP (Figure 1.4.1). The trade deficit was driven by poor goods & services export performance (dropped by 4.1 percent) and goods and services imports (increased by 2.9 percent). The trade deficit was partially offset by private transfers, one of the larg-est external resources for Ethiopia that increased from 7.6 to 8.3 percent of GDP, official transfers continued to decline from 2.3 to 1.4 percent of GDP in 2015/16 due to fiscal stress in developed countries. The current account deficit (10.4 percent of GDP) was financed
4 r-coefficient is a measure of the annual real O&M expenditure required per unit of additional capital expenditure on a public sector services project or programs.5 This excludes the regional budgets from own sources.6 Applying a nominal GDP growth of 17.8 percent for FY17, which is an estimate by IMF(IMF 2016 Article IV report).
5TH ETHIOPIA ECONOMIC UPDATE – WHY SO IDLE? WAGES AND EMPLOYMENT IN A CROWDED LABOR MARKET8
FIGURE 1.3: Fiscal Sector
Source: 3.1–3.5: MOFED, 3.6: WB-IMF DSA.
1) General Gov’t Deficit, % of GDP 2) Direct NBE Advances to GoE, % of GDP
0
–3
–3
–2
–2
–1
–1
0
2
4
6
8
10
12
14
16
18
20
2009
/10
2010
/11
2011
/12
2012
/13
2013
/14
2014
/15
2015
/16
Revenue and grantsTotal Expenditure
Overall balance incl. grants (RHA)Primary de�cit (RHA)
0.0
0.2
0.4
0.6
0.8
1.0
1.2
1.4
1.6
2009
/10
2010
/11
2011
/12
2012
/13
2013
/14
2014
/15
2015
/16
3) General Government Revenue, % of GDP4) General Government Spending, % of GDP
2009
/10
2010
/11
2011
/12
2012
/13
2013
/14
2014
/15
2015
/16
Direct taxNon tax revenue
Domestic indirect taxDomestic Revenue
Baseline Historical scenarioMost extreme shock Exports Threshold
Foreign trade taxRecurrent Capital Total Expenditure
2009
/10
2010
/11
2011
/12
2012
/13
2013
/14
2014
/15
2015
/16
0
3
6
9
12
15
2
4
6
8
10
12
14
16
18
20
0
5) FY17 Federal Budget, % of GDP
6) PV of Debt-to-Export ratio
2013/14Bdg 2016/17Bdg2014/15Bdg 2015/16Bdg
100755025
125150200
DSA 2015c. PV of debt-to-exports ratio
DSA 2016c. PV of debt-to-exports ratio
225250275300325350
0-5
0
5
10
15
20
Totalrevenue
Totalspending
Overall de�citincl grants
2015
2020
2025
2030
2035
100755025
125150200225250275300325350
0
2016
2021
2026
2031
2036
0.3
1.1
0.6
1.0
0.8
1.5
1.1
11
15
–3.1
11
14
–3.0
11
15
–3.4
12
15
–3.3
17 1715 16
15 15 16
19 1817
18 17 18 18
–1.2
–0.9
–1.6
–1.2
–1.6
–1.2
–1.9
–1.6
–2.6–2.4 –2.4
–2.2–2.0 –1.9
3.9 3.8 3.9 4.2 4.4 4.6 4.7
2.8 3.0 3.1 3.7 3.8 4.0 3.7
4.6 4.6 4.5 4.4 4.3 4.1 4.1
2.7 2.0 2.3 2.0 1.2 1.6 2.7
14.0 13.4 13.8 14.3 13.8 14.4 15.2
8.4 7.9 6.9 7.2 7.4 8.7 8.9
10.4 10.39.8 10.5 10.1
9.0 9.4
18.8 18.216.6
17.8 17.5 17.8 18.4
rEcEnt Economic DEvElopmEntS anD outlook 9
largely by external borrowing especially by SOEs and improved FDI inflows (4.2 percent) as well as draw-down of the foreign exchange reserve accumulations of 1.3 percent. Foreign exchange reserves reached to US$3.5 billion at the end of August 2016 supported by a central bank deposit from Saudi Arabia of US$1 billion in December 2015 (Figure 1.4.2). But the exter-nal sector is still vulnerable to terms of trade shocks, which need to be carefully managed.
Goods exports were disappointing (again) in 2015/16 thereby continuing their downward trend seen over the last four years as a result of price effects while volume recovered moderately. Export of goods dropped by 3.7 percent in 2015/16 as a result of a drop by 9.6 percent in the export price index, while the volume index increased by 5.4 percent (Figure 1.4.3). Service export declined by 4.5 percent primarily due to lower performance in travel and government service while transportation service increased by 2.0 percent with an improvement in the number of passengers and cargo services of Ethiopian Airlines despite rela-tively lower ticket prices in an environment of lower global fuel prices. In term of major export products, coffee value declined by 7.4 percent due to a decline in the price of Coffee Arabica, though the volume of exports increased by 8.0 percent in 2015/16. Gold exports declined by 9 percent because of low inter-national prices and a reduction in volume exported. Oilseeds, chat, and leather declined by 6.4, 12.4 and 3.7 percent, due to lower prices, volume decrease, and decline in both, respectively. Horticulture (flower and fruits, and vegetables) exports increased as a result of better prices and volume than last year. Overall, since 2010/11, Ethiopian exports have been on a declining path in percent of GDP (Figure 1.4.4).
Declining exports to China, Ethiopia`s major export destination since 2004, are cause of par-ticular concern. Export to China has been growing sharply since 2004, but recently slowed down. The average growth rate of exports to China was 85 per-cent between 2001 and 2014 compared to 134 per-cent between 2005 and 2009, and just 19.5 percent between 2010 and 2014. Although there is a declining
trend, it is important to note that the high growth rate between 2005 and 2009 was to a large extent due to an extraordinary increase in sesame (oil seeds) export in 2009 of 230 percent. Most recently, overall export values to China have declined by 52 percent y/y in the first half 2015/16 (vs. the first half 2014/15).
Continued growth in goods imports contrib-uted to the deteriorating current account balance in 2014/15, but the rate of increase as slowed markedly in 2015/16. Imports of goods increased by 20 percent in 2014/15, but growth has slowed to only 1.6 per-cent in 2015/16. The primary driver in 2015/16 was the 17 percent increase in consumer goods imports while capital goods imports stagnated (declined by 1 percent) that are associated with large public sector infrastructure investment activities. In terms of share in GDP, capital goods imports accounted for 9.4 per-cent of GDP, and consumer goods imports represented 7.3 percent; fuel imports bill were 1.9 percent of GDP in 2015/16 down from 4.6 percent in 2013/14 due to the declined oil prices (Figure 1.4.5). It is obvious that the total exports of goods and services cannot cover the cost of consumer goods and fuel imports. While the fuel cost was lower compared to the previous years the drop was insufficient to improve the current account deficit. Services import marginally decreased from 4.8 percent to 4.7 percent of GDP in 2015/16.
The overvalued real effective exchange rate contributes to the weak export performance. The real effective exchange rate (REER) has appreciated in cumulative terms by 98 percent since the nominal devaluation in October 2010. However, the speed of appreciation has slowed down over the past 6 months. While the appreciation between July and August 2015 was 24 percent (y/y), this has slowed to an average of 7.5 percent in March-June 2016 (i.e. slowdown in the rate of appreciation). This is primarily the work of two factors: first, a relative decline in the rate of domestic inflation, and second, the depreciation of the U.S. dollar relative to other currencies since January 2016. Since the Birr is pegged against the U.S. dollar the Birr also remained appreciated against other currencies. Still, the Birr remains overvalued, which is hurting

5TH ETHIOPIA ECONOMIC UPDATE – WHY SO IDLE? WAGES AND EMPLOYMENT IN A CROWDED LABOR MARKET10
FIGURE 1.4: External Sector
Source: 4.1–4.5: NBE and MOFED, 4.6: WB based on IMF source.
0.0
5.0
10.0
15.0
20.0
25.0
30.0
35.0
2009
/10
2010
/11
2011
/12
2012
/13
2013
/14
2014
/15
2015
/16
Capital goods Consumer goods FuelIntermediate goods Others Service imports
1. External Current Account Balance, % of GDP 2. Gross Official Foreign Exchange Reserves
Private transfers Official transfersLoans Change in reserves
FDI CAB/GDPTrade balance G&S
Foreign Reserve (mill $) Reserve in months of import (right axis)
–25
–20
–15
–10
–5
10
15
20
2008
/09
2009
/10
2010
/11
2011
/12
2012
/13
2013
/14
2014
/15
9.0 8.6 7.5 7.5 7.3 7.6 8.3
6.4 5.84.1 3.2 2.6 2.3 1.4
3.2 3.92.5 2.6 2.6 3.4 4.22.4 4.2 4.8
8.2 4.42.3 1.3
–5.3–7.9 -
–11.5 –10.4–6.5
–4.3–0.7–4.0
–1.0 –0.2 –0.1 –1.2
–19.2–14.9
–17.9 –16.4 –17.6–21.0 –19.8
1.0
1.5
2.0
2.5
3.0
3.5
0
500
1000
1500
2000
2500
3000
3500
4000
4500
Jan-
10
Jun-
10
Nov-
10
Apr-
11
Sep-
11
Feb-
12
Jul-1
2
Dec-
12
May
-13
Oct-
13
Mar
-14
Aug-
14
Jan-
15
Jun-
15
Nov-
15
Apr-
16
3. Growth in Export of Goods 4. Export of Goods and Services, % of GDP
Value growth Price growth Volume growth Service export Goods export
–20
–10
0
10
20
30
40
50
2004
/05
2005
/06
2006
/07
2007
/08
2008
/09
2009
/10
2010
/11
2011
/12
2012
/13
2013
/14
2014
/15
2015
/16
2008
/09
2009
/10
2010
/11
2011
/12
2012
/13
2013
/14
2014
/15
2015
/160.0
2.0
4.0
6.0
8.0
10.0
12.0
14.0
16.0
18.040.4
18.7 18.723.1
38.4 37.1
14.8
5.6
–1.0–2.3 –8.6 –4.7
6.0 6.8 8.16.5 6.0 5.7 4.8 4.1
4.5
6.7
8.6
7.36.5 5.9
4.64.0
5. Import of Goods and Service, % of GDP 6. Nominal and Real Effective Exchange Rate
70
90
110
130
150
170
190
210
Dec-
99Ju
n-00
Dec-
00Ju
n-01
Dec-
01Ju
n-02
Dec-
02Ju
n-03
Dec-
03Ju
n-04
Dec-
04Ju
n-05
Dec-
05Ju
n-06
Dec-
06Ju
n-07
Dec-
07Ju
n-08
Dec-
08Ju
n-09
Dec-
09Ju
n-10
Dec-
10Ju
n-11
Dec-
11Ju
n-12
Dec-
12Ju
n-13
Dec-
13Ju
n-14
Dec-
14Ju
n-15
Dec-
15Ju
n-16
9.6 8.6 6.8 7.5 8.7 10.7 9.4
8.47.2 8.2 7.2 6.7
7.0 7.3
4.45.2 4.9 4.5 4.6 3.2
1.9
4.84.4 5.0 4.0 4.3 4.3
4.2
0.40.4 0.7 0.8 0.4 0.4
0.3
5.1 5.7 6.14.8 4.4 4.8
4.7
Nov. 2008 148
Oct-10, 86
Jun-16, 170

rEcEnt Economic DEvElopmEntS anD outlook 11
exchange sales (IMF 2013). A key reason for the lim-ited use of indirect instruments is the underdeveloped interbank market and the fact that nominal interest rates are centrally fixed (IMF 2014), both of which make indirect liquidity management between banks an impossibility. Hence, the NBE currently relies first and foremost on direct monetary policy interventions, while trying to develop the institutional foundation for a more indirect monetary policy approach going forward. The International Monetary Fund (IMF) rec-ommended in 2014 that the NBE should focus more on using indirect monetary policy instruments for its monetary targeting approach and noted that flexibility of nominal interest rates would be a precondition to pursue such a step (IMF 2014).
This is a good moment to re-consider the mon-etary policy strategy in Ethiopia. First, inflation has come down to below 10 percent levels after relatively
international competitiveness. An overvalued currency does not help to improve export competitiveness and is a concern for the economy, especially with exports falling for three consecutive years.
Maintaining a competitive exchange rate is an important component of maintaining external competitiveness. Compared to its structural and aspirational peers,7 Ethiopia’s REER saw substantial appreciation and is overvalued, causing a steady loss of competitiveness over the past year. This stands in stark contrast to the experience of East Asian countries (including China), which pursued systematic under-valuation during periods of rapid growth, but broadly in line with those of Latin American economies, which adopted overvaluation with far less success. A recent World Bank study shows that a 1 percent real deprecia-tion increases total exports by 0.5 percent and reduces total imports by 0.6 percent. Disaggregation of exports reveals that a 1 percent real devaluation increases man-ufacturing and agricultural exports by about 1.06 and 0.33 percent, respectively (Haile 2015c).
Competitiveness also depends on labor pro-ductivity. The analysis undertaken in Chapter 2 shows that increasing labor productivity is key not just for competitiveness, but for making urban labor markets work better. Productivity of unskilled labor is currently so low that wages cannot fall to clear the urban labor market.
The Long View: Lessons Learned from Monetary Policy in China (1987–2006)8
Introduction
Ethiopia’s current monetary policy approach is anchored around reserve money growth and characterized by limited use of indirect monetary policy instruments. According to the NBE, the cen-tral bank’s suit of monetary policy tools is currently focusing on reserve requirement ratios; sales of foreign exchange; T-bills sales through reserve money; and adjustments to the interest rate. In practice, the focus of operations is on reserve requirements and foreign
7 Ethiopia’s structural peers (Uganda, Tanzania, Mozambique, and Kenya) are countries that share similar structural features, while its aspirational peers (Ghana, Zambia, Bangladesh, Cambodia, and Vietnam) are those that set a good development precedent and that the country may aspire to emulate. For more details see World Bank (2016 forthcoming: ‘Ethiopia: Systematic Country Diagnostics’).8 This section is building on work carried out by Steven Pennings (Re-search Economist, DECMG) in 2015 to inform the design of a study tour of the National Bank of Ethiopia to China in June 2015 to gain insights on the transition of monetary policy of the People’s Bank of China.
Ethiopia faces a number of challenges in the implementation of monetary policy as it implements a strategy that relies on public investment to close a large infrastructure gap aimed at triggering an export-led growth model. China has faced similar challenges since the 1980s. This section reviews the monetary policy experience of China when it was at a similar level of development following a similar growth strategy during the period from 1987 to 2006. The note finds that China had great success in stabilizing inflation once it implemented institutional reforms in the mid-1990s. After a large devaluation in 1994, the stable peg against the U.S. dollar acted as a nominal anchor. From the late-1990s, China was increasingly active in conducting open market operations (OMO), though it complemented OMOs with quasi-direct instruments (window guidance) and rule-based instruments (reserve requirements). Other developing countries have relied less on direct instruments than China, but also use a combination of rule-based and market-based instruments.
5TH ETHIOPIA ECONOMIC UPDATE – WHY SO IDLE? WAGES AND EMPLOYMENT IN A CROWDED LABOR MARKET12
banks. State-owned banks, which mainly focus on financing large enterprises, constitute 70 percent of total assets of the banking sector and are dominating the credit market share of lending. The government-owned CBE is the dominant commercial bank and accounts for 60 per-cent of total assets of banks as of June 30, 2015. The share of private banks assets to total assets of the banking sec-tor declined from 36 percent in 2008/09 to 30 percent in Q3 2015. Domestic credit to private sector as a ratio of GDP was estimated around 18 percent below the Sub-Saharan Africa average of 30 percent in 2013. Total outstanding credit of the banking system—excluding credit to Government and interbank lending—reached ETB 205.7 billion/approx. US$10 billion at the end of March 2015,10 a 26.2 percent increase compared to the previous year. Finally, the banking sector in Ethiopia remains closed to foreign banks.
Banks are profitable and well-capitalized although liquidity is a concern. The Ethiopian banking sector continues to show favorable aggregate indicators: in March 2015 the average risk weighted, system-wide capital adequacy ratio was 16.6 percent (double the minimum requirement); profitability was robust (with return on assets (ROA) at 3 percent and return on equity (ROE) at 45 percent, well above regional averages); and the non-performing loan ratio was only 2.4 percent. However, no Financial Sector Assessment Program (FSAP) has been conducted in Ethiopia and the absence of detailed bank data pre-cludes the assessment of potential vulnerabilities in individual banks.
The minimum deposit rate, regulated by NBE, has remained constant for the past five years at 5 percent. The lending rate to final borrowers is fully liberalized, but has been relatively unchanged over the same period with minimum and maximum observed
9 In 2006, China’s GDP per capita was US$2,000, more than 6 times that of Ethiopia currently (all figures are GDP per capita in constant 2005 U.S. dollars). The end date also reflects information. In the early 1980s, there is no inflation for China, and prices (and other parts of production) are sufficiently controlled to make comparisons difficult. Note that aspects of monetary policy may have changed in the 2007–14 period, but these are not the focus of the study.10 FX Rate as of 3/31/15: US$1 = ETB 20.43. Source: www.xe.com.
high inflation rates between 2011 and 2013. Current success in controlling inflation will keep inflation expectations at bay in the medium-term. Maintaining low levels of reserve money and broad money growth within a clear monetary policy strategy that outlines appropriate forward-looking institutional reforms would further cement the public’s view of successful fighting of inflation in Ethiopia. Second, an improved monetary policy framework is a prerequisite for an exchange rate regime geared towards more competitive-ness. This is to be able to effectively combat any infla-tionary pressures arising from a devaluing currency.
In search for lessons to guide Ethiopia in tran-sition from a directly controlled monetary policy approach towards a more indirect strategy, this section studies the performance of Chinese mon-etary policy in the 20 years from 1987 to 2006. The Chinese experience during this period is relevant for Ethiopia because of the two countries’ similar level of per capita GDP (US$550 in Ethiopia currently, US$400 in China in 1987), and a common public investment-led growth strategy combined with a developing financial market dominated by state-owned banks. By the mid-2000s, China could be considered a middle-income country, and so its experiences may be less relevant for a low-income country like Ethiopia.9
Current Situation in Ethiopia’s Financial Sector
Ethiopia’s financial sector is dominated by the bank-ing sector (commercial banks). The banking sector currently represents more than 92.6 percent of total assets of the financial sector, excluding the assets of the Development Bank of Ethiopia (DBE) and National Bank of Ethiopia (NBE). Microfinance institutions (MFIs) constitute 5.2 percent and insurance compa-nies 2.2 percent of the total financial sector assets. The Ethiopian financial sector consists of two public banks (i.e. the DBE and the Commercial Bank of Ethiopia (CBE)), 16 private banks, 17 insurance companies, 33 MFIs, and five capital goods finance companies.
The banking sector is operated exclusively by domestic banks and dominated by state-owned
rEcEnt Economic DEvElopmEntS anD outlook 13
lending rates unchanged at 7.5 and 16.25 percent, respectively. For banks to increase their lending in sup-port of structural transformation, they need to extend the average maturity of their deposit base. Longer-term deposits currently only account for 11 percent of the deposit base. Banks pay about 10 percent on longer-term deposits, roughly twice the interest rate on savings accounts. However, even these higher rates do not ensure a positive real rate of return on deposits. In addition, depending on the actual nominal lend-ing rate which currently fluctuates between 7.5 and 16.25 percent, the real interest rate might be positive or negative given the headline inflation of 11.8 percent as of July 2015.11
Despite significant improvement in outreach led by the expansion of the banks’ branch network in the past year, penetration of regulated financial institu-tions remains very limited, particularly in rural areas. The number of bank branches in Ethiopia increased to 2,636 as of March 2015 and, according to GTP II tar-gets, is supposed to double by 2020. Nevertheless, the country lags behind the regional trends with only 2.9 bank branches per 100,000 adults and only 0.3 ATMs per 100,000 adults compared to the SSA average of 4.5 and 3.4, respectively. While around 80 percent of the population lives in rural areas, access points remain con-centrated in the capital city; 35.4 percent of total bank branches and 53.4 of insurance companies’ branches are located in Addis Ababa. Thus, the long distances to regulated financial institutions present a barrier to account ownership for the rural population.
Overview of Institutional Monetary Policy Reforms in China
China was able to change from a high and vola-tile to a low and stable inflation environment between the 1980s and 1990s driven by reforms in the operational independence of the People’s Bank of China (PBC). In the late 1980s and early 1990s, China experienced high and volatile infla-tion—reaching 19 percent in 1988 and 24 percent in 1994 (Figure 1.5.1). However, inflation fell over the
1995–1998 period, and has been low and relatively stable ever since. This change in fortunes, and the ability to keep the inflation rate under control for an extended period of time was made possible by a number of reforms in the mid-1990s which allowed the People’s Bank of China (PBC) to move towards greater operational independence with a greater focus on inflation as well as significant changes in China’s exchange rate policy (next section).
Important institutional reforms towards more operational independence included establishing the PBC as its own entity under the state council (1995) and to end the credit plan (1998). First, March 1995 saw the establishment of the PBC as its own legal entity, reporting to the State Council. This, and earlier reforms (in December 1993), clari-fied that the PBC’s primary goal was to maintain the value of the currency (which would in turn promote growth). With this, the PBC was better able to pur-sue its monetary policy objectives, such as monetary growth targets (first set up in 1994).12 According to Montes-Negret (1995), over the 1979–1993 period monetary policy was subordinate to fiscal policy which led to monetary financing of the deficit, contributing to high and volatile inflation.13 Second, 1998 saw the end of the credit plan in China, and a move towards open market operations. Prior to this, the credit plan involved centrally allocated, bank-by-bank, quanti-tative credit controls. Montes-Negret (1995) argues that the growth and investment goals set by the State Planning Commission often required credit growth larger than the deposit base, leading to excessive
11 According to IMF Article IV Consultation Press Release from Sep-tember 2015, the reported headline inflation was a result of rising food prices due to below average rainfall, while non-food inflation was ap-proaching 10 percent.12 Reform of the PBC goals occurred i n several steps around 1993–95. Up until 1993, the PBC was responsible for both the promotion of economic growth and currency stability (Laurens and Maino 2007).13 Note that the PBC independence bill of 1995 was highly controversial: one-third of the delegates of the National People’s Congress abstained or voted against the 1995 Central Bank Law (Li 1996). However, inflation was also deeply unpopular, contributing to Chinese political instability in the late 1980s.
5TH ETHIOPIA ECONOMIC UPDATE – WHY SO IDLE? WAGES AND EMPLOYMENT IN A CROWDED LABOR MARKET14
lending by the PBC, increasing monetary supply growth and fueling inflation.
While the PBC was much more independent after the 1995 reform, it was far from fully legally or operationally independent; still reforms had their effect. From a legal perspective, most policy decisions still required the approval of the State Council. In fact, only 2 out of 7 monetary policy instruments in use in the period considered did not require State Council approval (Geiger 2010). More broadly, state-owned enterprises (SOE) and state-owned commercial banks (SOCB) were still under the influence of government policy (discussed fur-ther below), and this ensured a way for the govern-ment to pursue its priorities, practically limiting the PBC’s independence. Yet, the reforms had the effect of stabilizing money supply growth, which reduced the rate and volatility of inflation. As Figure 1.5.2 shows, the annual correlation between inflation and money supply growth is 0.56 over 1987–2006 (0.52 over 1987–2013), so to a large extent inflation is a monetary phenomenon.
The Exchange Rate
Changes in China’s exchange rate policy played an important complement to institutional reforms. And in fact, the early 1990s saw a significant change in exchange rate policy, with two main components: (i) a depreciation of the official exchange rate against the U.S. dollar by 33 percent14 in 1994 (Figure 1.5.3), and (ii) a harmonization of the market-based “swap center” exchange rate and the official exchange rate (Mehran et al. 1996). In 1993, around 80 percent of foreign exchange transactions were conducted in “swap centers” in different regions of China (Xu 2000), and the swap rate was much higher than the official rate—and had been so since the mid-late 1980s (Mehran et al. 1996, Chart 12). The large 1994 devaluation was not the first: the Yuan Renminbi (RMB) was devalued by 21 percent in December 1989, and by 17 percent over 1990–93 in a number of smaller steps. These devaluations were smaller than
the change in the consumer price index (CPI) over the previous couple of years and the inflation gap with the United States, and so aimed to bringing the real exchange rate closer to its equilibrium value rather than undervaluing it.15
The devaluation set the stage for a fixed exchange rate to serve as a nominal anchor for China over the following decade. The rate was estab-lished at around 8.3RMB/US$. The size of the 1994 devaluation also helped in stabilizing the RMB: after the 1994 devaluation, the RMB actually appreciated slight against the dollar over the following two years, reversing the trend of regular devaluation since 1980. The stabilization of the RMB no doubt had the effect of lowering (and stabilizing) inflation expectations, which had been building in response to the inflation outbreaks of late 1980s and early 1990s. Together with the institutional reforms described earlier in this sec-tion, the exchange rate policy of the early 1990s was able to lay the foundation for remarkable inflation stability over the next decade.
Policies to Combat the Inflation Outbreaks in the Late 1980s and Early 1990s16
The increase in inflation in China in the late 1980s stemmed from the relaxation of some credit quotas and the decentralization of decision-making about regional lending. Credit and money growth increased to around 30 percent in 1986. Banks lent out excess reserves, further increasing monetary growth in 1987. The credit plan constrained the PBC’s ability to rein in lending. In 1988–89, with inflation at 25 percent, the PBC raised reserve requirements (from 10 to 13 per-cent), credit plan quotas were more strictly enforced,
14 Source: World Development Indicators (Series DI: PA.NUS.FCRF). The depreciations reduced the value of 1 RMB from US$0.17 to US$0.12 (33%) from 1993–94. Some commentators measure the depreciation in terms of the increase in RMB/US$ rate: a 50% increase from 5.8 to 8.6. These are equivalent.15 The growth rate of the GDP deflator for China was much lower than that of the CPI, so movements in the CPI-based real exchange rate and GDP–deflator based real exchange rate will differ. Another key reform in 1994 was the centralization of foreign exchange trading in Shanghai.16 This section draws on Mehran et al (1996).
rEcEnt Economic DEvElopmEntS anD outlook 15
interest rates were raised17 and PBC credit to banks was reduced. This resulted in a fall in the rate of money growth to 3 percent in 1990.
The relaxation of anti-inflation policies in the early 1990s was the primary driver for excessive money supply growth and inflation in 1993 and 1994. More relaxed anti-inflation measures combined with other liberalization efforts that increased invest-ment expenditure, a real estate boom, an increase in food prices (and other administered prices) and PBC lending to the public sector resulted in excessive money supply growth and inflation. The PBC responded by reducing central bank credit to banks, recalling loans made “illegally,” recalling overdue loans, increasing interest rates, and attracting greater deposits.
Monetary Policy Transmission and Financial Sector Development
The transmission of monetary policy through indirect instruments requires that: (i) bank credit be sensitive to the availability and price of credit in the money market, and (ii) economic decisions by firms be influenced by the availability and price of bank credit.18 In China in the 1990s and 2000s, both components of the transmission mechanism were weakened by a lack of separation of policy and commercial lending, excess bank reserves, and a lack of competition. This section first provides some back-ground on the development of financial markets in China and associated reforms, and then discusses the effect on monetary policy transmission.
Before the start of the transition in the early 1980s, the PBC was the only bank in China, and was really an arm of the Ministry of Finance and State Planning Commission. In 1983/4 the PBC was established as the central bank, and four State Owned Specialist Banks were established, provided a mix of policy and commercial loans to different sectors (Cheng and Cheng 1998). However, the combination of policy and non-policy functions weakened account-ability, resulting in excess lending (including from the PBC as described above), as well as a high share
of non-performing loans. Recognizing this problem, reforms in 1994 transformed these four banks into State-Owned Commercial Banks (SOCB), and also created three policy banks (for development, agricul-ture, and export promotion).
Despite reforms, the State-Owned Commercial Banks did not become purely commercial (Cheng and Cheng 1998). Among other things, SOCBs pro-vided credit to loss-making state-owned enterprises and favored investment projects. For SOCBs, this meant providing loans regardless of cost in the money market. For SOEs, the repayment requirements were soft, and so the exact interest rate and terms offered were less relevant for investment and production decisions. As pointed out by Green (2005), the low ability of SOCB employees to price risk meant that banks were unable to turn variations in the cost of finance into changes in commercial loan availability. Given that banks often had effective monopolies in their areas of lending, there was little commercial pressure to become more respon-sive to the cost and availability of funds (Green 2005).
That period also saw high levels of excess reserves, a key symptom of a weak interbank market. Excess reserves apply both to SOCBs and also non-state-owned banks. Green (2005) reports that in the early-mid 2000s, excess reserves fluctuated between about 3.5 and 6.5 percent. One of the key instruments of the PBC was to change reserve requirements, but these would have little impact since those reserve requirements were not binding. Green (2005) argues that banks had excess reserves because: (i) large inflows of liquidity in the mid-2000s related to the [possibly] undervalued exchange rate, (ii) a lack of alternative safe investments (for example, corporate bonds), (iii) interest paid on excess reserves at the PBC, and (iv) regulations that
17 As open market operations had not yet been introduced, this higher interest rate may have applied to direct lending by PBC to state-owned enterprises as well as lending by commercial banks.18 The transmission mechanism of monetary policy can also occur through other channels (consumer borrowing and saving, asset prices, exchange rate movements, etc.), but Mishra et al. (2012) argue that in developing countries, the bank lending channel is likely to be the dominant one (at least in relative terms). In China during the period of study, credit was generally not available to individuals (Green 2005) and the exchange rate was fixed, further weakening these secondary channels.
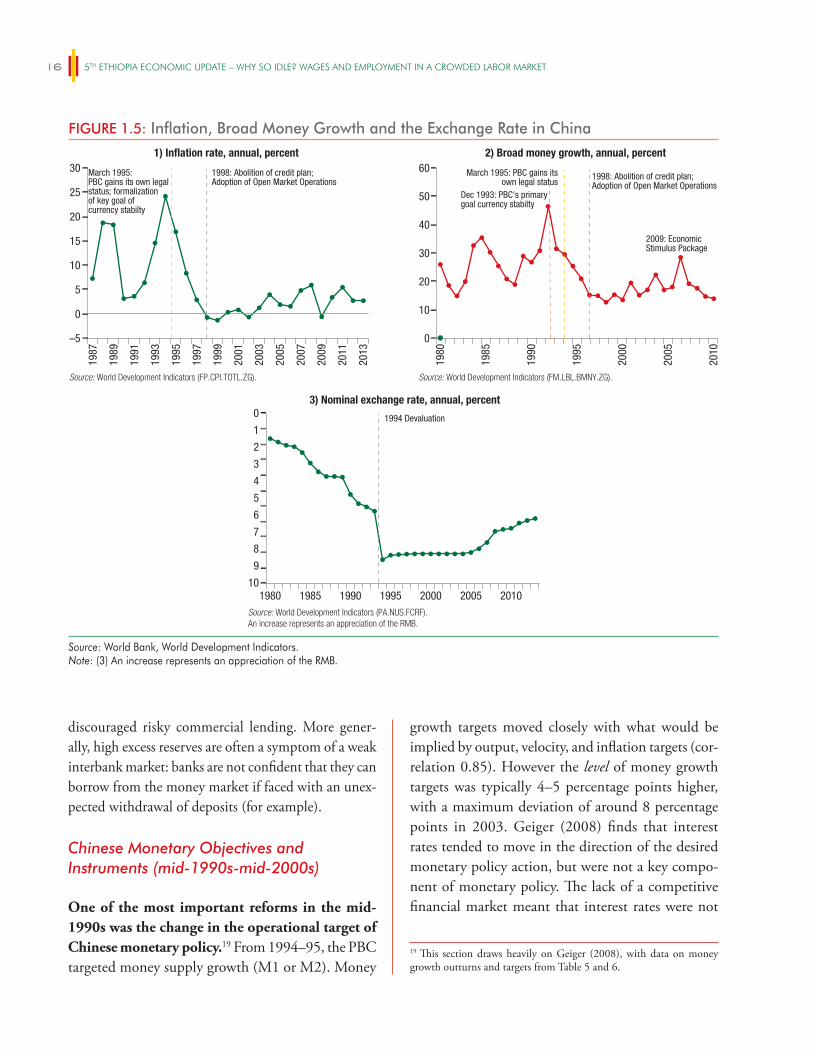
5TH ETHIOPIA ECONOMIC UPDATE – WHY SO IDLE? WAGES AND EMPLOYMENT IN A CROWDED LABOR MARKET16
discouraged risky commercial lending. More gener-ally, high excess reserves are often a symptom of a weak interbank market: banks are not confident that they can borrow from the money market if faced with an unex-pected withdrawal of deposits (for example).
Chinese Monetary Objectives and Instruments (mid-1990s-mid-2000s)
One of the most important reforms in the mid-1990s was the change in the operational target of Chinese monetary policy.19 From 1994–95, the PBC targeted money supply growth (M1 or M2). Money
growth targets moved closely with what would be implied by output, velocity, and inflation targets (cor-relation 0.85). However the level of money growth targets was typically 4–5 percentage points higher, with a maximum deviation of around 8 percentage points in 2003. Geiger (2008) finds that interest rates tended to move in the direction of the desired monetary policy action, but were not a key compo-nent of monetary policy. The lack of a competitive financial market meant that interest rates were not
FIGURE 1.5: Inflation, Broad Money Growth and the Exchange Rate in China
–5
0
5
10
15
20
25
30
0
10
20
30
40
50
601) Inflation rate, annual, percent
1987
1989
1991
1993
1995
1997
1999
2001
2003
2005
2007
2009
2011
2013
1998: Abolition of credit plan;Adoption of Open Market Operations
March 1995:PBC gains its own legalstatus; formalizationof key goal ofcurrency stabilty
2) Broad money growth, annual, percent
Source: World Development Indicators (FP.CPI.TOTL.ZG).
Source: World Development Indicators (PA.NUS.FCRF).An increase represents an appreciation of the RMB.
Source: World Development Indicators (FM.LBL.BMNY.ZG).
1980
1985
1990
1995
2000
2005
2010
1998: Abolition of credit plan;Adoption of Open Market Operations
2009: EconomicStimulus Package
March 1995: PBC gains itsown legal status
Dec 1993: PBC's primarygoal currency stabilty
3) Nominal exchange rate, annual, percent
1994 Devaluation0
1
2
3
4
5
6
7
8
9
101980 1985 1990 1995 2000 2005 2010
Source: World Bank, World Development Indicators.Note: (3) An increase represents an appreciation of the RMB.
19 This section draws heavily on Geiger (2008), with data on money growth outturns and targets from Table 5 and 6.

rEcEnt Economic DEvElopmEntS anD outlook 17
allocative (and interest rates were only partly liberal-ized). In fact, China often missed its money growth target—especially when it was trying to bring down inflation.20 Nonetheless, overall performance was quite good in terms of bias—average M1 growth was almost exactly the average of targeted growth, with average M2 growth 1.3 percentage points above tar-get. The mean absolute deviation (MAD) of planned and actual money growth was larger (around 3 per-cent).21 Despite these difficulties, the PBC succeeded in achieving low and relatively stable inflation over the 1998–2006 timeframe. In part, this might be because specific money growth targets helped the PBC to avoid the excessive money supply growth of the mid 1980s/ early 1990s.
In addition to changes to the operational framework, the PBC started relying on new instru-ments. Laurens (2005) and Buzeneca and Maino (2007) divide monetary policy operations into three basic types. (1) Direct instruments involve direct admin-istrative control over interest rates/quantities in the financial sector, and are a carryover from a planned economy. These include (in the Chinese context) win-dow guidance and wage/price controls. (2) Rule-based instruments work indirectly, but still rely on the regula-tory power of the central bank. These include reserve requirements, standing facilities and statutory liquid-ity requirements. (3) Market-based instruments (open market operations) involve the central bank trading in the money market and are the primary instrument used by central banks in developed-countries. China’s approach involves using all three types; some of the most important ones are described below. Other coun-tries are described in Box 1.1.
Open market operations were originally intro-duced in 1993 in China, but were abandoned and then reintroduced in 1998 when the interbank mar-ket was more developed (Geiger 2008). Key instru-ments included repos and reverse repos of T-bills, and issuance/receipt of central bank bills. By the mid-2000s, open market operations were taking place twice a week (an average of 115 transactions/year over 2000–06). Open market operations were particularly useful to try
to sterilize foreign exchange purchases (through repos and the issue of central bank bills). With an increased need for sterilization starting in 2003, the PBC started issuing central bank bills. Previously, sterilization had fallen on repo transactions, which continued after 2003, but were not sufficient for the volume of steril-ization required. One advantage of central bank bills over repos was that they could be traded, increasing liquidity in the money market (Green 2005).
Reserve requirements were a major tool of the PBC over 1998–2006. Initially it was used care-fully with five small movements in 2003–06, but 10 adjustments 2007 and eight in 2008 (Geiger 2010). Reserve requirements were first introduced in 1984. They were reduced (13 to 8 percent) over 1998–99 as inflation fell and the PBC moved to OMO to man-age liquidity (Geiger 2008). Reserves were remuner-ated at 1.89 percent over 1998–2006 (Laurens and Maino 2007).
Standing facilities and interest rate guidance were also in effect. During the period of study (1998–2006), banks could borrow from the PBC through the auto-matic collateralized lending facility at the rediscount rate; or lend excess reserves to the PBC through the excess reserves facility at a rate of around 1–2 percent (Laurens and Maino 2007). The rediscount rate was the main policy rate of the PBC during the period of study. From 2004 the PBC was able to change the redis-count rate (within a range) without permission from the State Council (Geiger 2008). In 2004, ceilings on lending rates and floors on deposit rates were eliminated. However, floors on lending rates and ceilings on deposit rates were maintained to protect banks’ profitability. The PBC changed these rates in 2006 in response to high credit growth (Laurens and Maino 2007).
20 Volatility in money multipliers is a problem in other countries too, such as the Bundesbank in the 1970s and 1980s (Geiger 2008) and also in Ethiopia (Aklilu 2009), which (along with volatile velocity) is one reason why many central banks have switched to interest rates as the intermediate target. Some authors suspect that interventions to stabilize the exchange rate may have contributed to the missed targets, though there is little evidence of this as foreign exchange activities were sterilized.21 Note that it is probably bias rather than MAD, which is more important for anchoring inflation expectations.
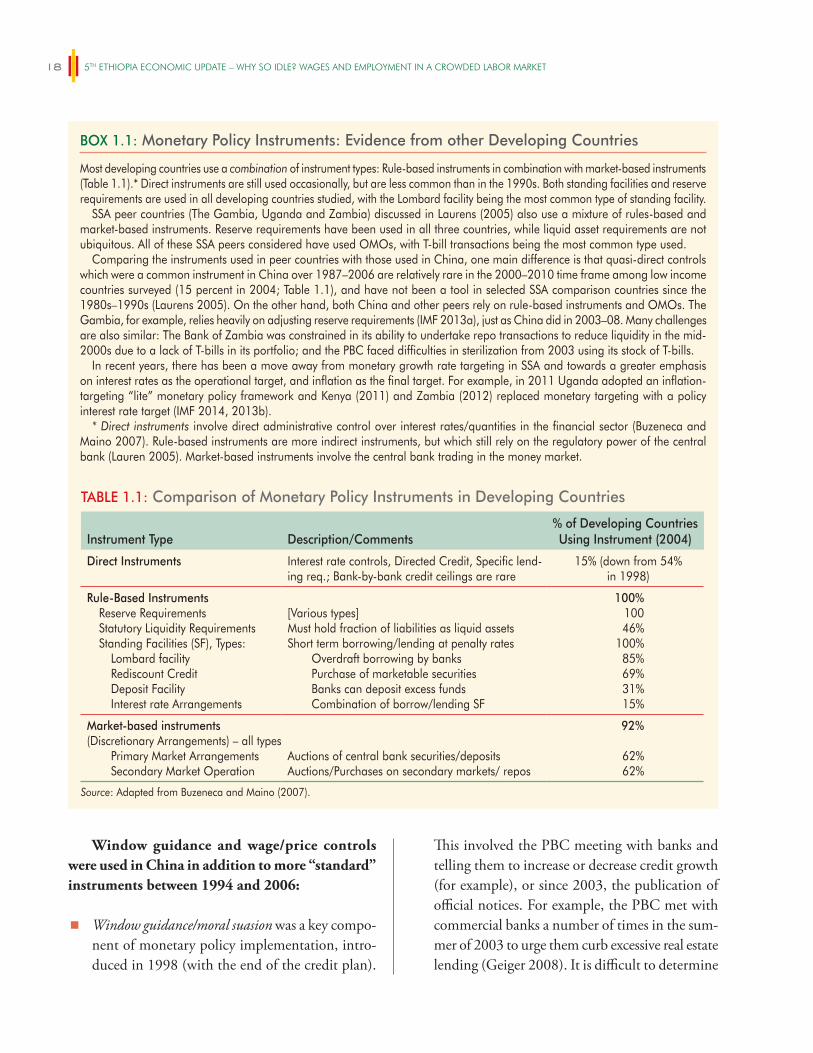
5TH ETHIOPIA ECONOMIC UPDATE – WHY SO IDLE? WAGES AND EMPLOYMENT IN A CROWDED LABOR MARKET18
Window guidance and wage/price controls were used in China in addition to more “standard” instruments between 1994 and 2006:
� Window guidance/moral suasion was a key compo-nent of monetary policy implementation, intro-duced in 1998 (with the end of the credit plan).
This involved the PBC meeting with banks and telling them to increase or decrease credit growth (for example), or since 2003, the publication of official notices. For example, the PBC met with commercial banks a number of times in the sum-mer of 2003 to urge them curb excessive real estate lending (Geiger 2008). It is difficult to determine
BOX 1.1: Monetary Policy Instruments: Evidence from other Developing Countries
Most developing countries use a combination of instrument types: Rule-based instruments in combination with market-based instruments (Table 1.1).* Direct instruments are still used occasionally, but are less common than in the 1990s. Both standing facilities and reserve requirements are used in all developing countries studied, with the Lombard facility being the most common type of standing facility.
SSA peer countries (The Gambia, Uganda and Zambia) discussed in Laurens (2005) also use a mixture of rules-based and market-based instruments. Reserve requirements have been used in all three countries, while liquid asset requirements are not ubiquitous. All of these SSA peers considered have used OMOs, with T-bill transactions being the most common type used.
Comparing the instruments used in peer countries with those used in China, one main difference is that quasi-direct controls which were a common instrument in China over 1987–2006 are relatively rare in the 2000–2010 time frame among low income countries surveyed (15 percent in 2004; Table 1.1), and have not been a tool in selected SSA comparison countries since the 1980s–1990s (Laurens 2005). On the other hand, both China and other peers rely on rule-based instruments and OMOs. The Gambia, for example, relies heavily on adjusting reserve requirements (IMF 2013a), just as China did in 2003–08. Many challenges are also similar: The Bank of Zambia was constrained in its ability to undertake repo transactions to reduce liquidity in the mid-2000s due to a lack of T-bills in its portfolio; and the PBC faced difficulties in sterilization from 2003 using its stock of T-bills.
In recent years, there has been a move away from monetary growth rate targeting in SSA and towards a greater emphasis on interest rates as the operational target, and inflation as the final target. For example, in 2011 Uganda adopted an inflation-targeting “lite” monetary policy framework and Kenya (2011) and Zambia (2012) replaced monetary targeting with a policy interest rate target (IMF 2014, 2013b).
* Direct instruments involve direct administrative control over interest rates/quantities in the financial sector (Buzeneca and Maino 2007). Rule-based instruments are more indirect instruments, but which still rely on the regulatory power of the central bank (Lauren 2005). Market-based instruments involve the central bank trading in the money market.
TABLE 1.1: Comparison of Monetary Policy Instruments in Developing Countries
Instrument Type Description/Comments% of Developing Countries Using Instrument (2004)
Direct Instruments Interest rate controls, Directed Credit, Specific lend-ing req.; Bank-by-bank credit ceilings are rare
15% (down from 54% in 1998)
Rule-Based Instruments Reserve Requirements Statutory Liquidity Requirements Standing Facilities (SF), Types:
Lombard facility Rediscount Credit Deposit Facility Interest rate Arrangements
[Various types] Must hold fraction of liabilities as liquid assets Short term borrowing/lending at penalty rates
Overdraft borrowing by banks Purchase of marketable securities Banks can deposit excess funds Combination of borrow/lending SF
100%10046%
100%85%69%31%15%
Market-based instruments (Discretionary Arrangements) – all types
Primary Market Arrangements Secondary Market Operation
Auctions of central bank securities/deposits Auctions/Purchases on secondary markets/ repos
92%
62%62%
Source: Adapted from Buzeneca and Maino (2007).
rEcEnt Economic DEvElopmEntS anD outlook 19
the impact of window guidance, but commenta-tors suggest it was an important component of monetary policy.
� Price controls. Around 25 percent of the Chinese CPI in 2001 consisted of goods where the govern-ment either directly controlled prices, or issued price guidance.22 In periods of high inflation, the government could (and did) freeze prices for these items. For example in March 2004, the National Reform and Development Commission instructed provincial officials to freeze prices of controlled goods/services once inflation reached a certain point (Geiger 2008). It is important to note that this was only a temporary freeze rather than a per-manent price subsidy—presumably once inflation fell below the threshold, the prices of these goods could be raised.
� Wage controls. Historically, wages were centrally set according to region, occupation, industry etc. In the mid-1980s and early 1990s, these were indexed to inflation, which contributed to the outbreak of inflation in 1988 and 1994 (Geiger 2008). However, starting in 1994–95, reforms were introduced to decentralize wage setting, which made it more closely, connected to produc-tivity growth and profitability. Geiger (2008) esti-mates that around 15 percent of employees in the late 1990s/early 2000s fell under the 1994–95 wage-setting arrangements.
Challenges in the Face of Weak Transmission
The Chinese reforms of 1993–98 outlined above were designed to replace the credit plan policy with market-based monetary policy instruments such as OMOs and interest rate adjustments, but in practice there were many challenges. It was expected that the PBC would be more able to implement these changes given its greater independence and clarity of objectives, and these measures would be more effec-tive due to the separation of policy and commercial lending. In practice, the transition was both chal-lenging and incomplete. In the late 1990s, faced with
deflation and falling credit growth, the PBC tried to stimulate the economy using indirect instruments. Over 1998–99, the PBC slashed official interest rates, increased the supply of base money through OMOs, reduced the required reserve ratio from 13 to 6 per-cent and reduced the interest rates paid on reserves (Green 2005). However, credit growth continued to slow over 2000–01.
In late 2001, the PBC resorted to window guid-ance and asked banks to increase lending. The gov-ernment also introduced expansionary fiscal policy. As outlined in Green (2005) credit growth shot up from below 10 percent to around 35 percent. China now faced the opposite problem: credit growth was too fast. Around 2003 the PBC raised interest rates, reduced the money supply through OMOs, and increased reserve requirements.23 Again, the policies seemed to be working slowly and so in the middle of 2003 the PBC began to introduce window guidance to reduce lending (Green 2005, Geiger 2008). Combined with other initiatives discussed above (such as price con-trols) credit growth dropped back to below 16 percent by June 2004.
This experience over 1998–2004 suggests that market-based instruments may have been less effec-tive than the PBC has hoped due to incomplete development of the financial sector. However, the same lack of institutional structure inhibiting indirect instruments meant that window guidance was both available and effective. An alternative interpretation is that market-based polices were new and hence more difficult to implement properly (e.g., harder to signal future actions), whereas window guidance was essentially a continuation of the credit plan which had been used for many years. Either way, the overshoot-ing of credit growth in the early 2000s suggest that it is also very difficult to use direct controls to fine-tune the macro-economy, which is worth noting for other countries considering similar policies.
22 Including utilities, goods produced by monopolies or products/services that were deemed to have specific importance.23 There were also large forex inflows in 2003, which may have also contributed to the boom conditions.
5TH ETHIOPIA ECONOMIC UPDATE – WHY SO IDLE? WAGES AND EMPLOYMENT IN A CROWDED LABOR MARKET20
crisis, for instance in the 1980s, and in a large drought in 2002/03. The large impact of droughts is explained by the fact that the agriculture sector is, by far, the biggest employer in Ethiopia, accounts for most mer-chandise exports, and is the second largest in terms of output. In addition, agricultural growth was an important driver of poverty reduction in Ethiopia over the past decade (2004 to 2014): Each percent of agricultural growth reduced poverty by 0.9 percent compared to 0.55 percent for each percent of overall GDP growth
Agriculture is also the major sector contribut-ing to growth in Ethiopia. The share of agriculture was 38 percent in FY 2015, which contributed about 2.6 percentage points to the 10.2 percent GDP growth in 2014/15. Crop production accounts for about three-quarters of agriculture value-added;25 this is followed by livestock which accounts for one-fifth of the agricultural value added. Agriculture is still largely rain-fed and dominated by small holders and subsistence production.
Despite the poor rains the national meher (main season) harvest for 2015/16 did not drop significantly. The overall drop in production for meher season of 2015/16 was estimated at –1.32 percent,26 while the crop production growth for all seasons including commercial
Implications and Lessons Learned for Ethiopia’s Monetary Policy
The main lesson from the Chinese experience in monetary policy for Ethiopia is that it is impor-tant for relying on a full range of instruments while financial markets develop. For China, this includes quasi-direct instruments (window guidance), rule-based instruments (reserve requirements) and open market operations (market-based instruments). Other peer countries (see Box 1.1) have combined market-based instruments with rule-based instru-ments (particularly reserve requirements). The mixed strategy allowed the central bank to control credit and monetary growth even in the face of limited financial market development and a concentrated and uncom-petitive banking sector.24
The second lesson is that fully effective market-based implementation of monetary policy is not possible without complementary reforms. Such reforms need to make the banking sector more com-petitive and to separate policy and non-policy lending. Knowing this, Chinese authorities separated policy banks from commercial banks in 1994. However in line with the gradualist approach, the reforms were incomplete—state-owned commercial banks were still not fully commercial—which may have reduced the effectiveness of market-based instruments over the following decade.
The Future View: Challenges and Outlook
Macroeconomic Challenges through the Current Drought
OverviewEthiopia is not a stranger to droughts and their impact is often large due to the importance of the agriculture sector in the economy and in peoples’ lives. The country has seen more than 15 drought epi-sodes between 1964 and 2015. They varied in impact, and some of them led to full-fledged humanitarian
24 Reserve requirements can be used to create a shortage of liquidity, to encourage banks to borrow from the central bank or each other (Laurens 2005). Standing facilities can be used to ensure liquidity (including in payments system) while open market operations and liquidity forecasting are being developed. Laurens (2005, Appendix V) shows that if banks are reluctant to lend to each other in the interbank market, the central bank can act as their counterparty (in Turkey in the 1980s) or can help to aggregate buy/sell orders (Thailand).25 Belg season harvest accounted for 4 percent of total crop production in 2013/14.26 The failure of belg rains and the arrival of El Nino in 2015 resulted in failed belg harvest and affected meher (main) season harvest.
Ethiopia`s strong economic growth slowed down in 2015/16 due to the recent drought, but it is expected to rebound quickly in 2016/17. Inflation is expected to remain in single digits. Disappointing exports and soaring imports contribute to poor external sector performance but are expected to improve in the medium-term. Economic growth in 2016, lower but still substantial, is expected to drive further reductions in poverty.
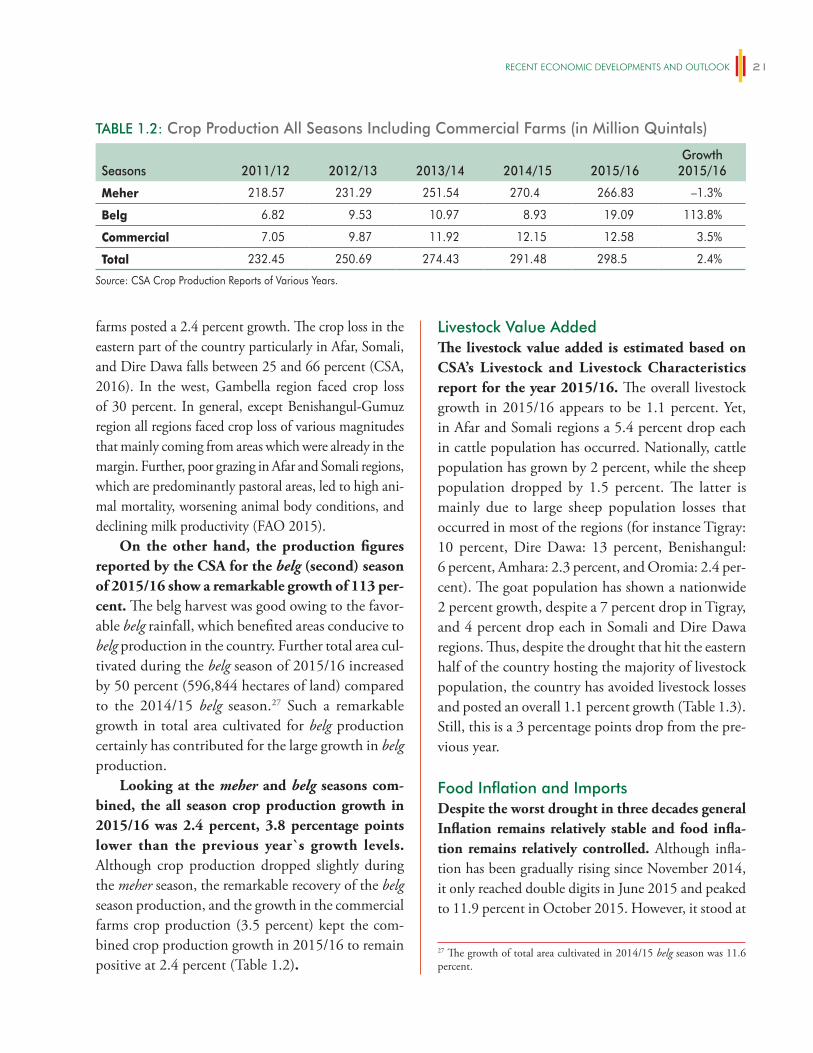
rEcEnt Economic DEvElopmEntS anD outlook 21
Livestock Value AddedThe livestock value added is estimated based on CSA’s Livestock and Livestock Characteristics report for the year 2015/16. The overall livestock growth in 2015/16 appears to be 1.1 percent. Yet, in Afar and Somali regions a 5.4 percent drop each in cattle population has occurred. Nationally, cattle population has grown by 2 percent, while the sheep population dropped by 1.5 percent. The latter is mainly due to large sheep population losses that occurred in most of the regions (for instance Tigray: 10 percent, Dire Dawa: 13 percent, Benishangul: 6 percent, Amhara: 2.3 percent, and Oromia: 2.4 per-cent). The goat population has shown a nationwide 2 percent growth, despite a 7 percent drop in Tigray, and 4 percent drop each in Somali and Dire Dawa regions. Thus, despite the drought that hit the eastern half of the country hosting the majority of livestock population, the country has avoided livestock losses and posted an overall 1.1 percent growth (Table 1.3). Still, this is a 3 percentage points drop from the pre-vious year.
Food Inflation and ImportsDespite the worst drought in three decades general Inflation remains relatively stable and food infla-tion remains relatively controlled. Although infla-tion has been gradually rising since November 2014, it only reached double digits in June 2015 and peaked to 11.9 percent in October 2015. However, it stood at
27 The growth of total area cultivated in 2014/15 belg season was 11.6 percent.
farms posted a 2.4 percent growth. The crop loss in the eastern part of the country particularly in Afar, Somali, and Dire Dawa falls between 25 and 66 percent (CSA, 2016). In the west, Gambella region faced crop loss of 30 percent. In general, except Benishangul-Gumuz region all regions faced crop loss of various magnitudes that mainly coming from areas which were already in the margin. Further, poor grazing in Afar and Somali regions, which are predominantly pastoral areas, led to high ani-mal mortality, worsening animal body conditions, and declining milk productivity (FAO 2015).
On the other hand, the production figures reported by the CSA for the belg (second) season of 2015/16 show a remarkable growth of 113 per-cent. The belg harvest was good owing to the favor-able belg rainfall, which benefited areas conducive to belg production in the country. Further total area cul-tivated during the belg season of 2015/16 increased by 50 percent (596,844 hectares of land) compared to the 2014/15 belg season.27 Such a remarkable growth in total area cultivated for belg production certainly has contributed for the large growth in belg production.
Looking at the meher and belg seasons com-bined, the all season crop production growth in 2015/16 was 2.4 percent, 3.8 percentage points lower than the previous year`s growth levels. Although crop production dropped slightly during the meher season, the remarkable recovery of the belg season production, and the growth in the commercial farms crop production (3.5 percent) kept the com-bined crop production growth in 2015/16 to remain positive at 2.4 percent (Table 1.2).
TABLE 1.2: Crop Production All Seasons Including Commercial Farms (in Million Quintals)
Seasons 2011/12 2012/13 2013/14 2014/15 2015/16Growth
2015/16
Meher 218.57 231.29 251.54 270.4 266.83 –1.3%
Belg 6.82 9.53 10.97 8.93 19.09 113.8%
Commercial 7.05 9.87 11.92 12.15 12.58 3.5%
Total 232.45 250.69 274.43 291.48 298.5 2.4%
Source: CSA Crop Production Reports of Various Years.

5TH ETHIOPIA ECONOMIC UPDATE – WHY SO IDLE? WAGES AND EMPLOYMENT IN A CROWDED LABOR MARKET22
5.6 percent in October 2016. The regional inflationary trends were also largely similar to the national trend, except that in Afar inflation spiked to 24 percent in September and October 2015, but dropped to 9.2 per-cent in September 2016. Similarly, food inflation reached to 16 percent in October 2015, but dropped back to 4.3 percent in August 2016 and rose up to 6.1 percent in September 2016 at the national level; the movement at the regional level has been mixed.28 The recent peak in inflation rate may signal the conse-quences of the unrest that compelled the government to enact state of emergency.
Following the drought situation, wheat imports reached the record high 2.5 million metric tonnes. Figure 1.6.3 shows the drought has pushed the wheat import to the record high 2.5 million metric tonnes (between October 2015 and September 2016), about 1.5 million metric tonnes above the recent aver-age (CIMMYT 2015; USDA and USAID 2016). Compared to the last 5 years average import of close to 1 million metric tonnes in commercial and emer-gency assistance, the current high import induced by the current drought has helped in containing food price hikes that would occur otherwise. Out of the
2.5 million metric tonnes of wheat import, 0.3 mil-lion metric tonnes goes to replenish the strategic food reserve which was 0.4 million metric tonnes and depleted in an earlier emergency response. High lev-els of cereal stock reserves and large carry-over stock from 2014/15 (Bellmon, 2015) may explain the low inflationary impact.
The investigation of the price trends of major cereals in different local markets shows that the price trends in the aftermath of the drought were not actually unusual y high, except sorghum prices. Cereal prices spiked for short period between June 2015 and October 2015, and quickly reverted back to their pre-drought levels. As of August 2016, the year on year price increase of all the three cere-als investigated here have posted a price decrease, except sorghum that posted a price increase between 20 to 60 percent. Large scale food imports, sup-ply of wheat to large bakeries at subsidized prices, and strategic distribution of food aid to drought affected areas may have helped in stabilizing cereal prices and hence food inflation. Further, the tight monetary policy regime also partly contributes for the price stability. The spatial price difference found to be higher for wheat, followed by sorghum. (See Figures 1.6.4–1.6.6).
There is some risk that increased wheat imports and subsidies put fiscal pressure on the Government. At the current levels, wheat imports may cost up to US$375 million, which is equivalent to 12 percent of the total annual export earnings of 2014/15. Following the humanitarian crisis ensuing from the drought, the Government has announced 18 Billion Birr (US$0.85 billion) additional budget during FY16, of which 82 percent (or US$0.7 bil-lion) was devoted to the financial requirement for drought-affected population (Reporter 2015).
TABLE 1.3: Livestock Population Growth in 2015/16
Regions
2015/16
Cattle Sheep Goats Total
Tigray 0.8 –9.9 –7.2 –4.2
Afar –5.4 4.0 4.8 2.1
Amhara 5.1 –2.3 0.3 1.7
Oromia 1.8 –2.4 6.7 1.8
Somali –2.2 0.9 –3.6 –1.8
BG 10.1 –6.3 1.8 5.6
SNNPR –0.4 2.7 4.9 1.6
Gambella 0.7 24.8 6.3 4.1
Harari 9.4 45.6 17.5 14.9
DD 5.7 –12.9 –3.5 –4.5
Total 2.0 –1.5 2.0 1.1
Source: CSA Livestock and Livestock Characteristics Report 2015/16.
28 In Addis Ababa, food inflation has increased since January 2015 and reached 30.4 percent in October 2015, but has been dropping since February 2016 and reached –1.9 percent in August 2016 (year on year), and stood at 0.46 percent in September 2016. Similarly, Afar and Oromia posted a negative inflation of 0.1 and 0.8 percent, respectively in August 2016, and negative 0.3 and 1.75 percent in September 2016, respectively. (Figure 1.6.3).

rEcEnt Economic DEvElopmEntS anD outlook 23
FIGURE 1.6: Drought Assessment
1) General inflation September 2015 to August 2016 2) Food Inflation September 2015 to August 2016
3) Ethiopia Wheat Import 1965–2016 4) Wheat price Trends in Selected local markets,March 2014 to August 2016
5) Maize price Trends in Selected local markets,March 2014 to August 2016
0
6) Sorghum price Trends in Selected local markets,March 2014 to August 2016
Sept
embe
r
Octo
ber
Nove
mbe
r
Dece
mbe
r
Janu
ary
Febr
uary
Mar
ch
April
May
June
July
Augu
stEthiopia AA AfarAmhara B.Gumuz D.Dawa
Gambella Harari OromiaSNNP Somalia Tigray
600700800900
10001100120013001400
2014
m3
2014
m5
2014
m7
2014
m9
2014
m11
2015
m1
2015
m3
2015
m5
2015
m7
2015
m9
2015
m11
2016
m1
2016
m3
2016
m5
2016
m7
DD AsselaMekelle Bahir Dar
ShashemeneAA
2014
m3
2014
m5
2014
m7
2014
m9
2014
m11
2015
m1
2015
m3
2015
m5
2015
m7
2015
m9
2015
m11
2016
m1
2016
m3
2016
m5
2016
m7
600
700
800
900
1000
1100
1200
AA DD
Mekelle D. Birhan
–10%
0%
10%
20%
30%
Sept
embe
r
Octo
ber
Nove
mbe
r
Dece
mbe
r
Janu
ary
Febr
uary
Mar
ch
April
May
June
July
Augu
st
–10%
0%
10%
20%
40%
30%
500
1,000Wha
et Im
port
('000
tonn
es)
1,500
2,000
2,500
3,000
1961
1965
1969
1973
1977
1981
1985
1989
1993
1997
2001
2005
2009
2013
400
450
500
550
600
650
2014
m3
2014
m5
2014
m7
2014
m9
2014
m11
2015
m1
2015
m3
2015
m5
2015
m7
2015
m9
2015
m11
2016
m1
2016
m3
2016
m5
2016
m7
500
AA BD DDMekelleShashemene
Source: 1.6.1–1.6.2: CSA; 1.6.3: CIMMYT (2015); 1.6.4–1.6.6: EGTE.
5TH ETHIOPIA ECONOMIC UPDATE – WHY SO IDLE? WAGES AND EMPLOYMENT IN A CROWDED LABOR MARKET24
Outlook
It was to be expected that Ethiopia’s strong eco-nomic growth would slow down in 2015/16 due to the recent drought. The drought caused by the El-Niño phenomenon affected the economy nega-tively through reductions in food production. While there was some uncertainty about the actual impact of the drought, preliminary actual figures from the Government for 2015/16 show now that the growth rate was 8 percent, in line with. With this, the growth impact is lower than originally envisaged; according to Government crop data released by the CSA in July 2016 there was a less than expected agriculture pro-duction impact; this is due to good crop production during the second season harvest of 2015/16. As past evidence shows, with regular rains again, agriculture growth can quickly pick-up in 201729 (Figure 1.7.1).
But positive growth moment will still remain. A decade of remarkable double digit growth rates helped the economy to cope well with the most recent chal-lenges encountered in 2015/16. In fact, the ability to keep growth positive is a remarkable achievement for the Government. In similar occasions in the past, for instance in 1997/98 and 2002/03 the country has experienced negative GDP growth. In 1998 growth dropped to –3.5 percent from 3 percent in the previous year. Similarly, in 2003 it dropped to –2.2 percent from 1.5 percent previous year. Medium-term economic growth can be unaffected from the drought since the rains set in normally again in 2016/17. Still, an overall dampening effect will set in motion in the medium term as total factor productivity (TFP) is expected to decline in the medium-term following the recent and rapid accumulation of capital stock (Figures 1.7.2 and 1.7.3). And potential negative economic effects of the current unrest are a risk to the outlook. On the other hand, the completion of the Addis Ababa -Djibouti railway line, significantly eases trade logistics related constraints. The commencement of new industrial and the increasing capacity in power generation with the completion of transmission lines to neighboring countries are also expected to improve the export
performance and stimulate growth in the short- to medium-term.
Economic growth in 2015/16, while lower still substantial, is expected to drive further reductions in poverty. Growth has been an important driver of poverty reduction in the last decade with each percent of growth reducing poverty by 0.55 percent. Hence, with growth at 8 percent in 2015/16 the poverty reduc-ing potential is still significant. Based on this, the pro-portion of households living below the poverty line of 1.9 US$PPP is estimated to decline from its estimated level of 27.2 percent in 2015 to 24.6 percent in 2018.
Since regions most badly affected by the drought are the poorest parts of the country, poverty may fall less than predicted. The impact of the poor rains has not been equal across the country. The areas most affected are the poorest parts of the country where many households are poor or live just above the poverty line. Drought-induced harvest losses in these areas cause large increases in poverty. The poverty headcount ratio estimate based on growth elasticity does not take such regional variations into account. When district-specific data on estimated crop losses are used, the rate of poverty reduction is potentially slower than estimated in 2016.
Export growth continues its declining trend, largely on account of falling commodity prices and an overvalued currency. The Birr continues to be ovrevalued in real terms and this is hurting external competitiveness (The Birr is pegged against the U.S. dollar). Over the past three years, exports of goods and services have averaged a growth rate of just 0.6 percent per year compared to an average of 13 percent over the last decade. Good exports continued its disappointing growth in FY16, declining by 8.3 percent in the first severn months of FY16. Looking forward, the current account deficit is predicted to narrow gradually to 7.8 percent in 2018 because of expected rebounding in exports (Figure 1.7.4).
29 Data from the most recent previous drought year in 2002/03 shows that production growth indeed picked up in the first post-drought year. A 40 percent increase in meher season production has been observed in 2003/04 following the recovery from the 2002/03 drought. In the same period agricultural GDP bounced back from –10.5 percent in 2002/03 to 17 percent in 2003/04.
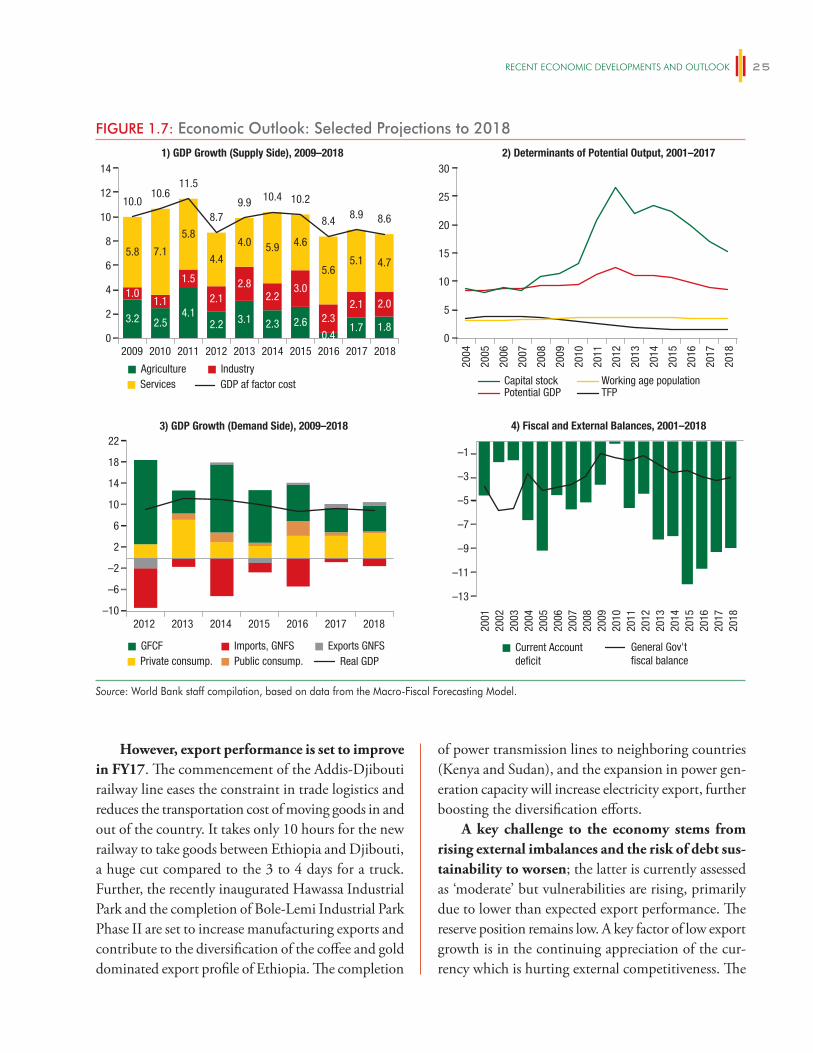
rEcEnt Economic DEvElopmEntS anD outlook 25
However, export performance is set to improve in FY17. The commencement of the Addis-Djibouti railway line eases the constraint in trade logistics and reduces the transportation cost of moving goods in and out of the country. It takes only 10 hours for the new railway to take goods between Ethiopia and Djibouti, a huge cut compared to the 3 to 4 days for a truck. Further, the recently inaugurated Hawassa Industrial Park and the completion of Bole-Lemi Industrial Park Phase II are set to increase manufacturing exports and contribute to the diversification of the coffee and gold dominated export profile of Ethiopia. The completion
of power transmission lines to neighboring countries (Kenya and Sudan), and the expansion in power gen-eration capacity will increase electricity export, further boosting the diversification efforts.
A key challenge to the economy stems from rising external imbalances and the risk of debt sus-tainability to worsen; the latter is currently assessed as ‘moderate’ but vulnerabilities are rising, primarily due to lower than expected export performance. The reserve position remains low. A key factor of low export growth is in the continuing appreciation of the cur-rency which is hurting external competitiveness. The
FIGURE 1.7: Economic Outlook: Selected Projections to 20181) GDP Growth (Supply Side), 2009–2018 2) Determinants of Potential Output, 2001–2017
3) GDP Growth (Demand Side), 2009–2018 4) Fiscal and External Balances, 2001–2018
Agriculture IndustryServices GDP af factor cost
GFCF Imports, GNFS Exports GNFSPublic consump.Private consump. Real GDP
0
2
4
6
8
10
12
14
Current Accountdeficit
General Gov'tfiscal balance
2009 2010 2011 2012 2013 2014 2015 2016 2017 2018
2012 2013 2014 2015 2016 2017 2018
0
3.2 2.54.1
2.2 3.1 2.3 2.60.4
1.7 1.8
1.01.1
1.5
2.12.8
2.23.0
2.32.1 2.0
5.8 7.1
5.8
4.4
4.0 5.9 4.6
5.65.1 4.7
10.010.6
11.5
8.79.9 10.4 10.2
8.4 8.9 8.6
Capital stockPotential GDP
–13
–11
–9
–7
–5
–3
–1
Working age population TFP
5
10
15
20
25
30
2004
2005
2006
2007
2008
2009
2010
2011
2012
2013
2014
2015
2016
2017
2018
–10
–6
–2
2
6
10
14
18
22
2001
2002
2003
2004
2005
2006
2007
2008
2009
2010
2011
2012
2013
2014
2015
2016
2017
2018
Source: World Bank staff compilation, based on data from the Macro-Fiscal Forecasting Model.
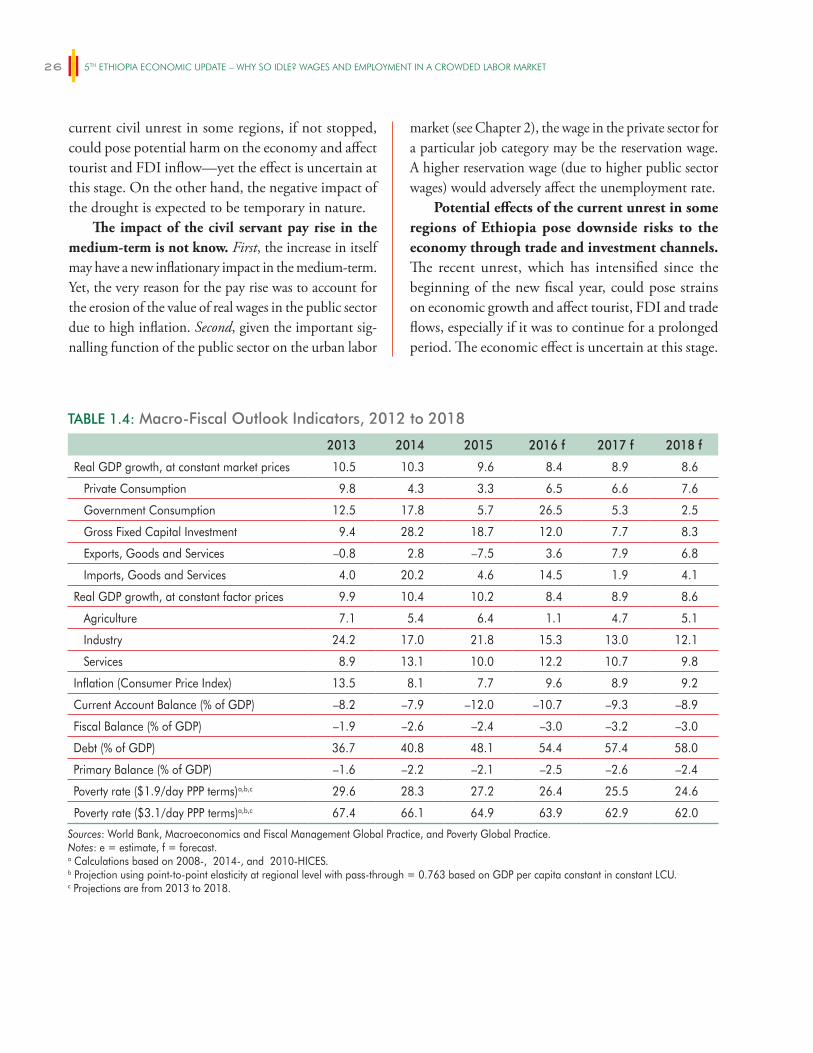
5TH ETHIOPIA ECONOMIC UPDATE – WHY SO IDLE? WAGES AND EMPLOYMENT IN A CROWDED LABOR MARKET26
current civil unrest in some regions, if not stopped, could pose potential harm on the economy and affect tourist and FDI inflow—yet the effect is uncertain at this stage. On the other hand, the negative impact of the drought is expected to be temporary in nature.
The impact of the civil servant pay rise in the medium-term is not know. First, the increase in itself may have a new inflationary impact in the medium-term. Yet, the very reason for the pay rise was to account for the erosion of the value of real wages in the public sector due to high inflation. Second, given the important sig-nalling function of the public sector on the urban labor
market (see Chapter 2), the wage in the private sector for a particular job category may be the reservation wage. A higher reservation wage (due to higher public sector wages) would adversely affect the unemployment rate.
Potential effects of the current unrest in some regions of Ethiopia pose downside risks to the economy through trade and investment channels. The recent unrest, which has intensified since the beginning of the new fiscal year, could pose strains on economic growth and affect tourist, FDI and trade flows, especially if it was to continue for a prolonged period. The economic effect is uncertain at this stage.
TABLE 1.4: Macro-Fiscal Outlook Indicators, 2012 to 2018
2013 2014 2015 2016 f 2017 f 2018 f
Real GDP growth, at constant market prices 10.5 10.3 9.6 8.4 8.9 8.6
Private Consumption 9.8 4.3 3.3 6.5 6.6 7.6
Government Consumption 12.5 17.8 5.7 26.5 5.3 2.5
Gross Fixed Capital Investment 9.4 28.2 18.7 12.0 7.7 8.3
Exports, Goods and Services –0.8 2.8 –7.5 3.6 7.9 6.8
Imports, Goods and Services 4.0 20.2 4.6 14.5 1.9 4.1
Real GDP growth, at constant factor prices 9.9 10.4 10.2 8.4 8.9 8.6
Agriculture 7.1 5.4 6.4 1.1 4.7 5.1
Industry 24.2 17.0 21.8 15.3 13.0 12.1
Services 8.9 13.1 10.0 12.2 10.7 9.8
Inflation (Consumer Price Index) 13.5 8.1 7.7 9.6 8.9 9.2
Current Account Balance (% of GDP) –8.2 –7.9 –12.0 –10.7 –9.3 –8.9
Fiscal Balance (% of GDP) –1.9 –2.6 –2.4 –3.0 –3.2 –3.0
Debt (% of GDP) 36.7 40.8 48.1 54.4 57.4 58.0
Primary Balance (% of GDP) –1.6 –2.2 –2.1 –2.5 –2.6 –2.4
Poverty rate ($1.9/day PPP terms)a,b,c 29.6 28.3 27.2 26.4 25.5 24.6
Poverty rate ($3.1/day PPP terms)a,b,c 67.4 66.1 64.9 63.9 62.9 62.0
Sources: World Bank, Macroeconomics and Fiscal Management Global Practice, and Poverty Global Practice.Notes: e = estimate, f = forecast.a Calculations based on 2008-, 2014-, and 2010-HICES.b Projection using point-to-point elasticity at regional level with pass-through = 0.763 based on GDP per capita constant in constant LCU. c Projections are from 2013 to 2018.

27
TRENDS AND CONSTRAINTS IN URBAN LABOR MARKETS IN ETHIOPIA
Introduction
Rapid economic growth since 2004 was driven by public infrastructure investment and supported by a conducive external environment. As shows in the World Bank Systematic Country Diagnostics (SCD), real GDP growth averaged 10.9 percent annu-ally (8.0 percent per capita) in 2004–14, according to official data. This substantially exceeds historical averages for the country as well as the regional and low-income averages for the same period. Growth was concentrated in services and agriculture with a recent impetus from construction, while contributions from manufacturing were low (World Bank 2016).
Economic growth, together with substan-tial improvements in the provision of safety nets and basic services explain the impressive poverty reduction observed in Ethiopia in recent years. The poverty headcount under the national poverty
line decreased considerably from 38.7 percent in 2000 to 29.6 percent in 2011. Poverty incidence has also fallen dramatically under the international line of extreme poverty (the US$1.25 PPP poverty line): from 60.5 percent in 1996 to 30.7 percent in 2011.
A modest shift in labor from agriculture to services and construction explains up to a quarter of Ethiopia’s per capita growth. World Bank (2015e) shows this posi-tive impact from structural change for the period 2005 to 2013. This illustrates the strong potential of structural change as a driver of economic growth as discussed in the literature (e.g. McMillan et al. 2014). Although Ethiopia has experienced high economic growth and some struc-tural change in production away from agriculture towards services, the similar shift in employment has been much more modest. Agricultural employment declined from 80 to 77 percent between 2005 and 2013 but because agri-cultural labor productivity was so low, this shift gave rise to static efficiency gains as relative labor shares increased in construction and services where the average value added of a worker is up to five times higher (World Bank 2015e).
While structural change contributed to eco-nomic growth in the past, it was not sufficiently inclusive and it has potential to contribute much more to poverty reduction in the future. Structural change has had little impact on poverty reduction in Ethiopia given limited movements of labor across sectors and locations (World Bank (2016)). In other words, progress among rural, self-employed, agricul-tural households in Ethiopia accounts for the major share of poverty reduction.30 Hence, looking forward,
2
A modest shift in labor from agriculture to services and construction explains up to a quarter of Ethiopia’s per capita growth over the past decade. But while structural change contributed to economic growth in the past, it was not sufficiently inclusive and needs to contribute much more to poverty reduction in the future. The urban space plays a key role in advancing structural change, as centers of innovation and industrial development. Well-functioning and efficient urban labor markets are a key ingredient for this transformation to take place, and to ensure that its benefits reach all segments of the population. Nonetheless, there are several factors that currently curb the efficiency of urban labor markets in Ethiopia. This chapter examines recent trends in urban labor markets to show how the availability and nature of work has been changing, and what factors limit the efficiency of urban labor markets in Ethiopia. A clearer understanding of the nature of the labor market helps inform policy interventions to provide better job opportunities for households, boosting private consumption, and thus, aggregate demand.
30 Poverty reduction in rural areas accounted for 5.2 and 7.8 percentage points of poverty reduction during the periods 2000–2005 and 2005–2011 and the contribution of reductions in poverty among those engaged in agriculture was similar: 3.8 and 6.9 percentage points respectively. Among the self-employed it was: 4.8 and 7.5 percentage points respectively.
5TH ETHIOPIA ECONOMIC UPDATE – WHY SO IDLE? WAGES AND EMPLOYMENT IN A CROWDED LABOR MARKET28
the Systematic Country Diagnostic argues that faster structural change is needed for several reasons. First, average and marginal productivity in agriculture is much lower than in other sectors suggesting that sectoral transitions will increase returns to labor. Second, the process of structural change offers the potential shift into export-oriented light manufactur-ing activities. Third, urban demand plays an impor-tant role in achieving agricultural growth, as would growth in agro-processing industries. Fourth, further agglomeration as a result of urbanization will bring positive externalities that will encourage growth and help reduce poverty. Finally, structural transformation can help reduce vulnerability. More inclusive struc-tural change is needed to ensure that non-agricultural growth reduces poverty going forward.
Fostering faster and more inclusive structural change in Ethiopia requires a healthy interplay between three main actors: firms, workers and the government. Productive and competitive firms are key to success because firms are able to organize labor in the most efficient manner, thereby raising productivity (World Bank 2016). Workers in turn should be healthy and possess the appropriate skills that firms need.31 The government, particularly urban planners, play a pivotal role in this overall process as they plan the urban space, support investment in economic and social infrastruc-ture and manage the provision of public services includ-ing education, training, health, and water/sanitation. This support sets the foundation for private investment in urban areas, which is essential for urban job creation.
The urban space plays a key role to advance structural change in Ethiopia, as centers of innova-tion and industrial development. Well-functioning and efficient urban labor markets are a key ingre-dient for this transformation to take place, and to ensure that its benefits reach all segments of the population. Yet, unemployment in Ethiopia is by and large an urban phenomenon, particularly in Addis Ababa and positive effects of urbanization can only unfold with increasing rates of non-farm employment (World Bank 2015b). In rural areas, fewer than five percent of all households have an unemployed adult.
However, in urban areas, 15 percent of all households report an adult member—male or female—as unem-ployed. Unemployment increases in large cities as the size of formal labor markets increase. In particular, there are high unemployment rates in Addis Ababa; 23.5 percent of households report an unemployed adult, versus 11 percent of households in other urban areas. In other words, urbanization in Ethiopia can only bring about its structural impact if it is accompa-nied by sustained increases in nonfarm employment.
Nonetheless, there are several factors that cur-rently curb the efficiency of urban labor markets in Ethiopia, leading to very high levels of unem-ployment. In rural areas, fewer than five percent of all households have an unemployed adult. However, in urban areas, 17 percent of all households report an adult member—male or female—as unemployed. Unemployment increases in large cities as the size of formal labor markets increase. In particular, there are high unemployment rates in Addis Ababa; 24 percent of households report an unemployed adult, versus 11 percent of households in other urban areas. A clearer understanding of the nature of the labor market helps inform policy interventions to provide more and better job opportunities for households, help reduce poverty, and allow the positive effects of urbanization unfold with increasing rates of non-farm employment.
This chapter examines recent trends in urban labor markets to show how the availability and nature of work has been changing, and explores what factors limit the efficiency of urban labor markets in Ethiopia. Evidence suggests that unemployment is partly explained by low labor productivity in the pri-vate sector. For those with little education, low labor productivity in unskilled jobs causes wages to be low, barely covering basic needs. If wages were any lower than their current levels it would not be worthwhile for
31 Yet, skills shortages in Ethiopia constitute a key constraint to growth and improved productivity in the manufacturing sector despite the country has made significant progress in expanding access to education. In the short run, the provisuion of Techncial and Vocaltional Education Training (TVET) and second-chance general education programs ccould be used to bridge the gap of skills supply to the manufacturing sector. See the 4th Ethiopia Economic Update (World Babnk 2015c) for details.

trEnDS anD conStraintS in urban labor markEtS in Ethiopia 29
workers to take the work as they would not be able to cover their basic needs. This prevents wages from falling to fully clear the market. In addition, there is evidence that while waiting for a high quality job educated indi-viduals take temporary low-skilled jobs to finance the relatively high costs of searching for a permanent job. The temporary jobs that are taken are those that low-skilled individuals would otherwise take contributing to higher unemployment among low-skilled workers. However the magnitude of the crowding out is rela-tively small and this phenomenon on its own does not explain unemployment entirely.
A Profile of the Labor Market in Urban Ethiopia32
Although unemployment has been decreasing, it remains the most salient trait of the Ethiopian urban labor markets. Before exploring what factors may be contributing to this phenomenon by limiting the efficiency of the labor market, first it is necessary to understand what characterizes this market and how it has evolved over the last few years. This section high-lights the low level of education of the labor force, the importance of the public sector in wage employment and the how self-employment is more or less attractive to individuals with different levels of education; while the next section explores how real wages have not reflected the increasing educational quality of the workforce, and how detrimental high inflation can be for real wages.
Unemployment rates are high and increase with city size. Seventeen percent of the labor force is
out of work and available for work.33 This is high in comparison to countries like Rwanda and Uganda, where urban unemployment is around 7 percent and 9.5 percent respectively. In Addis Ababa the unem-ployment rate is 24 percent (Figure 2.1.1). As a result Addis Ababa is home to 28 percent of the urban unem-ployed in Ethiopia. The 15 other major cities for which the UEUS is representative are home to 16 percent of the unemployed and the remaining 56 percent of the urban unemployed live in smaller urban centers.
In addition, unemployment rates are particu-larly high for those with secondary education but no college degree (Figure 2.1.2). Given that those with secondary education are not a large share of the urban labor force, those with primary or no education comprise the largest share (51 percent) of the unem-ployed pool. Unemployment rates are lowest among college graduates, but still 14 percent of the unem-ployed are graduates. A quarter of these unemployed graduates live in Addis Ababa, 19 percent in other major centers and 56 percent in smaller urban centers.
Wages increase with education, particularly for those with post-secondary education, but women’s wages are 28 percent lower than men’s wages. This is shown in Figure 2.1.3. Not only are hourly wages lower for women but they also work fewer hours than men, which compounds the monthly earnings gap. Women are no more likely to look for additional work elsewhere than men (Figure 2.1.4).
Despite rapid improvements in educational outcomes in recent years, the urban labor force
32 A series of Urban Employment and Unemployment Surveys (UEUS) collected by the Central Statistical Agency (CSA) from 2003 to 2014 is, unless otherwise stated, the data used for this analysis. The data was standardized across survey rounds using the I2D2 protocols. Much of the analysis presents national trends for urban areas in Ethiopia using this data. The data is also used to construct city-level statistics for the 16 cities of which the data is representative: Mekelle (Tigray), Assayita (Afar), Gondar Town (Amhara), Dessie Town (Amhara), Bahir Dar (Amhara), Bishoftu (Oromiya), Adama (Oromiya), Jimma (Oromiya), Shashemene (Oromiya), Jijiga (Somali), Asossa (Benishangul-Gumuz), Awassa (SNNPRs), Gambella Town (Gambella), Harari, Addis Ababa, Dire Dawa.33 According to the 2014 Central Statistical Agency report on the UEUS, an individual is classified as unemployed if he is not engaged in a produc-tive activity (in wage, self, or family employment) and is available for work the next month if the opportunity arises.
Ethiopia is urbanizing and as it does, the structure of work is changing. Unemployment rates have been decreasing but remain high and increase with city size. Wages increase with education, particularly for those with post-secondary education, but women fetch 28 percent lower wages than men on urban labor markets. Despite rapid improvements in educational outcomes in recent years, the urban labor force remains predominantly comprised of low skilled workers. An important trait of urban labor markets is the importance of the public sector, which has an important signaling function for the rest of the urban labor market.
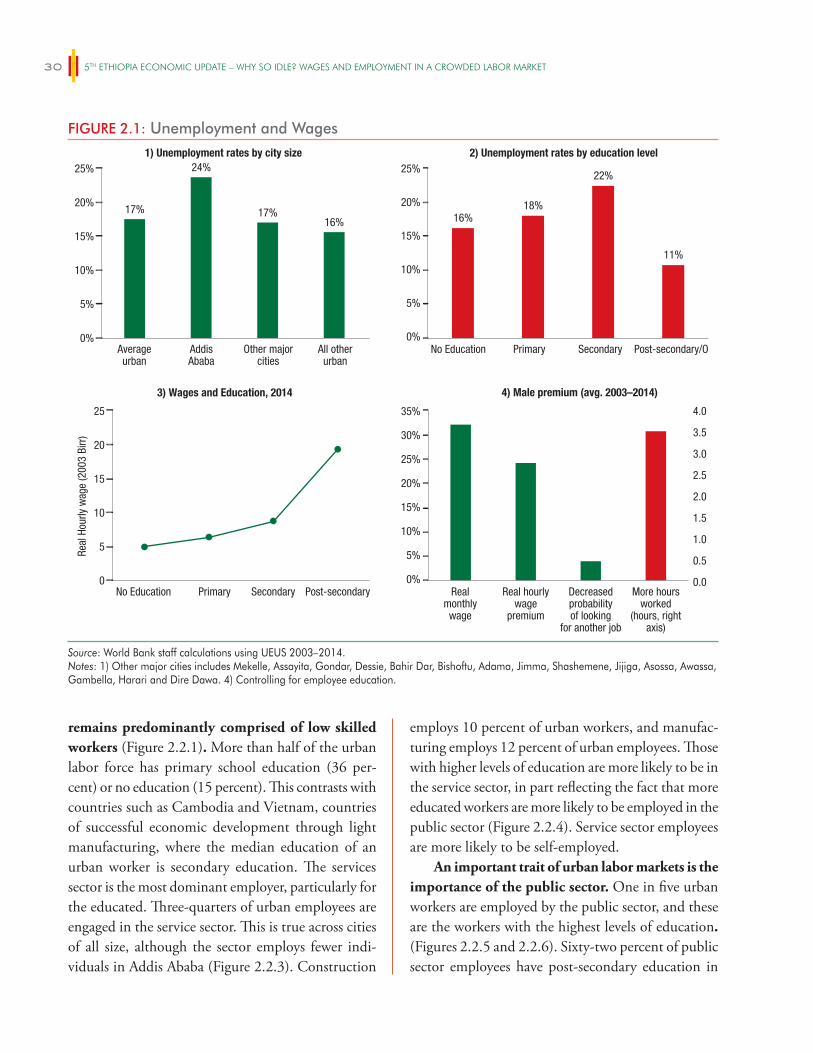
5TH ETHIOPIA ECONOMIC UPDATE – WHY SO IDLE? WAGES AND EMPLOYMENT IN A CROWDED LABOR MARKET30
remains predominantly comprised of low skilled workers (Figure 2.2.1). More than half of the urban labor force has primary school education (36 per-cent) or no education (15 percent). This contrasts with countries such as Cambodia and Vietnam, countries of successful economic development through light manufacturing, where the median education of an urban worker is secondary education. The services sector is the most dominant employer, particularly for the educated. Three-quarters of urban employees are engaged in the service sector. This is true across cities of all size, although the sector employs fewer indi-viduals in Addis Ababa (Figure 2.2.3). Construction
employs 10 percent of urban workers, and manufac-turing employs 12 percent of urban employees. Those with higher levels of education are more likely to be in the service sector, in part reflecting the fact that more educated workers are more likely to be employed in the public sector (Figure 2.2.4). Service sector employees are more likely to be self-employed.
An important trait of urban labor markets is the importance of the public sector. One in five urban workers are employed by the public sector, and these are the workers with the highest levels of education. (Figures 2.2.5 and 2.2.6). Sixty-two percent of public sector employees have post-secondary education in
FIGURE 2.1: Unemployment and Wages
16%18%
22%
11%
Realmonthly
wage
Real hourlywage
premium
Decreasedprobabilityof looking
for another job
More hoursworked
(hours, rightaxis)
1) Unemployment rates by city size 2) Unemployment rates by education level
3) Wages and Education, 2014 4) Male premium (avg. 2003–2014)
0%No Education Primary Secondary Post-secondary/O
No Education Primary Secondary Post-secondary
Real
Hou
rly w
age
(200
3 Bi
rr)
0%
5%
10%
17%
24%
17%16%
15%
20%
25%
0%
5%
10%
15%
20%
35%
25%
30%
5%
10%
15%
20%
25%
Averageurban
AddisAbaba
Other majorcities
All otherurban
0
5
10
15
20
25
0.0
0.5
1.0
1.5
2.0
2.5
3.0
3.5
4.0
Source: World Bank staff calculations using UEUS 2003–2014.Notes: 1) Other major cities includes Mekelle, Assayita, Gondar, Dessie, Bahir Dar, Bishoftu, Adama, Jimma, Shashemene, Jijiga, Asossa, Awassa, Gambella, Harari and Dire Dawa. 4) Controlling for employee education.

trEnDS anD conStraintS in urban labor markEtS in Ethiopia 31
FIGURE 2.2: A Profile of Urban Labor Markets
16% 15% 15% 14%
43%36% 35% 37%
26%29% 27%
37%
15% 21% 23%13%
1) Education 2) Wage and self-employment by city size
0%
10%
20%
30%
40%
50%
60%
70%
80%
90%
10%
30%
50%
70%
90%
100%
Working agepopulation
Labor forceparticipants
Employed Unemployed
No education Primary Secondary Post-secondary
No education Primary Secondary Post-secondary
Noeducation
Primary Secondary Post-secondary
0%
20%
40%
60%
80%
49%
72%
53%41%
39%
24%
36%45%
11%4% 10% 14%
100%
Self emp.Wage emp. Other
Private (wage)Public Private (rest)
UrbanEthiopia
AddisAbaba
Majorcity
Otherurban
UrbanEthiopia
AddisAbaba
Majorcity
Otherurban
3) Sector of employment by city size 4) Sector of employment by education
0%
20%
40%
60%
80%
100%
Services Construction Manufacture AgricultureMining
0%
20%
40%
60%
80%
12%
21% 23% 22% 21%
28%
50%
32%20%
51%
28%
53%
18%2%
42%
11%
27%
25%
12%
62%58%
15% 11% 10%
10% 12% 11% 9%
75% 71% 75% 77%
100%
UrbanEthiopia
AddisAbaba
Majorcity
Otherurban
5) Public employment by city size 6) Public employment by education level
0%
20%
40%
60%
80%
100%
0%
20%
40%
60%
80%
100%
Private Public
Source: World Bank staff calculations using UEUS 2014.

5TH ETHIOPIA ECONOMIC UPDATE – WHY SO IDLE? WAGES AND EMPLOYMENT IN A CROWDED LABOR MARKET32
comparison to only 12 percent of those employed in the private sector.
Moreover, public sector employees are a large share of wage employees: from 1 in 2 wage employees in smaller urban centers to 1 in 3 wage employees in Addis Ababa. Although public sector workers do not dominate the urban labor force in any city, this group is a significant share of wage employees, particularly for small cities. As cities increase in size the private sector becomes larger and the public sector is a less impor-tant source of wage-employment. In Addis Ababa for example, 50 percent of the workforce are private sector wage-employees compared to the 23 percent that are public sector employees (Figure 2.2.5). However, even in large cities the magnitude of the public sector as an employer is significant. Ethiopia also has a much larger share of wage employees in the public sector than many of its peers. One in five wage jobs in Uganda, Rwanda, and Ghana are in the public sector.
Those in employment are evenly split between wage and self-employment, but in larger cities wage employment comprises a larger share of employees. On average, 49 percent of urban employees are in wage-employment, 39 percent are in self-employment and 11 percent are unpaid family workers, or appren-tices (Figure 2.2.2). The share of wage employment increases with city size, in Addis Ababa, more than 70 percent of workers are in wage employment. The cross-sectional UEUS data used in this analysis pro-vides a view at one point in time, but longitudinal studies in Addis Ababa show that many individuals move in and out of work and types of work (Franklin 2014). Usually, self-employment is less attractive for individuals with secondary and tertiary education but more attractive for those with low level of edu-cation and high levels of entrepreneurial ability (see Figure 2.3, also Annex 3 presents a more detailed dis-cussion of self-employment).
FIGURE 2.3: Three Types in Urban Labor Markets
Valu
e
Ability
aL
aH
Enterpreneurship
Employment
Unemployment
Individual ability is shown on the x axis, and on the y axis the value of different activities. The blue line indicates the value of employment for individuals of differing levels of ability. The red line indicates the value of entrepreneurship and the black line indicates the value of searching for employment (i.e. unemployment) for different levels of ability. The current value of unemployment is zero at any point in time but it secures employment in the future, so the total value is positive and increasing with ability.
Type Low levels of education Secondary and tertiary education High levels of entrepreneurial ability
Strategy These individuals determine they are better not searching for work as it is costly and the wages would not compensate the cost. They choose self-employment.
These individuals realize that they could earn more in the long run if they were employed rather than self-employed, even though they know this will require spells of unemployment while they look for work.
These individuals realize they can earn higher returns if they choose to be self-employed rather than employed. They are successful entrepreneurs and employ others.
Outcome Petty trading, shoe-shining (“ne-cessity self-employment”)
Employed in blue- or white-collar jobs OR unemployed looking for work
Owners of medium-sized enterprises (“opportunity entrepreneurs”)
Source: Poschke (2014).

trEnDS anD conStraintS in urban labor markEtS in Ethiopia 33
Labor Market Trends
Growth in Employment in Urban Ethiopia
Labor market trends in urban Ethiopia have been improving over time. Figure 2.4.1 shows that the labor force participation rate has increased consis-tently since 2004 from 55.6 percent of the population to 63.9 percent of the population. Women’s labor force participation rate is lower than men’s, by about 13 percentage points, but this difference has been consistent across time implying equal growth rates. The male wage premium has fallen over time from 40 percent in 2003 to 28 percent in 2014, suggesting some progress over time in addressing the earnings gap between men and women.
Although unemployment rates are high, there has been clear progress with unemployment rates decreasing in all cities since 2004. The average unem-ployment rate across urban Ethiopia was 22 percent in 2003 and fell to 16 percent in 2014 (Figure 2.4.2). The unemployment rate in Addis Ababa was 33 percent in 2003 and fell to 24 percent in 2014.
The supply of labor in urban areas has been increasing, driven by demographic changes and migration; the supply of jobs has increased to match this. The urban population in Ethiopia increased from 9.8 million in 2000 to 18.4 million in 2014, according to World Bank (World Development Indicators). This has been driven by natural urban population growth (aided by low mortality rates in
urban areas) and rural-urban migration (World Bank 2015b). Although rates of rural-urban migration have been relatively low, it has been encouraged by a large welfare premium experienced by migrants to urban areas (de Brauw et al. 2013) and high rates of agricul-tural growth, which have helped households finance migration (de Brauw 2014).
Underemployment, while also too prevalent, has been falling. Underemployment rates were as high 52 percent in urban Ethiopia in 2003 and this fell to 43 percent in 2014 (Figure 2.4.3). Although there has been progress, this is still a staggeringly high rate of underemployment. Underemployment has fallen much faster in Addis Ababa than elsewhere, suggest-ing that those that are in work are more able to fulfill their desired hours. In 2014 underemployment fell to 31 percent In Addis Ababa from 52 percent in 2003.
A more Educated Workforce, but Little Change in the Nature of Employment
Although, many labor market outcomes show improving trends, there has been no observable structural change in the nature of work in urban Ethiopia. The share of wage and self-employment has stayed constant in urban Ethiopia: 48 percent of the workforce was wage employed in 2003 and 49 percent in 2014 (Figure 2.5.1). This is potentially concerning given evidence suggests that it is wage employment, not self-employment, that leads to the emergence of a middle class in developing countries (Banerjee and Duflo 2008). Similarly, there has been almost no change in the composition of labor employed in ser-vices, construction and manufacturing (Figure 2.5.2). This suggests that the construction boom has not resulted in a change in the sectoral composition of the workforce with other sectors increasing their employ-ment at an equal rate. It also suggests that the structural change observed by Martins (2015) is not a result of the changing nature of employment in urban areas, but rather a shift in the labor force from rural to urban Ethiopia (as suggested in the World Bank’s Ethiopia Urbanization Review). The share of private sector
Real wage trends in urban Ethiopia have not reflected the increasing educational quality of the workforce. Until 2012 there was a substantial reduction in the returns to education and other worker characteristics observed over the last decade. These changes are likely a reflection fixed nominal public wages in the presence of very high inflation rates. High rates of inflation were a factor in the erosion of the value of real wages in the public sector in the past; and it is because of past inflation that nominal wages for public servants had to be adjusted significantly in 2014/15 (see Chapter 1). Given that the public sector is such a major employer this affects the returns on education in urban labor markets, and also seems to have an effect on private sector wages.
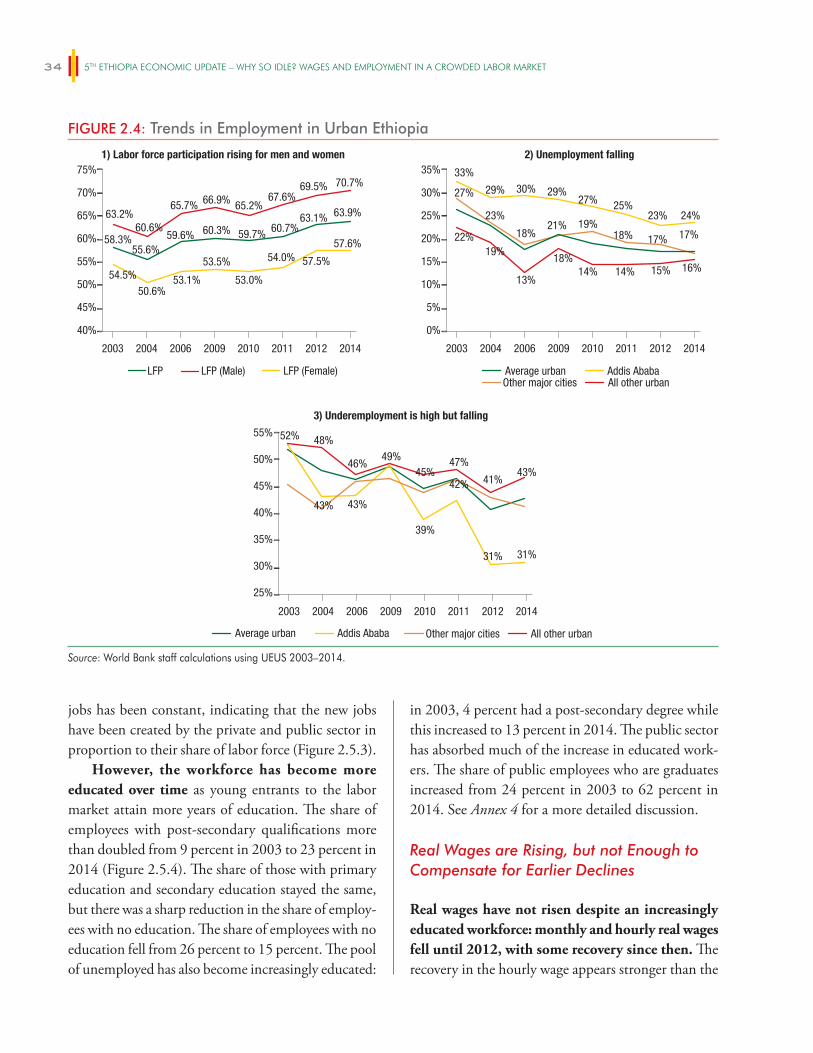
5TH ETHIOPIA ECONOMIC UPDATE – WHY SO IDLE? WAGES AND EMPLOYMENT IN A CROWDED LABOR MARKET34
jobs has been constant, indicating that the new jobs have been created by the private and public sector in proportion to their share of labor force (Figure 2.5.3).
However, the workforce has become more educated over time as young entrants to the labor market attain more years of education. The share of employees with post-secondary qualifications more than doubled from 9 percent in 2003 to 23 percent in 2014 (Figure 2.5.4). The share of those with primary education and secondary education stayed the same, but there was a sharp reduction in the share of employ-ees with no education. The share of employees with no education fell from 26 percent to 15 percent. The pool of unemployed has also become increasingly educated:
in 2003, 4 percent had a post-secondary degree while this increased to 13 percent in 2014. The public sector has absorbed much of the increase in educated work-ers. The share of public employees who are graduates increased from 24 percent in 2003 to 62 percent in 2014. See Annex 4 for a more detailed discussion.
Real Wages are Rising, but not Enough to Compensate for Earlier Declines
Real wages have not risen despite an increasingly educated workforce: monthly and hourly real wages fell until 2012, with some recovery since then. The recovery in the hourly wage appears stronger than the
FIGURE 2.4: Trends in Employment in Urban Ethiopia
Average urban Addis AbabaOther major cities All other urban
LFP LFP (Male) LFP (Female)
Average urban Addis Ababa Other major cities All other urban
1) Labor force participation rising for men and women 2) Unemployment falling
3) Underemployment is high but falling
40%
45%
50%
55%
60%
65%
70%
75%
2003 2004 2006 2009 2010 2011 2012 2014
58.3%55.6%
59.6% 60.3% 59.7%
52% 48%
46%49%
45%47%
41%43%
43% 43%
39%
42%
31% 31%
60.7%63.1% 63.9%63.2%
60.6%
65.7% 66.9% 65.2%67.6%
69.5% 70.7%
54.5%
50.6%53.1%
53.5%
53.0%
54.0% 57.5%
57.6%
2003 2004 2006 2009 2010 2011 2012 2014
2003 2004 2006 2009 2010 2011 2012 2014
0%
5%
10%
15%
20%
25%
30%
35%
27%
23%
18%21% 19%
18% 17% 17%
33%
29% 30% 29%27% 25%
23% 24%
22%19%
13%
18%14% 14% 15% 16%
25%
30%
35%
40%
45%
50%
55%
Source: World Bank staff calculations using UEUS 2003–2014.

trEnDS anD conStraintS in urban labor markEtS in Ethiopia 35
increase in monthly wages on account of the fall in the number of hours worked recorded between 2012 and 2014. Average real hourly and monthly wages in the private sector remained almost constant. Real wages increased in both the public and private sector after 2012, particularly hourly wages (Figures 2.6.1 and 2.6.2).
The increase in real wages post 2012 is observed in all sectors within the private sector, and all sub-sectors within manufacturing. Hourly earnings in manufacturing declined from 1.44 Birr (2003 Birr) per hour in 2006 to 1.24 Birr per hour in 2012, and then increased to 1.78 Birr per hour in 2014 (Figure 2.7.1). Changes at the lower end of the income distribution,
for temporary and casual workers, have been most important in increasing average wages. Examining the distribution of real wages in the private sector shows little change until 2012. From 2012 to 2014 there was a reduction in those paid less than 1 Birr (2003 prices) an hour and an increase in those paid between 1 and 3 Birr an hour (Figure 2.7.2). In 2014, earn-ings were about 40 percent lower for temporary and casual workers compared to permanent and contract workers. Over the entire period 2006–2014, earnings of permanent/contract workers declined, while those of temporary/casual workers increased (Figure 2.7.3).
The trend followed by real wages may in part be explained by labor productivity in the private sector,
FIGURE 2.5: A More Educated Workforce but Little Structural Change
Public Private (wage) Private (rest)
1) No change in the balance between wageand self-employment, all urban Ethiopia
2) No change in the sectoral composition of labor,all urban Ethiopia
3) The share of private sector jobs has beenconstant, all urban Ethiopia
4) Educational composition of the labor force,all urban Ethiopia
0%
20%
40%
60%
80%
100%
No education Primary Secondary Post-secondary/Other
2003 2004 2006 2009 2010 2011 2012 20140%
20%
40%
60%
80%
100%
2003 2004 2006 2009 2010 2011 2012 2014
Self emp.Wage emp. Other
0%
20%
40%
60%
80%
100%
2003 2004 2006 2009 2010 2011 2012 20140%
20%
40%
60%
80%
100%
2003 2004 2006 2009 2010 2011 2012 2014
ServicesConstructionManufactureAgriculture Mining
26%
28%
27%
22%
21%
21%
19%
15%
37%
35%
36%
35%
34%
35%
35%
35%
28%
28%
26%
28%
27%
25%
26%
27%
9% 10%
11%
15%
17%
18%
19%
23%
Source: World Bank staff calculations using UEUS 2003–2014.

5TH ETHIOPIA ECONOMIC UPDATE – WHY SO IDLE? WAGES AND EMPLOYMENT IN A CROWDED LABOR MARKET36
FIGURE 2.6: Nominal and Real Wage Trends
Mean Median
1) Monthly real wage, all urban Ethiopia 2) Hourly real wage, all urban Ethiopia
0
50
100
150
200
250
300
350
400
2003 2004 2006 2009 2010 2011 2012 2014 2006 2009 2010 2011 2012 2014
0.0
0.5
1.0
1.5
2.0
2.5
3.0
187.4182.3196.1202.6195.4185.9200.0200.0
282.7262.7
293.1297.1289.8
336.2354.4356.9
1.51.11.31.31.3
1.4
2.4
1.81.92.02.0
2.5
Source: World Bank staff calculations using UEUS 2003–2014.
FIGURE 2.7: Real Wage Trends by Sector, Sub-Sector and Wage Level
Manufacture Construction Services
All employees Permanent/contract workers Temporary/casual workers
2006 2012 2014
1) Average hourly real wages by sector 2) Distribution of real wages over time
0.0
2006 2009 2010 2011 2012 2014
2003
Birr
Year of survey
0.5
1.0
1.5
2.0
2.5
3.0
3.5
3) Real wage trends in manufacturing
2006 20102008 2012 2014
0.0
0 2 4 6 8 10
Dens
ity
0.2
0.4
0.6
0.8
1.0
1.0
1.5
2.0
2.5
3.0
Source: World Bank staff calculations using UEUS 2003–2014.

trEnDS anD conStraintS in urban labor markEtS in Ethiopia 37
but also reflects changes in public sector wages. Real wage trends have not reflected the increasing educa-tional quality of the work-force with a substantial reduc-tion and then some increase in the returns to education and worker characteristics observed over the last decade suggested by Oaxaca-blinder decomposition analysis. Real wages paid by manufacturing firms do, broadly, reflect changes in worker productivity. However, a deeper examination of both employment and firm data suggests that in Ethiopia, wage trends wages do not fol-low average labor productivity within sector or across cities (see Annex 5 for a detailed analysis). Real wage trends are likely a reflection of fixed nominal public wages in the presence of very high inflation rates. This affects private sector wages given the importance of the public sector as an employer in urban labor markets.
Constraints in Urban Labor Markets: Explaining High Unemployment
Background
As mentioned earlier, unemployment rates are per-sistently high in urban Ethiopia and especially in Addis Ababa, at 17 percent and 24 percent respec-tively in 2014.34 The rates have fallen in recent years, consistent with the impressive record of economic growth that the country has exhibited during the last decade. Nonetheless, such high rates of unemploy-ment, particularly among low skilled workers, are
unusual for a low-income country. What underpins the high rates of unemployment that characterizes the urban labor markets?
Several hypotheses have been posed about potential labor market imperfections in urban centers, which may help explain high unemploy-ment rates. Some have argued that, as in other African countries, high unemployment in Ethiopia is related to a queuing phenomenon for good quality jobs, which creates distortions that prevent the labor market from clearing (Serneels 2007, Krishnan 2000). Other plausible hypothesis that could explain this include: high search costs in the process of looking for a job (Franklin 2014), and high reservation wages among potential entrants to the labor market. In addition, others associate high unemployment and poverty rates to an oversupply of labor in comparison to the num-ber of jobs being created, and to the growing flows of migration to urban centers from rural areas (Bimerew 2015; Asmame 2011).
This section explores whether the labor data in Ethiopia is consistent with these various hypoth-eses in order to arrive at an improved understand-ing of the nature of the problem. Some hypotheses are tested more thoroughly than others due to data constraints, and in some cases, evidence from previ-ous studies on particular subjects are also included.
Is Unemployment Explained by Queueing for Permanent Jobs?
High rates of urban unemployment in low and middle income economies are often attributed to college educated workers queuing for highly desired, permanent jobs. In the past, unemployment in urban Ethiopia has also been related to a queuing phenomenon for good quality jobs (Serneels 2007, Krishnan 2000).
Whilst queuing may explain unemployment among graduates in urban Ethiopia, the majority
Several factors contribute to curb the efficiency of urban labor markets in Ethiopia. Unemployment has fallen but remains high, and the evidence suggests this is partly explained by low labor productivity in the private sector. While waiting for a permanent job, educated individuals take temporary low-skilled jobs that low-skilled individuals would otherwise take. Low productivity in the private sector translates into very low wage levels for the less skilled, preventing wages from adjusting to clear the market. These issues are aggravated by the high costs of searching for a job and the rural-urban migration influx. Finally, there is evidence that there are not enough opportunity for those with primary and secondary education in urban Ethiopia.
34 Following the official definition of unemployment in Ethiopia: some-one not engaged in a productive activity in the past 7 days, and available for work if the opportunity arises next month.
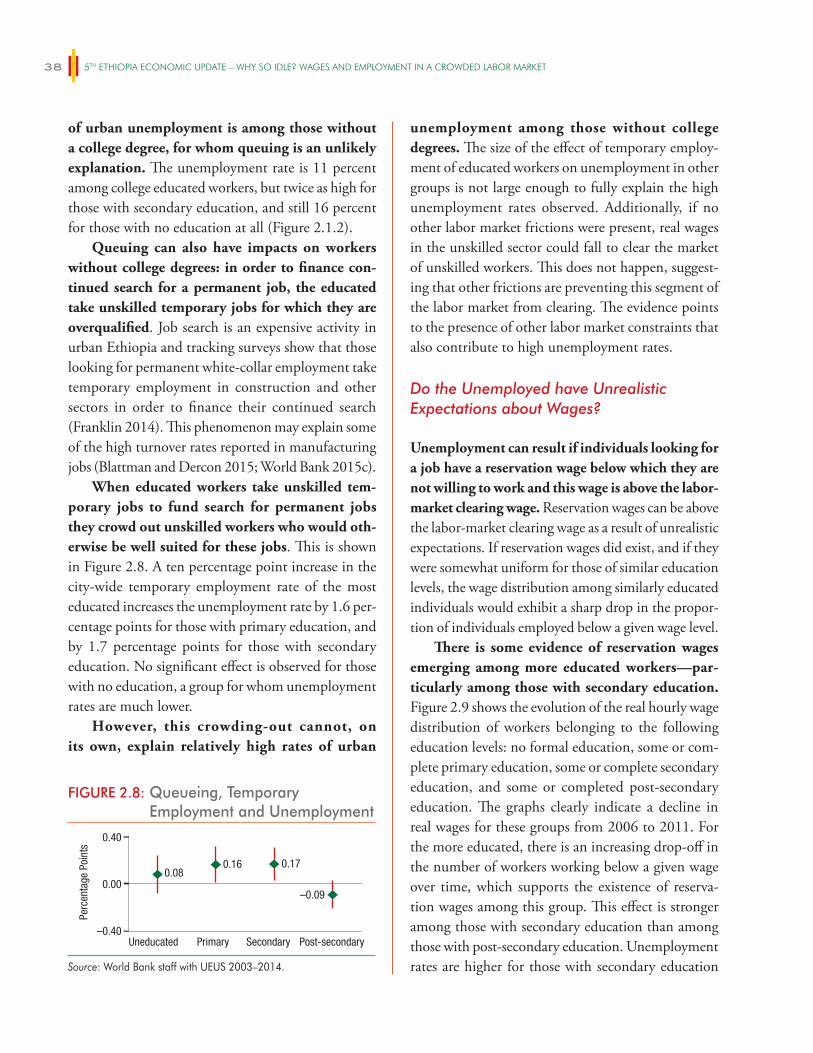
5TH ETHIOPIA ECONOMIC UPDATE – WHY SO IDLE? WAGES AND EMPLOYMENT IN A CROWDED LABOR MARKET38
of urban unemployment is among those without a college degree, for whom queuing is an unlikely explanation. The unemployment rate is 11 percent among college educated workers, but twice as high for those with secondary education, and still 16 percent for those with no education at all (Figure 2.1.2).
Queuing can also have impacts on workers without college degrees: in order to finance con-tinued search for a permanent job, the educated take unskilled temporary jobs for which they are overqualified. Job search is an expensive activity in urban Ethiopia and tracking surveys show that those looking for permanent white-collar employment take temporary employment in construction and other sectors in order to finance their continued search (Franklin 2014). This phenomenon may explain some of the high turnover rates reported in manufacturing jobs (Blattman and Dercon 2015; World Bank 2015c).
When educated workers take unskilled tem-porary jobs to fund search for permanent jobs they crowd out unskilled workers who would oth-erwise be well suited for these jobs. This is shown in Figure 2.8. A ten percentage point increase in the city-wide temporary employment rate of the most educated increases the unemployment rate by 1.6 per-centage points for those with primary education, and by 1.7 percentage points for those with secondary education. No significant effect is observed for those with no education, a group for whom unemployment rates are much lower.
However, this crowding-out cannot, on its own, explain relatively high rates of urban
unemployment among those without college degrees. The size of the effect of temporary employ-ment of educated workers on unemployment in other groups is not large enough to fully explain the high unemployment rates observed. Additionally, if no other labor market frictions were present, real wages in the unskilled sector could fall to clear the market of unskilled workers. This does not happen, suggest-ing that other frictions are preventing this segment of the labor market from clearing. The evidence points to the presence of other labor market constraints that also contribute to high unemployment rates.
Do the Unemployed have Unrealistic Expectations about Wages?
Unemployment can result if individuals looking for a job have a reservation wage below which they are not willing to work and this wage is above the labor-market clearing wage. Reservation wages can be above the labor-market clearing wage as a result of unrealistic expectations. If reservation wages did exist, and if they were somewhat uniform for those of similar education levels, the wage distribution among similarly educated individuals would exhibit a sharp drop in the propor-tion of individuals employed below a given wage level.
There is some evidence of reservation wages emerging among more educated workers—par-ticularly among those with secondary education. Figure 2.9 shows the evolution of the real hourly wage distribution of workers belonging to the following education levels: no formal education, some or com-plete primary education, some or complete secondary education, and some or completed post-secondary education. The graphs clearly indicate a decline in real wages for these groups from 2006 to 2011. For the more educated, there is an increasing drop-off in the number of workers working below a given wage over time, which supports the existence of reserva-tion wages among this group. This effect is stronger among those with secondary education than among those with post-secondary education. Unemployment rates are higher for those with secondary education
FIGURE 2.8: Queueing, Temporary Employment and Unemployment
Perc
enta
ge P
oint
s
Uneducated Primary Secondary Post-secondary
0.080.16 0.17
–0.09
–0.40
0.00
0.40
Source: World Bank staff with UEUS 2003–2014.
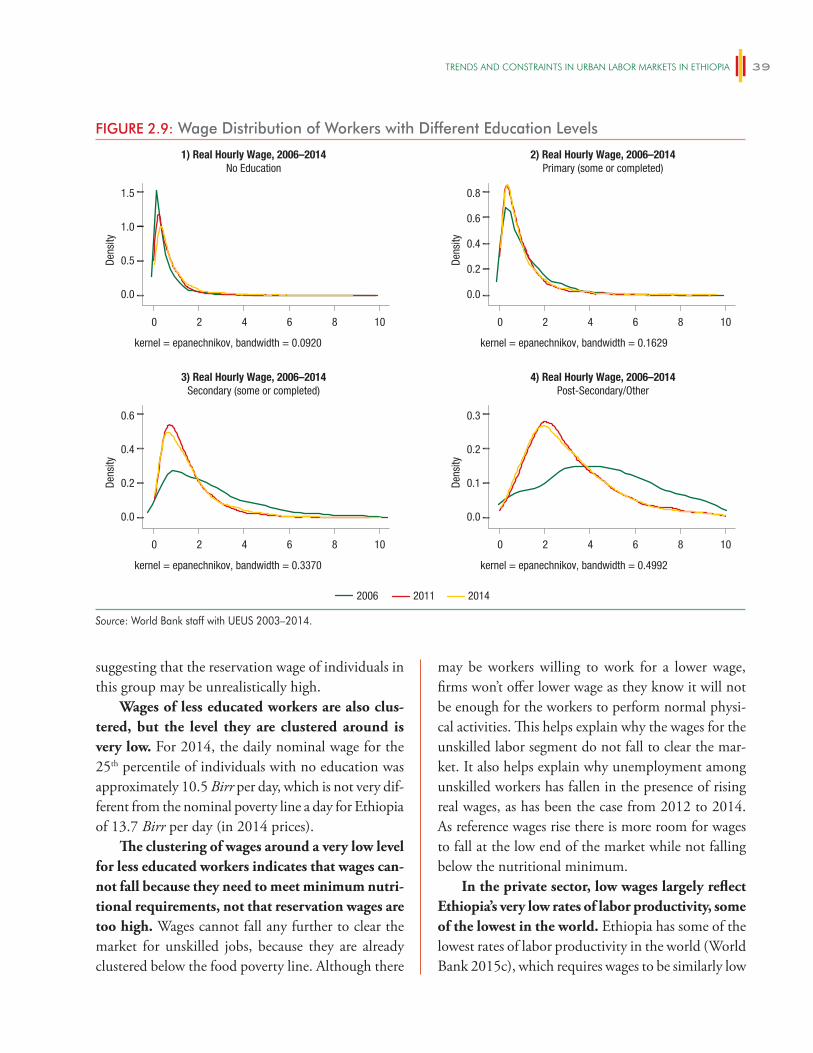
trEnDS anD conStraintS in urban labor markEtS in Ethiopia 39
suggesting that the reservation wage of individuals in this group may be unrealistically high.
Wages of less educated workers are also clus-tered, but the level they are clustered around is very low. For 2014, the daily nominal wage for the 25th percentile of individuals with no education was approximately 10.5 Birr per day, which is not very dif-ferent from the nominal poverty line a day for Ethiopia of 13.7 Birr per day (in 2014 prices).
The clustering of wages around a very low level for less educated workers indicates that wages can-not fall because they need to meet minimum nutri-tional requirements, not that reservation wages are too high. Wages cannot fall any further to clear the market for unskilled jobs, because they are already clustered below the food poverty line. Although there
may be workers willing to work for a lower wage, firms won’t offer lower wage as they know it will not be enough for the workers to perform normal physi-cal activities. This helps explain why the wages for the unskilled labor segment do not fall to clear the mar-ket. It also helps explain why unemployment among unskilled workers has fallen in the presence of rising real wages, as has been the case from 2012 to 2014. As reference wages rise there is more room for wages to fall at the low end of the market while not falling below the nutritional minimum.
In the private sector, low wages largely reflect Ethiopia’s very low rates of labor productivity, some of the lowest in the world. Ethiopia has some of the lowest rates of labor productivity in the world (World Bank 2015c), which requires wages to be similarly low
FIGURE 2.9: Wage Distribution of Workers with Different Education Levels
2006 2011 2014
kernel = epanechnikov, bandwidth = 0.0920 kernel = epanechnikov, bandwidth = 0.1629
kernel = epanechnikov, bandwidth = 0.3370 kernel = epanechnikov, bandwidth = 0.4992
1) Real Hourly Wage, 2006–2014No Education
2) Real Hourly Wage, 2006–2014Primary (some or completed)
0.0
0.5
1.0
1.5
0 2 4 6 8 10
Dens
ity
0.0
0.2
0.4
0.6
0.8
0 2 4 6 8 10
Dens
ity
3) Real Hourly Wage, 2006–2014Secondary (some or completed)
4) Real Hourly Wage, 2006–2014Post-Secondary/Other
0.0
0.2
0.4
0.6
0 2 4 6 8 10
Dens
ity
0.0
0.1
0.2
0.3
0 2 4 6 8 10
Dens
ity
Source: World Bank staff with UEUS 2003–2014.
5TH ETHIOPIA ECONOMIC UPDATE – WHY SO IDLE? WAGES AND EMPLOYMENT IN A CROWDED LABOR MARKET40
in order for firms to be competitive. Real wages paid by manufacturing firms do, broadly, reflect changes in worker productivity, although by no means perfectly.
Increasing labor productivity is key to improving the functioning of urban labor markets and reducing unemployment among the less educated. Aiding firm competitiveness should help address this constraint, but equally crucial is improving the educational quali-fication of workers and on-the-job skill formation to increase productivity. Mengistae (1999) shows that on the job skill formation can have a large impact on both marginal productivity and wages of workers.
Is Job-search too Costly to be Worthwhile?
High costs of job search are another labor market friction that may contribute to the high level of unemployment in Ethiopian cities. A locational mismatch between the unemployed and the location of firms, together with a lack of an efficient and com-prehensive system of matching potential candidates with job opportunities, can negatively affect the pace at which employment is created and vacancies are filled. This might be amplified in large and disperse labor markets, such as Addis Ababa.
Among the unemployed, centrally located job boards are one of the most common method of searching for a job. An Oxford-EDRI survey on unemployed youth in Addis Ababa finds 53.1 percent use this method in the last week, and 75.7 percent in the last 6 months (Franklin 2014). Usually these job boards are located in the city center of Addis Ababa. Newspaper ads are also a common search method, with 16 percent of the sample reporting having used in the last week, although sometimes respondents reported travelling to the job board to look at the most updated newspaper ads. While job boards and newspapers are the preferred method of search for the more educated segment of the sample (those with a diploma or a degree), those with lower educational background rely on more informal search methods, such as visiting work sites and asking for help through social networks.
The cost of traveling to job boards is not trivial for the unemployed, who live a median distance of 5.5 km from the city center, and who state that this constrains their search. The cost of a trip to search for work in the town center could be as much as 15 Birr in total (US$0.8), and on average respondents took about two trips per week; compared to a median total weekly expenditure of 100 Birr. Consequently, job seekers devoted around 25 percent of their bud-get to transport, a sizeable portion considering that they spend around 40 percent in food. Not surpris-ingly, 50 percent of the respondents reported that transportation costs are the main constraint for their job search, and 84 percent said that these costs were a constraint for their job search (Figure 2.10.1). The costs of looking for a job over a sustained period of time may explain why educated job seekers that can-not find a permanent work may accept low quality temporary jobs for some time (Franklin 2014).
Are the Right Kinds of Jobs Being Created?
High levels of unemployment could also be the result of mismatch between the types of workers looking for jobs and the types of jobs being created. A recent report on Ethiopia’s manufacturing sector points out that the shortage of skills is a key constraint for firms to grow and increase their productivity, and that firms often report struggling to find the technical and soft skills they require when recruiting candidates (World Bank 2015c). Given the high rates of unem-ployment also present in urban areas, this raises the question of whether the right types of jobs are being created. To assess the magnitude of this problem, data on firms hiring plans collected in a 2014 EDRI-University of Oxford survey of firms of all sectors in Addis Ababa is compared to the pool of unemployed in the 2014 UEUS. Firms were asked to report the type of vacancies they were trying to fill. The education profile of the current holders of these types of vacancies was used to estimate the education profile of the vacancies they were expecting to hire for. This provides a first approximation as to whether the firms are looking to
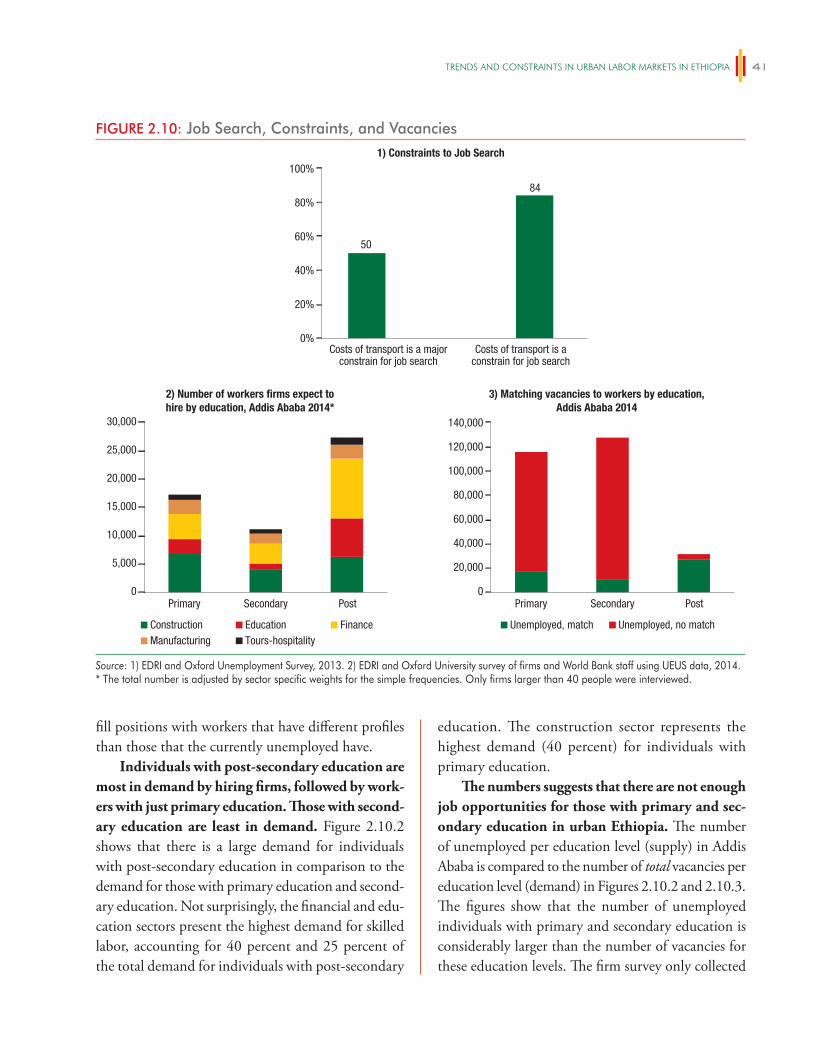
trEnDS anD conStraintS in urban labor markEtS in Ethiopia 41
fill positions with workers that have different profiles than those that the currently unemployed have.
Individuals with post-secondary education are most in demand by hiring firms, followed by work-ers with just primary education. Those with second-ary education are least in demand. Figure 2.10.2 shows that there is a large demand for individuals with post-secondary education in comparison to the demand for those with primary education and second-ary education. Not surprisingly, the financial and edu-cation sectors present the highest demand for skilled labor, accounting for 40 percent and 25 percent of the total demand for individuals with post-secondary
education. The construction sector represents the highest demand (40 percent) for individuals with primary education.
The numbers suggests that there are not enough job opportunities for those with primary and sec-ondary education in urban Ethiopia. The number of unemployed per education level (supply) in Addis Ababa is compared to the number of total vacancies per education level (demand) in Figures 2.10.2 and 2.10.3. The figures show that the number of unemployed individuals with primary and secondary education is considerably larger than the number of vacancies for these education levels. The firm survey only collected
FIGURE 2.10: Job Search, Constraints, and Vacancies
Construction Education FinanceManufacturing Tours-hospitality
Unemployed, match Unemployed, no match
1) Constraints to Job Search
2) Number of workers firms expect tohire by education, Addis Ababa 2014*
0%
0
50
84
20%
40%
60%
80%
100%
Costs of transport is a majorconstrain for job search
Costs of transport is aconstrain for job search
5,000
10,000
15,000
20,000
25,000
30,000
Primary Secondary Post
3) Matching vacancies to workers by education,Addis Ababa 2014
0Primary Secondary Post
20,000
40,000
60,000
80,000
100,000
120,000
140,000
Source: 1) EDRI and Oxford Unemployment Survey, 2013. 2) EDRI and Oxford University survey of firms and World Bank staff using UEUS data, 2014.* The total number is adjusted by sector specific weights for the simple frequencies. Only firms larger than 40 people were interviewed.
5TH ETHIOPIA ECONOMIC UPDATE – WHY SO IDLE? WAGES AND EMPLOYMENT IN A CROWDED LABOR MARKET42
data from firms with 40+ employees, so it does not fully reflect demand, but the magnitude of the gap suggests is unlikely to be fully filled by smaller firms. As previously discussed, the market does not clear for these workers because of overly-high expectations about wages among the secondary educated and low levels of labor productivity among unskilled workers.
These findings also concur with other studies that have shown that lack of skills for technical professions is a considerable cause for concern in Ethiopia. In the case of post-secondary education, the supply for labor was only slightly larger than the demand for labor. The firm survey only collected data from firms with 40+ employees, so it does not fully reflect demand, suggesting demand may not be too low for these workers. This finding would be consistent with the findings of a World Bank assessment on skills and competitiveness in Ethiopia that finds that vacancies for skilled production worker and managerial positions stay open for long periods of time and that 57 percent of firms identify lack of appropriate applicants as the key reason for leaving vacancies open for a long time (World Bank 2015c).35 However, there is a different type of skill mismatch among this group. An even larger challenge among this group is that those hired do not have the skills needed for the job—both technical and soft skills—and require training (World Bank 2015c). This results in firms engaging in substantial training costs, which in turn makes hiring more costly and curbs the rate at which firms create new positions.
Does Rural-urban Migration Contribute to Unemployment?
Many consider that increasing rates of rural migra-tion have contributed to increased rates of urban unemployment (Bimerew 2015 and Asmame 2011, among others). The effects of national and interna-tional migration on labor markets have been widely studied in the economic literature. The Harris-Todaro model predicts that a positive expected value of the urban-rural wage income differential should result in positive migration flows from rural to urban areas,
which might result in overcrowding and high unem-ployment rates in urban areas. It also predicts that even in a scenario of high unemployment in urban areas, migrating can still be a rational strategy that maximizes the expected value of wage income, depending on the wages and probabilities of obtaining employment in the two labor markets (urban and rural).
There is limited data on migration trends in Ethiopia with which to test this hypothesis. Recently, data on migration was collected in the 2007 Population and Housing Census and in the 2013 Labor Force Survey. The relationship between city-level rates of migration and unemployment is explored using this data together with subsequent waves of the UEUS collected in 2009 and 2014. Specifically, city level migration rates for the 16 cities for which the UEUS is representative are calculated, and the relationship between migration and an individual’s probability of finding a job is estimated.
Existing data suggests that individuals living in cities with a higher migration ratio are more likely to be unemployed, although this may simply reflect local economic conditions. An increase of 10 percent-age points of the proportion of the city population that migrated to the city in the last year increases the individual probability of being unemployed by 5.5 per-centage points. An identical increase in the proportion of the city population that migrated to the city in the last five years increases the probability of unemploy-ment by slightly less, around 1.9 percentage points (Table 2.1). However, it could be the case that local economic conditions affect both migration rates and labor market conditions, and the correlation between the two reflects this. Therefore, these results should be interpreted with care and not in a causal sense.
In addition, on its own migration cannot explain high rates of unemployment as wages should fall to match the additional supply of labor with demand. Other constraints, such as high reservation wages, low rates of labor productivity or high search costs are needed for high rates of unemployment to be explained.
35 See also World Bank 2014, page 4

trEnDS anD conStraintS in urban labor markEtS in Ethiopia 43
Short Summary and Recommendations
Ethiopia’s urbanization implies that understand-ing the nature of urban labor markets provides valuable insights for further poverty reduction and for a successful transition to a manufacturing and service-oriented economy. Urban labor markets differ from rural markets in several aspects: in large urban centers, wage employment is more important than self-employment, underemployment is lower but unemployment rates are high (particularly among the young, moderately educated population). Almost half of wage employees are employed by the public sector. The dominant sector in urban areas is the service sec-tor, and it increases in importance among the educated and also in smaller towns. Manufacturing is more important in larger cities and among the unskilled.
Many urban labor market trends are moving in the right direction although there has been little change in the structure of urban labor markets over time. Labor participation is increasing, and unemploy-ment and underemployment are falling. Ethiopia’s labor force is becoming increasingly educated. Wage
employment is becoming slightly more prevalent, particularly in Addis Ababa. The gender gap in labor participation (13 percentage points) as well as the proportion of wage employment in total employ-ment is similar to some structural and aspiration peers to Ethiopia. New jobs being created equally by the private and public sector and in proportion with the existing sectorial composition of the labor force.
Real wage trends in urban Ethiopia have not reflected the increasing educational quality of the workforce, although improvements were observed from 2012 to 2014. Wages are higher for those with more education—in 2014 wages were more than double for those with a degree compared to those with a secondary education—but returns on educa-tion have fallen over the last decade. The decline in wages at the beginning of the decade was somewhat compensated, although not fully, by increasing wages in the last two years (2012–2014). These changes may in part reflect changes in worker productivity, but they are also likely a reflection of changes in the nominal public sector wage structure, which also affects private sector wages given its importance as an employer in urban labor markets.
The phenomenon of queuing for high qual-ity jobs may contribute to unemployment among skilled and unskilled workers but it does not explain unemployment entirely. While waiting for permanent employment educated individuals take temporary low-skilled jobs to finance the relatively high costs of searching for a permanent job. The tem-porary jobs that are taken are those that low-skilled individuals would otherwise take. The relationship between temporary employment and unemployment among unskilled workers is present, but not large enough to explain much of the unemployment,
Higher levels of productivity in low-skilled jobs are desperately needed. Wages of those with little education are bunched around a very low level calling in to question whether they are able to fall any further to clear the market and still cover the basic needs of workers. Increasing labor productivity in these jobs will allow the marginal product of labor increases
TABLE 2.1: City-Level Migration Rates and Unemployment (marginal Effects)
(1) (2)
Probability of being unemployed
Probability of being unemployed
Migrant ratio less than 1 year
0.551***[0.211]
Migrant ratio less than 5 years
0.188**[0.0800]
Observations 38,491 38,491
Pseudo R-squared 0.097 0.097
City FE Yes Yes
Time FE Yes Yes
Robust standard errors in brackets, clustered by city.
*** p<0.01, ** p<0.05, * p<0.1
Source: World Bank staff calculations using the 2007 Population and Housing Census, the 2013 Labor Force Survey, UEUS 2009 and 2014. An individual’s age, gender, marital status, education level and house-hold size is controlled for. City and year fixed effects are also included.
5TH ETHIOPIA ECONOMIC UPDATE – WHY SO IDLE? WAGES AND EMPLOYMENT IN A CROWDED LABOR MARKET44
above the nutrition-based wage, enabling wages can adjust as needed in order to clear the market.
Although jobs are being created faster than growth in the urban workforce, not enough jobs are being created for those with primary and secondary education. By analyzing how the demand for labor compares to the supply of labor in Addis Ababa, it becomes clear that there are not enough job opportu-nities for those with primary and secondary education levels. This might have been aggravated by the increas-ing migration from rural to urban areas. Existing data suggests that individuals living in cities with a higher migration are more likely to be unemployed, although this may simply reflect local economic conditions.
There is a need for both faster job creation for non-graduates and investment in skills. More and better job opportunities for those with secondary and primary education are required. This segment of the market is in desperate need for high-productivity employment creation. Although low-skilled workers are more likely to be employed in manufacturing and construction than high-skilled workers, the service sector is still the primary employer of those with little education; growth in the service sector will be needed for job growth for non-graduates. Investment in skills of those in the job market is also needed. Many employers report delays in finding employees with the right skills and report needing to invest in training. This will likely require investment in on-the-job training as much as in formal training programs.
Costly job search also contributes to high unemployment rates and improving the technol-ogy of job search can help address this. The nature of the job search—searching for vacancies posted on physical job boards at specific points in the city—entails high transportation costs for the unemployed,
accounting for almost 25 percent of their monthly expenditure. Increasing access to information on job vacancies throughout the city through the use of technology can reduce the cost of searching. Targeted safety nets and labor market programs can also help reduce unemployment by investing in the skills of the unemployed, funding the cost of search, and improv-ing the quality of matching.
The following specific policy recommendations follow from these conclusions on the urban labor analysis:
1. Encourage firm creation and firm growth that creates jobs for non-graduates. This will require a focus on growth in services such as hospitality, as well as in construction and manufacturing, areas as these are sectors that are more likely to hire non-graduates. It will also require a focus on interventions that reduce costs associated with hiring non-graduates, such as certification of skills for secondary workers.
2. Increase labor productivity in the low-skill segment by addressing constraints faced by firms in access-ing capital (financial and physical) to ensure that the marginal product of labor increases above the nutrition-based wage.
3. Invest further in job training and technical train-ing programs to build the skills of those in the job market, both for low skilled workers to increase their productivity and at higher levels of education.
4. Introduce targeted urban safety nets and labor market programs to invest in skills of low-skilled employees and the unemployed and provide finan-cial support to enable their job search.
5. Enhance the use of ICT to provide information on job vacancies throughout the city and reduce the cost of job search.
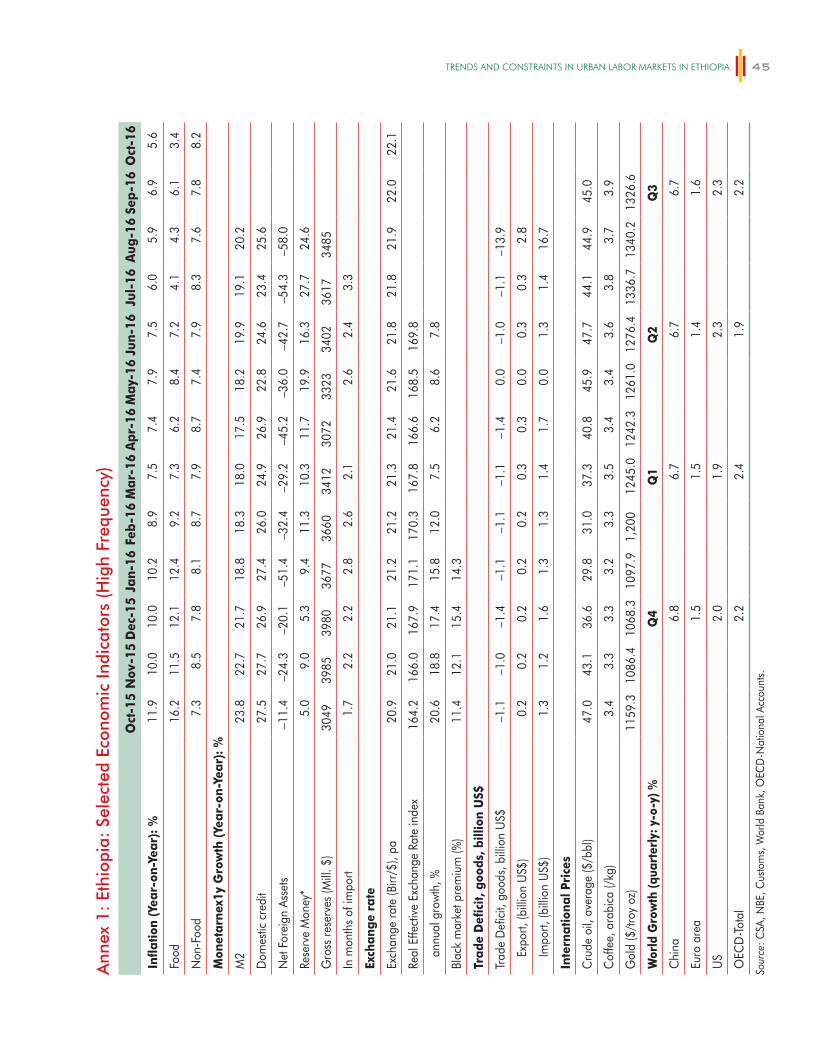
trEnDS anD conStraintS in urban labor markEtS in Ethiopia 45
Ann
ex 1
: Et
hiop
ia:
Sele
cted
Eco
nom
ic In
dica
tors
(Hig
h Fr
eque
ncy)
Oct
-15
Nov
-15
Dec
-15
Jan-
16Fe
b-1
6M
ar-1
6A
pr-1
6M
ay-1
6Ju
n-16
Jul-
16A
ug-1
6Se
p-1
6O
ct-1
6
Infla
tion
(Yea
r-on
-Yea
r): %
11.9
10.0
10.0
10.2
8.9
7.5
7.4
7.9
7.5
6.0
5.9
6.9
5.6
Food
16.2
11.5
12.1
12.4
9.2
7.3
6.2
8.4
7.2
4.1
4.3
6.1
3.4
Non
-Foo
d7.
38.
57.
88.
18.
77.
98.
77.
47.
98.
37.
67.
88.
2
Mon
etar
nex1
y G
row
th (
Year
-on-
Year
): %
M2
23.8
22.7
21.7
18.8
18.3
18.0
17.5
18.2
19.9
19.1
20.2
Dom
estic
cre
dit
27.5
27.7
26.9
27.4
26.0
24.9
26.9
22.8
24.6
23.4
25.6
Net
For
eign
Ass
ets
–11.
4–2
4.3
–20.
1–5
1.4
–32.
4–2
9.2
–45.
2–3
6.0
–42.
7–5
4.3
–58.
0
Rese
rve
Mon
ey*
5.0
9.0
5.3
9.4
11.3
10.3
11.7
19.9
16.3
27.7
24.6
Gro
ss re
serv
es (M
ill. $
)30
4939
8539
8036
7736
6034
1230
7233
2334
0236
1734
85
In m
onth
s of
impo
rt 1.
72.
22.
22.
82.
62.
1
2.6
2.4
3.3
Exch
ange
rat
e
Exch
ange
rate
(Birr
/$),
pa20
.921
.021
.121
.221
.221
.321
.421
.621
.821
.821
.922
.022
.1
Real
Effe
ctiv
e Ex
chan
ge R
ate
inde
x16
4.2
166.
016
7.9
171.
117
0.3
167.
816
6.6
168.
516
9.8
annu
al g
row
th, %
20.6
18.8
17.4
15.8
12.0
7.5
6.2
8.6
7.8
Blac
k m
arke
t pre
miu
m (%
)11
.412
.115
.414
.3
Trad
e D
efici
t, go
ods,
bill
ion
US$
Trad
e D
efici
t, go
ods,
bill
ion
US$
–1.1
–1.0
–1.4
–1.1
–1.1
–1.1
–1.4
0.0
–1.0
–1.1
–13.
9
Expo
rt, (b
illio
n U
S$)
0.2
0.2
0.2
0.2
0.2
0.3
0.3
0.0
0.3
0.3
2.8
Impo
rt, (b
illio
n U
S$)
1.3
1.2
1.6
1.3
1.3
1.4
1.7
0.0
1.3
1.4
16.7
Inte
rnat
iona
l Pri
ces
Cru
de o
il, a
vera
ge ($
/bbl
)47
.043
.136
.629
.831
.037
.340
.845
.947
.744
.144
.945
.0
Cof
fee,
ara
bica
(/kg
)3.
43.
33.
33.
23.
33.
53.
43.
43.
63.
83.
73.
9
Gol
d ($
/tro
y oz
)11
59.3
1086
.410
68.3
1097
.91,
200
1245
.012
42.3
1261
.012
76.4
1336
.713
40.2
1326
.6
Wor
ld G
row
th (q
uart
erly
: y-o
-y) %
Q4
Q1
Q2
Q3
Chi
na6.
86.
76.
76.
7
Euro
are
a1.
51.
51.
41.
6
US
2.0
1.9
2.3
2.3
OEC
D-To
tal
2.2
2.4
1.9
2.2
Sour
ce: C
SA, N
BE, C
usto
ms,
Wor
ld B
ank,
OEC
D-N
atio
nal A
ccou
nts.
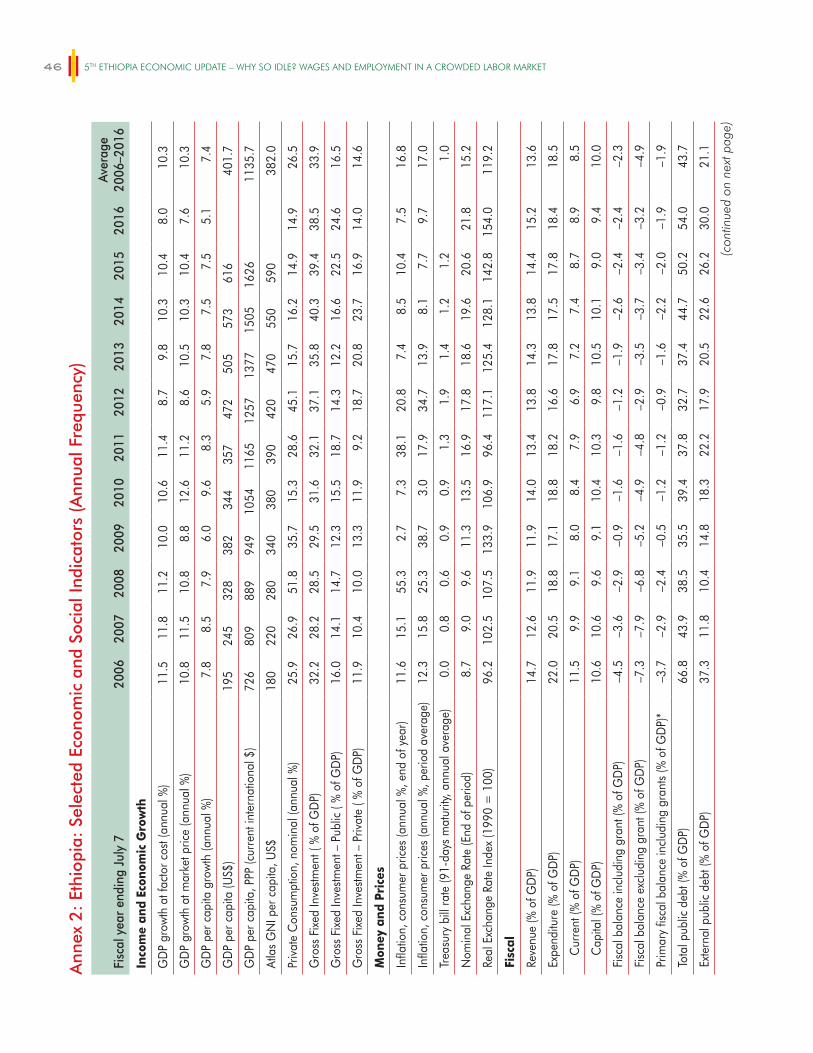
5TH ETHIOPIA ECONOMIC UPDATE – WHY SO IDLE? WAGES AND EMPLOYMENT IN A CROWDED LABOR MARKET46A
nnex
2:
Ethi
opia
: Se
lect
ed E
cono
mic
and
Soc
ial I
ndic
ator
s (A
nnua
l Fre
quen
cy)
Fisc
al y
ear
endi
ng J
uly
7 20
0620
0720
0820
0920
1020
1120
1220
1320
1420
1520
16Av
erag
e 20
06–2
016
Inco
me
and
Econ
omic
Gro
wth
GD
P gr
owth
at f
acto
r cos
t (an
nual
%)
11.5
11.8
11.2
10.0
10.6
11.4
8.7
9.8
10.3
10.4
8.0
10.3
GD
P gr
owth
at m
arke
t pric
e (a
nnua
l %)
10.8
11.5
10.8
8.8
12.6
11.2
8.6
10.5
10.3
10.4
7.6
10.3
GD
P pe
r cap
ita g
row
th (a
nnua
l %)
7.8
8.5
7.9
6.0
9.6
8.3
5.9
7.8
7.5
7.5
5.1
7.4
GD
P pe
r cap
ita (U
S$)
195
245
328
382
344
357
472
505
573
616
40
1.7
GD
P pe
r cap
ita, P
PP (c
urre
nt in
tern
atio
nal $
) 72
680
988
994
910
5411
6512
5713
7715
0516
26
1135
.7
Atla
s G
NI p
er c
apita
, US$
180
220
280
340
380
390
420
470
550
590
38
2.0
Priv
ate
Con
sum
ptio
n, n
omin
al (a
nnua
l %)
25.9
26.9
51.8
35.7
15.3
28.6
45.1
15.7
16.2
14.9
14.9
26.5
Gro
ss F
ixed
Inve
stmen
t ( %
of G
DP)
32.2
28.2
28.5
29.5
31.6
32.1
37.1
35.8
40.3
39.4
38.5
33.9
Gro
ss F
ixed
Inve
stmen
t – P
ublic
( %
of G
DP)
16.0
14.1
14.7
12.3
15.5
18.7
14.3
12.2
16.6
22.5
24.6
16.5
Gro
ss F
ixed
Inve
stmen
t – P
rivat
e ( %
of G
DP)
11.9
10.4
10.0
13.3
11.9
9.2
18.7
20.8
23.7
16.9
14.0
14.6
Mon
ey a
nd P
rice
s
Infla
tion,
con
sum
er p
rices
(ann
ual %
, end
of y
ear)
11.6
15.1
55.3
2.7
7.3
38.1
20.8
7.4
8.5
10.4
7.5
16.8
Infla
tion,
con
sum
er p
rices
(ann
ual %
, per
iod
aver
age)
12.3
15.8
25.3
38.7
3.0
17.9
34.7
13.9
8.1
7.7
9.7
17.0
Trea
sury
bill
rate
(91-
days
mat
urity
, ann
ual a
vera
ge)
0.0
0.8
0.6
0.9
0.9
1.3
1.9
1.4
1.2
1.2
1.
0
Nom
inal
Exc
hang
e Ra
te (E
nd o
f per
iod)
8.7
9.0
9.6
11.3
13.5
16.9
17.8
18.6
19.6
20.6
21.8
15.2
Real
Exc
hang
e Ra
te In
dex
(199
0 =
100
)96
.210
2.5
107.
513
3.9
106.
996
.411
7.1
125.
412
8.1
142.
815
4.0
119.
2
Fisc
al
Reve
nue
(% o
f GD
P)14
.712
.611
.911
.914
.013
.413
.814
.313
.814
.415
.213
.6
Expe
nditu
re (%
of G
DP)
22.0
20.5
18.8
17.1
18.8
18.2
16.6
17.8
17.5
17.8
18.4
18.5
Cur
rent
(% o
f GD
P)11
.59.
99.
18.
08.
47.
96.
97.
27.
48.
78.
98.
5
Cap
ital (
% o
f GD
P)10
.610
.69.
69.
110
.410
.39.
810
.510
.19.
09.
410
.0
Fisc
al b
alan
ce in
clud
ing
gran
t (%
of G
DP)
–4.5
–3.6
–2.9
–0.9
–1.6
–1.6
–1.2
–1.9
–2.6
–2.4
–2.4
–2.3
Fisc
al b
alan
ce e
xclu
ding
gra
nt (%
of G
DP)
–7.3
–7.9
–6.8
–5.2
–4.9
–4.8
–2.9
–3.5
–3.7
–3.4
–3.2
–4.9
Prim
ary
fisca
l bal
ance
incl
udin
g gr
ants
(% o
f GD
P)*
–3.7
–2.9
–2.4
–0.5
–1.2
–1.2
–0.9
–1.6
–2.2
–2.0
–1.9
–1.9
Tota
l pub
lic d
ebt (
% o
f GD
P)66
.843
.938
.535
.539
.437
.832
.737
.444
.750
.254
.043
.7
Exte
rnal
pub
lic d
ebt (
% o
f GD
P)37
.311
.810
.414
.818
.322
.217
.920
.522
.626
.230
.021
.1
(con
tinue
d on
nex
t pag
e)

trEnDS anD conStraintS in urban labor markEtS in Ethiopia 47
Ann
ex 2
: Et
hiop
ia:
Sele
cted
Eco
nom
ic a
nd S
ocia
l Ind
icat
ors
(Ann
ual F
requ
ency
)
Fisc
al y
ear
endi
ng J
uly
7 20
0620
0720
0820
0920
1020
1120
1220
1320
1420
1520
16Av
erag
e 20
06–2
016
Exte
rnal
Acc
ount
s
Goo
ds E
xpor
t gro
wth
(%, y
oy)
18.1
18.7
23.1
–1.0
38.3
37.1
14.8
–2.3
5.7
–8.5
–3.7
12.8
Goo
ds Im
port
grow
th (%
, yoy
)26
.411
.632
.813
.47.
7–0
.234
.03.
719
.719
.91.
615
.5
Mer
chan
dise
exp
orts
(% o
f GD
P)
6.7
6.1
5.5
4.5
6.7
8.6
7.3
6.5
5.9
4.6
4.0
6.0
of w
hich
cof
fee
expo
rts (%
of G
DP)
2.4
2.2
2.0
1.2
1.8
2.7
1.9
1.6
1.3
1.3
1.0
1.8
Mer
chan
dise
impo
rts (%
of G
DP)
28
.726
.027
.023
.827
.625
.825
.524
.124
.725
.523
.125
.6
Serv
ices
, net
(% o
f GD
P)1.
00.
80.
51.
31.
72.
40.
41.
21.
3–0
.1–0
.60.
9
Serv
ice
expo
rts (%
of G
DP)
7.2
6.6
5.9
6.0
6.8
8.1
6.5
6.0
5.7
4.8
4.1
6.1
Serv
ice
impo
rts (%
of G
DP)
–6.3
–5.8
–5.4
–4.7
–5.1
–5.7
–6.1
–4.8
–4.4
–4.8
–4.7
–5.3
Priv
ate
trans
fers
, net
(BoP
,% o
f GD
P)
8.0
8.6
8.8
8.3
9.0
8.6
7.5
7.5
7.3
7.6
8.3
8.1
Cur
rent
acc
ount
bal
ance
bef
ore
gran
t (Bo
P, %
of G
DP)
–1
3.4
–10.
5–1
2.2
–9.8
–10.
4–6
.5–1
0.6
–8.5
–10.
6–1
3.8
–11.
9–1
0.7
Cur
rent
acc
ount
bal
ance
afte
r gra
nt (B
oP, %
of G
DP)
–9
.1–4
.4–5
.6–5
.0–4
.0–0
.7–6
.5–5
.3–7
.9–1
1.5
–10.
4–6
.4
Fore
ign
Dire
ct In
vestm
ent (
% o
f GD
P)2.
42.
43.
02.
83.
23.
92.
52.
62.
63.
44.
23.
0
Exte
rnal
deb
t, to
tal (
% o
f GD
P)
37.3
11.8
10.4
14.8
18.3
22.2
17.9
20.5
22.6
26.2
30.0
21.1
Mul
tilat
eral
deb
t (%
of t
otal
ext
erna
l deb
t) 81
.151
.655
.746
.748
.646
.045
.445
.042
.134
.236
.548
.4
Deb
t ser
vice
ratio
(% o
f goo
ds a
nd N
FS)
8.0
7.3
2.9
2.3
2.7
4.5
6.9
9.6
10.3
16.1
16.7
7.9
Popu
latio
n, E
mpl
oym
ent a
nd P
over
ty
Popu
latio
n, to
tal (
mill
ions
), U
N78
.780
.983
.185
.387
.689
.992
.294
.697
.099
.4
88.9
Une
mpl
oym
ent R
ate
(urb
an)
17.0
20.4
18.9
18.0
17.5
16.5
17.4
16.8
17
.8
Pove
rty h
eadc
ount
ratio
at n
atio
nal p
over
ty li
ne
(% o
f pop
ulat
ion)
29.6
29
.6
Pove
rty h
eadc
ount
ratio
at $
1.25
a d
ay (P
PP)
(% o
f pop
ulat
ion)
30
.7
30.7
Pove
rty h
eadc
ount
ratio
at $
2 a
day
(PPP
) (%
of p
opul
atio
n)
66.0
66
.0
Ineq
ualit
y –
Inco
me
Gin
i
29.8
29
.8
Popu
latio
n G
row
h (a
nnua
l %)
2.7
2.7
2.7
2.6
2.6
2.6
2.6
2.5
2.5
2.5
2.
6
Life
Exp
ecta
ncy
57.3
58.4
59.4
60.4
61.3
62.1
62.8
63.4
64.0
61.0
(con
tinue
d)
(con
tinue
d on
nex
t pag
e)
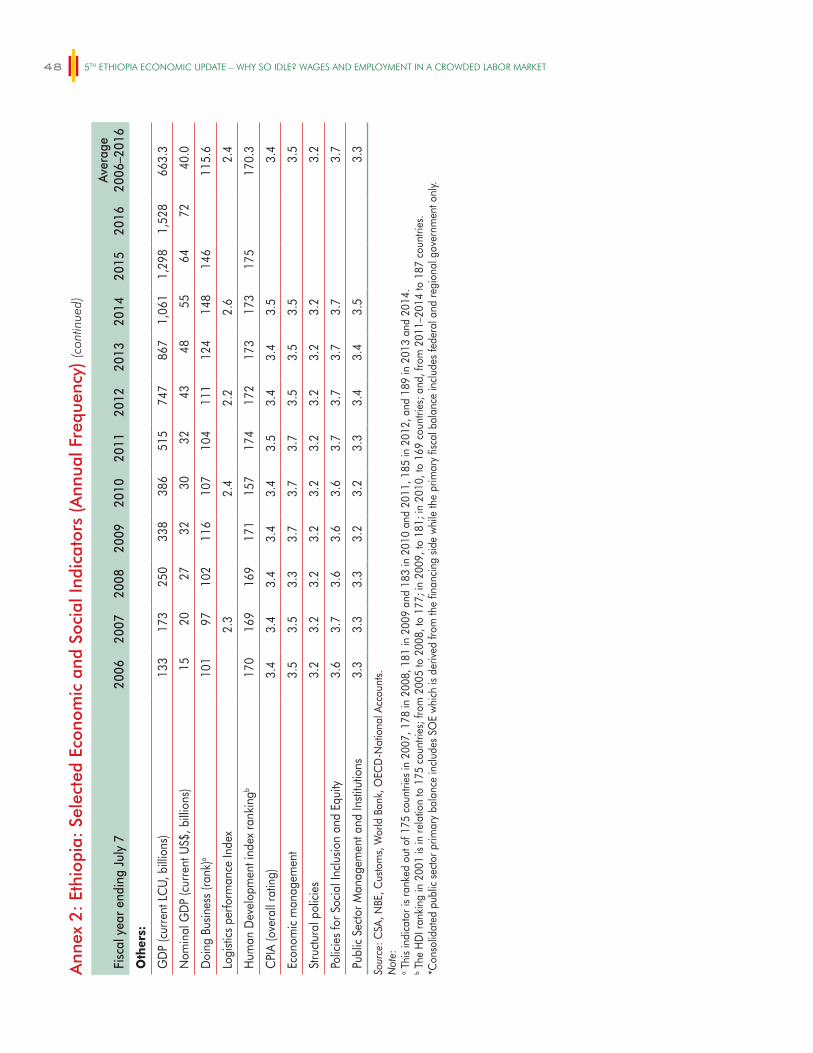
5TH ETHIOPIA ECONOMIC UPDATE – WHY SO IDLE? WAGES AND EMPLOYMENT IN A CROWDED LABOR MARKET48A
nnex
2:
Ethi
opia
: Se
lect
ed E
cono
mic
and
Soc
ial I
ndic
ator
s (A
nnua
l Fre
quen
cy)
Fisc
al y
ear
endi
ng J
uly
7 20
0620
0720
0820
0920
1020
1120
1220
1320
1420
1520
16Av
erag
e 20
06–2
016
Oth
ers:
GD
P (c
urre
nt L
CU,
bill
ions
) 13
317
325
033
838
651
574
786
71,
061
1,29
81,
528
663.
3
Nom
inal
GD
P (c
urre
nt U
S$, b
illio
ns)
1520
2732
3032
4348
5564
7240
.0
Doi
ng B
usin
ess
(rank
)a10
197
102
116
107
104
111
124
148
146
11
5.6
Logi
stics
per
form
ance
Inde
x
2.3
2.4
2.
2
2.6
2.4
Hum
an D
evel
opm
ent i
ndex
rank
ingb
170
169
169
171
157
174
172
173
173
175
17
0.3
CPI
A (o
vera
ll ra
ting)
3.4
3.4
3.4
3.4
3.4
3.5
3.4
3.4
3.5
3.4
Econ
omic
man
agem
ent
3.5
3.5
3.3
3.7
3.7
3.7
3.5
3.5
3.5
3.5
Stru
ctur
al p
olic
ies
3.2
3.2
3.2
3.2
3.2
3.2
3.2
3.2
3.2
3.2
Polic
ies
for S
ocia
l Inc
lusio
n an
d Eq
uity
3.6
3.7
3.6
3.6
3.6
3.7
3.7
3.7
3.7
3.7
Publ
ic S
ecto
r Man
agem
ent a
nd In
stitu
tions
3.3
3.3
3.3
3.2
3.2
3.3
3.4
3.4
3.5
3.3
Sour
ce: C
SA, N
BE, C
usto
ms,
Wor
ld B
ank,
OEC
D-N
atio
nal A
ccou
nts.
Not
e:a T
his
indi
cato
r is
rank
ed o
ut o
f 175
cou
ntrie
s in
200
7, 1
78 in
200
8, 1
81 in
200
9 an
d 18
3 in
201
0 an
d 20
11, 1
85 in
201
2, a
nd 1
89 in
201
3 an
d 20
14.
b The
HD
I ran
king
in 2
001
is in
rela
tion
to 1
75 c
ount
ries;
from
200
5 to
200
8, to
177
; in
2009
, to
181;
in 2
010,
to 1
69 c
ount
ries;
and
, fro
m 2
011–
2014
to 1
87 c
ount
ries.
*Con
solid
ated
pub
lic s
ecto
r prim
ary
bala
nce
incl
udes
SO
E w
hich
is d
eriv
ed fr
om th
e fin
anci
ng s
ide
whi
le th
e pr
imar
y fis
cal b
alan
ce in
clud
es fe
dera
l and
regi
onal
gov
ernm
ent o
nly.
(con
tinue
d)
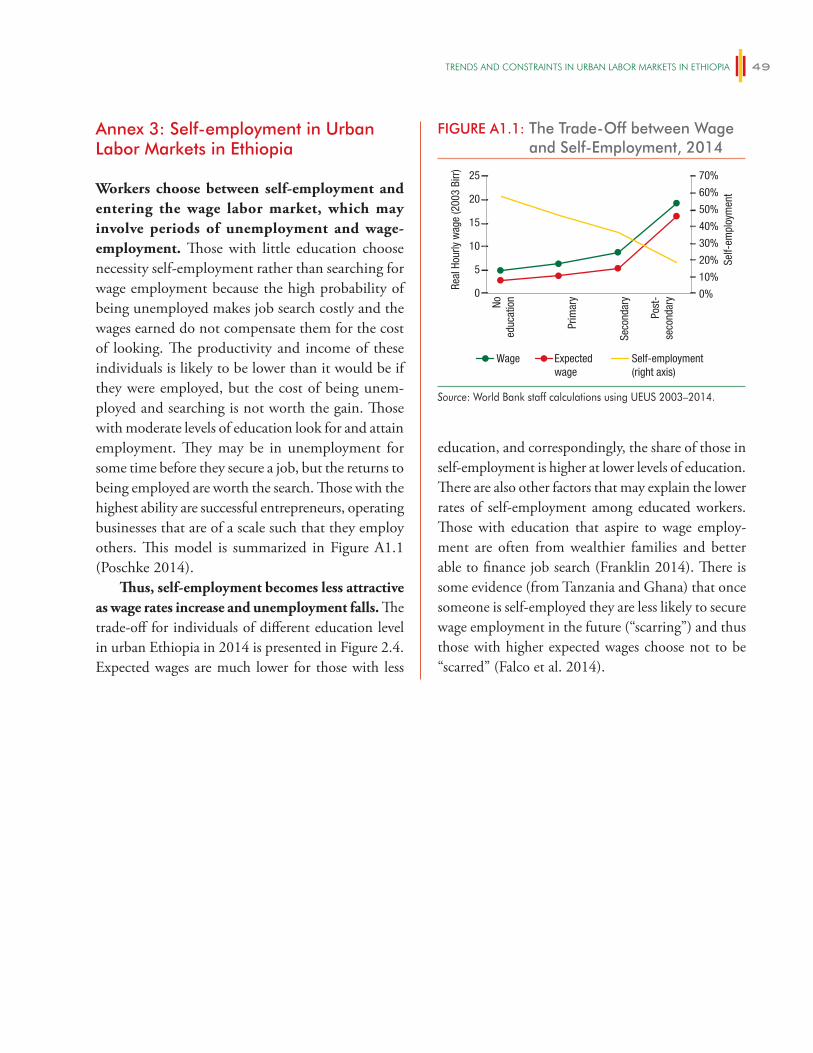
trEnDS anD conStraintS in urban labor markEtS in Ethiopia 49
Annex 3: Self-employment in Urban Labor Markets in Ethiopia
Workers choose between self-employment and entering the wage labor market, which may involve periods of unemployment and wage-employment. Those with little education choose necessity self-employment rather than searching for wage employment because the high probability of being unemployed makes job search costly and the wages earned do not compensate them for the cost of looking. The productivity and income of these individuals is likely to be lower than it would be if they were employed, but the cost of being unem-ployed and searching is not worth the gain. Those with moderate levels of education look for and attain employment. They may be in unemployment for some time before they secure a job, but the returns to being employed are worth the search. Those with the highest ability are successful entrepreneurs, operating businesses that are of a scale such that they employ others. This model is summarized in Figure A1.1 (Poschke 2014).
Thus, self-employment becomes less attractive as wage rates increase and unemployment falls. The trade-off for individuals of different education level in urban Ethiopia in 2014 is presented in Figure 2.4. Expected wages are much lower for those with less
education, and correspondingly, the share of those in self-employment is higher at lower levels of education. There are also other factors that may explain the lower rates of self-employment among educated workers. Those with education that aspire to wage employ-ment are often from wealthier families and better able to finance job search (Franklin 2014). There is some evidence (from Tanzania and Ghana) that once someone is self-employed they are less likely to secure wage employment in the future (“scarring”) and thus those with higher expected wages choose not to be “scarred” (Falco et al. 2014).
FIGURE A1.1: The Trade-Off between Wage and Self-Employment, 2014
Wage Expectedwage
Self-employment(right axis)
Real
Hou
rly w
age
(200
3 Bi
rr)
Self-
empl
oym
ent
0
5
10
15
20
25
Noed
ucat
ion
Prim
ary
Seco
ndar
y
Post
-se
cond
ary 0%
10%
20%
30%
40%
50%
60%
70%
Source: World Bank staff calculations using UEUS 2003–2014.

5TH ETHIOPIA ECONOMIC UPDATE – WHY SO IDLE? WAGES AND EMPLOYMENT IN A CROWDED LABOR MARKET50
Annex 4: Changes in the Composition of the Labor Force
In particular, the educational composition of pub-lic sector employees has improved significantly with a dramatic increase in the share of public employees who are graduates. Perhaps one of the largest changes that has taken place over time is the educational composition of public sector employ-ees (Figures A2.1 and A2.2). The public sector has consistently been the largest employer of those with post-secondary qualification in Ethiopia. In 2003, 24 percent of public sector employees had a graduate degree and by 2014 this had increased to 62 percent. These graduates displaced individuals with secondary schooling (Figure A2.1). In 2003, those with second-ary education were quite likely to be employed by the state: 41 percent of those with secondary education were thus employed. By 2014, this had more than
halved to 21 percent of those with secondary school-ing securing public sector employment.
Addis Ababa has seen some change in the struc-ture of employment, particularly in the growth of wage employment with respect to self-employment. The share of wage-employees increased from 62 per-cent in 2003 to 72 percent in 2014 (Figure A2.3), representing an almost equal increase in private and public sector wage employment—4 percentage points and 3 percentage points respectfully. Although the sectoral composition of the labor force in Addis Ababa did not change much, there was evidence of a rapid expansion in the construction sector in the employment data (Figure A2.4). The construction sector increased from employing 9 percent of the workforce, to employing 12 percent of the workforce from 2011, a relative increase in its share of employ-ment of 33 percent. The public sector increased its share in employment from 20 percent to 23 percent.
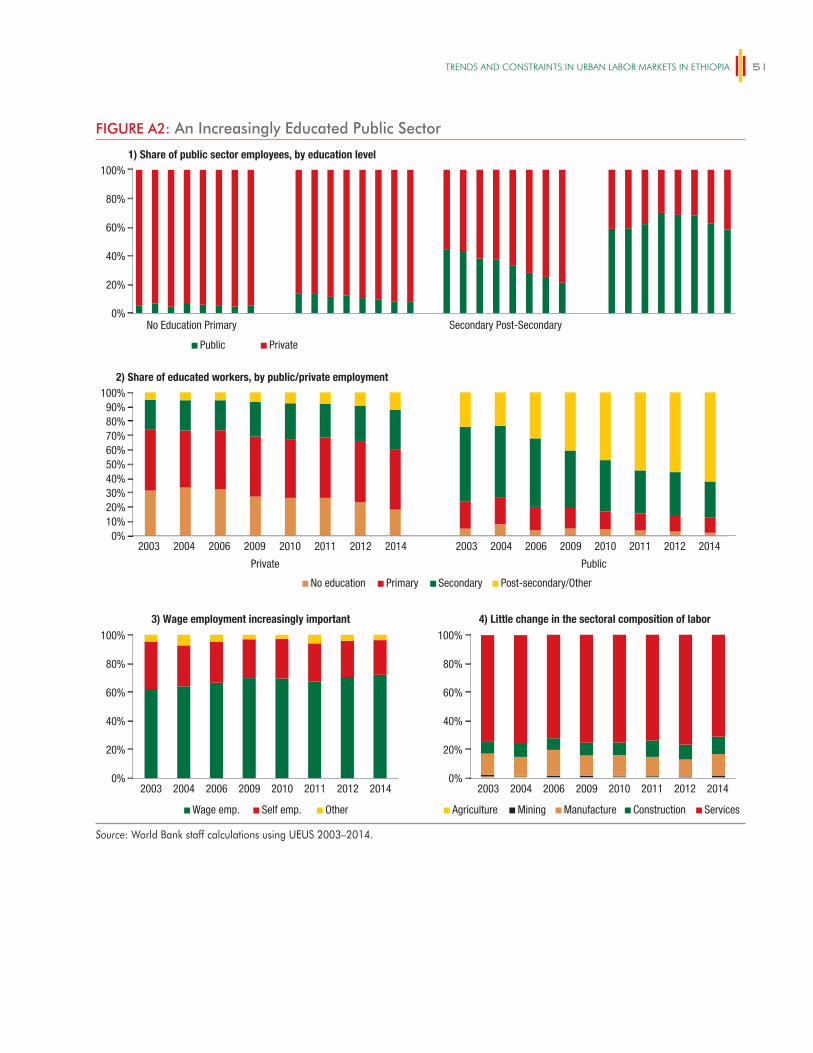
trEnDS anD conStraintS in urban labor markEtS in Ethiopia 51
FIGURE A2: An Increasingly Educated Public Sector
2) Share of educated workers, by public/private employment
3) Wage employment increasingly important 4) Little change in the sectoral composition of labor
0%
20%
40%
60%
80%
10%
30%
50%
70%
90%100%
No education Primary Secondary Post-secondary/Other
2003 2004 2006 2009 2010 2011 2012 2014 2003 2004 2006 2009 2010 2011 2012 2014
1) Share of public sector employees, by education level
0%
20%
40%
60%
80%
100%
PrivatePublic
0%
20%
40%
60%
80%
100%
2003 2004 2006 2009 2010 2011 2012 20140%
20%
40%
60%
80%
100%
2003 2004 2006 2009 2010 2011 2012 2014
ServicesConstructionManufactureAgriculture Mining
No Education Primary
Private Public
Secondary Post-Secondary
Self emp.Wage emp. Other
Source: World Bank staff calculations using UEUS 2003–2014.
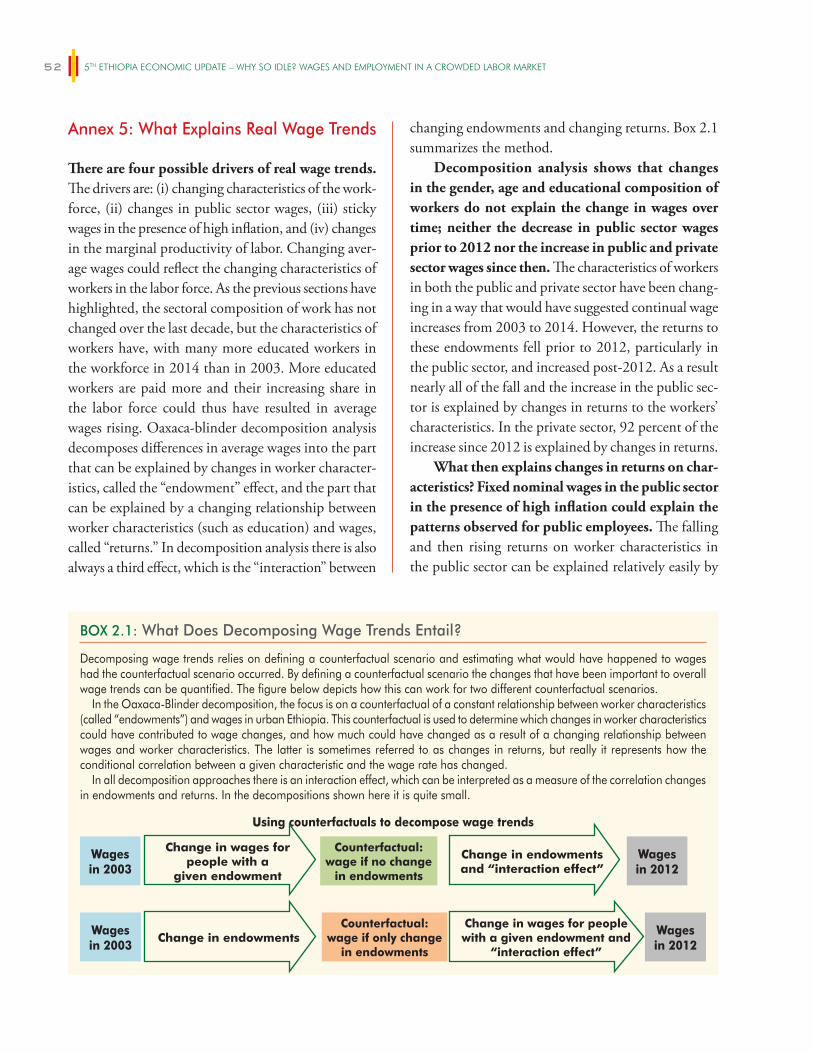
5TH ETHIOPIA ECONOMIC UPDATE – WHY SO IDLE? WAGES AND EMPLOYMENT IN A CROWDED LABOR MARKET52
Annex 5: What Explains Real Wage Trends
There are four possible drivers of real wage trends. The drivers are: (i) changing characteristics of the work-force, (ii) changes in public sector wages, (iii) sticky wages in the presence of high inflation, and (iv) changes in the marginal productivity of labor. Changing aver-age wages could reflect the changing characteristics of workers in the labor force. As the previous sections have highlighted, the sectoral composition of work has not changed over the last decade, but the characteristics of workers have, with many more educated workers in the workforce in 2014 than in 2003. More educated workers are paid more and their increasing share in the labor force could thus have resulted in average wages rising. Oaxaca-blinder decomposition analysis decomposes differences in average wages into the part that can be explained by changes in worker character-istics, called the “endowment” effect, and the part that can be explained by a changing relationship between worker characteristics (such as education) and wages, called “returns.” In decomposition analysis there is also always a third effect, which is the “interaction” between
changing endowments and changing returns. Box 2.1 summarizes the method.
Decomposition analysis shows that changes in the gender, age and educational composition of workers do not explain the change in wages over time; neither the decrease in public sector wages prior to 2012 nor the increase in public and private sector wages since then. The characteristics of workers in both the public and private sector have been chang-ing in a way that would have suggested continual wage increases from 2003 to 2014. However, the returns to these endowments fell prior to 2012, particularly in the public sector, and increased post-2012. As a result nearly all of the fall and the increase in the public sec-tor is explained by changes in returns to the workers’ characteristics. In the private sector, 92 percent of the increase since 2012 is explained by changes in returns.
What then explains changes in returns on char-acteristics? Fixed nominal wages in the public sector in the presence of high inflation could explain the patterns observed for public employees. The falling and then rising returns on worker characteristics in the public sector can be explained relatively easily by
BOX 2.1: What Does Decomposing Wage Trends Entail?
Decomposing wage trends relies on defining a counterfactual scenario and estimating what would have happened to wages had the counterfactual scenario occurred. By defining a counterfactual scenario the changes that have been important to overall wage trends can be quantified. The figure below depicts how this can work for two different counterfactual scenarios.
In the Oaxaca-Blinder decomposition, the focus is on a counterfactual of a constant relationship between worker characteristics (called “endowments”) and wages in urban Ethiopia. This counterfactual is used to determine which changes in worker characteristics could have contributed to wage changes, and how much could have changed as a result of a changing relationship between wages and worker characteristics. The latter is sometimes referred to as changes in returns, but really it represents how the conditional correlation between a given characteristic and the wage rate has changed.
In all decomposition approaches there is an interaction effect, which can be interpreted as a measure of the correlation changes in endowments and returns. In the decompositions shown here it is quite small.
Using counterfactuals to decompose wage trends
Wages in 2003
Change in wages forpeople with a
given endowment
Counterfactual:wage if no change
in endowments
Change in endowmentsand “interaction effect”
Wages in 2012
Wages in 2003
Change in endowmentsCounterfactual:
wage if only change in endowments
Change in wages for people with a given endowment and
“interaction effect”
Wages in 2012
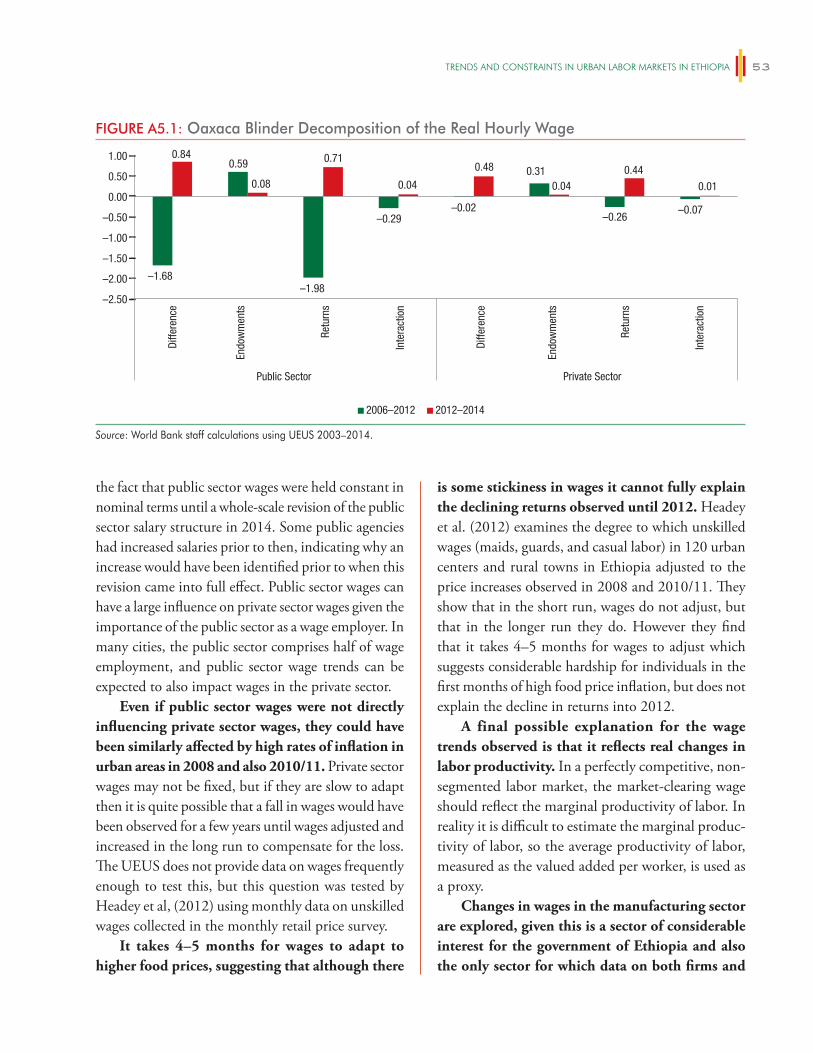
trEnDS anD conStraintS in urban labor markEtS in Ethiopia 53
the fact that public sector wages were held constant in nominal terms until a whole-scale revision of the public sector salary structure in 2014. Some public agencies had increased salaries prior to then, indicating why an increase would have been identified prior to when this revision came into full effect. Public sector wages can have a large influence on private sector wages given the importance of the public sector as a wage employer. In many cities, the public sector comprises half of wage employment, and public sector wage trends can be expected to also impact wages in the private sector.
Even if public sector wages were not directly influencing private sector wages, they could have been similarly affected by high rates of inflation in urban areas in 2008 and also 2010/11. Private sector wages may not be fixed, but if they are slow to adapt then it is quite possible that a fall in wages would have been observed for a few years until wages adjusted and increased in the long run to compensate for the loss. The UEUS does not provide data on wages frequently enough to test this, but this question was tested by Headey et al, (2012) using monthly data on unskilled wages collected in the monthly retail price survey.
It takes 4–5 months for wages to adapt to higher food prices, suggesting that although there
is some stickiness in wages it cannot fully explain the declining returns observed until 2012. Headey et al. (2012) examines the degree to which unskilled wages (maids, guards, and casual labor) in 120 urban centers and rural towns in Ethiopia adjusted to the price increases observed in 2008 and 2010/11. They show that in the short run, wages do not adjust, but that in the longer run they do. However they find that it takes 4–5 months for wages to adjust which suggests considerable hardship for individuals in the first months of high food price inflation, but does not explain the decline in returns into 2012.
A final possible explanation for the wage trends observed is that it reflects real changes in labor productivity. In a perfectly competitive, non-segmented labor market, the market-clearing wage should reflect the marginal productivity of labor. In reality it is difficult to estimate the marginal produc-tivity of labor, so the average productivity of labor, measured as the valued added per worker, is used as a proxy.
Changes in wages in the manufacturing sector are explored, given this is a sector of considerable interest for the government of Ethiopia and also the only sector for which data on both firms and
FIGURE A5.1: Oaxaca Blinder Decomposition of the Real Hourly Wage
–1.68
0.59
–1.98
–0.29–0.02
0.31
–0.26–0.07
0.84
0.08
0.71
0.04
0.48
0.040.44
0.01Di
ffere
nce
Endo
wm
ents
Retu
rns
Inte
ract
ion
Diffe
renc
e
Endo
wm
ents
Retu
rns
Inte
ract
ion
Public Sector Private Sector
2012–20142006–2012
–2.50
–2.00
–1.50
–1.00
–0.50
0.00
0.50
1.00
Source: World Bank staff calculations using UEUS 2003–2014.

5TH ETHIOPIA ECONOMIC UPDATE – WHY SO IDLE? WAGES AND EMPLOYMENT IN A CROWDED LABOR MARKET54
employees are available. Data on firms in Ethiopia is limited. Data is collected annually on medium- and large-scale manufacturing firms, but these firms employ a relatively small proportion of the labor force. Nevertheless this data is used to examine wage trends and labor productivity within manufacturing and to explore whether wages follow average labor productivity. Details on how value added per worker was calculated are provided in Box 2.2.
Real labor costs reported by manufacturing firms broadly reflect trends in average labor pro-ductivity. The manufacturing firm data exhibits con-siderable noisiness, even after trimming the data for outliers. Taking this into account, Figure A5.2.1 shows labor productivity falling until 2010 and increased thereafter. Although labor productivity increased after 2010, gains in recent years have been weaker. Figure A5.2.2 showed real labor costs falling until 2011 and then increasing. These figures suggest that trends in real wages paid by manufacturing firms do, broadly, reflect changes in worker productivity, but by no means perfectly, with large differences in the ratio between the two values.
However, a deeper examination of both employ-ment and firm data suggests wage trends may not be so easily explained. Wages do not follow trends in average productivity within sector or across cities. Per worker labor cost trends are similar across industries reflecting the findings above that the wage changes were reflected in all sectors (Figure A5.2.2). Labor pro-ductivity gains have been present in most industries, but have declined since 2010 in textiles, apparel, and leather (Figure A5.2.3). This is not reflected in a differ-ent wage trend in this sector (Figure A5.2.2). Increases in wages have been present in all cities, but this is not the case for increases in labor productivity, with as many of the large cities experiencing falls in productivity as increases since 2012 (Figures A5.2.4 and A5.2.5). The scatter plot in A5.2.6, shows that (broadly) productiv-ity and wages are positiviely correlated (confirmed in the regression results of Table A5.1), but this positive trend is not significant, and explains very little of the variation in wage levels (2 percent). This could reflect the quality of the manufacturing census data, but it does question whether it is real productivity changes that underly the observed wage trends.
BOX 2.2: Measuring Labor Productivity
Value added per workers is defined as total output and income from services provided, minus total costs (raw materials, other industrial costs, and non-industrial costs) divided by the number of workers. When cost data was missing, this was treated as 0 costs. However a missing value was kept when the total costs of raw materials and parts were missing.
Labor costs and productivity according to the manufacturing census are based on permanent and contract workers only. That is, wage costs and employment of seasonal and temporary workers is excluded. Temporary workers make up about 20 percent of workers, so the true level of labor productivity would be lower than the levels estimated here. However, there is considerable measurement error in estimating the person-months engaged and the wages paid and this makes it justifiable to exclude them.
All averages reported are weighted by firms’ number of permanent and contract workers. Labor costs are quite sensitive to outliers, particularly in some years such as 2009/10, and removing the top and bottom
percentile by year or in the pooled data produces rather different numbers. Unless stated otherwise, averages presented are calculated after truncating the pooled data (i.e. removing the top and bottom percentiles in the pooled firm-level data).

trEnDS anD conStraintS in urban labor markEtS in Ethiopia 55
FIGURE A5.2: Labor Costs and Labor Productivity in the Manufacturing Sector
Value added per worker Output per worker
Firm values weighted by number of workers. Top and bottom percentiles dropped. Source: Census
All manufacturing Food products and beveragesTextiles, apparel, leather Other Manufacturing
Firm values weighted by number of workers. Top and bottom percentiles dropped. Source: Census
All manufacturing Food products and beveragesTextiles, apparel, leather Other Manufacturing
Firm values weighted by number of workers. Top and bottom percentiles dropped. Source: Census
Firm values weighted by number of workers. Top and bottom percentiles dropped. Source: Census
Mekele Addis Ababa AwasaBahir Dar Debre Zeyit Dire Dawa Nazaret
Source: UEUS
Source: UEUS and Census
Mekele Addis Ababa AwasaBahir Dar Debre Zeyit Dire Dawa Nazaret
1) Trends in labor productivity in manufacturingLabor productivity in '000 2003 Birr
2) Trends in labor costs in manufacturingPer worker labor costs in '000 2003 Birr
0
2006 2008 2010 2012 2014
50
100
150
4
2006 2008 2010 2012 2014
6
10
8
12
3) Trends in labor productivity by subsectorValue added per worker in '000 2003 Birr
4) Real monthly wage trends by cityMonthly earnings by city – all manufacturing workers in 2003 Birr
02006 2008 2010 2012 2014
20
40
80
60
200
2006 2008 2010 2012 2014
300
500
400
5) Trends in labor productivity by cityValue added per worker by city in '000 2003 Birr
0
2006 2008 2010 2012 2014
50
200
100
150
6) Growth in real wages and labor productivity by cityEarnings and productivity growth across cities correlation 0.099
–0.3
–1 0 1 2 3 4
–0.2
0.2
Real
mon
thly
ear
ning
s –
annu
al p
erce
ntag
e gr
owth
Real value added per worker – annual percentage growth
0.0
–0.1
0.1
Source: World Bank staff calculations using UEUS 2003–2014.

5TH ETHIOPIA ECONOMIC UPDATE – WHY SO IDLE? WAGES AND EMPLOYMENT IN A CROWDED LABOR MARKET56
TABLE A5.2: Earnings and Productivity, Regression Results All Cities
log real hourly wages log real monthly earnings
All paid workers Permanent/contract workers Permanent/contract workers
log real per worker value added
0.013(0.039)
0.029(0.038)
0.013(0.051)
0.024(0.043)
–0.014(0.043)
0.004(0.038)
2009 –0.067(0.086)
–0.273(0.097)
–0.236(0.087)
2010 –0.043(0.089)
–0.286(0.1)
–0.196(0.089)
2011 –0.152(0.087)
–0.413(0.097)
–0.281(0.087)
2012 –0.259(0.085)
–0.515(0.097)
–0.417(0.086)
Constant 0.304(0.125)
0.37(0.141)
0.491(0.162)
0.777(0.155)
5.874(0.137)
6.06(0.138)
N 63 63 62 62 62 62
R-squared 0.002 0.221 0.001 0.432 0.002 0.372
Note: Standard errors in brackets. All regressions control for city fixed effects. Standard errors are reported below the coefficient estimate.
57
REFERENCES
Laurens, B. 2005. “Monetary Policy Implementation at Different Stages of Development.” IMF Occasional paper 244.
Laurens, B. and R Maino. 2007. “China: Strengthening Monetary Policy implementation.” IMF WP/07/14.
Li, K-W. 1996. “Some thoughts on China’s 1995 Bank Reform.” Conference Paper presented at conference on “China’s Economic Reform and Opening” (Oct 1995 Hong Kong) and the Canadian Economic Association Conference (May/June 1996).
Mehran, H., M. Quintyn, T. Nordman, and B. Laurens. 1996. “Monetary and Exchange System Reforms in China: An Experiment in Gradualism.” IMF Occasional Paper 141
Mishra, P., P. Montiel, and A. Spilimbergo. 2012. “Monetary Transmission in Low-Income Countries: Effectiveness and Policy Implications.”, IMF Economic Review 60, 270–302.
Montes-Negret, F. 1995. “China’s Credit Plan: an Overview.” Oxford Review of Economic Policy, 11 (4)
Xu, Y. 2000. “China’s exchange rate policy.” China Economic Review 11: 262–277.
Section C: The Future View
Bellmon. 2015. Bellmon Analysis 2015/16: Reassessment of crop Production and Marketing for the year 2014/15.
Bloomberg. 2016. Ethiopia to Miss 11 Percent Growth Target As Drought Hurts Agriculture. Addis Ababa and New York.
CIMMYT. 2015. Wheat Atlas (http://wheatatlas.org) Accessed December 15, 2015.
Ethiopian Reporter Amharic Edition. December 26, 2015.
Chapter 1: Recent Economic Developments and Outlook
Section B: The Long View
Aklilu, Y. 2009. “The money multiplier: proximate determinants and stability (the case of Ethiopia).” National Bank of Ethiopia Birritu Magazine 103, pp 22–35.
Buzeneca, I and R. Maino. 2007. “Monetary Policy Implementation: Results from a Survey.” IMF WP/07/7.
Cheng, E. and Y. Cheng. 1998. “Banking Reform and the Separation of Policy and Commercial Loans in China.” MOCT-MOST: Economic Policy of Transitional Economies, 8, 5–21.
Geiger, M. 2008. “Instruments of Monetary Policy in China and their effectiveness: 1994–2006” UN Conference on Trade and Development Discussion Papers 187.
Geiger, M. 2010. “Monetary Policy in China: Institutions, Targets, Instruments and Strategies.” PhD Dissertation, Julius Maximilians University of Würzburg; Available at: http://d-nb.info/1021078328/34
Green, S. 2005. “Making Monetary Policy Work in China: A Report from the Money Market Front Line.” Stanford Center for International Development, Working Paper No. 245.
IMF. 2013a. “The Gambia Staff Report for the 2013 Article IV Consultation.” Country Report 13/289.
IMF. 2013b. “Sub-Saharan Africa Regional Economic Outlook.” May 2013.
IMF. 2014. “Zambia Staff Report for the 2013 Article IV Consultation.” Country Report 14/5.
5TH ETHIOPIA ECONOMIC UPDATE – WHY SO IDLE? WAGES AND EMPLOYMENT IN A CROWDED LABOR MARKET58
FAO. 1997. FAO/WFP Crop and Food Supply Assessment Mission to Ethiopia. http://www.fao.org/giews.
FAO. 2010. FAO/WFP Crop and Food Security Assessment Mission to Ethiopia. http://www.fao.org/giews.
FAO. 2015. Crop prospects and Food Situation. No. 4. http://www.fao.org/giews.
FEWS NET. 2015. Ethiopia Food Security Outlook October 2015 to March 2016. www.fes.net/Ethiopia.
Humanitarian Requirements Document (HRD). 2016. Ethiopia Joint Government and Humanitarian Partners` Document, Addis Ababa, Ethiopia.
Minot, N., W. James, L. Solomon, K. Leulseged, G. Abate G, and R. Shaidur. 2015., The Wheat Supply Chain in Ethiopia: Patterns, Trends, and Policy Options. International Food Policy Research Institute (IFPRI), Washington DC.
Reuters. 2015., http://www.voanews.com/content/ethi-opia-drought-gdp-finance-minister/3055402.html
UNDP. 2016. Assessing the cost drought in Ethiopia and the case for long-term development approach. Policy Note.
UNOCHA. 2016. http://www.unocha.org/top-stories/all-stories/world-must-support-ethiopi-ans-frightening-drought-looms; http://www.un.org/apps/news/story.asp?NewsID=52382#.Vsc5rk8WMrp.
USDA and USAID. 2016. GAIN Report Number ET1603. http://gain.fas.usda.gov/.
Xinshen, D., F. Belay, H. Steven, S. Alemayehu, W. Kassu, and Y. Bingxin. 2007. Agricultural growth linkages in Ethiopia: Estimates Using Fixed and Flexible Price Models. International Food Policy Research Institute Discussion Paper No. 00695
Chapter 2: Trends and Constraints in Urban Labor Markets in Ethiopia
Asmame, Birhan. 2011. “Causes and Consequences of Rural-Urban Migration”. Mimeo. University of South Africa.
Banerjee, Abhijit V., and Esther Duflo. 2008. “What Is Middle Class about the Middle Classes around the World?” Journal of Economic Perspectives 22 no. 2: 3–28.
Bigsten, Arne, Taye Mengistae, and Abebe Shimeles. 2013. Labor Market Integration in Urban Ethiopia, 1994–2004. Economic Development and Cultural Change 61(4): 889–931.
Bimerew, Habtamu. 2015. “Rural-Urban Migration and its Consequence on Urban living: the case in Hawassa City Southern Ethiopia.” Global Journal of Human-Social Science: Economics. Volume 15 Issue 4 Version 1.0.
de Brauw, Alan, Valerie Mueller, and Tassew Woldehanna. 2013. “Does Internal Migration Improve Overall Well-Being in Ethiopia?” ESSP working paper 55. International Food Policy Research Institute (IFPRI).
de Brauw, Alan, 2014. “Migration, Youth and Agricultural Productivity in Ethiopia.” Background Paper prepared for the Ethiopia Poverty Assessment.
Falco, Paolo, Andrew Kerr, Pierella Paci, and Bob Rijkers, 2014. “Working toward Better Pay: Earning Dynamics in Ghana and Tanzania.” World Bank Publications, The World Bank, number 18553.
Franklin, Simon. 2014. “Work, Unemployment and Job Search among the Youth in Urban Ethiopia.” Mimeo, Oxford University.
Headey, Derek, Fantu Bachewe Nisrane, Ibrahim Worku, Mekdim Dereje, and Alemayehu Seyoum Taffesse. 2012. “Urban Wage Behavior and Food Price Inflation: The Case of Ethiopia.” ESSP Working Paper 41
Imbert, Clement. 2012. “Decomposing the Labor Market Earnings Inequality: The Public and Private Sectors in Vietnam, 1993–2006.” The World Bank Economic Review 27(1): 55–79.
Kibru, Martha. 2012. Employment Challenges in Ethiopia. Friedrich Ebert Stiftung, Nairobi.
Krishnan, P. 2000. “Public Sector Pay and Private Sector Wage Premiums: Testing Alternative

rEfErEncES 59
Models of Wage Determination.” Center for the Study of African Economies, Oxford, Working Paper Series, WPS/2000-7.
Martins, P. 2015. “Structural change in Ethiopia – an update using 2013 LFS data.” Background Paper prepared for World Bank’s Ethiopia Great Run Report published in 2015.
McMillan, M. and D. Rodrik, 2011. Globalization, Structural Change, and Productivity Growth, NBER Working Paper 17143, National Bureau of Economic Research.
Mengistae, Taye. 1999. The Relative Effects of Skill Formation and Job Matching on Wage Growth in Ethiopia. World Bank Policy Research Working Paper 2104.
Mengistae, Taye. 1999. Wage rates and job queues: does the Public Sector Overpay in Ethiopia? World Bank Policy Research Working Paper 2104
Poschke, M., 2014. “A Model of Entrepreneurship and Employment in Ethiopia: Simulating the Impact of an Urban Safety Net.” Background Paper pre-pared for the Ethiopia Poverty Assessment.
Serneels, Peter. 2007. “The nature of unemployment among young men in urban Ethiopia.” Review of Development Economics. Vol. 11, No. 1, pp. 170–186, February.
World Bank. 2013. Ethiopia Economic Update II: Laying the Foundation for Achieving Middle Income Status. Africa Region, World Bank, Washington DC.
World Bank. 2014. “Skills for Competitiveness and Growth in the Manufacturing Sector.” World Bank Report: Human Development, Education and Private Sector Development, Africa Region, Washington DC.
World Bank. 2015a. Ethiopia Poverty Assessment. Africa Region, World Bank, Washington DC.
World Bank 2015b. Ethiopia Urbanization Review: Urban Institutions for a Middle-Income Ethiopia. Africa Region, World Bank, Washington DC.
World Bank. 2015c. Ethiopia Economic Update IV: Overcoming Constraints in the Manufacturing Sector. Africa Region, World Bank, Washington DC.
World Bank 2015d. Rwanda Labor Market Study. Africa Region, World Bank, Washington DC.
World Bank 2015e. Ethiopia’s Great Run: The Growth Acceleration and How to Pace It. Africa Region, World Bank, Washington DC.
World Bank 2016. Systematic Country Diagnostics (SCD): Priorities for Ending Extreme Poverty and Promoting Shared Prosperity. Africa Region, World Bank, Washington DC.


The World Bank1818 H Street, NW Washington, DC 20433Phone: (202) 473-1000Fax: (202) 477-6391


![S4Net: Single stage salient-instance segmentation · rather than instance segments. 2.3 Semantic instance segmentation Earlier semantic instance segmentation methods [22–24, 54]](https://img.pdfslide.us/doc/110x75/5fa63c2f83ae5a0cdb44c66e/s4net-single-stage-salient-instance-segmentation-rather-than-instance-segments.jpg)