Embed Size (px)
Citation preview

Document of
The World Bank FUF COPYFOR OFFICIAL USE ONLY
Report No. 3089a-UNI
NIGERIA
KANO STATE
KANO AGRICULTURAL DEVELOPMENT PROJECT
STAFF APPRAISAL REPORT
April 6, 1981
West Africa Projects DepartmentAgriculture Division I
This document has a restricted distribution and may be used by recipients only in the performance oftheir official duties. Its contents may not otherwise be disclosed without World Bank authorization.
Pub
lic D
iscl
osur
e A
utho
rized
Pub
lic D
iscl
osur
e A
utho
rized
Pub
lic D
iscl
osur
e A
utho
rized
Pub
lic D
iscl
osur
e A
utho
rized
Pub
lic D
iscl
osur
e A
utho
rized
Pub
lic D
iscl
osur
e A
utho
rized
Pub
lic D
iscl
osur
e A
utho
rized
Pub
lic D
iscl
osur
e A
utho
rized
CURRENCY EQUIVALENTS
Currency Unit = Naira (N)US$1 = Naira 0.55N = US$1.818
WEIGHTS AND MEASURES
Unless otherwise stated, all weights andmeasures used in this report are metric:
1 metric ton = 0.981 hectare (ha) = 2.47 acre1 kilometer (km) = 0.62 mile
FISCAL YEAR
January 1 - December 31

FOR OFFICIAL USE ONLYABBREVIATIONS
ADAs - Accelerated Development AreasADPs - Agricultural Development ProjectsAI - Agricultural InstructorAPMU - Agricultural Projects Management Unit for West AfricaAPMEPU - Agricultural Projects Monitoring, Evaluation and Planning Unit
(Kaduna)ARMTI - Agricultural and Rural Management Training InstituteASP - Advanced Service PackageBSP - Basic Service PackageCFU - Central Fertilizer UnitCMEU - Central Monitoring and Evaluation UnitCRCS - Chief Reg4.strar of Cooperative SocietiesCSDT - Central Staff Development and Training DivisionDOC - Department of CooperativesERR - Economic Rate of ReturnFADP - Funtua Agricultural Development ProjectFASU - Federal Agricultural' Support tJnitFDA - Federal Department of AgricultureFDRD - Federal Department of Rural DevelopmentFGN - Federal Government of NigeriaFMA - Federal Ministry of AgricultureFO - Field OverseerFSC - Farm Service CenterHJRBDA - Hadejia Jama'are River Basin Development AuthorityIAR - Institute of Agricultural ResearchKASCO - Kano Agricultural Supply CompanyKNADP - Kano Agricultural Development ProjectKNARDEC - Kano State Agriculture and Rural Development Executive CommitteeKNAPMU - Kano Agricultural Programme Management UnitKNSG - Kano State GovernmentKSCB - Kano State Cooperative BankLBA - Licensed Buying AgentLGA Local Government AreaLGC - Local Government CouncilMANR - Ministry of Agriculture and Natural Resources (Kano State)NLG - Ministry of Local Government (Kano State)MRCD - Ministry of Rural and Community Development (Kano State)MTU - Mobile Training UnitNWH - Ministry of Works and Housing (Kano State)NACB - National Agricultural and Cooperative BankNCB - National Cotton BoardNEPA - National Electric Power AuthorityNFMC - National Fertilizer Marketing CompanyPSL - Pre-Season LoansRTDD - Research and Technical Development DivisionRWS - Rural Water SupplySLAR - Side-Looking Airborne RadarWRECA - Water Resources Engineering and Construction AgencyZDC - Zonal Development CommitteeZMIEU - Zonal Monitoring and Evaluation Unit
This document has a restricted distribution and may be used by recipients only in the performance oftheir ofricial duties. Its conents may not otherwise be disclosed without World Bank authorization.


NIGERIA
KANO STATE
KANO AGRICULTURAL DEVELOPMENT PROJECT
Table of Contents
Page No.
I. BACKGROUND ............................................ 1
II. THE AGRICULTURAL SECTOR .. 1
III. THE PROJECT AREA. 5
A. Physical Features. 5B. Infrastructure and Social Services. 6C. Socio-Economic Features. 8D. Land Use, Farm Structure and Farm Enterprise 9E. State Agricultural Institutions .12
IV. THE PROJECT .14
A. Summary Description .14B. Detailed Features .16C. Cost Estimates .23D. Proposed Financing .24E. Procurement .27F. Disbursements .27
G. Accounts and Audits .28H. Programming and Budgeting .28
V. TECHNOLOGY AND PRODUCTION SPECIFICATIONS .... .......... 29
A. Crop Development ................................. 29B. Forestry Development ............................. 32C. Feeder Roads ..................................... 32D. Rural Water Supplies ............................. 33
VI. DEMAND, MARKETING AND PRICES .35
A. Demand .35B. Marketing .35C. Prices .36
This Report is based on the findings of an IBRD mission consisting ofMessrs. Kalkat, Cadario, des Bouvrie, Ranganathan, Miller, Fishwick,Maguire (Bank), Jackson, Phocas, and Atwal (Consultants), who visitedNigeria from May 2 to May 28, 1980 to appraise the project.
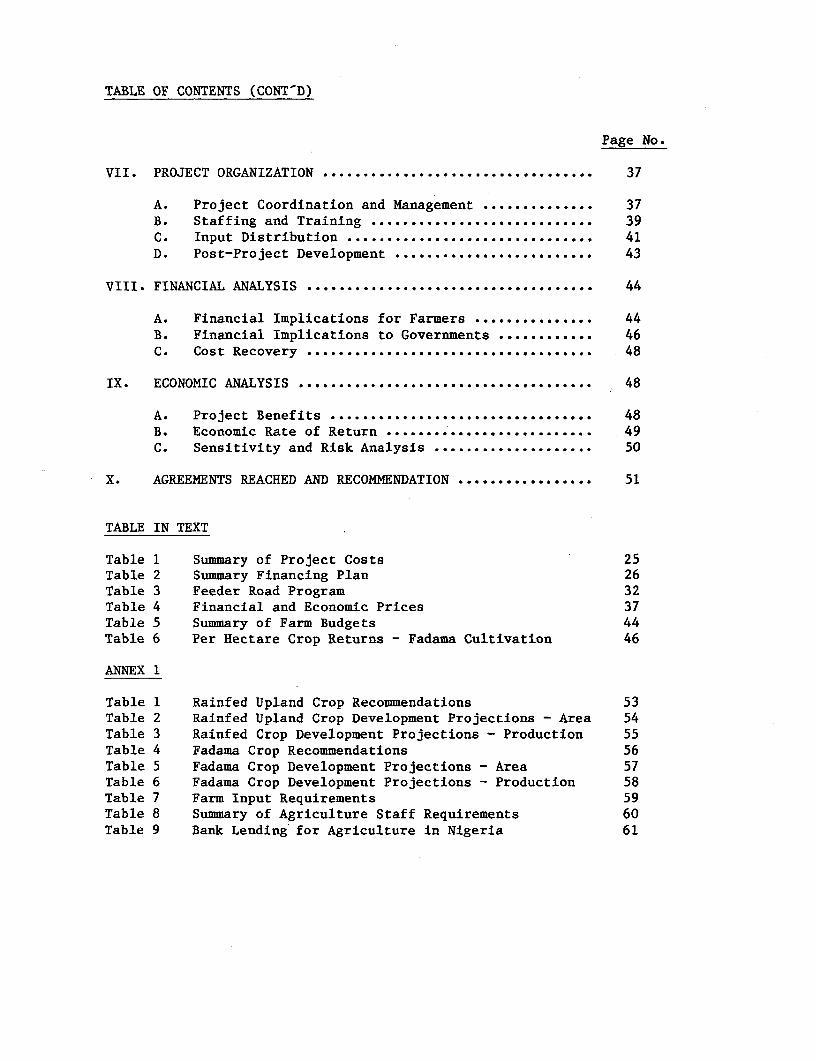
TABLE OF CONTENTS (CONT'D)
Page No.
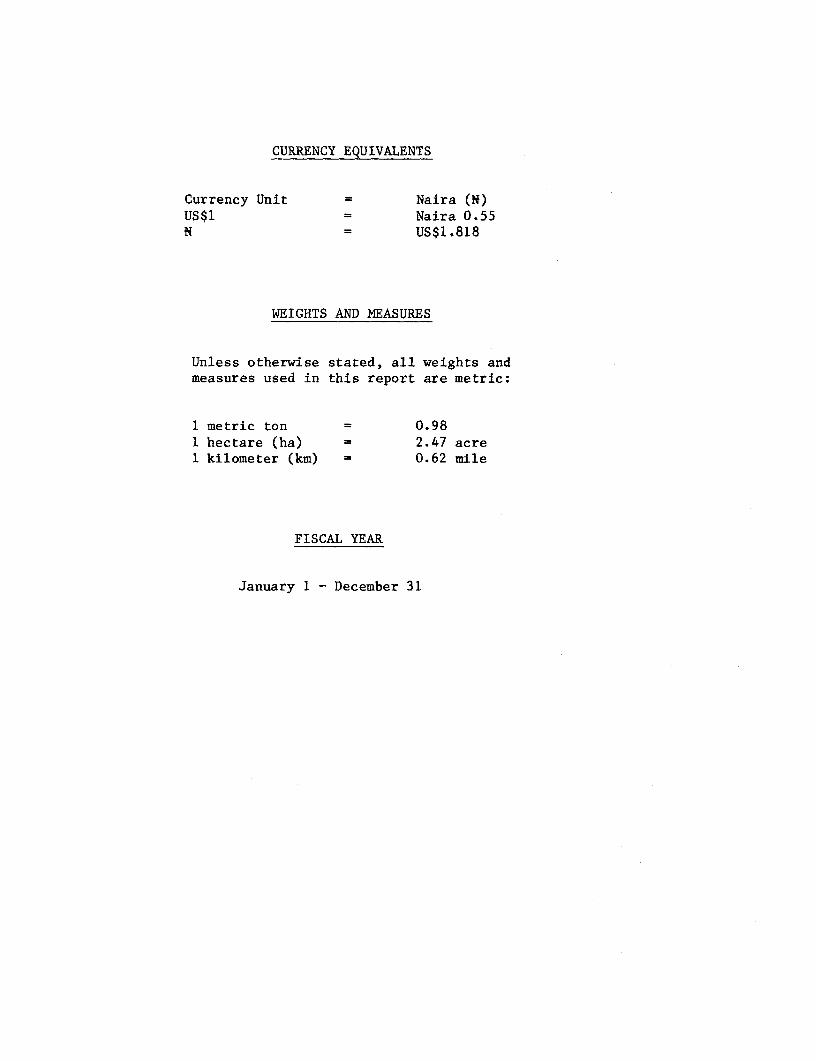
VII. PROJECT ORGANIZATION ........ ......................... 37
A. Project Coordination and Management ....... . 37B. Staffing and Training ...... ........................ 39C. Input Distribution ...... ......................... 41D. Post-Project Development ..... .................... 43
VIII. FINANCIAL ANALYSIS .................. .................. 44
A. Financial Implications for Farmers ............... 44B. Financial Implications to Governments ............ 46C. Cost Recovery ...... ............... ............... 48
IX. ECONOMIC ANALYSIS ..................................... 48
A. Project Benefits ................. ... .............. 48B. Economic Rate of Return .......................... 49C. Sensitivity and Risk Analysis .... ................ 50
X. AGREEMENTS REACHED AND RECOMMENDATION ... .............. 51
TABLE IN TEXT
Table 1 Summary of Project Costs 25Table 2 Summary Financing Plan 26Table 3 Feeder Road Program 32Table 4 Financial and Economic Prices 37Table 5 Summary of Farm Budgets 44Table 6 Per Hectare Crop Returns - Fadama Cultivation 46
ANNEX 1
Table 1 Rainfed Upland Crop Recommendations 53Table 2 Rainfed Upland Crop Development Projections - Area 54Table 3 Rainfed Crop Development Projections - Production 55Table 4 Fadama Crop Recommendations 56Table 5 Fadama Crop Development Projections - Area 57Table 6 Fadama Crop Development Projections - Production 58Table 7 Farm Input Requirements 59Table 8 Summary of Agriculture Staff Requirements 60Table 9 Bank Lending for Agriculture in Nigeria 61
TABLE OF CONTENTS (CONT'D)
Page No.
ANNEX 2
Table 1 Summary of Project Costs ........................ 62
Table 2 Project Cost by Financing Category ............ .. 63
Table 3 Detailed Financing Plan ......................... 64
Table 4 Summary of Project Cost and Financing ........... 65
Table 5 Farm Input Requirements ... 66
Table 6 Chemicals and Other Farm Inputs Requirements .... 67
Table 7 Estimated Schedule of Disbursements .... ......... 68
Table 8 KASCO - Trading and Profit and Loss Statement .... 69
Table 9 KASCO Balance Sheet as on December 31 .... ....... 70
Table 10 KASCO - Statement of Cash Flow .71
ANNEX 3 Financial Implications of Fertilizer and SubsidyMechanism .72
Table 1 Total Fertilizer Requirements ...... .............. 74
Table 2 Fertilizer Financing ...... ...................... 75
Table 3 Incremental Fertilizer Cost in Current Terms .... 76
ANNEX 4
Table 1 Farm Models for Upland Cultivation .... .......... 77
Table 2 Farm Budgets for Upland Cultivation:Zones 1 and 3 ................................... 78
Table 3 Farm Budgets for Upland Cultivation:Zones 2 and 4 ................................... 79
Table 4 Per Hectare Returns from Fadama Cultivation ..... 80
ANNEX 5
Table 1 Upland Cultivation: Incremental Productionand Value .......... ............................. 81
Table 2 Fadama Cultivation: Incremental Productionand Value .......... ............................. 82
Table 3 Calculation of Economic Benefits .... ............ 83Table 4 Summary of Economic Analysis .................... 84Table 5 Sensitivity Analysis ...... ...................... 85
ANNEX 6
Data and Related Documents in Project File .86
Charts
21829 - Internal Organization21828 - Kano Agricultural Supply Company Limited (KASCO)

TABLE OF CONTENTS (CONT'D)
MAPS
IBRD 15065 - IBRD ausisted Agricultural ProjectsIBRD 15162 - Kano State Agricultural Project
NIGERIA
KANO AGRICULTURAL DEVELOPMENT PROJECT
STAFF APPRAISAL REPORT
I. BACKGROUND
1.01 The Federal Government of Nigeria (FGN) has requested World Bankassistance for a statewide agricultural development project in Kano State.This report appraises a five-year agricultural development program which hasbeen designed to increase the productivity, incomes and standard of living ofabout 430,000 rural families, and improve the technical and managerialcapacity of State agricultural institutions. This project originated in 1977in a request from the Kano State Rural Development Agency (PDA) to FGN'sAgricultural Projects Monitoring Evaluation and Planning Unit (APMEPU) toprepare an integrated rural development project. The state wished to pursue amore coordinated approach to its rural development efforts, which were spreadover several agencies (paras 3.20 to 3.22), and to emulate the observedsuccess of Bank-financed ADPs in nearby Kaduna, Sokoto and Bauchi states(Annex 1, Table 9). Preparation continued on behalf of MANR after the dis-solution of RDA in 1978 and the report was completed in October 1979. Likethe three other proposed statewide agricultural development projects (ADPs)in northern Nigeria, the Kano ADP would provide a broad range of farm supportservices, physical infrastructure and institutional modifications.
II. THE AGRICULTURAL SECTOR
2.01 Nigeria. The Federal Republic of Nigeria comprises 19 statesand covers a total land area of 924,000 km2. Total 1979 population isestimated at roughly 83 million, which is nearly 20% of the total for theAfrican continent. Average GDP per capita, estimated at around US$670 in1979, is low and unevenly distributed. Income in rural areas is considerablyless, possibly one third of urban per capita incomes.
2.02 Economic Trends. The Nigerian economy is dominated by the oilsector, which accounts for about 23% of GDP, over 90% of export earnings and80% of government revenue. Increases in oil prices since 1973/74 haveenabled the government to embark on.massive investment programs whichcontributed to GNP growth, averaging 7% per annum between 1973 and 1977.However, growth has been concentrated in those sectors that benefitted inparticular from the rapid expansion in government expenditure, i.e., infra-structure, education and large-scale manufacturing, and performance of theprimary productive sectors, notably agriculture, has been disappointing.Furthermore, the economy has been unable to generate goods and services atthe rate demanded, and consequently, the domestic price level rose by anaverage of 20% per annum between 1974 and 1979. The combination of a high

level of oil output and a doubling of the price of oil during 1979 hastemporarily removed financial constraints. The price of oil is expected tocontinue to rise gradually in real terms through 1990, and, although oilproduction may not exceed the present level of 2.15 million barrels per day,the resource position over the next four years is likely to be comfortable.Whereas the overall growth prospects for the medium term are good, thelonger run outlook depends on the success of the effort to diversify theeconomy, and in particular, to improve performance in the agriculturalsector.
2.03 Agricultural Sector. 1/ Agriculture is the leading non-oil sectorin Nigeria, supporting 60% of the population directly, and providing about 23%of GDP, nearly 5% of total exports and 70% of non-oil exports. Production isoverwhelmingly by smallholders, using traditional, manual technology. In thenorth, annual crops predominate (grains, cotton and groundnuts), while in thesouth, cash income is largely from tree crops (cocoa, oil palm and rubber)with subsistence support from root crops and grains.
2.04 Since 1970, agricultural production ha-s stagnated, with annualgrowth rates (below 1%) less than half population growth. Domestic foodprices have risen, agricultural exports have declined, and imports of foodrose fifteenfold between 1970 and 1978. Imports of food represented 6.8% ofgross calorie supply in 1976, and are estimated to rise to 15% in 1980.If present trends continue, imports will contribute 24% of gross supply by1985. Inflation for food commodities has been running at about 25% peryear--significantly higher than for the economy as a whole.
2.05 Development Strategy. Successive governments have emphasized theimportance of improving agricultural performance. The revised Third FiveYear Development Plan (1975-80) allocated N3.0 billion for agriculturaldevelopment--partly for direct production projects (mechanized agriculture,capital-intensive irrigation schemes) and partly for support to smallholders.However, the direct production schemes have proved expensive and have achievedlittle development impact, while past national smallholder programs (OperationFeed the Nation, National Accelerated Food Production Program) lacked theinstitutional capability to deliver services effectively to farmers. Morerecently, however, experience from Bank-supported agricultural developmentprojects has indicated the shape that an effective national smallholderprogram could take, and such a program is incorporated in the new government'sNational Food Production Plan (para. 2.09).
2.06 Development Constraints. There are three main sets of constraintsto agricultural development: (a) the generation and diffusion of informationon improved technology, (b) the supply of productive inputs, and (c) feederroad links from farm to market. Agricultural research has been inadequate, isin some parts of the country non-existent, and has often failed to addressfarmers' most pressing problems. Links between research and the extension
1/ A full description and policy analysis is given in Report 2181-UNI (1979).
services have been weak, and the extension services (divided between Statesand Local Government Councils) have been short of trained manpower and oftenlacking in vigorous direction and coordination.
2.07 Application of improved technology requires access to supplies ofimproved inputs such as inorganic fertilizer, pesticides and simple farmmachinery. The structure of government subsidies on inputs, especially fer-tilizer, has been such as largely to preclude commercial involvement by theprivate sector in distributing such inputs, while the public sector has lackedboth the physical infrastructure and the effectively managed institutionsrequired to accomplish this task. At the same time the limited budgetaryresources available for subsidy have imposed artificial ceilings on totalinput availability. Meanwhile, responsibility for construction and mainte-nance of rural roads has been transferred to Local Government Councils (LGCs,established in 1977) which, while having important long-term potentialin furthering rural development, are at present critically short of bothadministrative and technical expertise.
2.08 Bank Role, Key Sector Issues and Future Strategy. Between 1971 and1980 the Bank has committed US$443.2 million in loans for 19 projects inNigeria's agricultural sector. The projects are listed in Annex 1, Table 9.They include loans, primarily for smallholder development, in oil palm, cocoa,livestock and irrigated rice, as well as a forestry plantation project. Thereis also one loan designed to address manpower constraints in agriculturalservices, by assisting the establishment of an Agricultural and Rural Manage-ment Training Institute (ARMTI). In addition, the Bank has now approved atotal of nine area-specific Agricultural Development Projects (ADPs), mostlyin the North or Middle Belt. Within the ADP project areas, semi-autonomousproject management units have provided strong direction to upgraded andexpanded extension services, undertaken local, adaptive field trials, estab-lished input distribution networks of Farm Service Centers (FSCs) and con-structed and upgraded rural feeder roads on force account. The first threeADPs have completed their development period, and while analysis of fielddata is still under way, 1/ evaluation studies show that the projects achievedsignificant farmer impact and production increases.
2.09 The success of the early ADPs on a relatively small scale hasencouraged the Nigerian authorities and the Bank to explore ways of bringinga similar package of extension, inputs and feeder roads to much larger numbersof farmers. With Bank assistance, the Government has prepared and publisheda National Food Production Plan which sets a five-year target for bringingADPs, or similar, but simplified service packages to be known as AcceleratedDevelopment Areas (ADAs), to the whole Nigerian rural population. The Bankwill be ready to assist in implementing such a program. At the same time,it must be recognized that not all sectoral issues can be resolved throughan expanded farm service program.
1/ Results of the projects are to be reviewed under Bank-sponsored researchprojects RPO 671-30 and RPO 671-88. Project completion reports are nowbeing prepared.

- 4 -
2.10 Under Loans 1092-UNI and 1455-UNI, the Bank helped establishthe Agricultural Projects Monitoring, Evaluation and Planning Unit (APMEPU)at Kaduna. In its five years of existence, APMEPU has steadily grown intoan important Nigerian institution which provides the Federal Governmentthe means to monitor and evaluate the effectiveness of the ADP program.APMEPU has also played an important role in improving training programsat project level. Because of the wide coverage of existing and proposedADPs, and the need to initiate the ADA program as an integral part ofNigeria-s food strategy, the Bank has recently negotiated a proposed Agri-cultural Technical Assistance project (Report 3207a-UNI). This project willnot only expand APMEPU's capabilities but will also establish four new FederalAgricultural Support Units (FASUs) that will, on an ecological zone basis,provide a management information service and additional technical support,particularly in training, agronomy and rural engineering, to both ADPs andADAs. It would thus significantly redress the current manpower constraintsaffecting the Federal Department of Rural Development, and would providesignificant professional support for Government agricultural policy andstrategy planning.
2.11 Issues that need to be approached on a sector-wide basis include:(a) research, (b) supply of trained manpower, (c) marketing institutions andpricing policy, (d) procurement, subsidization and distribution of farminputs, and (e) development of agricultural credit policies and institu-tions. In the areas of research, credit and marketing, Bank assistance maytake the form of future national projects, and identification work in theseareas is under way. In developing credit structures, it is regarded asimportant that interest rate spreads be adequate to support viable creditinstitutions. The forthcoming Third Cocoa Project would address this issue.Sector work is being undertaken on pricing policy, and will shortly beinitiated in the manpower planning sector, where it will supplement Bankefforts through the establishment of ARMTI (para. 2.08) and through thelarge training components included in ADPs and other projects. This projectand the other statewide ADPs have provided an opportunity for FGN to addressthe needs for the improvement of fertilizer procurement and distribution (para2.12). These projects should also lead to satisfactory mechanisms for supplyof government funds to agricultural support services, in view of the sometimesirregular financing experienced in the past (para. 4.35).
2.12 To meet the fertilizer demand of Nigeria's expanding agriculturalsector and to ensure adequate and timely supply of fertilizer to farmers(including those under the Bank assisted ADPs), the Federal Executive Councilhas recently authorized the establishment, under the Companies Act of 1968, ofthe National Fertilizer Marketing Company (NFMC), which would shortly replacethe present Federally-operated Central Fertilizer Unit. Reporting to theFederal Ministry of Agriculture, NFMC would operate along commercial lines.It would be responsible for the procurement of Nigeria's total fertilizerrequirements and for wholesale distribution to sales agents throughoutNigeria. NFMC would hold and manage buffer stocks and sell fertilizer atprices determined and agreed from time to time by FGN and the States. Toensure that the company would operate on sound commercial principles, satis-factory arrangements would be made for the employment of qualified and

experienced staff. Although Government approval to establish NFMC hasalready been obtained, the incorporation of the company including the callingup of the issued capital and the recruitment of staff will take some time.The company if expected to become operational in time to deliver fertilizerfor the 1982 season. The quantity of fertilizer and the arrangements for itsdistribution in 1981 are satisfactory.
III. THE PROJECT AREA
A. Physical Features
3.01 General. Kano State is in the north central part of Nigeria (Map15065). It has an area of 43,070 km2, 5% of the total area of the country.The project area includes 19 of the 20 local government areas in the state,Kano Municipality (500 km2) being excluded as it contains little agricul-tural activity. As the state is contiguous to the Funtua ADP (FADP) area tothe southwest, and has similar climatic and agronomic characteristics, ithas been possible to proceed with a statewide ADP in Kano without theprecedent of a sub-state project. 1/
3.02 Topography and Soils. The northwestern, western and southernareas of the state are characterized by gently undulating plains overlayingthe Basement Complex, a formation consisting of granites and other crystal-line rocks. The northeast is underlain by the Chad Formation, comprisedof sands and clays deposited by rivers flowing off the Basement Complex intothe Lake Chad Basin. Its topography is marked by alluvial plains of existingand old river systems, interspersed with areas of sand dunes. Elevationsrise gradually from 350 m in the northeast to 650 m in the southwest. Themain drainage system is the Challawa/Hadejia system, which flows northeastthrough the center of the state to the Lake Chad Basin. The Gari/Thomasriver system drains the northwest. Soils of the state are inherently of lowfertility. The only exceptions are certain fadama or valley bottom alluvialsoils of heavy texture, mostly located in the main river valleys and floodplains. Otherwise the upland soils are light in texture and low in exchange-able bases, plant nutrients and humus content, and generally deficient in
1/ The FADP, along with the Gombe and Gusau ADPs, was one of the firstBank-financed ADPs in Nigeria. Completed in 1980, FADP has shown thatthe basic package of improved extension supported by regular in-servicetraining and adaptive research, a properly managed input supply system,and construction of feeder roads, can achieve significant resultsin agroclimatic conditions very similar to those in much of the Kanoproject area. Total annual production of main crops have expandedsignificantly and production gains are expected to show at least 25%over preproject levels. This data will be further refined and detailedin a Project Completion Report currently under preparation.

- 6 -
micronutrients. The deficiency problem is even more acute on the very lighttextured soils formed from the Chad Basin deposits and wind-blown sand onthe higher elevations. Such very light sandy soils are of doubtful valuefor crop production and, in general, are best left to grazing or used forforestry.
3.03 Climate. Rainfall characteristics show a decreasing patternfrom south to north. Mean annual rainfall in the south is 1,000 mm duringa season averaging 150 days, from late May through October. In the north,mean annual rainfall is 635 mm during a season lasting 90-100 days, fromlate June through September. The peak rainfall period is mid-August toearly September. The period November-March is marked by dry northeasterlywinds of the Harmattan.
3.04 Vegetation. The original vegetation of the state was a type ofsavanna made up of various species of grasses, bushes and trees. Intensivecultivation, both shifting and static, has very considerably changed thenatural vegetation, which now only exists in relatively small pockets inforest or game reserves and in non-arable areas. Because of the variationin rainfall from north to south, there is a small portion of Sahel savannaat the extreme northeastern tip of the state. The bulk of the state isclassified as the Sudan Savanna Zone. However, the northern part of thiszone, north of a line running east-west through Kano City, is markedly drierthan the portion to the south. Parkland trees are common in the southernpart of the Sudan zone, but the numbers of such trees are being rapidlyreduced due to cutting for firewood. In the northern part, such trees areless evident, especially in the extreme north, where they are generallyabsent. In the southern areas which have been allowed to revert to a bushfallow, coppice-type growth is common, resulting in a reduction in theamount of grass and an increase in the amount of woody shrubs, therebyspoiling the grazing.
B. Infrastructure and Social Services
3.05 Roads and Communications. On the two-thirds of Kano State whichis underlain by the Basement Complex, the trunk road network is well deve-loped. Road development in the remaining north eastern part of the State ispoor, however, due to construction difficulties in the light sandy soils ofthe Chad Formation. The road network comprises 890 km of paved federalroads, 320 km of paved state roads, and 220 km of gravelled roads. SeveralFederal and State roads have been reconstructed recently or are underconstruction, while most others are in good condition. There are about 270km of all-weather feeder roads plus a further 2,100 km of dry season motor-able tracks. The responsibility for feeder roads is presently shared by thenewly-created Ministry of Rural and Community Development (MRCD), and theLocal Government Councils (LGCs). While policy is at a formative stage,there is no clear division of responsibility for feeder road development andmaintenance. Neither the Ministry nor the LGCs have capacity to perform

these functions adequately, although the Ministry of Works and Housingprovides technical assistance as required. The railway lines from Lagos andPort Harcourt branch at Zaria, with one line passing through the state viaKano terminating at Nguru in Borno State. There is an international airportat Kano.
3.06 Power. Electricity is supplied to the major towns by NEPA(National Electric Power Authority), while a modest number of small diesel-operated generating units have been installed under the program run by theRural Electrification Board.
3.07 Water Supply. Piped water is supplied to the capital through theGreater Kano Water Supply Scheme which also serves some 80 larger villageswithin a 45 km radius of the city. The system is operated by the Kano StateWater Resources Engineering and Construction Agency (WRECA), which has alsobeen charged with the supply of water to all settlements with a populationof over 5,000 inhabitants. In such places boreholes are provided, equippedwith pumps, storage tanks (of 20-50,000 gallons) and reticulated standpipesystems. These facilities are generally well run but very badly in need ofexpansion. Water supply for communities of less than 5,000 inhabitantsfalls under the responsibility of the Ministry of Rural and CommunityDevelopment (MRCD). The Hadejia-Jama-are River Basin Development Authority(HJRBDA) is also to some extent active in rural water supply programswithin its territory. In all, some 7,500 concrete wells (mainly hand-dug)have been constructed to date. Of these some 3,000 have fallen in disrepairand another 9,000 such facilities would have to be constructed to meet basicrequirements. Village water supplies are mainly drawn from seasonal streams,open wells and some reservoirs. They are invariably badly polluted and ahazard to health. The maintenance of these structures is the responsibilityof the MRCD and in some instances of the LGCs, but the means are inadequateto carry out these functions satisfactorily. To address these problems inan accelerated manner, a new rural water supply strategy is now underconsideration, aimed at phasing out the sinking of open wells in favor oflarge-scale programs of boreholes equipped with hand or motorized pumps.The project would support this effort.
3.08 Health. Hospitals are the main centers for treatment in thestate, annually accounting for 50,000 inpatient visits and 65% of the morethan 2,000,000 recorded outpatient visits. The Health Services ManagementBoard operates the 16 general hospitals, eight of which are located in Kanomunicipality, the others being at Gwarzo, Danbatta, Kazaure, Gumel, Hadejia,Birnin Kudu, and two at Rano. Three new hospitals are being built under the1975-80 Development Plan. Local governments operate about 140 dispensaries(125 in rural areas) and 270 centers for treatment of leprosy. Ministrystaff number over 1,000, including 120 doctors and 400 nurses.
3.09 Education. Primary school enrollment was 460,710 in 1978. Thisrepresented a nearly 200% increase over the 1976 enrollment, resultingfrom the national Universal Primary Education policy adopted in 1977, butaccounted for only 40% of the primary school-age population in the state.

Local governments and local education authorities administer the nearly3,000 primary schools, while the state Ministry of Education is responsiblefor professional supervision and curriculum development. Post-primaryeducation facilities operated in the state include 35 teacher trainingcolleges, 32 secondary schools, and 5 vocational/technical schools. BayeroUniversity and Kano Technical College are located in Kano Municipality.Several ministries, notably Health and Agriculture, operate a number ofspecialized training institutions.
C. Socio-Economic Features
3.10 Demography. Accurate population statistics for Nigeria are notavailable. The 1973 census has been abandoned formally by the FGN, and themost recent published figures are derived from the 1963 census, assuminggrowth rates of 5% p.a. for Kano Municipality and 2.5% p.a. for the re-mainder of the state. On this basis, the 1980 state population is officiallyestimated at 9.0 million, of which 756,000 (8.4%) reside in Kano Municipa-lity. It is estimated that 85% of the rural population is involved inagriculture, and that the number of farm families is about 614,000. 1/ Thestate is the most densely populated in the north, with an overall density of210 persons per km2. The average density in the four LGAs immediatelysurrounding Kano Municipality is twice the state average, i.e., 420 personsper km2. About 15% of the population lives in settlements of 10,000 ormore people (including Kano Municipality), with another 25% in settlementsof 5,000-10,000.
3.11 Land Tenure. Ownership of land is vested in the state. Farmershold usufructuary rights, and the rights to a particular piece of land canbe passed on by inheritance, sale or rental. The land owned by a particularfamily is often in fragmented holdings within a varying radius of thevillage. Islamic inheritance law has resulted in continuous subdivision ofexisting holdings among family members. The two main customary forms ofland tenure are gandu, under which the land right is vested in the familyhead but the land is worked and its produce shared by all family members,and gayauna, under which the land is worked by the family member who has theright to its use. The gandu is of particular importance as it enables theindividual to hold off-farm employment while still enjoying the benefits ofagriculture. Land pressures have mounted due to population growth, conti-nual subdivision, land accumulation by wealthy individuals, and publicrequirements (roads, schools, irrigation schemes, etc.). As a result, land
1/ Population estimates for Nigeria are unreliable. On existing ADPs,post-appraisal baseline surveys suggest that the actual number of farmfamilies is considerably lower than official estimates. On this basis,the 1978 population of Kano State would have been 5.8 million and the1980 population would be about 6.1 million, of which Kano Municipalitywould be 10%. The number of farm families would be 614,000.

prices have mounted, reaching over N1,000 (US$1,800) per hectare near KanoMunicipality, and land has become increasingly important as a speculativeand readily liquid asset. Payment of compensation is usually required whentaking land for public uses, and typically includes payments for land,crops, buildings, and economic trees.
D. Land Use, Farm Structure & Farm Enterprise
3.12 Land Use. About 60% of Kano State-s 43,000 km2 land area, some2.6 million ha, is under cultivation. In the densely populated areas,80-90% of the land area is cultivated. In the northern part of the state,certain areas of very light sandy soils have been left fallow, and it ispossible that in such areas shifting cultivation is still practiced to someextent. The bulk of the agricultural lands are upland and used for rainfedcrops such as sorghum, millet, cowpeas, groundnuts, maize, and cotton.
3.13 While total cultivated area is 2.6 million ha, the inclusion ofintercropped areas gives a total upland cropped area of 4.9 million ha.In addition to the upland areas, a considerable agricultural potential doesexist in the valleys along the main river systems of the State, known asfadama lands. Accurate data are not available but it has been estimatedthat the main fadama systems and their floodplain areas cover 163,000 ha:17,000 ha in Zone 1, 28,000 ha in Zone 2, 70,000 ha in Zone 3 and 48,000 hain Zone 4. During the rainy season rice, maize, sugarcane, sorghum, andsome tobacco are grown in the fadama lands, while onions, tomatoes, othervegetables, and wheat are grown during the dry season under irrigation. Onthe fringe fadama lands, sorghum and maize are the main crops. The northerntwo zones (Zones 2 and 4) are markedly drier than Zones 1 and 3 in thesouth.
3.14 Farming Systems. Cultivation is overwhelmingly carried out byhand, although a few tractors have been introduced in recent years.Work-oxen are rare. Fadama areas are worked intensively to produce highvalue cash crops, but most farm enterprises are rainfed. There is noevidence of any particular rotational system, and intense land pressure hasreduced or eliminated the fallow period in many areas of the State. Farmsize varies from as little as 0.2 ha in areas close to Kano and fadama landsto holdings in excess of 200 ha. The average farm size in Zones 1 and 3 isof the order of 2.5 ha, and in Zones 2 and 4, generally about 3 ha. Farmsare generally fragmented and field sizes vary significantly. Most of thecultivators in the State are Hausa, the remainder generally being settledFulani pastoralists who now cultivate crops as well as keep animals. Meanholding size for Kano State is 2.8 ha, but there is great size dispersion,especially in Zone 1, adjacent to Kano City, where mean holding sizes in thedifferent LGAs vary from 1.6 ha to 5.1 ha with a zonal mean holding of 2.5ha. Families generally h,ave 7 or 8 members, with a mean for Kano State of7.6 persons per family.

- l.iA -
3.15 Farm Labor. Family members provide about 85% of total on-farmlabor input on an average traditional farm. Non-family labor is providedby hired laborers, engaged at N3 to N4 per day, or on a piece-ratebasis, as well as by traditional reciprocal labor. Religious and socialrestrictions tend to restrict adult female input to threshing and processingof ouitput in the family compound, the bulk of family labor input to on-farmactivities coming mainly from adult males (55-60%). The share of children-supplied labor can be expected to drop with expanding primary and secondaryeducation. On-farm activities on the traditional farm are highly seasonal,with 90% of family labor input being supplied from June to November.
3.16 Farm Incomes. Evaluation of Bank-assisted projects in neigh-boring Kaduna and Bauchi states has not yet yielded information on farmincomes or income distribution. Recently published studies 1/ suggest thatthe relative shortage of land, with its consequent adverse effect on incomedistribution, can be offset by increasing the proportion of other tradi-tional inputs, such as labor, or by the introduction of land-intensiveimproved technology, such as the project would promote. Access to land nearZaria, which is adjacent to Kano State, appears relatively egalitarian, withGini coefficients for cultivated land ranging from 0.31 to 0.34, and for netfarm income ranging from 0.30 and 0.36, in villages with reasonable accessto markets. 2/ Rural income distribution tends to show a high degree ofincome equality, with ratios of mean per capita incomes between poorest andrichest groups only 1:5, and 1976 average per capita incomes of only N99(US$180) even for the richest 10% of households. 3/ A life cycle earningspattern suggests that the observed distribution may be partially accountedfor by factors internal to the family (age of household head or familysize), and that under a longer-term income concept, the degree of incomeinequality would be even less. As the proposed project emphasizes broadcoverage of the farmer population and concentrates on low-cost improvementsto existing techniques, it is consistent with maintaining the existing lowincome inequality.
3.17 Crop Production. The bulk of agricultural production comes frommanually cultivated rainfed crops. Fadama areas contribute substantially tothe farmer's income as they produce most of the cash crops, mainly during
1/ David W. Norman, et al. "Technical Change and the Small Farmer inHausaland, Northern Nigeria." Department of Agricultural Economics,Michigan State University, East Lansing, 1979.
2/ The Gini Coefficient, a number between 0 and 1, is used as a statisticalmeasure of inequality: the lower the figure the more equal the distribu-tion. More inaccessible villages had greater holding size and slightlyhigher income inequality, with Gini Coefficients of 0.40 and 0.50respectively.
3/ Peter G. Matlin "Income distribution among farmers in northern Nigeria:empirical results and policy implications." Michigan State University,East Lansing, 1979.
- 11 -
the dry season. Agro-climatic conditions, in particular the short durationand low level of rainfall in the north, together with lighter soils, affectthe cropping patterns. The most important crop in the south (Zones 1 and 3)is sorghum, which is planted on over 35% of the cultivated area. Millet,the second main crop, covers 26% of the cropped area. To the north (Zones 2and 4) agroclimatic conditions become less favorable, millet predominatesand is planted on up to 90% of cropland. In the southern part of Zones 1and 3, where rainfall is higher, maize is becoming popular. Cowpeas areextensively grown in all areas of the State, especially in Zones 1 and 3.Groundnuts have lost their importance following the disastrous spread of theaphid-borne disease, rosette, which wiped out the crop in 1975, and poormarketing. Cotton is grown in very limited areas. Intercropping of two ormore crops is predominant. It has many advantages for the region in that itpermits filling in of a crop which may not have germinated well, providesbetter utilization of available soil and allows adjustment to uncertainty inthat one crop may survive while the other fails. Farmers start the seasonby planting food crops first, usually millet, which may have sorghum orother crops subsequently planted with it. There appears to be no evidenceof any particular rotational systems. The choice of crops mainly depends onthe agroclimatic conditions, the farmer's particular food needs, marketconditions and location of fields in relation to his house. Throughout thestate, sorghum accounts for about 29% of the cropped area, millet for 34%,cowpeas for 27%, groundnuts 9%, maize 1% and cotton, 1%. Yields of allupland crops are low due to poor technology used in all aspects of cropproduction. Fertilizers are little used, the average usage at presentestimated at 6 kg NPK per hectare. Currently available crop varieties arelow yielding, weeding is either neglected or done too late and pest controlis virtually non-existent except for some sporadic interventions of govern-ment sprayings on cotton in cases of acute emergency.
3.18 Reliable estimates for the area of available fadama land actuallyused for traditional wet and dry season cultivation are not available, butestimates based mainly on observations bring the total fadama area presentlyunder cultivation to 30,000-40,000 ha. These fadama areas provide an impor-tant source of food and cash income during the dry season. Traditionally,the fadama lands are utilized in two ways: (a) by growing rice in fieldsinundated temporarily during the wet season; and (b) by growing dry seasonvegetables with water lifted from hand dug wells or riverstreams by"shadoofs". Onions, tomatoes, other vegetables and wheat are dry seasoncrops grown under irrigation, while rice, sugarcane and tobacco (in verylimited areas mainly in Zone 4 and some in Zone 2) are wet season crops.Tobacco is grown through special contracts between the two tobacco companiesoperating in the State and the tobacco cooperative societies. Yields offadama crops compared to rainfed upland crops are generally low, although anincreasing number of farmers experience better results, especially withtomatoes and onions, through the use of good-quality imported seeds ofimproved varieties and increased fertilization. Recent observations haveindicated an increasing spread of nematodes in fields planted with tomatoesfor a number of consecutive years, a situation which warrants quick actionin terms of prevention through long-term rotations and, where possible, theapplication of nematocides.

- 12 -
3.19 Although diets are generally adequate, especially in familieswhich have a small fadama vegetable plot, cereals provide the bulk ofcalorific intake in Kano State. The major foods are sorghum and millet,which are preferred to maize (grown in the south of the state) becausethey are easier to process. Production of rootcrops, mostly cassava, islimited. Cowpeas and grou-dnuts are the main source of vegetable protein,although legumes are less popular as many women are unfamiliar with theirpreparation. Meat and yogurt provide limited animal protein. Occasionalincome from hired labor and remittances from relatives in urban areas allowfamilies to purchase small amounts of sugar and salt. With increasingincome, families show increased demand for wheat and rice, although generallylittle of a family-s small cash income is spent on food. Most crops destinedfor human use are processed using simple methods at, or near, the point ofconsumption.
E. State Agricultural Institutions
3.20 Government. The state Ministry of Agriculture and Natural Re-sources (MANR) comprises the Agricultural Services, Irrigation, Livestock,Fisheries, Produce Inspection and Agricultural Engineering Divisions. TheAgricultural Services Division is responsible for training, seed production,farm institutes (young farmers training), and distribution of fertilizers.It also controls general extension work, although LGCs have assumed someresponsibility for agriculture. The LGCs have some lower-level extensionstaff, but they receive guidance and training from the supervisory staff ofMANR. There are about 200 field extension workers with the AgriculturalServices Division and the LGCs, equivalent to a staff: farmer ratio of about1:4,000.
3.21 The Ministry of Local Government coordinates the activities ofLGCs. The LGCs are responsible for a wide range of functions as laid downin the Kano State Edict R of September 1, 1976. They are, however, in theprocess of initial development and do not yet have the capacity to tacklemany of the responsibilities (feeder roads, markets, grazing areas, fuelwoodplantations, rural water supplies, etc.) assigned to them.
3.22 A new Ministry of Rural and Community Development (MRCD) wascreated in 1980. It is charged with the responsibility of rural developmentincluding water supplies (for communities up to 5,000 population), feederroads, forestry, rural industries, rural electrification, and agriculturalcredit. The Ministry is not yet organized or fully staffed. 1/ The Govern-ment has agreed to assign responsibility for feeder roads and water supplyin villages below 1,500 persons to the eroject, allowing MRCD to concentrateon its other responsibilities~
1/ Some staff have been transferred from Water Resources EngineeringConstruction Agency (WRECA).
- 13 -
3.23 Marketing. The marketing of agricultural produce by the farmersis essentially one of traditional exchange, sometimes involving barter.Sales are made either in villages or in the more than 300 local markets.The marketing system from the producer to the consumer is comprised of anumber of functionaries such as farmer-cum-trader, bulking trader, rural-urban link wholesaler, urban wholesaler-cum-commission agent and urbanretailer. For retail sale in the villages, rural retailers play a signifi-cant role. In the inter-state transactions, inter-regional wholesalers,regional wholesalers, urban wholesalers, and retailers form the chain to theconsumer. The farmer is estimated to get about 70% of the price paid by theultimate consumer, with about 4% going to the transporter and the balancebeing shared by a number of intermediaries.
3.24 In 1977 FGN created seven commodity-specific marketing boards(cocoa, cotton, groundnut, grains, palm produce, rubber, tubers and root-crops), charged with guaranteeing the purchase of satisfactory produce at aset price, exporting purchases surplus to domestic needs, and the generaldevelopment and rehabilitation of producing areas, including ensuringan adequate supply of fertilizers and necessary inputs. Unfortunately,the boards, as presently set up and managed, are ineffective. Their short-comings, mainly the lack of adequate financial resources and poor marketintelligence, are now under study. Government involvement in food cropmarketing takes place mainly through the Nigerian Grains Board (NGB) and theNational Grains Production Company Limited. Their impact has also beenlimited, with inadequate performance in absorbing ADP-generated productionin excess of the capacity of the private merchants who dominate the wholemarketing system. Traders, as a general rule, clear crops efficiently andtrading margins are not excessive. Satisfactory marketing development isseverely hampered by the lack of any effective crop and marketing informa-tion system or services. Although traders seem relatively well informed, bytheir own methods, over limited areas and crop ranges, there is no officialintelligence system. Efforts are now being made to establish a MarketIntelligence and Crop Forecasting Unit in FDA, and UNDP/FAO assistancehas been sought. The Bank is assisting in the reform and reorganization ofthe management of NGB, with funds from the Ilorin Agricultural DevelopmentProject (Loan 1668-UNI) financing the cost of consultants over a 12-monthperiod to design and help implement a new marketing operation. The recentlynegotiated Agricultural Technical Assistance Project (para 2.10) includesfurther support for NGB.
3.25 Credit. Under the current FGN subsidy arrangements, creditis not generally required for inputs, fertilizer being subsidized to about88% of its cost. Larger farmers need short-term loans for meeting currentexpenses (largely for hired labor) and medium and long-term loans forcapital investment in farm machinery and equipment including work oxen,ploughs, carts and pumpsets, purchase of animals, setting up of poultryhouses and purchase of chickens. While the short-term pre-season loans(PSL) for agricultural production are made available by cooperatives withfinances from the Kano State Cooperative Bank under State government guaran-tee, the medium-term loans are advanced under different schemes by MANR, and

- 14-
now, by the recently created MRCD and the Ministry of Trade and Industry andCooperatives, again with resources provided by the NACB. For the short-termloans for agricultural production, farmers are now required to pay interestat 12%. The management of these loan schemes is far from satisfactory, andneeds to be improved to expand coverage and improve recoveries.
3.26 Cooperatives The State had 718 primary cooperative societiesand 31 tobacco farmers- societies in 1978-79. Total membership was about55,000. Primary societies advanced PSL amounting to N863,000 in 1978-79,of which N798,000 has been repaid. In the hierarchy of cooperatives, theprimary societies are affiliated to the 20 LGA cooperative unions. Produc-tion loans are made directly to the primaries from the Kano State Coopera-tive Bank. Those unions, which themselves are affiliated at the state levelto the Kano State Cooperative Federation, operate primarily as consumers-coops, mainly in larger centers. There are also a few thrift societies ofsalary earners and some primary Coop stores.
3.27 The Kano State Cooperative Bank, established under the 1968Companies Act operates primarily as a commerciar bank and plays no promo-tional or supervisory role in the development of cooperatives. Of itstotal 1978-79 loans and advances of about N7.1 million, only about 12%were devoted to pre-season agricultural loans. The permitted levels offinance per farmer are low and inadequate for agricultural needs.
IV. THE PROJECT
A. Summary Description
4.01 In accord with FGN and KNSG policies, the primary objective ofthe project is to increase food production and farm incomes. A second,extremely important goal is to strengthen state institutions, primarily theMinistries of Agriculture and Natural Resources (MANR) and Rural and Commu-nity Development (MRCD). The project, which would be implemented over fiveyears, mid-1981 through mid-1986, would benefit some 430,000 farm familiescultivating on average 2.8 ha. It would include:
(a) Farm and Crop Development
- increasing production of the major crops on about 900,000 hathrough the introduction of improved farming practices,strengthened extension services and provision of improvedseeds, fertilizer, crop protection and other support services;
- improving farm management through the introduction of anadvanced package which, where applicable, would augment theimproved package by the use of workbulls, mechanization, andherbicides; and planned water management and small-scale pumpirrigation on the fadama lands;

- 15 -
- carrying out an applied research program to test varieties ofagronomic practices, new implements and farm systems;
- building up a seed production service to enable farmers toreplace seed every fourth year;
- establishing forest nurseries for on-farm and communal plantingprograms; and
- improving land use planning capability.
(b) Civil Works
- constructing about 1,440 km of feeder roads and training ofstaff in their subsequent maintenance;
- improving rural water supplies, mainly through drilling some1,000 boreholes and rehabilitating some 1,000 wells; and
- constructing project offices, workshops, stores, staff housesand farm service centers (FSCs).
(c) Institutional Support
- providing for a management structure, supported by adequatetechnical and administrative staff, logistical support andfunds, to implement the project, evaluate project progress, andprovide guidelines for further development;
- adapting and improving the existing state training institutionsto meet the short-term technical needs of the project, whilealso developing a longer-term comprehensive staff developmentprogram;
- supporting the operations of the Kano Agricultural SupplyCompany (KASCO), a wholesale agency operating on commerciallines, to take over from the State the distribution of inputs,and to handle their procurement. Distribution would be orga-nized through FSCs and, where already viable, primary coopera-tive societies;
- assisting with on-farm storage while making provision forconstruction of short-term grain storage facilities; and
- integrating LGs into the operations of the project throughtechnical and advisory committees and training programs.
(d) Technical Assistance
- recruitment of suitably qualified staff, largely throughconsultant firms, to assist in program execution and trainingof managerial and technical staff; and

- 16 -
- funding for consultant studies of adaptive research, inter-mediate technology, rural water supply planning, training andstaff development and socio-economic impact.
B. Detailed Features
Farm and Crop Development
4.02 Project intervention would improve cultivation practices by some430,000 smallholder families, on an estimated 870,000 ha (1.6 million ha totalcropped area, allowing for intercropping) in upland areas and on some 30,000ha of cropped area in fadama land. The total incremental production ofrainfed upland crops from both improved and advanced technology in PY5 isexpected to reach 166,750 tons of sorghum (an increase of 21% over PYO),70,450 tons of millet (+13% over PYO), 56,100 tons of maize (234% over PYO)117,020 tons of cowpeas (+78% over PYO), 15,400 tons of groundnuts (+11% overPYO), and 3,100 tons of cotton (+33% over PYO). Incremental productionexpected from the fadama lands would comprise: onions 75,600 tons (36%increase over PYO), tomatoes 40,000 tons (+38%), other vegetables 28,000 tons(+67%), rice 14,750 tons (+42%), wheat 1,360 tons (+26%), sorghum 14,550 tonsand maize 10,100 tons. Crop development and production projections are shownin Annex 1, Tables 1-6.
4.03 Basic Service Package. This is a relatively simple productionpackage, applicable to existing traditional farming systems. It is intendedfor wide coverage. Based on past experience in other states under similarconditions, an estimated 70% of the farmers would adopt partly or whollyimproved and advanced crop production packages. The main immediate benefitswould result from improved attention to timeliness of operations such asplanting and weeding, optimum and uniform plant populations and modest useof fertilizer, insecticides and improved seeds. Local research results andthe experience of the Funtua ADP, which adjoins the southwestern part ofKano, indicate that appreciable yield responses can be obtained from maize,sorghum 1/, millet, cowpeas, groundnuts and cotton, which are the dominantcrops in the area. Fadama areas possess significant potential for yieldimprovement of vegetables and other crops through improvement in agronomicand water management techniques. Details of inputs and estimated yieldsunder rainfed and fadama cultivation are in Annex 1.
4.04 The success of the BSP would largely depend upon the efficientoperation of a farm input distribution network comprising 138 Farm ServiceCenters (FSCs) and an efficient extension service. The establishment ofFSCs would bring farmers within a radius of 10 km of a supply point, alevel of service that has proved adequate in the ongoing agricultural
1/ Initial palatability problems have been overcome in the case ofShort Kaura.

- 17 -
development projects in Northern Nigeria. The average extension-farmerratio is now 1:4,000 and under the project, it would be improved to 1:660.Participating farmers, selected by the extension staff in consultation withthe LGCs, would be contacted and advised by the field Agricultural Instruc-tor (AI) on a regular basis either at fortnightly or monthly intervals.Farmers would be contacted either as groups or individuals on four days ofthe week. The remaining day would be used for training or office work. Theexact method of extension and the field worker/farmer ratio must be viewedwith considerable flexibility until the demands and needs of the farmers areproperly evaluated. As profitable growing of crops like cowpeas, ground-nuts, cotton and vegetables would require specialized pest control, theextension service would include staff specially trained in pest management.
4.05 Advanced Service Package. The program would supplement BSPand would be designed for groups and individual farmers displaying themanagement aptitude to handle more sophisticated techniques and croppingsystems incorporating pest management, higher use of fertilizers, chemicalweed control, hybrid maize, animal power and mechanization, and the integra-tion of livestock with arable farming. In the fadama areas, improved floodcontrol and low-cost pumping schemes would be established as part of the ASPprogram.
4.06 Farm Input Supplies. Through the wholesale company, KASCO (paras7.12 to 7.19), and its retail outlets at FSCs and cooperatives, the projectwould supply a range of inputs that would reach in Year 5 about 230,500 tonsof fertilizers, 1,120 tons of improved certified seeds and 594 tons ofvarious plant protection chemicals. The inputs would be sold primarily forcash and in some cases on deferred payment (para 7.20).
4.07 The project would provide advice on farm planning and mechanizationtogether with training in preventive maintenance. The FSC would stock andsell equipment and fast-moving spare parts while the zonal workshop would, toa limited extent, take up repairs of tractors, pumps, and plant protectionequipment. The FSC would also stock and sell storage bins, hand pumps, andother agricultural equipment.
4.08 Applied Research. All applied research would aim at integratingnew technology into farming systems acceptable to the local community.Applied research trials would be carried out in the twelve state farms runby MANR and on farmers' land. These state farms are located in all fourzones. Trials on farmers' lands would be carried out through the use ofthe farmer's own labor and capital resources. The required farm inputs(fertilizers, seeds and pesticides) for these trials would be provided freeby the project. Applied research priorities would include crops and cropvarieties suitable for the shorter rainy seasons, crop rotation and suitablecropping mixtures, introduction of animal traction (a sector in whichNigeria is lagging behind other West African countries), introduction of newfruit trees and varieties, improved irrigation systems in the fadama areas,improved cultivation techniques for soil, and water conservation in the wetseason fadama lands.

- 18 -
4.09 An essential feature of the applied research approach would beassessment of the impact of innovations not only on yields but also onsocio-economic factors and farmers attitude as well. A central researchcoordination unit (CRCU) would be established at headquarters in Kano,supervised by the Chief Technical Officer. The Evaluation Section would befully involved in monitoring farming activities and would liaise withApplied Research in the preparation of annual research programs.
4.10 Seeds and planting material. Seed production would be concen-trated at Kadawa farm and with surrounding farmers. The foundation seedwould be obtained from the National Seed Service Center in Zaria. Theproject would implement a seed production plan so that farmers would even-tually replace annually 25% of their requirements with new seeds. Thelong-term objective would be the regular provision of improved seed by KASCOthat would allow for a minimum replacement of 25% per annum. KNAPMU wouldassist in importing disease-free stocks of seeds, expecially potatoes, forfurther multiplication.
Forestry Development
4.11 Demand for land for cultivation, expansion of towns and industry,and the insatiable need for firewood have led to widespread encroachment onKano State-s 1,150 km2 of forest reserves. The 1973-74 Sahelian droughtalerted Government to the rapid degradation in the north and FGN and KNSG haverecently embarked on an anti-desertification program. Even in the southernpart of the state, population pressure and the expansion of grazing andcultivation that followed tsetse eradication have led to bush degradation andovergrazing. The project would modernize 15 nurseries with a total capacityof 4.5 million seedlings annually to be supplied free to farmers for on-farmplanting. About 500 ha of degraded watersheds would be planted with treeseach year. The State forestry staff would carry out the program.
4.12 Soil Conservation and Land Use Planning. As the state is denselysettled and intensively cultivated, there is considerable pressure on theland and competition among various land uses. The project would developthe nucleus for proper long-term land use planning in the state throughits land use planning unit, located in the statewide headquarters. The unitwould collect base data on land use and potential, and advise project manage-ment and the state government on land problems and development opportunities.It would identify sites for small-scale conservation projects which would beundertaken with road construction machinery during the dry season. In theearly stage of the project, the unit would be charged with identifying sitesfor project-financed facilities, including farm service centers, roadalignments, and forestry plantations.
Civil Works
4.13 Roads. The project would construct about 1,440 km of feederroads, which are required to provide all-weather access to the projectfarm service centers and to link important agricultural areas to the main

- 19 -
road network. 1/ Most of the roads would be constructed in Zones 1, 2 and 3as these are areas of high agricultural potential and, for the most part,road construction materials are readily available for construction usingmotor scrapers. In Zone 4, however, a limited road program of 105 km wouldprovide access to the important Hadejia and Gaya fadama areas where small-scale irrigation would be developed (para. 5.04). In addition, simpleimprovements would be made to the seasonal access tracks within the fadamaareas which are subject to annual flooding. The lack of suitable roadbuilding materials in Zone 4 results in expensive haulage costs using tippertrucks hired from local contractors. Moreover, the natural constraints onthe agricultural potential of this Zone preclude a more extensive roadprogram. Road construction and maintenance equipment (40% of road construc-tion costs) would be procured by KNAPMU under ICB. The road program wouldbe executed by project engineers (recruited through consulting firms) withpetty contractors delivering laterite and constructing simple culverts.The annual feeder road development program, including justification, standard,length and location, would be carefully considered with the LGCs. It would bepart of the annual action plan (para. 4.36) to be agreed with the Bank.
4.14 Project road maintenance units would be established in each zoneduring the project and would, when necessary, employ the services of localhaulage contractors for regravelling. Regular traffic monitoring would becarried out on project roads and liaison maintained with MWH with a view totransferring responsibility for roads carrying over 100 vehicles per day tothe MWH. Under the recent reorganization, MRCD is expected to have long termresponsibility for feeder road maintenance. The project would maintain closecontact with both the MWH and MRCD to coordinate mutually agreed roadworkactivities. Additionally, from the outset, emphasis would be given toproviding, wherever possible, technical assistance to LGs to improve theirroad maintenance capacity.
4.15 Rural Water Supplies. The project-s rural water supply (RWS)component would aim at making potable water available to some 0.8 - 1.0million rural dwellers living in communities of less than 1,500 inhabitants.About 1,000 boreholes would be drilled, distributed among the four zones,with priority accorded those areas which are most critically deprived ofadequate water facilities. In addition, an estimated 1,000 existing wellswould be rehabilitated and modernized, by deepening the shaft and improvingwell-head facilities. To avoid duplication of effort the project wouldassist in the preparation of a statewide rural water supply strategy andannual construction programs, jointly with the MRCD, WRECA, and the HJRBDA,and in close consultation with LGCs and local village authorities. Thisprogram would form part of the Action Plan to be agreed with the Bank each
1/ The intensity of feeder road construction would be much less thancurrently scheduled in on-going ADPs. At Ayangba, the equivalentof one zone, for example, the rate of construction is about 200 kmper year, compared to 90 km per zone in Kano.

- 20 -
year (para 4.37). Experienced and well-qualified staff specialized in ruralwater planning and groundwater development would be included in the KNAPMUplanning team. Water supply maintenance would be organized on a three-tiersystem at village, LGA, and zonal level to ensure proper long-run functioningof the RWS systems (para 5.22 and Working Paper C6).
4.16 Buildings. The project would construct a headquarters complex,about 980 houses, including 760 for junior grade staff, 43 stores, 4 mechani-cal workshops, 128 Farm Service Centres, four zonal offices, and other ancil-liary buildings as detailed in the project file. A Building Section withinthe Engineering Division in each zone would be responsible for the design,supervision of contracts and subsequent maintenance of all project buildings.A buildings supervisor, experienced in the organization and management oflarge building projects undertaken on contract, would be responsible to thezonal Chief Engineer 1/ for supervision of local building contractors. Mostbuildings would follow either the existing ADP designs or standard MWH designs.On occasion, architects may be called on to undertake new designs. Supportstaff would include a draftsman, administrative officer, storekeeper, clericalstaff, skilled artisans (plumber, electrician, etc.), and labor. Buildingssupervisors would report directly to the zonal Chief Engineers.
Institutional Support
4.17 Details of the institutional development features of the projectrelating directly to the project management unit and associated committeesand organisational structure are discussed in Chapter VII.
4.18 Monitoring and Evaluation. Monitoring of project activitieswould focus on progress achieved in civil works and training programs, costeffectiveness, agronomic developments and production, and market, price andincome information. Zonal operations units would set yearly work programsand targets which would be approved by central management and monitoredquarterly. Cost accountants in each zone would be charged with regularproduction of data on plant and vehicle utilization and civil work costs.An officer in the Central Monitoring and Evaluation Unit (CMEU) would beresponsible solely for the collection and timely reporting of this informa-tion. CMEU will receive some technical support from APMEPU and the proposedFASU to be established in Kaduna (para 2.10). Basic agronomic data (areaplanted, yields, etc.), results from demonstration plots, and market andprice information would be collected by Zonal Monitoring and EvaluationUnits (ZMEU) and analyzed by economists at the CMEU. Data for in-depthevaluation of technical packages would be collected by small teams in theZMEU for analysis by a farm management economist in the CMEU. The CMEU andZMEUs would be equipped with micro-computers for recording data on disks,which would be sent to APMEPU for processing the data. A baseline surveywould be conducted in Year 1 to gather data on the ongoing agronomic andeconomic activities as a basis for gauging project impact.
1/ The engineers heading the zonal Engineering Division would usually,though not necessarily, be the Road Engineers.

- 21 -
4.19 Staff Development and Training. The project itself would bea massive training effort in improved agricultural methods, infrastructuredevelopment, communications, and rural administration. It would providea sound basis for on-the-job experience and training under competent seniorstaff, where the objectives of management and rural development wouldbe clearly laid out. Experience to date shows conclusively that, undersuch conditions, Nigerian staff have performed most effectively and learnrapidly by experience. This in itself, however, is not sufficient, and theproject would supplement on-the-job experience with formal staff developmentprograms.
4.20 Management Training. One of the fundamental problems affectingthe continuity of project activities relates to the scarcity of managerial,as opposed to technical, background among Nigerian agricultural staff.The problem must be approached by a combination of formal training andguided on-the-job experience, and much will depend on the caliber of staffworking on the project. The Chief Training Officer would update an initialinventory of existing and required staff and their training needs, and wouldsubsequently work closely with project technical managers to prepare staffdevelopment programs for individual Nigerians in key positions, as well asfor groups of staff at medium and lower levels. Consultants would assist inpreparation and execution of practical management programs and would reviewannual progress. Project staff also would be enrolled in courses at theAgricultural and Rural Management Training Institute (ARMTI) (Loan 1719-UNI),currently being established at Ilorin in Kwara State. Overseas courses inmanagement fields, as in technical subjects, would be considered where nocomparable Nigerian course existed, but should be limited to relatively shortcourses with immediate practical relevance to the staff members responsibili-ties.
4.21 Technical Training. Specialized training courses would beestablished for all levels of staff in the agronomic and other relevanttechnical needs of the project. Existing and new field staff would be givenan intensive in-service training program by a modified T&V system to improvetechnical skills and to ensure that the project ideals are understood.Instruction would be offered at selected locations in the field, making useof mobile training units. Farmer training would be conducted by mobiletraining units on a systematic basis. Courses would be short (usually ofone-day duration) and would be held on farmers- fields or at FSCs. Entry-level field staff training would receive special emphasis. An additional800 field overseers (FO) would be required over the life of the project.These personnel would be recruited and trained at three residential schools,in courses of 12-months duration, specially designed to prepare field stafffor project activities. The project would also develop training courses forfarm management advisory staff, essential for the more advanced farmingsystems introduced under the project. The small number of home economicsfield staff would be augmented by expanding the Home Economics TrainingSchool at Kadawa to house more comfortably additional trainees. Housingwould be constructed at each of the existing Farm Institutes to allow wivesof young farmers attending the one-year agricultural course to participatein a full-time home economics program for a similar period. Short courseswould be developed for agricultural staff, mechanics, bookkeepers, store-keepers, and salesmen.

- 22 -
4.22 Media Production. To support the training and the extensionactivities a Media Center will be established at Kadawa as part of the StaffDevelopment and Media Center. The Center will have the capability of designingand field testing audio and visual materials, training staff in the use andmaintenance of audio-visual equipment and advising zonal units on thecollection of material and preparation of scripts for inclusion in the KNADPradio program.
4.23 Training Administration. An active statewide program of staffdevelopment would be undertaken to ensure that the project attracts andretains skilled and motivated personnel. Staff records would be kept andcontinously updated, career structures would be designed for personnel in allspecializations, and opportunities created to enable staff to assume moreresponsibility. The Chief Training Officer would also be responsible forworking with State and LG officials in developing adequate training programsin areas related to project activities, e.g. road and water facility mainte-nance and administration. The senior training officer attached to APMEPUwould work in close collaboration with project management in developing andmonitoring new training techniques.
4.24 The Kano Agricultural Supply Company (KASCO) is to be establishedby KNSG to provide farm supplies to Kano State farmers. KASCO would bean independent body initiated with state equity, linked to existing coopera-tive organizations and operated on commercial principles. Distribution offarm supplies would be through FSCs and, where functioning properly, throughexisting primary cooperative societies. Ultimately, KASCO would assist withstorage and marketing of crops when this is essential, to ensure pricestabilization and efficient movement of surplus.
Technical Assistance
4.25 The project would provide about 210 man years of internationallyrecruited staff, mainly through consultant firms, to assist in the executionof the project (para. 7.08-7.11). It would also provide short-term technicalassistance for the preparation of special project-related studies to assistKNAPMU in examining specialized topics, as on other ADPs. The project wouldprovide 164 man-months of consultant services to KNSG to assist in specificareas where local skills are not available or when short-term supplementationis required. Specifically, the consultants, at an estimated cost of US$11,000per man-month, would provide:
(a) Staff Development and Management Training. Assistance in establish-ing KNAPMU staff development and management training programs (sixman-months). The consultants would assist the senior staff develop-ment and training specialist to develop such a program in the firsttwo years of the project and would thereafter visit the project on ayearly basis (three man-months) to assess and evaluate the progressof staff training and development. Findings would be reported toKNSG and the Bank;

- 23 -
(b) Adaptive Research. The project-s research effort would at timesrequire assistance for short periods from specialists in particularaspects of innovative on-farm technology. Among the areas wherethis need is expected would be: on-farm and other low-level cropstorage, crop processing, mixed cropping systems, animal tractionand small-scale mechanization (six man-months);
(c) Water Supply. Specialized skills would be required in the hydro-geological field to assist in planning the water supply component,in particular in the interpretation of side-looking radar imagery(24 man-months) and for training of village maintenance personnel(32 man-months);
(d) Intermediate Technology. At present, technology used in fadamafarming (e.g., the shadoof) is unduly labor-intensive and ineffi-cient. Alternative, more efficient solutions exist at low tointermediate levels of technology, ranging from more efficient typesfof human- or animal-powered water lifting devices (as developed inparts of South Asia) to simple, low-maintenance diesel pumps thatmight be suitable for individual cooperative operations. To assistin introducing and adapting these and other similar technologicalinnovations to the area, 12 man-months of consultancies havebeen provided; 8 man-months also have been provided for detailedplanning in the Fadama areas.
(e) Marketing. Eighteen man-months of marketing services to review themarketing procedures within the state and the need for adopting moreappropriate procedures, and to assess the amount of produce beingmarketed in and outside the state;
(f) Socio-economic Evaluation. Twenty man-months for extra evaluationstudies on the overall economic effects of the project on variousstrata of farms, including changes in income distribution;
(g) Land Use Planning. Fifteen man-months have been provided forspecialized services including remote sensing and air photographyinterpretation, surveys, and cartographic services; and
(h) Other Studies. Twenty man-months of special studies on post-projectorganization, maintenance of feeder roads and rural water supply.
KNAPMU would be responsible for preparing detailed terms of reference forreview by the Bank prior to the engagement of any consultants, who would beemployed on conditions and terms satisfactory to the Bank.
C. Cost Estimates
4.26 Project costs during the five-year development period 1981-85,are estimated at N265.2 million (US$482.2 million). N119.2 million(US$216.8 million) or 45% would be foreign exchange costs, and N146.0million (US$265.4) local costs, of which N15.4 million (US$28.0 million)would be taxes.

- 24 -
4.27 Project base costs are calculated using prices obtained duringappraisal and updated to levels expected to prevail in January 1981. Costsinclude physical contingencies equal to 5% of base costs, except on civilworks which have 10%, and 25% for borehole drilling. Price contingencies arecalculated on base costs plus physical contingencies and are compoundedannually using the following annual rates: on local salaries and allowances,10%, on all other local costs, 15%; and on foreign costs, 9% in PYl, 8% in PY2and 7% thereafter. Total contingencies are equivalent to 26% of total costsor 34% of base costs. Details of project costs, presented in Annex 2, Table 1,and Working Paper C10 of the Project File, are summarized in Table 1 below.
4.28 The costs summarized in Table 1 are incremental, covering thoseinvestments and operational costs over and above the present MANR andMRCD recurrent budget covering comparable areas. This annual current levelof expenditure in the Agricultural Division of MANR for activities thatwill be absorbed by the project is approximately N2.7 million. At nego-tiations, KNSG agreed to transfer these activities and the associated budget(largely for extension staff) to KNAPMU. For annual farm inputs, the tableincludes those annual quantities which are incremental over the precedingyear s estimated consumption. In the case of fertilizer, which is the keyinput, FGN agreed during negotiations to make arrangements satisfactory tothe Bank to ensure that the requisite quantities would be made available toKano State for the project on time (para 2.12).
D. Proposed Financing
4.29 Of the total project cost of N265.2 million (US$482.2 million)the Bank would finance N78.1 million (US$142 million) at the lending rateof interest current at the time of loan approval and for a period of 20years including a five-year grace period. The Bank loan would represent 30%of project costs or 32% of costs net of taxes, and would be approximately66% of the foreign exchange component. FGN's contribution (N78.8 million)would consist of 25% of project costs exclusive of input costs (N48.0million), plus the fertilizer subsidy (N30.8 million) equivalent to 48%of the farmgate price. KNSG would contribute N91.9 million plus N3.5million as equity contributions to KASCO and the cooperatives (not part ofproject costs). Project farmers would contribute N16.4 million in theform of payment for inputs. Annex 2, Tables 2, 3 and 4 summarize the projectfinancing plan.
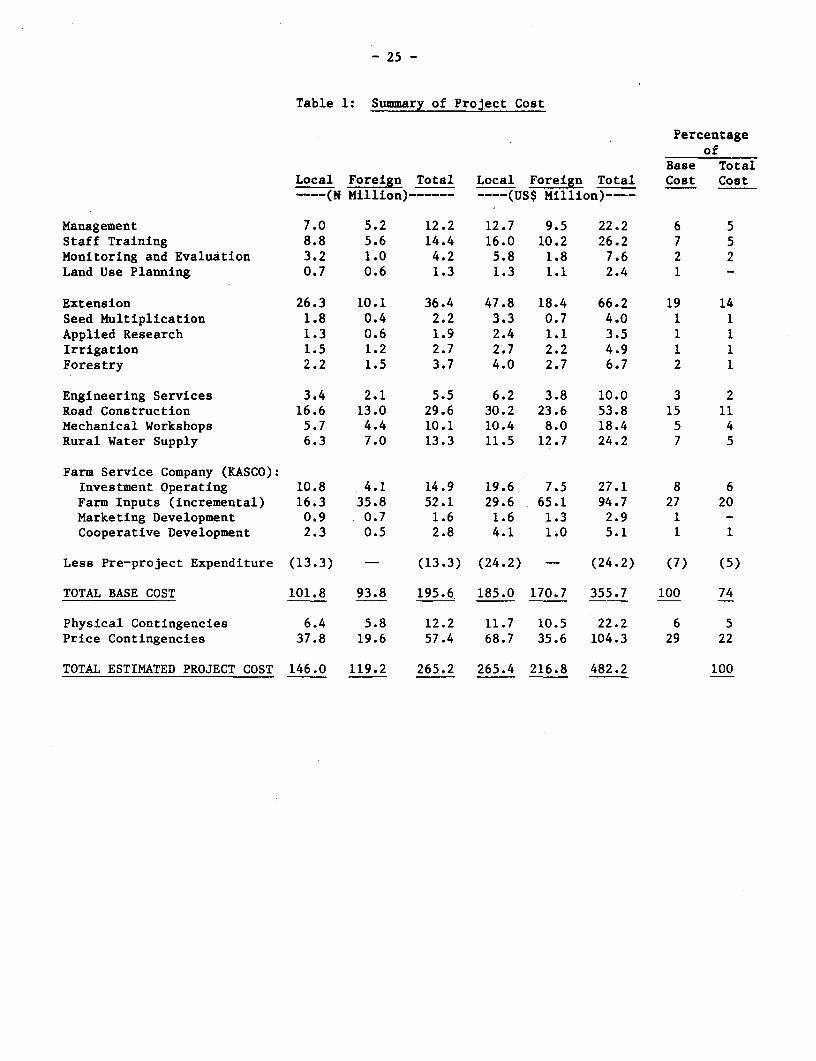
- 25 -
Table 1: Summary of Project Cost
Percentageof
Base TotalLocal Foreign Total Local Foreign Total Cost Cost--- (N Million)------ ----(US$ Million)---
Management 7.0 5.2 12.2 12.7 9.5 22.2 6 5Staff Training 8.8 5.6 14.4 16.0 10.2 26.2 7 5Monitoring and Evaluation 3.2 1.0 4.2 5.8 1.8 7.6 2 2Land Use Planning 0.7 0.6 1.3 1.3 1.1 2.4 1 -
Extension 26.3 10.1 36.4 47.8 18.4 66.2 19 14Seed Multiplication 1.8 0.4 2.2 3.3 0.7 4.0 1 1Applied Research 1.3 0.6 1.9 2.4 1.1 3.5 1 1Irrigation 1.5 1.2 2.7 2.7 2.2 4.9 1 1Forestry 2.2 1.5 3.7 4.0 2.7 6.7 2 1
Engineering Services 3.4 2.1 5.5 6.2 3.8 10.0 3 2Road Construction 16.6 13.0 29.6 30.2 23.6 53.8 15 11Mechanical Workshops 5.7 4.4 10.1 10.4 8.0 18.4 5 4Rural Water Supply 6.3 7.0 13.3 11.5 12.7 24.2 7 5
Farm Service Company (KASCO):Investment Operating 10.8 4.1 14.9 19.6 7.5 27.1 8 6Farm Inputs (incremental) 16.3 35.8 52.1 29.6 65.1 94.7 27 20Marketing Development 0.9 0.7 1.6 1.6 1.3 2.9 1 -Cooperative Development 2.3 0.5 2.8 4.1 1.0 5.1 1 1
Less Pre-project Expenditure (13.3) - (13.3) (24.2) - (24.2) (7) (5)
TOTAL BASE COST 101.8 93.8 195.6 .185.0 170.7 355.7 100 74
Physical Contingencies 6.4 5.8 12.2 11.7 10.5 22.2 6 5Price Contingencies 37.8 19.6 57.4 68.7 35.6 104.3 29 22
TOTAL ESTIMATED PROJECT COST 146.0 119.2 265.2 265.4 216.8 482.2 100

- 26 -
Table 2: Summary Financing Plan(N million)
Total IBRD FGN 1/ Farmers KNSG
Civil Works 40.8 20.4 10.2 - 10.2Plant, Vehicles, Equipment 50.6 31.8 12.7 - 6.1Borehole Drilling 6.6 4.6 1.6 - 0.4Salaries, International 13.1 13.1 - - -Consultants and OverseasTraining 2.1 2.1 - - -
Salaries, Local 52.1 - 16.7 - 35.4Operating Costs and GeneralServices 27.1 - 6.8 - 20.3
Fertilizers-incremental 64.1 - 30.8 7.7 25.6Incremental Chemicals andFarm Implements 8.7 6.1 - 8.7 (6.1)
Total 265.1 78.1 78.8 16.4 91.9
100% 30% 30% 6% 34%
1/ 25% of project costs excluding farm inputs, plus fertilizer subsidy.
4.30 Under the project, annual consumption of fertilizer would risefrom about 46,900 tons in the pre-project year to about 230,500 tons inYear 5. Total consumption throughout the project period would be about725,800 tons (Annex 3), of which about 491,300 tons would be additional topre-project consumption levels. Under current subsidy practices, FGN sub-sidizes 50% of the cost delivered to Kano, the farmer pays a fixed price(approximately equal to about 17% of the cost to Kano) and KNSG pays theremaining costs, including all costs of distribution within the State.Continuing current subsidy practices, the total cost to FGN and KNSG offertilizer subsidies over the project period would be N227.6 million. TheBank would not finance the foreign cost of incremental fertilizer requirements,as the Government is able to finance the unduly heavy subsidies to the ruralsector from its oil revenues. A comprehensive financing plan including theseamounts is given in Annex 2, Table 2.
4.31 The Bank loan of US$142.0 million would be made to the FederalGovernment, who would onlend on the same terms and conditions to KNSG under asubsidiary loan agreement drawn up between FGN and KNSG. The signing of thesubsidiary loan agreement would be a condition of effectiveness. As manyongoing projects are suffering from inadequate and untimely inflows of fundsfrom Government sources, FGN and KNSG agreed during negotiations to aflow of funds mechanism to address this problem. KNAPMU would submit atleast four months prior to each fiscal year the project's proposed annual
- 27 -
budget as approved by the KNARDC to FMA and the Bank. KNAPMU would beauthorized to establish overdraft facilities equivalent to three-monthsexpenditure, N5 million and the overdraft would be guaranteed by KNSG. (Acondition of effectiveness requires KNSG to provide evidence satisfactory tothe Bank that the guaranteed overdraft facilities had been established witha commercial bank.) KNSG and FGN would each pay their contribution into theproject's bank account quarterly and in advance in accordance with theapproved annual budget. It was agreed at negotiations that, in the event ofKNSG's being delinquent in paying its contribution to project costs, FGNwould pay the State-s contribution directly from KNSG-s statutory allocationinto the project's bank account. This would be specified in the subsidiaryloan agreement between FGN and KNSG. A condition of effectiveness would bethat FGN and KNSG had each made payments of N3 million to the project sbank acccount. Bank reimbursement would be made directly to KNAPMU-scommercial bank account.
E. Procurement
4.32 Chemicals and agricultural implements valued at N18.6 million(US$33.8 million), of which N8.7 million (US$15.8 million) is incremen-tal, vehicles, road construction equipment, tractors and other equipmentand spare parts valued at N50.6 million (US$92.0 million), and civilworks including buildings, boreholes, and materials for road and dam con-struction valued at N46.4 million (US$84.4 million) would be procuredthrough international competitive bidding. Services of consultants andinternationally recruited staff, and provision of overseas training, valuedat N16.7 million (US$30.4 million) would be obtained in accordance withprocedures acceptable to the Bank. Contracts for civil works valued atless than US$2 million and other contracts for less than US$200,000 wouldbe awarded following local competitive bidding procedures acceptable tothe Bank. For contracts of less than US$60,000 direct competitive shoppingwould be employed. Items for procurement would be bulked to permit optimumuse of competitive bidding. Domestically manufactured goods would beallowed a 15% preference or the applicable import duty, whichever may belower, when comparing bids with those of foreign manufacturers in procure-ment under ICB. Fertilizer valued at N82.6 million (US$150.2 million)would be procured by NFMC and would not be reimbursable under the loan.
F. Disbursements
4.33 The Bank loan would be disbursed during from 1981 to 1986 asfollows:
Category I 50% of the cost of buildings (US$33.3 million);
Category II 100% of the foreign expenditures for directlyimported goods for vehicles, tractors, heavy plant,generators, road-equipment, and spare parts, or 85%if locally procured (US$52.0 million);

- 28 -
Category III 100% of the cost of salaries and allowances ofinternationally recruited staff and cost of consul-tant services, studies and overseas training (US$25.0million);
Category IV 100% of the foreign costs or 70% of the total costsof expenditures on contracted borehole drilling forrural water supply, (US$7.5 million);
Category V 100% of the foreign expenditure on directly importedincremental chemicals and other farm inputs, excludingfertilizers, or 70% if locally procured, (US$10.0million);
Category VI An unallocated amount of US$14.2 million.
All expenditures would be fully documented and disbursements for all cate-gories would be made only against authorized contracts. Provision has beenmade for up to US$400,000 of retroactive financing for key internationally-recruited staff, to begin work after negotiations to assist in projectstart-up activities. A schedule of Bank loan disbursements is givenin Annex 2, Table 5.
G. Accounts and Audits
4.34 KNAPMU and KASCO would keep financial records in accordance withsound accounting practices to reflect their operations and financial posi-tions and would have these audited by independent external auditors accept-able to the Bank. The audited accounts and the auditors' reports, includingstatements as to whether Bank funds had been used for their intended purpose,would be submitted to the Bank within four months of the end of the fiscalyear.
H. Programming and Budgeting
4.35 Annual budgets would be prepared by KNAPMU based on appraisalestimates amended, where necessary, to reflect changes in costs and projectdevelopment policies. These would be submitted to KNARDEC and the projectwould operate on the basis of these statements. KNAPMU would prepare forprompt submission to the Bank, quarterly and annual progress reports in-cluding summaries of expenditures and use of funds. On the basis of theapproved annual budgets, KNSG would make budgetary allocations and thereforewould make available to KNAPMU all necessary funds quarterly and in advance.It was agreed at negotiations that FGN would pay KNSG's share of costsdirectly from KNSG's statutory allocation in the event that KNSG weredelinquent in its payments. Separate bank accounts for KNAPMU and KASCO

- 29 -
would be opened with commercial banks and FGN and KNSG would each make initialdeposits of N3 million for KNAPMU and, KNSG, N3.0 million for KASCO (aspayment of cash equity). Opening of the two bank accounts and the respectiveinitial deposits would be conditions of effectiveness.
4.36 At negotiations KNSG confirmed that its share of project costs wasincluded in the Fourth Development Plan currently under preparation. It also
agreed to prepare and submit to the Bank by September 30 of each year anAction Plan detailing the specific investments and project activities proposedfor execution during the following fiscal year. The plan would also specifyarrangements for training and for road and water supply maintenance, includingwhere appropriate, supplementary funding arrangements from KNSG and LGCs
(e.g., for road maintenance). Submission to the Bank for approval of thefirst Action Plan for the year 1981 would be a condition of effectiveness.The yearly plans should include a budget for the following year, the annualreport for KNAPMUTs previous year s operations and a report on its operationsand finances. The Action Plan and the audited financial statements for theprevious year would be reviewed by KNSG and the Bank at an implementationreview to be held in October of each year. The implementation review andagreed Action Plan would form the basis for Bank supervision of the project.Supervision would also be supported by the project-s management informationsystem and by ongoing monitoring and evaluation data collected by the FASU andAPMEPU.
V. TECHNOLOGY AND PRODUCTION SPECIFICATIONS
A. Crop Development
5.01 Agronomic recommendations and yield projections are based onrelevant research experience in FADP and other projects and observed perfor-mance under field conditions. Development proposals for the improved cropshave additionally taken account of the ecological conditions in the four zonesof the State, and socio-economic constraints, including family finances andlabor availability. The technology proposed is simple and relatively inexpen-sive. In brief, substantial increases in the present very low yields of graincrops, groundnuts and cotton in the upland areas, and of irrigated vegetablesand wheat, rainy season rice and sorghum and maize in the fringe fadama lands,would involve improved cultivation practices. These include the use offertilizers on time and in adequate quantities, improved planting material(cleaned, dressed and certified seed), pest and disease control, appropriatepractices such as timely planting, spacing and crop mixing, timely weeding andsound post harvest practices. Detailed recommendations are shown for rainfedupland crop husbandry and production are shown in Annex 1, table 1 and forfadama crops in Annex 1, table 4. Certified seed would be made available toparticipating farmers with the aim of renewing one fourth of the farmer'srequirements every fifth year for sorghum, millet, cowpeas, maize, groundnutsand wheat, and the total quantity of vegetable seed requirements every fifthyear. The National Cotton Board would continue to provide all cotton seed.

- 30 -
The crop varietal recommendations must be regarded as tentative. As part ofits adaptive research program KNAPMU would carry out trials in the early yearsof the project to determine suitable varieties for different areas.
5.02 More sophisticated technology would be introduced for farmersparticipating in the advanced program. This would include higher fertilizerlevels and improved seed, appropriate planting methods and increased numberof sprayings for pest control. Oxen and tractor implements would be intro-duced to help in row planting. Weeding of crops sown in rows would befacilitated and would permit use of manual weeders early in the season therebyreducing labor peaks on a pilot but fairly large basis. The project wouldalso attempt to integrate to a fairly large degree animal rearing with arablefarming. With increased production, there would be substantial quantities ofcrop residues which could be profitably converted into meat by smallscalefattening units.
5.03 Using the figures for yield increases, and essential recommendedfarm inputs, shown in Annex 1, Table 1, it is estimated that the increase inyield brought about by the BSP and ASP packages'would raise average farmers'gross incomes to levels which should make the enterprise economicallyattractive. For details on farm budgets, see Chapter VIII, Section A andAnnex 4, table 2. Projected increases in the production of individual cropsat full development (PY5) are shown in Annex 1, table 3 for upland rainfedcrop production. For example, in zones 1 and 3, under improved practices(BSP), sorghum yields would rise from 550 kg/ha to 850 kg/ha, millet 350 to600, maize 450 to 1,200, cowpeas 120 to 500, groundnuts 350 to 800, andcotton 190 to 350.
5.04 Fadama Development. Traditional irrigation is currently practicedon an estimated 60,000 ha "fadama" land. Dry season vegetables are grown bytapping water from reservoirs, streams and shallow water tables by means ofa hand operated water lifting device known as a "shadoof". Rice is grown onthe flood plains of the Hadeija-Jama'are River under semi-controlled flooding.
5.05 The project would improve fadama crop production by providingfertilizers, better seed and pesticides, and by promoting timely plantingand appropriate planting techniques. But the greatest emphasis would belaid on making optimal use of the fadama's scarce dry season water resources.Conditions under which this water is found vary from zone to zone and there-fore call for a flexible approach and local farmer trials to test appropriatesmall-scale irrigation equipment, techniques, and practices. The proposedfadama development component, covering 27,400 ha in total, and the crops tobe grown are given in Annex 1, Table 4. The proposed technology would berelatively inexpensive and easy to implement, and would involve three mainactivities.
5.06 Fadama intensification would aim at making more efficient use ofrun-off through bunding and ridging, and of residual moisture or the capil-lary fringe of shallow groundwater tables. A second crop could thus be grownduring the dry season, if timely planting is observed at the tail end of therains. An estimated 14,700 ha would thus be developed.
- 31 -
5.07 Pump irrigation would provide for the replacement of the shadoof bymodern low lift manual or motorized water lifting devices. Efficient handpumps would be introduced which would allow individual farmers to irrigatefrom 0.5-0.8 ha, where currently "shadoof" irrigated plots would rarely exceed0.1-0.2 ha. As a next step, 3-4" diesel driven pumps with a capacity of up to75 m3 per hour would be procured to irrigate from 3 to 4 ha each. Groups offour to six farmers would be encouraged to purchase one such unit permittingthem individually to expand their plots to at least 0.5 ha. The total thusirrigated would reach 6,800 ha.
5.08 Improved Flood Irrigation would be undertaken on selected partsof the major river flood plains, to increase the production of traditionallygrown rice. Here, land preparation currently consists of a rudimentarysystem of bunds and ridges and brushwood diversion structures. Rice, mainlyGlaberrina varieties, is thus inadequately protected against prevailingfloods and consequently, is low yielding, and land is used inefficiently.The project would assist groups of farmers with technical support to selectand improve the layout of riverine areas of up to 20 ha for the productionof paddy under higher standards of water conttol. Improvement would consistof the construction of more permanent protective bunds at locations whichwould be less exposed to floods. The area thus isolated would be divided bysmall bunds into plots of 0.5 to 1.0 ha, depending on the configuration ofthe land, and peripheral supply ditches with check structures would beprovided where appropriate. Provision would also be made for the removal ofexcess water by means of shallow drains and checks leading to a main drainand drainage outlet. The aim would be to allow two crops to be grown peryear on an estimated 5,900 ha: high yielding rice during the floods,followed by dry season maize, sorghum or cowpeas, making use of residualmoisture.
5.09 Planning assistance would be provided free of charge to interestedfarmers. Surveys would be undertaken in close association with the land useplanning unit to locate fadama lands best suited for the development envisaged.Particular attention would be given to water balances of local catchments tomake most efficient use of available water, both at the start and tail end ofthe rains and during the dry season. Survey teams would assist farmers inadapting the layout of the "shadoof" irrigated gardens to the new water yieldsupplied by modern water lifting devices. The fadama development componentwould be supported by a program of trials conducted on farmers' field to testthe proposed new technology, techniques, and practices.
5.10 As a rule, farmers would themselves undertake the construction ofditches and bunds for land preparation, but, where needed, would be expectedto hire labor paid from their own resources or from loans, which would beobtainable from the Kano Cooperative Bank channelled through the cooperativesystem. The average cost of land improvement would vary from an estimated250 N/ha (US$454) for pumped irrigation (by motor pumps) to 400 N/ha (US$727)for improved flood irrigation. Motor pumps would be available at N2,500-3,000(US$4,545-5,454) each from KASCO, which would also stock diesel fuel and basicspare parts at FSC outlets. The project would provide training through itsextension services to farmers in pump operation and maintenance.

- 32 -
B. Forestry Development
5.11 The project would upgrade and rehabilitate 15 state-owned irrigatednurseries, each capable of producing 300,000 to 500,000 seedlings annually forboth plantations and distribution to farmers and villagers. Tree-plantingwould be undertaken in five selected degraded watersheds for five years, onabout 500 ha each year. The Kano State Forestry Division staff would beresponsible for the nursery production of tree seedlings and their distribu-tion, and for the planting, protection and maintenance of trees planted onrehabilitated degraded land. The local government forestry staff, whereavailable, would be responsible under the guidance of the State forestry staff,for the extension work required in popularising tree planting by individualfarmers and villagers. An expert in degraded land rehabilitation would workwith the project's land use planning unit to guide and advise the StateForestry Division, which would carry out the program on the 2,500 ha areaselected. The project would also provide funds for research into the introduc-tion of more efficient wood-burning stoves and bio-gas production on selectedfarms. Details are given in the Project File, Working Paper C7.
C. Feeder Roads
5.12 The tentative work program for the construction of 1,440 kms offeeder roads by KNAPMU mechanized units is shown below. Units using motorscrapers would operate in Zones 1, 2 and 3 where laterite haulage distancesare short. In Zone 4, where practically no suitable gravel deposits areavailable, hired tipper trucks would transport selected surfacing materialto the construction site.
Table 3: Feeder Road Program
…---------- Kilometers-----------
ZONE PYI PY2 PY3 PY4 PY5 TOTAL
1 60 120 105 85 75 4452 60 120 105 85 75 4453 60 120 105 85 75 4454 10 20 25 25 25 105
State 190 380 340 280 250 1,440
5.13 Based on the experience of ongoing ADPs, the feeder roads would bebuilt to withstand axle loads of 10 tons and a traffic density of up to 100vehicles per day (vpd). KNSG has agreed to transfer the responsibility formaintaining roads carrying over 100 vpd to the state MWH. In most areas, theroad section would incorporate a 7.3 m carriageway with 3% falls to "v" shaped

- 33 -
side drains. However, in the less populous areas of the state, a narrower5m carriageway would be adopted. The running course would be surfaced withgravel to a compacted depth of 15 cm. In fadama areas subject to seasonalflooding, simple grading and compaction would be carried out to improve dryseason access. Watershed alignment would be adopted, wherever possible, tominimize drainage and subsequent maintenance requirements. Drainage struc-tures would be simple and inexpensive.
5.14 A team of consultants would assist in managing the execution of thefeeder road program and would train road staff. Road construction would becarried out directly by KNAPMU with zonal construction units of the engineer-ing division, under the control of a road engineer experienced in feederroadworks and responsible directly to the zonal management. Technical guidancewould be available from the Chief Engineer who would also be responsible forcoordinating the statewide road program. Mechanical services would be providedby zonal workshops under the control of an experienced mechanical engineer.The Mechanical Engineer at KNAPMU would advise on workshop design and equip-ment and establish a unified mechanical stores system throughout the zones.He would also arrange a central mechanical spares procurement organizationfrom both local and overseas sources.
5.15 The project would maintain close contact with both MWH, MRCD, andMLG on mutually agreed roadwork activities to ensure that feeder road main-tenance is properly funded and coordinated. Both periodic and routine main-tenance units would be established in each zone during the project and would,where necessary, employ the services of local haulage contractors for re-gravelling.
D. Rural Water Supplies
5.16 Kano State's RWS strategy would be a shared responsibility ofWRECA, MRCD, HJRBDA and the project (para. 3.07). It would consist of abalanced statewide program of medium (8") and small size (4" to 6") boreholesand shallow wells, equipped with motorized or hand pumps, storage tanks, andstandpipe reticulation systems. The program would take into account the sizeof communities to be served, user requirements, availability of water re-sources, relative cost-effectiveness of alternative systems and orders ofpriority. An implementation schedule would be worked out annually to estab-lish clearly individual responsibilities of the agencies involved. Theproject would concentrate mainly on borehole drilling and well rehabilitationas indicated below. These figures represent an approximate order of magnitudeonly, and would be subject to amendment during implementation, without chang-ing the total capital funds provided.
5.17 Boreholes. The major thrust of the water supply program wouldbe the drilling of some 1,000 boreholes distributed over the four zones.Siting would be undertaken, well in advance of mobilization of drillingoperations, by a team of rural water supply specialists and hydrogeologists.In the hard rock areas of the two western zones, boreholes would be sited

- 34 -
under a specialized contract making use of existing Side-Looking AirborneRadar (SLAR) imagery, while in the alluvial formations electric resistivitydepth probing would be applied where justifiable. The use of SLAR hasproven effective in spotting the major joints and lineaments in the hardrock formations and has, in the process, increased the success rate insiting boreholes of satisfactory yield (1.0-2.Om3/hr), from the current60% to over 90%.
5.18 Borehole drilling would be undertaken with modern versatile rigs,capable of rapid drilling using down-the-hole percussion in the hard rocks ofthe Basement Complex, and compressed air/rotary drilling techniques in thesedimentary rocks and river alluvium or aeolian deposits of the eastern zones.
5.19 As a rule 4" to 6" boreholes would be drilled to a maximum depthof 50 m. Casing would be provided over the length of the borehole in thesedimentary formations and until solid bedrock is reached in the hard rocks.All boreholes would be equipped with hand pumps of proven sturdiness andsuitability.
5.20 Trial programs in the area indicate that, if the modern equipmentand techniques described above are applied on a sufficiently large scale andwith maximum efficiency, unit costs can be substantially reduced from therates currently quoted by local contractors. Drilling therefore wouldbe undertaken by qualified firms contracted under ICB, although if bidsreceived prove too high, other procurement arrangements acceptable to theBank would be made.
5.21 Wells. An estimated 1,000 wells would be rehabilitated and modern-ized. This would involve deepening the shaft to 4-5 m below dry season watertables, making use of motorized sludge pumps to reach well yields of up to2m3/hr. Also, the facilities around the well-head (including stock wateringprovisions) would be improved. The wells would be sealed off with reinforcedconcrete lids to reduce pollution and fitted with one or two hand pumps. Fourfully-qualified and well-equipped well rehabilitation units would be estab-lished (one for each zone) to train LGC teams in well maintenance and rehabil-itation. Each unit would be capable of rehabilitating 50 wells per year inthe process.
5.22 Maintenance. Drilling contractors, pump suppliers and project staffwould be expected to organize and supervise maintenance during an initial rea-sonable period following construction. They would also train local staff, insupport of the maintenance programs which would be organized at the village,LGA, and Zonal levels to ensure the proper long-run functioning of thesefacilities.

- 35 -
VI. DEMAND, MARKETING AND PRICES
A. Demand
6.01 Nigeria is a net importer of food, and the 1979 Nigerian Agricul-tural Sector Review (Report 2181-UNI), in common with other serious studies,projects the gap to continue widening. In the absence of fundamental policychange, the report projects a deficit of 11 million tons of cereal equivalentper annum by 1990, representing an import bill of N1.3 billion at 1978prices. In aggregate, therefore, there should be no lack of demand fordomestically produced foodstuff. In individual sectors, however, problemsmay be created by competition from imports brought into Nigeria at an exchangerate which is sustained only by the oil sector and which does not correspondto cost structures in the other productive sectors of the economy.
6.02 Agro-ecologically, Kano State is mainly suited for food grainproduction, but is prone to severe drought cohditions in some areas. Produc-tion of food grains in 1979-80 was estimated at 1.54 million tons, comparedto an annual consumption of 1.59 million tons.l/ Thus, the state is almostself-sufficient in food grains at present. These estimates are highly specula-tive, as the figures of area, productivity and population are subject to widemargins of error. With the full realization of production targets, by PY5the state will have a production of around 2 million tons of food grains, anincrease which would just suffice for the increased population during theproject period. In the years of serious drought, however, there could be adeficit in food grains production, causing distress particularly in the SudanSavanna areas of Zones 2 and 4 of the project.
B. Marketing
6.03 With small landholdings and large family size, most farmers havevery little marketable surplus to offer. As a result of the perceivedclimatic risks to farming, many families hold back their marketable surplusuntil the prospects for the new crop are well established. As this surplusmay not be sold at a single time in one market, this has led to the need forbulking and assembly through a large number of petty traders operating inthe villages and in more than 300 local weekly markets. According to astudy made in 1975,2/ eight different types of intermediaries are involved
1/ "Food situation in Nigeria - An economic analysis of sorghum." Insti-tute of Agricultural Research, 1978. SAMARU - Misc. Paper 80. Calcu-lated on the basis of 3.7 kg per capita per week, for a population of8.3 million.
2/ Hays, H.M. "The Marketing and Storage of Food Grains in NorthernNigeria," 1975.

- 36 -
in moving the produce from the villages to the ultimate consumers, withmarkups approaching more than 30% of the final price to the consumer. Thepresent marketing system appears to be broadly competitive and non-exploita-tive, and to work satisfactorily. With improved roads and transport, farmersare not expected to meet any serious marketing problems; however, increasedproduction may depress food crop prices and thus act as an incentive toproduce other cash crops such as cotton and groundnuts. Existing cooperativeinstitutions at the village and LG level should take up marketing of agricul-tural produce, and could be increasingly engaged as licensed buying agents(LBAs) by the groundnut, cotton and grains boards. The project would assistthem in this task by financing the construction of 13,000 tons of storage forproduce and inputs, training and initially financing the salaries of primarysociety secretaries and union managers, and providing technical assistancethrough the Chief Marketing Officer. Further advice and assistance would beprovided through KASCO. To ensure that the cooperatives have adequate workingcapital to engage in marketing operations, KNSG agreed at negotiations toparticipate in the share capital of the primary societies and unions up to atotal of N500,000. Fadama vegetable growers would be organized to markettheir produce through cooperatives.
6.04 The project would strengthen marketing in other ways. To overcomea lack of reliable market information, the project would finance studies onproduction and supply of various agricultural commodities, considering mar-ket arrivals and directional movements, prices in producing and consumingcenters, transport and handling problems, scrap, and weights and measures.It would establish a simple market intelligence system, finance selectedimprovements to LGC-operated markets, and promote better on-farm storage bymaking available through KASCO improved storage bins on credit terms. Ongoingsector work, and the preparation of a possible National Agricultural MarketingProject for Bank intervention, will review market intelligence, the function-ing of the Boards, and measures necessary to involve the private sector morefully in produce marketing.
C. Prices
6.05 There is a growing disparity between prices for home-produced food-grains and the corresponding world market prices. With the high inflation inNigeria and the overvalued exchange rate, domestic food prices have increasedrapidly. For example, the average price for domestic wheat at harvest in 1979was about N510 (US$923) per ton with fluctuations within the same year fromN352 to N610 per ton. By contrast the cost of imported wheat, c.i.f. Kano, isonly N288 (US$524) per ton. The prices of groundnuts and cotton in the openmarkets within Nigeria, on the other hand, were in the past greatly suppressedin real terms in favor of foodgrains, making cultivation of these cash cropsless attractive. Groundnut prices have recently been raised. The futuremarket prices of various commodities would depend on Federal Government policyon imports, and price and market support of the local produce. The prices ofvarious agricultural commodities used in project financial and economicanalysis are given in Table 4 below.

- 37 -
Table 4: Financial and Economic Prices (N/ton)(Constant 1981 Prices)
Financial EconomicCommodity 1979* 1981 1981 1985
Sorghum 190 320 165 172Millet 207 345 176 182Maize 240 370 188 193Cowpeas 378 575 345 415Paddy Rice 319 256 150 170Groundnuts 447 460 376 412Wheat 288 310 218 222
* Actual.
VII. PROJECT ORGANIZATION
A. Project Coordination and Management
7.01 The project embraces a wide range of activities which are nownominally the operational responsibility of different ministries, agencies,and institutions (paras 3.20-3.27). Kano State is relatively fortunate inhaving a long tradition of reasonably effective state and local governmentinstitutions. The project has been designed, however, to introduce effectivemanagement and coordination of rural development activities where they are nowlacking, and to strengthen the technical base needed for project execution andpost-project development.
7.02 As the Kano Agricultural Development Project is to be the basis forlong-term agricultural and rural development in Kano State, a state committeewould be established to coordinate and define rural development policy andoversee project execution. This body, the Kano State Agricultural and RuralDevelopment Executive Committee (KNARDEC) would consist of the Governor or hisnominee (Chairman), representatives of the Ministries of Agriculture, Ruraland Community Development, Trade, Industry and Cooperatives,and Local Govern-ment, the Secretary to the State Government, the Advisor to the Governor onAgriculture and Rural Development, the Director of the Budget, the ProgramManager, the Managing Director of the Kano Agricultural Supply Company, theGeneral Manager of the Hadejia-Jama'are River Basin Development Authority(HJRBDA), two chairmen of Zonal Development Committees (para 7.05) chosen byrotation, and a representative of FMA. This committee would be responsiblefor reviewing and agreeing to the annual implementation program and budget tobe sent to the Governor and the Kano State House of Assembly for appropriationof funds; coordination of program activities with other State and Federalministries and with other agencies and institutions, including WRECA, and theHJRBDA; formulation and approval of training policies; appointment of senior

- 38 -
staff; and approval of contracts over N60,000.1/ The establishment ofKNARDEC would be a condition of effectiveness.
7.03 KNARDEC would have two major technical subcommittees. The MarketingLiaison Committee would be chaired by the Chief Marketing Officer. It wouldmonitor, and make recommendations concerning marketing of agricultural outputand the input supply performance of KASCO. The Water Development LiaisonCommittee, to be chaired by the Chief Engineer, would ensure coordination ofthe water supply and small-scale irrigation aspects of agricultural develop-ment program with the water supply activities of WRECA and with the irrigationdevelopment program of the HJRBDA, especially in the fadamas of the HadejiaRiver in Zone 4 (para 5.08).
7.04 The agricultural development program would operate through fourzones:
Zone 1: Gwarzo, Bebeji, Rano, Kura, Tudun Wada, Rogo andDawakin Kudu LGAs, (headquartered at Rano);
Zone 2: Dawakin Tofa, Minjibir, Gezawa, Bichi, Kazaure, Garkiand Danbatta LGAs, (headquartered at Danbatta);
Zone 3: Samalia, Wudil, Gaya, Dutse, Birnin Kudu and GwaramLGAs, (headquartered at Birnin Kudu); and
Zone 4: Ringim, Gumel, Maigatari, Kaugama, Birniwa, Hadejia,Jahun and Kafin Hausa LGAs, (headquartered at Gumel).
7.05 A Zonal Development Committee (ZDC) would coordinate programexecution at the zonal level. It would consist of an appointee of theGovernor (Chairman), Chairmen of the zonal LGCs, the zonal manager and thezonal chief accountant. It would advise on the annual zonal program and itsbudget, ensure coordination with LGC officials, and monitor the staff develop-ment of LGC staff involved in water supply maintenance. It would providetechnical coordination and advise project management on the siting of roads,FSCs and other civil works, establish guidelines for land allocation (wherenecessary) and payment of land compensation by the LGs, and review project-related disputes. Where appropriate, the ZDC would seek advice from LGCs,village councils, farmers groups, and the primary cooperative societies inthe zone.
7.06 Project Management. The project would be executed by the KanoAgricultural Program Management Unit (KNAPMU), which would report to theKNARDEC. Its establishment would be a condition of effectiveness. Duringthe five-year development period, the project-s operating divisions would beattached to the Unit, and their staffs seconded from existing Ministries:the Agriculture Department from the Ministry of Agriculture and the Feeder
1/ Contracts of less than N60,000 could be awarded by KNAPMU.

- 39 -
Roads and Rural Water Supply Divisions from the Ministry of Rural andCommunity Development. Existing agricultural extension workers, mainlyfield overseers and agricultural instructors, who had been transferred tolocal governments, would be transferred back to the Agriculture Department.In addition to the program manager, key KNAPMU staff would include thefinancial controller, chief technical officer, chief engineer, mechanicalengineer, irrigation engineer, chief training officer, land use planner,chief forestry officer, principal evaluation officer and senior evaluationofficer (farm management), chief marketing officer, senior water supplyengineer, senior hydrogeologist, and mechanical engineer (Water Supplies). 1/
7.07 Four zonal managers would be responsible to the program managerfor the full implementation of the program within their zones. They wouldinitiate the annual work program and budget, after consultation with the ZDCand KNAPMU. They would supervise construction of roads and water supplies,establish and operate a zonal workshop and operations center, and maintaintransport and buildings. The zonal managers would control agriculturaldevelopment and training, and would liaise with the zonal evaluation unit,KASCO, and cooperatives.
B. Staffing and Training
7.08 There continues to be critical shortage in Kano State, and ingeneral in Nigeria, of trained staff with experience in managing large andcomplex projects. Experience from ongoing projects indicates that theshortage is particularly evident at senior and middle levels of management.The problem is further aggravated by the disparity between salary levels inthe public and private sectors, and by most state governments reluctance toemploy Nigerian personnel non-indigenous to the State. A well-designed andsystematic training program for Nigerian personnel is, therefore, necessary.It would be supervised by the Chief Training Officer assisted by an advisorypanel of senior Ministry and project personnel. Candidates for managerialpositions would undertake individually tailored work programs which would besystematically evaluated by the advisory panel. To reinforce the practicalon-the-job experience acquired by working closely with expatriate personnel(para 7.10), a management skills instructor would be employed to design andteach basic management skills and techniques based on a survey of needsconducted in PYI. Detailed incremental staff requirements for the projectare in Annex 1, Table 8. Agricultural instructors trained by KNSG under acrash program in 1980 before project start-up would be upgraded at a laterdate.
7.09 In the three completed and six ongoing rural development projects,the Bank has encouraged state governments to identify and recruit suitableNigerians for key positions, but in nearly every instance, it has proven
1/ If KNAPMU were to undertake the borehole program on force account,two master drillers, a drilling mechanic and a water supply logis-tics officer would be added to the KNAPMU staff.
- 40 -
extremely difficult. The large number of vacancies now existing in thesenior and middle management ranks of the MANR requires the employment ofexpatriates in the accounting, engineering, training, management and techni-cal agricultural fields. The project has therefore provided funds (aboutUS$94,000 per man-year) 1/ for international recruitment, where necessary,of experienced and well-qualified staff, about 210 man-years, to supplementthe skills available from the ranks of the civil service. They would supplyadministrative support, training of government staff, and reporting assistance.
7.10 Internationally recruited technical staff include the programmanager, four zonal managers, the chief technical officer and four zonaltechnical officers,a conservator of forests, two evaluation officers, oneland use planner, irrigation engineer, chief training officer, four zonaltraining officers, media specialist, and management instructor. Financialstaff include the financial controller, KASCO financial controller, and fourzonal chief accountants. Engineering staff include the chief engineer,senior water supply engineer, senior hydrogeologist, three roads engineers,and four mechanical engineers. 2/ Commercial staff would include a chiefmarketing officer, and KASCO's managing director and commercial manager.Expatriate employees would, as part of their terms of reference, be requiredto participate in the training of their deputies as designated successorsand by the end of the project most, if not all, of the key managerial andsupervisory positions should be in the hands of Nigerians.
7.11 International recruitment would be carried out according to proce-dures acceptable to the Bank, in accordance with the Bank's guidelines forthe use of consultants. The cost of Nigerian nationals employed throughconsulting firms in accordance with these procedures would be eligible forreimbursement from the Loan. The Bank's Agricultural Projects ManagementUnit for Western Africa (APMU) would assist in recruiting the program manager,the financial controller, the chief technical officer, the chief engineer andtraining and staff development officer. The other internationally recruitedstaff would be engaged through a consulting firm or firms, Nigerian-basedwhere possible, in order to allow Nigerians from the private sector, as wellas expatriates, to be considered. Staff and consultants to help in projectexecution would be engaged with qualifications and experience, and accordingto terms of reference and contracts, satisfactory to the Bank. Recruitmentprocedures were agreed during negotiations. The appointment of the programmanager, the financial controller, the chief engineer, the four zonal mana-gers, the four zonal chief accountants, and KASCO's managing director, commer-cial manager and financial controller would be a condition of effectiveness.Prior to effectiveness, KNSG should have also made satisfactory arrangementsfor the recruitment of the remaining KNAPMU staff.
1/ Includes salary, allowances, gratuity, medical, education and settlementcosts, international travel, company overheads and fees.
2/ Two master drillers, a drilling mechanic and a water supply logisticsmanager would be required if the water supply program is undertaken onforce account (para. 4.32).

- 41 -
C. Input Distribution
The Kano Agricultural Supply Company, Limited (KASCO)
7.12 To ensure satisfactory procurement and distribution of inputs,a State-owned input supply company, the Kano Agricultural Supply CompanyLimited (KASCO), would be established. Its establishment and the appoint-ment of senior staff (para 7.11) would be condition of effectiveness.
7.13 Under a similar regional development project in Ghana, financedunder Loan 1291-T-GH, a company similar to KASCO has been established,with the ultimate objective of company ownership by the farmers. As inthe statewide projects in neighboring Kaduna and Bauchi States, this wouldbe the ultimate objective for KASCO. This could be achieved either bymerging with the Kano State Cooperative Federation Limited, or by theprogressive sale of shares to farmers as equivalent amounts of governmentequity were paid off.
7.14 KASCO would actively support cooperative development. Wheresuitable cooperatives existed, FSCs would be taken over by societies toprovide inputs and services to all farmers, whether members or not. Toassist in the proper management of the FSCs, KASCO would second a GeneralManager to the Kano Cooperative Federation and provide full technicalsupervision, coordinating with the Chief Registrar of Cooperatives and therespective union as appropriate. In the event that any cooperatively-managedFSC should not perform satisfactorily, the entire input supply operation atan FSC would revert to KASCO.
7.15 KASCO would be established in Kano under the 1968 Companies Act,with an authorized share capital of N20.0 million. The initial issue ofshares would be subscribed wholly by KNSG. 1/ The main objectives of KASCOwould be to:
(a) ensure the timely supply of appropriate farm inputs to as manyeffective retail outlets as possible, especially cooperatives,farmers organizations, and FSCs of whatever sort;
(b) ensure that such supplies are efficiently distributed and avail-able to all farmers and take appropriate steps to remedy anydeficiencies including, where necessary, the establishment ofwholly or jointly-owned retail outlets; and
(c) work in close cooperation with the Kano State CooperativeFederation to achieve these objectives.
1/ The share capital would consist of cash equity of N3.0 million,and other shares issued for considerations other than cash, com-prising facilities and inventories taken over on formation of thecompany.

- 42 -
A summary of the Memorandum and Articles of Association of the Company isin Appendix 1 of Working Paper C3. When operational, the Board of Directorswould initially consist of the Advisor to the Governor on Agriculture andRural Development (Chairman) Permanent Secretary, MANR, a representativefrom the State Ministries of Finance, and Rural and Community Developmentand two farmers, initially appointed by KASCO but eventually to be electedby the shareowning farmers, the Chief Registrar of Cooperatives, KNAPMUProgram Manager KNADP, and the Managing Director of KASCO.
7.16 The Company's organization, with its four main divisions, isshown in Chart 21828. Commercial Operations would be responsible for inputprocurement and supply, input distribution and sales, and produce marketing.Finance would provide central accounting support services, including basicdata collection for the Monitoring and Evaluation Section. Administrationwould handle company assets, personnel, training and security. InternalAudit would be under the operational control of the Managing Director butreport directly to the Board. Its training activities would be handled bythe Program Management Unit-s Training Division (para 7.08) and by short-the Program Management Unit's Training Division (para 7.08) and by short-term consultants for special tasks. Field operations would be managed on azonal basis and be conducted through FSCs. All FSCs would be staffed byKASCO, except where a well-functioning cooperative society, with acceptablestaff, would be authorized to run the FSC commercial services only. In suchcases, responsibility for the audit of the society's affairs would remainwith the Chief Registrar of Cooperatives, KASCO being responsible only forsupervision with regard to inputs sales.
7.17 Equity and Assets. In addition to the N3.0 million that KNSGwould provide KASCO prior to effectiveness, KASCO would take over upon itsformation the existing storage facilities at Dakarta Depot and the existingfertilizer stocks, at a valuation determined by an inventory, in exchangefor shares. Furthermore, the project would provide during the five-yearproject period additional investments (mainly for staff houses, offices, andvehicles) which would be registered in KASCO's books. The projected balancesheets, profit and loss accounts, and cash flow are given in Annex 2, Tables9-11 and in Working Paper C3.
7.18 Staffing and Training. As KASCO would have to build up a largeand efficient organization in a short period, additional personnel wouldbe trained to ensure that there would be adequate staff to operate allFSCs. The Managing Director, Financial Controller and Commercial Managerwould be recruited internationally but all other posts would be locallyfilled either by secondment from KNSG, particularly the Produce Branch, orby direct employment. KNAPMU zonal mobile training units (MTU) would carryout commercial training of KASCO field staff, and the KNAPMU Chief TrainingOfficer would assist in locating suitable external training courses wherenecessary.
7.19 Farm Service Center (FSC). There are now only 10 FSCs in KanoState where farm inputs are sold, affording inadequate farmer access tofertilizers, seeds and other needs. During the project, 128 additional

- 43 -
FSCs would be constructed, providing additional storage capacity of about70,000 tons to supplement the existing 60,000 tons. All FSCs would belongto the project, and would be leased to KASCO at a rent equivalent to 4% ofcapital costs, which would be adequate to cover maintenance and administra-tive costs. Table 4 of Working Paper C3 shows estimated zonal storagerequirements.
7.20 Sales and Credit. Fertilizers would be sold at offical subsidizedprices, while chemicals and implements would be sold at a cost plus a 25%markup. All inputs distributed by KASCO and the FSCs will be sold for cashpayments, but occasionally to stimulate development in new areas wherecooperative facilities are not available, KASCO would be permitted to sellinputs to individual farmers on a seasonal credit basis. KASCO would bepermitted to sell agricultural implements and equipment on medium-termcredit, at the same terms as the cooperatives, currently 12% p.a. Coopera-tive members needing short-term credit for inputs could also continue toapply to their cooperative societies. The technical assistance provided bythe Chief Marketing Officer would help the cooperative unions and the ChiefRegistrar assemble and process loan applicatiorns and improve recoveryperformance.
D. Post-Project Development
7.21 During the project, Kano State Government staff would be in-creased and trained to deliver a wide range of agricultural services andsupport to the rural population, all under the coordination of KNAPMU. Atthe end of the project, KNAPMU's. operating divisions, technically strongerand accustomed to operating in a coordinated way, would be returned to theMinistries from which they had been transferred for project execution. TheProgram Manager and his evaluation staff would continue as a coordinatingoffice, to be responsible to the Governor, 1/ and would plan and monitor theState Government-s rural development activities assigned to the executingministries. The Staff Development and Training Unit of the project, returnedto the Ministry of Agriculture, would continue to train new staff and offerrefresher courses and upgrading, since the professional needs of the state sagricultural sector would only be partially filled during the project.Beginning at the Implementation Review in Year 3, the Bank and KNSG woulddiscuss training and any reorganizational or management changes needed toreintegrate the project activities into the Ministries at the end of theproject. At the Year 4 Implementation Review, or not later than December 31,1984, KNSG would submit to the Bank detailed proposals for post-projectorganization (including training of additional staff and managers), finance(including, but not limited to, continuation of farm support services,provision of inputs, expansion of road and water supply infrastructure, andfunding of LG maintenance responsibilities) and maintenance of projectfacilities. The project provides consultancy funds, if necessary, to assistKNSG and KNAPMU in formulating such proposals (para. 4.25).
1/ This relationship would be similar to that of the Director of theBudget.

- 44 -
7.22 In 1985 prices, the estimated annual cost of operating and main-taining project facilities to continue to serve the State-s rural populationwould total about N28.3 million, excluding fertilizers. The estimatedannual cost of international procurement of 240,000 tons of fertilizers,transport to Kano, and handling and distribution within the state would bean estimated N93 million. The annual post-project cost to local govern-ments for maintenance of the 1,000 new rural water supplies to be providedamounts to N200,000.
7.23 The Kano Agricultural Supply Company (KASCO) would continue toprocure and distribute fertilizer and other inputs. While the State Govern-ment now intends to retain ownership of the company indefinitely, KASCO½sarticles of agreement, structure, and commercial practices would make itpossible for its shares to be sold to farmers or to the Kano State Coopera-tive Federation at some future time.
VIII. FINANCIAL ANALYSIS
A. Financial Implications for Farmers
8.01 The two farm models constructed to represent dryland cultivationare largely hypothetical, reflecting not only crop combinations but also theextent to which a farm family adopts improved or advanced practices on any orall of its holdings. One model reflects a 2.7 ha farm in the wetter drylandareas of the (southern) Zones 1 and 3. The rainy season averages over 120days and main crops are sorghum, cowpeas, and millet. It is possible tocultivate maize and cotton. The second model depicts a 3 ha farm in thedrier (northern) Zones 2 and 4 where the 600 to 800 mm of rain falls duringa shorter and less reliable rainy season, averaging 110 days, beginning notbefore early June. Under traditional practices, millet, either as a solocrop or with cowpeas or sorghum, is the main crop. In practice, a farmer-sdecision to adopt new cultivation practices requiring increased fertilizerapplication and more, hired labor would be influenced by several factors.The existing highly subsidized fertilizer prices considerably reduce financialrisk to the farmer. But even with subsidies, the attractiveness of the basicservice package would depend not only on a reliable and timely supply ofinputs, but also on the adequacy of extension services and marketing opportun-ities, which the project is to improve.
8.02 Detailed farm budgets are presented in Annex 4, Tables 2 and 3, andsummarized below:
Table 5: Summary of Farm Budgets(Unsubsidized Prices)
N
Zones l and 3 - 2.7 ha Farm Zones 2 and 4 - 3.0 ha FarmW/OP W/P W/P W/OP W/P
Traditional Improved Advanced Traditional Improved
Family Farm Income 570 1,140 1,179 315 918Income Per Capita 75 150 155 41 121Income per labor-day 2.10 2.81 2.99 1.13 2.24
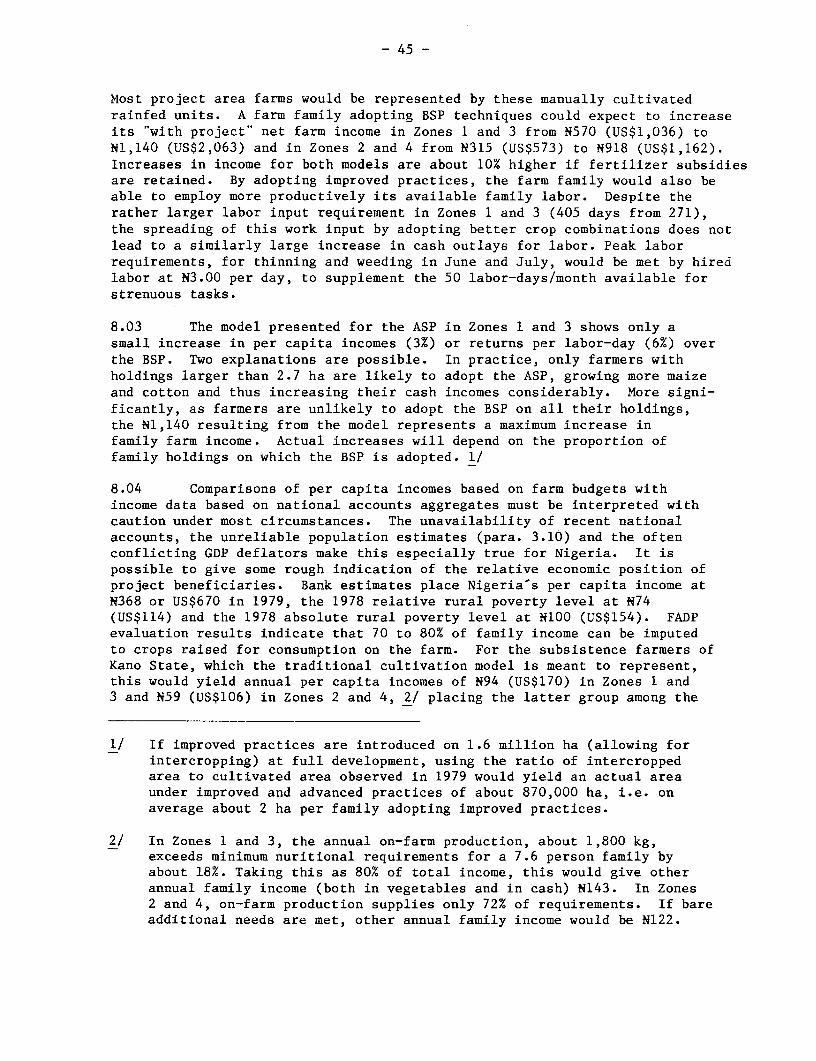
- 45 -
Most project area farms would be represented by these manually cultivatedrainfed units. A farm family adopting BSP techniques could expect to increaseits "with project" net farm income in Zones 1 and 3 from N570 (US$1,036) toN1,140 (US$2,063) and in Zones 2 and 4 from N315 (US$573) to N918 (US$1,162).Increases in income for both models are about 10% higher if fertilizer subsidiesare retained. By adopting improved practices, the farm family would also beable to employ more productively its available family labor. Despite therather larger labor input requirement in Zones 1 and 3 (405 days from 271),the spreading of this work input by adopting better crop combinations does notlead to a similarly large increase in cash outlays for labor. Peak laborrequirements, for thinning and weeding in June and July, would be met by hiredlabor at N3.00 per day, to supplement the 50 labor-days/month available forstrenuous tasks.
8.03 The model presented for the ASP in Zones 1 and 3 shows only asmall increase in per capita incomes (3%) or returns per labor-day (6%) overthe BSP. Two explanations are possible. In practice, only farmers withholdings larger than 2.7 ha are likely to adopt the ASP, growing more maizeand cotton and thus increasing their cash incomes considerably. More signi-ficantly, as farmers are unlikely to adopt the BSP on all their holdings,the N1,140 resulting from the model represents a maximum increase infamily farm income. Actual increases will depend on the proportion offamily holdings on which the BSP is adopted. 1/
8.04 Comparisons of per capita incomes based on farm budgets withincome data based on national accounts aggregates must be interpreted withcaution under most circumstances. The unavailability of recent nationalaccounts, the unreliable population estimates (para. 3.10) and the oftenconflicting GDP deflators make this especially true for Nigeria. It ispossible to give some rough indication of the relative economic position ofproject beneficiaries. Bank estimates place Nigeria's per capita income atN368 or US$670 in 1979, the 1978 relative rural poverty level at N74(US$114) and the 1978 absolute rural poverty level at N100 (US$154). FADPevaluation results indicate that 70 to 80% of family income can be imputedto crops raised for consumption on the farm. For the subsistence farmers ofKano State, which the traditional cultivation model is meant to represent,this would yield annual per capita incomes of N94 (US$170) in Zones 1 and3 and N59 (US$106) in Zones 2 and 4, 2/ placing the latter group among the
1/ If improved practices are introduced on 1.6 million ha (allowing forintercropping) at full development, using the ratio of intercroppedarea to cultivated area observed in 1979 would yield an actual areaunder improved and advanced practices of about 870,000 ha, i.e. onaverage about 2 ha per family adopting improved practices.
2/ In Zones 1 and 3, the annual on-farm production, about 1,800 kg,exceeds minimum nuritional requirements for a 7.6 person family byabout 18%. Taking this as 80% of total income, this would give otherannual family income (both in vegetables and in cash) N143. In Zones2 and 4, on-farm production supplies only 72% of requirements. If bareadditional needs are met, other annual family income would be N122.

- 46 -
relatively poor. Under improved practices, and assuming no drop in otherincome, per capita incomes could increase substantially to N169 (US$306)in Zones 1 and 3 and N138 (US$250) in Zones 2 and 4, great improvementsabove subsistence level but still much less than the national average.These comparisons show that the project would greatly increase the income ofpoorer farmers in the project area and help narrow the income gap betweenrural and urban areas of Kano State.
8.05 As fadama lands are in most cases part of a farming unit con-taining rainfed uplands, and as it was not possible to arrive at a mixedcropping model, no farm budget has been prepared for the fadama component.With the high prices prevailing for vegetables and other irrigated crops andthe reduction in risk due to the use of irrigation, this component should befinancially attractive to project area farmers. Per hectare crop returns,allowing for full cost recovery on land levelling and equipment, havebeen calculated for sorghum, rice, tomatoes and wheat, under fadama intensi-fication, flood irrigation, and pump irrigation programs. Without subsidyfigures are shown below, and more details appear in Annex 4, Table 4.
Table 6: Per Hectare Crop Returns - Fadama Cultivation(Unsubsidized Costs)
NNet
Return per ha Return per labor-day
W/OP 1/ W/P W/OP 1/ W/P
Sorghum 148 151 2.96 3.02Rice 244 501 1.87 2.98Tomato 3,060 4,680 3.81 8.10Wheat 315 345 1.37 3.00
1/ From the preparation report, Annex 3.
B. Financial Implications to Governments
8.06 The project would not directly increase Government revenues,as farmers' output is not taxed and the Cotton, Groundnuts and GrainsMarketing Boards are not revenue producers for FGN at present price levels.Some indirect public revenue generation could be expected, however, asproject beneficiaries would spend part of their increased incomes on con-sumer goods and services offered by the private sector, some of which carrya tax element, mostly in the form of import duties. As such, the increasedtax revenue would accrue to FGN for the most part, rather than KNSG.Precise quantification of such increased tax revenue is not possible, but anupper limit may be suggested. If 50% of benefits enter the cash economy,and are spent on goods carrying an average tax rate of 15%, then (in con-stant base terms) the additional public revenue would be in the region of

- 47 -
N11.4 million per annum at full development. In practice, it is expectedthat a higher proportion of benefits would be taken in the form of non-taxedlocal produce. Small amounts of additional revenue might be generated atthe State or Local Government level through increased payments of marketfees, etc.
8.07 The financial costs to the Kano State Government during the projectperiod total about N193 million (US$350.9 million) and are summarized inAnnex 2, Table 4. The State's share of project costs, in current priceterms, would be about N70 million over the five-year period, excludinginput subsidies, but including N3.0 million equity contribution to KASCOand NO.5 million equity contribution to cooperatives. The State-s expen-diture on existing project-related activities, which will be transferred toKNAPMU, amount to N17.9 million in current terms over the five-year period.The State share of the cost of farm inputs, under current subsidy arrangementswould total N105.1 million (current prices). Total State expenditure incurrent price terms would rise from N24.1 million in PYI to N60.2 millionin PY5, averaging N38.6 million per annum. In addition, the State would beobliged to prefinance expenditures eligible for IBRD reimbursement in theearly stages of project implementation. The precise amounts involved woulddepend on the speed and efficiency with which disbursement applications weresubmitted and much of this prefinancing could be taken care of through theproject's overdraft facility.
8.08 The Bank has reviewed the future budgetary resources of KanoState. The results indicate that, exclusive of fertilizer subsidies, thetotal State expenditures for the agricultural sector, including this project,would be less than 10% of the State's expected revenues over the projectperiod. Continuing the present input subsidy policy would add an additional5%. At negotiations, KNSG confirmed the prime importance attached to agri-cultural development, and its intention to raise the share of agriculturein State budgets from about 5% to 10%. In the post-project period (1985prices) total State annual expenditures to continue activities begun underthe project would amount to about N28.3 million, (para 7.22) excludingfertilizer subsidies.
8.09 Direct FGN input would amount to N170.5 million (current prices)or on average N34.1 million annually, assuming the continuation of existingpolicies. Fertilizer subsidies represent N122.5 million. In 1985 prices,federal fertilizer subsidies in the post-project period would be aboutN44.1 million a year. Details of financial implications to FGN and KNSG areshown in Annex 2, Tables 3 and 4.
8.10 Cost of servicing the IBRD loan would depend on the lending ratecurrent at the time of approval. Assuming 9.6% interest, and 20-year term(with 5 years grace), initially commitment fees would run US$1.1 millionper annum, but interest would build up to a maximum of about US$13.6 million.Thus, with principal repayments at US$9.5 million per annum, peak total debtservice would approach US$23.1 million in Year 6.

- 48 -
C. Cost Recovery
8.11 KASCO would recover all costs for procurement and distribution ofseeds, chemicals, sprayers and agricultural implements through adequate mark-ups. KASCO's cost recovery practices would be reviewed annually by KNSG andthe Bank in light of KASCO's annual report, audited accounts, and operationsprogram, to ensure that costs are fully recovered. Calculations of the mark-ups that would be required are shown in Working Paper C6. The project wouldprovide technical advice, including basic surveying, to farmers without charge.But actual land development costs, including land levelling and field bunding,would be paid by benefitting farmers, if necessary by loans arranged throughtheir cooperative unions. Water-lifting equipment and simple storage facili-ties would be sold by KASCO and the project at a full cost basis. Consultancyprovisions under the proposed Kaduna State ADP (Report No. 2718-UNI) and underthe general studies consultancies of this project (para 4.25) would examinethe possibility of developing a viable LG tax system, which could recoverinfrastructural costs and help place the maintenance of rural roads and watersupply on a sound financial basis.
IX. ECONOMIC ANALYSIS
A. Project Benefits
9.01 The project's two main benefits are closely related. Improvingthe management and staffing, and hence the effectiveness of the Ministry ofAgriculture and Natural Resources, the Ministry of Rural and CommunityDevelopment and cooperative institutions, and the establishment of the newKASCO, would enable a large number of Kano State's 614,000 farm families toraise their productivity and incomes. The effects of project packages onfarm incomes are quantified in Chapter VIII. In addition, increased projectarea food production would assist in reducing Nigeria's 1985 projected fooddeficit.
9.02 As one of the first of a proposed series of Bank-assisted state-wide agricultural development projects, the project will attempt to intro-duce, on a larger scale, many of the successful management and organizationaltechniques adopted in the limited area ADPs already in progress. This strategyhas been adopted by the Government in its efforts to meet Nigeria's projectedfood deficit and channel more resources, more efficiently, to the rural sector.The project cannot be regarded as experimental - its agronomic features aretried, the four zonal units are each not much larger than ongoing ADPs, andthe project organization integrates and strengthens mostly existing institu-tions. The project cost, while meeting state and federal intentions to in-crease the share of revenues directed to agricultural development, is regardedas realistic within the overall fiscal resources likely to be available to theState (para 8.08). Staff development and training figure prominently inproject design, not only for agricultural staff, but also for staff in thecooperative and rural infrastructure sectors.

- 49 -
9.03 There are an estimated 614,000 farm families in the project area,and assuming (on experience from existing ADPs) that 60 to 70% of farmersadopt some of the project recommendations, then some 430,000 families (3.2million individuals) will benefit directly from the project-s agriculturalcomponents. Others will benefit from infrastructure components (rural roadsand water supplies, para 9.04). The project is not designed primarily toincrease the number of persons employed in agriculture, and the technologi-cal packages should be able to be introduced within the present laborsupply. The economic analysis assumes an increased hired labor input of some7 million labor days per annum at full development. In view of the presenthighly uneven seasonal pattern of labor utilization, emphasis will be placedon eliminating bottlenecks by improved field practices, such as timelyweeding and better tools, and raising the productivity of off-season familylabor, for example, by improved storage. The adaptive research program,introduction of simple improved implements, fadama upgrading ,and the watersupply program are all among project components which would help realizethis aim.
9.04 Formal analysis of the rate of return on the rural water supplyprogram would not be meaningful because of the practical impossibility ofquantifying and internalizing the various benefits into a single indicatorlike the net present value. Many of the benefits will be qualitative, dueto an improvement in the safety and reliability of water supply. Additionallabor will be released for other productive tasks. The subcomponent wasthus designed on a cost-minimization basis, as the lowest cost means ofbringing safe year-round water supplies to a substantial number of ruralpeople in a reasonable time. However, in view of non-quantifiability ofbenefits the subcomponent is excluded from the calculation of the project'srate of return. No additional benefits from vehicle operating cost savingshave been imputed to the feeder roads subcomponent, as poor communicationsmay otherwise impede participation in the project altogether.
B. Economic Rate of Return
9.05 The project-s economic rate of return (ERR) is about 36%, and itsnet present value (NPV) discounted at 11%, the estimated opportunity cost ofcapital in Nigeria, is about N228.6 million.
9.06 The ERR was calculated on the basis of incremental costs andincremental output. Project life was assumed to be 25 years, includinga five-year investment period during which statewide development activitieswould be substantially completed. For the calculation of project costs,farm inputs were costed at full, unsubsidized economic cost. Additionalon-farm labor was costed at Nl.50 per day in border naira, representingthe average daily productivity in unimproved agriculture when all outputsare valued in economic (border naira) terms 1/. Other local costs were
1/ Hired labor requirements under improved practices in Zones 2 and 4are slightly less than in traditional cultivation. In Zones 1 and3, about 7 million man-days per year at full development, with aborder economic value of N10.6 million, have been included inproject costs.

50 -
converted to border naira using a standard conversion factor (SCF) of0.83 (supply). This adjustment allows for distortions to local costsresulting from import duties, quotas etc. Local costs used base periodprices, on the grounds that continued disparity between domestic inflationwill, at some stage, result in either an exchange rate adjustment, orincreased trade restrictions (hence a fall in the SCF), while a delay insuch adjustment would represent a political choice to apply oil "rent" toconsumption. A portion of project costs consists either of long-terminstitution building, not directly related to the agricultural productivitybenefits attributed to the project, or of rural infrastructure (para 9.04)for which quantification of benefits is problematic. 1/ Working Paper Cllgives details of the adjustments made to project costs to allow for theseelements. Project benefits comprise the value of incremental crop produc-tion, priced at border farmgate prices derived from import parity forinternationally traded goods and their immediate substitutes, and fromdomestic retail prices, adjusted by the SCF (demand), 0.69, for non-tradedoutputs. To calculate the naira border value, import parity prices werecalculated, based on IBRD forecasts for 1981-1990, in constant 1981 dollars,converted at the official exchange rate.
C. Sensitivity and Risk Analysis
9.07 The sensitivity of the ERR to changes in cost or benefit streamswas tested, and the percentage change in a stream or streams that wouldreduce the ERR to its minimum acceptable value of 11%, (or equivalently reducethe NPV at 11% to zero) were calculated. Costs would have to rise by 44%, orbenefits fall by 30%, to yield a minimum acceptable ERR of 11%, or an NPV ofzero. The daily shadow wage could rise from N1.50 to about N5 beforethe NPV fell to zero. Benefits from the production of grain crops, about60% of total project benefits, would have to fall by 50%. An increase infertilizer prices of 25% would leave the ERR at about 25% and the NPV aboutN130 million. Adoption rates would have to fall by 63% to 26% to reducethe NPV to zero. A delay of one year in benefits alone (with no delay incosts) would reduce the NPV to N146.6 million (about 36%), and even adelay of three years still would leave the NPV positive.
9.08 Although the sensitivity analysis indicates that the projectcould tolerate a certain amount of latitude in actual values from thoseprojected, it is important that major divergences in costs, yields or timingbe avoided. 2/ Sound initial management, regular and timely financing, andefficient and dependable procurement and distribution of farm inputs will be
1/ Costs for rural water supply were excluded. Costs of studies andproject activities relating to cooperatives, marketing and evaluationwere reduced by 50% to account for their mainly long-term impact.
2/ Divergencies in economic prices are regarded as outside project control.
- 51 -
crucial to success. Failure in any of these areas could have very seriousimplications, and safeguards in each area are listed in Chapter X. Theproject's BSP and ASP are fairly simple and well tested both at researchstation and farm level and refinements to improve the mixed cropping recom-mendations should result from the project-s applied research component.
9.09 As the financial viability of various crop enterprises woulddepend upon Government policies affecting producer prices, e.g. internationaltrade policy towards farm produce and the activities of marketing boards,the Bank will need to maintain a continuing dialogue with FGN over suchnational policy issues. This dialogue has made an excellent start withclose Bank involvement in assisting FGN to draw up a National Food Plan.The Bank is also assisting FGN improve the operations of the National GrainsBoard (para 3.24) and streamline fertilizer procurement (para 2.12). Thedrilling program for rural water supply would run the risk that actual costsmight exceed estimates (unit contract costs for much smaller drilling programsin the area are substantially above project unit costs). The appraisal costsare based on an efficient, large-scale force account operation, with addi-tional allowances for physical contingencies and firm overheads.
X. AGREEMENTS REACHED AND RECOMMENDATION
10.01 During negotiations for the proposed loan, the following majorissues were discussed and agreements reached with FGN and KNSG and specifiedas conditions in the Loan and Project Agreements:
Financial Conditions
(a) FGN and KNSG would each provide its share of project costs to theproject quarterly and in advance, these sums to be paid into theKNAPMU-s bank account (para 4.31);
(b) in the event that KNSG were delinquent in paying its quarterlyshare of project costs into the project account, FGN would beauthorized to pay KNSG's contribution directly from the State'sstatutory allocation (paras 4.31 and 4.36);
(c) Bank disbursements would be made directly to the KNAPMU bank account(para 4.31);
(d) KNSG would review annually and agree with the Bank KASCO's costrecovery policies and practices, to ensure that they enable thecost of any input or service to be fully recovered (para 8.11);
(e) KNSG would contribute to the working capital of cooperative unionsand primary societies to assist them in their marketing activities,amounting to about N500,000 (para 6.03).

- 52 -
Project Administration Conditions
(f) fertilizer procurement and distribution procedures satisfactory tothe Bank would be established (para 4.28);
(g) KNSG would review annually with KNAPMU and the LGs arrangementsfor the maintenance of roads and water supply facilities, andfor staff training, providing as necessary the funds requiredfor these purposes (para 4.36);
(h) procurement (para 4.32), audit (para 4.34), budgeting (para 4.35),and reporting (para 4.36) requirements would be satisfactory to theBank;
(i) consultants (para 4.25) and internationally-recruited staff(listed in para 7.10) with qualifications and experience accept-able to the Bank, would be appointed on satisfactory terms andconditions, and according to agreed recruitment procedures (para7.11);
(j) not later than December 31, 1984, KNSG would make recommendationsfor the future of project activities and the post-projectorganization (para 7.21);
Conditions of Loan Effectiveness
(k) a subsidiary loan agreement between FGN and KNSG, acceptableto the Bank, had been signed (para 4.31);
(1) FGN and KNSG had each made its initial contribution of N3.0million to the KNAPMU bank account (para 4.31);
(m) overdraft facilities for KNAPMU, equivalent to N5 million,had been arranged in a commercial bank and guaranteed by KNSG(para 4.31);
(n) the Action Plan for 1981 acceptable to the Bank had been drawnup (para 4.36);
(o) KNSG had established KNAPMU and KNARDEC (paras 7.02, 7.06);
(p) the KNAPMU Program Manager, Financial Controller, Chief Engineer,four zonal managers, four zonal chief accountants, and KASCO.sManaging Director, Commercial Manager and Financial Controller hadbeen appointed (paras 7.11 and 7.12);
u) KNSG had established KASCO and made an initial equity paymentof N3.0 million (paras 7.12, 7.17);
10.02 On the basis of these agreements and conditions, the project issuitable for a Bank loan of US$142.0 million to the Federal Republic ofNigeria.

-53-
Table
fMl3 R=a MATLJL DVPWPMENT PsIICT
rFtosirEed Qnr e Crp macadotiona - All Zones
Seed SPacIngoRe- rvoe Fritoah/s YIeld
Crop Cocos TZ sdinin ' Varieties Crop Miotoras Plants cm cSP CAN Crop Proteonlon ka/ha
Serghee I & 3 Traditional Traditional anons multi -rops 9 Wide -siable Nil Nil Nil Nil 550
Improved Traditional Millet 12 90e60n2 or 100 5S Sled dro-eivg .03 kg 850YC 5760 (No-th) 9rocodnot Slo3Dol or 1i0 50 a-to l p kg acod
SE 5912 (Sooth) Coaree
Advanced Kono BL Croondnut 12 90o30x2 150 100 Seed dreo-in .003 kg 1,20OYG 5760 Cropo- cotor-al per kg oeod
SI 59 12 boerore Solsooth
2 A 4 Tr-ditlonl Tr-dilov-al Wi-h eillot V avrioblo Nil Nil Nil Nil 41).'
Ieproved TG 5760 With logono or tillo 172 90xCxC2 100 Sead dreliD,G 0-03 kg 601
cor lpo- kg cod
Milltt t & 3 T-aditiovol Tr-dititovl V-o1t.. 8 Wide-gi-i Nil Nil Ntl Nil 350Ft Borne tige-nia (astly Iniclud-e -artebhetemepocino sorgicel
lIpreved E. 8rte- Nigortat ROlap roopped vith 8 90o60n2 75 SC Seed dr-esiog .003 kg 600
Cocposite leg-ces sndlv- -otton 00 75 50 cat-ric1 p-r kg seed
2 & 4 Tradititocl Tr-ditioeel Et B-oro -ropprd _ith Segono 8 Veriabl Nil Nil Nil Nil 250Nigerian Coopocino
liprored E. Bor-o Nigerian Crorppd with ononees 8 9CS60x2 100 Seed drooing .003 kg 450Composite or groc-dneta ca-erlol par kg coed
Holzn I 6 3 Tr-ditio-ol Lovol hite Var-oce -Ili orope 1I V-irble N1il Nil Nil Nil 450
Inprov-d TOO With legnvS or coreor T0 90C60okrl 150 t 0 Sieed dro-sing 1,200or too 100
Advoend TZt Sole 20 90h45o 2 250 250 Seed dre,ing .003r kg 2 000or 250 050 odteria i 0 kg orod
Cropec I 6 3 T-oditinl Ftrin Vario-e mlti crop. lT Ve-y tide Nil Nil Nil Nil 120
Forty Wake -cohohir 11,ynthettc pyrotkrnidc
Inprovad 176l , 341 1W) Uoder - rre l- 15 90v30I2 Nil 5i Nil 2 WLV Sp-cyioo 11 500 -ah-yl Ior ny ithe.335, 335 (B) Relar _ith villo- 2 kg/ho I" I kh/hr hit.b I---. i.1
2 & 4 TraditiovoI Loval Mainly _ith nillelt IC Varible Nil Nil Nil Nil 105Fari. Wale
Inproved 176B, 341 (W) Under nillot 15 90x30x2 Nil Nil Nil 2 ULV Sprayia 300335, 335 (B) 2 kg/he 3 1 khhe h '
Gr?undavt I & 3 T-aditcssa. 561 Ver-ios olvi crops 30 Wild-gii Nil Nil Nil Nil 350
Inpr-erd M 95.71 Mtllot/groovdaore 40 90t22x2 Nil 155 Nil ol LV S900yi,g I0
M103.74 1 _hg/h I kglhM599.74
2 & 4 Traditlonel S 6I Wfth gosit 305 Variable Nil Ni: Nil Nhl 200
Improved M 95.71 With ill- or 40 90.o222 Nil 150 Nil I dLV Spr-yig 1 450M103.4 sorh_ I kg/ kg,h
M599.74
Cntton 1 6 3 Traditional ham 71 Lon p-a - odoly 10 Nh rd 0il NiT Nil S-ed aIready droco-d 190
Itpr-e-d SFe 71 Rklo> -opynd 5" 90k6352 ICO 150 2 UtV St-yigS.3 I kgh1 350
wtih nillrt/co-pe- or 150 100 2 kla/h. t dre-ced need
Advev-od Sac 71 Roloy -ro-ped Millet 20 9045o 2 l50 i00 4 UtV Sptapi EsoIc or 150 1OD 4 kg/ia t droseod seed 60 600
4 Tradltnal San 71 tte plan-od w,dely 10 haohacan-d Nil Nil Nl Se-d al-dy dr oe. 107
Jone 4, 1980
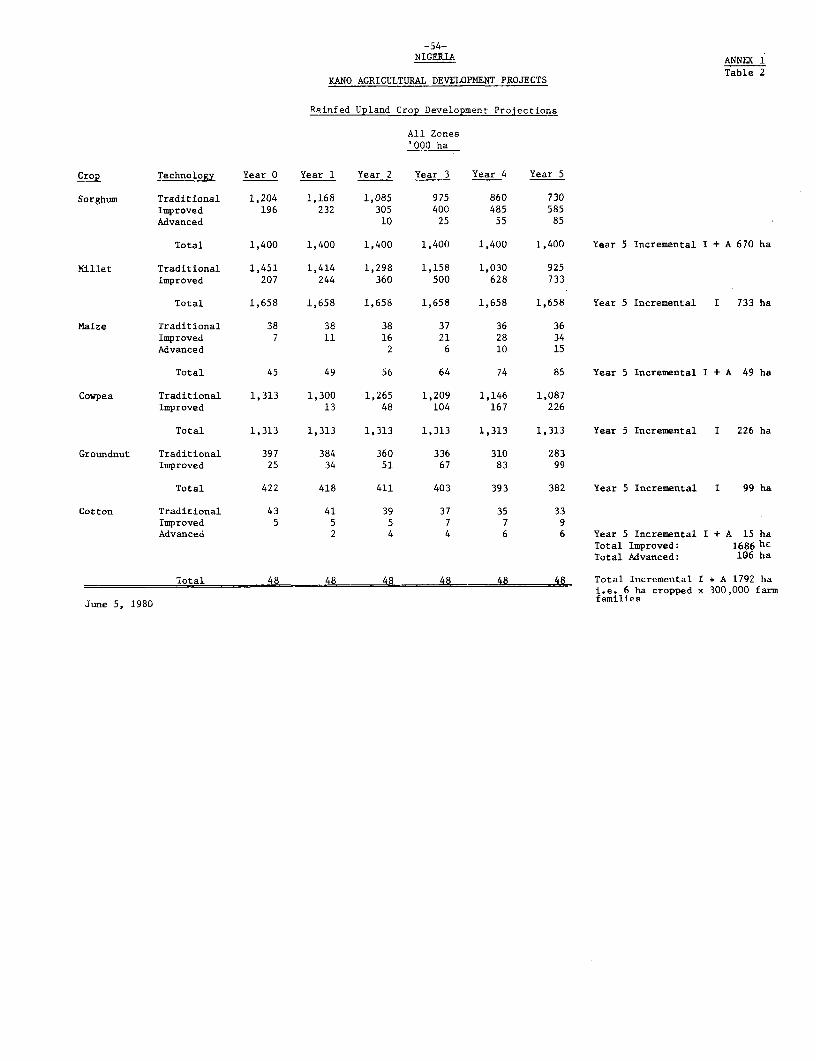
-54-NIGEPtIA ANNEX I
Table 2KANO AGRICULTURAL DEVELOPMENT PROJECTS
Rainfed Upland Crop Development Projections
All Zones
'000 ha
Crop Technology Year 0 Year 1 Year 2 Year 3 Year 4 Year 5
Sorghum Traditional 1,204 1,168 1,085 975 860 730Improved 196 232 305 400 485 585Advanced 10 25 55 85
Total 1,400 1,400 1,400 1,400 1,400 1,400 Year 5 Incremental I + A 670 ha
Millet Traditional 1,451 1,414 1,298 1,158 1,030 925Improved 207 244 360 500 628 733
Total 1,658 1,658 1,658 1,658 1,658 1,658 Year 5 Incremental I 733 ha
Maize Traditional 38 38 38 37 36 36Improved 7 11 16 21 28 34Advanced 2 6 10 15
Total 45 49 56 64 74 85 Year 5 Incremental I + A 49 ha
Cowpea Traditional 1,313 1,300 1,265 1,209 1,146 1,087Improved 13 48 104 167 226
Total 1,313 1,313 1,313 1,313 1,313 1,313 Year 5 Incremental I 226 ha
Groundnut Traditional 397 384 360 336 310 283Improved 25 34 51 67 83 99
Total 422 418 411 403 393 382 Year 5 Incremental I 99 ha
Cotton Traditional 43 41 39 37 35 33Improved 5 5 5 7 7 9Advanced 2 4 4 6 6 Year 5 Incremental I + A 15 ha
Total Improved: 1686 h'Total Advanced: 106 ha
Total 48 48 48 48 48 48 Total Incremental I + A 1792 hai.e. 6 ha cropped x 300,000 farm
June 5, 1980 families

ANNEX 1-55 - Table 3
NIGERIA
KANO AGRICULTURAL DEVELOPMENT PROJECT
Rainfed Crop Development Projections - Production('000 t)
% IncreaseYear 0 Year 1 Year 2 Year 3 Year 4 Year 5 over Year 5
Crops
Sorghum 784.15 794.55 821.15 859.04 902.09 950.09 21Incremental 10.40 37.00 75.25 118.75 166.75
Millet 540.05 548.05 572.75 603.07 631.45 653.65 21Incremental 8.00 32.07 63.65 91.04 113.06
Maize 24.10 28.10 37.10 49.65 64.20 80.20 232Incremental 4.00 13.00 25.55 40.01 56.01
Cowpeas 149.22 155.62 172.88 202.32 235.82 266.24 78Incremental 6.04 23.66 53.01 86.06 117.02
Groundnuts 143.20 145.65 149.80 153.20 155.95 158.60 10Incremental 2.45 6.06 10.00 12.75 15.40
Cotton 9.35 10.17 10.99 11.31 12.13 12.45 33Incremental 0.82 1.64 1.96 2.78 3.01
July 1980

- 56 -
NIGERIA ANNEX 1Table 4
KANO AGRICULTURAL DEVELOPMENT PROJECT
Fadama Crop Recommendations
SeedFertilizer Rate Y1P.1ge
Crop ki/ha kg/ha Crop Protection Y5 Y4 Y3 Y2 Yl
Onions Compound: 300 1 3 - 4 Sprayings 24,000 22,000 18,000 14,000 12,000CAN 200 N 20/ha synthetic pyre-
throids, carbaryl or anyother suitable insecti-cide
Tomatoes Compound: 300 4 3 - 4 Sprayings 25,000 22,000 19,000 17,000 15,000CAN : 250 N 20/ha synthetic proe-
throids, or carbarylwith fungicide
Other Vegetables Compound: 250 3 3 _4 Sprayings 20,000 18,000 16,000 14,000 12,000CAN : 100 N 20/ha synthetic pyre-
throids or carbarylwith fungicide
Rice Compound: 200 45 2,500 2,000 1,600 1,200 1,000CAN : 150
Wheat Compound: 200 1O0 2,000 2,000 1,900 1,700 1,500
Sorghum Compound: 200 12 1,500 1,200 900 700 500CAN : 100
Maize Compound: 250 20 2,000 1,600 1,300 1,000 700CAN : 250

- 57 -
ANNEX 1Table 5
NIGERIA
KANO AGRICULTURAL DEVELOPMENT PROJECT
Fadama Crop Development Projections Cumulative Area (ha)
CROPSYear 1 Year 2 Year 3 Year 4 Year 5
Dry SeasonGardens 480 1,780 3,330 5,130 6,830
Wet SeasonGardens 600 2,450 4,300 6,150 5,900
FringeLands 1,250 4,500 7,750 11,250 14,750
Total Cropped Area 2,330 8,730 15,380 22,530 27,480
July 1980

NIGERIA
KANO AGRICULTURAL DEVELOPMENT PROJECT
Fadama Crop Development Projections - Production
Year I Year 2 Year 3 Year 4 Year 5 Pre-Pro'ectArea Production Area Production Area Production Area Production Area Production Production Incremental
Crops T (t (h.) (tons) (ha) t (h (ton (ha) ton) (tons) Yr.5-Yr.O %
Onions 200 2,400 700 9,800 1,450 26,100 2,300 50,600 3,150 75,600 210,000 35.7%.Tomatoes 100 1,500 450 7,650 800 15,200 1,200 26,400 1,600 40,000 105,000 38.0'.Other Vegetables 100 1,200 400 5,600 700 11,200 1,100 19,800 1,400 28,000 42.000 66.6%Rice 420 420 1,690 2,028 2,960 4,736 4,230 8,460 5,900 14,750 35,000 42.1%Wheat 80 120 230 391 380 722 530 1,060 680 1,360 5,250 25.9%Sorghum 900 450 3,000 2,100 1,620 4,590 7,400 8,880 9,700 14,550 - _Maize 350 245 1,500 1,500 2,650 3,445 3,850 6,160 5,050 10,100 _
Ju0nJune 9, 1980

- 59 -ANNEX 1
NIGERIA Table 7
KANO AGRICULTURAL DEVELOPMENT PROJECT
Farm Lnput Reguirsemets
INPUTS UNITS PYO PYI PY2 t13 PY4 PY5
Fertilizers
Compound 000 Tons 25.8 44.20 63.90 88.99 129.56 157.56SSP " 11.4 5.80 9.55 14.10 19.10 23.85CAN " 9.7 14.75 22.07 32.68 44.32 54.36Total 46.9 64.76 95.52 135.77 192.99 235.77Incremental 17.86 48.62 88.87 146.09 188.87
Insecticides
Synthetic Pyrethroids Tons 78.0 165.0 305.0 455.0 590.0or Carbaryl
Seed dressing insecti-cide/fungicide "I 1.404 2.031 2.784 2.554 4.299
Seeds
Sorghum Tons 0.077 139.74 190.8 258 384.44 407.8Millet " 0.021 97.6 144. 200 251.2 293.2Cowpea ' 0.005 9.75 36. 78 125.25 169.5Maize 0.037 11.35 18. 29.6 41.85 54.Groundnut " 0.104 68. 103.5 134. 166. 192.Cotton 140. 180. 220. 260. 300.Tomatoes i 0.08 0.36 0.64 0.96 1.28Onions J 0.007 0.04 0.14 0.29 0.46 0.63Other vegetables 0.6 0.24 0.42 0.66 0.84Rice " -- 0.945 3.80 6.66 9.51 13.27Wheat ii 0.150 0.40 1.15 1.9 2.65 3.4

ANNEX 1
- 60- Table 8
NIGERIA
KANO AGRICULTURAL DEVELOPMENT PROJECT
Summary of Agriculture Staff Requirements
Year 0 Year 1 Year 2 Year 3 Year 4 Year 5
AO/AS
Senior Development Officers - 4 4 4 4 4Training Officers - 28 28 28 28 28Research Officers - 5 5 5 5 5Subject Matter Specialists - 8 8 8 8 8District AOs' - 19 19 19 19 19Plant Protection Officers - 4 4 4 4 4Irrigation Officers - 4 4 4 4 4
Total 571/ 72 72 72 72 72
AA
Extension 77 48 66 87 107 114Plant Protection 0 3 8 15 19 20Irrigation 0 0 8 15 18 20
Total 77 51 82 117 144 154
FO
Extension 196 376 536 696 856 927
1/ Includes 26 AO/AS graduates in 1980.
August 18, 1980JMiller:sg

-61-
ANNEX 1Table 9
NIGERIA
KANO AGRICULTURAL DEVELOPMENT PROJECT
Bank Lending for Agriculture in Nigeria
Loan Number Year Project Loan amount US$ mn.
764 1971 Western State Cocoa 7.21045 1974 Second Cocoa 20.01091 1975 Livestock 21.01092 1975 Funtua ADP 29.01099 1975 Gusau ADP 19.01103 1975 Rice 17.51164 1975 Gombe ADP 21.01183 1975 Mid-West Oil Palm 29.5
(Bendel State, Nucleus Estate/Smallholder)
1191 1976 East-Central Oil Palm 19.0(Imo State, Smallholder)
1192 1976 Western Oil Palm 17.0(Ondo State, Nucleus Estate/Smallholder)
1454 1977 Lafia ADP 27.01455 1977 Ayangba ADP 35.01591 1978 Rivers Oil Palm 30.0
(Nucleus Estate/Smallholder)1667 1979 Bida ADP 23.01668 1979 Ilorin ADP 27.01679 1979 Forestry 31.01719 1979 Agricultural and Rural Management
Institute 9.01838 1980 Oyo North ADP 28.51854 1980 Ekiti-Akoko ADP 32.5
443.2
NOTE: For location of existing and proposed projects see Map IBRD 15065.

AINEX 2Table 1
-62-
NIGERIA
KANO AGRICULTURAL DEVELOPMENT PROJECT
SUMMARY OF PROJECT COSTS
(NAIRA '000)
1 2 3 4 5 TOTALS
MANAGEMENT SERVICES 4892.26 1714.54 1764.36 2071.56 1789.16 12231.88STAFF TRAINING 5626.31 2058.81 2008.81 2709.11 1977.61 14380.65MONITORING & EVALUATION 1238.29 737.29 737.29 788.09 737.29 4238.25LAND USE PLANNING 388.82 208.52 238.52 249.02 20B.52 1293.40EXTENSION 11255.43 7513.11 6733.01 5720.79 5143.78 36366.12FADAMA IRRIGATION 799.24 379.64 496.33 645.83 409.63 2730.67SEED MULTIPLICATION 693.06 358.06 358.06 468.36 358.06 2235.60APPLIED RESEARCH 773.29 270.29 264.09 363.59 257.89 1929.15ENGINEERING SERVICES 2298.27 989.81 851.40 714.15 640.15 5493.76ROAD CONSTRUCTION 9025.16 4057.78 6943.11 4947.11 4593.91 29567.08MECHANICAL WORKSHOPS 5114.49 1464.71 1347.01 1138.01 1000.01 10064.21RURAL WATER SUPPLY 3210.23 2991.78 2166.68 2888.04 2036.54 13293.27COOPERATIVE DEVELOPMENT 266.00 454.50 673.50 747.50 609.50 2751.00MARKETING DEVELOPMENT 271.57 353.07 327.47 421.47 208.07 1581.65FARM SUPPLY COMPANY 5055.95 2425.53 2582.45 2730.25 2107.25 14901.43FERTILIZER-INCREMENTAL 6275.22 6804.96 9070.97 13637.62 10006.00 45794.77OTHER INPUTS 935.98 1012.26 1401.36 1511.55 1452.77 6313.92FORESTRY 513.42 783.00 98 .96 760.26 627.46 3665.10
SUBTOTAL 58632.99 34577.65 38945.37 42512.30 34163.59 208831.90
LESS PREPROJECT COSTS 2658.50 2658.50 2658.50 2658.50 2658.50 13292.50
INCREMENTAL BASE COSTS 55974.49 31919.15 36286.87 39853.80 31505.09 195539.40
FOREIGN 29667.04 14290.31 16858.78 19730.33 13525.63 94072.09LOCAL 26307.45 17628.84 19428.08 20123.47 17979.46 101467.31
PHYSICAL CONTINGENCIES 3888.23 2184.73 2156.85 2218.59 1751.51 12199.91PRICE CONTINGENCIES 3413.32 6213.85 11260.13 17570.23 19055.80 57513.34
TOTAL PROJECT COSTS 63276.04 40317.74 49703.85 59642.63 52312.40 265252.65
TOTAL FOREIGN COSTS 33005.16 17363.71 21772.95 27183.16 19951.08 119276.05TOTAL LOCAL COSTS 30270.89 22954.02 27930.90 32459,47 32361.32 145976.60
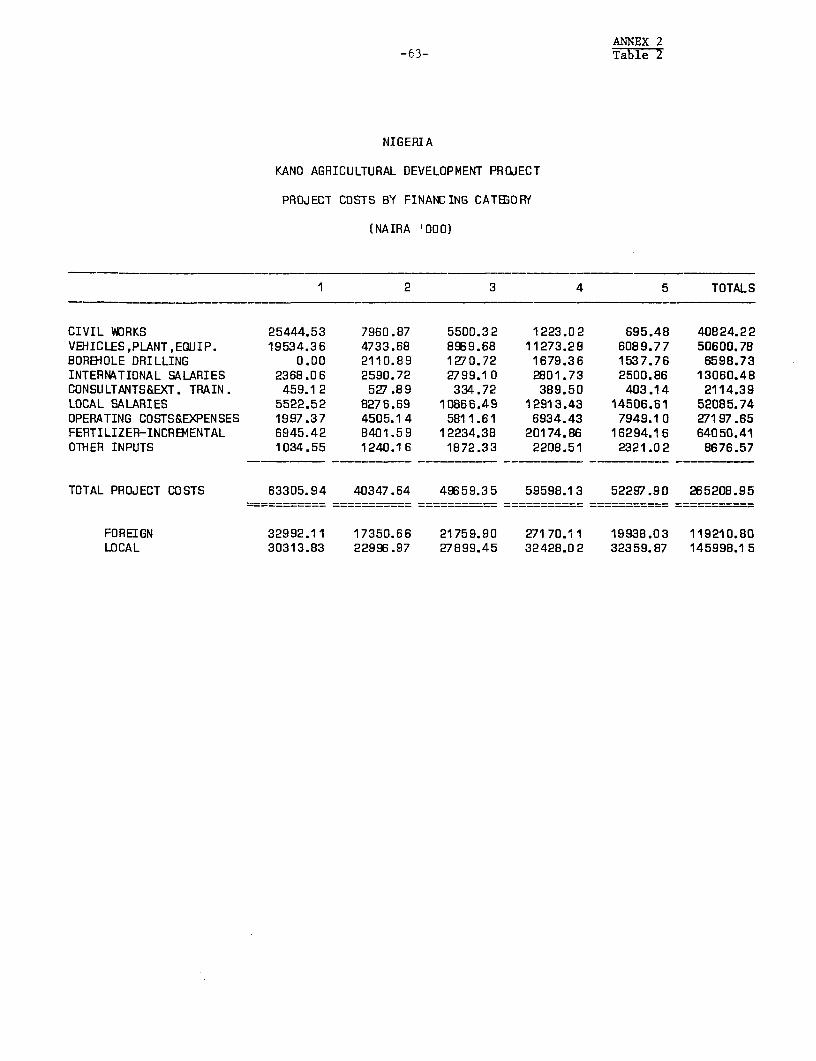
ANNEX 2-63- Table 2
NIGERIA
KANO AGRICULTURAL DEVELOPMENT PROJECT
PROJECT COSTS BY FINANCING CATEBOFY
(NAIRA '000)
1 2 3 4 5 TOTALS
CIVIL WORKS 25444.53 7960.87 5500.32 1223.02 695.48 40824.22VEHICLES,PLANT,EOUJIP. 19534.36 4733.68 8969.68 11273.28 6089.77 50600.78BOREHOLE DRILLING 0.00 2110.89 1270.72 1679.36 1537.76 6598.73INTERNATIONAL SALARIES 2368.06 2590.72 2799.10 2801.73 2500.86 13060.48CONSULTANTS&EXT. TRAIN. 459.12 527.89 334.72 389.50 403.14 2114.39LOCAL SALARIES 5522.52 8276.69 10866.49 12913.43 14506.61 52085.74OPERATING COSTS&EXPENSES 1997.37 4505.14 5811.61 6934.43 7949.10 27197.65FERTILIZER-INCREMENTAL 6945.42 8401.59 12234.38 20174.86 16294.16 64050.41OTHER INPUTS 1034.55 1240.16 1872.33 2208.51 2321.02 8676.57
TOTAL PROJECT COSTS 63305.94 40347.64 49659.35 59598.13 52297.90 265208.95
FOREIGN 32992.11 17350.66 21759.90 27170.11 19938.03 119210.80LOCAL 30313.83 22996.97 27899.45 32428.02 32359.87 145998.15

NIGERIA
KANO AGRICULTURAL DEVELOPMENT PROJECT
Detailed Financing Plan
(N'000)
Bank LoanAs per Disbursement
Year 1 Year 2 Year 3 Year 4 Year 5 Total US$ mn Schedule
Bank Loan
Civil Works 12,722.7 3,980.4 2,750.2 611.5 347.7 20,412.5 37.1 33.4
Plant, Vehicles, & Equip. 14,168.7 2,542.1 5,443.1 6,836.4 2,836.7 31,827.0 57.9 52.1
Borehole drilling - 1,477.6 889.5 1,175.6 1,076.4 4,619.1 8.4 7.6
International Salaries 2,827.2 3,118.6 3,133.8 3,191.2 2,904.0 15,174.8 27.6 24.8
Farm Inputs 764.3 895.8 1,316.7 7,520.7 1,572.7 6,070.1 11.0 9.9
Subtotal 30,482.9 12,014.5 13,533.3 13,335.4 8,737.4 78,103.5 142.0 127.8
FGN Unallocated 14.2142.0
Fertilizer Subsidy 3,333.6 4,032.3 5,887.0 9,681.8 7,819.2 30,753.9
25% subvention 13,830.9 7,673.6 8,883.7 9,296.4 8,410.2 48,094.8
Subtotal 17,164.5 11,705.9 14,770.7 18,978.2 16,229.4 78,848.7
Farmer
Input Purchases 1,867.9 2,248.2 3,344.0 4,629.1 4,275.6 16,364.8
KNSG 13,790.6 14,379.0 18,011.5 22,655.3 23,055.5 91,891.9
Incremental Project Costs 63,305.9 40,347.6 49,659.4 59,598.0 52,297.9 265,208.9
Additional Financing
KNSG - KASCO Equity 3,000.0 - - - - 3,000.0
KNSG - Cooperative Working Capital 315.0 43.0 58.0 48.0 29.8 493.8
KNSG - on-going Expenditure 2,791.4 3,186.9 3,540.8 3,971.2 4,455.6 17,945.9
Remaining Farm Inputs
FGN - Subsidy 5,968.3 10,317.1 15,598.0 23,482.1 36,331.2 91,696.7
KNSG - Subsidy & Transport 4,486.1 8,337.8 13,178.1 20,692.1 32,839.3 79,533.4
Farmer - Inputs 2,077.0 3,676.4 5,546.2 8,318.2 12,357.3 31,975.1
Total FGN 23,132.8 22,023.0 30,368.7 42,460.3 52,560.6 170,545.4
Total KNSG 24,383.1 25,946.7 34,788.4 47,366.6 60,380.2 192,865.0
Total Farmers 3,944.9 5,924.6 8,890.2 12,947.3 16,632.9 48,339.9
09/03/80

- 65 -Annex 2
NIGERIA Table 4
KANO AGRICULTURAL DEVELOPMENT PROJECT
Summary of Project Cost and Financing J
(Million N)
PYl PY2 PY3 PY4 PY5 Total
Project Cost 63.3 40.3 49.7 59.6 52.3 265.2less incremental fertilizer & farm inputs 8.0 9.6 14.1 22.4 18.6 72.7
Project cost, less inputs 55.3 30.7 35.6 37.2 33.7 192.5
FGN subvention (25%) 13.8 7.7 8.9 9.3 8.4 48.1FGN subsidy on incremental fertilizer 2/ 3,3 4.0 5.9 9.7 7.8 30.7FGN contribution to project cost 17.2 11.7 14.8 19.0 16.2 78.9
KNSG share of project costs less inputs 11.2 11.2 13.1 14.4 16.3 66.2KNSG subsidy on incremental fertilizer 2/ 2.6 3.2 4.9 8.2 6.8 25.7
KNSG contribution to project cost 13.8 14.4 18.0 22.6 23.1 91.9
Farmers' purchases, incremental inputs.-/ 1.9 2.2 3.3 4.6 4.3 16.4
Total Nigerian Contribution 32.9 28.3 36.1 46.2 43.6 187.2
IBRD Loan 30.5 12.0 13.5 13.3 8.7 78.1
TOTAL PROJECT COST 63.3 40.3 49.7 59.6 52.3 265.2
Total Fertilizer Cost 19.5 30.1 45.1 69.7 93.0 257.4
FGN 9.3 14.3 21.5 33.2 44.2 122.5Farmer 2 2.9 4.0 5.5 7.8 9.5 29.7KNSG 2/ 7.3 11.7 18.1 28.8 39.4 105.3
Additional KNSG Financing 6.1 3.2 3.6 4.0 4.5 21.5
KASCO Equity 3.0 - 3.0Cooperatives' working capital 0.3 - 0.1 0.1 - 0.5On-going expenditure 2.8 3.2 3.5 4.0 4.5 18.0
KNSG Share of Program Cost 3/ 14.0 14.4 16.6 18.4 20.8 84.2Project Cost less inputs 11.2 11.2 13.1 14.4 16.3 66.2On-going expenditure 2.8 3.2 3.5 4.0 4.5 18.0
KNSG Fertilizer Cost 2/ 7.3 11.7 18.1 28.8 39.4 105.3KNSG: for KASCO and cooperatives 3.3 - 0.1 0.1 - 3.5
Total KNSG Cost 24.6 26.1 34.8 47.3 60.2 193.0
1/ Totals may not add due to rounding.2/ Under current fertilizer subsidy arrangements.3/ KNSG share of cost of all project-related activities, excluding fertilizer subsidies.
November 19, 1980

NIGERIA
KANO AG.RICULTURIAL DEVELOPFEXIP PROJECT
F0 5
7nLt flebqreimnts
Total F-rignUnit Ye-r 0 Ye-r 1 Year 2 Year 3 Ye-r 4 Year 5 P0 1-5 foodsegR
1Inlte Price G Q tCot Cost 0ty Cot Qty Cot w Cost t Cost Qtv Cort /. A..o.t
Fertili-eCoertipound - Ni'K 15-15-i5 1,000 7oO 160.5 25.8 4,140.9 45.2 7,254.4 6.0 9,790.5 82.7 13,273.4 120.1 19,276.0 145.8 23,400.9 454.8 72,995.4 100 72,995.4CAN " 110.9 9.7 13,075.7 19. 2,195.8 28.1 3,116.3 38.9 4,314.0 50.9 5,644.8 60.8 6,742.7 198.5 22,013.6 101 22,013.6BSSP " 93.4 11.4 , 064.5 5.8 541.7 9.6 896.6 14.1 1 316.9 19.1 1,783.9 23.9 2,232.3 72.5 6 771.4 100Sob Tottl 46.9 6,281.4 70.8 9,992.1 98.7 13,803.4 135.7 18,906.3 190.1 26,704.7 230.5 32 375.9 725.8 101,780.4 100 101,780.5
Pot Chotto- 14.0 656.6 991.2 l,381.8 1,899.8 2,661.4 3,227.0 10,161.2...rsp-rt to ta.. 82.3 3,5. 58_26.8 8,t230 11,1681 18,970.1 5973. 30 1792-
4,516.5 9,504.8 13,067.9 18,306.6 22,197.1 69,894.4 17,920.0
Feetilizer (Cost at Stot,CL.pItjl 10,797.9 16,810.1 23,308.2 31,972.2 45,011.3 54,573.0 171,674.8 119,700.5total Coats in RatioHan-dlig 1.0 46.9 70.8 98.7 135.7 190.1 230.5 725.8Teoroport 10.0 469.0 708.D 987.0 1,357.0 1,901.0 2,305.0 7,249.0 38 201
515.9 778.8 1,035.7 1,492.7 2,091.1 ! 2,535,5 7,974.8 2,174.7
Tottl Cost 11,313.8 17,588.9 24,393.9 33,464.9 47,102.4 57,108.5 179,649,6 68 121,875.2
AC noal Incre. ent 6,275.1 6,805.0 9,071.0 13,637.5 10,006.1 45,794.7 68 31,178.4
See-resstng _ ... o 11.10 - 1,404 15.6 2,031 22.5 2,784 30.9 3,554 39.5 4.299 47.7 14,074 156.2 70 109.3Syothetlo Pyret roidol-arbaryl 6.50 - 78,000 507.0 165,000 1 072.5 305,000 1,982.5 455,000 2,957.5 590,000 3,835.0 1,593,000 10,354.5 70 7,248.0
1---t ~ ~ ~ ~ ~ ~ ~ ~ ~ ~ ~ ~ ~ ~~~~~~2. ,050203.4 2,997.0 3,92.7 10,510.7 7,357.3Antoel Itcremneot 522.6 572.4 918.4 983.6 885.7 3,882.7 70 2,717.9
Agrlooltorol leplenentteSprayers each 30.0 780 23.4 1,660 49.8 3,100 93.0 4,600 138.0 5,900 177.0 16.040 481.2 80 384.9NettalLI Bles " 300.0 400 120.0 400 120.0 400 120.0 400 120.0 400 120.0 2,000 600.0 80 480.0Sonsl-poeps ~~~~~~~~~~ ~~300.0 900 270.0 900 270.0 900 200 00270.0 900 2700 4501300 9 9.413.4 439.8 483 0 57 8 0 56°70°0 2 43 1 20 o r O
July 28, 1980

NIGERIA
KANO AGRICULTURAL DEVELOPMENT PROJECr
Chemicals and Other Farm Inputs Requirements(Naira' 000)
PY 1 PY 2 PY 3 PY 4 PY 5 Total
Chemicals: (Incremental)
Base Cost 522.6 572.4 918.4 983.6 885.7 3,882.7Physical Contingency 26.1 28.6 45.9 49.2 44.3 194.1
548.7 601.0 964.3 1,032.8 930.0 4,076.8
Price Contingency:
Foreign (70%) 17.3 56.2 147.4 219.6 257.1 697.6Local (30% 12.3 47.4 122.1 196.7 245.5 624.0
29.6 103.6 269.5 416.3 502.6 1,321.6
Cost in current terms 578.3 704.6 1,233.8 1,449.1 1,432.6 5,398.4
Agricultural Implements
Sprayers, Mettalic Bins and 413.4 439.8 483.0 528.0 567.0 2,431.2hand pumps
Physical Contingency 20.7 22.0 24.1 26.4 28.3 121.5434.1 461.8 507.1 554.4 595.3 2,552.7
Price Contingency:
Foreign (80%) 15.6 49.4 88.6 134.7 188.1 476.4Local (20%) 6.5 24.3 42.8 70.4 104.8 248.8
22.1 73.7 131.4 205,1 292.9 725.2
Cost in current terms 456.2 535.5 638.5 759.5 888.2 3,277.9
Chemicals (Total Requirements)
Base Cost 522.6 1,095.0 2,013.4 2,997.0 3,882.7 10,510.7Physical Contingency 26.1 54.7 100.7 149.8 194.1 525.4
548.7 1,149.7 2,114.1 3,146.8 4,076.8 11,036.1
Price Contingency
Foreign (70%) 17.3 107.5 323.2 637.1 1,127.2 2,212.3Local (30%) 12.3 90.7 267.6 599.5 1,076.3 2,046.4_ 1
0.29.6 198.2 590.8 1,236.6 2,203.5 4,258.7 S
Cost in current terms 578.3 1,347.9 2,704.9 4,383.4 6,280.3 15,294.8
July 30, 1980

-68 -
ANNEX 2Table 7
NIGERIA
KANO AGRICULTURAL DEVELOPMENT PROJECT
Estimated Schedule of Disbursements of Bank Loan(US$ million)
IBRD CurrentFiscal Year Quarter Cumulative
FY 1982 1.3 1.33.7 5.07.5 12.512.0 24.5
FY 198.3 15.6 40.19.0 49.18.5 57.68.3 65.9
FY 1984 8.5 74.47.3 81.75.7 87.43.2 90.6
FY 1985 7.3 97.95.3 103.25.6 108.83.3 112.1
FY 1986 8.5 120.64.6 129.24.8 134.03.5 137.5
FY 1987 2.8 140.31.7 142.0
The closing date is December 31, 1986.
July 30, 1980

ANNEX 2Table 8
- 69 -
NIGERIA
KANO AGRICULTURAL DEVELOPMENT PROJECT
KANO AGRICULTURAL SUPPLY COMPANY LIMITED
Trading and Profit & Loss Statement(Naira'000)
Year 1 Year 2 Year 3 Year 4 Year 5Sales:
Fertilizer 2,910.4 4,041.2 5,546.8 7,804.4 9,464.4Chemicals & Sprayers 755.2 1,760.8 3,534.7 5,727.4 8,196.9Agricultural Implements 538.1 593.5 644.5 701.3 763.8
4,203.7 6,395.5 9,726.0 14,233.1 18,425.1
State Gov't. Subsidy/GrantFertilizer (Net) 6,391.5 10,308.3 15,938.2 25,359.4 34,685.9Fertilizer Distribution 872.7 1,389.8 2,145.7 3,400.9 4,669.4Grant to cover operating cost 1,919.5 2,557.1 3,188.3 3,557.6 3,966.1
9,183.7 14,255.2 21,272.2 32,317.9 43.321'4
Total Sales & State Gov'tSubsidy/Grant: 13,387.4 20,650.7 30,998.2 46,551.0 61,746.5
Cost of Sales:Fertilizer 1/ 9,301.9 14,349.5 21,485.0 33,163.8 44,150.3Chemicals & Sprayers 604.2 1,408.6 2,827.8 4,581.9 6,557.5Agricultural Implements 430.3 474.8 515.6 561.0 611.0
10,336.4 16,232.9 24,828.4 38,306.7 51,318.8
Gross-Profit plus Subsidy & Grant 3,051.0 4,417.8 6,169.8 8,244.3 10,427.7Truck Rental 118.0 135.7 156.1 179.5 206.5Interest _ 58.1 102.8 131.7 143.5
Total: 3,169.0 4,611.6 6,428.7 8,555.5 10,777.7
Deduct:Salaries & Wages 1,349.4 1,720.8 2,130.3 2,339.1 2,568.0Fertilizer Transport & Handling 872.7 1,389.8 2,145.7 3,400.9 4,669.4Vehicle Operating Costs 357.2 407.1 450.6 505.0 566.7General Charges 101.4 207.5 256.8 310.3 367.8Storage Rent 111.5 221.7 350.6 403.2 463.6Depreciation 317.2 364.6 412.9 594.8 594.8
Total: 3,109.4 4,311.5 5,746.9 7,553.3 9,230.3
Profit/(Loss) 59.6 300.1 681.8 1,002.2 1,547.4Cumulative 59.6 359.7 1,041.5 2,043.7 3,591.1
1/ Fertilizer coat delivered Kano, (less FGN Subsidy) payable to FFSA.

ANNEX 2- 70- Table 9
NIGERIA
KANO AGRICULTURAL DEVELOPMENT PROJECT
KANO AGRICULTURAL SUPPLY CO. LTD.
Balance-Sheet as on December 31(Naira'OOO)
Year 1 Year 2 Year 3 Year 4 Year 5
Authorized Share Capital:Shares of Ni, each 20,000.0 20,000.0 20,000.0 20,000.0 20,000.0
Issued 6hare CapitalOrdinary Shares of Ni each
fully paid 4,200.0 4,200.0 4,200.0 4,200.0 4,200.0
Profit & Loss Account 59.6 359.7 1,041.5 2,043.7 3,591.14,259.6 4,559.7 5,241.5 6,243.7 7,791.1
KNADP Current Account 5,602.7 7,611.1 9,838.0 12,320.3 12,320.39,862.3 12,170.8 15,079.5 18,564.0 20,111.4
Represented by:Fixed Assets at Cost
Buildings & Staffhousing 4,064.8 4,584.4 5,115.3 5,115.3 5,115.3Vehicles & Equipment 1,077.8 1,249.9 1,425.2 2,334.8 2,334.8
5,142.6 5,834.3 6,540.5 7,450.1 7,450.1Less:Aggregate Depreciation 317.2 681.8 1,094.7 1,689.5 2,284.3
4,825.4 5,152.5 5,445.8 5,760.6 5,165.8
Current AssetsStocks 1,883.4 3,343.4 5,142.9 7,168.5 8,072.9Debtors 484.3 857.1 1,0/.6 1,195.9 1,301.6Cash 2,669.2 2,817.8 3,393.2 4 439.O 5,571.1
5,036.9 7,018.3 9,633.7 12,803.4 14,945.6
9,862.3 12,170.8 15,079.5 18,564.0 20,111.4
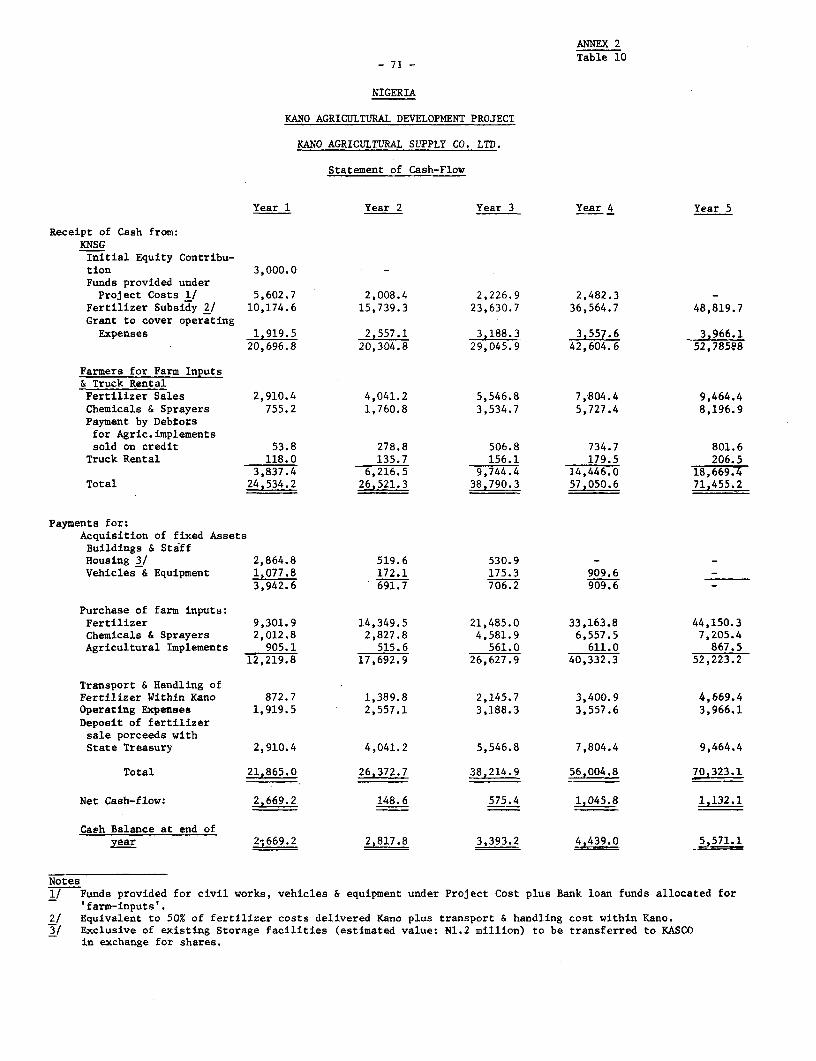
ANNEX 2
- 71 - Table 10
NIGERIA
KANO AGRICULTURAL DEVELOPMENT PROJECT
KANO AGRICULTURAL SUPPLY CO. LTD.
Statement of Cash-Flow
Year 1 Year 2 Year 3 Year 4 Year 5
Receipt of Cash from:KNSGInitial Equity Contribu-tion 3,000.0Funds provided underProject Costs 1/ 5,602.7 2,008.4 2,226.9 2,482.3 -
Fertilizer Subsidy 2/ 10,174.6 15,739.3 23,630.7 36,564.7 48,819.7Grant to cover operatingExpenses 1,919.5 2,557.1 3,188.3 3,557.6 3,966.1
20,696.8 20,304.8 29,045.9 42,604.6 52,78598
Farmers for Farm Inputs& Truck RentalFertilizer Sales 2,910.4 4,041.2 5,546.8 7,804.4 9,464.4Chemicals & Sprayers 755.2 1,760.8 3,534.7 5,727.4 8,196.9Payment by Debtorsfor Agric.implementssold on credit 53.8 278.8 506.8 734.7 801.6
Truck Rental 118.0 135.7 156.1 179.5 206.53,837.4 6,216.5 9,744.4 14,446.0 18,669.4
Total 24,534.2 26,521.3 38,790.3 57,050.6 71,455.2
Payments for:Acquisition of fixed AssetsBuildings & StiffHousing 3/ 2,864.8 519.6 530.9 -Vehicles & Equipment 1,077.8 172.1 175.3 909.6 -
3,942.6 691.7 706.2 909.6 -
Purchase of farm inputs:Fertilizer 9,301.9 14,349.5 21,485.0 33,163.8 44,150.3Chemicals & Sprayers 2,012.8 2,827.8 4,581.9 6,557.5 7,205.4Agricultural Implements 905.1 515.6 561.0 611.0 867.5
12,219.8 17,692.9 26,627.9 40,332.3 52,223.2
Transport & Handling ofFertilizer Within Kano 872.7 1,389.8 2,145.7 3,400.9 4,669.4Operating Expenses 1,919.5 2,557.1 3,188.3 3,557.6 3,966.1Deposit of fertilizersale porceeds withState Treasury 2,910.4 4,041.2 5,546.8 7,804.4 9,464.4
Total 21,865.0 26,372.7 38,214.9 562004.8 70,323.1
Net Cash-flow: 2,669.2 148.6 575.4 1,045.8 1,132.1
Cash Balance at end ofyear 2,669.2 2,817.8 3,393.2 4,439.0 5,571.1
Notes1/ Funds provided for civil works, vehicles & equipment under Project Cost plus Bank loan funds allocated for
'farm-inputs'.2/ Equivalent to 50% of fertilizer costs delivered Kano plus transport & handling cost within Kano.3/ Exclusive of existing Storage facilities (estimated value: N1.2 million) to be transferred to KASCO
in exchange for shares.

- 72 -ANNEX 3
NIGERIA
KANO AGRICULTURAL DEVELOPMENT PROJECT
Financial Implications of Fertilizer and Subsidy Mechanism
1. Although chemicals, seeds and farm implements are expected to besold to farmers on commercial terms (cost plus mark-up), fertilizers arepresently sold at a heavily subsidized price, fixed by FGN. The 1980 salesprice was N2.20 per bag (ff44/ton) for compounds and urea, and f1f.80per bag (ff36/ton) for other types. The Federal Government, which procuresfertilizer centrally and delivers it to each state capital, had in 1979informed the states that it would subsidize 50% of the total cost, deliveredto Kano, expecting KNSG to pay the balance between the other 50% and thesales price to the farmer (up to 1979, the subsidy had been about 80%). TheKNSG has also to pay for transport from Kano to the selling and/or distribu-tion point: village, farm-service center, etc. The following table shows theshare of each intermediary in the cost of, for example, one ton of NPK:
Breakdown of Participants Share in Fertilizer Costs
I C & F in US$ per ton $292
In Naira, at US$1.00 - NO.55 N161Plus: Port charges and
transport to Kano 96II Total N257
FGN Subsidy N128 (50% of II)Sales price to farmer 44 (17% of II)
Sub-total N172III Balance of original cost
to be paid by KNSG 85 (33% of II)IV Total N257
V Additional in-state transportto be paid by KNSG N 11
IV + V = VI Total KNSG Subsidy N 96 per ton

- 73 -
The cost breakdown for cheaper fertilizers would be different, since inlandtransport costs remain the same and the federal subsidy is therefore lower.This system is complicated, and an inadequate accounting system has made itvirtually impossible for the FGN to collect the states shares. Thus theFGN has ended up paying the full cost including transportation to the statecapitals.
2. The present central procurement procedure has also resulted indisrupted supplies because FGN has to prefinance procurement. Consequently,in years of financial constraints, budgetary allocations for fertilizerprocurement were curtailed and supply could not meet demand. In addition,supplies often arrived late owing to ordering and handling delays at theCentral Fertilizer Unit (CFU). One result of these supply shortfalls hasbeen the creation of a black market, in which prices are much higher thanthe subsidized official price.
3. In view of the critical need to increase the supply and use offertilizer for food crop production, FGN has decided to replace the presentsystem of subsidies and central procurement. The project would require largequantities of fertilizer (from 46,900 tons in 1980 to 230,500 tons in PY5),and the supply of fertilizer is critical to the achievement of the project'sestimated benefits. FGN has decided to retain responsibility for fertilizerprocurement, and the Executive Council has approved the establishment ofthe National Fertilizer Marketing Company (NFMC), which would be responsibleto the Federal Ministry of Agriculture. Operated by expert management oncommercial grounds, it would coordinate national demand for fertilizer, takeup domestic output, procure the rest of Nigeria's requirements at internationalprices, apply the applicable subsidies, and arrange for its distribution insideNigeria by quasi-government agencies (including state farm supply companies),cooperatives, and the private sector.
4. As fertilizer distribution would be the responsibility of theState, KNSG would establish the Kano Agricultural Supply Company (KASCO) toprocure chemicals, agricultural machinery, implements and small equipment andto set up a distribution network to enable most farmers to obtain these inputsand fertilizer needs at a convenient place and time. All investments neededby KASCO - storage areas for fertilizer, Farm-Service Centers, storage areasfor maize and other grain, vehicles and trucks - would be provided under theproject. KASCO would use hired trucks for instate distribution. KASCO's costrecovery practices would be such as to ensure full cost recovery.
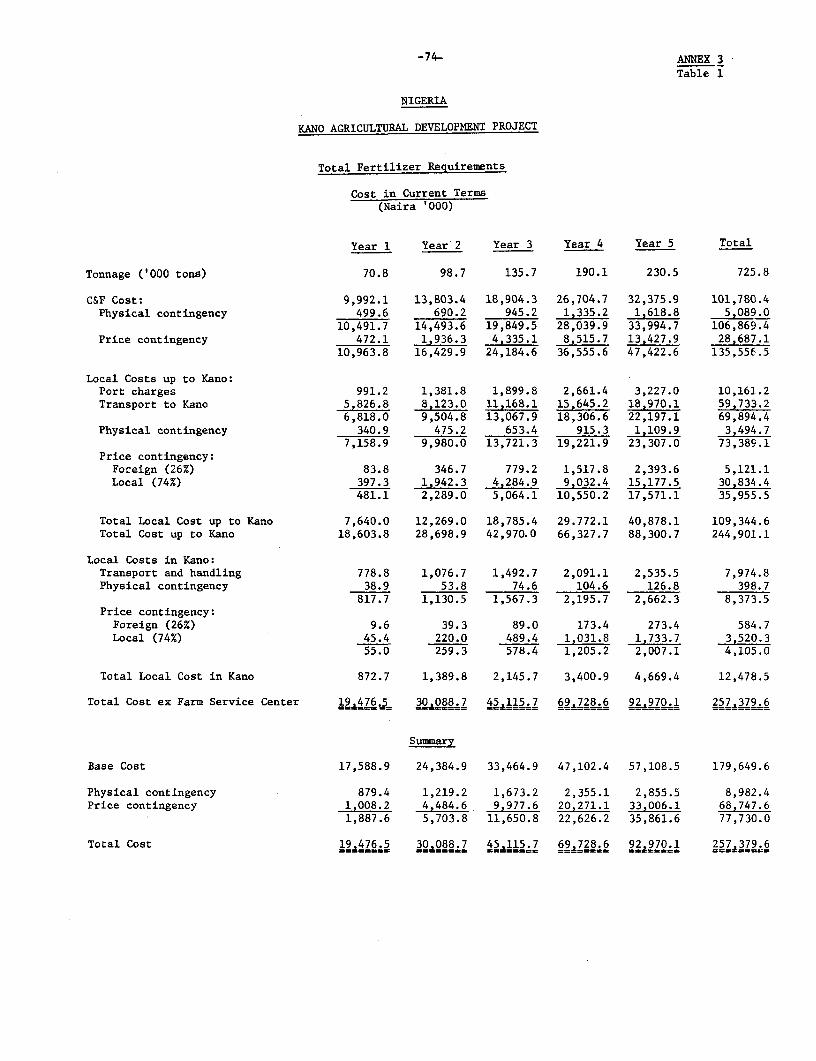
-74- ANNEX 3
Table 1
NIGERIA
KANO AGRICULTURAL DEVELOPMENT PROJECT
Total Fertilizer Requirements
Cost in Current Terms(Naira '000)
Year 1 Year 2 Year 3 Year 4 Year 5 Total
Tonnage ('000 tons) 70.8 98.7 135.7 190.1 230.5 725.8
C&F Cost: 9,992.1 13,803.4 18,904.3 26,704.7 32,375.9 101,780.4Physical contingency 499.6 690.2 945.2 1,335.2 1,618.8 5,089.0
10,491.7 14,493.6 19,849.5 28,039.9 33,994.7 106,869.4Price contingency 472.1 1,936.3 4,335.1 8,515.7 13,427.9 28,687.1
10,963.8 16,429.9 24,184.6 36,555.6 47,422.6 135,55C.5
Local Costs up to Kano:Port charges 991.2 1,381.8 1,899.8 2,661.4 3,227.0 10,161.2Transport to Kano 5,826.8 8,123.0 11,168.1 15,645.2 18,970.1 59,733.2
6,818.0 9,504.8 13,067.9 18,306.6 22,197.1 69,894.4Physical contingency 340.9 475.2 653.4 915.3 1,109.9 3,494.7
7,158.9 9,980.0 13,721.3 19,221.9 23,307.0 73,389.1Price contingency:
Foceign (26%) 83.8 346.7 779.2 1,517.8 2,393.6 5,121.1Local (74%) 397.3 1,942.3 4,284.9 9,032.4 15,177.5 30,834.4
481.1 2,289.0 5,064.1 10,550.2 17,571.1 35,955.5
Total Local Cost up to Kano 7,640.0 12,269.0 18,785.4 29.772.1 40,878.1 109,344.6Total Cost up to Kano 18,603.8 28,698.9 42,970.0 66,327.7 88,300.7 244,901.1
Local Costs in Kano:Transport and handling 778.8 1,076.7 1,492.7 2,091.1 2,535.5 7,974.8Physical contingency 38.9 53.8 74.6 104.6 126.8 398.7
817.7 1,130.5 1,567.3 2,195.7 2,662.3 8,373.5Price contingency:
Foreign (26%) 9.6 39.3 89.0 173.4 273.4 584.7Local (74%) 45.4 220.0 489.4 1,031.8 1,733.7 3,520.3
55.0 259.3 578.4 1,205.2 2,007.1 4,105.0
Total Local Cost in Kano 872.7 1,389.8 2,145.7 3,400.9 4,669.4 12,478.5
Total Cost ex Farm Service Center 19,6,45 30.088.7 4 5a115 27 _728=6 92A970: 257,379.6
Summary
Base Cost 17,588.9 24,384.9 33,464.9 47,102.4 57,108.5 179,649.6
Physical contingency 879.4 1,219.2 1,673.2 2,355.1 2,855.5 8,982.4Price contingency 1,008.2 4,484.6 9,977.6 20,271.1 33,006.1 68,747.6
1,887.6 5,703.8 11,650.8 22,626.2 35,861.6 77,730.0
Total Cost 19.476.5 30.088.7 45.115.7 692728.6 92,970.1 257,379.6

NIGERIA
KANO AGRICULTURAL DEVELOPMENT PROJECT
Fertilizer - Financing(N'000)
Year 1 Year 2 Year 3 Year 4 Year 5 Total
Fertilizer ('000 tonnes)
Compound 45.2 61.0 82.7 120.1 145.8 454.8CAN 19.8 28.1 38.9 50.9 60.8 198.5BSSP 5.8 9.6 14.1 19.1 23.9 72.5
70.8 98.7 135.7 190.1 230.5 725.8
Price charged to Farmer (Naira per Ton)
Compound 44.0 44.0 44.0 44.0 44.0 44.0CAN 36.0 36.0 36.0 36.0 36.0 36.0BSSP 36.0 36.0 36.0 36.0 36.0 36.0
.. ............... In Naira'OOO .........................
Total Cost: (In current terms) 19,476.5 30,088.7 45,115.7 69,728.6 92,970.1 257,379.6
Financed as follows:
FGN (Subsidy - 50% of cost delivered 9,301.9 14,349.4 21,485.0 33,163.9 44,150.4 122,450.6 (48%)Kano)
Farmer;
Compound 1,988.8 2,684.0 3,638.8 5,284.4 6,415.2 20,011.2CAN 712.8 1,011.6 1,400.4 1,832.4 2,188.8 7,146.0BSSP 208.8 345.6 507.6 687.6 860.4 2,610.0
2,910.4 4,041.2 5,546.8 7,804.4 9,464.4 29,767.2 (12%)
State Government:
Transport and handling costs in Kano 872.7 1,389.8 2,145.7 3,400.9 4,669.4 12,478.5State Government Subsidy (Balance) 6,391.5 10,308.3 15,938.2 25,359.4 34,685.9 92,683.3
7,264.2 11,698.1 18,083.9 28,760.3 39,355.3 105,161.8 (40%)
TOTAL 19,476.5 30,088.7 45,115.7 69,728.6 92,970.1 257,379.6 (100%)
July 29, 1980

-76- ANNEX 3
Table 3
NIGERIA
KANO AGRICULTURAL DEVELOPMENT PROJECT
Incremental Fertilizer
Cost in Current Terms(Naira '000)
Year 1 Year 2 Year 3 Year 4 Year 5 Total
Tonnage ('000 tons) 23.9 27.9 37.0 54.4 40.4 183.6
C&F Cost: 3,710.7 3,811.3 5,100.9 7,800.4 5,671.2 26,094.5Physical contingency 185.5 190.6 255.0 390.0 283.6 1,304.7
3,896.2 4,001.9 5,355.9 8,190.4 5,954.8 27,399.2Price contingency 175.3 534.6 1,169.7 2,487.4 2,352.2 6,719.2
4,071.5 4,536.5 6,525.6 10,677.8 8,307.0 34,118.4
Port Charges and Transport:Cost up to Kano 2,301.5 2,686.8 3,563.1 5,238.7 3,890.5 17,680.6Physical contingency 115.1 134.3 178.2 261.9 194.5 884.0
2,416.6 2,821.1 3,741.3 5,500.6 4,085.0 18,564.6Price contingency
Foreign (26%) 28.3 98.0 212.5 434.3 419.5 1,192.6Local (74%) 134.1 549.0 1,199.9 2,584.7 2,660.2 7,127.9
162.4 647.0 1,412.4 3,019.0 3,079.7 8,320.5
Total Local Cost up to Kano Z,579.0 3,468.1 5,153.7 8,519.6 7,164.7 26,885.1Total Cost up to Kano 6,650.5 8,004.6 11,679.3 19,197.4 15,471.7 61,003.5
Local Costs in Kano: 262.9 306.9 407.0 598.4 444.4 2,019.6Physical contingency 13.2 15.3 20.4 29.9 22.2 101.0
276.1 322.2 427.4 628.3 466.6 2,120.6Price contingencyForeign (26%) 3.2 11.2 24.3 49.6 47.9 136.2Local (74%) 15.3 62.7 133.5 295.2 303.8 810.5
18.5 73.9 157.8 344.8 351.7 946.7
Total Local Cost in Kano 294.6 396.1 585.2 973.1 818.3 3,067.3
Total Cost ex Farm Service Center 6,945.1 8,400.7 12,264.5 20,170.5 16,290.0 64,070.8
Summary
Base Cost: 6,275.1 6,805.0 9,071.0 13,637.5 10,006.1 45,794.7Physical contingency 313.8 340.2 453.6 681.8 500.3 2,289.7Price contingency 356.2 1,255.5 2,739.9 5,851.2 5,783.6 15,986.4
670.0 1,595.7 3,193.5 6,533.0 6,283.9 18,276.1
Total Cost 6,945.1 8,400.7 12,264.5 20,170.5 16,290.0 64,070.8
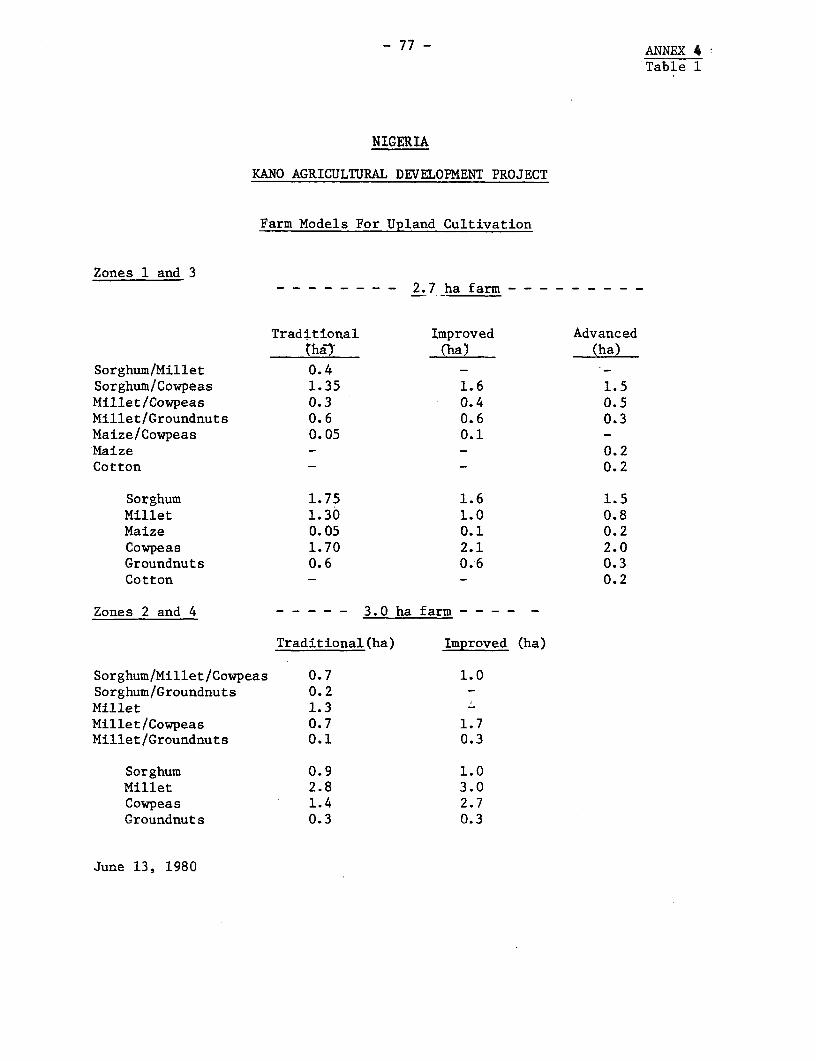
- 77 ANNEX 4Table 1
NIGERIA
KANO AGRICULTURAL DEVELOPMENT PROJECT
Farm Models For Upland Cultivation
Zones 1 and 3- - - - - - - - 2.7 ha farm - - -
Traditional Improved Advancedthaiy (ha) (ha)
Sorghum/Millet 0.4 -Sorghum/Cowpeas 1.35 1.6 1.5Millet/Cowpeas 0.3 0.4 0.5Millet/Groundnuts 0.6 0.6 0.3Maize/Cowpeas 0.05 0.1 -Maize - - 0.2Cotton - - 0.2
Sorghum 1.75 1.6 1.5Millet 1.30 1.0 0.8Maize 0.05 0.1 0.2Cowpeas 1.70 2.1 2.0Groundnuts 0.6 0.6 0.3Cotton - - 0.2
Zones 2 and 4 - - - - - 3.0 ha farm - - - - -
Traditional(ha) Improved (ha)
Sorghum/Millet/Cowpeas 0.7 1.0Sorghum/Groundnuts 0.2 -Millet 1.3 'Millet/Cowpeas 0.7 1.7Millet/Groundnuts 0.1 0.3
Sorghum 0.9 1.0Millet 2.8 3.0Cowpeas 1.4 2.7Groundnuts 0.3 0.3
June 13, 1980

ANNEX 4_78_ Table 2
NIGERIA
KANO AGRICULTURAL DEVELOPMENT PROJECT
Farm Budgets for Upland Cultivation
I. Zones 1 and 3: - 2.7 ha _
Traditional Improved Advanced
Income N 660 1473 1580
Expenses 90 333 401
Hired Labor 2/ 90 141 153
Fertilizer 3/ 154 206
Chemicals 4/ 38 42
Net Farm income 570 1140 1179
Return per ha N 211 422 437
Return per labor-day N 2.10 2.81 2.99
Annual per capita income5/ N 75 150 155
($136) (273) (282)
1/ Farm models, related to total area under cultivation, by crop, are givenin the Project File, Working Paper C2. All amounts expressed in 1981 N.
2/ 30, 47 and 51 man-days per year, respectively, mainly for weeding. Familylabor availability assumed at 50 man-days per month for strenuous work, 83man-days per month for other work.
3/ At unsubsidized prices of N13.50 per bag. Under existing fertilizer subsidypolicy, net farm incomes for improved and advanced cultivation would increaseto N1271 and N1343, respectively, and per capita income to N167 and N177.
4/ At unsubsidized prices. Application of spray and seed dressing.
5/ Based on average family size of 7.6 persons.

- 79 - ANNEX 4
Table 3
NIGERIA
KANO AGRICULTURAL DEVELOPMENT PROJECT
Farm Budgets for Upland Cultivation
1/II. Zones 2 and 4 -3 ha-
Traditional Improved
Income N 441 1,145
Expenses N 126 227
Hired Labor N 126 81
Fertilizer N 101
Chemicals -/ N 45
Net Farm Income N 315 918
Return per ha N 105 306
Return per labor-day N 1A13 2.24
Annual per capita income -/ N 41 121
($75) ($219)
1/ The production of this farm under traditional practices yields only about1,200Kg of grain per year, or about 72% of the hypothetical nutritionalrequirements for the "average" household of 7.6 persons. Additional re-quirements are met from vegetables, eggs, poultry and small livestock, whichare owned by most families, and from cash purchases financed by remittancesfrom relatives who have left the farm.
2/ 42 and 27 labor-days, respectively. Improved system spreads increased laborrequirements more evenly over the cropping season, largely due to betterand more timely planting and weeding operations.
3/ Owing to the shortage of cash income, farmers traditionally meet this needby working together on each other's farms.
4/ At unsubsidized prices averaging N13.50 per bag. Under existing fertilizersubsidy policy, net farm incomes for improved cultivation would increaseto N1,004, and annual per capita income to N132.
5/ For spray and seed dressing. At unsubsidized prices.
6/ Based on average family size of 7.6 persons.

NIGERIA
ti KANO AGRrCULTURAL DEVELOPMENT PROJECT
L'r Hectare return& for Fadama Gultivation
Gross Fertilizer Chemicals Irr-sationReturns, Pump Material Total Net Return (N)
Yield Price _ Labord*y Seed Quatity Cost N i Type Cost (N) Hours Costs Cost Cost Returu/ha Return/labor day
tons/ha) (N/ton) (N) 8Rice 2.5 256 640 143 29.30 200 NPK 94.50 - - 15.00 138.80 501 (2.98)
+ 25 for + 150 CANmanualirrigation
Sorghum 0.7 320 224 50 4.20 100 NPK 54.00 _ - - - 15.00 73.20 151 (3.02)+ 100 CAN
0.
Tomato 25 210 5,250 578 150.00 300 NPK 148.50 Spray-/ 42.90 164.00 65.00 570.40 4,680 (8.10)+ 250 CAN
Wheat 2.4 310 744 115 35.00 200 NPK 94.50 - 140 114.80 15.00 399.00 345 (3.00)+ 150 cAN
1/ 3 applications at 1.5 kg/ha, @ N7.80/Kg, depreciation on ULV sprayer and batteries N7.802/ Unsubsidized
June 3, 1980

-87,-
ANNEX ST.ble I
NIGERIA
KANO AGRICULTURAL D2Z'ELOPMNiT PROJECT
Upland Cultivation: increnmotal Production (000t) nd Value at Border Pric.8 ('000 1981 8)
____ _ 1 rl 2 Tow 3 Yer 4 Yer 5- Year 9 Year 10 -Year 25
Vale _ Value *titQ Value Oantity Value Quantity Value
U1_IMM 10.4 1,716.0 37.0 6.179.0 75.25 12.717.25 118.75 20.306.25 167.75 28,853.0 167.75 29.188.5
,one 1 9.0 30.4 52.9 74.9 99.9Zon 2 0.2 (165) 1.2 (167) 2.2 (1I9) 3.2 (171) 4.2 (172) (174)Zone 3 0.6 4.2 17.95 36.45 56.45Zone 4 0.6 1.2 2.2 4.2 6.2
illt, 7-35 1,293.6 19.95 3.55L.1 36.45 6,561.0 52.95 9,636.9 66.45 12,093.9 66.45 12,293.25
Zope 1; 6.0 12.25 19.75 27.25 29.75Zoe 2 0.6 (176) 1.6 (178) 4.6 (1SO) 5.6 (182) 8.6 (182) (185)Zone 3 b.75 4.5 9.5 14.5 19.5Zon 4 1.6 2.6 5.6 8.6
melee 4.8 902.4 14.8 2,797.2 28.35 5,414.85 44.3 8,505.6 59.7 11,522.1 59.7 11,641.5
Zone 1 4.8 10.4 19.55 29.15 39.35Zone 2 (188) (I89) (191) (192) (193) (195)Zone 3 4.4 8.8 15.15 20.35Zone 4
Compum 4-4 1.518 17.26 5.954.7 36.10 12,454.5 58.6 20.217.0 78.22 26.985.9 78.22 26.985.9
Zone 1 3.8 12.4 23.94 35.72 44.98Zone 2 0.6 (345) 1.0 (415) 1.6 (415) 2.0 (415) 2.4 (415) (415)Zone 3 2.66 8.36 17.48 25.84Zone 4 1.2 2.2 3.4 5.0
Groudnut. 2.45 921.2 j6 2,541.0 10.0 3,940.0 11.95 4.815.85 15.4 6,344.8 15.4 6,683.6
Zo7 1 2.2 3.95 4.9 5.5 6.7Zoe 2 0.25 (376) 0.75 (385) 1.0 (394) 1.5 (403) 1.75 4412) 1 (434)Zone 3 1.2 2.4 3.25 3.65Zoe4 0.7 1.7 1.1 3.3
Cotton 1.22 507.5 1.64 731.4 .96 933.0 2.78 1,406.7 3.1 1,661.6 3.1 1,739.1
Zo 1 0.41 0.82 0.98 1.39 1.55(416) (46) (476) (506) (536) (551)
Zone3 0.4 0.82 0.98 1.39 1.55
Total Value 6,858.7 21,754.4 42,020.6 64,868.3 87,461.3 88,531.8
!2S: Te fiures in parenthees are eonoic coSts in 1981 Neira.
July 28, 1980

NIGERIA
KANO AGRICULTURAL DEVELOPHENT PROJBCT
Fadama Cultivation: Incremental Production (tons) and Value ('000 1981 N1)
YEAR 1 YEAR 2 YEAR 3 YEAR 4 PY5 - YEAR 9 YEAR 10 - YEAR 25
Quantity Price Value Quantity Price Value Quantity Price Value Quantity Price Valut Quantity Price Value Quantity Price Value
Onions 2/ 2,400 (135) 9,800 (135) 26,100 (1,35)- 58,600 (135) 75,600 (135) 75,600 (135)
389 1,318 3,512 6,809 10,185 10,185
Tematoes 2/ 1,500 (124) 7,650 (124) 15,200 (142) 26,400 (142) 40,000 (142) 40,000 (142)
186 948 1,883 3,270 4,955 4,955
Other Vegetables 1/ 1,200 C258) 5,600 (258) t1,200 (258) 19,800 (258) 28,000 (258) 28,000 (158)
309 i,443 2,886 5,103 7,216 7,216
Rice 420 (150) 2,028 (155) 4,736 (160) 8,460 (165) 14,750 (170) 14,750 (175)
63 314 758 1,396 2,508 2,581
Wheat 120 (218) 391 (219) 722 (220) 1,113 (221) 1,360 (222) 1,360 (248)
26 86 159 246 302 337
Sorghum 450 (165) 1,800 (167) 4,590 (169) 8,880 (171) 14,550 (172) 14,550 (174)
85 301 776 1,518 2,503 2532
Maize 245 C188) 1,500 (189) 3,445 (191) 6,160 (192) 10,100 (19V 10,100 (195)
46 284 658 1,183 1,949 1,970
1,104 4,694 10,632 1l,525 29,618 29,776
1/ Other vegetables eg. peppers U150/4 kg = W374/t x.69 -2 5 8
/t
/ Onions, Tomtoes: Preparation report Annex 3, End Table 2 x.69

NIGERIA
KA4NO AGRICULTURAL DEVELOPMENT PROJECT
Calculation of Economic Coats('000 1981 N)
PYl PY2 PY3 PY4 PY5 Years 6-10 Years 11-25Foruin Local Foreian Local Foreign Local Foreign Local foreign Local Foreign Local Formin Local
Incremental Hired Pars Labor - 740.8 - 2,647.8 - 5,097.6 - 7,547.4 - 10,500 - 10,500 - 10,500Fertilizer / 4,029.0 2,824.1 7,319.0 5,102.2 12,885.1 8,466.0 20,214.8 13,641.3 26,394.1 17,469.7 26,394.1 17,469.7 26,738.2 17,661.6Civil Works 9,220.3 13,857.9 2,655.4 3,983.1 1,641.2 2,461.8 325.6 488.4 165.0 247.5 - - - -Vehicles and equipe,ent 12,916.3 3,646.9 1,869.0 837.1 3,435.1 1,283.2 4,296.5 1,339.0 983.4 516.0 - - - -International Staff 2,047.3 227.5 2,189.0 243.3 2,189.0 243.3 2,041.6 226.9 1,714.6 190.6 171.5 19.1 - _Local Staff - 5,145.0 - 7,008.2 - 8,395.0 - 8,893.0 - 9,280.4 5,210 - 1,Z42.0Operating Costs 1,692.6 3,068.7 2,412.7 3,942.4 2,774.6 4,589.1 2,682.8 5,033.8 2,861.7 4,822.0 1,430.8 2,834.7 286.2 566.9Other Inputs 384.1 164.6 804.8 344.9 1,479.8 634.2 2,202.8 944.1 2,853.8 1,223.1 2,853.8 1,223.1 2,853.8 1,223.1Implements 347.4 86.8 369.4 92.4 405.7 101.4 443.5 110.9 476.3 119.1 476,3 119.1 476.3 119.1
Total Base * Physical Contingencies 30,637.1 29,762.3 17,619.3 24,203.2 24,810.5 31,271.6 32,207.6 38,224.8 35,428.9 44,368.4 31,326.5 37,375.7 30,354.5 31,112.7
Adjustment by conversion factors - -4,438.7 - -2,796.7 - -3,015.4 - -2,896.1 - -2,787.8 - -1,599.0 - -501.7
Total Economic Costs 30,637.1 25,323.6 17,619.3 21,405.5 24,810.5 28,256.2 32,207.6 15,328.7 35,428.9 41,580.6 31,326.5 35,776.7 30,354.5 30,611.0S
1/ The upply standard conversion factor, 0.83, has been applied to all local costs, except fertilizer (see Working Paper CIll, Table 7) and incraeental labor (Nl.50 par labor-day derived fros, economic qreturns in traditional culttvation, sas Working Paper Ct1, Table 1). Conversion factors for transport and conatruction are also 0.83.2i For increantalqtatlitia aver Yer 0. For economic costs, sea Working Paper Cl1, Table 11. (SSP: 1188/ton - 11
9 7/ton; CAN: 11205/ton - 1243/ton; 83K 11246/ton).
July 29, 1980
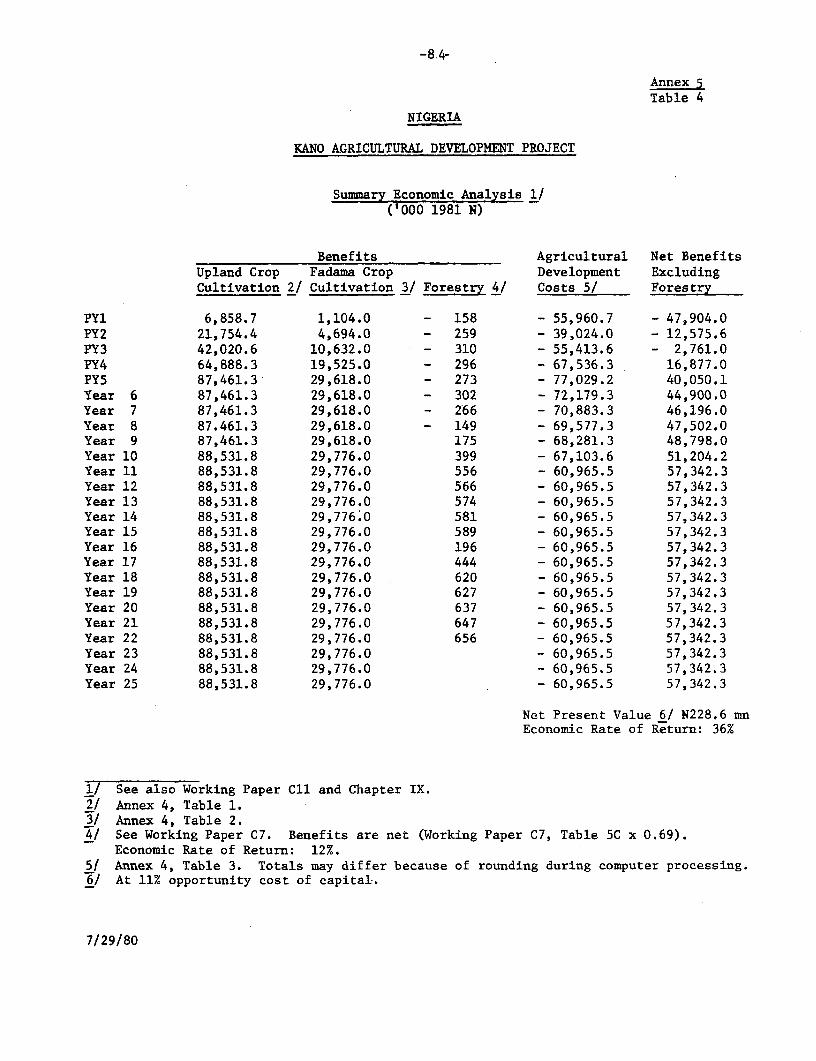
-8.4-
Annex 5Table 4
NIGERIA
KANO AGRICULTURAL DEVELOPMENT PROJECT
Summary Economic Analysis 1/('000 1981 N)
Benefits Agricultural Net BenefitsUpland Crop Fadama Crop Development ExcludingCultivation 2/ Cultivation 3/ Forestry 4/ Costs 5/ Forestry
PYl 6,858.7 1,104.0 - 158 - 55,960.7 - 47,904.0PY2 21,754.4 4,694.0 - 259 - 39,024.0 - 12,575.6PY3 42,020.6 10,632.0 - 310 - 55,413.6 - 2,761.0PY4 64,888.3 19,525.0 - 296 - 67,536.3 16,877.0PY5 87,461.3 29,618.0 - 273 - 77,029.2 40,050.1Year 6 87,461.3 29,618.0 - 302 - 72,179.3 44,900.0Year 7 87,461.3 29,618.0 - 266 - 70,883.3 46,196.0Year 8 87.461.3 29,618.0 - 149 - 69,577.3 47,502.0Year 9 87,461.3 29,618.0 175 - 68,281.3 48,798.0Year 10 88,531.8 29,776.0 399 - 67,103.6 51,204.2Year 11 88,531.8 29,776.0 556 - 60,965.5 57,342.3Year 12 88,531.8 29,776.0 566 - 60,965.5 57,342.3Year 13 88,531.8 29,776.0 574 - 60,965.5 57,342.3Year 14 88,531.8 29,776.0 581 - 60,965.5 57,342.3Year 15 88,531.8 29,776.0 589 - 60,965.5 57,342.3Year 16 88,531.8 29,776.0 196 - 60,965.5 57,342.3Year 17 88,531.8 29,776.0 444 - 60,965.5 57,342.3Year 18 88,531.8 29,776.0 620 - 60,965.5 57,342.3Year 19 88,531.8 29,776.0 627 - 60,965.5 57,342.3Year 20 88,531.8 29,776.0 637 - 60,965.5 57,342.3Year 21 88,531.8 29,776.0 647 - 60,965.5 57,342.3Year 22 88,531.8 29,776.0 656 - 60,965.5 57,342.3Year 23 88,531.8 29,776.0 - 60,965.5 57,342.3Year 24 88,531.8 29,776.0 - 60,965.5 57,342.3Year 25 88,531.8 29,776.0 - 60,965.5 57,342.3
Net Present Value 6/ N228.6 mnEconomic Rate of Return: 36%
1/ See also Working Paper Cll and Chapter IX.2/ Annex 4, Table 1.3/ Annex 4, Table 2.4/ See Working Paper C7. Benefits are net (Working Paper C7, Table 5C x 0.69).
Economic Rate of Return: 12%.51 Annex 4, Table 3. Totals may differ because of rounding during computer processing.6/ At 11% opportunity cost of capital-.
7/29/80

-85 -
ANNEX 5Table 5
'NIGERIA
KAN0 AGRICULTURAL DEVELOPMENT PROJECT
-Sensitivity AAnalysis 1/
Net Present Value NPV at 11%: W228.6 million
Economic Rate of Return: 36%
Charges in key variables to yield zero NPV (11% ERR)
30% drop in benefits,
44%-increase in costs
339% increase in shadow wage rate (from N1.50/day to N5.10/day)
50% drop in maize, millet, sorghum and wheat prices
63% drop in adoption rate (70% to 26%)
34% drop in PY5-Year 25 benefits
Change in Variable NPV (N million)
25% drop in price of NPK, PY5-Yr.25 2/ 263.5 (+15%)
One year delay in benefits 146.5 (-36%)
10% increase in benefits 303.5 (+33%)
1/ Excluding Forestry, Rural Water Supplies, Consultancies. Per WP Cll.2/ The impact on NPK prices in Nigeria of the Onne Fertilizer Plant,
projected to start production in 1985, cannot be predicted with certainty.

- 86 - 6
NIGERIA
KANO AGRICULTURAL DEVELOPMENT PROJECT
Data and Related Documents Available in the Project File
A. Kano State Integrated Rural Development Project Preparation Report.October 1979.
C. Working Papers
Cl Agricultural Background and PotentialC2 MarketingC3 Input SupplyC4 Cooperatives and CreditC5 Feeder RoadsC6 Rural Water SupplyC7 ForestryC8 Training and Staff DevelopmentC9 Monitoring and EvaluationC10 Cost EstimatesCll Economic Analysis

NIGERIAKANO AGRICULTURAL DEVELOPMENT PROJECT
Internal Organization
DEPUTY GOVE
STATE PROGRAM MANAGEMENT UNIT
II IADMINISTRATION FINANCIAL CONTROL LAND USEPLANNING MONITORING AND EVALUATION
CHIEF ADMIN OFFICER CHIEF FINAOFFICERFFICER) (CHIEF L.U OFFICER) CHIEF EVALUATION OFFICER)
MA G AD I AGRICULTURAL SERVICES MANPOWER DEVELOPMENT ENGINEERINGMARKETING AND CHIEF TECHNICAL OFFICERI ICHIEF TRAINING OFFICERI (CHIEF ENGINEER)
AIPIIEII F SEFD~SEIR TAF R-SRVCEMCHNIARESEARCH MULTIPLICATION TRAINING TAI(
ZONAL DEVELOPMENT UNIT
~~~~~ M A ~ ~ ~ EU1 AAE
ADMINISTRATNI NG ON FICER CHIEF TECHNICALOFFICER
CHIEF TRAIN)INDGOFFICER CHIEF TECHNICAL OFFiCER
FSUBJECT MATTER ROADS AND MECHANICALTRAI|ING TRAINING SPECIALISTS DEILVEI N WORKSHOP
L- - -~ - -- LG LEVELE
DISTRICT LEVEL
AGR.C. AGRIC AGRIC. AGRIC.
SUFT.4
P SUPT. SUPT. SUPT.
AGR AGRIC. AGRIC AGRIC.
|ASST. (5) ||ASST. 18)I ASST. 181 ASST 151
FARMERS
11 Chefn Enginneteriould Se a Crodl Enginser, and would hawe tesaonsibilaRy 1ot Roads and Bulzdings as well as ooetall resEonsiblito
2Z Zonal Offelagnntn Oicemr to appoinn nsth.r Roads Engineer or Mechanical Engin-,r as Chief Engineer
1 In early years If Proje.t, some posItions will be staffed by Highen Agric. SperIlntendents
VI In ::el, Feats of Pnoiaet some PBsitions -ill bF staetd b- Senmor Agrro. Assistants.
51 In nVely ye3rs of Projett, some tPEsii-s will ba etafted by F ield Oew sane1

NIGERIAKANO AGRICULTURAL DEVELOPMENT PROJECTKano Agricultural Supply Company Limited (KASCO)
Organization Chart
BOARD OF I lDIRECTORS
MANAGINGDIRECTOR
IrICOMMERCIAL FINANCE ADMIN INTERNAL
ASST. COMMERCIAL DIVISION DIVISION DIVISION AUDITMANAGERZ/ _ MANAGER - CONTROLLER COMPANY INTERNAL
MANAGER CONTROLLER SECRETARY AUDITOR
1 ZONAL FINANCE ASSETS AUDITSTORAGE MANAGEMENT ACQUISITION] REGISTER SUPERVISOR
SUPERINTENDENT MANAGER
l l -| PAYROLL | |PERSONNEL AUDIT
TEAM
~~[ _ I _| ~~BAN K ACCOUNTSSECU~R ITY
STORAGEADVISERS
|BOUGHT/SOLD_ LE DGER
COMMERCIALSUPERVISION
SUPERVISOR3J DEBTORCONTROL
MANAGER/COOP COSTSECRETARY 4 ACCOUNTANT]
- -- - ~Technical SupervisionCASHIER
NOTES:
il The Board of Directors consists of the Advisor to the Governor on Agriculture and Rural Development (Chairman), PermanentSecretary, MANR, the Chief Registrar of Cooperatives, one representative from each of the Kano State Ministries of Finance andRural and Community Development, two Farmers, the Program Manager, KNAPMU, and the Managing Director, KASCO.
v The Assistant Commercial Manager would be primarily responsible for input transport and distribution./ About 19 Commercial Superintendents and 10 Supervisors to be hired. Deployment will be related tD
LGAs and the concentration of FSCs in each zone. Fadama areas will require greater supervisory input.
December 1980
World Bank - 21828

I B R D 15065R
'M~~~~~~~~~~~~rAU "E ~~~~~~~~~~~~~~~~~~~~~~~NIGERIA''i t~~~A r~~¾ IBRD Assisted Agricultural Projects
Completed and AppraisedB - ~~~~~Agricultural Development Projects
__COMPLIEID:
Pantue (Loan 092-UNi)Goaao(Loa- 1099- UNI)G-abe (Loas1164- UNI(SOKOTO STATE~~~~~~~~~~~~~~N EITIG
B 0 R N 0 ~~~~~~~~~~~~~~Lafin (Loan1454-UNI)0 K ,Q: KAN AICJ 5 ~~~~~~~~~~~~~~~~~~~~~~~~~~~~~~~~~~~~Apoagha lL.on1455-UNII
EAISUGUnI Bide (Loan 1667 - UNI1)Ionic Loon 1668-UNI(
SORT/C SlATE G~~~~~~~~~~~~yo North (Loan IBSaUN1IEkati Aokok (Loan1B54-UINIIB-rohi StateRena State.4APPRAISEO:
i t K.d..o Stt.~~~~~~~~~~~~~~~~~~~~~~~~~~~~~~~~~~~~~~~~~~~~~~~~~~~~~~~~~~oht tr
RM ~ ~ ~ ~ ~~~- es 1UNDER PREPARATION:
mA..b State4. N ~~~~~~~~~~~~~~~~~~~~~~~~~~~~~~~~~~~~~~~~~~~~~~~~~~~~~~~~Beedel Nerth
Ri.ers store
Ir P L A T E A U ~~~~~~~~~~~~~~~~~~~~~~~~~~~~~~~~NTraining Projects:
"N. "1j ~Agr"Ict.ael end Reral
FEDEPAL ~~~~~~~~~~~~~~~~~~~~~~~~~~~~~~~~~~~~~Mana.gement Training lestiutetw ag, CAPITAI I (~~~~~~~~~~~~~~~~~~~~~~~~~~~~~~~~~~~~~~~~~~Loan 1719%UNI)q; b ~~~~~~~~~~~~~~~~~~~~~~~~~~~~~~~~~~~~~~~~~~~~~~~~~~~~~~Tree Crop Projects:
EXISTING
4! ~~~~~~Cocon I ( Loan 764- UN I)I and[ ] Cocoa Ir (Loan 1045 -UNI)MAK ~~~~~~~~~~~~~~~~~~~~~~~~~~~~~~~~Ondo Gil Palm (Lo..nt1192- UNI(
Z1 Bende1 Gil Polo (Loan118 tB-UNI(Ion GOl Palo (Loan 1I9PPUN))A.111. Al I~~~~~~~~~~~~~~~~~~~~~~~~~~~~~~~~~~~~~~~~~~~~~~~~~~~~~~Rvr treGlPlloa 55UI
I ~~n MOTh PorentF-p (Loan,1679PUNI(
APPRAISED'
too erAs' u"nraatOnOr ~~~~~~Cros River State Estat (Oil Pe1i,,I
ceneaaI/Z~aeu4e - ot S ,.no4-n,ii"'ioIrrigation Project:
rO E$iesEe ,ae Ron (Loano1 10O-UNl()
S ( uani ( .~~~~~~ sniessEs 5O55t%5~~~~~~~ i( j 0'Tir"' I ~~~~~Livestock Development Project:(Loon 1091 -UN()g, '4~~o.s
A SGeak EXISrING:ruonniA tt U ~~~~~~National Livestock Production Co. Ranches
sty ~.. u~ r' A NortkE-atern Co RanchesU Animal / P-aror In-eatigai Centers
O adE [3 ] Graing Re Frcs- oln Group RancheBight of Bonn OOsrae-ggrJ~~~~~~~~~~~~~~~~A


I B G B * 1 0 ,8./ rIR
/.7; /A Z RA R I HonoA r
:, ~ ~ ~~~ ~ ~ ~~~GUM'A DELA
N P~~~~~~~~~~~~~~Roj oN l BoG daM e
0 KI
f A H 5 A~~~~~~~~~~ ranngCntr
N '3 ' A I ,v, edeal.! Cla 1 AGRoa I LeAuRIs TURAL DEVELOPMENT PROJECT
\ bv5t$zKvM,,'013 Js.
x \s P \ / Fi I S 0 \ > I~~~~~~~~I L
VOOS t ;K^~~~~~~~~~~~~~~~~~~N° MILE PrnS t4stt9t0 D°etZnlHoqoe
<e I ~o> -. -'-- i - Railway _- Local Covernnment Area Bouodarbes
1t olo >, Dm ternatianal Boundary womv c ev vvin,5,v.ro vift
C e r < / ~~~~~cvsMEtCtO Or <rfto'R vvrnei :es.,,, _= * _inp
4ra5t! t2 / - >_RmsbdorlZ~ ~Ant 00flll Wvieda,suiv.et,rmo s
4r i' -- fmerbarmclRf~~~vurnier om.imevfehroei


![Semiconductor Devices [Kanaan Kano]](https://img.pdfslide.us/doc/110x75/55cf931a550346f57b9bb747/semiconductor-devices-kanaan-kano.jpg)