Embed Size (px)
Citation preview
Policy, Planning, and Research
WORKING PAPERS
I Macroeconomic Adjustmentand Growth
Country Economics DepartmentThe World Bank
June 1989WPS 234
A Consistency Frameworkfor Macroeconomic Analysis
William Easterly
Illustrating with data for Colombia and Zimbabwe, Easterlypresents a consistency framework useful for checking projec-tions or constructing macroeconomic models, reconciling sepa-rate accounts for the government, monetary system, nonfinan-cial private sector, balance of payments, and national accounts.
The Policy, I'lanning, and Rescarch Cormplcx diinsbutes I'PR %'orking Paperc in disseymnaic the finding, of s ork in progrc,ss and tocncouragc he exchangc of ideas among 1ank staff and all oLhers nn:crcstcd in decs c:pm.cnt isses lhics papers carry thc namcs ofthe authors, rcflex only thcir vicws, and should hc uscd and cited acc,rdingiK 'Ihef nd:ngs. tnterpretaUo ns. and conclusions are theauthors nson. Tcy should no bc atxnhutcd in thc %''ir:d H3ank, iLs H0ard of l):rcctors, iLs nanagemeni. or ant yof its ma,ner countnes
Pub
lic D
iscl
osur
e A
utho
rized
Pub
lic D
iscl
osur
e A
utho
rized
Pub
lic D
iscl
osur
e A
utho
rized
Pub
lic D
iscl
osur
e A
utho
rized

Policy, Planning, and Research
HN.1 "N i1 .14 1m
Macroeconomic Adjustmentand Growth
Consistency is a hobgoblin (to borrow a phrase invaluable in defining the structure of the model.from Emerson) that macroeconomists cannot The consistency framework is not itself a model,avoid. Macroeconomic consistency is the which can be used to do projections. It is arequirement that budget constraints be observed. generic check on any projection done by anBudget constraints do not uniquely determine a explicit or implicit behavioial model.particular economic outcome, but they do allow Easterly's consistency framework foranalysts to rule out many outcomes when they macroeconomic analysis includes five accounts,have some notion of "reasonable" behavior. in current prices: government, monetary systemOften this is enough to evaluate whether a nionfinancial private sector, balance of paymentsparLicular adjustment scenario is feasible. What and national accounts. Easterly presents these atseems at first to be a reasonable projection may individual accounts, then integrates thembe revealed as highly unlikely when aiialyzed in through a matrix of income, expenditures,a full consistency framework. savings, and accumulated assets and liabilities.
Even where a fully specified behavioral Examples of estimation of the frameworkmodel is desired, the consistency relations are are presented for Colombia and Zimbabwe.
This paper is a product of the Macroeconomic Adjustment and Growth Division,Country Economics Department. Copies are available free from the World Bank,1818 H Street NW,Washington DC 20433. Please contact Raquel Luz, room Nil-057, extension 61760 (39 pages with tables).
_ _ _ _ _ _ _ _ _ _ _ _ _ m
The PPR Working Paper Series disscminates the findings of work undcr way in the Bank's Policy. Planning, and ResearchComplex. An objective of the seT;Cs is to get thcse findings out quickly, even if presentations are less than fully polished.The findins, interpretations, and conclusions in these papers do not neecssarily represent official policy of the Bank.
Produced at the PPR Dissemination Center

A Consistency Framework for Macroeconumic AnLlysis
byWilliam Easterly
Table of Contents
Introduction: why do we need consistency? 1
A hypothetical example of consistency problems 2
A consistency framework for macroeconomic analysis 4
1. Individual accounts 4
2 Matrix presentation 8
Problems of estimation 12
Country examples 13
'. Colombia 14
2. Zimbabwe 18
Conclusion 19
Bibliography 25
Appendix: country applications 26
Tnis paper has benefited from the collaboration of Klaus Schmidt-Heb)'eland Ali Khadr, the guidance of John Holsen and Vittorio Corbo, and theresearch assistance of Susan Hume and Perla Aizenman. Comments of otherCECMG staff and Bela Balassa have also been very useful.

Introduction: wh; do we need consistency?
Is consistency *the hobgoblin of little minds," as Emerson once
said? Since consistency is often tedious to enforce, it is important to
remember for what purpose it is required in macroeconomics. Consistency is
simply the requirement that budget constraints be observed for all
participants in the economy.
Budget constraints appear at the economy-wide level in the form of
four familiar macroeconomic identities. The national accounts identity tells
us that tocal income from domestic production (value added) equals total
expenditure on domestic production (total consumption, total investment, and
net exports). This can be rearranged to give the identity that total saving
(including foreign saving) must equal total investment. The fiscal identity
equates the excess of public sector expenditure over income with total public
sector borrowing and money creation. The balance of Payments identity
similarly equates the excess of foreign exchange expenditure over earnings
with foreign borrowing and reserve changes. The monetary identity tells us
thaL the increase in the money supply corresponds to the increase in domestic
credit and foreign reserves. These identities imply as a residual the private
sector budget constraint, but this is seldom included explicitly in
macroeconomic analysis.
A basic consistency framework should require that all of these
identities -- as well as the private sector budget constraintl -- be
simultaneously satisfied. If oae or more of the identities is left out of an
1 The private sector budget constraint would be analogous to the otheridentIcies -- that private income minus expenditure equal private net';inancAal asset accumulation.

economic projection, the implicit values for the components of the missing
identity may take unrealistic values. Since the private sector is often the
residual, there may be unrealistic projections for private saving or money
demand. Even if all the identities are included, they may be satisfied in an
inconsistent way. For example, one estimate of government foreign borrowing
might be used for the balance of payments while a different one might be used
for the fiscal accounts.
However, a consistency framework is not in itself a model, such as
could be used to do projections. It is a generic check on any projection done
by an explicit or implicit behavioral model. It also could be used as the
foundation for construction of a macroeconomic model.
A hypothetical example of consistency problems
A hypothetical example may help illustrate the consistency problems
that are likely to arise when a complete fremework is not used. Suppose that
an economic report projects an increase in growth in country X from its
present (1988) anemic rate of 2.4 percent to 4.8 percent by the year 2000. To
support this increase in growth, the rate of investment is projected to double
from 12 percent of GNP to 24 percent of GNP. At the same time, it is
projected that the current worrisome fiscal deficit of 6 percent of GNP is
gradually reduced to zero by the year 2000, financed entirely by increases in
taxes. Public investment and consumption stay constarnt at 6 percent and 10
percent of GNP respectively. Inflation is projected to remain constant at 10
percent per year. Finally, it is projected that the current account deficit
will remain stable at 3 percent of GNP.
Is this projection consistent? Yes, but only at very unrealistic
values for private sector investment, saving, and financial behavior. The
private investment ratio increases by a factor of three, from 6 percent of GNP
-3
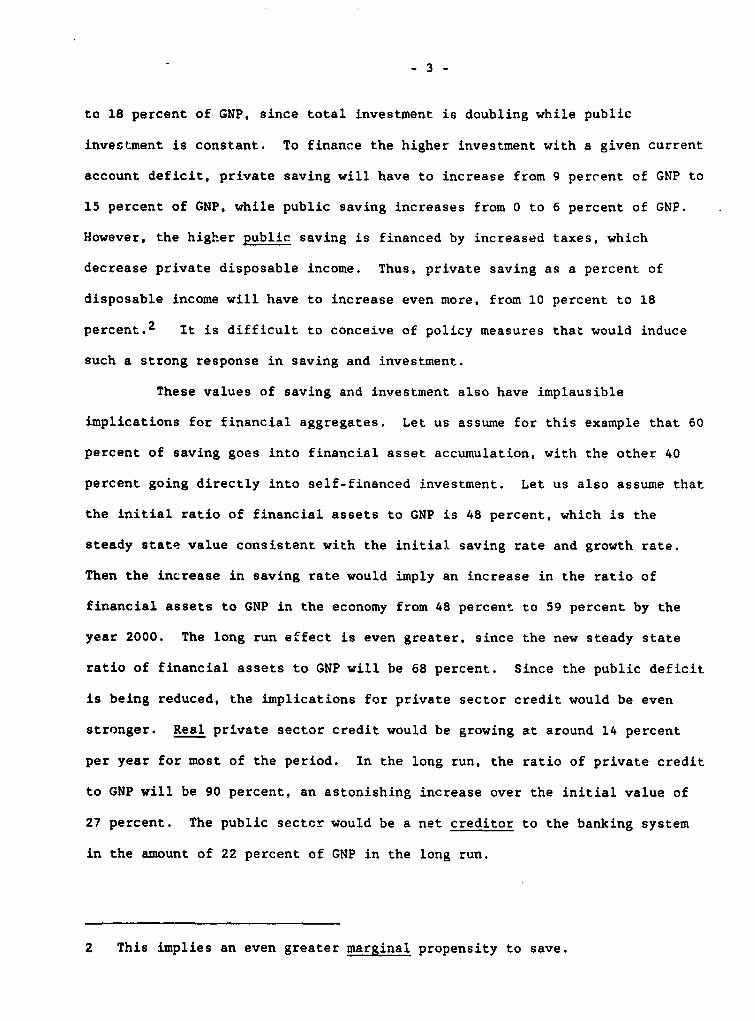
to 18 percent of GNP, since total investment is doubling while public
investment is constant. To finance the higher investment with a given current
account deficit, private saving will have to increase from 9 percent of GNP to
15 percent of GNP, while public saving increases from 0 to 6 percent of GNP.
However, the higher public saving is financed by increased taxes, which
decrease private disposable income. Thus, private saving as a percent of
disposable income will have to increase even more, from 10 percent to 18
percent.2 It is difficult to conceive of policy measures that would induce
such a strong response in saving and investment.
These values of saving and investment also have implausible
implications for financial aggregates. Let us assume for this example that 60
percent of saving goes into financial asset accumulation, with the other 40
percent going directly into self-financed investment. Let us also assume that
the initial ratio of financial assets to GNP is 48 percent, which is the
steady state value consistent with the initial saving rate and growth rate.
Then the increase in saving rate would imply an increase in the ratio of
financial assets to GNP in the economy from 48 percent to 59 percent by the
year 2000. The long run effect is even greater, since the new steady state
ratio of financial assets to GNP will be 68 percent. Since the public deficit
is being reduced, the implications for private sector credit would be even
stronger. Real private sector credit would be growing at around 14 percent
per year for most of the period. In the long run, the ratio of private credit
to GNP will be 90 percent, an astonishing increase over the initial value of
27 percent. The public sector would be a net creditor to the banking system
in the amount of 22 percent of GNP in the long run.
2 This implies an even greater marginal propensity to save.
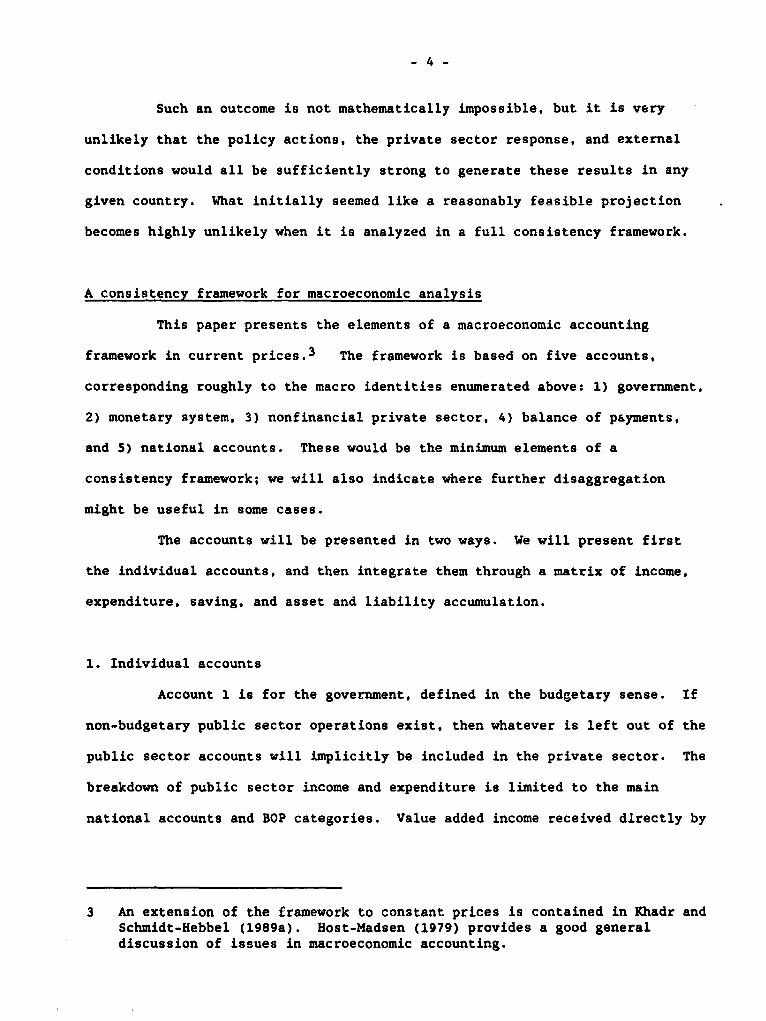
Such an outcome is not mathematically impossible. but it is very
unlikely that the policy actions, the private sector response, and external
conditions would all be sufficiently strong to generate these results in any
given country. What initially seemed like a reasonably feasible projection
becomes highly unlikely when it is analyzed in a full consistency framework.
A consistency framework for macroeconomic analysis
This paper presents the elements of a macroeconomic accounting
framework in current prices.3 The framework is based on five accounts,
corresponding roughly to the macro identities enumerated above: 1) government,
2) monetary system, 3) nonfinancial private sector, 4) balance of payments,
and 5) national accounts. These would be the minimum elements of a
consistency framework; we will also indicate where further disaggregation
might be useful in some cases.
The accounts will be presented in two ways. We will present first
the individual accounts, and then integrate them through a matrix of income,
expenditure, saving, and asset and liability accumulation.
1. Individual accounts
Account 1 is for the government, defined in the budgetary sense. If
non-budgetary public sector operations exist, then whatever is left out of the
public sector accounts will implicitly be included in the private sector. The
breakdown of public sector income and expenditure is limited to the main
national accounts and BOP categories. Value added income received directly by
3 An extension of the framework to constant prices is contained in Khadr andSchmidt-Hebbel (1989a). Host-Madsen (1979) provides a good generaldiscussion of issues in macroeconomic accounting.
-5-
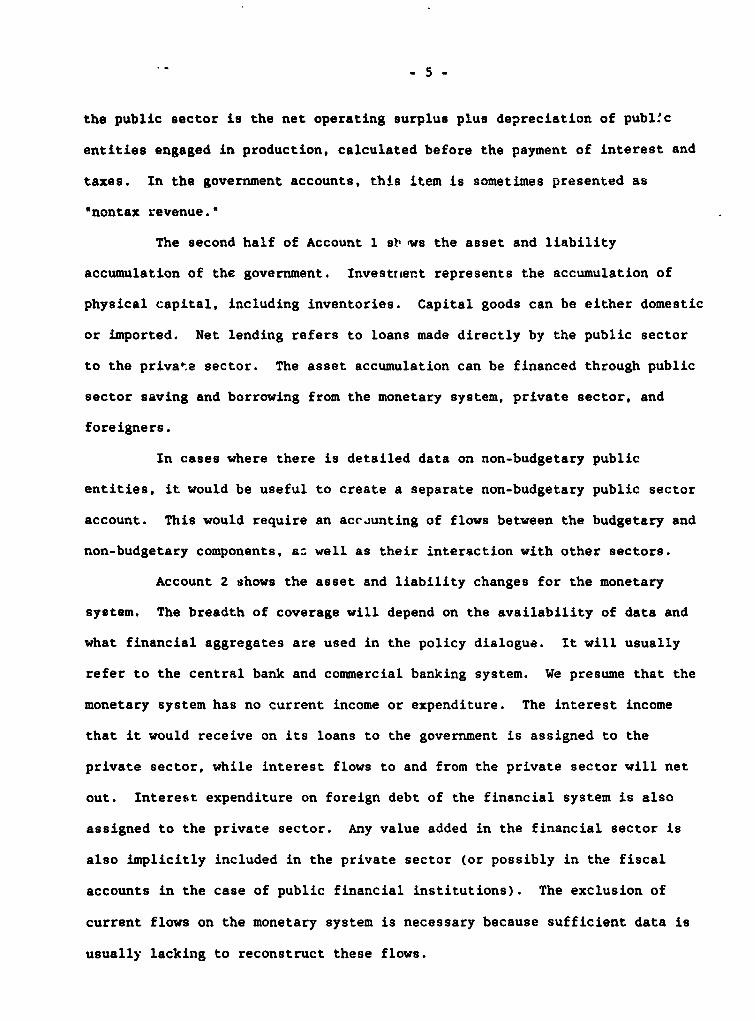
the public sector is the net operating surplus plus depreciation of publ'c
entities engaged in production, calculated before the payment of interest and
taxes. In the government accounts, this item is sometimes presented as
nontax revenue."
The second half of Account 1 sb ws the asset and liability
accumulation of the government. Investriert represents the accumulation of
physical capital, including inventories. Capital goods can be either domestic
or imported. Net lending refers to loans made directly by the public sector
to the private sector. The asset accumulation can be financed through public
sector saving and borrowing from the monetary system, private sector, and
foreigners.
In cases where there is detailed data on non-budgetary public
entities, it would be useful to create a separate non-budgetary public sector
account. This would require an accounting of flows between the budgetary and
non-budgetary components, a_ well as their interaction with other sectors.
Account 2 shows the asset and liability changes for the monetary
system. The breadth of coverage will depend on the availability of data and
what financial aggregates are used in the policy dialogue. It will usually
refer to the central bank and commercial banking system. We presume that the
monetary system has no current income or expenditure. The interest income
that it would receive on its loans to the government is assigned to the
private sector, while interest flows to and from the private sector will net
out. Interest expenditure on foreign debt of the financial system is also
assigned to the private sector. Any value added in the financial sector is
also implicitly included in the private sector (or possibly in the fiscal
accounts in the case of public financial institutions). The exclusion of
current flows on the monetary system is necessary because sufficient data is
usually lacking to reconstruct these flows.
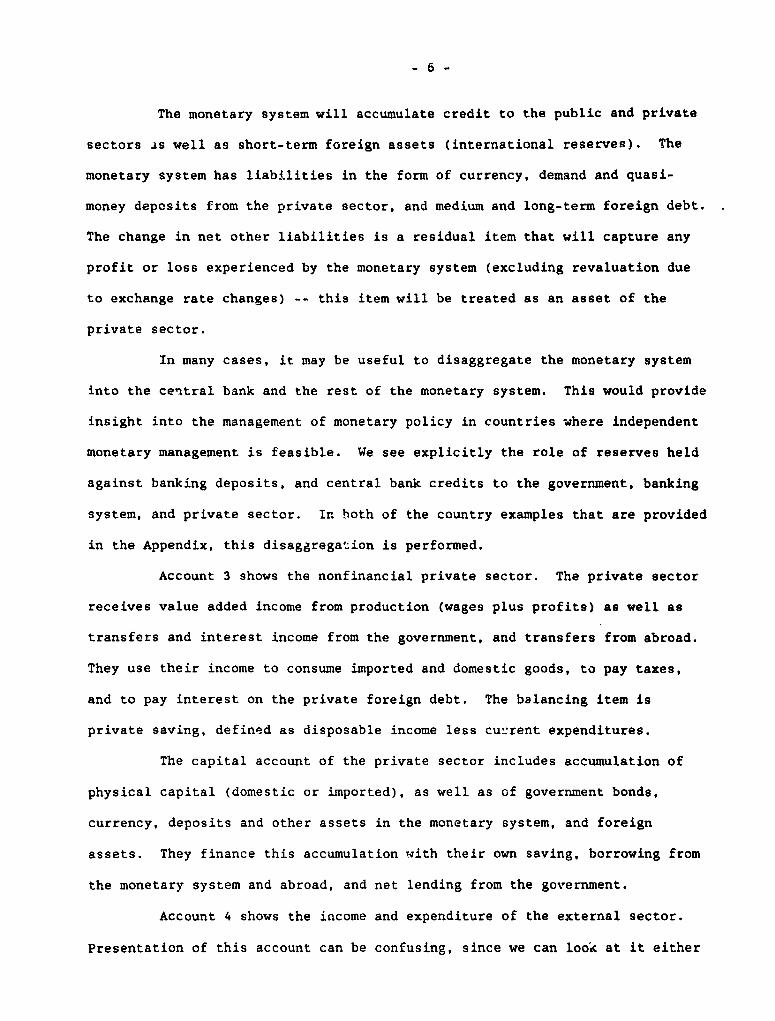
The monetary system will accumulate credit to the public and private
sectors as well as short-term foreign assets (international reserves). The
monetary system has liabilities in the form of currency, demand and quasi-
money deposits from the private sector, and medium and long-term foreign debt.
The change in net other liabilities is a residual item that will capture any
profit or loss experienced by the monetary system (excluding revaluation due
to exchange rate changes) -- this item will be treated as an asset of the
private sector.
In many cases, it may be useful to disaggregate the monetary system
into the ceitral bank and the rest of the monetary system. This would provide
insight into the management of monetary policy in countries where independent
monetary management is feasible. We see explicitly the role of reserves held
against banking deposits, and central bank credits to the government, banking
system, and private sector. In both of the country examples that are provided
in the Appendix, this disaggregation is performed.
Account 3 shows the nonfinancial private sector. The private sector
receives value added income from production (wages plus profits) as well as
transfers and interest income from the government, and transfers from abroad.
They use their income to consume imported and domestic goods, to pay taxes,
and to pay interest on the private foreign debt. The balancing item is
private saving, defined as disposable income less current expenditures.
The capital account of the private sector includes accumulation of
physical capital (domestic or imported), as well as of government bonds,
currency, deposits and other assets in the monetary system, and foreign
assets. They finance this accumulation with their own saving, borrowing from
the monetary system and abroad, and net lending from the government.
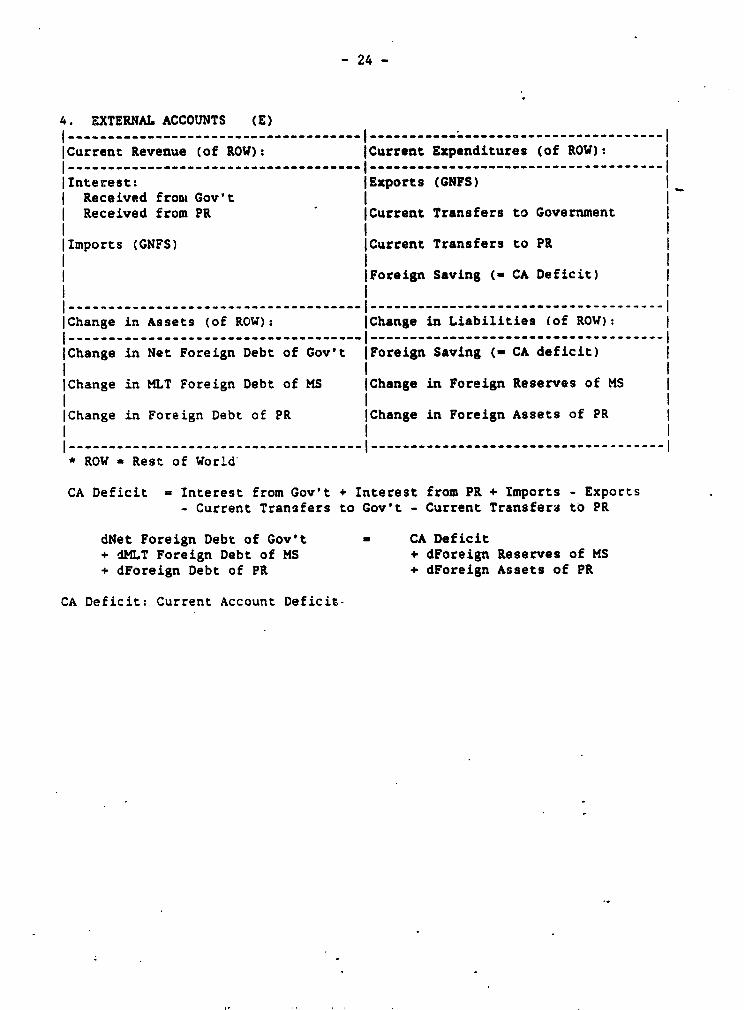
Account 4 shows the income and expenditure of the external sector.
Presentation of this account can be confusing, since we can look at it either

-7-
from the point of view of the rest of the world (ROW) or of nationals. To be
consistent with the other accounts, it is presented here from the point of
view of ROW, which means that imports are treated as income (of ROW) and
exports are treated as expenditure (of ROW). Similarly, external borrowing is
viewed as asset accumulation by ROW.
Foreign exchange outlays in the current account (income of ROW) are
divided into interest on public ana private foreign debt and imports.
Interest on public debt could be defined in net terms by subtracting interest
earned on foreign exchange reserves from interest paid on public foreign debt.4
It may be useful to break down imports into consumption imports (public and
private), investment imports (public and private), and intermediate imports.
However. it may not be possible in many cases to disaggregate imports in which
case only total imports will be estimated.
Foreign exchange receipts (expenditure of ROW) are broken down into
exports and transfers (public and private). It may be desirable in some cases
to disaggregate exports further into, for example, traditional and
nontraditional categories. In some countries, nonfinancial factor income
(such as wage remittances) may also need to be included. The balancing item
in the current account is foreign saving, which is equivalent to the current
account deficit.
The financing of the current account deficit is given in the capital
account part of Account 4. The public sector, monetary system, and private
sector all borrow abroad. The monetary system accumulates foreign assets in
the form of international reserves. The international reserves should be
defined in a way consistent with the standard definition used in the policy
4 This would be appropriate if interest on reserves are passed from thecentral bank to the budget. In other cases, this interest would have tobe treated as private sector income.

dialogue. The private sector accumulation of assets could also be estimated
when capital flight data is available. This can be estimated on the basis of
the *errors and omissions" and "capital NEI* lines of the BOP in some cases.
Accumulation of foreign assets by the government could be accomodated by
defining their debt in net terms. The change in foreign debt and assets
should exclude revaluation changes resulting from devaluation of the domestic
currency or cross-currency rate changes. While this paper excludes capital
gains and losses, an extension of the framework to include them is presented
in Khadr and Schmidt-Hebbel (1989a).
The foreign currency figures of the balance of payments should be
converted into domestic currency with the average official exchange rate for
each period. In countries with multiple or parallel exchange rates, more
complicated adjustments may be necessary.
The national accounts follow from the previous accounts. GDP is
broken down on the income side into private sector value added, public sector
value added (retained profits by state enterprises), indirect taxes, and
subsidies (entering with a negative sigrn. On the expenditure side, GDP is
disaggregated into consumption (public and private), investment (public and
private), and net exports (exports minus imports). Tb-e capital account
counterpart is the saving-investment identity, where the sum of public and
private investment must equate to the sum of public, private, and foreign
saving.
2. Matrix presentation
Although the individual accounts give a comprehensive presentation of
the flows in the consistency framework, it is helpful to integrate the
accounts so that they are mutually consistent. For this, a useful device is a
matrix of sources and uses for the four sectors plus the national accounts.

-9-
The matrix can be seen as a combination of the flow-of-funds (FOF)
and social accounting matrix (SAM) approaches to macroeconomic accounting.
The FOF methodology emphasizes the equality of sources and uses of funds.
distinguished between current and capital accounts. The version of the kOF
methodology underlying this framework is that presented in Holsen (1989).
The SAM approach presents the standard macroeconomic identities
(savings-investment, income-expenditure) in a form that shows the
participatiot of each economic agent in the economy. The SAM has
traditionally been used for ana'.7sis of the real economy, as in general
equilibrium models, and thus covered only real variables. However, it has
recently been extended to cover real-financial interactions as well (Easterly
(forthcoming), Taylor and Rosensweig (forthcoming)).
The matrix has the advantage that it captures the strong points of
both the SAM and FOF approaches. The matrix presentation has the appealing
feature that the row sums must equate to the sums of the corresponding
columns. This allows us to verify at a glance that the accounts are
consistent. Like the SAM, it also presents the main macroeconomic identities
in a transparent way. Thus the first row is the conventional GDP identity
from the expenditure side, while the first column is the GDP identity from the
income side. The last row and column give the identity of saving and
investment.
As in the FOP approach, the matrix stresses the identity of sources
and uses, distinguished between current and capital accounts. The upper left
hand 5 x 5 corner of the matrix presents the current part of each of the five
accounts (although the current account of the monetary system is left empty as
explained earlier).
The remainder of the matrix records the capital account transactions
for each sector. The connecting link between the two is the saving of each
- 10 -
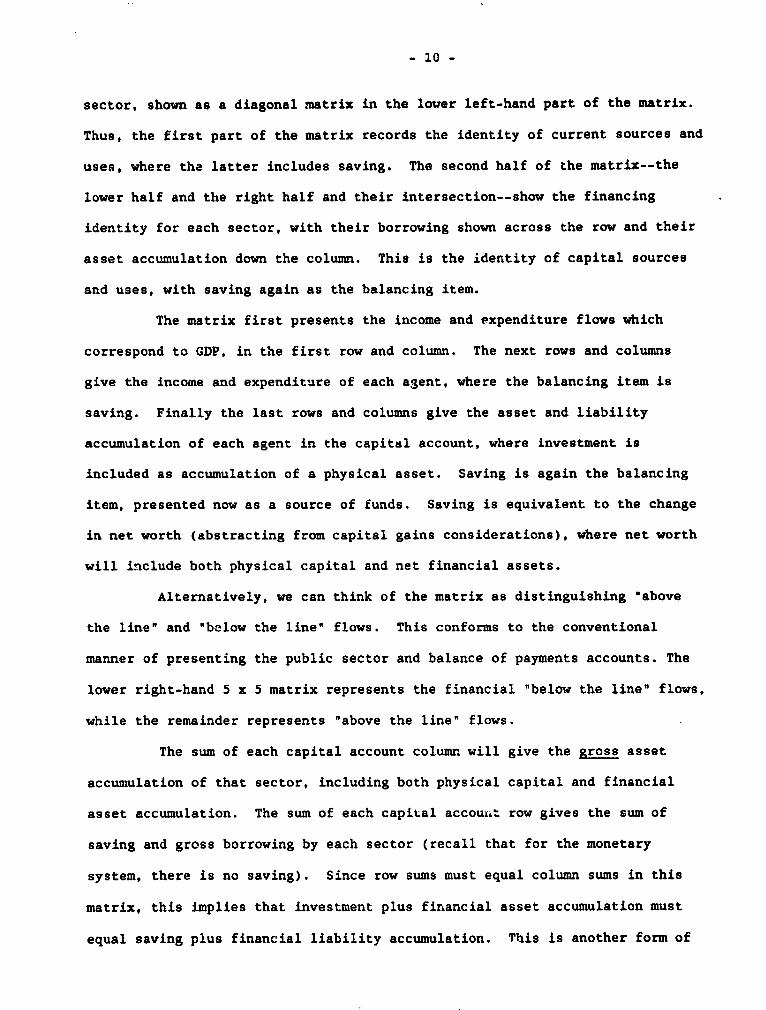
sector, shown as a diagonal matrix in the lower left-hand part of the matrix.
Thus, the first part of the matrix records the identity of current sources and
uses, where the latter includes saving. The second half of the matrix--the
lower half and the right half and their intersection--show the financing
identity for each sector, with their borrowing shown across the row and their
asset accumulation down the column. This is the identity of capital sources
and uses, with saving again as the balancing item.
The matrix first presents the income and expenditure flows which
correspond to GDP, in the first row and column. The next rows and columns
give the income and expenditure of each a3ent, where the balancing item is
saving. Finally the last rows and columns give the asset and liability
accumulation of each agent in the capital account, where investment is
included as accumulation of a physical asset. Saving is again the balancing
item, presented now as a source of funds. Saving is equivalent to the change
in net worth (abstracting from capital gains considerations), where net worth
will include both physical capital and net financial assets.
Alternatively, we can think of the matrix as distinguishing "above
the line" and "below the line" flows. This conforms to the conventional
manner of presenting the public sector and balance of payments accounts. The
lower right-hand 5 x 5 matrix represents the financial "below the line" flows,
while the remainder represents "above the line" flows.
The sum of each capital account column will give the gross asset
accumulation of that sector, including both physical capital and financial
asset accumulation. The sum of each capital accourit row gives the sum of
saving and gross borrowing by each sector (recall that for the monetary
system, there is no saving). Since row sums must equal column sums in this
matrix, this implies that investment plus financial asset accumulation must
equal saving plus financial liability accumulation. This is another form of

- 11 -
the familiar identity that saving minus investment equals net financial asset
accumulation for each sector.
For the monetary system, which has neither saving nor investment,
this identity requires that the change in its net financial position is zero.
This necessitates a residual item, called here "net other liabilities", which
often appears explicitly in the primary data source.
The example of the public sector may be helpful in clarifying the use
of the matrix. Reading across the row for public income (current sources), we
get public value added and indirect taxes minus subsidies and direct taxes
from the private sector. (Direct taxes are in turn an expenditure (or use)
for the private sector.) Reading down the column for the public sector we
get current expenditures such as government consumption, transfers, and
interest payments. The balancing item that ensures the sum of the column
entries will be equal to the sum of the row entries is government saving. By
definition, saving plus current expenditure must equal current income.
The second part of the matrix will give the capital account of the
public sector. Reading down the capital acceant column fo: the public sector,
we see asset accumulation in the form of purchases of capital goods
(investment) plus net lending to the private sector. This asset accumulation
will be financed by public sector saving (which could be negative), and
borrowing from the monetary system, private sector, and foreigners. Thus,
total capital sources (including saving) will equal total capital uses. To
put it another way, the public deficit -- public saving minus public
investment -- will be equivalent to net borrowing from other sectors.
It may also be helpful to explain the national accounts row of the
table in more detail. The first row gives the expenditure components of GDP.
The aggregate consumption and investment expenditures (government and private)
includes spending on both imported and domestic goods. Therefore, we have to

- 12 -
subtract imported goods expenditure from exports to obtain net foreign
exchange earnings, which will give us GDP when summed with total consumption
and investment. The imports are added back in further down the external
sector column, in the external sector row. Th'.s insures that that the external
sector column sum will be total current foreign exchange receipts, while the
external sector row sum will be total current foreign exchange payments.
Problems of estimation
It is important to recognize some of the practical problems involved
in estimating the consistent framework described above with historical data.
The historical numbers themselves are usually not consistent. This is because
the different sets of accounts -- national accounts, fiscal account., balance
of payments accounts, and monetary accounts -- use different accounting
methodologies. For example, the balance of payments and national accounts are
estimated on an accrual basis, while the fiscal accounts are on a cash basis.
The monetary accounts are often inconsistent with fiscal and balance of
payments accounts so that we get different estimates of surpluses or deficits
from "above the line* or "below the line".
To construct the accounts, we will thus often have to choose between
competing estimates of the same concept. For example, either the balance of
payments or national accounts could be used to estimate exports and imports of
goods and nonfactor services. In the estimation examples below we used the
BOP estimates, since these accounts are more readily available on a timely
basis. Private consumption then must be adjusted to preserve the national
accounting idertity.
Other items in the accounts can be estimated residually to preserve
accounting consistency. For example, in the Colombia estimates, the net
lending of the public sector to the private sector was estimated residually to

- 13 -
reconcile below the line financing with the estimated public sector deficit.
Similarly, private foreign asset accumulation was estimated residually to
reconcile foreign debt flows with the estimated current account deficit.
These residuals will absorb the measurement errors and methodological
inconsistencies in the accounts, and so should not be interpreted too
literally. Where such residuals are excessively large, further work is needed
to identify the source of the inconsistency.
Even substantial inconsistencies in the historical data do not
necessarily render invalid the consistency exercise, whose purpose is to
provide a framework for projections or analysis of policy tradeoffs. If we
presume that the size of the inconsistency will remain within a limited range
over time, then it will still be possible to use the framework for analysis of
the future. The principle of enforcing budget constraints holds even if the
historical data do not precisely fit these constraints. Measurement errors in
accounting identities are analogous to stochastic error terms in behavioral
equations -- in both cases the model remains useful even though it does not
fit the data exactly.
Country examples
The appendix contains applications of this consistency framework to
historical data for Colombia and Zimbabwe. It may provide additional insight
to analyze what these applications tell us, and to indicate how implicit or
explicit behavioral relations would be added. The analysis of historical data
is purely for illustrative purposes -- usually this kind of a framework would
be used as a basis for a projection or for a counter-factual simulation.

- 14 -
1. Colombia
The appendix shows the matrix of 1986 flows for Colombia as a
percentage of GDP. We see that the public sector had a high rate of saving in
1986 (6.86S of GDP), which actually exceeded total public investment (5.33 +
1.34 - 6.67 2 of GDP).5 Despite this small public sector surplus, the
government borrowed abroad in significant amounts (2.03 Z of GDP). This
foreign borrowing was used to reduce government debt at the central bank in an
amount equal to 2.51 2 of GDP. The rest of the foreign borrowing, together
with modest borrowing from the financial system and directly from the private
sector, was used to finance net lending (i.e. development credits) to the
private sector in the amount of 0.58 2 of GDP.
The central bank had substantial inflows of foreign reserves to
accomodate in 1986, equal to 3.45 2 of GDP, because of the current account
surplus and substantial foreign borrowing. In this task, it would have been
helped by the repayment of debt owed to it by the government, except this was
mostly offset by credit expansion to the financial system (0.97Z percent of
GDP) and to the private sector (1.55Z of GDP). The latter is calculated as a
residual. In total, ti,e liabilities of the central bank expanded by an amount
equal to 3.46Z of GDP. However, as shown in account 2, only 1.74 t of GDP of
this amount corresponded to expansion of the monetary base. The remainder was
accounted for by nonmonetary liabilities sold to banks and the nonfinancial
public sector, and by foreign borrowing. The issuing of the nonmonetary
liabilities was a sort of open-market operation that allowed the central bank
to sterilize a substantial portion of the reserve increase.
5 Two decimal points are given to assist the reader in matching figures inthe text to those in the table. It is unlikely that the quality of thedata justifies such precision.
- 15 _
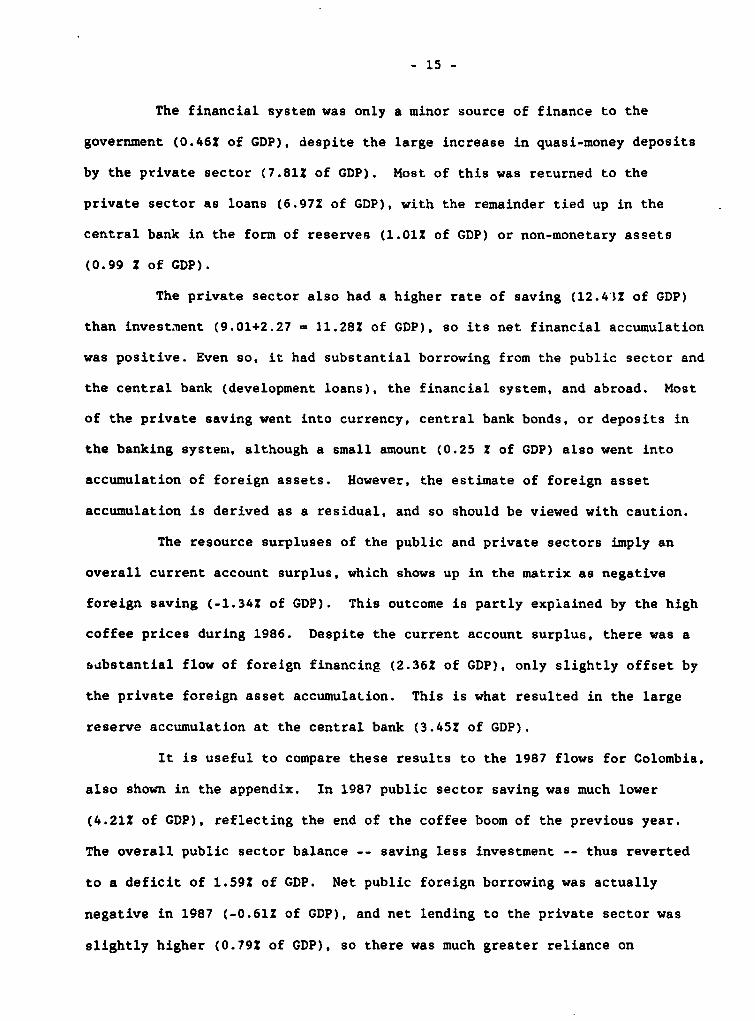
The financial system was only a minor source of finance to the
government (0.46Z of GDP), despite the large increase in quasi-money deposits
by the private sector (7.812 of GDP). Most of this was returned to the
private sector as loans (6.97Z of GDP), with the remainder tied up in the
central bank in the form of reserves (1.01Z of GDP) or non-monetary assets
(0.99 Z of GDP).
The private sector also had a higher rate of saving (12.43Z of GDP)
than invest.-ent (9.01+2.27 - 11.28Z of GDP), so its net financial accumulation
was positive. Even so, it had substantial borrowing from the public sector and
the central bank (development loans), the financial system, and abroad. Most
of the private saving went into currency, central bank bonds, or deposits in
the banking systenm, although a small amount (0.25 2 of GDP) also went into
accumulation of foreign assets. However, the estimate of foreign asset
accumulation is derived as a residual, and so should be viewed with caution.
The resource surpluses of the public and private sectors imply an
overall current account surplus, which shows up in the matrix as negative
foreign saving (-1.34Z of GDP). This outcome is partly expiained by the high
coffee prices during 1986. Despite the current account surplus, there was a
substantial flow of foreign financing (2.362 of GDP), only slightly offset by
the private foreign asset accumulation. This is what resulted in the large
reserve accumulation at the central bank (3.45Z of GDP).
It is useful to compare these results to the 1987 flows for Colombia,
also shown in the appendix. In 1987 public sector saving was much lower
(4.21Z of GDP), reflecting the end of the coffee boom of the previous year.
The overall public sector balance -- saving less investment -- thus reverted
to a deficit of 1.59Z of GDP. Net public foreign borrowing was actually
negative in 1987 (-0.61Z of GDP), and net lending to the private sector was
slightly higher (0.792 of GDP), so there was much greater reliance on
- 16 -
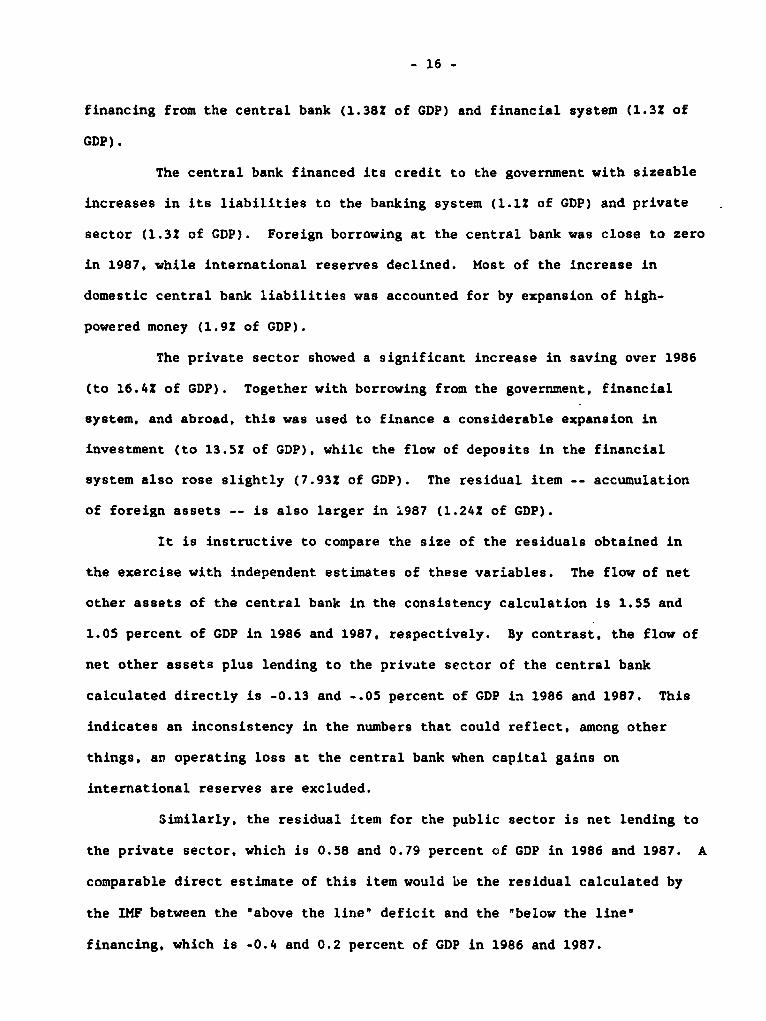
financing from the central bank (1.38? of GDP) and financial system (1.3? of
GDP).
The central bank financed its credit to the government with sizeable
increases in its liabilities to the banking system (1.1 of GDP) and private
sector (1.32 of GDP). Foreign borrowing at the central bank was close to zero
in 1987. while international reserves declined. Most of the increase in
domestic central bank liabilities was accounted for by expansion of high-
powered money (1.9? of GDP).
The private sector showed a significant increase in saving over 1986
(to 16.4? of GDP). Together with borrowing from the government, financial
system, and abroad, this was used to finance a considerable expansion in
investment (to 13.5? of GDP), while the flow of deposits in the financial
system also rose slightly (7.93Z of GDP). The residual item -- accumulation
of foreign assets -- is also larger in 1987 (1.24Z of GDP).
It is instructive to compare the size of the residuals obtained in
the exercise with independent estimates of these variables. The flow of net
other assets of the central bank in the consistency calculation is 1.55 and
1.05 percent of GDP in 1986 and 1987, respectively. By contrast, the flow of
net other assets plus lending to the private sector of the central bank
calculated directly is -0.13 and -.05 percent of GDP in 1986 and 1987. This
indicates an inconsistency in the numbers that could reflect, among other
things, an operating loss at the central bank when capital gains on
international reserves are excluded.
Similarly, the residual item for the public sector is net lending to
the private sector, which is 0.58 and 0.79 percent of GDP in 1986 and 1987. A
comparable direct estimate of this item would be the residual calculated by
the IMF between the "above the line' deficit and the "below the line"
financing, which is -0.4 and 0.2 percent of GDP in 1986 and 1987.

- 17 -
Finally, the residual for the balance of payments is foreign asset
accumulation by the private sector, in the amount of 0.25 and 1.24 percent of
GDP in 1986 and 1987. There is no direct estimate of this concept available,
but a comparable item would be the errors and omissions line of the balance of
payments. This shows 0.37 and 0.01 percent of GDP in 1986 and 1987.
These numbers should induce caution in interpreting any of the
residual estimates too literally. It is inevitable that there be some
discrepancy in attempting to reconcile the different accounts, as explained
earlier. How much discrepancy is tolerable will vary from one country to
another depending on the quality of the data available.
The numbers are also of limited relevance without introducing an
implicit or explicit behavioral model to analyze them, such as would be done
in a projection or a study of policy alternatives. For example, a portfolio
model of private sector demands for financial assets might be specified. We
then could ask what effect the shift towards domestic financing of the public
sector deficit during 1987 had on inflation (through a money demand equation)
and on interest rates (through an equation for portfolio demand for interest-
bearing financial assets). In a projection, the question might be posed as to
what interest rates and inflation would be necessary for the government to
obtain a particular level and composition of domestic financing. Similarly,
in a projection the consistency of foreign debt inflows and the current
account deficit with export and import performance -- based on the real
exchange rate, terms of trade, trade policy, etc. -- would need to be
explicitly modelled. This could be used to ask what real exchange rate would
be necessary to support a particular outcome.

- 18 -
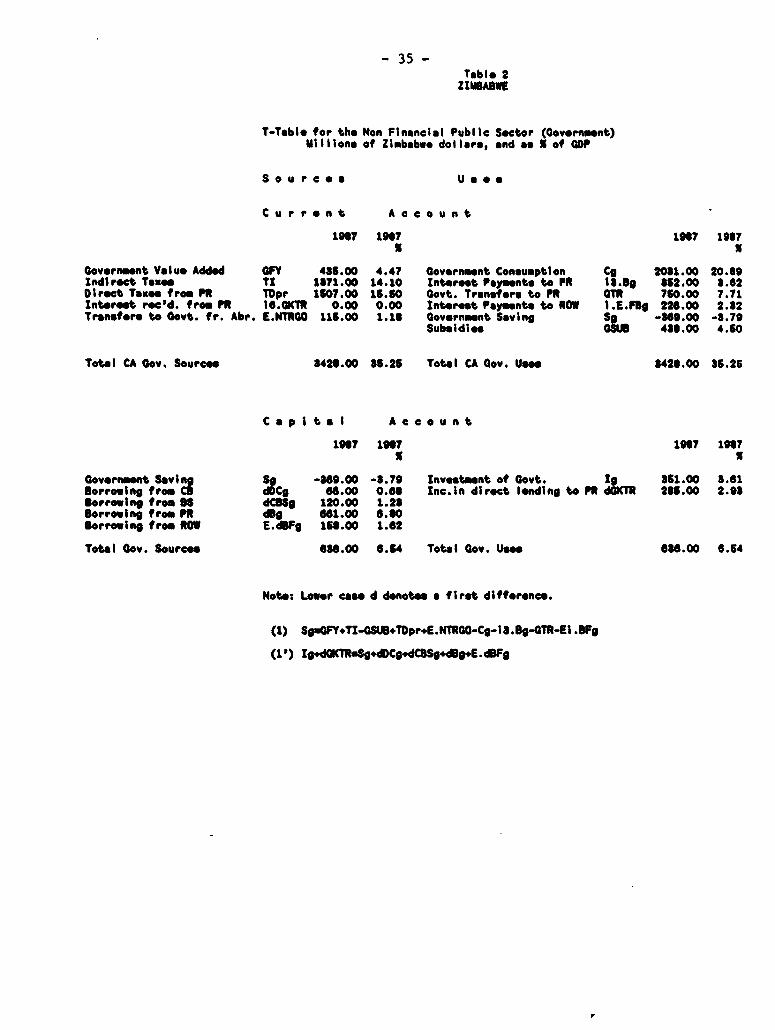
2. Zimbabwe
This example is based on a more detailed presentation contained in
Khadr and Schmidt-Hebbel (1989b). Their presentation also contains an
extension to constant prices.
The matrix of 1987 flo'ds for Zimbabwe (see Table 1) shows that public
dissaving was significant (3.82 of GDP). The overall public sector borrowing
requirement amounted to some 102 of GDP. Foreign borrowing and credit from the
financial system were both relatively modest (1.62 and 1.92 of GDP,
respectively). The bulk (6.82 of GDP) came from borrowing from the private
sector. Aside from public investment (3.62 of GDP) and public dissaving, the
remainder of government borrowing (2.92 of GDP) was used mainly to provide
capital transfers to parastatals, which are subsumed in the private sector.
For the central bank, foreign reserve inflows were significant in
1987 (2.32 of GDP). Total domestic credit expansion was negligible, but there
was a slight increase in credit to the government (0.72 of GDP) at the expense
of a contraction in credit to the private sector (which includes local
government and parastatals). There was also a minor entry for repayment of
foreign loans. The liabilities of the central bank therefore increased by
some 2.52 of GDP, predominantly in the form of commercial bank reserves.
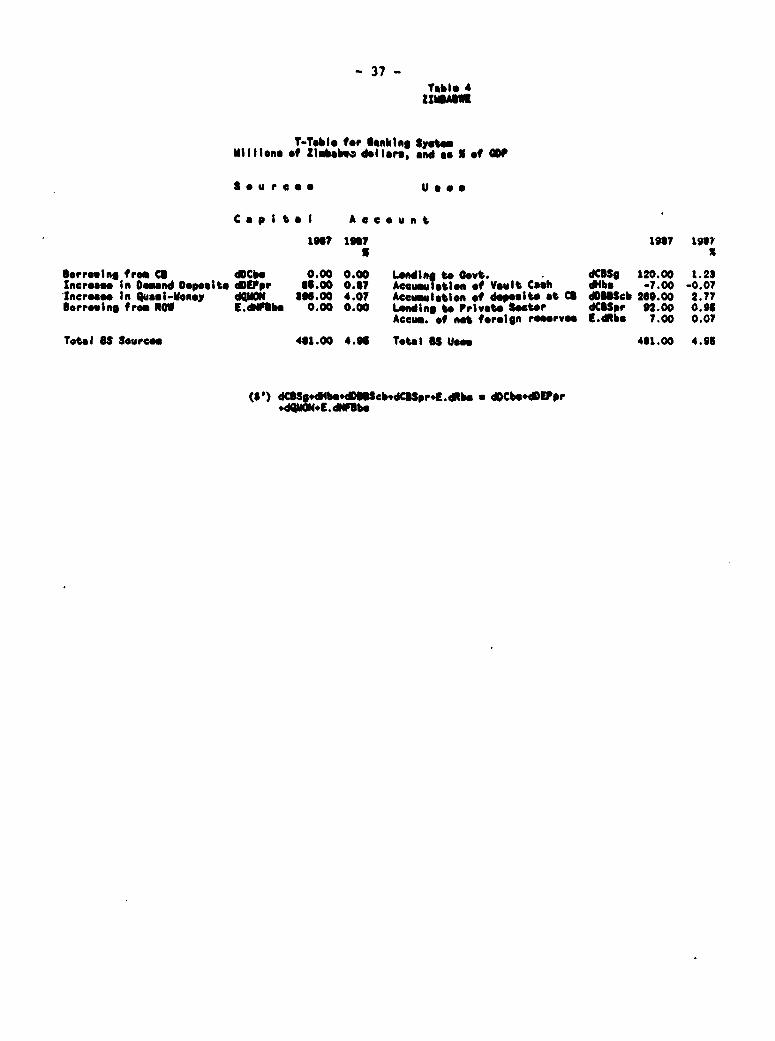
The banking sector was a modest source of finance to the government
(1.22 of GDP) and the private sector (0.92 of GDP) in 1987. More important was
the increase in reserves with the central bank (2.72 of GDP). The
corresponding increase in the liabilities of the banking system (5.02 of GDP)
took the form of an increase in demand deposits (0.92) and time deposits
(4.12).
The savings of the private sector (23? of GDP) significantly exceeded
its investment (152 of GDP) in 1987. This aside, capital flows to the private
sector included capital transfers from the government (mainly to parastatals)

- 19 -
(2.9? of GDP), loans from the banking system (0.92 of GDP) and foreign
borrowing (0.2Z of GDP). Uses in the private sector's capital account covered
lending to the government (ie. acquisition of bonds and Treasury bills) (6.8?
of GDP), an increase in holdings of currency and demand deposits (0.9Z of
GDP). an increase in quasi-money (4.1? of GDP), repayments to the central bank
(0.5? of GDP) and _isinvestment by foreign multinationals (0.42 of GDP).
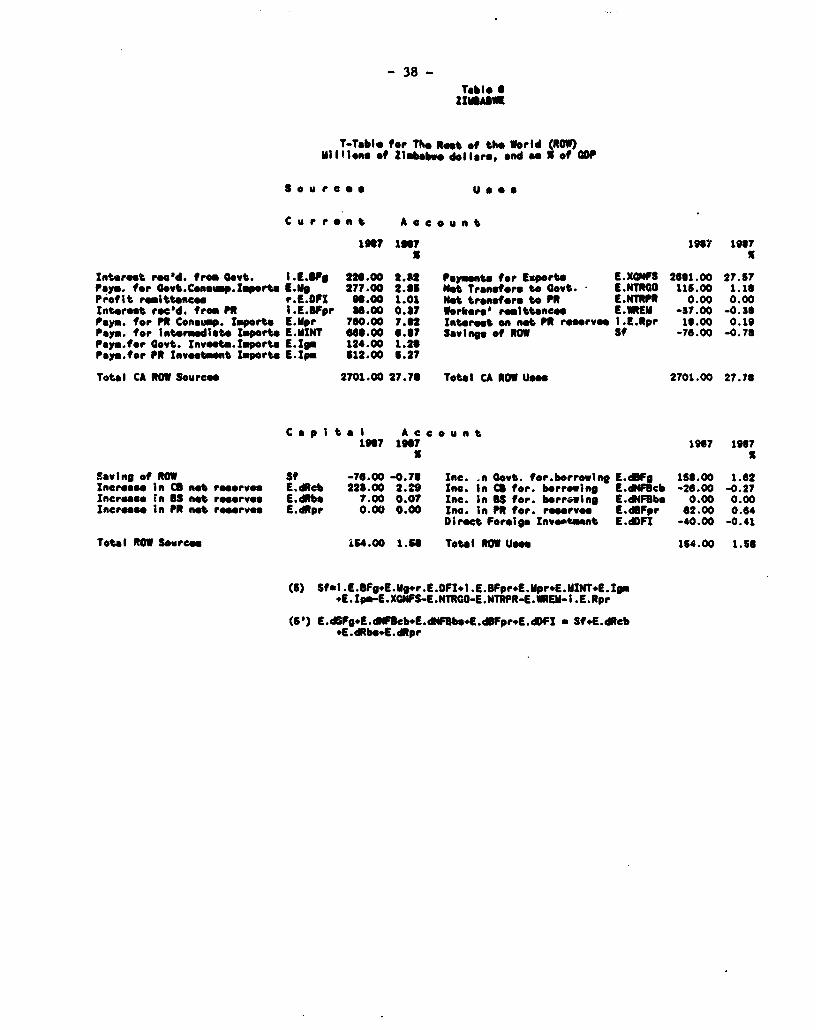
Finally, the large excess of private saving over investment in 1987
allowed a modest current account surplus in the balance of payments (0.82 of
GDP) to coexist with the sizeable public deficit. The surplus is the result
mainly of tight restrictions on imports. The inflow of foreign borrowing (2?
of GDP) largely financed foreign reserve accumulation by the central bank
(2.3Z of GDP).
As with the Colombia example, the Zimbabwe consistency framework
would have to be used together with a behavioral model to deepen the analysis.
We could ask what the heavy reliance of the government on domestic bonds sold
to the private sector means for crowding out of private investment. In a
projection, we could look at the government's future debt service requirements
based on the existing stock of government debt and discuss what the tradeoffs
were among alternative fiscal adjustment strategies.
Conclusion
To answer Emerson's question posed at the beginning, consistency is a
hobgoblin that cannot be avoided by macroeconomists.6 Even though measurement
errors may prevent us from observing exactly the budget constraints, we at
least know the equations that must be approximated. This is an improvement
6 No doubt Emerson would have responded that this confirms thatmacroeconomists have "little minds".

- 20 -
over the situation often encountered in economic analysis where both the form
of thc equation and the data are uncertain. While budget constraints do not
uniquely determine a particular economic outcome, they do allow us to rule out
a great many outcomes when we have some notion of 'reasonable' behavior. In
many cases this is enough to evaluate whether a particular adjustment scenario
is feasible. Even where a fully-specified behavioral model is desired, the
consistency relations are invaluable in defining the structure of the model.
A good grasp of consistency is a necessary addition to the macroeconomist's
toolkit.

CONSISTENCY ACCOUNTING MATRIX 13-Apr
Curront, account of: Capital account of:
National Budgetary Monetary Nonfinancial Euternal Budgetary Monetary Nonfinancial External Total TOTAL
Sources (across) and Accounts Public System Private Public System Private InvostmentUses (down) Sector Sector Sector Sector
National I Ioverneant I I Private IExportsamUSi ICoverneentI I Privateo I Total IAccounts I Consumptionl IConsumptionl mainus I 1Znve,st~ment I linveatmeot I Ilnve,tmeot I
I ~ ~~I I I 11sportsGNsI I I I I IIGD
Budgotary IIndir TaMes I I I Pr'ivate I Transfers v GrossPublic Seoctor I-Subsidios I II Direct I E to C IIIIII Govsrnment(Govermsent) (G) 1. Not Gov't I Ij Taes. I I III Icome
10per. Surplusli I I I I I I
Monetary IIIIII System (MS) IIIIII
Non-Finoncial I Private T7reanfrer I I Transfers II III I GrossPrivete Sector I Wages .I.In1toreatl E toPR IIIIIII Private(PR) I Profits a Gto? I II Income
External I Interest I I Interest Il.portaGNFSI III I I Gross Sector I I Gto EI I PR to E II I I I I For Exchang.(E) IIIIIII Pyet
Saving ond borrowing of:
Budgoetry I GVovrnamet I I I I id US Credit Id PR Creditld For Debt I I BorrowingPublic Sector I SavingII I I I I to Govt I to GovtI of Govt I I*Soviog of I
Monetary I I I I I I I I d Broadid Fore"tlI d USSystem I I I I I II I Ilonoy (112)-I of US I ILiabilitios
I ~ ~~I I I I I I I id NotOtberl I II I I. I I I I I Iliab. of MS I I
… I … I … I … I … I … II……------I------I-------I------…-------II------…I------I …------ ------… I------I …-----Mon-Financial I I Primste I I iNst LeWiningid MS Credit I Id For Debt I IBorreming #Private Sector e I I SavingI I I to PR I to PR I I of PR ISovisglof Pi
… I … I … I … I … I … II … I … I…---I------I-------I------…-------II------… I------…I------I …----- I------ ------External I I I I Foreign I I I d Internat d For.. I d Int')SectorIIII Saving II Reservee Assets of I Reserves
I I I I ~~~~~~~~~~~(-CA bet.) I I of MS I PRI I It CA defici'… I … I … I … I…----------------- ------ ------ I-----------…I…--------------- ----- -…---------- -----
Saving--total (sum I Government I Private I ForeignIIIII I I Totaof previous 4 rowe)I I SavingI I Saving I SavingII I I I Saving
… I ……-- - - -- - - - - - -- - - -I …-- -- - -I-- - -- - - -- -…- - -I-- - -- - -I I …-- -- - --- - -- - -I …--- - -I …--- - -…--- - -I …--- - -TOTAL CDGP iTot Currentl ITot Currewtit Total FX I IAsset Accuml d MS Asset Accuml d Tot ForI Total
I ~~~I Govt Uses I I PR Uses I Receipts I I of GovtI Assets I of PR I Debt linvestamatI-- --I …- -- - -I- - - -- - -II- - -- - -I- - - -- - …-- - - -- -I -- - - -- I …-- - - -- -I -- - - -- -I -- - - -- I- -- - - -- I - -- - - -I …--- - -

- 22 -
1. GOVERNMENT (G)------------------------------------- ______________.________--- -------ICurrent Revenue: iCurrent Expenditures:I…-- - - - - - - - -.I-------------------------------------IDirect Taxes JGovernment Consumption
|lndirect Taxes IDomestic TransfersI I INet Operating Surplus llnterest Payment:I I on Domestic Debt held by PRjTransfers from Abroad I on Foreign Debt
ILess: Subsidies IGov't Saving
IChange in Assets: IChange in Liabilities:I-------------------------------------…I…------------------------------------iGovernment Investment lGovernment Saving
INet Lending to PR IChange in MS Credit to Gov'tI II IChange in PR Credit to Gov'tI II IChange in Foreign Credit to Gov't
Gov't Saving - Direct taxes + Indirect Taxes + Net Operating Surplus+ Transfers from Abroad - Subsidies - Consumption - Dom. Transfers- Interest on Dom. Debt held by PR - Interest on For. Debt
Investment + Net Lending to PR - Saving + dMS Credit to Gov't+ dPR Credit to Gov't+ dForeign Credit to Gov't
2. MONETARY SYSTEM (MS)I------------------------ ------------ …---------- ------------------------IChange in Assets: IChange in Liabilities:I-------------------------------------…I…------------------------------------iChange in MS credit to Government IChange in Broad Money (M2)I i!IChange in MS credit to PR IChange in MLT Foreign Debt of MS
IChange in Foreign Reserves of MS IChange in Net Other Liab. to PRI I
dCredit to Gov't + dCredit to PR = dM2 + dMLT For. Debt* dForeign Reserves + dNet Other Liab. to PR
MLT: medium- and long-termd: change in a financial stock within period

- 23 -
3. NON-FINANCIAL PRIVATE SECTOR (PR)
I----------------------------I-----.--------------------------------jCurrent Revenue: ICurrent Expenditures:I-------------------------------------I…------------------------------IValue Added Income (wages + profits) IConsumption:I I Domestic PR ConsumptionIDomestic Transfers from Gov't j Private Consumer Imports
lInterest Payment on Domestic Debt IDirect TaxesI held by PR II llnterest Paid on Private For. DebtITransfers from Abroad
IPR Saving
-- - - - - - - - - -- - - - - - - - -I-- - - - - - - - - - - - - - - - - -IChange in Assets: iChange in LiabilitiessI---------------------..I _ ------------- I-------------------------------------IPrivate Investment IPR Saving
IChange in PR Credit to Government IChange in MS Credit to PRI IIChange in Broad Money (M2) IChange in Foreign Debt of PRI IIChange in Foreign Assets of PR INet Lending from GovernmentI IIChange in Net Other Liabilities of MSII II-------------------------------------I…--------------------------------
Private Saving - Value Added Income + Domestic Tranfers from Gov't+ Interest on Dom. Debt + Transfers from Abroad- Consumption - Direct Taxes - Interest on Private Foreign Debt
Investment + dCredit to Gov't - Saving + dMS Credit to PR+ dM2 + DForeign Assets + dForeign Debt+ dNet Other Lib. of MS + Net Lending from Gov't
- 24 -
4. EXTERNAL ACCOUNTS (E)
---------- -------------------------- I--- ----------------------------------ICurrent Revenue (of ROW): ICurrent Expenditures (of ROW):
…-------------------------------------I…------------------------------------
lInterest: lExports (GNFS) iReceived from Gov't I IReceived from PR ICurrent Transfers to Government
lImports (GNFS) ICurrent Transfers to PR
IForeign Saving (- CA Deficit) II ~~~~~~~~~~~~~~~~~~~~~~~~~~~~~~~~~~~~~~~~~~~~~~I
IChange in Assets (of ROW): IChange in Liabilities (of ROW): II-------------------------------------…I-------------------------------------IChange in Net Foreign Debt of Gov't IForeign Saving (- CA deficit) II IiChange in MLT Foreign Debt of MS IChange in Foreign Reserves of MS
IChange in Foreign Debt of PR IChange in Foreign Assets of PR
I …… ~~~~~~~~~~~~~~~~~~~~~~~~~~~~~~~~~~~~~~~~~~~~~~I…* ROW - Rest of World
CA Deficit - Interest from Gov't + Interest from PR + Imports - Exports- Current Transfers to Gov't - Current Transfers to PR
dNet Foreign Debt of Gov't - CA Deficit+ dMLT Foreign Debt of MS + dForeign Reserves of MS+ dForeign Debt of PR + dForeign Assets of PR
CA Deficit: Current Account Deficit-

- 25 -
BIBLIOGRAPHY
Easterly, W. "Portfolio Effects in a CGE Model: Devaluation in a DollarizedEconomy" in L. Taylor, ed. Structuralist Computable General EquilibriumModels, [forthcoming].
Holsen, J. "An Illustration of RMSM-X (Revised Minimum Standard Model--Extended]," [1989].
Host-Madsen, P. Macroeconomic Accounts: An Overview. International MonetaryFund, Pamphlet Series No. 29, Washington, D.C., (1979],
Khadr, A. and K. Schmidt-Hebbel. "A Framework for Macroeconomic Consistencyin Current and Constant Prices," CECMG, [1989a].
_ WA Macroeconomic Consistency Framework with an Application toZimbabwe," CECMG, [1989b].
Rosensweig, J. and L. Taylor "Devaluation, Capital Flows, and Crowding-Out: ACGE Model with Portfolio Choice for Thailand" in Taylor, ed. Op.cit.(forthcoming].

- 26 -
APPENDIX I: COUNTRY APPLICATIONS

I ~~~~~~~COLUMBIA(EONISTF,ICV ACCOLINFINC oAlfifN
3Q66 C....r.n PI-COD (a. a I of CDP) 14-Apr
C"'frat a.Cco t of Cap.tal acccOnt of
N.c..'-6 P.bI,c Central F.. P'.e.. E.t*,nal P.bl.. Central F-na-cal P-,nt.e Eatermel Total TOTALSou.ee (Ocroe.) and *~.. s SeCt. a..h sye.to s..to, Sector Bookt Spots. santo. Sector Inneautena..o (down) fea&CotI)
Nsi.oe.l I lCont Cnone" 11IIPi.st. Coines. ICWeS 19.031 5 Coant lea. I Frri eto low. I 57.5.1 Ine I IAccouste I 1Dooeat,c 6.09 1 M onaestic 63.71 ilnt. N -5.1? I jIoaseetoc 5 33 1 I Domestic 9.01 I jomemtic 34 34 I 1100.00 I
Mom-Fineaciel (G) gNCOS 95 se I IT*.es 2.041II SIII
A.blic Sectw Ife.e, 12 44 1 )[alit 0.14 I I .53I5S.ba -0555 I I I
Central (Call I I I II
SenFt Ici (R)Il . O. I I I Il% 0 I I III F.aanse$c ter (P5) I 'l ITr re GWI I I lIf SI.2 I I W.ItI I
Spel I ~~~Aded I I I I I II IIIII I I
E.te-FlesIcIaIn%.)2Fr2ate lin. 0.5 lIes 00 I I IT l P*trie. etsVI. 85 I TrC(e. fre losn 0 "I..0 6.55 I II.. es 2.111 1 In. .71in." 3 II 0.01 I
I I ed 5 I I IWS . " II I I I I I I I
se. ntam oeol s f I lIt. .2 I Int 1.0I I I I I I I IToIal
Seor * Imcia ICon. INI0.1I I ICo.N 09 )t .7 ICIne Nd 1.34c1 , amw. to 2.2 ,. Debt I NI6 I000ftblic ocib1 Ism 5a I I Sw 665 I I I l c - tIoa 0 IPR04 a a 2 031 72
Seieeet.ra.u.f I I I I I I I I Iftee .1IC ,n, 07 I 4.Le. I I 1.
Book I ia I5owtI I I I I I IC rei IN" cLeitbO. INK Ldeb to Flot . 0.21 I .4-- b - -- ---- ---- ---- --- -- -- -- I- -- -- -- -- - -- -- I-- - - - - - - -I-- - - - - - -I I-- - - - - - - -I---- ----- ---- I--- ---- ---- I--- --- --- --- 2-- - -- - - -I- - - -- - - - I--- .--- I
CentreSl IIII I I I I ICIc.i Ift re .14iCarreac 0.7 IFo,. LieS. I I I
Spates 5 I -I I I I I Ito FS 0 975 5NDLimb. 1.21 lot FS -0 571 II 9.43I
Non-Finanicial I I I IPrinate I I INst Lendi.n Ic 5C8 cr .t 5FS cred.t I 5Cradit -0 25 I IPriest. Sector I I I 5S.a.ng 12 43 5 I It. PR 0 0 Se to PR I SS Ito PR 6 97 I 5CF1 0 97 I 5 22.22 I
E.tornal I I I IFor,.sn I I IF., R.e.,r.as IFor. Aeeta I I I5ISector.. I I I. I i.eqn -1 345 bdlo C 3 451 lotfPR 0.2551 I I 2.2551
Sawing--total I 50~~joc5 I IFr-ate IFDoei.qf I5 I (s.a of pro.eciu S -o.)I ISa.c.n 6.8" I I 5San-n 12 43 155m6i. -1 34 I 1 79
… 5…-- -- - - - - -- -I - -- - - - -I-- - - - - - - -I-- -- I- -- -I-- - - -- - - - I- - - -- - - -II…--- - - -- - -- - - -- - -I-- - - - - - -I-- - - -- - - -- - - -- - - -- - -- - - -- - …- - -5 .5I I I SI I I I I5
TOTAL I 1u0 00 5 23 63 I I 07.16 I 20 00 I 5 7.25 I 3 46 5 9.43 5 21.22 1 2 36 51? 95 5… 5…-- -- - - - - - -I - -- - - - -I-- - - - - - - -I-- -- I- -- -I-- - - - - - - -I-- - - - - - -I I-- -- - -- -- - - -- - -- -- -I-- - - - -- -…-- - -- - - - - - - - - - -I-- - -- - - -- …-- - -
Sac.sae - Inoasteont 0 19 1.15 -1 34
Verisbl* lbmes:MMS: Net Co.'t Oparatnag S.rpl.o Trfar TransfersSets Sebm.dia. Nll L. b Oln-ooane,ar L,ebil,t,oala% . Interest NO La.b Nat 055cr t.sb,.it.oaWF S.. Naon-facto, Se. .can Qa.0. N Does. 1NO,eint N: ilrat Ieeorta OFI Ore.ct Foreson In....two.tInn . In-et-et I.aortn F.r L.ab F.ra.gn t,&b,i,t,eaCons Con.Acot..o Incc t Ef Enpo-ts of G-ood and N-n facto, Sar,c.o

COLOMBIA
u"itSTEaCI ACCaDNffC Eat ARiLa
34.7 C-rren Price. (ae. S of CDP) la-Se.
C.rs-et accout of: C.p.tal acco,nt Of.
Netunal rgblic Central Pin. Ps-swat. Estasrnel Public Central FPsamoceal Ps-swat. t.tasrnal 1045i TOTALS~rcae (acroee) end A,.o.W.. butOBsiS Sastoo sector Sector Ba&. Syss., Sector Secto, ia.aetmmanti.e.. (doSs) (mhtotLo)
… I … .......... ------- I …------- …-…-------I …--------S …-------A-----… --- S …-------I …-------I--------I…-----… -- I…--------A …---IMatlases 50o.c Cons... I 5Ptis-at. Cone... gaGES la 94 5 IGa.,#. In.. I I Ps-maste is.. I ntSie la.. IAccent. I l0ceaac.c 7.51 I I 100ceastiC 63.39 11nt N -5.32 A jDaeetmic 46 5 I Ihammetic 20.63 I Joease tic 15.48 I 00 00 I
… I…-----------I…-------I--…------I …-- --- …--------I …-------5 …--------- -------- I …----------…------ ----- …----------- …---2ba-P.asac,al (C) 5fGC05 7 3.1 5 IIS.S.. I 2)65IS I I I 5. Psshic Sector 51.... 12 44 5 1 lint. 0.21 5 I 2 OISI3.66 I
lube -QISS I S I I IISII …------------I …-------I …------- …-------… - ----- … --- I …-------I ---- …----I …----------…----I …S…------I…-----------------…--
Castr-al (CS) II I III Saab SII I III
… I … I … I… I… I … I…- ------- ----------------------- -------- II…--------I …----------…----I …---------- …-----I…-------I …--- Piesascial (FS) III I III Slate I - ---------- tLi---------I- --------- I----- I---- -------- I-- ------ II-- ------- I-- …------I--- …-- -l---I -------- I-------- ---------- I--- -- INa-Pbaascial (PR) IPs-suete inat GAB9 I I I lint. 0.051ISI I I IPr-ivoet Sectr lValue 60 72 iTre*sa 5.03 I I Airefare 2-fl IIIA I 0604651
lAddad I I I I I Al I III … I … I … I… I… I … A … IA…------I---------…----I---I---------… A-------…---------I----------------…-----------------I…-------I…---
Eatersal f lnt 2.60 1 I Alaes. 0.545 5555 litelO I ISector A Cone H 0.13 1 I Ica"e. N 1.22 llnt. N 5.32 I Ala.. II 1iii f in.. N 2.6? 5 52ev. N 3.62 1 30 42 5
5 5 5 5WSr. 6605. II I A AMF I,I G1 5-… I … I … A… A… A … A … Al …A … A…--I …A-------…A…A-I---…----------I--------I --------- -------- -------- I--------- -------- -----
So.iagend borrs oinagofl I A AIA A A A A I----------- I--------- --------- I---I------------I--A----A-A--- I -------------Al--I------- --------- I-----A- - AA -A - I------ -- ----- J
Hmt-Fiesbcial A C*.'t A A A A A A I Scre isadt IFS credit Shade to APor. Cast I Pu.blclco - I Saun I a.8 42215 A A IA 1 to t.aSWItoGa 1.30AMP 0.32lot0 -0.625 5 3595I
…-------------I … A … … A… …A…----------I--- 5I--- …----------I----A---… … --------l-I--------A--------…I------A--…------… -5…A------- ----Casual I A I A A A A A 5 lflaaes-vae 0.14 lCerrascg 1.25 jPor. L.ub. A A 5I 074 Itrecy 116 Ior.Lieb I Sash A I - A A A A Al~~~~~~~~~~~~~~~~~~~~~~~~~~~~~~~~ I 5aM,Liabo .3955. Limb. 0.13Alof CS 0.04, I 1 24651
… S …A-- - - - - - - - - - - - - - - - - - -- - - -- - - - - -I -- - - - - - - - - - - -- - - - - - - - - -A… … A … A ……- ------ --- --- --I--- -- ---A…--I …A…A…-- -- I - -- - - -- - -- - -Pisascial AI A A A A 55O 5C6radstL AbasHi of 93 orCDebt I Slate AI I A II ItoPFS 0. Go INDLeb. 1i43 lofPFS -0.435 A 9 52
… s … S … … I… …I… A … … 5 … …A----- -------------- --- -------- ;I---------II---------… A--------II ------- A-----I----I-A------I-------------taPim inanasal I 5 A `IPri1at I I SWat Leadsal ACS Cs-edit IFS credit I ACs-edst -0 09 I
Sewealctor I I A Shn, 16 4451 A Ato M OTBAtoM lOSAtoM2. P 7.095 IViD 0.43 1 A25.7125… S…-----------I … A… A…--A … A … Al…-------------------- -------- --------- I---…A …--I--------I-- …------I- …------I- …------S ----
E.a stna 5 forasast I A IPor Raaar.aa I iPor Aesate I I Sector I 5 I 5 iSa.inq -2.34 5 A lof CB -GM5 I lof Fe 1.24 5 5 -06 5
… I … I … A … A … 5…~--- - - -- - - -- - - - -- - -- - -I- - - -- - - -- - - -I …-- - - - - -I I - - -- - - -- -I -- - - -- - -I- - - -- - - -I-- - - -A-- -…I- - -- - - - AI - - -- - - - - …- - -e.-issg -- toteI A-- lco.t I I lPrlvate lforign 55I I A A I
("aeofpravioiie 5roma) I ISeOg- 4225 5 laSeusn 16 44 55e.isg -2 34 55 5 5AIt5 1305… A … I … 5… I… 5 … S … Al …I … A…I---------I…A…----…---
'5 5 6.59:~~~~~~~~~~~~~~----------------- :-------- 246------ ---------- ---------------- ------- ---
Seuhaga - Inwesatoent -t 59 2.93 -1.34
Variabe "eMa-NM;S Aant Co. t Oparating Wc-I res-a Tranafear".a : Sisbaidee* L4.eb Nts-eanatsry Li.b,lit'.e
Ist Interste NOI L.ab Nat OLbas- LiabslitsmeNF Sr.. anon-factor Se.ce a.S N Qua.. Money
1st. N: Znt. iedsat lmgs-rtz OPi' U.s-act Poreign lnveateentn. N Ineteent laoLs-t For Link Pore.as- L.sbilit.ea
Cone Coneiagtson. Sas.c.s. tCdP 1 E.pos-ta of COoda and Non-faCLs- 6as-nCaa

- 29 -
COLOMBIAAs! As %
1. Non-Financial Public Sector (Government) 1986 of GDP 1987 of GDP -
----------------------------------------------------------------------- __----__-------------------
Current Revenue (millions of current pesos) 1683884 23.63 1813635 20.86Direct Taxes (Private (total)) 136636 2.04 102069 1.16Indirect Taxes 833804 12.44 1092431 12.44Int. Rec'd. from No-Fin. Priv. Soctor 9200 0.14 18800 0.21Not Current Transfers from AbroadNot Operating Surplus (nontax revonues) 640700 9.6G 648100 7.38Not Subsidies -36636 -0.65 -47866 -0.55
Current Expenditures (millions of current pesos) 1123864 16.77 1444136 16.45Interest 201800 3.01 331400 3.77to Non-Financial Private Sector 50200 0.76 77800 0.89to External Sector 161600 2.26 263600 2.89
Current Tronafers (not) 372264 6.66 441736 5.03Consumption Expenditures 649800 8.20 671000 7.64Domestic 642187 8.09 669610 7.51Imported 7613 0.11 11490 0.13
Govornment Savings 460000 6.86 369400 4.21
Assot Accumulation 4E-774 7.25 678439 8.S9Net Capital Transf. and Gov't Lend 38674 0.68 69439 0.79Fixod capital formation 47200 6.67 609000 5.80
domestic goods 357295 6.33 408366 4.66imported goods 89906 1.34 100646 1.15
Financing 26774 0.38 209039 2.38Net Central Bank Lending -168462 -2.61 120964 1.38Net Banking System Lending 30967 0.46. 113714 1.30Bonds to private sector 27299 0.41 27868 0.32Net Foreign Debt 135960 2.03 -63487 -0.61
Memo: Gov't net financing requirement 12800 0.19 -139600 -1.59

- 30 -
a.
COLOMBIAAs As %
2. Central Bank (C8) 1986 of GOP 1987 of CDP
Change in Asnetu 231805 3.46 216871 2.46Net Foreign Reserves Central Sank 231073 3.46 -48692 -0.55Not Central Bank Lending to Gov't -168462 -2.61 120964 1.38Domestic Credit to Private Sector -23722 -0.43 -2688 , -0.03Credit to Banking System 65189 0.97 61346 0.58Net other assets (priv sector) 132718 1.98 94952 1.08
Change in Liabilities 231805 3.48 215871 2.46
Change in High Powered Monoy: 110429 1.74 166458 1.90Currency 48376 0.73 101112 1.15Bank Reserves 67653 1.01 65346 0.74
Change in Non-Monetary Liab;lities: 101482 1.61 46788 0.52Banks 66112 0.99 34286 0.39Non-Financial Privato Sector 36360 0.53 11502 0.13
Change in Foreign Liabilities 13914 0.21 3625 0.04
Aso As %3. Financial System (FS) 1988 of CDP 1987 of CDP
Change In Assets 631826 9.43 836C88 9.52Net Credit to Covernment 30967 0.46 113714 1.30Not Credit to Privato Sector 467194 6.97 622342 7.09Central Sank Reserves 67653 1.01 65346 0.74International Reserves (net) 0 0.00 0 0.00Non-Monetary Credit to CB 68112 0.99 3428C 0.39
Change in Liabilities 631826 9.43 835688 9.52cross Credit from CS 65189 0.97 51346 0.58Quasi-Money 623682 7.81 696487 7.93Not Long-Term Foreign Borrowing -38023 -0.67 -37757 -0.43Change in Net Other Liabilitioes to PR (residual) 81078 1.21 125613 1.43
- 31 -
COL04IIAAs X As X
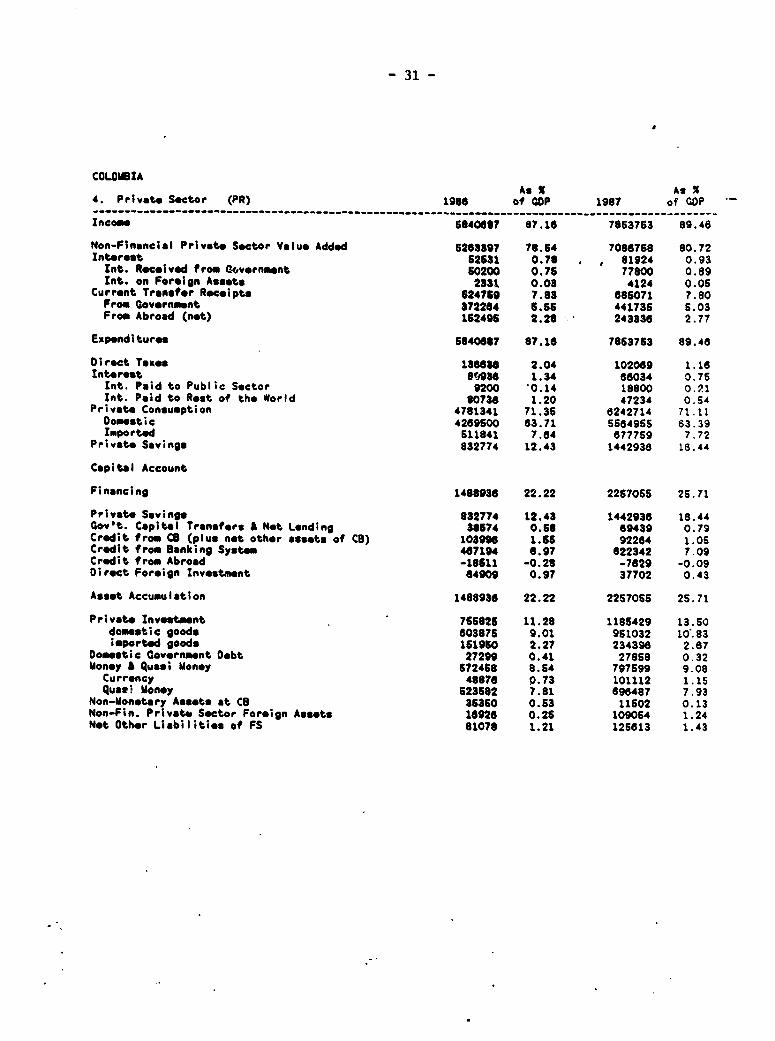
4. Private Sector (PR) 1986 ot COP 1987 of GOP
Incoe 5340687 87.16 7853763 89.48
Non-Financial Private Sector Value Added 5268897 78.54 7006766 80.72Interest 62531 0.78 , 81924 0.93Int. Rocolved from Government 50200 0.76 77800 0.89Int. on Foroign Assets 2331 0.03 4124 0.06
Current Transfer Receipts 524759 7.83 686071 7.80From Government 372264 6.C5 441736 5.03from Abroad (not) 162495 2.20 243336 2.77
Expenditures 5840087 87.16 7663763 89.46
Direct Taxes 136636 2.04 102069 1.16Interest 89936 1.34 66034 0.75Int. Paid to Public Sector 9200 *0.14 18800 0.21Int. Paid to Rest of the World 80736 1.20 47234 0.54
Private Consumption 4791341 71.35 6242714 71.11Domestic 4269600 63.71 5684965 63.39Imported 611841 7.64 677759 7.72
Private Savings 832774 12.43 1442936 16.44
Capital Account
Financing 1488936 22.22 2267065 25.71
Privut. Savings 832774 12.43 1442936 18.44Cov't. Capital Transfors & Net Lending 38674 0.68 69439 0.79Credit from CS (plus not other *ssets of CB) 103996 1.65 92264 1.06Credit froe Banking System 467194 6.97 622342 7.09Credit from Abroad -18611 -0.28 -7629 -0.09Direct Foreign Investment 64909 0.97 37702 0.43
Asset Accumulation 1488936 22.22 2257055 25.71
Privat. Investmwnt 765682 11.28 1185429 13.50domestic goods 603876 9.01 961032 10-.83imported goods 161960 2.27 234396 2.67
Doestic Government DObt 27299 0.41 27858 0.32Money A Quasi Money 672468 8.64 797699 9.08Currency 48876 0.73 101112 1.15Quasi Money 623682 7.81 696487 7.93
Non-Monetary Assets at CB 35360 0.53 11602 0.13Non-Fin. Private Sector Foreign Assets 16926 0.26 109064 1.24Net Othor Liabilities of FS 81078 1.21 125613 1.43

- 32 -
COLOMBIAAs i As%
5. Balance of Payments (in local currency) 1986 of GOP 1987 of GDP
Resource BsalanceExports (G#NFS) 1276129 19.03 1662693 18.94Imports (GCNFS) 1107870 16.63 1491311 16.99Intermediate Imports 346662 6.17 467020 5.32Consumer Imports 619464 7.76 689249 7.85
Goods 73819 1.10 118393 1.36Public Sector 7613 0.11 11490 0.13Private Sector 66206 0.99 106902 1.22
Non-factor Services 446636 6.66 670867 6.soInvestment Imports 241866 3.61 336042 3.82Public Sector 89900 1.34 100646 1.15Private Sector 151960 2.27 234396 2.67
Factor payments 256463 3.81 339409 3.87Int. Payment by Gov't on For. Debt 174717 2.61 292176 3.33Int. Paid on Private For. Oebt 80736 1.20 47234 0.54
Factor Income 26448 0.38 42699 0.49Int. on Private For. issets 2331 0.03 4124 0.05Int. Received on public foreign assets 23117 0.34 38675 0.44
Not Transfers 162496 2.28 243336 2.77Net Cur. Trans. R*ecd from Abroad by Cov't 0 0.00 0 0.00Net Cur. Trans. R*ecd from Abroad by Priv. Secto 162496 2.28 243336 2.77
Aggregate Fo!-ign Exchange Earnings 1463072 21.68 1948627 22.20Aggregate Foreign Exchange Payments 1363324 20.34 1830720 20.86
Current Account Deficit -89749 -1.34 -117907 -1.34
Net L-T Extornal Borrowing 158260 2.36 -57646 -0.66Not Gov't Foreign Borrowing 136960 2.03 -53487 -0.81Net Private Foreign Borrowing -18611 -0.28 -7629 -0.09Net CB Foreign Borrowing 13914 0.21 3626 0.04Not Banking System Foreign Borrowing -38023 -0.67 -37767 -0.43Direct Foreign Investment 64909 0.97 37702 0.43
Short-term foreign assets 247909 3.70 60382 0.69CB Foreign Reserves 231073 3.46 -48692 -0.5SNonfin private sector foreign assets 16926 0.26 109054 1.24

- 33 -
COLOMBIAAs As%
8. National Accounts 1986 of GOP 1987 of GOP------------------------------ _--------------_-----------------------____----__-__---__--_--------
Total Value Added Income (GOP) 6701426 100.00 8779424 100.00---------------------------------- _---------------
Non-Financial Priv. Sector Income 6263397 78 64 7086758 80.72Noet Operating Surplus of Government 840700 9.66 648100 7.38Indirect Taxes 833864 12.44 1092431 12.44Lost Subsidies -38636 -0.66 -47886 -0.56--------------------------------------------- _----
Government dometic consumption 542187 8.09 669610 7.51Private Domstic consumption 4269600 63.71 6654966 63.39Govt invostment (domestic) 367295 6.33 408365 4.85Privato investment (domostic) 803876 9.01 961032 10.83Exports GNFS - Interediste imports 928668 13.86 1196672 13.82
Total Expenditures (GDP) 6701426 100.00 6779424 100.00
Consumption 6331141 79.55 6913714 78.75Gov't Consumption 649800 8.20 671000 7.64Private Consumption 4781341 71.36 6242714 71.11
Investment 1203026 17.96 1694429 19.30Gov't Investment 447200 6.67 509000 5.80Private Investment 76t825 11.28 1186429 13.50
Exports of Goods and Nonfactor Services 1275129 19.03 1682693 18.94
Imports of Goods and Nonfactor Services 1107870 16.63 1491311 16.99Gov't Consumption Imports 7613 0.11 11490 0.13Private Consumption Imports 66206 0.99 108902 1.22Intermediate Imports 346562 5.17 467020 5.32Governmnt Invostment Imports 89905 1.34 100645 1.15Private Investment Imports 161960 2.27 234396 2.67Nonfactor serviceos 445635 6.66 570867 6.50
GDP 6701426 100.00 8779424 100.00

- - - - a - - - - - - ~~~~~~~~~~~~~~~~~~~~~~~~a a -~~". - -" -- .-
.. .. ... . .. . .. . .. . .. . .. .. .0. .. ..3. .. . .. . .... ......s........ e ..... . .. . .. . .. . .....e.. .aq .... .... ..... . .. .. . .. . .. .. . .. . .. . ......... aq.
- I~~~~~~~~~~~~~~~~~~0 w o0 l sIV O. A
IS is * s nns nas O- wa Seas- ts I 0. ' -l a *s
--- a-i -.I--g55 me.......... ....... -- --- ------------ - ...... ...... s-.....as ............ e.... ------ ----------- a---------- ----- 5---d-----------------
a p a-an no~~~~~~~~~~~A '-aimt a aw sg oa
so GP5 *ulo sam so3 evea i aa tse,
tWO as- assumes a~~~~~~~~~~~~~~~~~~~e~~~n q'e a a OInIa s.tndua aa "-55 J~~~~~~~~~~~LS5- *fl a~~~~~~~g 0 dAvI A
s- pa.. taaq, ao aI--------- ---- - --- -.-..-.--.-... -.... - - --
ag0 aI9 oMo La ofsa.4 1a suaa -. ao
4aM."~~~~~~~~~~~~~~~~~~~~~~~~~~~~~~~ a… o0 NW a no *4ssi ass *arns~~~~~~~~~~~~-%4s6- VG
n a aa a anwact $ mat' " t-
ass- as~~o rnNoaa Oe aoIL
is I ag I SC I "I a I too cm 4 .. w I- on a 6-IOM~~~~~~~~~~~~~~I …~~~~~~~~0t i…a… & nI
US a us a ass a asm, obtdob IA 'ma i Ae Ilta.. .. . ... . .... .. .. .sa stem... . .. . .. . .. .. .. .
.q s-n-n - a see .sa~~~~~~~~~~~~~~~~~~.sp PO.
…~~~~~~~~~~~~~~~~~~~~~~~~~~~~~~a…LA 39ie
ma ass s ~~~ £81 fl59 535 55 DIsCO 055MB 1*4 '903- ml *sa S tflj5Sq~~~ol"j
- 35 -Table 2ZIMBASI!
T-Tablo for the Non Financial Public Sector (Govornment)Millions of Zimbabwe dollars, and as U of GOP
Sou rce Uses
C u r r * n t A c c o u n t
1m6? 1907 1937 1967U X
Governmnt Value Added CFY 435.00 4.4? Government Consumption Cg 2031.00 20.S9Indir et Taxes TI 1 O71.00 14.10 tnterost Payments to PR 1 O9o 852.00 9.62Direct Taxes from PR TDpr 1507.00 15.50 Govt. Transfer* to PR GIR 750.00 7.71Interest reccd. from PR 16.lO Th 0.00 0.00 tnterest Paymento to ROW 1 E PE g 226.00 2.32Transfors to Govt. fr. Abr. E.NTRQO 115.00 1.13 Government Saving S -U69.00 -8.79
Subsidies 4 3.00 4.50
Total CA Gov. Sourceo 8423.00 85.25 Total CA Gow. Use 8423.00 36.26
C a p i t a l A a c o u n t
1997 190? 1"7 1"7?U S
Government Savin So -869.00 -8.79 tnvostment of Govt. Ig 851.00 8.61Borrowing from dDCg 66.00 0.63 0 nc.In direct lending to PR dCKTR 235.00 2.98Borrowlng from SI dCBSg 120.00 1.28Borrowln9 from PR dB 661.00 6.30Borrowing from Ro E.dBFg 156.00 1.62
Total Gov. Sources 686.00 6.54 Total Gov. Use 686.00 6.54
Note: Lower case d denotes a first difference.
(1) SgomFY+TI-GSUB+TDpr.E.NTRGO-Cg-1. 8g-OTR-Ei .BFg
(1') tq*dOlC(TRSg.dOCg.dCBSq.dBg.E .Bg

- 36 -Table 3
ZIMBABWE
T-Table for Control SankMillions of Zimbsbwe dollars, and as X of CDP
SourcesUses
C a p i t a l A c c o u n t
1967 1967 1987 1987
Increase in vault cash dHbc -7.00 -0.07 Lending to Govt. dDCg 66.00 0.68Increase in BS deposits dDBOScb 269.00 2.77 Lending to BS dDCbc 0.00 0.00Increase In Currency dHpr 4.00 0.04 Lending to PR dDCpr -49.00 -0.60Increase In iR deposits dDSPRcb 0.00 0.00 Accumulation of net reserves E.dRcb 223.00 2.29Foreign borrowing E.dNFScb -20.00 -0.27
Total CB Sources 240.00 2.47 Total CS Uses 240.00 2.47
(2') dDCg.dDCbsdDCpr+E .dRcb a dNibs.dSISScb+dHpr*dDBPRcbE .dNFNcb
- 37 -Table 4
Y-T.ble fre Blaking SystemMillions of Zimtbl e dollars, and as I of w
Soureso Uses
1W? 199? 199? 197
Sorrowing freo CB dDCb. 0.00 0.00 Lending to Govt. dCBSS 120.00 1.23Incresse In Demand Deposits OEPpr 3t.00 0.97 Aceculoti.e of Vault Cash dHMe -7.00 -0.07'Increase In quasi-Money dM I90 00* 4.07 Accumulation of doolits at CB DSOMb 269.00 2.77Berrowing froe NOW E.dIWbo 0.00 0.00 Lendlns te Private Sectr dCSpr 92.00 0.95
Acem. of nt foren r" *rves 1.dtbs 7.00 0.07
Total OS Sources 461.00 4W9 Total 05 Use 461.00 4.95
(3') dCBSI-Mbo.dDWScb*dCSprEdbSW a dDCbeDWEPpr*dQUWl*.dlUbs
- 38 -
Table 0ZIMSAW3
T-Tabl- for The Rest of tho World (ROW)Millions of Zimbabwe dollars, end an t of 0
Sou rc- Uses
C u r t A c e o u n t
111? lW? iosv igs7X 3
Interost reo'd. from Govt. I.E.FG 226.00 2.82 PayssetO for Exporte E.XOWS 2601.00 27.57pays. for GOt.Conoump.ASportt EMg 277.00 2.35 Net Transfeor to Govt. - E.NTRGO 115.00 1.16Piofit re_ittncne r.E.OfY 90.00 1.01 Not tranof-rs to PR E.NATRI 0.00 0.00tnterest roc'd. froe PR I.E.Opr J6.00 0.37 Workeor. remlttance E.REM -17.00 -0.33Pays. for PR Conosmp. I port E.Mpr 760.00 7.32 tntoroat on net PR roerveo I.E.Rpr 16.00 0.19Pays. for Intermtdiate Import E.MINT 666.00 6.67 Savings of RNW St -76.00 -0.78Paym.for Govt. Invoetm.Tmports E.tgm 124.00 1.20Pay .for PR tnvestmont Sorta E.Ipm 612.00 6.27
Total CA ROW Sourco 2701.00 27.79 Total CA ROW Us" 2701.00 27.78
C a p I t a l A c c o u n t1967 1967 1937 1967
S ISavlng of ROW Si -76.00 -0.79 Inc. .n Govt. for.borrowing E.dOFq 156.00 1.62Increase In CD net re rvos E.dRcb 223.00 2.29 tnc. In CS for. borrowing E.dNFBcb -26.00 -0.27tncroae in US not resorves E.dRbe 7.00 0.07 Tne. In BS for. borrowing E.dNPDbe 0.00 0.00tneresse In PR not resrves E.dRpr 0.00 0.00 tne. in PR for. r_esrveo E.dFpr 62.00 0.64
Direct Foreign tnveitment E.dDFS -40.00 -0.41
Total ROW Sources 154.00 1.56 Total ROW Use 154.00 1.56
(5) Sfsl.E.BFg.E.Mg.r.E.DFt.i.E.IFpr4E.Mpr4E.NINT-E.tg*E.Ip ,E.XOWNS-E.NTR7O-E.NTRPR-E.VEM-I .E.Rpr
(5') E.dOFSE.dNFBcb.E.dNfPbs-E.dSFpr4E.dDFt a Sf#E.dRcb*E.dRb.E.dRpr

- 39 -Table 7
ZIMSABWE
T-Tablo for the National AccountsMillions of Zimbabwe dollars, and as I of CDP
So u r ces Uses
C u r r * n t A c c o u n t
1907 1987 1987 198?X s
Contram Govt. Consumption Cg 2051.00 20.89 Government Value Added OFT 435.00 4.47Prlvate Consumption Cpr 5656.00 57.16 PR Value Added PRFY 808t.00 86.95Central Govt. Investment Ig 561.00 3.61 Indirect Taxes TI 1371.00 14.10Private Investment Ipr 1444.00 14.86 Lose:Exports of CNFS E.XCNFS 2681.00 27.67 Subsidies GSUB 486.00 4.60Loes:
Central Oovt.Consumptlon E.Mg 277.00 2.96Prlv. Consumption Iports E.Mpr 760.00 7.82Central Govt.Invest. Iports E Zgm 124.00 1.20Priv. Invostomnt I"ports E.Ipm 612.00 6.27Intermediate goods Imports E.MINT 666.00 6.67
Total NA Sources 9724.00 100.00 Total NA Uses 9724.00 100.00
(7) GOP a Cg.CpraIg.Ipr.E.(XONFS-Mg-Upr-Igm-MtdT)
(78) CDP a CFY.PRFY.TI-GSUB

PPR Workint Paper Series
ContactTitle Author Date for paper
WPS204 The Impact of Labor Costs onManufactured Exports in DevelopingCountries. An Ecenometric Analysis Luis Riveros May 1989 R. Luz
61762
WPS205 What Determines National Saving?A Case Study of Korea and thePhilippines Sang-Woo Nam May 1989 R. Luz
61762
WPS206 The Effects of Single-Sex Schoolingon Student Achievement and Attitudesin Nigeria Valerie E. Lee May 1989 C Cristobal
Marlaine E. Lockheed 33640
WPS207 Occupational Training AmongPeruvian Men: Does It Make aDifference Ana-Maria Arriagda May 1989 C. Cristobal
33640
WPS208 Effective Primary Level ScienceTeaching in the Philippines Marlaine E. Lockheed May 1989 C. Cristobal
Josefina Fonacier 33640Leonard J. Bianchi
WPS209 Can the Industrial CountriesReturn to Rapid Growth? SpaceSeminar International
Economics Departmentand InternationalEconomic Analysis andProspects Division
WPS210 Notes on Cash-Flow Taxation Roger H. Gordon June 1989 A Bhalla60359
WPS211 Coffee Pricing Policies in theDominican Republic Panos Varangis May 1989 D. Gustafson
33714
WPS212 Beyond the Debt Crisis: AlternativeForms of Finar.cing Lessard
WPS213 Conditionality and Debt Relief Stijn Claessens June 1989 S. King-WatsonIshac Diwan 33730
WPS214 Adjustment and the Labor Market Peter R. Fallon June 1989 R. LuzLuis A. Riveros 61762
WPS215 Adjustment and Income Distribution:A Counterfactual Analysis Francois Bourguignon
William H. BransonJaime de Melo May 1989 M. Ameal
61466WPS216 Price and Quality Effects of
Vers--Revisited: A Case Study ofKorean Footwear Exports Jaime de Melo June 1989 M. Ameal
L. Alan Winters 61466
WPS217 Public Dlbt, North and South Helmut Reisen
PPR Working Paper Series
ContactTitle Author Date for paDer
WPS218 Public Finance, Trade andDevelopment Vittorio Corbo
WPS219 Rura: Credit in Developing Countries Avishay Braverman June 1989 C. SpoonerJ. Luis Guasch 37570
WPS220 Capacity Building for Policy Analysis:Lessons of Experience S;amuel Paul
!javid SteedmanFrancis X Sutton
WPS221 How Does Uncertainty About the RealExchange Rate Affect Exports? Ricardo J. Caballero June 1989 A. Oropesa
Vittorio Corbo 61758
WPS222 Why Stabilisation Policies in ZambiaDid Not Succeed Christopher Coiclough
WPS223 Overvalued and Undervalued ExchangeRates in An Equilibrium OptimizingModel Jose Saul Lizondo
WPS224 The Economics of the GovernmentBudget Constraint Stanley Fischer May 1989 S. Fischer
33774
WPS225 Targeting Assistance to the PoorUsing Household Survey Data Paul Glewwe June 1989 B. Rosa
Oussama Kanaan 33751
WPS226 Inflation and the Costs ofStabilization: Historical Cases,Recent Experiences and Policy Lessons Andres Solimano
WPS227 Institutional Reforms in SectorAdjustment Operations Samuel Paul
WPS228 Economic Performance of DevelopingCountries in the 1980s Robert Lynn
F. Desmond McCarthy
WPS229 The Demographic Transition and Savingfor Ufe-Cycle Motives in DevelopingCountries Steven B. Webb
Heidi Zia
WPS230 Unemployment, Migration and Wagesin Turkey, 1962-1985 Bent Hansen
WPS231 The World Bank Revised MinimumStandard Model Doug Addison May 1989 J. Onwuemene-
Kocha
WPS232 Kenya: Women and Food Security PHRWD
WPS233 Public Enterprise Reform in AdjustmentLending John Neglis
WPS234 A Consistency Framework MacroeconomicAnalysis William Easterly June 1989 R. Luz
61760