Embed Size (px)
Citation preview

WORLD AGRICULTURAL RESOURCES AND FOOD SECURITY
International Food Security
FRONTIERS OF ECONOMICSAND GLOBALIZATION
17
Series Editors:
HAMID BELADIUniversity of Texas at San Antonio, USA
E. KWAN CHOIIowa State University, USA
FRONTIERS OF ECONOMICS AND GLOBALIZATIONVOLUME 17
WORLD AGRICULTURALRESOURCES AND FOOD
SECURITY
International Food Security
Edited by
Andrew SchmitzUniversity of Florida, Gainesville, FL, USA
P. Lynn KennedyLouisiana State University, Baton Rouge, LA, USA
Troy G. SchmitzArizona State University, Mesa, AZ, USA
United Kingdom � North America � JapanIndia � Malaysia � China

Emerald Publishing Limited
Howard House, Wagon Lane, Bingley BD16 1WA, UK
First edition 2017
Copyright r 2017 Emerald Publishing Limited
Reprints and permissions service
Contact: [email protected]
No part of this book may be reproduced, stored in a retrieval system, transmitted in
any form or by any means electronic, mechanical, photocopying, recording or
otherwise without either the prior written permission of the publisher or a licence
permitting restricted copying issued in the UK by The Copyright Licensing Agency
and in the USA by The Copyright Clearance Center. Any opinions expressed in the
chapters are those of the authors. Whilst Emerald makes every effort to ensure the
quality and accuracy of its content, Emerald makes no representation implied or
otherwise, as to the chapters’ suitability and application and disclaims any
warranties, express or implied, to their use.
British Library Cataloguing in Publication Data
A catalogue record for this book is available from the British Library
ISBN: 978-1-78714-516-0 (Print)
ISBN: 978-1-78714-515-3 (Online)
ISBN: 978-1-78714-957-1 (Epub)
ISSN: 1574-8715 (Series)
Certificate Number 1985ISO 14001
ISOQAR certified Management System,awarded to Emerald for adherence to Environmental standard ISO 14001:2004.
CONTENTS
LIST OF CONTRIBUTORS xi
ACKNOWLEDGMENTS xv
1 ASSESSING THE IMPACT OF AGRICULTURAL R&D
INVESTMENTS ON LONG-TERM PROJECTIONS OF
FOOD SECURITY
1
Zuzana Smeets Kristkova, Michiel van Dijk and Hans van Meijl
1. Introduction 12. Methodology 3
2.1. The MAGNET model 32.2. Incorporation of R&D-driven technical change 42.3. Definition of scenarios 5
3. Results 74. Conclusions 13
References 14
2 THE NEXUS OF DIETARY GUIDELINES AND FOOD
SECURITY
19
Brandon McFadden and Troy G. Schmitz
1. Introduction 192. Dietary guideline history in the United States 213. Compliance with USDA dietary guidelines 274. The effects of income and access on compliance with
USDA dietary guidelines 285. The future of USDA dietary guidelines 296. Dietary guidelines beyond the United States 30
References 30
3 FOOD SECURITY THROUGH BIOTECHNOLOGY:
THE CASE OF GENETICALLY MODIFIED SUGAR
BEETS IN THE UNITED STATES
35
P. Lynn Kennedy, Karen E. Lewis and Andrew Schmitz
1. Introduction 362. Dimensions of food security 37

3. Theoretical framework 383.1. Scenario 1: Reduced sugar-beet acreage and constant
beet-sugar demand 403.2. Scenario 2: Fixed sugar-beet acreage and constant
beet-sugar demand 403.3. Scenario 3: Reduced sugar-beet acreage and decreased
beet-sugar demand 423.4. Scenario 4: Fixed sugar-beet acreage and reduced
beet-sugar demand 434. Price impact of increased beet-sugar yields 435. Quantitative example of increased beet-sugar yields 45
5.1. Fixed sugar-beet acreage versus fixed production 466. The interface between GM crop adoption and demand 467. Conclusions 48
References 49
4 WHAT WOULD HAPPEN IF WE DON’T HAVE GMO
TRAITS?
53
Farzad Taheripour and Wallace E. Tyner
1. Introduction 542. Analytical approach 553. The US study results 574. Global study results 615. Conclusions 64
References 65
5 CLIMATE CHANGE AND FOOD SECURITY: THREATS
AND ADAPTATION
69
Junyi Chen, Bruce A. McCarl and Anastasia Thayer
1. Introduction 702. Climate change and CO2 as observed and projected 703. Food security implications and findings 72
3.1. Food production 723.2. Food access 743.3. Food outlook 75
4. Adaptations of agriculture 754.1. Crop systems 764.2. Livestock systems 774.3. Fisheries and aquaculture systems 78
5. International trade 786. Research and development 797. Infrastructure 798. Discussion and further research 80
References 81
vi Contents

6 CLIMATE CHANGE AND FOOD SECURITY: FLORIDA’S
AGRICULTURE IN THE COMING DECADES
85
David Letson
1. Introduction 862. The Southeastern Climate Consortium 873. Agroclimate.org 884. El Nino�Southern Oscillation 895. Climate change is hard to comprehend 906. Secular trends in Florida’s climate 917. Sea level rise 948. Paris climate agreement impact for Florida agriculture 999. Conclusions 99
References 100
7 VEGETABLE PRODUCTION, DISEASES, AND CLIMATE
CHANGE
103
Andreas W. Ebert
1. Introduction 1042. Global vegetable production 1063. Vegetable diseases and insect pests and their relation to climate
change 1093.1. Sustainable disease and insect pest management
approaches 1124. Conclusions 116
References 117
8 U.S. AGRICULTURAL POLICY: IMPACTS ON
DOMESTIC AND INTERNATIONAL FOOD SECURITY
125
Vincent H. Smith and Joseph W. Glauber
1. Introduction 1262. U.S. agricultural policy: A brief overview 1263. U.S. agricultural policy: A more detailed assessment 129
3.1. Agricultural-insurance and disaster-aid programs 1293.2. Price and revenue support programs 1313.3. Conservation policy 1343.4. Publicly funded agricultural R&D 135
4. The 2007 renewable fuels standard 1365. U.S. food-aid programs 1366. Conclusions 138
References 138
viiContents

9 SUGARCANE YIELDS AND PRODUCTION: FLORIDA
AND LOUISIANA
143
Andrew Schmitz, P. Lynn Kennedy and Michael Salassi
1. Introduction 1432. Theoretical framework 1443. Sugarcane industry in Florida 146
3.1. Florida sugarcane overview 1463.2. Florida sugarcane yields 1473.3. Genetic contribution 149
4. Sugarcane industry in Louisiana 1504.1. Sugarcane plant-breeding efforts 1504.2. Mechanical harvesting 1504.3. Disease, insects, and weed infestation 1514.4. Mechanical-harvester adoption and increase in
farm size 1524.5. Private research and development 1524.6. Sugarcane production costs 1534.7. Sugarcane prices 154
5. Conclusions 154References 156
10 AQUACULTURE: ITS ROLE IN THE FUTURE OF FOOD 159James L. Anderson, Frank Asche, Taryn Garlock andJingjie Chu
1. Introduction 1602. Seafood production 1613. Seafood in the animal food system 164
3.1. Seafood trade 1664. Environmental issues 1685. Conclusions 169
References 170
11 FOOD SECURITY AND THE FOOD SAFETY
MODERNIZATION ACT
175
Lisha Zhang and James Seale Jr.
1. Introduction 1762. Overview of the Food Safety Modernization Act 1773. Method and data 1804. Estimated market prices of fresh tomatoes under FSMA 1815. Estimated profits changes for fresh-tomato producers after
FSMA 1826. Conclusions 187
References 187
viii Contents

12 AGRICULTURAL BIOTECHNOLOGY AND FOOD
SECURITY: CAN CETA, TPP, AND TTIP BECOME
VENUES TO FACILITATE TRADE IN GM PRODUCTS?
191
Crina Viju, Stuart J. Smyth and William A. Kerr
1. Introduction 1922. Potential for biotechnology to increase agricultural
productivity 1943. Assessment of three regional trade agreements 1964. Limits of trade agreements 2005. Conclusions 203
References 204
13 ASSESSING FOOD SECURITY IN ETHIOPIA 207Karen Thome, Birgit Meade, Stacey Rosen andJohn C. Beghin
1. Introduction 2082. Model framework 209
2.1. Summary 2092.2. Demand system specification 2102.3. Model calibration 2122.4. Quality scaling 2142.5. Food-security indicators 214
3. Food price shocks and their impacts 2154. Conclusions 217
References 218
14 THE COFFEE-FOOD SECURITY INTERFACE FOR
SUBSISTENCE HOUSEHOLDS IN JIMMA ZONE
ETHIOPIA
221
John C. Beghin and Yalem Teshome
1. Introduction 2222. Survey instrument 2233. Empirical analysis 224
3.1. Descriptive statistics of the sample 2243.2. Mean comparison between food-secure and
food-insecure households 2253.3. Logit analysis 229
4. Conclusions 231References 233
ixContents

15 ASSESSING FOOD SECURITY IN RURAL
BANGLADESH: THE ROLE OF A NONFARM
ECONOMY
241
Ashok K. Mishra and Aditya R. Khanal
1. Introduction 2422. Food security and measurement 2433. Empirical methodology 2454. Data and descriptive statistics 2485. Results and discussion 2516. Conclusions and policy implications 253
References 254
16 FOOD COSTS DURING THE FOOD CRISIS:
THE CASE OF TANZANIA
259
Donald Mitchell, Aneth Kayombo and Nancy Cochrane
1. Introduction 2592. The global food crisis 2623. Composition and cost of the typical diet 2644. Conclusions 271
References 273
17 FOOD LOSS AND WASTE AS AN ECONOMIC
AND POLICY PROBLEM
275
Ulrich Koester
1. Introduction 2762. Definition of FLW 2773. Contribution of FLW to food security objectives 2784. FLW and efficiency of resource use 2795. FLW and sustainability 2796. Methods for quantification of FLW 2807. Further research 2828. Policy activities 2829. Policies to reduce FLW in the value chain 283
9.1. FLW at the farm level 2839.2. FLW at the wholesale level 2849.3. FLW at the retailer level 2849.4. FLW at the household level 2859.5. FLW at the restaurant level 286
10. Conclusions 286References 286
INDEX 289
x Contents

LIST OF CONTRIBUTORS
James L. Anderson Institute for Sustainable Food Systems,University of Florida, Gainesville, FL, USA
Frank Asche Institute for Sustainable Food Systems,University of Florida, Gainesville, FL, USA
John C. Beghin Department of Agricultural and ResourceEconomics, North Carolina State University,NC, USA
Junyi Chen Texas A&M University, College Station,TX, USA
Jingjie Chu Global Practice for Environment and NaturalResources, The World Bank Group,Washington DC, USA
Nancy Cochrane USDA/ERS, Washington, DC, USA
Andreas W. Ebert World Vegetable Center, Shanhua, Tainan,Taiwan
Taryn Garlock Institute for Sustainable Food Systems,University of Florida, Gainesville, FL, USA
Joseph W. Glauber International Food Policy Research Institute,Washington, DC, USA
Aneth Kayombo USAID/SERA, Dar es Salaam, Tanzania
P. Lynn Kennedy Department of Agricultural Economics andAgribusiness, Louisiana State University,Baton Rouge, LA, USA
William A. Kerr Agricultural and Resource EconomicsDepartment, University of Saskatchewan,Saskatoon, Canada
Aditya R. Khanal Department of Agricultural andEnvironmental Sciences, Tennessee StateUniversity, Nashville, TN, USA
Ulrich Koester Christian-Albrechts-University, Kiel, Germany

David Letson Department of Marine Ecosystems andSociety, University of Miami/RSMAS, Miami,FL, USA
Karen E. Lewis Department of Agricultural and ResourceEconomics, University of Tennessee,Knoxville, TN, USA
Bruce A. McCarl Texas A&M University, College Station, TX,USA
Brandon McFadden Food and Resource Economics Department,University of Florida, Gainesville, FL, USA
Birgit Meade USDA/ERS, Washington, DC, USA
Ashok K. Mishra Morrison School of Agribusiness, WP CareySchool of Business, Arizona State University,Mesa, AZ, USA
Donald Mitchell USAID/SERA, Dar es Salaam, Tanzania
Stacey Rosen USDA/ERS, Washington, DC, USA
Michael Salassi Department of Agricultural Economics andAgribusiness, Louisiana State University,Baton Rouge, LA, USA
Andrew Schmitz Food and Resource Economics Department,University of Florida, Gainesville, FL, USA
Troy G. Schmitz Morrison School of Agribusiness, ArizonaState University, Mesa, AZ, USA
James Seale, Jr. Food and Resource Economics Department,University of Florida, Gainesville, FL, USA
Zuzana SmeetsKristkova
Department of International Policy,Wageningen Economic Research, The Hague,Netherlands; Faculty of Economics andManagement, Czech University of LifeSciences, Prague, Czech Republic
Vincent H. Smith Montana State University, Bozeman,MT, USA
Stuart J. Smyth Agricultural and Resource EconomicsDepartment, University of Saskatchewan,Saskatoon, Canada
Farzad Taheripour Purdue University, West Lafayette, IN, USA
Yalem Teshome Department of World Languages and Cultures,Iowa State University, Ames, IA, USA
xii List of Contributors

Anastasia Thayer Texas A&M University, College Station, TX,USA
Karen Thome USDA/ERS, Washington, DC, USA
Wallace E. Tyner Purdue University, West Lafayette, IN, USA
Michiel van Dijk Department of International Policy,Wageningen Economic Research, The Hague,Netherlands; Ecosystem Services andManagement Program, International Institutefor Applied Systems Analysis (IIASA),Laxenburg, Austria
Hans van Meijl Wageningen Economic Research, The Hague,Netherlands
Crina Viju Institute of European, Russian and EurasianStudies, Carleton University, Ottawa, Canada
Lisha Zhang Department of Agricultural Science, ClemsonUniversity, Clemson, SC, USA
xiiiList of Contributors

ACKNOWLEDGMENTS
We would like to thank all of those who contributed to this volume
entitled World Agricultural Resources and Food Security. This work
was made possible through funding provided by the Ben Hill Griffin,
Jr. Endowment, and by the National Institute for Food and Agriculture
(USDA Multistate Research Project, S-1062). We especially would like to
thank Carol Fountain for managing our overall project on food security.
We would also like to thank Carol Fountain and H. Carole Schmitz for
their editorial assistance. Without their tireless effort, this project would
not have been possible.
1
Assessing the Impact of Agricultural R&DInvestments on Long-Term Projections ofFood Security
Zuzana Smeets Kristkovaa,b, Michiel van Dijka,c and Hans van Meijla
aDepartment of International Policy, Wageningen Economic Research, Postal code: 2585 DB,
The Hague, Netherlands, Email address: [email protected], [email protected],
[email protected] of Economics and Management, Czech University of Life Sciences, Postal code:
16521, Prague, Czech RepubliccEcosystem Services and Management Program, International Institute for Applied Systems
Analysis (IIASA), Postal code: A-2361, Laxenburg, Austria
Abstract
The purpose of this chapter is to analyze the impact of public agriculturalResearch and Development (R&D) investments on agricultural productiv-ity and long-term food security to derive policy recommendations. Themethodological approach is based on the application of the state-of-theart Computable General Equilibrium (CGE) model to R&D. By endogen-izing R&D in global CGE models, it is possible to assess the impact of dif-ferent public R&D policies on the food availability and food access offood security. This study found that R&D investments bring positiveeffects on the food access dimension of food security, particularly in placessuch as Sub-Saharan Africa where prices are expected to growsignificantly by 2050, as agricultural land becomes scarcer and moreexpensive. Doubling the R&D intensity would soften the land constraintsand substantially decelerate food prices, thus preventing the deteriorationof living standards of rural households and leading to a gain in dailycaloric consumption. The impact of alternative agricultural R&D policieson the various dimensions of food security has not been analyzed using aCGE framework, which enables capturing both the benefits and costsfrom R&D investments. Modeling the dynamic accumulation of R&Dstocks makes it possible to analyze the effects of R&D on food securityover time.
Frontiers of Economics and GlobalizationVolume 17 ISSN: 1574-8715DOI: 10.1108/S1574-871520170000017001
Copyright © 2017 by Emerald Publishing LimitedAll rights reserved

Keywords: Agricultural productivity, CGE model, food security,land-augmenting technical change, MAGNET, public agricultural R&Dinvestments
JEL classifications: D5, Q16, Q18
1. Introduction
There are various challenges for reaching long-term sustainable agricul-
tural production and food security. On the one hand, there are increased
demand pressures resulting from ongoing population growth, improve-
ments in living standards in developing countries, and increased demand
from nonfood sources (e.g., renewable energy sources). On the other hand,
there are constraints on the production side due to climate change, limited
agricultural land, and reduced agricultural labor. The Food and
Agricultural Organization of the United Nations (FAO, 1996) estimates
that food production will need to be increased by 60% to feed a global
population of approximately 9 billion people in 2050. Around 80% of the
projected growth will have to come from intensification, predominantly an
increase in agricultural yields through better use of inputs (Alexandratos &
Bruinsma, 2012).Agricultural research and development (R&D) investments represent a
possible solution for the food-security challenge, especially in developing
countries where cereal yields are still well below the global average level.
Continuous investments in R&D are important from the perspective of all
four food-security dimensions, namely food availability, accessibility,
utilization, and stability (FAO, 1996). The availability dimension of food
security is associated with the physical supply of food. According to vari-
ous scholars (Alston, Andersen, James, & Pardey, 2009; Avila & Evenson,
2010; Fuglie, 2012; Pardey & Beddow, 2013), investments in R&D are
important drivers of agricultural productivity and food availability. R&D
investments in better seeds and varieties during the Green Revolution
resulted in lower agricultural prices, which contributed positively to the
accessibility dimension of food security. By increasing agricultural produc-
tivity, the corresponding farmer income gains can translate into better
nutrition, gains in dietary diversity, and improved health that affect
positively the utilization and stability dimensions of food security.Despite the key role of R&D investments when improving the dimen-
sions of food security, only a few global model studies have explicitly
assessed the impact of R&D investment on food security (Baldos, Hertel,
& Fuglie, 2015; Dietrich, Schmitz, Lotze-Campen, Popp, & Miller, 2014;
Hoddinot, Rosegrant, & Torero, 2012). These studies used partial equilib-
rium (PE) models such as International Model for Policy Analysis of
2 Zuzana Smeets Kristkova et al.

Agricultural Commodities and Trade (IMPACT) and Model of
Agricultural Production and its Impact on the Environment (MAgPIE)
that can simulate the agricultural sector but cannot address the impact of
agricultural R&D investment on the wider, global economy (for instance
through lower prices of agricultural commodities). Therefore, we use a
computable general equilibrium (CGE) model to analyze food security.The objective of this chapter is to provide projections of agricultural
production, food prices, and other food-security indicators toward 2050
with alternative scenarios of R&D investments. In the baseline scenario,
R&D investments follow a constant share in agricultural gross domestic
product (GDP). In the policy simulations, the impact of doubling and
tripling shares of R&D investments in agricultural GDP on food security
in targeted developing countries is analyzed, with the major focus on the
regions of Sub-Saharan Africa, South Asia, and Latin America. The
results are contrasted with a scenario in which land productivity follows
an exogenous trend, thus with no R&D investments.
2. Methodology
2.1. The MAGNET model
In this case, we use an extended variant of the Global Trade Analysis
Project (GTAP) model (Hertel & Hertel, 1997) known as the Modular
Applied GeNeral Equilibrium Tool (MAGNET) (Woltjer et al., 2014).
MAGNET is a neoclassical recursive dynamic multisector, multiregion
CGE model that has been widely used to simulate the impacts of agricul-
tural, trade, land use, and biofuel policies on global economic development
(Banse, Van Meijl, Tabeau, & Woltjer, 2008; Francois, Van Meijl, & Van
Tongeren, 2005; Nelson et al., 2014a, 2014b; Nowicki et al., 2009; Van
Meijl, Van Rheenen, Tabeau, & Eickhout, 2006). MAGNET includes an
improved treatment of agricultural sectors (such as the endogenous land
supply curve), agricultural policy, and biofuel policy. On the consumption
side, a dynamic CDE expenditure function is implemented that allows for
changes in income elasticities when purchasing power parity (PPP)-
corrected real GDP per capita changes. Segmentation and imperfect
mobility between agricultural and nonagricultural labor and capital are
introduced in the modeling of factor markets.For the analysis in this chapter, MAGNET uses GTAP database version
8, final release (Narayanan, Aguiar, & McDougall, 2013) which contains
data on the input-output structure for 140 countries for base year 2007. To
conduct the analysis, we aggregate the data to 25 production sectors, from
which 11 are primary agricultural sectors and 21 are regions (Appendix).
3Agricultural R&D and Food Security

2.2. Incorporation of R&D-driven technical change
We focus on public agricultural R&D targeted to major improvements ofseeds and varieties in the style of the Green Revolution. In other words,we assume that public agricultural R&D is responsible for biological tech-nical change in line with the reasoning of Piesse, Shimpeffeling, andThirtle (2011). Although one might argue that public R&D comprises alarger category than just land-oriented research, investment in improvingcrop varieties is still the key focus of publically funded research. We pro-pose a global empirically based approach to link R&D with productivitycoefficients applying the function of constant elasticity of substitution(CES) production structures in a global modeling framework. Besidesbeing empirically based, the advantage of linking public R&D to produc-tivity coefficients is that the agricultural sector benefits “freely” from thepublic R&D sector, while the government pays for all expenditures(increased governmental consumption is reflected in reduced savings tothe rest of the economy). Thus, the public goods component of agricul-tural R&D is well captured. The alternative and more common approachin the CGE literature is to include knowledge as a new production factorresulting from cumulative R&D efforts. In this way, knowledge is embed-ded in producers’ cost minimization, meaning that agricultural producershave to pay for investing in R&D which is more appropriate for modelingprivate R&D effects.
In line with our assumptions, a separate R&D sector was disaggre-gated from the public services sector in the social accounting matrix(SAM), the basic data structure of CGE models that reflects all markettransactions in an economy. A simple procedure of applying the share ofpublic R&D expenditures in the value of the output of public services wasapplied to all cost components. This means that the public R&D sectoremploys the same share of skilled and unskilled labor as other publicservices. Various data sources were compiled to derive the value of publicR&D expenditures for all 140 regions (Smeets Kristkova, Van Dijk, &Van Meijl, 2016). All values were converted to 2007 US dollars to homog-enize with values of other variables in SAM.
Following the empirical evidence on the specific shape of knowledgestocks distribution over time, a gamma distribution function was incorpo-rated in MAGNET for building R&D stocks from public R&D expendi-tures. In line with the evidence in the literature, regions were grouped intosix vintage groups. R&D investments in high-income regions such as theUnited States exhibit the longest lags corresponding to the nature of theresearch (basic research prevails). On the other hand, developing regionsare allocated to vintage groups with shorter lags due to the more adaptivenature of research (Table 1). Similarly, the elasticity values vary with thevintage groups and generally follow the pattern that the longer the R&Ddistribution lag is, the higher the return and the elasticity of technical
4 Zuzana Smeets Kristkova et al.
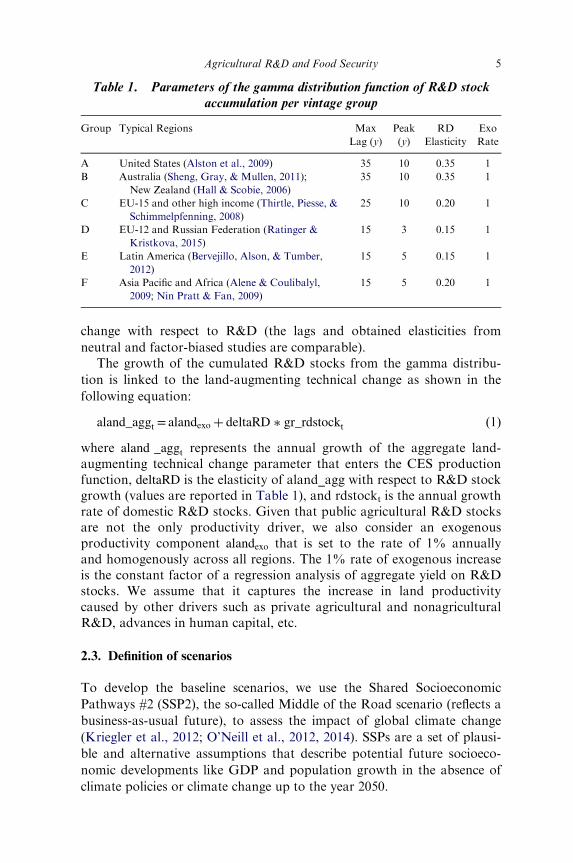
change with respect to R&D (the lags and obtained elasticities from
neutral and factor-biased studies are comparable).The growth of the cumulated R&D stocks from the gamma distribu-
tion is linked to the land-augmenting technical change as shown in the
following equation:
aland_aggt = alandexo þ deltaRD � gr_rdstockt ð1Þwhere aland _aggt represents the annual growth of the aggregate land-augmenting technical change parameter that enters the CES productionfunction, deltaRD is the elasticity of aland_agg with respect to R&D stockgrowth (values are reported in Table 1), and rdstockt is the annual growthrate of domestic R&D stocks. Given that public agricultural R&D stocksare not the only productivity driver, we also consider an exogenousproductivity component alandexo that is set to the rate of 1% annuallyand homogenously across all regions. The 1% rate of exogenous increaseis the constant factor of a regression analysis of aggregate yield on R&Dstocks. We assume that it captures the increase in land productivitycaused by other drivers such as private agricultural and nonagriculturalR&D, advances in human capital, etc.
2.3. Definition of scenarios
To develop the baseline scenarios, we use the Shared Socioeconomic
Pathways #2 (SSP2), the so-called Middle of the Road scenario (reflects a
business-as-usual future), to assess the impact of global climate change
(Kriegler et al., 2012; O’Neill et al., 2012, 2014). SSPs are a set of plausi-
ble and alternative assumptions that describe potential future socioeco-
nomic developments like GDP and population growth in the absence of
climate policies or climate change up to the year 2050.
Table 1. Parameters of the gamma distribution function of R&D stockaccumulation per vintage group
Group Typical Regions Max
Lag (y)
Peak
(y)
RD
Elasticity
Exo
Rate
A United States (Alston et al., 2009) 35 10 0.35 1
B Australia (Sheng, Gray, & Mullen, 2011);
New Zealand (Hall & Scobie, 2006)
35 10 0.35 1
C EU-15 and other high income (Thirtle, Piesse, &
Schimmelpfenning, 2008)
25 10 0.20 1
D EU-12 and Russian Federation (Ratinger &
Kristkova, 2015)
15 3 0.15 1
E Latin America (Bervejillo, Alson, & Tumber,
2012)
15 5 0.15 1
F Asia Pacific and Africa (Alene & Coulibalyl,
2009; Nin Pratt & Fan, 2009)
15 5 0.20 1
5Agricultural R&D and Food Security

Besides population and GDP, choices must be made regarding the
mechanism of governmental R&D spending. It is generally expected that
governments follow a constant agricultural research intensity ratio, being
considered as a “norm for reinvestment in the agricultural sector related
to size of the agricultural sector” (Beintema & Elliot, 2009, p. 12).
However, in some cases, imposing a constant share of agricultural R&D
in agricultural GDP does not reflect the research capacity and the expan-
sion of governmental spending. When comparing historical growth rates
of R&D investments (2007�2010) with simulation growth rates based on
constant R&D shares, large deviations are found, particularly for coun-
tries such as China and India. As highlighted in Pardey, Alston, and
Chan-Kang (2013), China and India have enjoyed considerably high
growth rates of public R&D investments that far outpace the growth of
their domestic agricultural sectors. To account for these inconsistencies,
regions were grouped into three categories (Table 2). The first category is
represented by regions, such as the European Union (EU), where it is
plausible to expect that future R&D investments follow a constant share
in agricultural GDP. The second group is represented by regions, such as
the Middle East, where R&D investments in agriculture are driven mostly
by governmental budget growth fueled by oil revenues rather than by
domestic agricultural sector. The third group is represented by regions,
such as China and India, where R&D expenditures might be either
heavily underestimated or excessively overrated into the future, so a
mixed solution is chosen that resembles best R&D historical growth rates.By applying the three different R&D mechanisms, baseline projections
of agricultural productivity and food security are obtained. However, in
many developing regions, particularly Sub-Saharan Africa and Asia, the
existing agricultural R&D intensity ratios are well below those of devel-
oped regions (0.5% vs. 2.5%); various R&D strategy documents call for
doubling the amount of R&D investments in Africa (Beintema & Elliott,
Table 2. Drivers of public agricultural R&D investment in MAGNET
R&D Mechanism Regions
Public agricultural R&D growth
follows agricultural GDP growth
Canada West Africa
United States Rest of Eastern Europe
Central America Rest of Western Europe
Brazil South Africa
Rest of South America Rest of South Asia
East Africa EU-16
Oceania EU-12
Public agriculture R&D growth
follows government budget growth
North Africa High-income Asia
Middle East Southeast Asia
Mixed approach (50% agricultural
GDP and 50% government budget)
India China
6 Zuzana Smeets Kristkova et al.
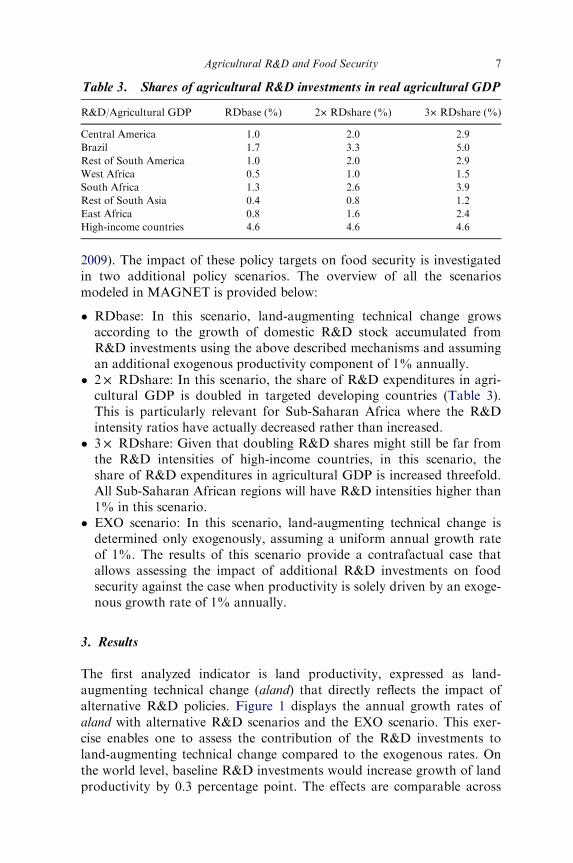
2009). The impact of these policy targets on food security is investigated
in two additional policy scenarios. The overview of all the scenarios
modeled in MAGNET is provided below:
• RDbase: In this scenario, land-augmenting technical change growsaccording to the growth of domestic R&D stock accumulated fromR&D investments using the above described mechanisms and assumingan additional exogenous productivity component of 1% annually.
• 2× RDshare: In this scenario, the share of R&D expenditures in agri-cultural GDP is doubled in targeted developing countries (Table 3).This is particularly relevant for Sub-Saharan Africa where the R&Dintensity ratios have actually decreased rather than increased.
• 3× RDshare: Given that doubling R&D shares might still be far fromthe R&D intensities of high-income countries, in this scenario, theshare of R&D expenditures in agricultural GDP is increased threefold.All Sub-Saharan African regions will have R&D intensities higher than1% in this scenario.
• EXO scenario: In this scenario, land-augmenting technical change isdetermined only exogenously, assuming a uniform annual growth rateof 1%. The results of this scenario provide a contrafactual case thatallows assessing the impact of additional R&D investments on foodsecurity against the case when productivity is solely driven by an exoge-nous growth rate of 1% annually.
3. Results
The first analyzed indicator is land productivity, expressed as land-
augmenting technical change (aland) that directly reflects the impact of
alternative R&D policies. Figure 1 displays the annual growth rates of
aland with alternative R&D scenarios and the EXO scenario. This exer-
cise enables one to assess the contribution of the R&D investments to
land-augmenting technical change compared to the exogenous rates. On
the world level, baseline R&D investments would increase growth of land
productivity by 0.3 percentage point. The effects are comparable across
Table 3. Shares of agricultural R&D investments in real agricultural GDP
R&D/Agricultural GDP RDbase (%) 2× RDshare (%) 3× RDshare (%)
Central America 1.0 2.0 2.9
Brazil 1.7 3.3 5.0
Rest of South America 1.0 2.0 2.9
West Africa 0.5 1.0 1.5
South Africa 1.3 2.6 3.9
Rest of South Asia 0.4 0.8 1.2
East Africa 0.8 1.6 2.4
High-income countries 4.6 4.6 4.6
7Agricultural R&D and Food Security

the regions. Tripling shares of R&D investment would boost annual land
productivity to be one-third of a percentage point higher than the exoge-
nous growth rate. In Sub-Saharan Africa, this would represent a 70%
increase of productivity in 2050 compared to 2010 (this would be a sub-
stantial productivity boost). Interestingly, growth rates of land productivity
in South America would be below 1% annually and comparably lower than
the world average if agricultural research intensity were to stay unchanged.
This is a result of a deceleration of the R&D stocks accumulation that
would occur after 2030. Boosting R&D shares in agricultural GDP would
bring important contributions to agricultural productivity in this region.An important question that arises when inspecting the evolution of
land-augmenting technical change is how these developments are trans-
lated in agricultural and food production. Figure 2 shows the annual
growth rates of agrifood production and the differences from the EXO
scenario. On the world level, it seems that R&D investments provide little
contribution to the quantity of agrifood production; however, the regional
effects are more noticeable. Particularly in West Africa, tripling the share
of R&D investments could improve the availability of food by 0.34
percentage point annually, or 40% more over the total period. Important
effects of R&D on food availability are found in the case of South
America, except for Brazil, where R&D policy would have negligible
effects on food production.
1.26
1.14
1.19
1.19
1.13
0.89
0.99
0.95
1.31
1.23
1.27
1.28
1.22
1.16
1.20
1.21
1.33
1.29
1.32
1.34
1.28
1.25
1.28
1.30
1.00
1.00
1.00
1.00
1.00
1.00
1.00
1.00
0.00 0.50 1.00 1.50
World
RestAsia
EaAfrica
SoAfrica
WeAfrica
CentrAmer
Brazil
RestSoAmer
% Annual growth (2010 – 2050)
EXO RD3xshare RD2xshare RDbase
0.26
0.14
0.19
0.19
0.13
–0.11
–0.01
–0.05
0.31
0.23
0.27
0.28
0.22
0.16
0.20
0.21
0.33
0.29
0.32
0.34
0.28
0.25
0.28
0.30
–0.20 0.00 0.20 0.40
World
Rest Asia
EaAfrica
SoAfrica
WeAfrica
CentrAmer
Brazil
RestSoAmer
Difference from EXO scenario (pp)
RD3xshare RD2xshare RDbase
Fig. 1. Annual growth of land-augmenting technical change (2010�2050).Source: Authors.
8 Zuzana Smeets Kristkova et al.

The availability of food is only one of the indicators of food security. It
is also important to assess economic access to food in future projections.
Figure 3 shows that the world agrifood prices might decline by about
0.5% annually, which reflects a gradual decline of prices in most regions
of the world. Conversely, agrifood prices in regions such as Sub-Saharan
Africa will continue rising. In the absence of any R&D investments and
assuming an autonomous 1% yield growth, agrifood prices might grow
between 0.85% and 1.7% annually. The increase in prices will be driven
by the limited availability of land. For land-scarce regions such as Sub-
Saharan Africa situated on the steep part of the land supply curve, further
increases in agricultural demand would have little effect on supplied agri-
cultural quantity but would have a substantial effect on both land and
agrifood prices. Conversely, for land-abundant countries situated at the
flat part of the land supply curve, the impact on land prices is limited.The impact of R&D investments on reducing food prices is notable.
Although agrifood prices will still face an increase, any additional R&D
investments will substantially decelerate price inflation. In the case of tri-
pling R&D shares, annual food prices would decelerate growth by 0.9
percentage point. Also, although food production would be unaffected by
R&D investments in Brazil, prices would decline and therefore the posi-
tive effects of food security in South America are mostly observed in the
food access dimension.
1.05
2.36
2.74
3.42
3.25
1.18
1.04
1.62
1.05
2.42
2.76
3.49
3.38
1.19
1.04
1.68
1.06
2.47
2.78
3.53
3.48
1.20
1.04
1.71
1.02
2.30
2.71
3.34
3.14
1.18
1.08
1.60
0.00 1.00 2.00 3.00 4.00
World
ReSoAsia
SoAfrica
EaAfrica
WeAfrica
CentrAmer
Brazil
RestSoAmer
%Annual growth (2010 – 2050)
EXO RD3xshare RD2xshare RDbase
0.03
0.06
0.03
0.07
0.11
0.00
–0.04
0.03
0.04
0.12
0.05
0.14
0.24
0.01
–0.03
0.08
0.04
0.17
0.06
0.19
0.34
0.02
–0.03
0.11
–0.20 0.00 0.20 0.40
World
ReSoAsia
SoAfrica
EaAfrica
WeAfrica
CentrAmer
Brazil
RestSoAmer
Difference from EXO (pp)
RD3xshare RD2xshare RDbase
Fig. 2. Annual growth of agrifood production volume (2010�2050).Source: Authors.
9Agricultural R&D and Food Security

Growth of food prices is only one of the indicators of food access. It is
also important to take into account the purchasing power of households
which may vary over time. Rural households that are dependent on agri-
cultural incomes are the most vulnerable. As an appropriate indicator, the
ratio of wages of unskilled labor in agriculture to the cereal price index is
chosen. Figure 4 compares this ratio between 2010 and 2050. Results show
that worldwide, food access by rural households would improve between
150% and 200% depending on the R&D investment scenario. Positive
growth in food access is particularly noted in Asia and South America,
whereas food access improvements in Sub-Saharan Africa are very moder-
ate. Moreover, in the absence of R&D investments, the purchasing power
of West African households dependent on low-skilled labor would decline
compared to 2010. Increasing R&D intensity would have important contri-
butions for improving the food access of rural households. The largest
contribution of tripling R&D shares is found in East Africa where living
standards could grow by 136% compared to 71% under constant R&D
intensity. Clearly, these projections estimate a large regional inequality of
food access in the future. Two factors play a role in explaining the opening
divide in food access. First, there is the growth of food prices in regions
such as Sub-Saharan Africa. Second, low wages in the agriculture sector
are projected to decline relative to wages in other sectors due to segmented
factor markets (i.e., farmers are locked into the agricultural sector). Rural
households will be more vulnerable than urban households to future
prices.
–0.53
0.33
1.36
0.74
1.39
–0.65
–1.10
–0.85
–0.58
0.23
1.33
0.65
1.05
–0.68
–1.14
–0.93
–0.62
0.16
1.31
0.59
0.81
–0.70
–1.17
–0.97
–0.38
0.51
1.43
0.85
1.70
–0.60
–1.01
–0.72
–2.00 0.00 2.00
World
ReSoAsia
SoAfrica
EaAfrica
WeAfrica
CentrAmer
Brazil
RestSoAmer
% Annual growth (2000 – 2050)
EXO RD3xshare RD2xshare RDbase
–0.15
–0.18
–0.07
–0.12
–0.31
–0.05
–0.09
–0.13
–0.21
–0.27
–0.10
–0.21
–0.65
–0.08
–0.14
–0.21
–0.24
–0.34
–0.12
–0.26
–0.89
–0.10
–0.17
–0.25
–1.00 –0.50 0.00
World
ReSoAsia
SoAfrica
EaAfrica
WeAfrica
CentrAmer
Brazil
RestSoAmer
Difference from EXO (pp)
RD3xshare RD2xshare RDbase
Fig. 3. Annual growth of agrifood prices (2000�2050). Source: Authors.
10 Zuzana Smeets Kristkova et al.

Figure 5 shows how food availability and food access are reflected in
total caloric consumption. On the world level, total increase of caloric
consumption per day would be about 600�700 kcal which represents an
increase from about 2,300 kcal in 2010 to 3,000 kcal in 2050. In Sub-
Saharan Africa, the increase in caloric consumption would be more than
1,000 kcal, exceeding average global caloric increase. The right-side of
Figure 5 shows how additional R&D investments are translated into
excess calories. For East Africa and West Africa, doubling R&D shares
would bring a gain of 100�150 kcal per day, and with triple shares,
households could consume 200 kcal per day more.Finally, Figure 6 provides an overview of the costs of R&D policies. In
Sub-Saharan Africa, cumulative nominal governmental spending on agri-
cultural R&D reaches between US$2 billion and US$6 billion, depending
on the agricultural research intensity. Total R&D spending of Sub-
Saharan Africa would represent only 2% of world R&D expenditures
(US$260 billion) in the baseline scenario, but would increase to 5% when
tripling R&D shares. R&D expenditures in the rest of South Asia would
grow from US$1 billion to US$3 billion, whereas in Brazil they would
exceed US$20 billion. When these costs are related to additional gains in
calories, it is found that obtaining an additional 100 kcal of nutrition per
day requires substantially less costs in Africa than in South America.
R&D costs per 100 kcal are US$2 billion in South Africa, US$1 billion in
186
192
70
71
–18
146
184
184
199
211
90
107
10
158
191
205
207
226
105
136
36
164
194
217
148
168
43
28
–39
135
175
154
–100 0 100 200 300
World
ReSoAsia
SoAfrica
EaAfrica
WeAfrica
CentrAmer
Brazil
RestSoAmer
% Growth Index 2050 vs 2010
EXO RD3xshare RD2xshare RDbase
37.9
24.0
27.0
42.3
21.5
10.6
8.8
30.2
50.5
42.9
46.7
79.1
49.5
22.3
15.5
51.5
58.8
57.6
61.3
107.9
75.2
28.6
19.0
63.8
0.0 50.0 100.0 150.0
World
ReSoAsia
SoAfrica
EaAfrica
WeAfrica
CentrAmer
Brazil
RestSoAmer
Difference from EXO (pp)
RD3xshare RD2xshare RDbase
Fig. 4. Ratio of unskilled wages in primary agriculture to cereal priceindex. Source: Authors.
11Agricultural R&D and Food Security

672
1,997
1,110
1,123
1,129
457
501
226
684
1,993
1,119
1,182
1,182
468
509
239
695
1,994
1,126
1,231
1,248
475
513
246
613
1,964
1,065
1,036
1,090
438
487
206
0 1,000 2,000 3,000
World
ReSoAsia
SoAfrica
EaAfrica
WeAfrica
CentrAmer
Brazil
RestSoAmer
Difference 2050 to 2010 (kcal per capita perday)
EXO RD3xshare RD2xshare RDbase
59
33
45
87
40
19
15
20
71
29
54
147
93
30
22
33
83
30
61
195
158
36
26
40
0 100 200 300
World
Rest Asia
SoAfrica
EaAfrica
WeAfrica
CentrAmer
Brazil
RestSoAmer
Difference from EXO (kcal per capita perday)
RD3xshare RD2xshare RDbase
Fig. 5. Absolute increase in total caloric consumption per capita per day.Source: Authors.
1,102
2,012
1,344
2,471
2,830
8,978
4,138
2,062
3,737
2,470
4,485
5,185
16,588
7,610
3,039
5,459
3,593
6,496
7,535
24,148
11,080
0 10,000 20,000 30,000
ReSoAsia
SoAfrica
EaAfrica
WeAfrica
CentrAmer
Brazil
RestSoAmer
Cumulative nominal R&D investments2010–2050 (mln USD)
RD3xshare RD2xshare RDbase
1,761
1,782
607
1,209
4,110
15,494
6,506
2,225
2,660
670
1,064
5,531
20,551
8,578
2,410
3,379
750
1,080
6,872
25,509
10,606
0 10,000 20,000 30,000
ReSoAsia
SoAfrica
EaAfrica
WeAfrica
CentrAmer
Brazil
RestSoAmer
R&D costs per 100 kcal per day(mln USD)
RD3xshare RD2xshare RDbase
Fig. 6. Cumulative R&D investments and R&D costs per excess calories.Source: Authors.
12 Zuzana Smeets Kristkova et al.
West Africa, and less than US$1 billion in East Africa, whereas they arebetween US$15 billion and US$25 billion in South America. It is alsointeresting to compare the costs of additional caloric consumption acrossthe scenarios. Whereas in South America, R&D costs per gained caloriegrow quickly with increasing R&D intensity, they remain almost constantin Sub-Saharan Africa.
4. Conclusions
In this chapter, the projections of food security toward 2050 with alterna-tive R&D policy scenarios were analyzed. By linking R&D investmentswith land productivity in global CGE models, it is possible to assess theimpact of different public R&D policies on food security. Such analysis isparticularly important for developing countries where food-security issuesare the most pertinent and the share of public R&D expenditures in agri-cultural GDP is still well below the share in most developed regions.
Concerning the impact of projected R&D investments on agriculturalproductivity, it was found that tripling the shares of R&D investments inagricultural GDP would boost the annual land-augmenting technicalchange in Sub-Saharan Africa by 70% in 2050 compared to that of 2010.As for Latin America, stimulating R&D intensity would be important foravoiding a decline of R&D stocks accumulation that is expected to occurafter 2030 in a baseline scenario.
With respect to food availability, the impact of R&D investments ismostly notable in land-scarce countries such as Sub-Saharan Africa,whereas in land-abundant countries such as Latin America, R&D invest-ments contribute little to the increase of agrifood production. Concerningfood access, the impact of R&D investments is more pronounced in devel-oping regions. In Sub-Saharan Africa, prices are expected to grow signifi-cantly by 2050 due to a high increase in food demand and land scarcity.The additional R&D investments will substantially decelerate food pricesin this situation as the land constraint is released by higher yields. InWest Africa, food prices would be 30% lower in 2050 than in the case ofno R&D investments.
The projections also show that toward 2050, a large regional inequalityof food access will be expected. Growth from low wages in agriculturewould not adequately compensate for the expected future growth in foodprices; this would result in a deterioration of the living standards of ruralhouseholds dependent on income from agriculture.
With respect to daily caloric consumption, it was found that stimulat-ing R&D investments in Sub-Saharan Africa can bring an additional 200kcal per capita. Moreover, the R&D costs of additional calories are nota-bly lower in Sub-Saharan Africa compared to Latin America. This pointsto the problem of current underinvestment in Sub-Saharan Africa, where
13Agricultural R&D and Food Security
additional R&D investments keep the benefit-cost ratio constant, as
opposed to Latin America, where R&D costs grow quicker than the gain
in calories. Stimulating shares of R&D investments in agricultural GDP
is a cost-effective policy that can contribute significantly to food security
in regions such as Sub-Saharan Africa.The policy implications following from this chapter are largely directed
toward higher support of national R&D investments in the developing
regions. As agricultural land becomes more limited, it will be crucial to
focus more R&D investments on land-augmenting technologies such as
new varieties of crops.
Acknowledgments
This work was supported by a Marie Curie Intra European Fellowship
within the 7th European Community Framework Program, METCAFOS
[Grant Number 625278], aimed at investigating the links between drivers of
technical change and sectoral growth integrated into a global CGE model
(MAGNET) with the purpose of improving projections of food security.
References
Alene, A. D., & Coulibaly, O. (2009). The impact of agricultural research
on productivity and poverty in sub-Saharan Africa. Food Policy, 34(2),
198�209.Alexandratos, N., & Bruinsma, J. (2012). World agriculture toward 2030/
2050: The 2012 revision. ESA Working Paper 12-3. Rome: FAO.Alston, J. M., Andersen, M. A., James, J. S., & Pardey, P. G. (2009).
Persistence pays: U.S. agricultural productivity growth and the benefits
from public R&D spending (Vol. 34). New York, NY: Springer Science
and Business Media.Avila, A. F. D., & Evenson, R. E. (2010). Total factor productivity
growth in agriculture: The role of technological capital. Handbook of
Agricultural Economics, 4, 3769�3822.Baldos, U. L. C., Hertel, T. W., & Fuglie, K. O. (2015). Climate change
adaptation through agricultural R&D investments: Implications for food
security and the environment. Retrieved from http://ageconsearch.umn.
edu/bitstream/205747/2/AAEA-RD-Adaptation-to-CC-05-27-2015.pdf.
Accessed on May 2.Banse, M., Van Meijl, H., Tabeau, A., & Woltjer, G. (2008). Will EU bio-
fuel policies affect global agricultural markets? European Review of
Agricultural Economics, 35(2), 117�141.
14 Zuzana Smeets Kristkova et al.

Beintema, N., & Elliott, H. (2009). Setting meaningful investment targetsin agricultural research and development: Challenges, opportunities andfiscal realities. Rome: FAO.
Bervejillo, J. E., Alston, J. M., & Tumber, K. P. (2012). The benefits frompublic agricultural research in Uruguay. Australian Journal ofAgricultural and Resource Economics, 56(4), 475�497.
Dietrich, J. P., Schmitz, C., Lotze-Campen, H., Popp, A., & Muller, C.(2014). Forecasting technological change in agriculture: An endoge-nous implementation in a global land use model. TechnologicalForecasting and Social Change, 81, 236�249.
Food and Agriculture Organization of the United Nations [FAO]. (1996).Rome declaration on world food security and world food summit plan ofaction. Rome: FAO.
Francois, J., Van Meijl, H., & Van Tongeren, F. (2005). Trade liberalizationin the Doha development round. Economic Policy, 20(42), 350�391.
Fuglie, K. O. (2012). Productivity growth and technology capital in theglobal agricultural economy. In K. O. Fuglie, S. L. Wang, & V. E. Ball(Eds.), Productivity growth in agriculture: An international perspective(pp. 335�369). Wallingford: CABI.
Hall, J., & Scobie, G. M. (2006). The role of R&D in productivity growth:The case of agriculture in New Zealand: 1927 to 2001. Wellington, NewZealand: The Treasury.
Hertel, T. W., & Hertel, T. W. (1997). Global trade analysis: Modelingand applications. Cambridge: Cambridge University Press.
Hoddinott, K. J., Rosegrant, M., & Torero, M. (2012). Hunger and mal-nutrition. New York, NY: Copenhagen Consensus Center.
Kriegler, E., O’Neill, B. C., Hallegatte, S., Kram, T., Lempert, R. J.,Moss, R. H., & Wilbanks, T. (2012). The need for and use of socio-economic scenarios for climate change analysis: A new approach basedon shared socio-economic pathways. Global Environmental Change,22(4), 807�822.
Narayanan, B., Aguiar, A., & McDougall, R. (2013). Global trade, assis-tance, and production: The GTAP 8 data base. Est Lafayette, Indiana:Purdue University.
Nelson, G. C., Mensbrugghe, D., Ahammad, H., Blanc, E., Calvin, K.,Hasegawa, T., … Willenbockel, D. (2014a). Agriculture and climatechange in global scenarios: Why don’t the models agree? AgriculturalEconomics, 45(1), 85�101.
Nelson, G. C., Valin, H., Sands, R. D., Havlık, P., Ahammad, H.,Deryng, D., … Willenbockel, D. (2014b). Climate change effects onagriculture: Economic responses to biophysical shocks. Proceedings ofthe National Academy of Sciences, 111(9), 3274�3279.
Nin Pratt, A., & Fan, S. (2009). R&D investment in national and interna-tional agricultural research: An ex ante analysis of productivity andpoverty impact. Washington, DC: IFPRI.
15Agricultural R&D and Food Security

Nowicki, P., Goba, V., Knierim, A., Van Meijl, H., Banse, M., Delbaere,
B., … Jansson, T. (2009). Update of analysis of prospects in the scenar
2020 study: Preparing for change. Retrieved from http://ec.europa.eu/
agriculture/analysis/external/scenar2020ii/report_en.pdf. Accessed on
May 2.O’Neill, B. C., Carter, T., Ebi, K. L., Edmonds, J., Hallegatte, S., Kemp-
Benedict, E., … Van Vuuren, D. P. (2012). Report of the workshop on
the nature and use of new socioeconomic pathways for climate change
research. Boulder, CO: NCAR.O’Neill, B. C., Kriegler, E., Riahi, K., Ebi, K. L., Hallegatte, S., Carter,
T. R., … van Vuuren, D. P. (2014). A new scenario framework for
climate change research: The concept of shared socioeconomic
pathways. Climatic Change, 122(3), 387�400.Pardey, P., & Beddow, J. (2013). Agricultural innovation: The United
States in a changing global reality. CCGA Report. Chicago, IL:
Chicago Council on Global Affairs.Pardey, P. G., Alston, J. M., & Chan-Kang, C. (2013). Public agricultural
R&D over the past half century: An emerging new world order.
Agricultural Economics, 44(s1), 103�113.Piesse, J., Schimmelpfennig, D., & Thirtle, C. (2011). An error correction
model of induced innovation in UK agriculture. Applied Economics,
43(27), 4081�4094.Ratinger, T., & Kristkova, Z. (2015). R&D Investments, technology
spillovers, and agricultural productivity, case of the Czech Republic.
Agricultural Economics, 61(7), 297�313.Sheng, Y., Gray, E. M., & Mullen, J. D. (2011, February). Public invest-
ment in R&D and extension and productivity in Australian broadacre
agriculture. Canberra: ABARES.Smeets Kristkova, Z., Van Dijk, M., & Van Meijl, H. (2016). Projections
of long-term food security with R&D driven technical change: A CGE
analysis. NJAS-Wageningen Journal of Life Sciences, 77, 39�51.Thirtle, C., Piesse, J., & Schimmelpfennig, D. (2008). Modeling the length
and shape of the R&D lag: An application to UK agricultural produc-
tivity. Agricultural Economics, 39(1), 73�85.Van Meijl, H., Van Rheenen, T., Tabeau, A., & Eickhout, B. (2006). The
impact of different policy environments on agricultural land use in
Europe. Agriculture, Ecosystems & Environment, 114(1), 21�38.Woltjer, G. B., Kuiper, M., Kavallari, A., Van Meijl, H., Powell, J. P.,
Rutten, M. … Tabeau, A. (2014). The MAGNET model: Module
description (No. 14-057, p. 146). Hague, The Netherlands: LEI-
Wageningen UR.
16 Zuzana Smeets Kristkova et al.

Appendix: Description of regions, production sectors, and periods applied inMAGNET
Regions Production Sectors Periods
1. Canada 1. pdra 1. p[1] 2007�2010
2. United States 2. whta 2. p[2] 2010�2020
3. Central America 3. graina 3. p[3] 2020�2030
4. Brazil 4. oilsa 4. p[4] 2030�2040
5. Rest of South America 5. sugara 5. p[5] 2040�2050
6. North Africa 6. horta
7. West Africa 7. cropsa
8. Rest of East Europe 8. cattlea
9. Rest of West Europe 9. pigpoula
10. South Africa 10. milka
11. Middle East 11. cmt
12. India 12. omt
13. Rest of South Asia 13. dairy
14. High-income Asia 14. sugar
15. Southeast Asia 15. vol
16. East Africa 16. ofd
17. EU-16 17. fish
18. EU-12 18. lowind
19. China 19. oth_ser
20. Oceania 20. oagra
21. RussiaStan 21. pub_ser
22. highind
23. rd
24. fossilfuel
25. CGDS
Total
Note: Sector description follows GTAP terminology (sector listing: https://www.gtap.agecon.
purdue.edu/databases/v9/v9_sectors.asp).
17Agricultural R&D and Food Security