Embed Size (px)
Citation preview

Sharing Data and Evidence about Making Wellness Programs Effective
Ron Z. Goetzel, Ph.D. Emory University & Truven Health Analytics
Worksite Health Promotion

2
WHAT PROBLEM ARE WE ATTEMPTING TO SOLVE? WE’RE SPENDING A BOATLOAD OF MONEY ON SICK CARE
• The United States spent $2.7 trillion in healthcare in 2010, or $8,680 for every man, woman and child.
• Per enrollee spending
• Private sector - $4,786
• Medicare - $11,610
• Medicaid - $7,434
• Government paid $1.2 trillion (45% of total), private businesses financed $558 billion (21%), and households incurred $749 billion (28%) in costs.
• Health expenditures as percent of GDP:
7.2 % in 1970
17.9% in 2011
Source: Hartman et al., Health Affairs, 32:1, January 16, 2013, 87-99

EMPLOYERS’ AND EMPLOYEES’ COSTS ARE RISING RAPIDLY
3
2005 2010 Percent Increase
Worker Contribution $2,713 $3,997 47% Employer Contribution $8,167 $9,773 20% Total $10,880 $13,770 27%
Average Annual Health Insurance Premiums and Worker Contributions for Family Coverage, 2005-2010
Source: Kaiser/HRET Survey of Employer-Sponsored Health Benefits, 2005-2010. http://ehbs.kff.org/

4
A RENEWED EMPHASIS ON INCREASING WORKER PRODUCTIVITY
• Introduce new technology
• Get workers to work more hours
• Make sure workers show up for work
• Make sure workers are mentally at work (presenteeism)
• Increase motivation to achieve at peak performance

5
KNOWLEDGE WORKERS
• Productivity is at an all time high – especially since businesses now need to do more with fewer workers
• But, $260B is wasted each year in the U.S. on health-related productivity losses
Source: Mattke et al, AJMC, 2007, 13:4, 211-217.

6
THE FALLOUT FROM A PUSH FOR HIGHER PRODUCTIVITY
• Increased job demands
• Detachment and depersonalization
• Increased health care usage
• Increased absenteeism
• Low job morale
• Increased disability rates
• On the job accidents
• Work - life imbalance
• High stress

7
INCREASED HEALTH AND PRODUCTIVITY RISKS
MEDICAL Chest/back pain, heart disease, GI disorders, headaches, dizziness, weakness, repetitive motion injuries.
PSYCHOLOGICAL Anxiety, aggression, irritability, apathy, boredom, depression, loneliness, fatigue, moodiness, insomnia.
BEHAVIORAL Accidents, drug/alcohol abuse, eating disorders, smoking, tardiness, “exaggerated” diseases.
ORGANIZATIONAL Absence, work relations, turnover, morale, job satisfaction, productivity.

8
WHY IS HEALTH CARE SO EXPENSIVE?
Source: K.E. Thorpe, "The Rise in Health Care Spending and What to Do About It," Health Affairs 24, no. 6 (2005): 1436-1445; and K.E. Thorpe et al., "The Impact of Obesity on Rising Medical Spending," Health Affairs 23, no. 6 (2004): 480-486.
Innovation/advancing technology (pharmacologic, devices, treatments)
• Newborn delivery costs – five-fold increase from 1987-2002
– NICU, incubators, ventilators, C-sections
• New/better medicines for treating disease – Depression (SSRI introduction – 45% treated in
1987 to 80% treated in 1997 – Allergies (Claritan, Allegra, …)
• New treatment thresholds – Blood pressure – High blood glucose – Hyperlipidemia
Rise in spending for treated diseases (37%)
Ken Thorpe
9
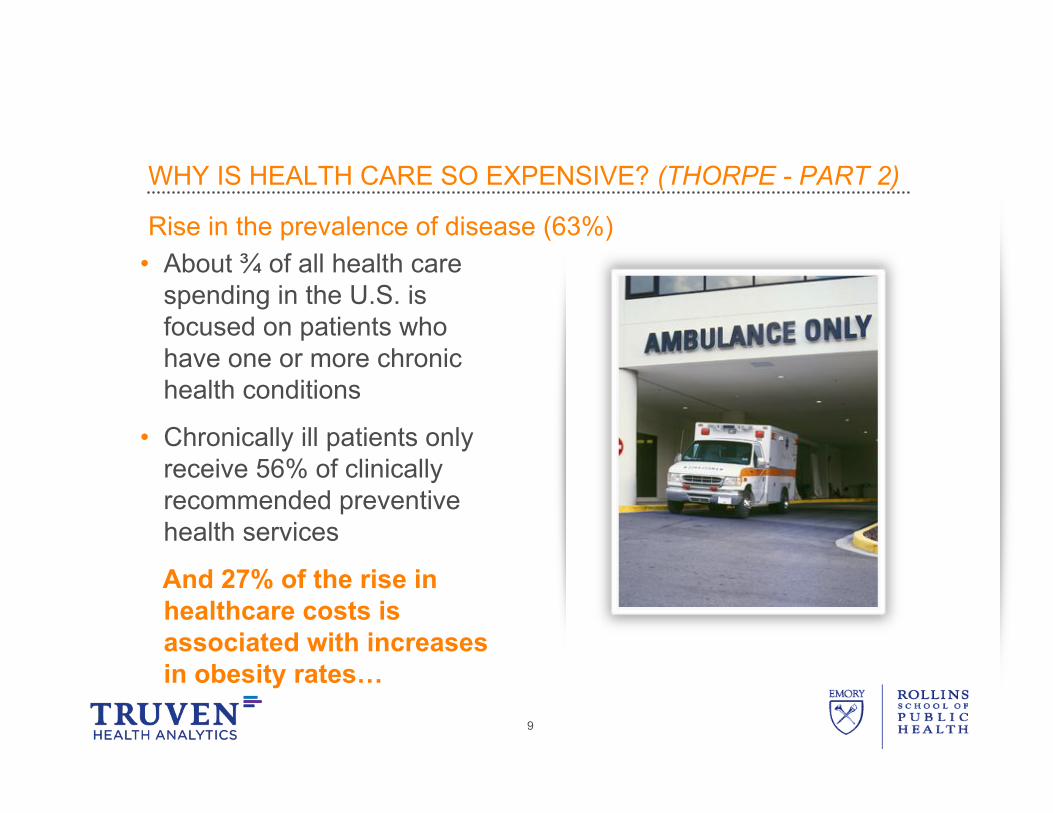
WHY IS HEALTH CARE SO EXPENSIVE? (THORPE - PART 2)
• About ¾ of all health care spending in the U.S. is focused on patients who have one or more chronic health conditions
• Chronically ill patients only receive 56% of clinically recommended preventive health services
And 27% of the rise in healthcare costs is associated with increases in obesity rates…
Rise in the prevalence of disease (63%)

10#
No Data <10% 10%–14% 15%–19% 20%–24% 25%–29% ≥30%
PREVALENCE OF OBESITY
1990 1996 2006
PREVALENCE OF DIABETES (Among US adults; BRFSS)
No Data <4% 4%–6% 6%–8% 8%–10% >10%

11
ENVIRONMENTAL CORRELATES OF OBESITY
More driving • Rise in car ownership • Increase in driving shorter distances • Less walking and bicycling
At home, more convenience • Increase use of “labor saving” devices • Increase in ready-made foods • Increase in television viewing, computers, and video games
At work • Sedentary occupational fields (“knowledge workers”)
In public • More elevators, escalators, automatic doors and moving
sidewalks

12
AWAY-FROM-HOME FOOD CONSUMPTION HAS DOUBLED
Source: Food Consumption (per capita) Data System, USDA, Economic Research Service
Share of total food expenditures Calories Consumed

13
SO, WHAT’S THE SOLUTION? IT SEEMS SO LOGICAL… If you improve the health and well being of your employees…
…quality of life improves
…health care utilization is reduced
…disability is controlled
…productivity is enhanced
14
WHAT IS THE EVIDENCE BASE?
• A large proportion of diseases and disorders is preventable. Modifiable health risk factors are precursors to a large number of diseases and disorders and to premature death (Healthy People 2000, 2010, Amler & Dull, 1987, Breslow, 1993, McGinnis & Foege, 1993, Mokdad et al., 2004)
• Many modifiable health risks are associated with increased health care costs within a relatively short time window (Milliman & Robinson, 1987, Yen et al., 1992, Goetzel, et al., 1998, Anderson et al., 2000, Bertera, 1991, Pronk, 1999)
• Modifiable health risks can be improved through workplace sponsored health promotion and disease prevention programs (Wilson et al., 1996, Heaney & Goetzel, 1997, Pelletier, 1991, 1993, 1996, 1999, 2001, 2005, 2009, 2011)
• Improvements in the health risk profile of a population can lead to reductions in health costs (Edington et al., 2001, Goetzel et al., 1999, Carls et al., 2011))
• Worksite health promotion and disease prevention programs save companies money in health care expenditures and produce a positive ROI (Johnson & Johnson 2002, Citibank 1999-2000, Procter and Gamble 1998, Chevron 1998, California Public Retirement System 1994, Bank of America 1993, Dupont 1990, Highmark, 2008, Johnson & Johnson, 2011)

15
POOR HEALTH COSTS MONEY
Drill Down…
• Medical
• Absence/work loss
• Presenteeism
• Risk factors

THE COST OF CHRONIC DISEASE
TOP 10 MOST COSTLY PHYSICAL HEALTH CONDITIONS Medical, Drug, Absence, STD Expenditures (1999 annual $ per eligible), by Component
Source: Goetzel, Hawkins, Ozminkowski, Wang, JOEM 45:1, 5–14, January 2003.
16
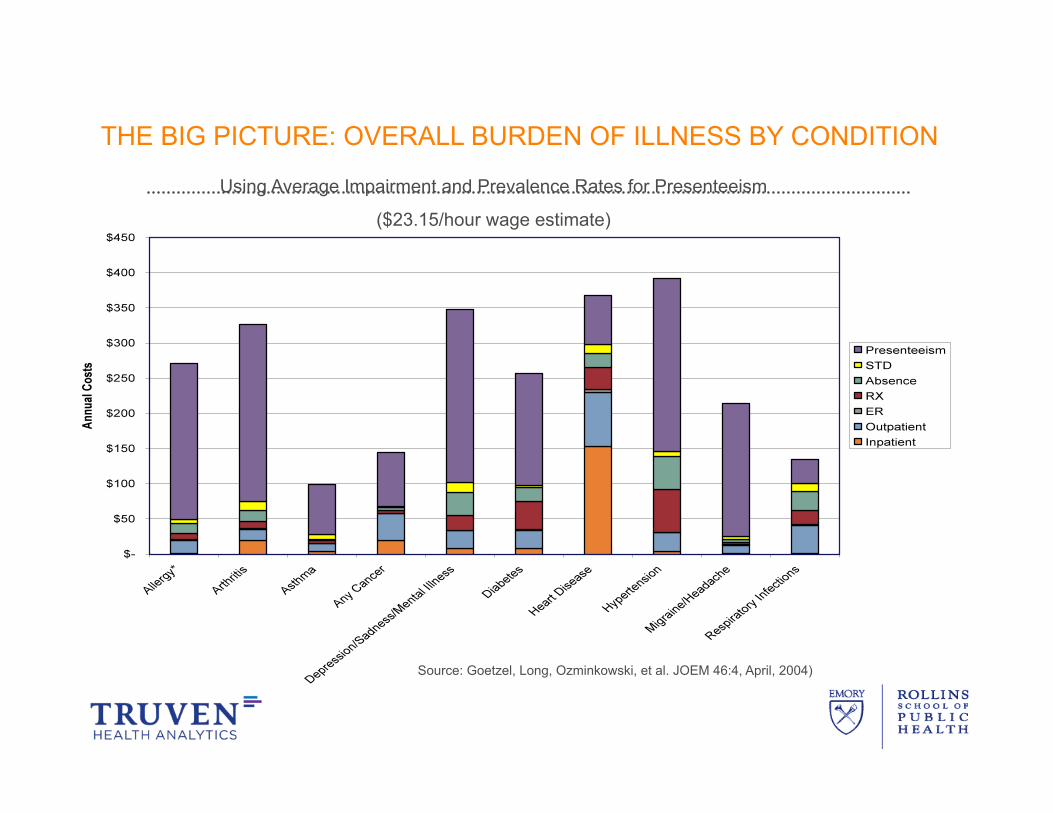
THE BIG PICTURE: OVERALL BURDEN OF ILLNESS BY CONDITION
Using Average Impairment and Prevalence Rates for Presenteeism
($23.15/hour wage estimate)
Source: Goetzel, Long, Ozminkowski, et al. JOEM 46:4, April, 2004)

HERO II STUDY – PUBLISHED NOV. 2012
18

RISK-COST IMPACTS – HERO II
19

RESEARCH ON RISK-COST RELATIONSHIPS - NOVARTIS
20

RISK FACTORS AND PRESENTEEISM (N = 5,875)
21

RISK-COST RELATIONSHIPS AT PEPSICO
22

BMI BREAKDOWN BY CATEGORY

PEPSICO – OVERWEIGHT / OBESE ANALYSIS (N=11,217)
*At least one difference significant at the 0.05 level
Source: Henke RM, Carls GS, Short ME, Pei X, Wang S, Moley S, Sullivan M, Goetzel RZ. The Relationship between Health Risks and Health and Productivity Costs among Employees at Pepsi Bottling Group. J Occup Environ Med. 52, 5, May 2010.
Difference between combined overweight/obese categories and normal weight is displayed
Diff = 29%, $613*
Diff = 58%, $111*
Diff = 25%, $987
Diff = 10%, $28
Diff = 7%, $49
Diff = 26%, $186*
• 74% of the sample is overweight or obese
24
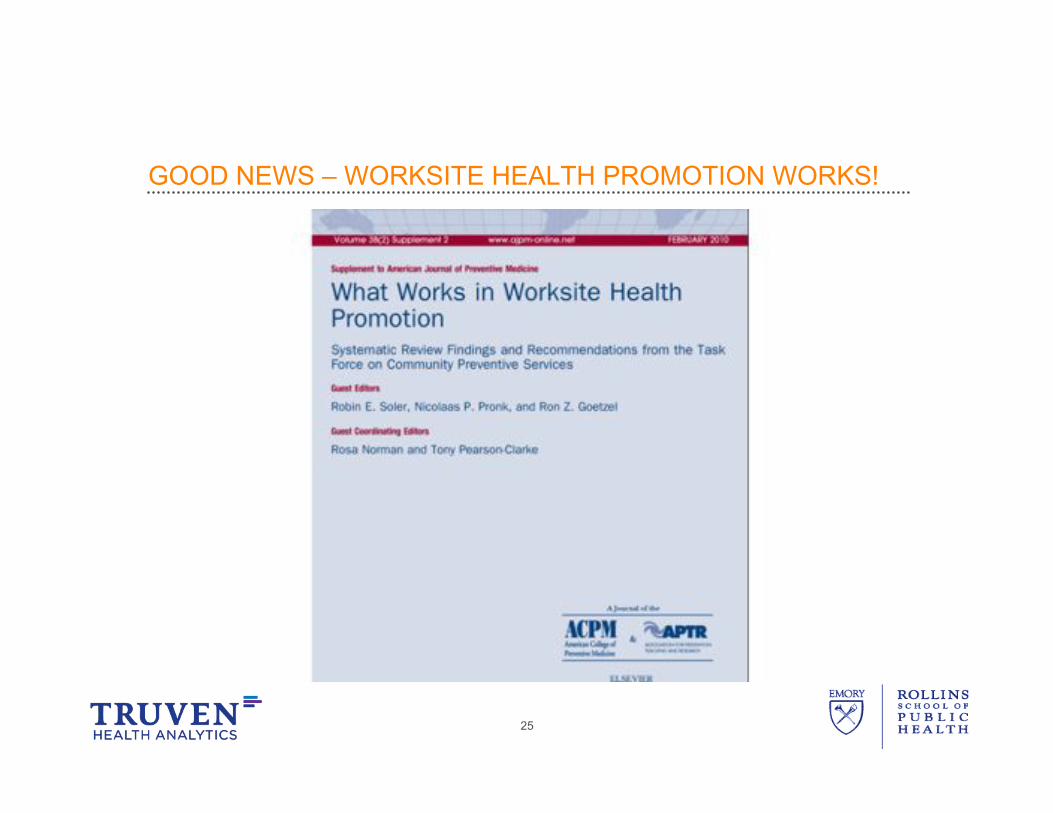
GOOD NEWS – WORKSITE HEALTH PROMOTION WORKS!
25
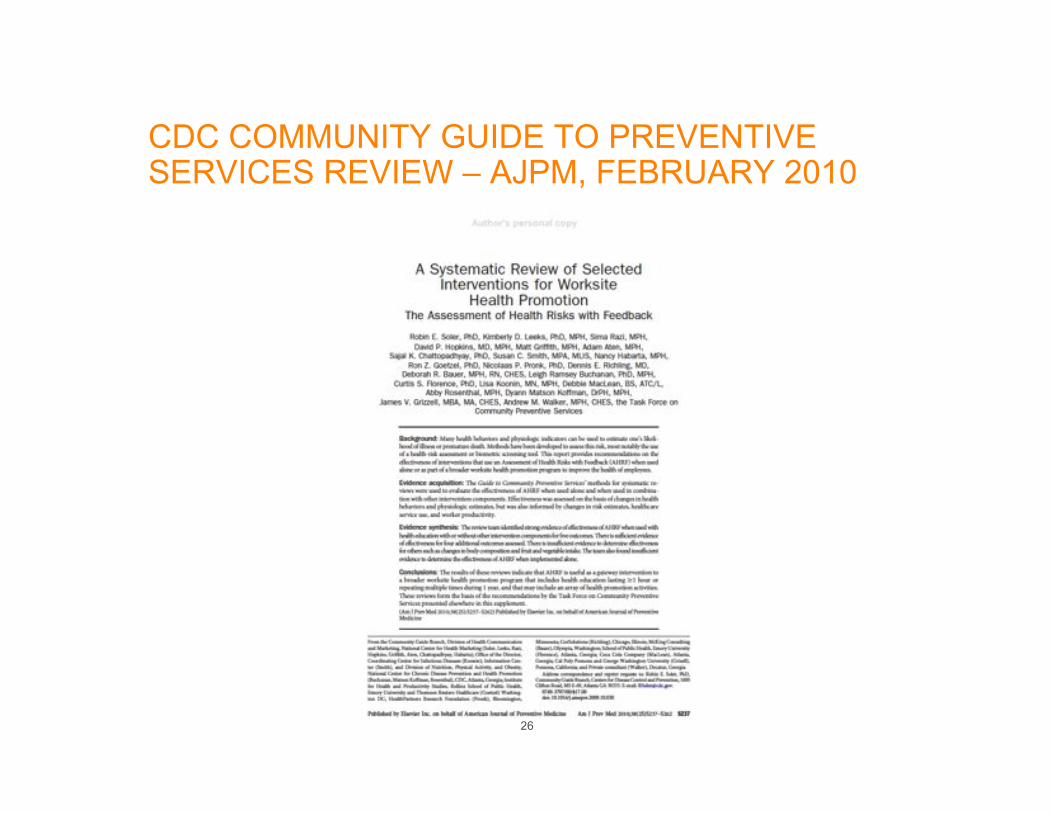
CDC COMMUNITY GUIDE TO PREVENTIVE SERVICES REVIEW – AJPM, FEBRUARY 2010
26

27
SUMMARY RESULTS AND TEAM CONSENSUS
Outcome Body of
Evidence Consistent
Results Magnitude of
Effect Finding
Alcohol Use 9 Yes Variable Sufficient
Fruits & Vegetables
% Fat Intake
9
13
No
Yes
0.09 serving
-5.4%
Insufficient
Strong
% Change in Those Physically Active
18 Yes +15.3 pct pt Sufficient
Tobacco Use
Prevalence
Cessation
23 11
Yes
Yes
–2.3 pct pt
+3.8 pct pt
Strong
Seat Belt Non-Use 10 Yes –27.6 pct pt Sufficient

28
Outcome Body of
Evidence Consistent
Results Magnitude of Effect Finding
Diastolic blood pressure
Systolic blood pressure
Risk prevalence
17 19 12
Yes
Yes
Yes
Diastolic:–1.8 mm Hq
Systolic:–2.6 mm Hg
–4.5 pct pt
Strong
BMI
Weight
% body fat
Risk prevalence
6 12 5 5
Yes
No
Yes
No
–0.5 pt BMI
–0.56 pounds
–2.2% body fat
–2.2% at risk
Insufficient
Total Cholesterol
HDL Cholesterol
Risk prevalence
19 8 11
Yes
No
Yes
–4.8 mg/dL (total)
+.94 mg/dL
–6.6 pct pt
Strong
Fitness 5 Yes Small Insufficient
SUMMARY RESULTS AND TEAM CONSENSUS
29
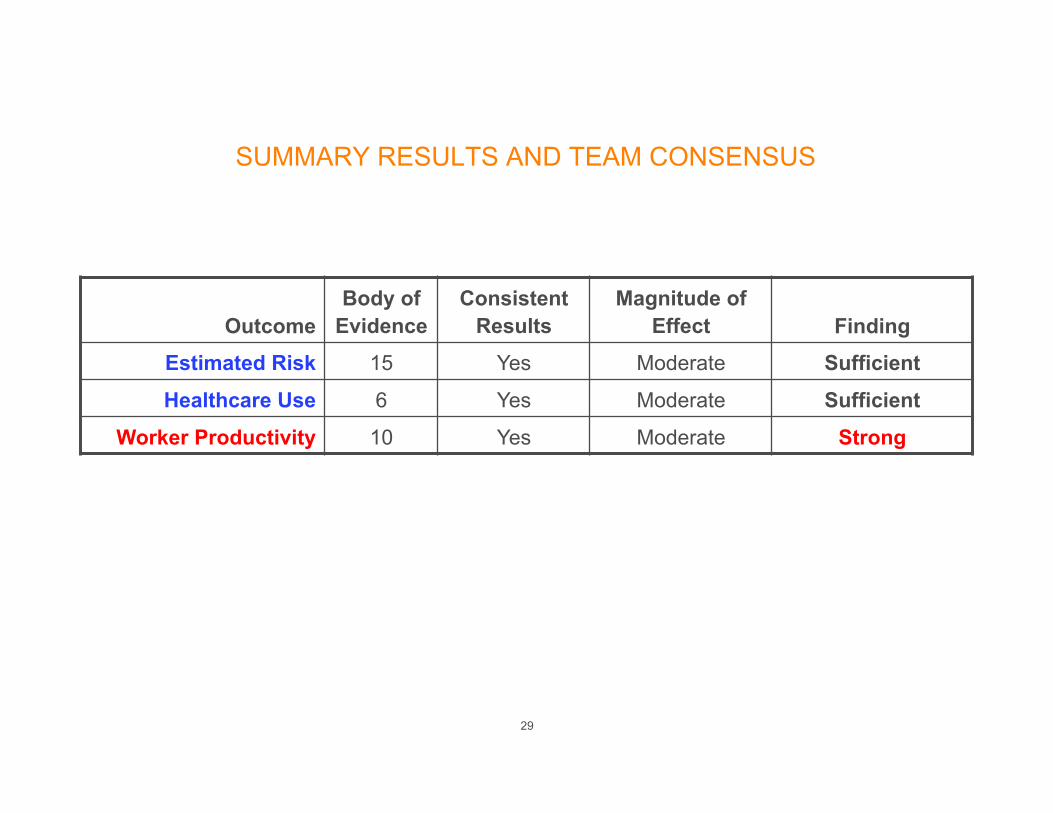
SUMMARY RESULTS AND TEAM CONSENSUS
Outcome Body of
Evidence Consistent
Results Magnitude of
Effect Finding
Estimated Risk 15 Yes Moderate Sufficient
Healthcare Use 6 Yes Moderate Sufficient
Worker Productivity 10 Yes Moderate Strong

WHAT ABOUT ROI? CRITICAL STEPS TO SUCCESS
Reduced Utilization
Risk Reduction
Behavior Change
Improved Attitudes
Increased Knowledge
Participation
Awareness
Financial ROI
30

HEALTH AFFAIRS ROI LITERATURE REVIEW Baicker K, Cutler D, Song Z. Workplace Wellness Programs Can Generate Savings. Health Aff (Millwood). 2010; 29(2). Published online 14 January 2010.
31

RESULTS - MEDICAL CARE COST SAVINGS Description N Average ROI
Studies reporting costs and savings
15 $3.37
Studies reporting savings only 7 Not Available
Studies with randomized or matched control group
9 $3.36
Studies with non-randomized or matched control group
6 $2.38
All studies examining medical care savings
22 $3.27
32

RESULTS – ABSENTEEISM SAVINGS Description N Average ROI
Studies reporting costs and savings
12 $3.27
All studies examining absenteeism savings
22 $2.73
33

CASE STUDIES

35
CITIBANK, N.A. HEALTH MANAGEMENT PROGRAM EVALUATION
TITLE Citibank Health Management Program (HMP)
INDUSTRY
TARGET POPULATION
Banking/Finance
DESCRIPTION
CITATIONS
47,838 active employees eligible for medical benefits
• A comprehensive multi-component health management program • Aims to help employees improve health behaviors, better manage chronic conditions, and
reduce demand for unnecessary and inappropriate health services, • And, in turn, reduce prevalence of preventable diseases, show significant cost savings,
and achieve a positive ROI.
• Ozminkowski, R.J., Goetzel, R.Z., Smith, M.W., Cantor, R.I., Shaunghnessy, A., & Harrison, M. (2000). The Impact of the Citibank, N.A., Health Management Program on Changes in Employee Health Risks Over Time. JOEM, 42(5), 502-511.
• Ozminkowski, R.J., Dunn, R.L., Goetzel, R.Z., Cantor, R.I., Murnane, J., & Harrison, M. (1999). A Return on Investment Evaluation of the Citibank, N.A., Health Management Program. AJHP, 44(1), 31-43.

36
PROGRAM COMPONENTS
Questionnaire 1 (Program Entry and Channeling
beginning January 1994
Letter/Report 1 High-Risk Letter/Report 1
High-Risk Questionnaire Letter/Report 2
High-Risk Questionnaire Letter/Report 3
High-Risk Questionnaire Letter/Report 4
Books, Audiotapes, Videotapes
Books, Audiotapes, Videotapes
Books, Audiotapes, Videotapes
Books, Audiotapes, Videotapes
Timeline (months)
80% Low Risk 20% High Cost Risk
3 M
ON
THS
6 M
ON
THS
9 M
ON
THS
Self-Care Materials

37
PROGRAM PARTICIPATION
47,838 54.3%
$10 3,000
All 47,838 active employees were eligible to participate.
The participation rate was 54.3 percent.
Participants received a $10 credit for Citibank’s Choices benefit plan enrollment for the following year.
Approximately 3,000 employees participated in the high risk program each year it was offered.
38
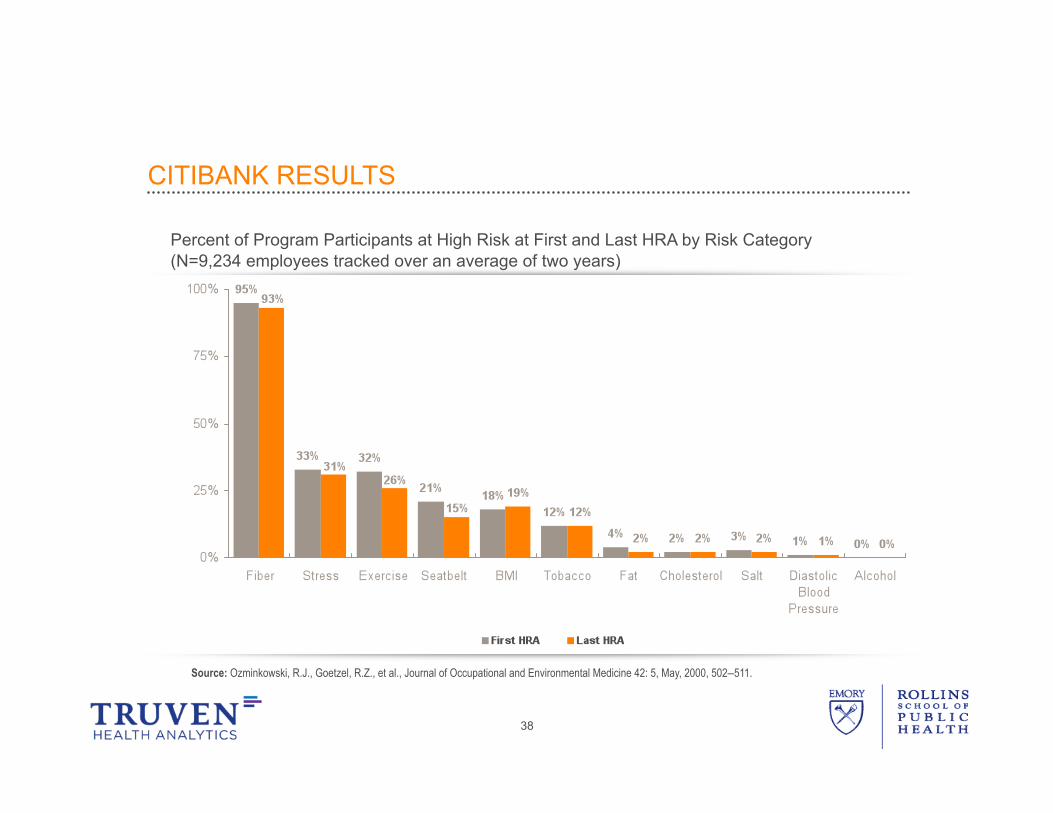
Source: Ozminkowski, R.J., Goetzel, R.Z., et al., Journal of Occupational and Environmental Medicine 42: 5, May, 2000, 502–511.
CITIBANK RESULTS
Percent of Program Participants at High Risk at First and Last HRA by Risk Category (N=9,234 employees tracked over an average of two years)

39
CITIBANK RESULTS
Unadjusted Impact**
Adjusted Impact**
Net improvement* of at least 1 category versus others (N = 1,706)
-$1.86† -$1.91
Net improvement* of at least 2 categories versus others (N = 391)
-$5.34 -$3.06
Net improvement* of at least 3 categories versus others (N = 62)
-$146.87† -$145.77 ‡
Impact of improvement in risk categories on medical expenditures per month
*Net Improvement refers to the number of categories in which risk improved minus number of categories in which risk stayed the same or worsened.
**Impact = change in expenditures for net improvers minus change for others. Negative values imply program savings, since expenditures did not increase as much over time for those who improved, compared to all others
† p < 0.05, ‡ p < 0.01

40
CITIBANK: MEDICAL SAVINGS Citibank Medical Population
Adjusted Mean Net Payments for the Pre- and Post-HRA periods
Total savings associated with program participation for 11,219 participants over an average of 23 months post-HRA is $8,901,413* * Based on $34.03 savings and 23.31054 months post-HRA for 11,219 participants

41
CITIBANK HEALTH MANAGEMENT PROGRAM ROI
$1.9 million*
PROGRAM COSTS
$8.9 million*
PROGRAM BENEFITS
$7.0 million*
PROGRAM SAVINGS
Notes: 1996 dollars @ 0 percent discount. Slightly lower ROI estimates after discounting by either 3% or 5% per year.
ROI = $4.70 in benefits for every $1.00 in costs

42
Source: Goetzel, R.Z., Jacobson, B.H., Aldana, S.G., Vardell, K., and Yee, L. Journal of Occupational and Environmental Medicine, 40:4, April, 1998.
PROCTER & GAMBLE
Total Annual Medical Costs For Participants and Non-Participants In Health Check (1990 - 1992) Adjusted for age and gender; Significant at p < .05 *In year 3 participant costs were 29% lower producing an ROI of 1.49 to 1.00

43
HIGHMARK ROI STUDY • Regional health plan with approximately 12,000 workers
• Headquartered in Pittsburgh, with a major operating facility in Camp Hill, PA and other locations in Johnstown, Erie, and Williamsport, PA.
• Worksite Health Promotion Program (introduced in 2002) – health risk assessments (HRAs) – online programs in nutrition, weight management and stress
management – tobacco cessation programs – on-site nutrition and stress classes – individual nutrition and tobacco cessation coaching – biometric screenings – six- to twelve-week campaigns to increase fitness participation and
awareness of disease prevention strategies – state-of-the-art fitness centers (Pittsburgh and Camp Hill, PA) Source: Naydeck, Pearson, Ozminkowski, Day, Goetzel. The Impact of the Highmark Employee Wellness Programs on Four-Year Healthcare Costs. JOEM, 50:2, February 2008

44
Calendar Year 2001 All Participants Non-Participants N = 1890 N = 1890 P-value
Male, n (%) 484 (25.6) 484 (25.6) 0.98 Age, 2001 mean years 41.7 41.6 0.94 Net payments for healthcare expenditures in 2001, mean $1,414 $1,318 0.94
Comorbidity Prevalence, % Heart disease, n(%) 183 (9.7) 184 (9.7) Diabetes, n(%) 13 (0.7) 13 (0.7) 0.99 CCI Group 1 comorbidity, n(%) 849 (44.9) 849 (44.9) 0.98 CCI Group 2 comorbidity, n(%) 528 (27.9) 528 (27.9) 0.98 CCI, median (range) 1.75 (0-17) 1.75 (0-18) 0.97
CHARACTERISTICS USED IN MATCHING SUBJECTS – AIM IS TO SHOW PARTICIPANTS AND NON-PARTICIPANTS ARE NOT STATISTICALLY DIFFERENT
Overall Comparison
CCI = Charlson comorbidity index; Group 1 comorbidity includes presence of any of these: chronic obstructive pulmonary disease, rheumatologic disease stomach ulcer or dementia, all as coded by using the Charlson index; Group 2 comorbidity includes presence of any of these: cancer, renal failure, liver disease or cirrhosis, autoimmune disease.

45
ANNUAL GROWTH IN NET PAYMENTS
Sta
rt of
Pro
gram
Annual growth in costs, Highmark, Inc. For matched-participants and non-participants over four years`

46
Net Payments β Estimate
Intercept -964.51 All participants, (n=1892) -176.47 Male gender 497.09
Age, per year 46.05
Heart disease at baseline 576.59 Diabetes at baseline 1704.01 Group 1 comorbidity 1133.20 Group 2 comorbidity 397.80 Annual savings estimate from participation (β*n) $333,881 Per person estimate 176.47
ESTIMATED ANNUAL SAVINGS AFTER FOUR YEARS OF FOLLOW-UP — PARTICIPANTS VERSUS NON-PARTICIPANTS — ADJUSTED FOR CONFOUNDERS
Participants versus Non-participants

47
Cost-Benefit (ROI) Analysis
Wellness Program Costs, Highmark, inflation-adjusted to 2005 dollars

48
JOHNSON & JOHNSON HEALTH AND WELLNESS PROGRAM EVALUATION
TITLE J & J Health and Wellness Program (H & W)
INDUSTRY
TARGET POPULATION
Healthcare
DESCRIPTION
CITATIONS
43,000 U.S. based employees
• Comprehensive, multi-component worksite health promotion program • Evolved from LIVE FOR LIFE in 1979
• Goetzel, R.Z., Ozminkowski, R.J., Bruno, J.A., Rutter, K.R., Isaac, F., & Wang, S. (2002). The Long-term Impact of Johnson & Johnson’s Health & Wellness Program on Employee Health Risks. JOEM, 44(5), 417-424.
• Ozminkowski, R.J., Ling, D., Goetzel, R.Z., Bruno, J.A., Rutter, K.R., Isaac, F., & Wang, S. (2002). Long-term Impact of Johnson & Johnson’s Health & Wellness Program on Health Care Utilization and Expenditures. JOEM, 44(1), 21-29.

49
HEALTH & WELLNESS PROGRAM IMPACT ON EMPLOYEE HEALTH RISKS (N=4,586)
High Risk Group
After an average of 2¾ years, risks were reduced in eight categories but increased in four related categories: body weight, dietary fat consumption, risk for diabetes, and cigar use.

50
JOHNSON & JOHNSON HEALTH & WELLNESS PROGRAM IMPACT ON MEDICAL COSTS (1996-1999 vs. 1990-1995)
Source: Ozminkowski et al, 2002 — N=18,331
$225 Annual Medical Savings/ Employee/Year since 1995

J&J STUDY – HEALTH AFFAIRS, MARCH 2011

HEALTH RISKS – BIOMETRIC MEASURES -- ADJUSTED
Results adjusted for age, sex, region * p<0.05 ** p<0.01

HEALTH RISKS – HEALTH BEHAVIORS -- ADJUSTED
Results adjusted for age, sex, region * p<0.05 ** p<0.01

HEALTH RISKS – PSYCHOSOCIAL -- ADJUSTED
Results adjusted for age, sex, region * p<0.05 ** p<0.01

ADJUSTED MEDICAL AND DRUG COSTS VS. EXPECTED COSTS FROM COMPARISON GROUP
Average Savings 2002-2008 = $565/employee/year
Estimated ROI: $1.88 - $3.92 to $1.00

VANDERBILT UNIVERSITY
56

PHYSICAL ACTIVITY
57

OBESITY
58

SMOKING
59

Identifying “Best Practices” in Workplace Health Promotion: What Works?
Source: Goetzel RZ, Shechter D, Ozminkowski RJ, Reyes M, Marmet PF, Tabrizi M, Chung Roemer E. Critical success factors to employer health and productivity management efforts: Findings from a benchmarking study. Journal of Occupational and Environmental Medicine. (2007) February; 49:2, 111-130.

61
Health Promotion Programs — What Works?
Leadership Commitment
• Leading by example – with buy-in by middle managers
• “Healthy company” norm/culture
• Explicit connection to the core principles of the organization
• Employee-driven advisory board
• Specific program goals and objectives – with realistic expectations
• Alignment of organizational, HR and health promotion policies/practices
• Sustainability – future orientation

62
Health Promotion Programs — What Works?
Incentives
• Incentives to participate (not change biometrics)
• Accountability at all levels – linked to rewards
• Effective marketing and communication (multi-channel)

63
Health Promotion Programs — What Works?
Effective Screening and Triage
• Casting a wide net to identify the highest risk individuals
• Providing “public health” interventions to keep people at low risk
• Triaging individuals into programs that produce greatest impact/payoff
• Protecting confidentiality
• Coordinating with providers and community resources

64
Health Promotion Programs — What Works?
• Theory and evidence-based (e.g., Bandura, Prochaska, Lorig, Strecher, Glasgow)
• Tailored and individualized interventions
• Balancing high touch with high tech
• Individual and Environmental/ecological interventions
• Effective, reliable, valid tools
State-of-the-Art Intervention Programs

65
Health Promotion Programs — What Works?
Effective Implementation
• Integrate programs – insure vendor (stakeholder) engagement
• Accessible/attractive programs
• Start simple – pilot – grow on success
• Multi-component -- variety of topics and engagement modalities
• Integrate staff into the fabric of the organization
• Spend the right amount of money to achieve a desired ROI

66
Health Promotion Programs — What Works?
Integrated Data
Systems
Explicit connection of results to core
values
Measure, manage, and
measure again Rigorous
methods that stand up to peer review
Regular communication
of results
Excellent Evaluation

SO, WHAT CAN YOU DO TOMORROW?
Promote physical activity • Walking trails, open stairwells, slow down the elevator, promote public transport, subsidize
gym membership, provide pedometers, sponsor competitions, work with your local schools
Promote access to healthy foods • Make the healthy choices the easy choices, label “healthy” choices, only allow healthy food at
company-sponsored events, change vending machine contractors, sell half portions in the cafeteria, give people smaller plates, provide free water, make people wait for unhealthy food, promote and subsidize nutritious food, provide healthy cupboards, pay for microwaves and refrigerators, educate
Advocate for legislation that supports healthy lifestyles • Soda taxes, physical activity in schools, ensure food advertizing to children is responsible,
support outdoor facilities and parks, end subsidies for unhealthy foods and increase subsidies for healthy foods, build bike and walking trails
Build a healthy company culture • Change the norms of the organization, reward employees and managers for healthy lifestyles,
provide social support for employees who want to lose weight, make the workplace fun
67

68
YOOHOO!! Focusing on improving the health and quality of people’s lives will improve the productivity and competitiveness of our workers and citizens.
A growing body of scientific literature suggests that well-designed, evidence-based health promotion and disease prevention programs can:
• Improve the health of workers and lower their risk for disease;
• Save businesses money by reducing health-related medical losses and limiting absence and disability;
• Heighten worker morale and work relations;
• Improve worker productivity; and
• Improve the financial performance of organizations instituting these programs.

THANK YOU!
69
Ron Z. Goetzel, Ph.D. Rollins School of Public Health, Emory University Truven Health Analytics +1 301-547-4393 (voice) +1 202-285-6728 (cell) [email protected] [email protected]