Embed Size (px)
Citation preview
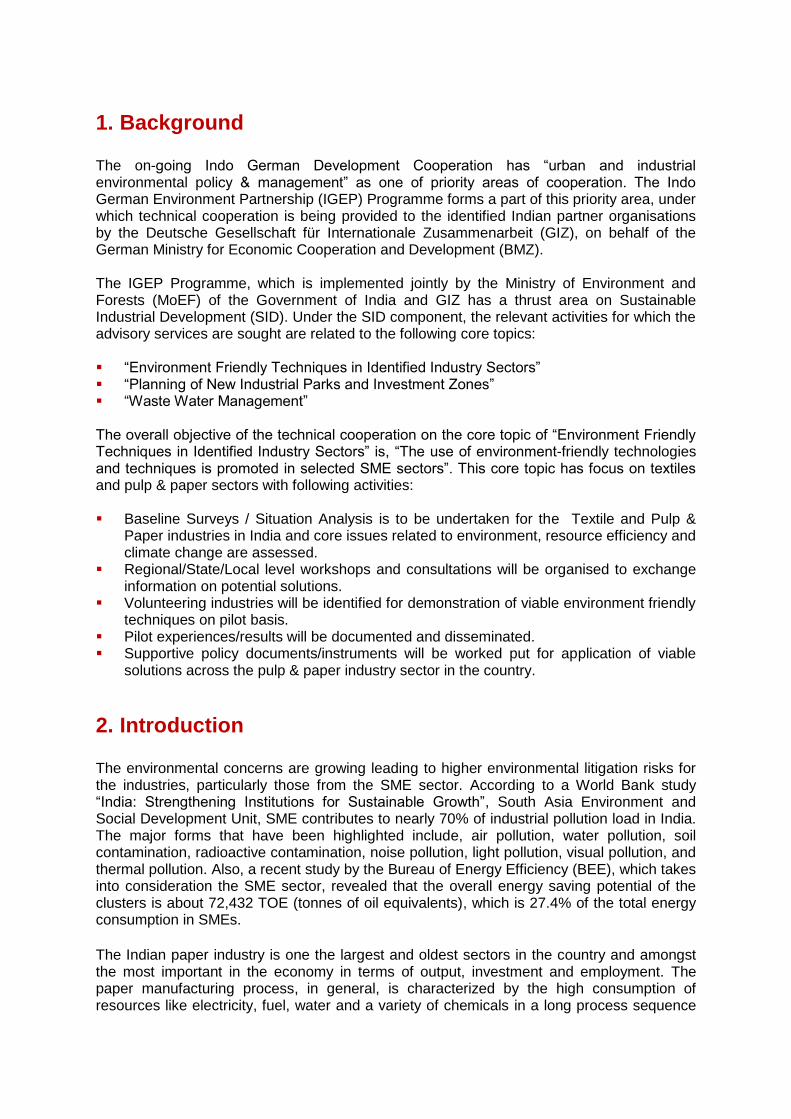
Workshop Report
Environment Friendly Techniques in Pulp & Paper Sector
27th February, 2013 Center of Excellence (COE), GIDC Industrial Estate, Vapi (Gujarat)
Contents
1. Background .................................................................................................................. 3
2. Introduction .................................................................................................................. 3
3. Programme of the Workshop ...................................................................................... 4
4. Participants in the Workshop ...................................................................................... 5
5. Inaugural Session of the Workshop ........................................................................... 5
6. Technical Sessions of the Workshop ......................................................................... 6
7. Concluding Session of the Workshop ........................................................................ 8
1. Background The on-going Indo German Development Cooperation has “urban and industrial environmental policy & management” as one of priority areas of cooperation. The Indo German Environment Partnership (IGEP) Programme forms a part of this priority area, under which technical cooperation is being provided to the identified Indian partner organisations by the Deutsche Gesellschaft für Internationale Zusammenarbeit (GIZ), on behalf of the German Ministry for Economic Cooperation and Development (BMZ). The IGEP Programme, which is implemented jointly by the Ministry of Environment and Forests (MoEF) of the Government of India and GIZ has a thrust area on Sustainable Industrial Development (SID). Under the SID component, the relevant activities for which the advisory services are sought are related to the following core topics: “Environment Friendly Techniques in Identified Industry Sectors” “Planning of New Industrial Parks and Investment Zones” “Waste Water Management” The overall objective of the technical cooperation on the core topic of “Environment Friendly Techniques in Identified Industry Sectors” is, “The use of environment-friendly technologies and techniques is promoted in selected SME sectors”. This core topic has focus on textiles and pulp & paper sectors with following activities: Baseline Surveys / Situation Analysis is to be undertaken for the Textile and Pulp &
Paper industries in India and core issues related to environment, resource efficiency and climate change are assessed.
Regional/State/Local level workshops and consultations will be organised to exchange information on potential solutions.
Volunteering industries will be identified for demonstration of viable environment friendly techniques on pilot basis.
Pilot experiences/results will be documented and disseminated. Supportive policy documents/instruments will be worked put for application of viable
solutions across the pulp & paper industry sector in the country.
2. Introduction The environmental concerns are growing leading to higher environmental litigation risks for the industries, particularly those from the SME sector. According to a World Bank study “India: Strengthening Institutions for Sustainable Growth”, South Asia Environment and Social Development Unit, SME contributes to nearly 70% of industrial pollution load in India. The major forms that have been highlighted include, air pollution, water pollution, soil contamination, radioactive contamination, noise pollution, light pollution, visual pollution, and thermal pollution. Also, a recent study by the Bureau of Energy Efficiency (BEE), which takes into consideration the SME sector, revealed that the overall energy saving potential of the clusters is about 72,432 TOE (tonnes of oil equivalents), which is 27.4% of the total energy consumption in SMEs.
The Indian paper industry is one the largest and oldest sectors in the country and amongst the most important in the economy in terms of output, investment and employment. The paper manufacturing process, in general, is characterized by the high consumption of resources like electricity, fuel, water and a variety of chemicals in a long process sequence
that generates a significant amount of waste and emissions. Hence, the paper sector can benefit by making improvements targeting resource efficiency, process improvements, energy efficiency and reduced negative environmental impacts. By employing appropriate technologies, both environmental and economic gains can be achieved. For referencing viable environment friendly techniques in pulp & paper sector, various sources of information are available. For example, the BREF (Best Available Techniques Reference Documents) from Germany and the Comprehensive Industrial Documents (COINDS) of the Central Pollution Control Board provide useful information. Also, possibly some of the pulp & paper industries in Indi might have championed in pioneering efforts in technological innovation. In addition, there also technology providers dealing with relevant technologies for the pulp & paper sector, such as the insulation systems, low energy motors, online pollution monitoring systems etc. Agencies such as the Gujarat Cleaner Production Centre have undertaken pilot studies in the pulp & paper industries. To gather information and to facilitate information exchange, under the IGEP Programme, strategically stakeholder consultation are being organised periodically. Such consultations are organised at local, regional, state and national levels to facilitate identification of core issues faced by the sector and to look out for viable technical solutions. The consultations are organised through workshops, meetings and conferences. Against this background, as a part of the Phase I activities, GIZ collaborated with the Gujarat Cleaner Production Center (GCPC) and organized the 1-day Regional Workshop on “Environment Friendly Techniques in Pulp & Paper Sector” on February 27, 2013 at the Centre of Excellence, GIDC Industrial Estate, Vapi (Gujarat). The workshop was aimed to share knowledge, experiences and case examples and to discuss on the core issues, including policy and regulatory related, and technological and management related aspects that need to be addressed for ensuring improved environmental performance by the pulp & papers sector in India.
3. Programme of the Workshop The workshop focused on:
Policy/Legal/Regulatory Aspects – Challenges and Opportunities Technological aspects – Challenges and Opportunities Roles of Key Stakeholders (industries, industrial associations, government,
regulatory bodies) – innovative approaches/actions, capacity building requirement The workshop programme included:
Inaugural session. Technical Session 1: Environmental Policies, Laws and Challenges Technical Session 2: Technological Aspects for Improved Environmental
Performance in Pulp & Paper Sector Concluding session.
The programme details are given in Annexure I. The programme covered 12 technical presentations covering various relevant topics.
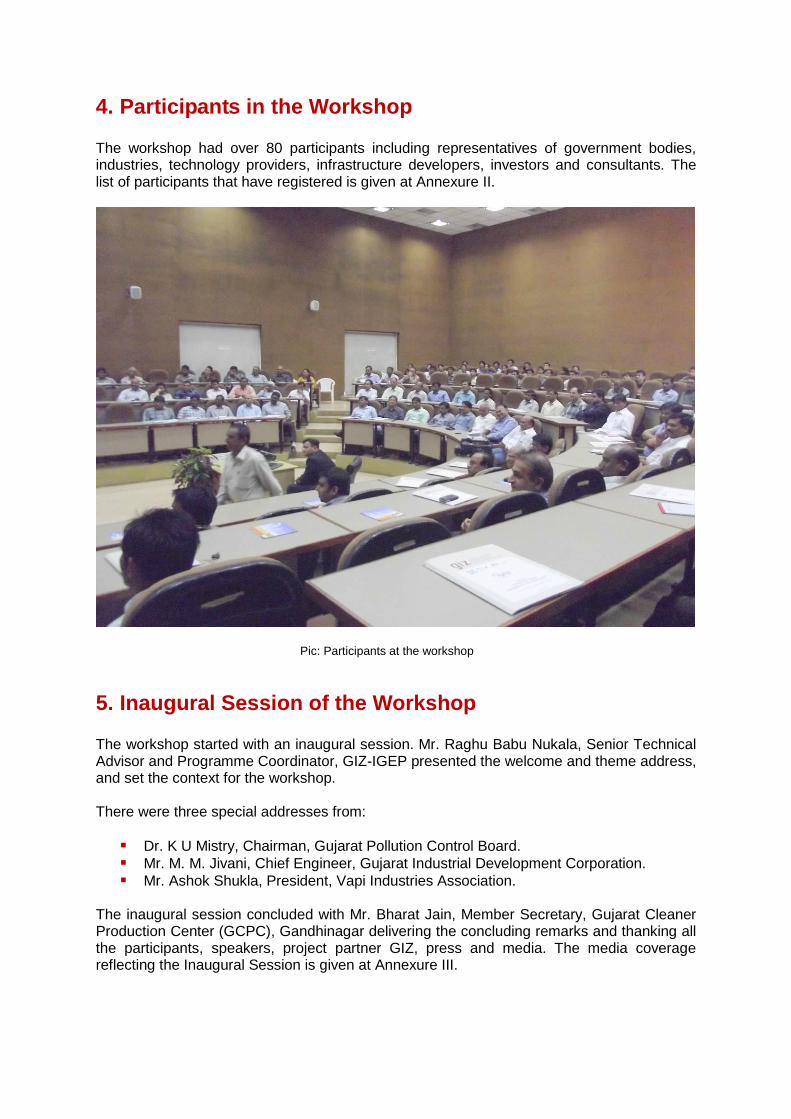
4. Participants in the Workshop The workshop had over 80 participants including representatives of government bodies, industries, technology providers, infrastructure developers, investors and consultants. The list of participants that have registered is given at Annexure II.
Pic: Participants at the workshop
5. Inaugural Session of the Workshop
The workshop started with an inaugural session. Mr. Raghu Babu Nukala, Senior Technical Advisor and Programme Coordinator, GIZ-IGEP presented the welcome and theme address, and set the context for the workshop.
There were three special addresses from:
Dr. K U Mistry, Chairman, Gujarat Pollution Control Board.
Mr. M. M. Jivani, Chief Engineer, Gujarat Industrial Development Corporation.
Mr. Ashok Shukla, President, Vapi Industries Association.
The inaugural session concluded with Mr. Bharat Jain, Member Secretary, Gujarat Cleaner Production Center (GCPC), Gandhinagar delivering the concluding remarks and thanking all the participants, speakers, project partner GIZ, press and media. The media coverage reflecting the Inaugural Session is given at Annexure III.
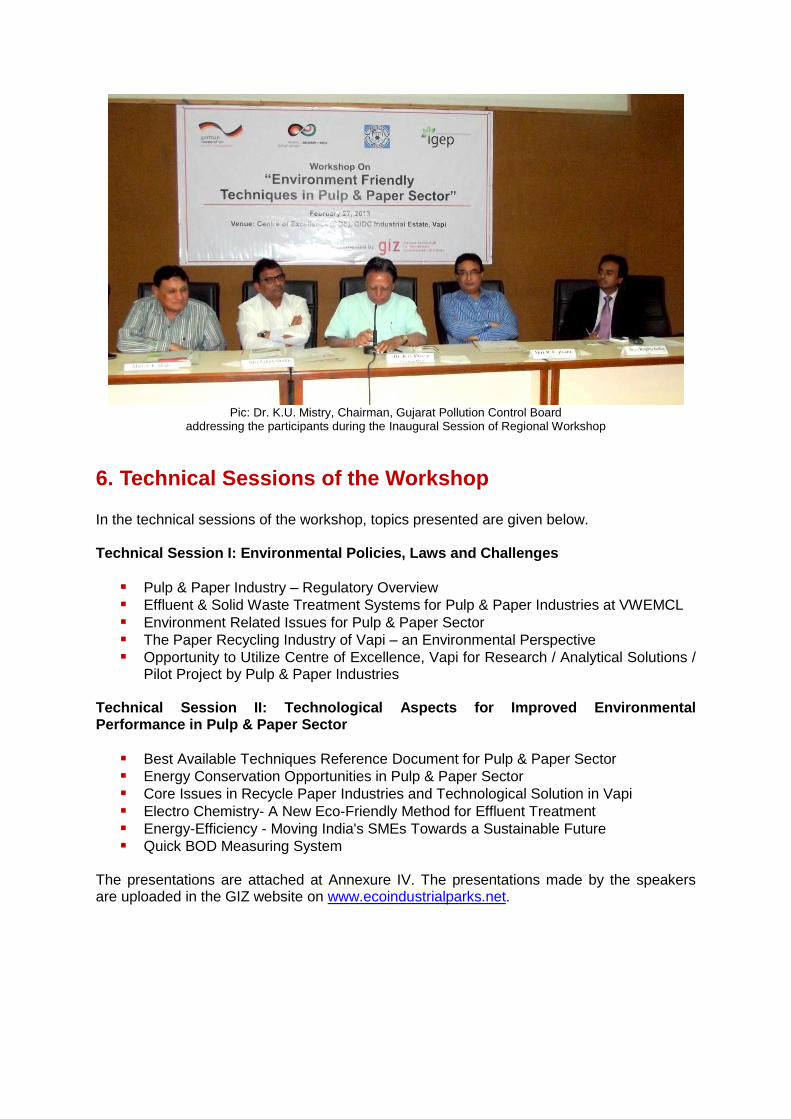
Pic: Dr. K.U. Mistry, Chairman, Gujarat Pollution Control Board
addressing the participants during the Inaugural Session of Regional Workshop
6. Technical Sessions of the Workshop
In the technical sessions of the workshop, topics presented are given below. Technical Session I: Environmental Policies, Laws and Challenges
Pulp & Paper Industry – Regulatory Overview
Effluent & Solid Waste Treatment Systems for Pulp & Paper Industries at VWEMCL
Environment Related Issues for Pulp & Paper Sector
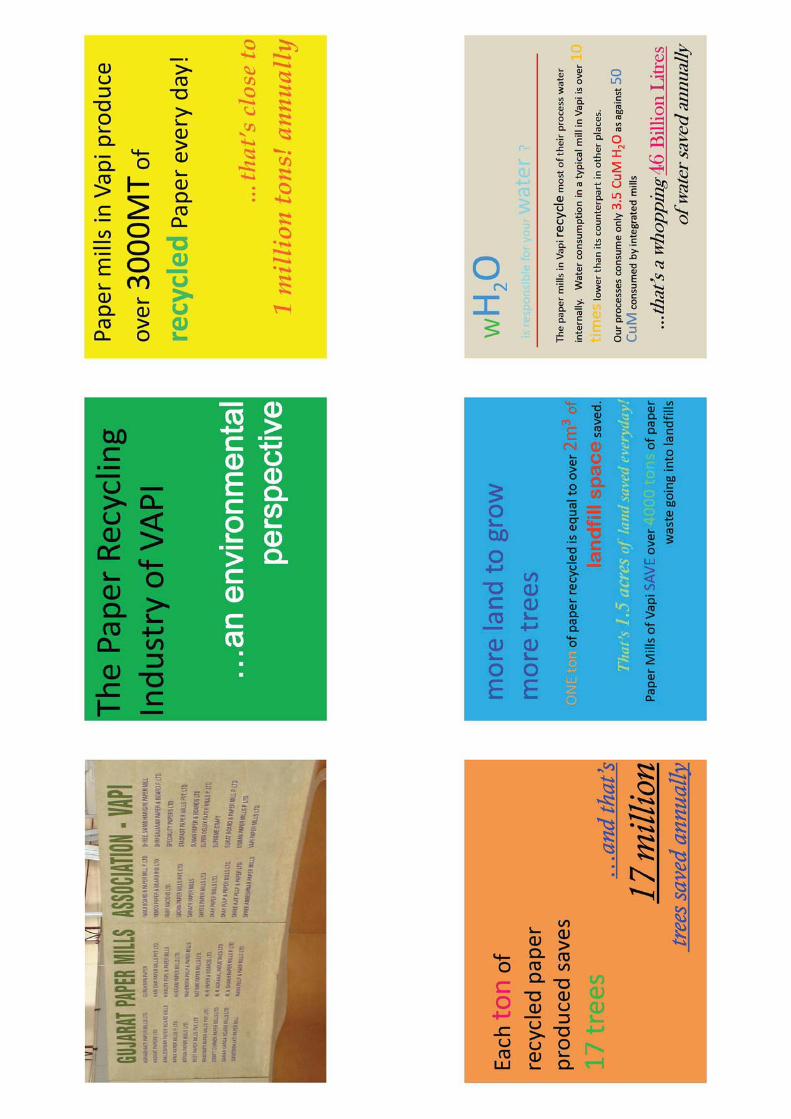
The Paper Recycling Industry of Vapi – an Environmental Perspective
Opportunity to Utilize Centre of Excellence, Vapi for Research / Analytical Solutions / Pilot Project by Pulp & Paper Industries
Technical Session II: Technological Aspects for Improved Environmental Performance in Pulp & Paper Sector
Best Available Techniques Reference Document for Pulp & Paper Sector Energy Conservation Opportunities in Pulp & Paper Sector Core Issues in Recycle Paper Industries and Technological Solution in Vapi Electro Chemistry- A New Eco-Friendly Method for Effluent Treatment Energy-Efficiency - Moving India's SMEs Towards a Sustainable Future
Quick BOD Measuring System The presentations are attached at Annexure IV. The presentations made by the speakers are uploaded in the GIZ website on www.ecoindustrialparks.net.
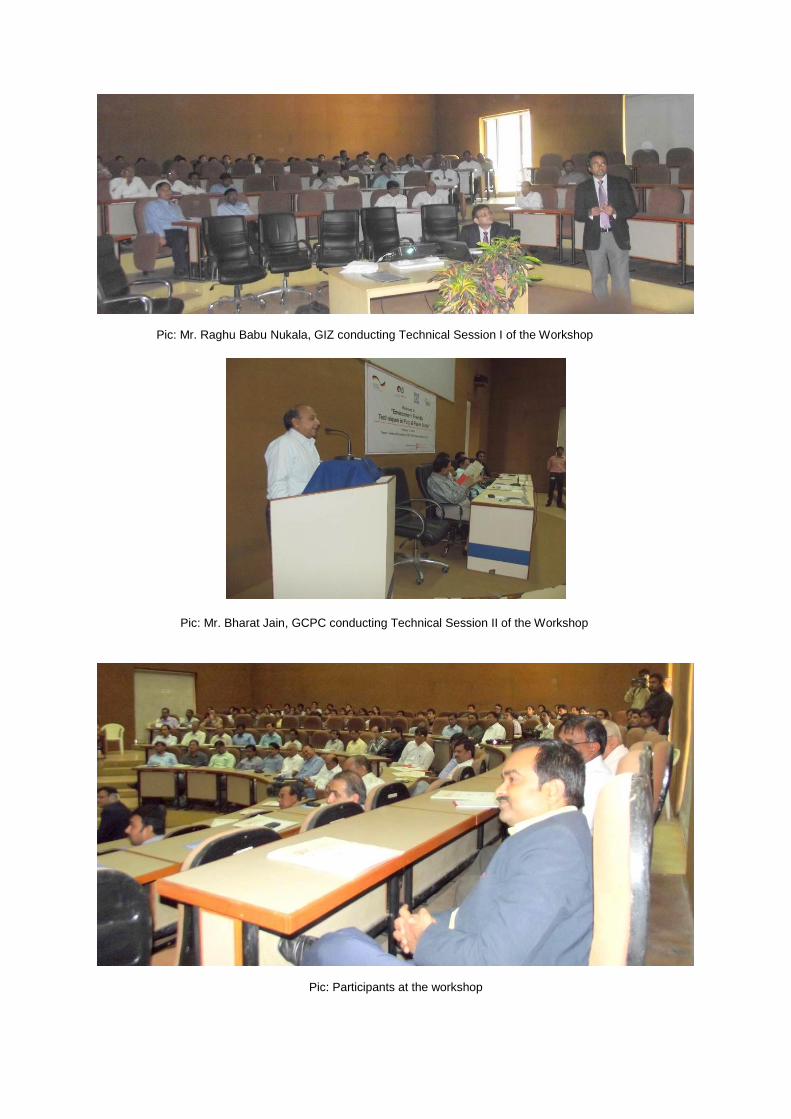
Pic: Mr. Raghu Babu Nukala, GIZ conducting Technical Session I of the Workshop
Pic: Mr. Bharat Jain, GCPC conducting Technical Session II of the Workshop
Pic: Participants at the workshop
7. Concluding Session of the Workshop
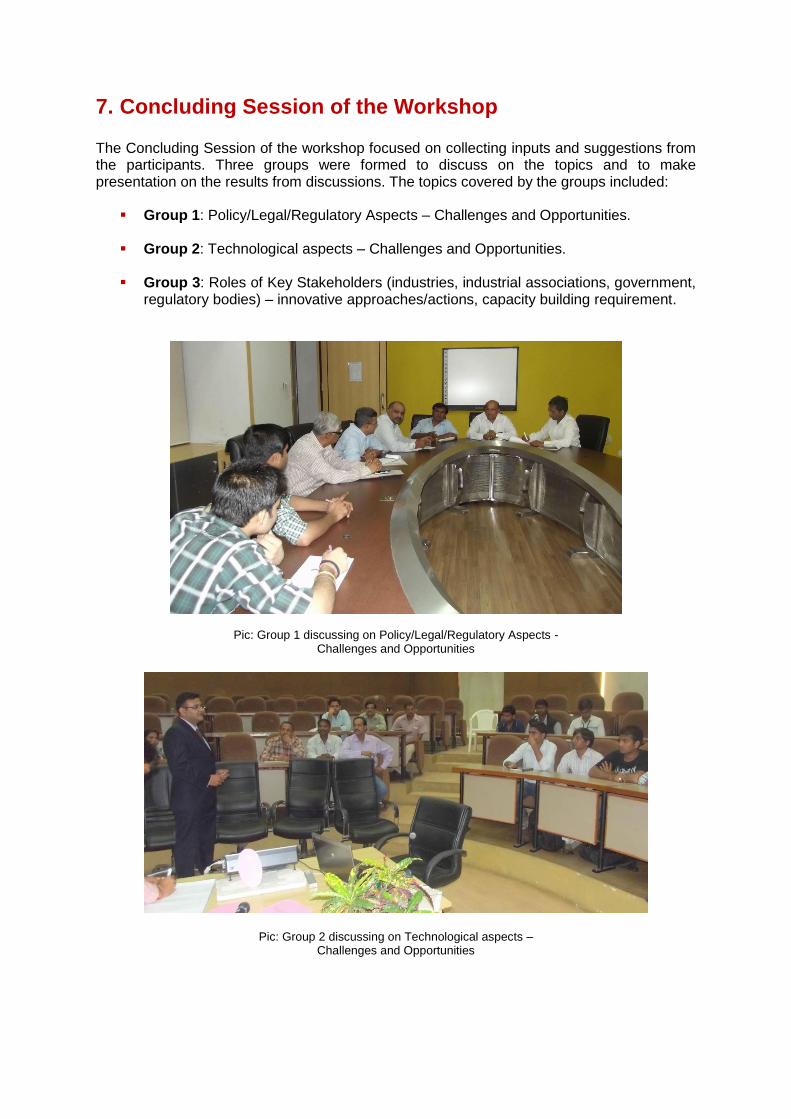
The Concluding Session of the workshop focused on collecting inputs and suggestions from the participants. Three groups were formed to discuss on the topics and to make presentation on the results from discussions. The topics covered by the groups included:
Group 1: Policy/Legal/Regulatory Aspects – Challenges and Opportunities.
Group 2: Technological aspects – Challenges and Opportunities.
Group 3: Roles of Key Stakeholders (industries, industrial associations, government,
regulatory bodies) – innovative approaches/actions, capacity building requirement.
Pic: Group 1 discussing on Policy/Legal/Regulatory Aspects - Challenges and Opportunities
Pic: Group 2 discussing on Technological aspects – Challenges and Opportunities
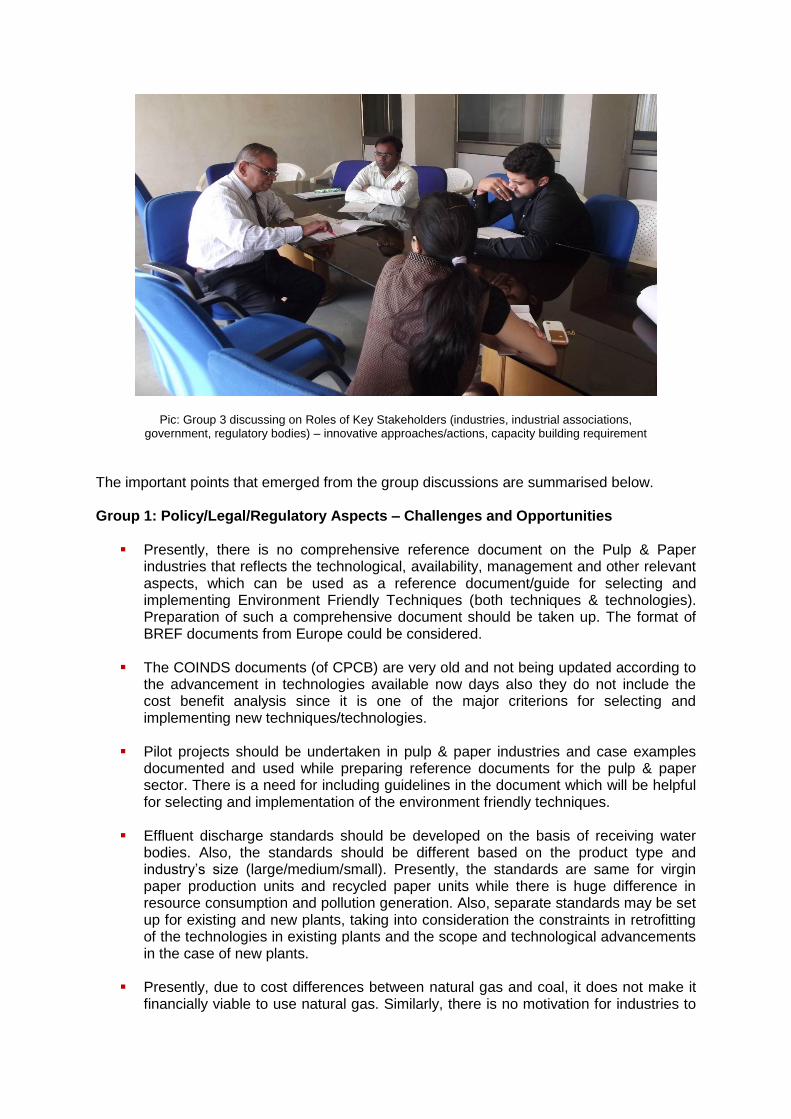
Pic: Group 3 discussing on Roles of Key Stakeholders (industries, industrial associations, government, regulatory bodies) – innovative approaches/actions, capacity building requirement
The important points that emerged from the group discussions are summarised below.
Group 1: Policy/Legal/Regulatory Aspects – Challenges and Opportunities
Presently, there is no comprehensive reference document on the Pulp & Paper industries that reflects the technological, availability, management and other relevant aspects, which can be used as a reference document/guide for selecting and implementing Environment Friendly Techniques (both techniques & technologies). Preparation of such a comprehensive document should be taken up. The format of BREF documents from Europe could be considered.
The COINDS documents (of CPCB) are very old and not being updated according to
the advancement in technologies available now days also they do not include the cost benefit analysis since it is one of the major criterions for selecting and implementing new techniques/technologies.
Pilot projects should be undertaken in pulp & paper industries and case examples
documented and used while preparing reference documents for the pulp & paper sector. There is a need for including guidelines in the document which will be helpful for selecting and implementation of the environment friendly techniques.
Effluent discharge standards should be developed on the basis of receiving water
bodies. Also, the standards should be different based on the product type and industry’s size (large/medium/small). Presently, the standards are same for virgin paper production units and recycled paper units while there is huge difference in resource consumption and pollution generation. Also, separate standards may be set up for existing and new plants, taking into consideration the constraints in retrofitting of the technologies in existing plants and the scope and technological advancements in the case of new plants.
Presently, due to cost differences between natural gas and coal, it does not make it
financially viable to use natural gas. Similarly, there is no motivation for industries to
recycle/reuse water. There should be provisions in the policy for encouraging recycle/reuse of water from different processes and also for usage of clean fuel (e.g., natural gas).
The technology/techniques that will be propagated for the pulp & paper sector may
have large impact financial implications on the industry, particularly on product pricing if not uniformly applied across the country. This aspect should be taken into consideration.
There should be a monitoring system for pollution parameters, which can provide online/real time feedback so that immediate actions can be taken by the industry to prevent pollution generation. For example, through online BOD monitors, instead of waiting for 3 days or 5 days, actions can be initiated right away if there are real-time online monitors. However, SMEs cannot put up costly instrumentation for such monitoring systems. If there are centralised facilities and monitoring systems, pollution parameters can be controlled in time, by disseminating information to industries about their emissions/discharges and various options for abating/controlling the same.
Implementation strategy for labelling programme like “Ecomark” is available but not
practiced by industries as they do not have regulatory mandate and associated incentives.
Group 2: Technological aspects – Challenges and Opportunities
Recovered energy in Indian pulp & paper mills meets only 45% of energy requirements of pulp and recovery section (in good global mills there is energy excess).
Freshwater consumption is high, current average is 57 m3/tonne for virgin paper
industries (European average 10 m3/tonne for the virgin paper). However, in the recycled paper industries, as claimed by the industry the consumption is much lesser than even the European average.
Use of chemicals (e.g., Alum & Rosin) to make the paper hydrophobic reduces yield
percentage, which results in fibre losses and increase in fresh water consumption.
Energy Losses in drying section are significant due to non-availability of the side insulations for dryer due to constant dynamic motion.
Electrical equipment inefficiency due to improper sizing and designing of the equipments and auxiliaries and less knowledge on the efficiency part of the equipments.
Resource losses due to material handling practices and lack of good housekeeping.
Weak instrumentation & process control. This results in wide variations in quality of sectional outputs.
Conventional process of manufacturing generates effluent with COD level of 10,000
mg/l and BOD of 500-800 mg/l, which cannot be reused after treatment.
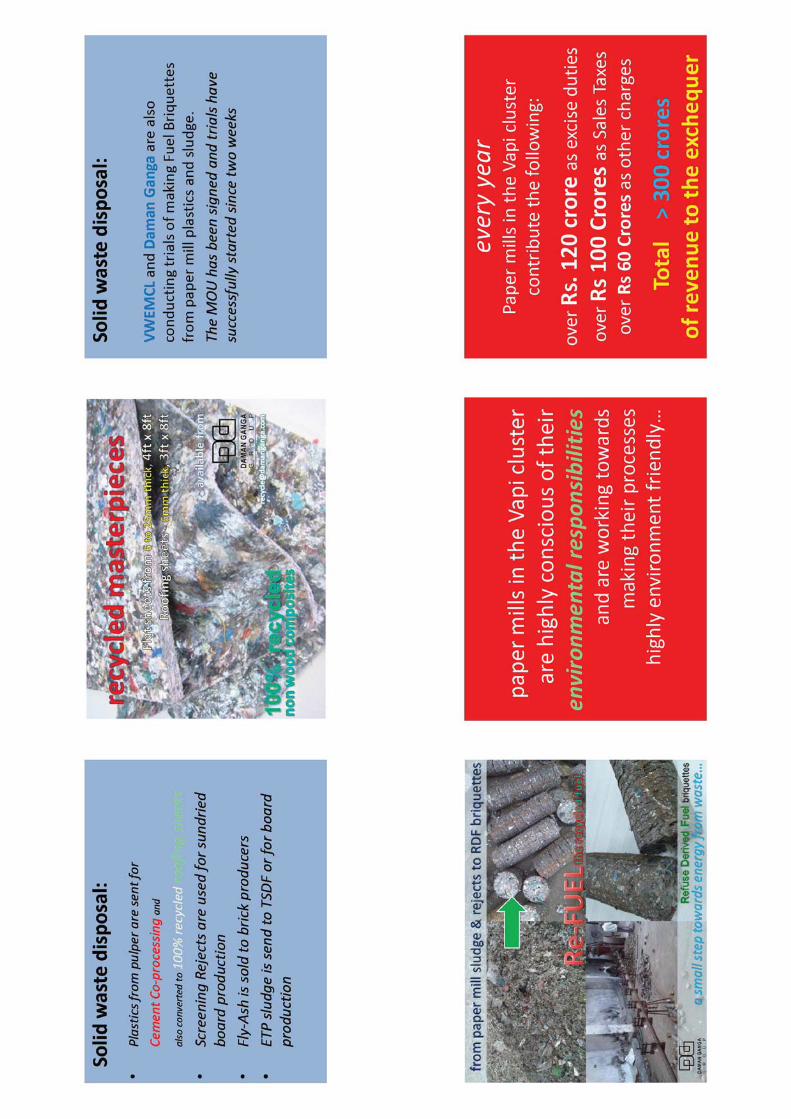
Generation of de-inking sludge and rejects, which are hazardous are sent to landfills presently. However, alternatives of using it as fuel is possible, which needs to be checked and approved by SPCBs.
Boiler fly ash generated by the industries is sent to landfills, although some industries are also sending it to brick manufacturers, However, it is not commercially done till now.
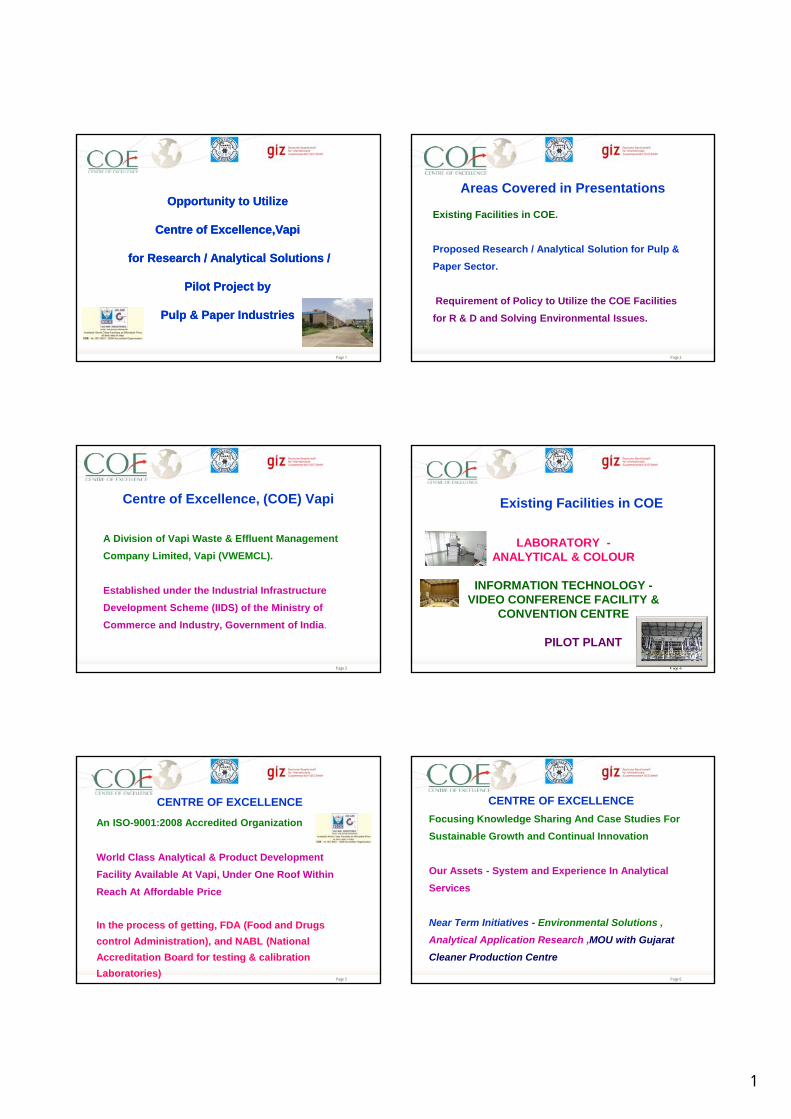
Plastic waste generation from recycled paper industries could be co-processed in cement industries. This is being practiced (limited to certain quality of plastic) by a few industries. One of the industries in Vapi has made a briquette out of the waste mixture containing plastic without PVC and fibre sludge from the ETP, and are seeking SPCB permission to commercialize and use it in boilers.
The Environment Friendly Techniques available in BREF documents could be selected and tried/tested for the pilot work in selected industries, and also used for creating database for applicable techniques in the sector.
Group 3: Roles of Key Stakeholders (industries, industrial associations, government, regulatory bodies) – innovative approaches/actions, capacity building requirement
Training to Industries on resource efficiency and cleaner production is required as the
SMEs do not have resources to get the experts to train and increase knowledge of their workforce.
Knowledge sharing platform should be created on the available feasible (technological, available, economical) techniques. Industries in clusters should also work together to have collective impact on decreasing pollution load.
R & D activities should be taken up, for example in cooperation with industries and the Centre of Excellence at Vapi Industrial Estate, to improve the product and the associated manufacturing processes.
^^^

Annexures
Annexure 1
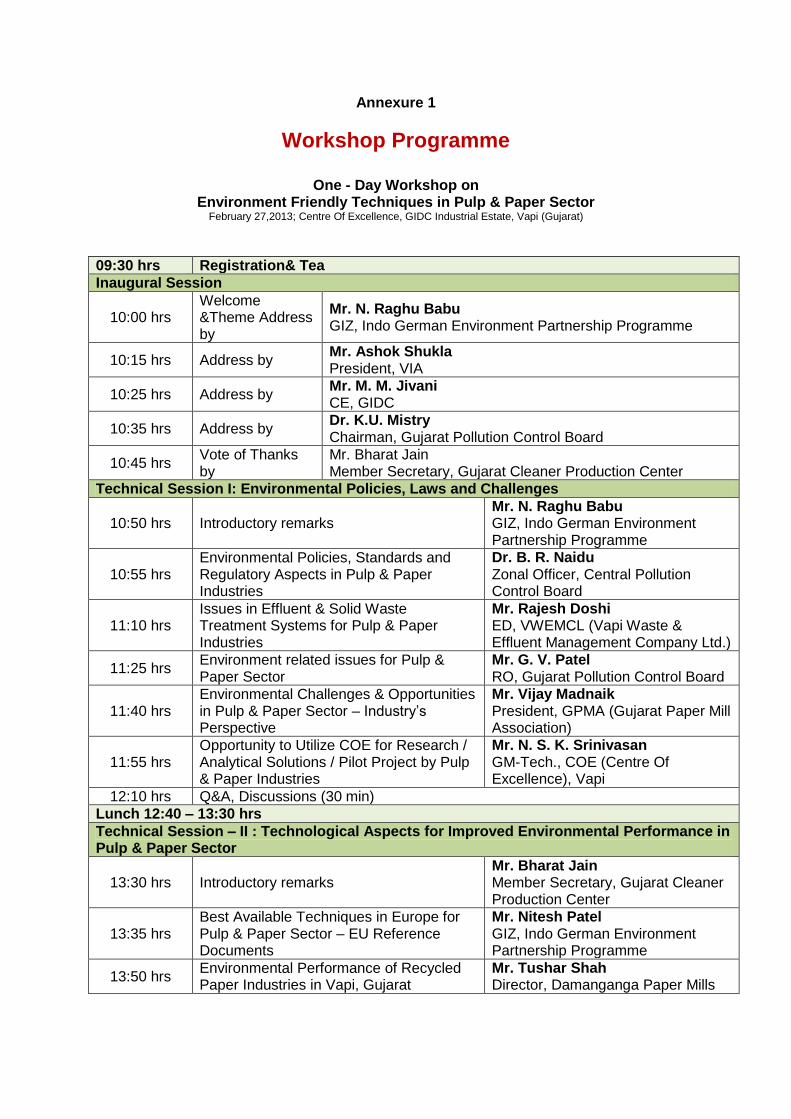
Workshop Programme
One - Day Workshop on Environment Friendly Techniques in Pulp & Paper Sector
February 27,2013; Centre Of Excellence, GIDC Industrial Estate, Vapi (Gujarat)
09:30 hrs Registration& Tea
Inaugural Session
10:00 hrs Welcome &Theme Address by
Mr. N. Raghu Babu GIZ, Indo German Environment Partnership Programme
10:15 hrs Address by Mr. Ashok Shukla President, VIA
10:25 hrs Address by Mr. M. M. Jivani CE, GIDC
10:35 hrs Address by Dr. K.U. Mistry Chairman, Gujarat Pollution Control Board
10:45 hrs Vote of Thanks by
Mr. Bharat Jain Member Secretary, Gujarat Cleaner Production Center
Technical Session I: Environmental Policies, Laws and Challenges
10:50 hrs Introductory remarks Mr. N. Raghu Babu GIZ, Indo German Environment Partnership Programme
10:55 hrs Environmental Policies, Standards and Regulatory Aspects in Pulp & Paper Industries
Dr. B. R. Naidu Zonal Officer, Central Pollution Control Board
11:10 hrs Issues in Effluent & Solid Waste Treatment Systems for Pulp & Paper Industries
Mr. Rajesh Doshi ED, VWEMCL (Vapi Waste & Effluent Management Company Ltd.)
11:25 hrs Environment related issues for Pulp & Paper Sector
Mr. G. V. Patel RO, Gujarat Pollution Control Board
11:40 hrs Environmental Challenges & Opportunities in Pulp & Paper Sector – Industry’s Perspective
Mr. Vijay Madnaik President, GPMA (Gujarat Paper Mill Association)
11:55 hrs Opportunity to Utilize COE for Research / Analytical Solutions / Pilot Project by Pulp & Paper Industries
Mr. N. S. K. Srinivasan GM-Tech., COE (Centre Of Excellence), Vapi
12:10 hrs Q&A, Discussions (30 min)
Lunch 12:40 – 13:30 hrs
Technical Session – II : Technological Aspects for Improved Environmental Performance in Pulp & Paper Sector
13:30 hrs Introductory remarks Mr. Bharat Jain Member Secretary, Gujarat Cleaner Production Center
13:35 hrs Best Available Techniques in Europe for Pulp & Paper Sector – EU Reference Documents
Mr. Nitesh Patel GIZ, Indo German Environment Partnership Programme
13:50 hrs Environmental Performance of Recycled Paper Industries in Vapi, Gujarat
Mr. Tushar Shah Director, Damanganga Paper Mills
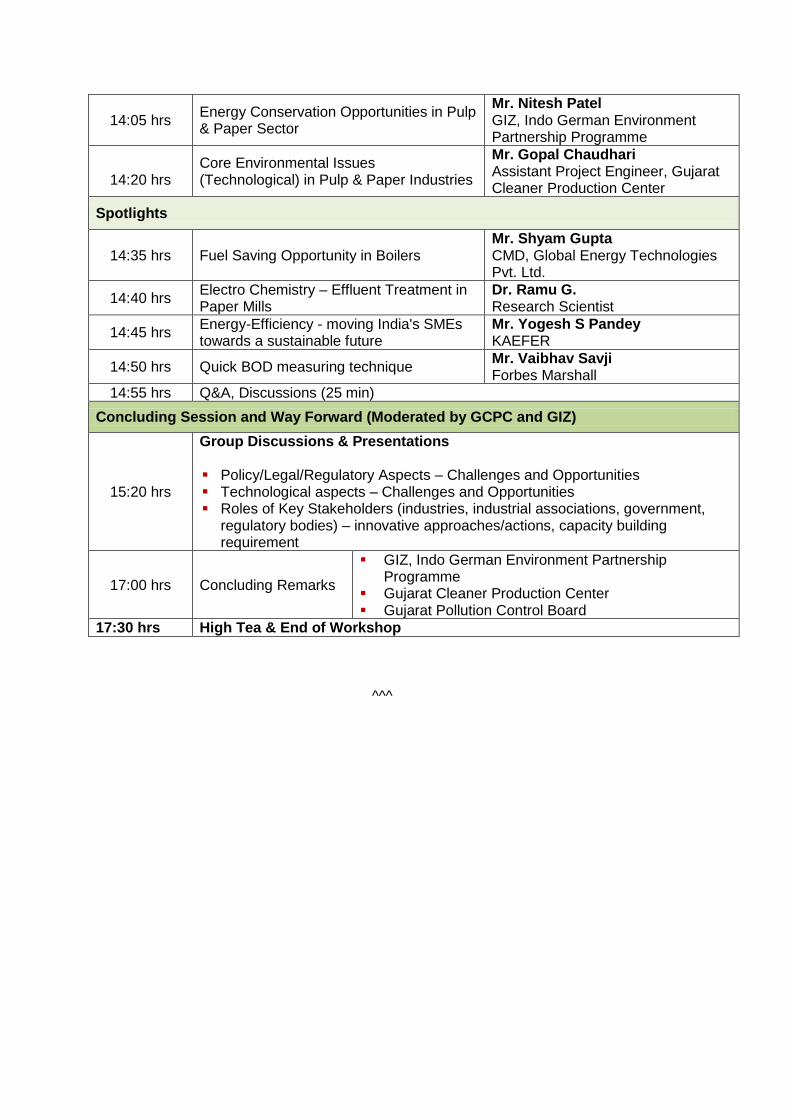
14:05 hrs Energy Conservation Opportunities in Pulp & Paper Sector
Mr. Nitesh Patel GIZ, Indo German Environment Partnership Programme
14:20 hrs
Core Environmental Issues (Technological) in Pulp & Paper Industries
Mr. Gopal Chaudhari Assistant Project Engineer, Gujarat Cleaner Production Center
Spotlights
14:35 hrs Fuel Saving Opportunity in Boilers Mr. Shyam Gupta CMD, Global Energy Technologies Pvt. Ltd.
14:40 hrs Electro Chemistry – Effluent Treatment in Paper Mills
Dr. Ramu G. Research Scientist
14:45 hrs Energy-Efficiency - moving India's SMEs towards a sustainable future
Mr. Yogesh S Pandey KAEFER
14:50 hrs Quick BOD measuring technique Mr. Vaibhav Savji Forbes Marshall
14:55 hrs Q&A, Discussions (25 min)
Concluding Session and Way Forward (Moderated by GCPC and GIZ)
15:20 hrs
Group Discussions & Presentations
Policy/Legal/Regulatory Aspects – Challenges and Opportunities Technological aspects – Challenges and Opportunities Roles of Key Stakeholders (industries, industrial associations, government,
regulatory bodies) – innovative approaches/actions, capacity building requirement
17:00 hrs Concluding Remarks
GIZ, Indo German Environment Partnership Programme
Gujarat Cleaner Production Center Gujarat Pollution Control Board
17:30 hrs High Tea & End of Workshop
^^^
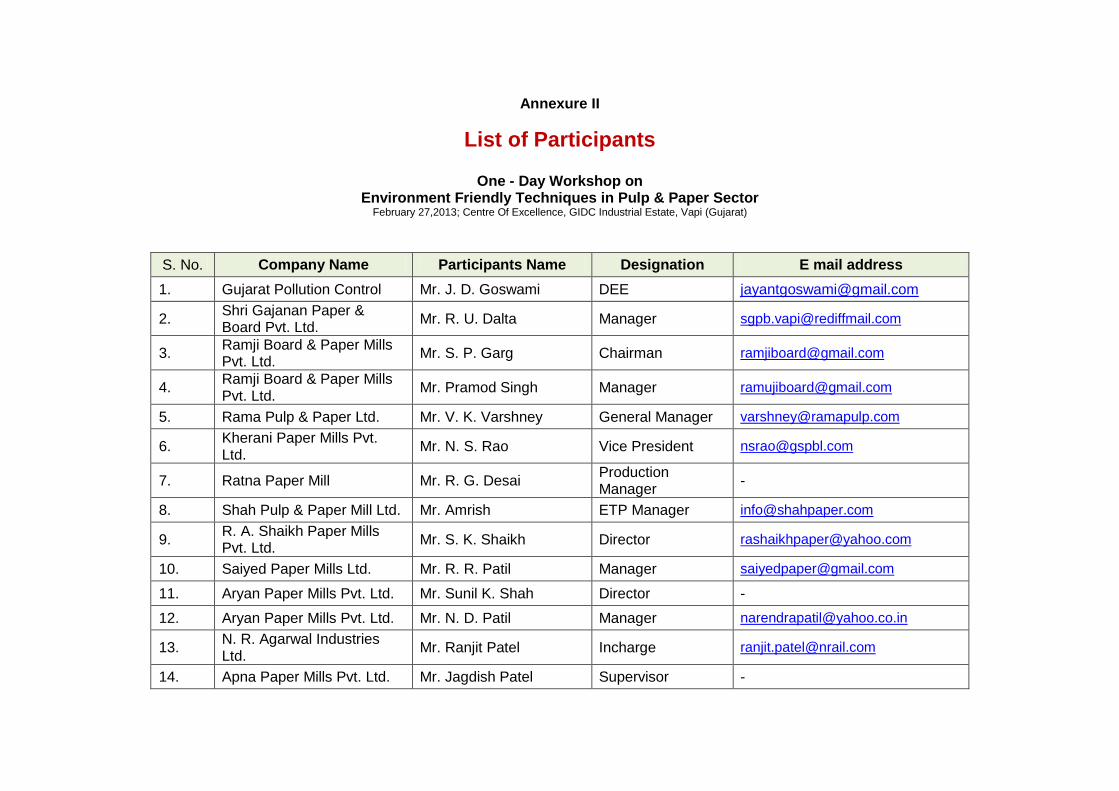
Annexure II
One - Day Workshop on
Environment Friendly Techniques in Pulp & Paper Sector February 27,2013; Centre Of Excellence, GIDC Industrial Estate, Vapi (Gujarat)
S. No. Company Name Participants Name Designation E mail address
1. Gujarat Pollution Control Mr. J. D. Goswami DEE [email protected]
2. Shri Gajanan Paper & Board Pvt. Ltd.
Mr. R. U. Dalta Manager [email protected]
3. Ramji Board & Paper Mills Pvt. Ltd.
Mr. S. P. Garg Chairman [email protected]
4. Ramji Board & Paper Mills Pvt. Ltd.
Mr. Pramod Singh Manager [email protected]
5. Rama Pulp & Paper Ltd. Mr. V. K. Varshney General Manager [email protected]
6. Kherani Paper Mills Pvt. Ltd.
Mr. N. S. Rao Vice President [email protected]
7. Ratna Paper Mill Mr. R. G. Desai Production Manager
-
8. Shah Pulp & Paper Mill Ltd. Mr. Amrish ETP Manager [email protected]
9. R. A. Shaikh Paper Mills Pvt. Ltd.
Mr. S. K. Shaikh Director [email protected]
10. Saiyed Paper Mills Ltd. Mr. R. R. Patil Manager [email protected]
11. Aryan Paper Mills Pvt. Ltd. Mr. Sunil K. Shah Director -
12. Aryan Paper Mills Pvt. Ltd. Mr. N. D. Patil Manager [email protected]
13. N. R. Agarwal Industries Ltd.
Mr. Ranjit Patel Incharge [email protected]
14. Apna Paper Mills Pvt. Ltd. Mr. Jagdish Patel Supervisor -
List of Participants
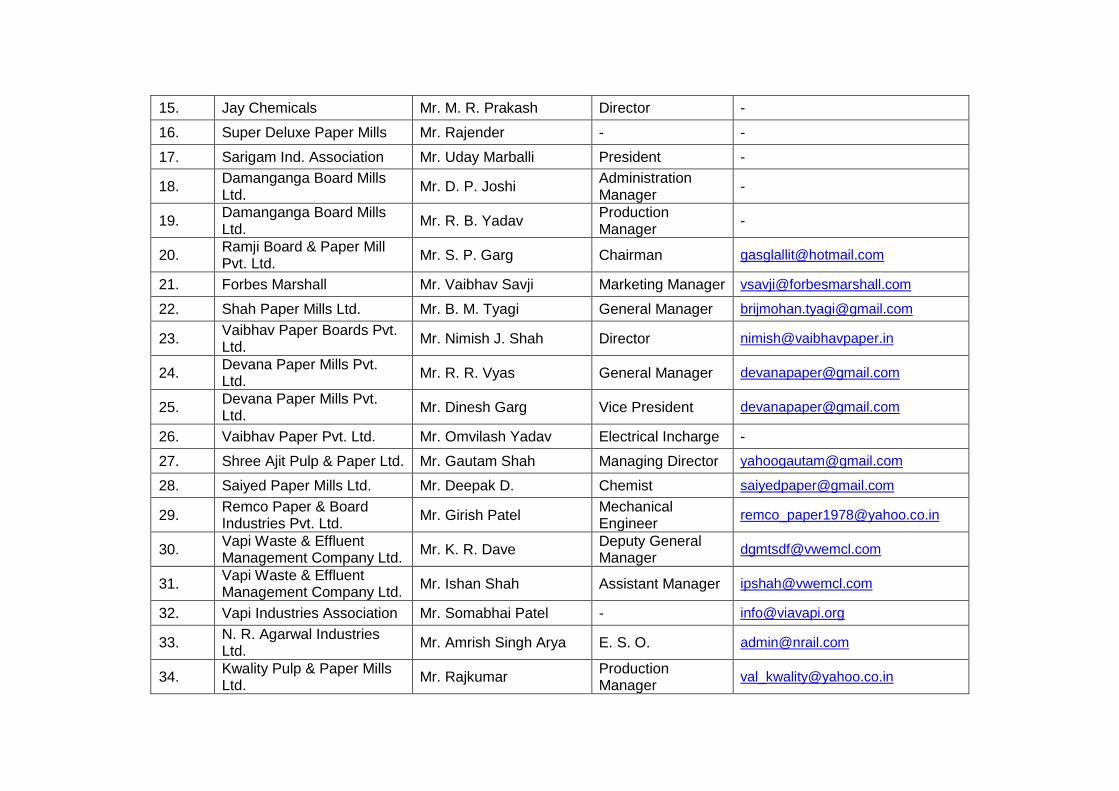
15. Jay Chemicals Mr. M. R. Prakash Director -
16. Super Deluxe Paper Mills Mr. Rajender - -
17. Sarigam Ind. Association Mr. Uday Marballi President -
18. Damanganga Board Mills Ltd.
Mr. D. P. Joshi Administration Manager
-
19. Damanganga Board Mills Ltd.
Mr. R. B. Yadav Production Manager
-
20. Ramji Board & Paper Mill Pvt. Ltd.
Mr. S. P. Garg Chairman [email protected]
21. Forbes Marshall Mr. Vaibhav Savji Marketing Manager [email protected]
22. Shah Paper Mills Ltd. Mr. B. M. Tyagi General Manager [email protected]
23. Vaibhav Paper Boards Pvt. Ltd.
Mr. Nimish J. Shah Director [email protected]
24. Devana Paper Mills Pvt. Ltd.
Mr. R. R. Vyas General Manager [email protected]
25. Devana Paper Mills Pvt. Ltd.
Mr. Dinesh Garg Vice President [email protected]
26. Vaibhav Paper Pvt. Ltd. Mr. Omvilash Yadav Electrical Incharge -
27. Shree Ajit Pulp & Paper Ltd. Mr. Gautam Shah Managing Director [email protected]
28. Saiyed Paper Mills Ltd. Mr. Deepak D. Chemist [email protected]
29. Remco Paper & Board Industries Pvt. Ltd.
Mr. Girish Patel Mechanical Engineer
30. Vapi Waste & Effluent Management Company Ltd.
Mr. K. R. Dave Deputy General Manager
31. Vapi Waste & Effluent Management Company Ltd.
Mr. Ishan Shah Assistant Manager [email protected]
32. Vapi Industries Association Mr. Somabhai Patel - [email protected]
33. N. R. Agarwal Industries Ltd.
Mr. Amrish Singh Arya E. S. O. [email protected]
34. Kwality Pulp & Paper Mills Ltd.
Mr. Rajkumar Production Manager
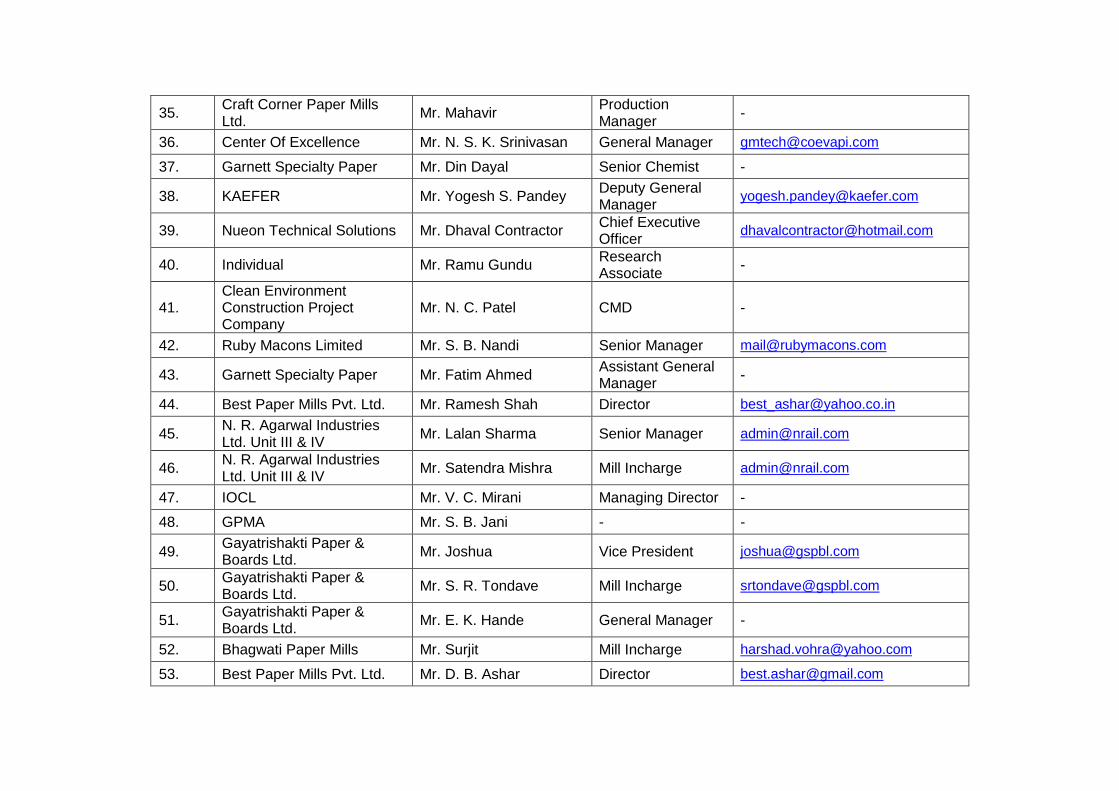
35. Craft Corner Paper Mills Ltd.
Mr. Mahavir Production Manager
-
36. Center Of Excellence Mr. N. S. K. Srinivasan General Manager [email protected]
37. Garnett Specialty Paper Mr. Din Dayal Senior Chemist -
38. KAEFER Mr. Yogesh S. Pandey Deputy General Manager
39. Nueon Technical Solutions Mr. Dhaval Contractor Chief Executive Officer
40. Individual Mr. Ramu Gundu Research Associate
-
41. Clean Environment Construction Project Company
Mr. N. C. Patel CMD -
42. Ruby Macons Limited Mr. S. B. Nandi Senior Manager [email protected]
43. Garnett Specialty Paper Mr. Fatim Ahmed Assistant General Manager
-
44. Best Paper Mills Pvt. Ltd. Mr. Ramesh Shah Director [email protected]
45. N. R. Agarwal Industries Ltd. Unit III & IV
Mr. Lalan Sharma Senior Manager [email protected]
46. N. R. Agarwal Industries Ltd. Unit III & IV
Mr. Satendra Mishra Mill Incharge [email protected]
47. IOCL Mr. V. C. Mirani Managing Director -
48. GPMA Mr. S. B. Jani - -
49. Gayatrishakti Paper & Boards Ltd.
Mr. Joshua Vice President [email protected]
50. Gayatrishakti Paper & Boards Ltd.
Mr. S. R. Tondave Mill Incharge [email protected]
51. Gayatrishakti Paper & Boards Ltd.
Mr. E. K. Hande General Manager -
52. Bhagwati Paper Mills Mr. Surjit Mill Incharge [email protected]
53. Best Paper Mills Pvt. Ltd. Mr. D. B. Ashar Director [email protected]
54. N. R. Agarwal Industries Ltd. Unit I
Mr. S. K. Pathak Manager [email protected]
55. N. R. Agarwal Industries Ltd. Unit I
Mr. S. G. Dutta Assistant Laboratory Incharge
56. Shah Paper Mills Ltd. Mr. B. P. Singh Director [email protected]
57. Vapi Waste & Effluent Management Company Ltd.
Mr. Pranav Pathak Vigilance Incharge [email protected]
58. GIZ (IGEP) Mr Raghu Babu Nuakala Sr. tech. Advisor & Programme Coordinator
59. GIZ (IGEP) Mr. Nitesh Patel Junior Advisor [email protected]
60. GCPC Mr Bharat Jain Member Secretary [email protected]
61. GCPC Ms. Chinkal Patel Project Engineer [email protected]
62. GCPC Mr. Punam Rathod Project Engineer [email protected]
63. GCPC Mr. Hiren Bhendwal Project Engineer [email protected]
64. GCPC
Mr. Gopal Chaudhari Assistant Project Engineer
65. GCPC Ms. Aagnya Pandit Project Engineer [email protected]
Annexure III Presentations
1
Page 112/03/2013
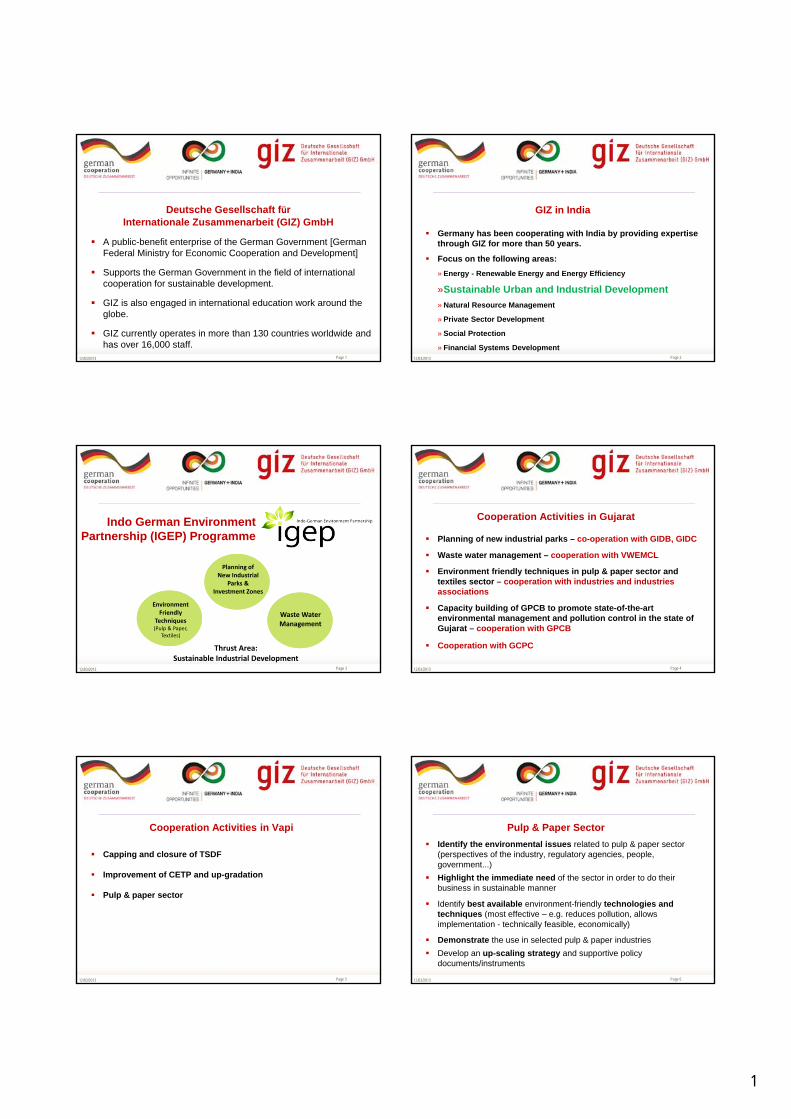
Deutsche Gesellschaft für Internationale Zusammenarbeit (GIZ) GmbH
A public-benefit enterprise of the German Government [German Federal Ministry for Economic Cooperation and Development]
Supports the German Government in the field of international cooperation for sustainable development.
GIZ is also engaged in international education work around the globe.
GIZ currently operates in more than 130 countries worldwide and has over 16,000 staff.
Page 212/03/2013
GIZ in India
Germany has been cooperating with India by providing expertise through GIZ for more than 50 years.
Focus on the following areas:
» Energy - Renewable Energy and Energy Efficiency
»Sustainable Urban and Industrial Development
» Natural Resource Management
» Private Sector Development
» Social Protection
» Financial Systems Development
Page 312/03/2013
Indo German Environment Partnership (IGEP) Programme
Thrust Area: Sustainable Industrial Development
Planning of New Industrial
Parks & Investment Zones
Waste Water Management
Environment Friendly
Techniques(Pulp & Paper,
Textiles)
Page 412/03/2013
Cooperation Activities in Gujarat
Planning of new industrial parks – co-operation with GIDB, GIDC
Waste water management – cooperation with VWEMCL
Environment friendly techniques in pulp & paper sector and textiles sector – cooperation with industries and industries associations
Capacity building of GPCB to promote state-of-the-art environmental management and pollution control in the state of Gujarat – cooperation with GPCB
Cooperation with GCPC
Page 512/03/2013
Cooperation Activities in Vapi
Capping and closure of TSDF
Improvement of CETP and up-gradation
Pulp & paper sector
Page 612/03/2013
Pulp & Paper Sector
Identify the environmental issues related to pulp & paper sector(perspectives of the industry, regulatory agencies, people, government...)
Highlight the immediate need of the sector in order to do their business in sustainable manner
Identify best available environment-friendly technologies and techniques (most effective – e.g. reduces pollution, allows implementation - technically feasible, economically)
Demonstrate the use in selected pulp & paper industries
Develop an up-scaling strategy and supportive policy documents/instruments
2
Page 7company presentation 201212/03/2013 Page 812/03/2013
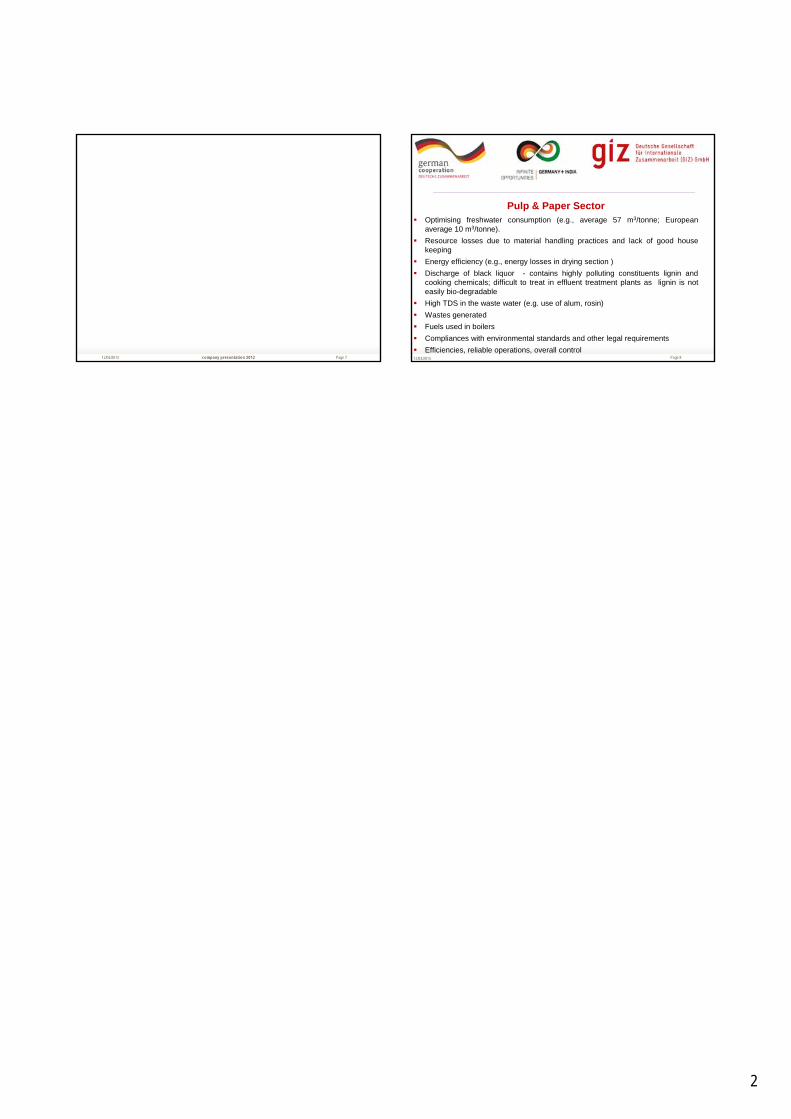
Pulp & Paper Sector Optimising freshwater consumption (e.g., average 57 m3/tonne; European
average 10 m3/tonne).
Resource losses due to material handling practices and lack of good housekeeping
Energy efficiency (e.g., energy losses in drying section )
Discharge of black liquor - contains highly polluting constituents lignin andcooking chemicals; difficult to treat in effluent treatment plants as lignin is noteasily bio-degradable
High TDS in the waste water (e.g. use of alum, rosin)
Wastes generated
Fuels used in boilers
Compliances with environmental standards and other legal requirements
Efficiencies, reliable operations, overall control
12‐03‐2013
1
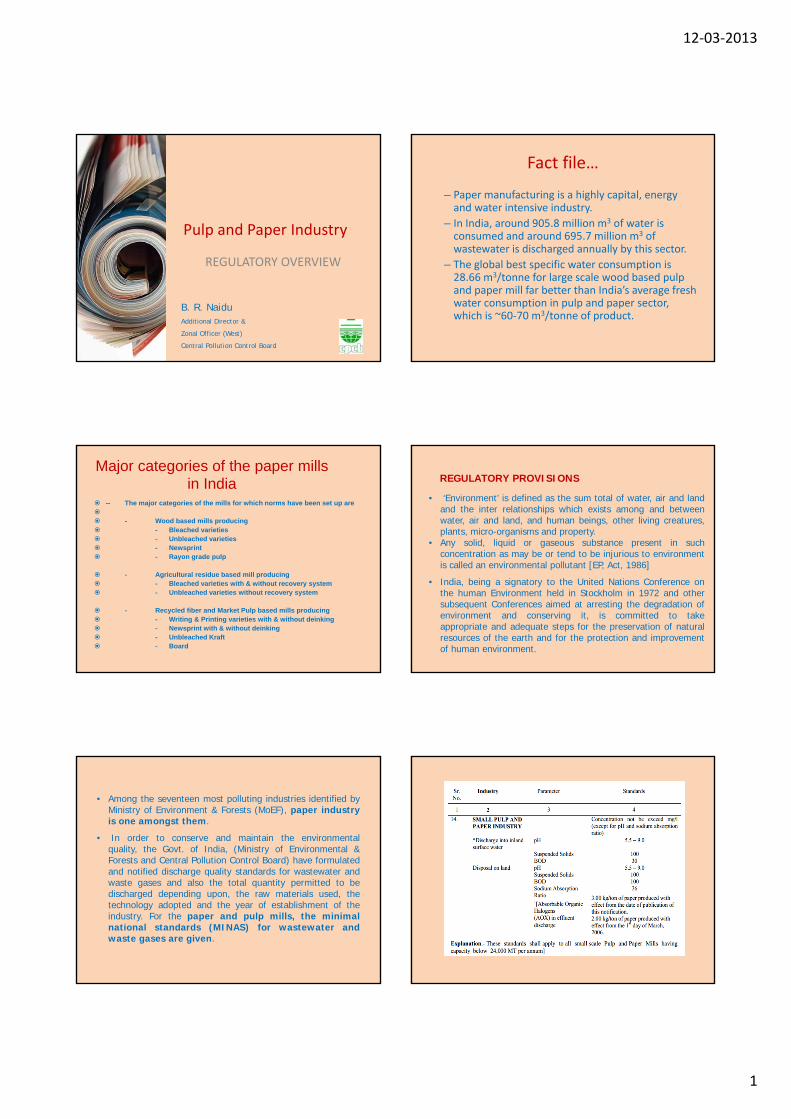
Pulp and Paper Industry
REGULATORY OVERVIEW
B. R. NaiduAdditional Director &
Zonal Officer (West)
Central Pollution Control Board
Fact file…
– Paper manufacturing is a highly capital, energy and water intensive industry.
– In India, around 905.8 million m3 of water is consumed and around 695.7 million m3 of wastewater is discharged annually by this sector.
– The global best specific water consumption is 28.66 m3/tonne for large scale wood based pulp and paper mill far better than India’s average fresh water consumption in pulp and paper sector, which is ~60‐70 m3/tonne of product.
Major categories of the paper mills in India
-- The major categories of the mills for which norms have been set up are
- Wood based mills producing - Bleached varieties - Unbleached varieties - Newsprint - Rayon grade pulp
- Agricultural residue based mill producing - Bleached varieties with & without recovery system - Unbleached varieties without recovery system
- Recycled fiber and Market Pulp based mills producing - Writing & Printing varieties with & without deinking - Newsprint with & without deinking - Unbleached Kraft - Board
REGULATORY PROVISIONS
• ‘Environment’ is defined as the sum total of water, air and landand the inter relationships which exists among and betweenwater, air and land, and human beings, other living creatures,plants, micro-organisms and property.
• Any solid, liquid or gaseous substance present in suchconcentration as may be or tend to be injurious to environmentis called an environmental pollutant [EP, Act, 1986]
• India, being a signatory to the United Nations Conference onthe human Environment held in Stockholm in 1972 and othersubsequent Conferences aimed at arresting the degradation ofenvironment and conserving it, is committed to takeappropriate and adequate steps for the preservation of naturalresources of the earth and for the protection and improvementof human environment.
• Among the seventeen most polluting industries identified byMinistry of Environment & Forests (MoEF), paper industryis one amongst them.
• In order to conserve and maintain the environmentalquality, the Govt. of India, (Ministry of Environmental &Forests and Central Pollution Control Board) have formulatedand notified discharge quality standards for wastewater andwaste gases and also the total quantity permitted to bedischarged depending upon, the raw materials used, thetechnology adopted and the year of establishment of theindustry. For the paper and pulp mills, the minimalnational standards (MINAS) for wastewater andwaste gases are given.
12‐03‐2013
2
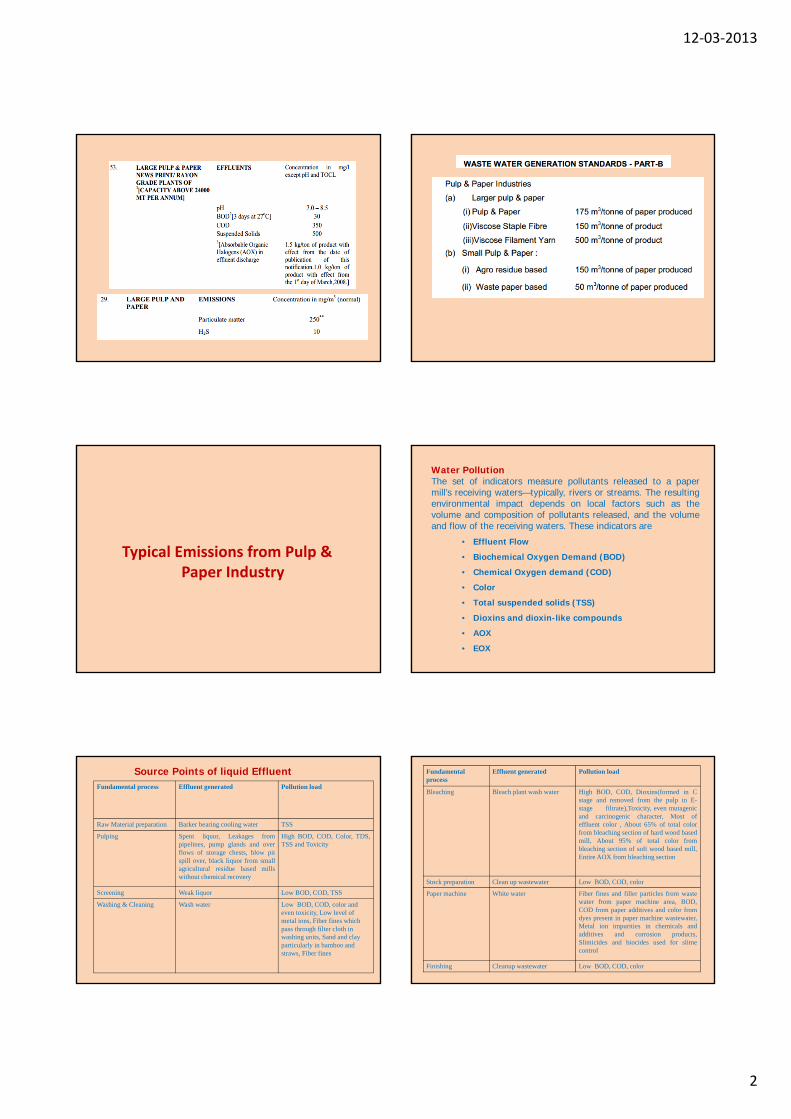
Typical Emissions from Pulp & Paper Industry
Water PollutionThe set of indicators measure pollutants released to a papermill’s receiving waters—typically, rivers or streams. The resultingenvironmental impact depends on local factors such as thevolume and composition of pollutants released, and the volumeand flow of the receiving waters. These indicators are
• Effluent Flow
• Biochemical Oxygen Demand (BOD)
• Chemical Oxygen demand (COD)
• Color
• Total suspended solids (TSS)
• Dioxins and dioxin-like compounds
• AOX
• EOX
Fundamental process Effluent generated Pollution load
Raw Material preparation Barker bearing cooling water TSS
Pulping Spent liquor, Leakages frompipelines, pump glands and overflows of storage chests, blow pitspill over, black liquor from smallagricultural residue based millswithout chemical recovery
High BOD, COD, Color, TDS,TSS and Toxicity
Screening Weak liquor Low BOD, COD, TSS
Washing & Cleaning Wash water Low BOD, COD, color and even toxicity, Low level of metal ions, Fiber fines which pass through filter cloth in washing units, Sand and clay particularly in bamboo and straws, Fiber fines
Source Points of liquid Effluent Fundamentalprocess
Effluent generated Pollution load
Bleaching Bleach plant wash water High BOD, COD, Dioxins(formed in Cstage and removed from the pulp in E-stage filtrate),Toxicity, even mutagenicand carcinogenic character, Most ofeffluent color , About 65% of total colorfrom bleaching section of hard wood basedmill, About 95% of total color frombleaching section of soft wood based mill,Entire AOX from bleaching section
Stock preparation Clean up wastewater Low BOD, COD, color
Paper machine White water Fiber fines and filler particles from wastewater from paper machine area, BOD,COD from paper additives and color fromdyes present in paper machine wastewater,Metal ion impurities in chemicals andadditives and corrosion products,Slimicides and biocides used for slimecontrol
Finishing Cleanup wastewater Low BOD, COD, color
12‐03‐2013
3
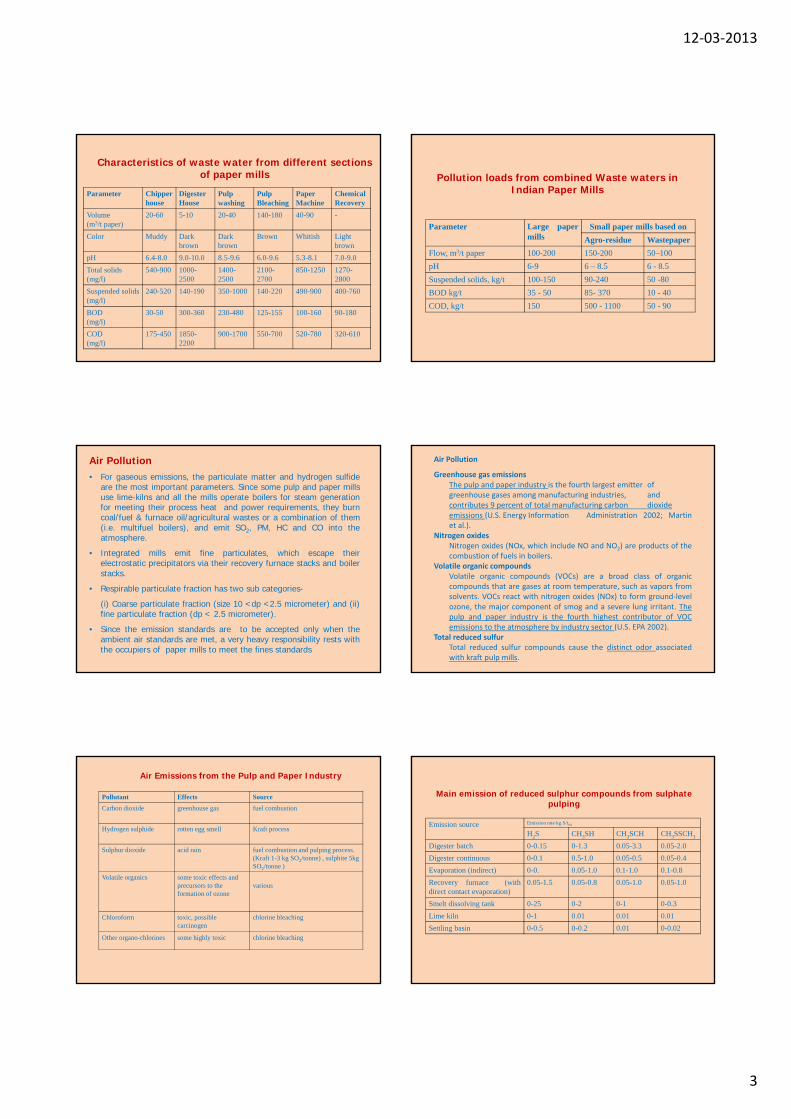
Characteristics of waste water from different sections of paper mills
Parameter Chipperhouse
DigesterHouse
Pulpwashing
PulpBleaching
PaperMachine
ChemicalRecovery
Volume (m3/t paper)
20-60 5-10 20-40 140-180 40-90 -
Color Muddy Darkbrown
Darkbrown
Brown Whitish Lightbrown
pH 6.4-8.0 9.0-10.0 8.5-9.6 6.0-9.6 5.3-8.1 7.0-9.0
Total solids (mg/l)
540-900 1000-2500
1400-2500
2100-2700
850-1250 1270-2800
Suspended solids (mg/l)
240-520 140-190 350-1000 140-220 490-900 400-760
BOD(mg/l)
30-50 300-360 230-480 125-155 100-160 90-180
COD(mg/l)
175-450 1850-2200
900-1700 550-700 520-780 320-610
Pollution loads from combined Waste waters in Indian Paper Mills
Parameter Large papermills
Small paper mills based on
Agro-residue Wastepaper
Flow, m3/t paper 100-200 150-200 50–100
pH 6-9 6 – 8.5 6 - 8.5
Suspended solids, kg/t 100-150 90-240 50 -80
BOD kg/t 35 - 50 85- 370 10 - 40
COD, kg/t 150 500 - 1100 50 - 90
Air Pollution• For gaseous emissions, the particulate matter and hydrogen sulfide
are the most important parameters. Since some pulp and paper millsuse lime-kilns and all the mills operate boilers for steam generationfor meeting their process heat and power requirements, they burncoal/fuel & furnace oil/agricultural wastes or a combination of them(i.e. multifuel boilers), and emit SO2, PM, HC and CO into theatmosphere.
• Integrated mills emit fine particulates, which escape theirelectrostatic precipitators via their recovery furnace stacks and boilerstacks.
• Respirable particulate fraction has two sub categories-
(i) Coarse particulate fraction (size 10 <dp <2.5 micrometer) and (ii)fine particulate fraction (dp < 2.5 micrometer).
• Since the emission standards are to be accepted only when theambient air standards are met, a very heavy responsibility rests withthe occupiers of paper mills to meet the fines standards
Air Pollution
Greenhouse gas emissionsThe pulp and paper industry is the fourth largest emitter ofgreenhouse gases among manufacturing industries, andcontributes 9 percent of total manufacturing carbon dioxideemissions (U.S. Energy Information Administration 2002; Martinet al.).
Nitrogen oxidesNitrogen oxides (NOx, which include NO and NO2) are products of thecombustion of fuels in boilers.
Volatile organic compoundsVolatile organic compounds (VOCs) are a broad class of organiccompounds that are gases at room temperature, such as vapors fromsolvents. VOCs react with nitrogen oxides (NOx) to form ground‐levelozone, the major component of smog and a severe lung irritant. Thepulp and paper industry is the fourth highest contributor of VOCemissions to the atmosphere by industry sector (U.S. EPA 2002).
Total reduced sulfurTotal reduced sulfur compounds cause the distinct odor associatedwith kraft pulp mills.
Air Emissions from the Pulp and Paper Industry
Pollutant Effects Source
Carbon dioxide greenhouse gas fuel combustion
Hydrogen sulphide rotten egg smell Kraft process
Sulphur dioxide acid rain fuel combustion and pulping process. (Kraft 1-3 kg SO2/tonne) , sulphite 5kg SO2/tonne )
Volatile organics some toxic effects and precursors to the formation of ozone
various
Chloroform toxic, possible carcinogen
chlorine bleaching
Other organo-chlorines some highly toxic chlorine bleaching
Main emission of reduced sulphur compounds from sulphate pulping
Emission source Emission rate kg S/t90
H2S CH3SH CH3SCH CH3SSCH3
Digester batch 0-0.15 0-1.3 0.05-3.3 0.05-2.0
Digester continuous 0-0.1 0.5-1.0 0.05-0.5 0.05-0.4
Evaporation (indirect) 0-0. 0.05-1.0 0.1-1.0 0.1-0.8
Recovery furnace (withdirect contact evaporation)
0.05-1.5 0.05-0.8 0.05-1.0 0.05-1.0
Smelt dissolving tank 0-25 0-2 0-1 0-0.3
Lime kiln 0-1 0.01 0.01 0.01
Settling basin 0-0.5 0-0.2 0.01 0-0.02
12‐03‐2013
4
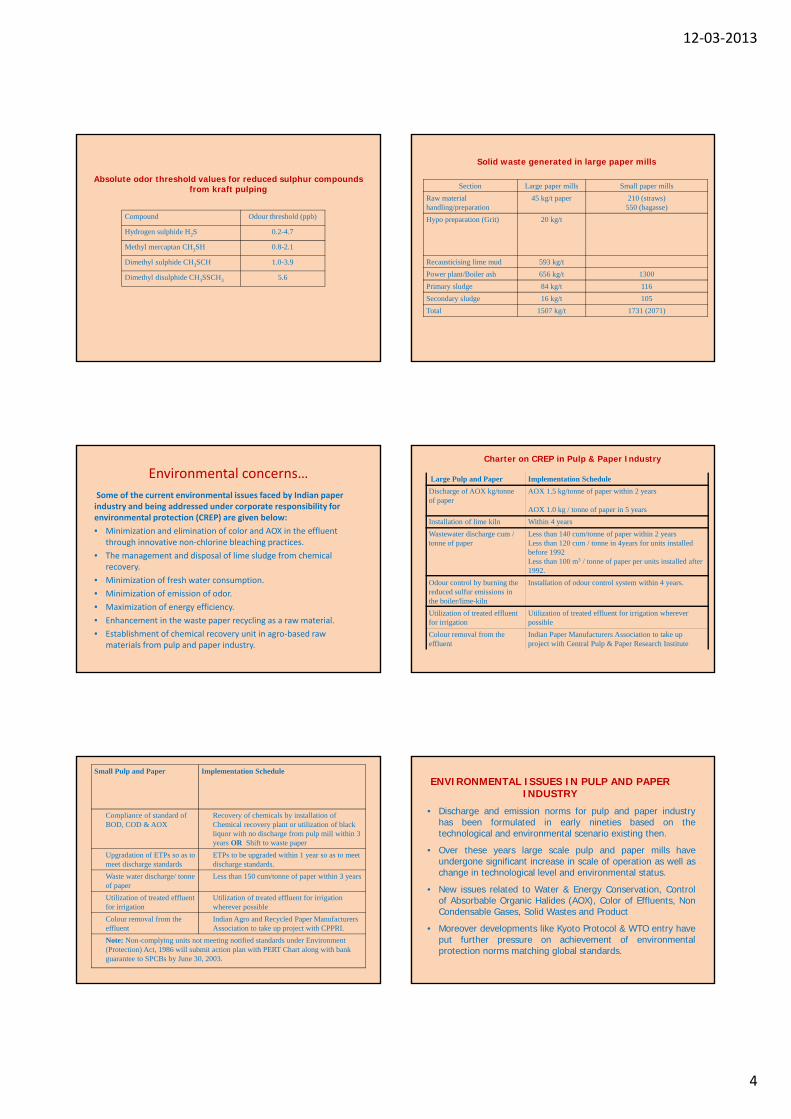
Absolute odor threshold values for reduced sulphur compounds from kraft pulping
Compound Odour threshold (ppb)
Hydrogen sulphide H2S 0.2-4.7
Methyl mercaptan CH3SH 0.8-2.1
Dimethyl sulphide CH3SCH 1.0-3.9
Dimethyl disulphide CH3SSCH3 5.6
Solid waste generated in large paper mills
Section Large paper mills Small paper mills
Raw material handling/preparation
45 kg/t paper 210 (straws)550 (bagasse)
Hypo preparation (Grit) 20 kg/t
Recausticising lime mud 593 kg/t
Power plant/Boiler ash 656 kg/t 1300
Primary sludge 84 kg/t 116
Secondary sludge 16 kg/t 105
Total 1507 kg/t 1731 (2071)
Environmental concerns…
Some of the current environmental issues faced by Indian paper industry and being addressed under corporate responsibility for environmental protection (CREP) are given below:
• Minimization and elimination of color and AOX in the effluent through innovative non‐chlorine bleaching practices.
• The management and disposal of lime sludge from chemical recovery.
• Minimization of fresh water consumption.
• Minimization of emission of odor.
• Maximization of energy efficiency.
• Enhancement in the waste paper recycling as a raw material.
• Establishment of chemical recovery unit in agro‐based raw materials from pulp and paper industry.
Charter on CREP in Pulp & Paper Industry
Large Pulp and Paper Implementation Schedule
Discharge of AOX kg/tonne of paper
AOX 1.5 kg/tonne of paper within 2 years
AOX 1.0 kg / tonne of paper in 5 years
Installation of lime kiln Within 4 years
Wastewater discharge cum / tonne of paper
Less than 140 cum/tonne of paper within 2 years Less than 120 cum / tonne in 4years for units installed before 1992 Less than 100 m3 / tonne of paper per units installed after 1992.
Odour control by burning the reduced sulfur emissions in the boiler/lime-kiln
Installation of odour control system within 4 years.
Utilization of treated effluent for irrigation
Utilization of treated effluent for irrigation wherever possible
Colour removal from the effluent
Indian Paper Manufacturers Association to take up project with Central Pulp & Paper Research Institute
Small Pulp and Paper Implementation Schedule
Compliance of standard of BOD, COD & AOX
Recovery of chemicals by installation of Chemical recovery plant or utilization of black liquor with no discharge from pulp mill within 3 years OR Shift to waste paper
Upgradation of ETPs so as to meet discharge standards
ETPs to be upgraded within 1 year so as to meet discharge standards.
Waste water discharge/ tonne of paper
Less than 150 cum/tonne of paper within 3 years
Utilization of treated effluent for irrigation
Utilization of treated effluent for irrigation wherever possible
Colour removal from the effluent
Indian Agro and Recycled Paper Manufacturers Association to take up project with CPPRI.
Note: Non-complying units not meeting notified standards under Environment (Protection) Act, 1986 will submit action plan with PERT Chart along with bank guarantee to SPCBs by June 30, 2003.
ENVIRONMENTAL ISSUES IN PULP AND PAPER INDUSTRY
• Discharge and emission norms for pulp and paper industryhas been formulated in early nineties based on thetechnological and environmental scenario existing then.
• Over these years large scale pulp and paper mills haveundergone significant increase in scale of operation as well aschange in technological level and environmental status.
• New issues related to Water & Energy Conservation, Controlof Absorbable Organic Halides (AOX), Color of Effluents, NonCondensable Gases, Solid Wastes and Product
• Moreover developments like Kyoto Protocol & WTO entry haveput further pressure on achievement of environmentalprotection norms matching global standards.
12‐03‐2013
5
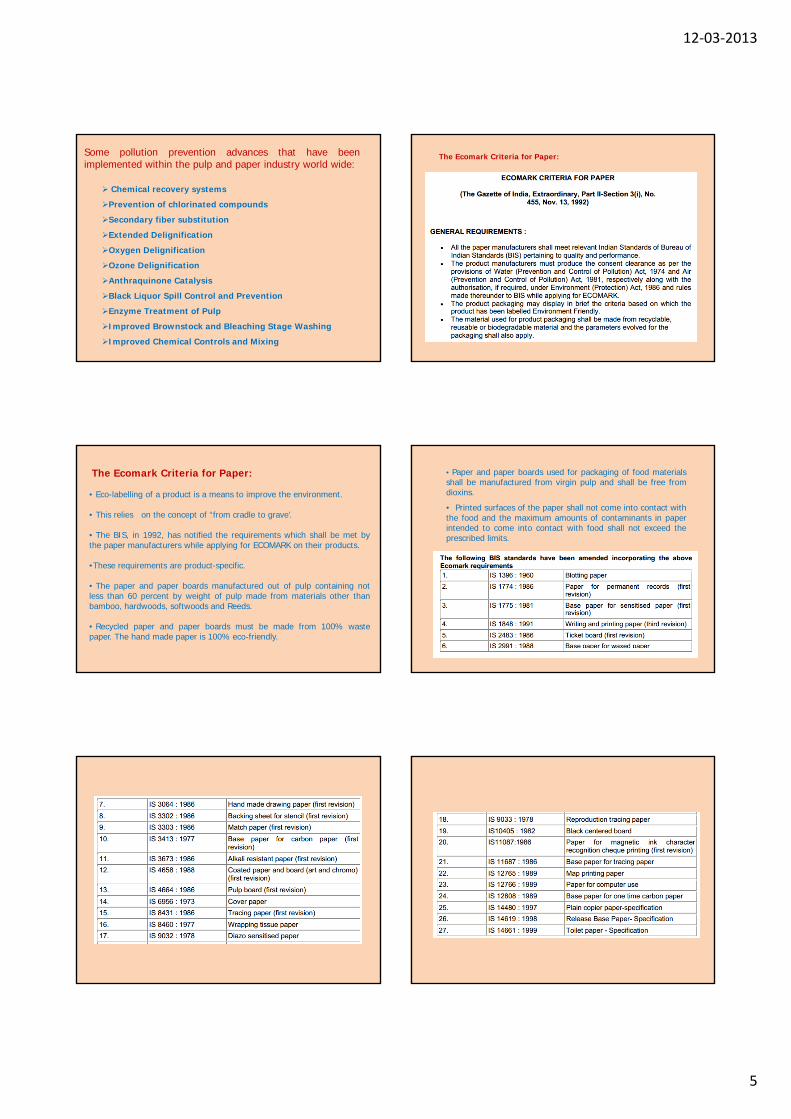
Some pollution prevention advances that have beenimplemented within the pulp and paper industry world wide:
Chemical recovery systems
Prevention of chlorinated compounds
Secondary fiber substitution
Extended Delignification
Oxygen Delignification
Ozone Delignification
Anthraquinone Catalysis
Black Liquor Spill Control and Prevention
Enzyme Treatment of Pulp
Improved Brownstock and Bleaching Stage Washing
Improved Chemical Controls and Mixing
The Ecomark Criteria for Paper:
The Ecomark Criteria for Paper:
• Eco-labelling of a product is a means to improve the environment.
• This relies on the concept of “from cradle to grave’.
• The BIS, in 1992, has notified the requirements which shall be met bythe paper manufacturers while applying for ECOMARK on their products.
•These requirements are product-specific.
• The paper and paper boards manufactured out of pulp containing notless than 60 percent by weight of pulp made from materials other thanbamboo, hardwoods, softwoods and Reeds.
• Recycled paper and paper boards must be made from 100% wastepaper. The hand made paper is 100% eco-friendly.
• Paper and paper boards used for packaging of food materialsshall be manufactured from virgin pulp and shall be free fromdioxins.
• Printed surfaces of the paper shall not come into contact withthe food and the maximum amounts of contaminants in paperintended to come into contact with food shall not exceed theprescribed limits.

12‐03‐2013
6
1
Page 1company presentation 201212/03/2013
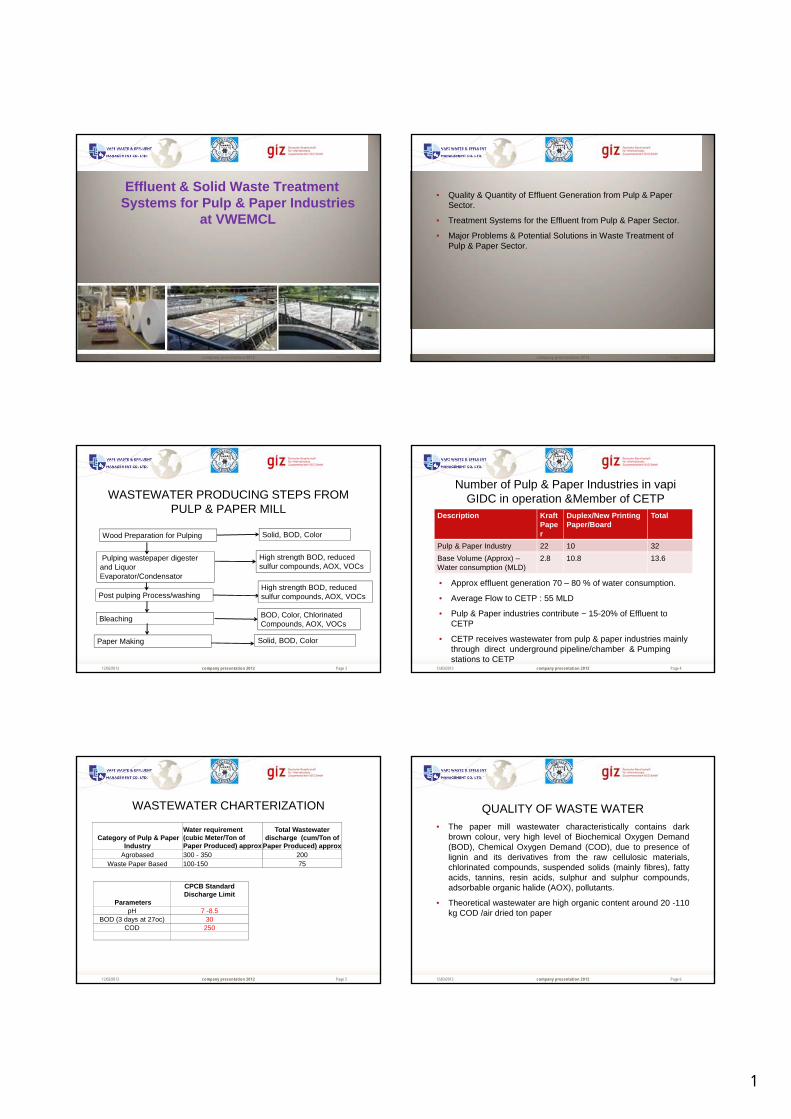
Effluent & Solid Waste Treatment Systems for Pulp & Paper Industries
at VWEMCL
Page 2company presentation 201212/03/2013
• Quality & Quantity of Effluent Generation from Pulp & Paper Sector.
• Treatment Systems for the Effluent from Pulp & Paper Sector.
• Major Problems & Potential Solutions in Waste Treatment of Pulp & Paper Sector.
Page 3company presentation 201212/03/2013
WASTEWATER PRODUCING STEPS FROM PULP & PAPER MILL
Wood Preparation for Pulping Solid, BOD, Color
Pulping wastepaper digester and Liquor Evaporator/Condensator
High strength BOD, reduced sulfur compounds, AOX, VOCs
Post pulping Process/washingHigh strength BOD, reduced sulfur compounds, AOX, VOCs
Bleaching BOD, Color, Chlorinated Compounds, AOX, VOCs
Paper Making Solid, BOD, Color
Page 4company presentation 201212/03/2013
• Approx effluent generation 70 – 80 % of water consumption.
• Average Flow to CETP : 55 MLD
• Pulp & Paper industries contribute ~ 15-20% of Effluent to CETP
• CETP receives wastewater from pulp & paper industries mainly through direct underground pipeline/chamber & Pumping stations to CETP
Number of Pulp & Paper Industries in vapiGIDC in operation &Member of CETP
Description KraftPaper
Duplex/New Printing Paper/Board
Total
Pulp & Paper Industry 22 10 32
Base Volume (Approx) –Water consumption (MLD)
2.8 10.8 13.6
Page 5company presentation 201212/03/2013
WASTEWATER CHARTERIZATION
Category of Pulp & Paper Industry
Water requirement (cubic Meter/Ton of Paper Produced) approx
Total Wastewater discharge (cum/Ton of
Paper Produced) approxAgrobased 300 - 350 200
Waste Paper Based 100-150 75
Parameters
CPCB Standard Discharge Limit
pH 7 -8.5BOD (3 days at 27oc) 30
COD 250
Page 6company presentation 201212/03/2013
• The paper mill wastewater characteristically contains darkbrown colour, very high level of Biochemical Oxygen Demand(BOD), Chemical Oxygen Demand (COD), due to presence oflignin and its derivatives from the raw cellulosic materials,chlorinated compounds, suspended solids (mainly fibres), fattyacids, tannins, resin acids, sulphur and sulphur compounds,adsorbable organic halide (AOX), pollutants.
• Theoretical wastewater are high organic content around 20 -110kg COD /air dried ton paper
QUALITY OF WASTE WATER
2
Page 7company presentation 201212/03/2013
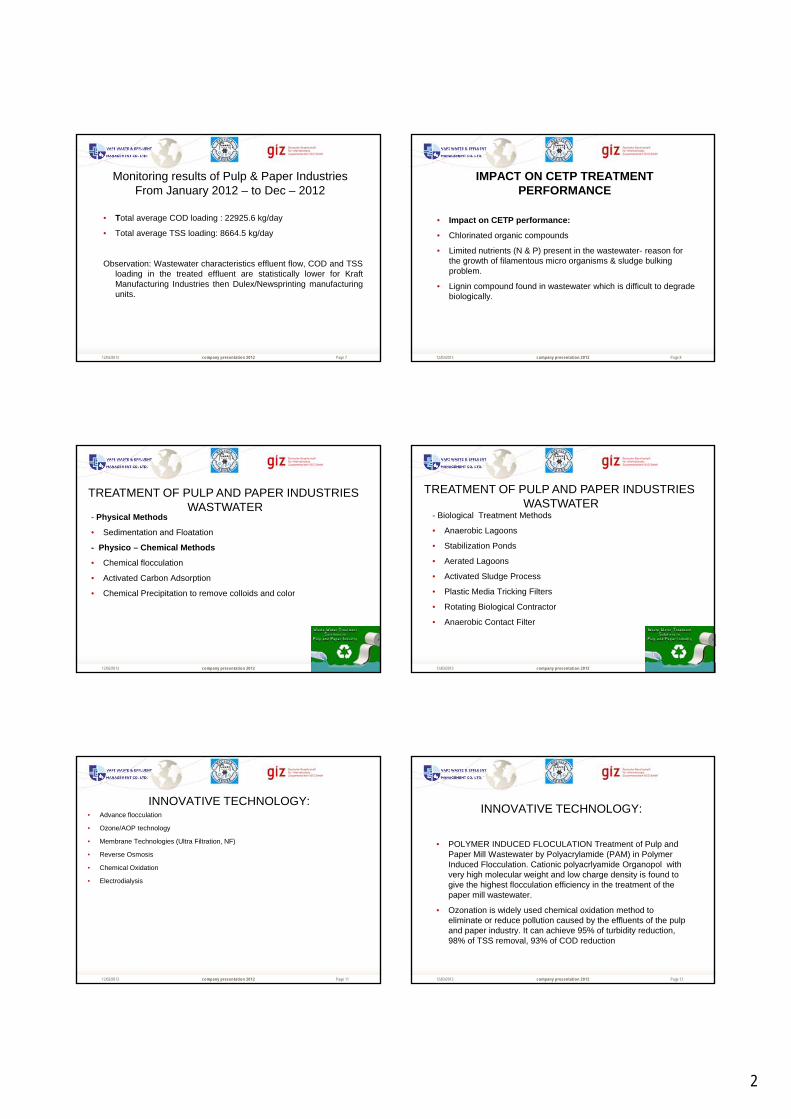
• Total average COD loading : 22925.6 kg/day
• Total average TSS loading: 8664.5 kg/day
Observation: Wastewater characteristics effluent flow, COD and TSSloading in the treated effluent are statistically lower for KraftManufacturing Industries then Dulex/Newsprinting manufacturingunits.
Monitoring results of Pulp & Paper Industries From January 2012 – to Dec – 2012
Page 8company presentation 201212/03/2013
• Impact on CETP performance:
• Chlorinated organic compounds
• Limited nutrients (N & P) present in the wastewater- reason for the growth of filamentous micro organisms & sludge bulking problem.
• Lignin compound found in wastewater which is difficult to degrade biologically.
IMPACT ON CETP TREATMENT PERFORMANCE
Page 9company presentation 201212/03/2013
- Physical Methods
• Sedimentation and Floatation
- Physico – Chemical Methods
• Chemical flocculation
• Activated Carbon Adsorption
• Chemical Precipitation to remove colloids and color
TREATMENT OF PULP AND PAPER INDUSTRIESWASTWATER
Page 10company presentation 201212/03/2013
- Biological Treatment Methods
• Anaerobic Lagoons
• Stabilization Ponds
• Aerated Lagoons
• Activated Sludge Process
• Plastic Media Tricking Filters
• Rotating Biological Contractor
• Anaerobic Contact Filter
TREATMENT OF PULP AND PAPER INDUSTRIESWASTWATER
Page 11company presentation 201212/03/2013
INNOVATIVE TECHNOLOGY:• Advance flocculation
• Ozone/AOP technology
• Membrane Technologies (Ultra Filtration, NF)
• Reverse Osmosis
• Chemical Oxidation
• Electrodialysis
Page 12company presentation 201212/03/2013
• POLYMER INDUCED FLOCULATION Treatment of Pulp and Paper Mill Wastewater by Polyacrylamide (PAM) in Polymer Induced Flocculation. Cationic polyacrlyamide Organopol with very high molecular weight and low charge density is found to give the highest flocculation efficiency in the treatment of the paper mill wastewater.
• Ozonation is widely used chemical oxidation method to eliminate or reduce pollution caused by the effluents of the pulp and paper industry. It can achieve 95% of turbidity reduction, 98% of TSS removal, 93% of COD reduction
INNOVATIVE TECHNOLOGY:
3
Page 13
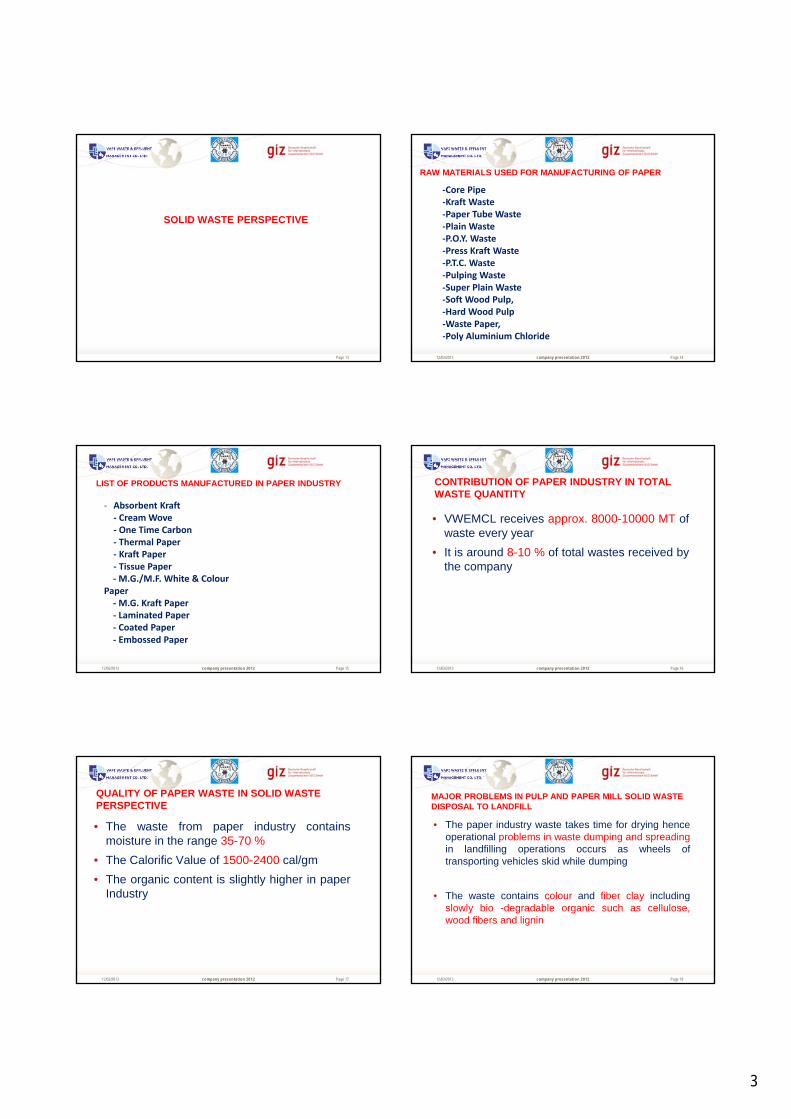
SOLID WASTE PERSPECTIVE
Page 14company presentation 201212/03/2013
RAW MATERIALS USED FOR MANUFACTURING OF PAPER
‐Core Pipe‐Kraft Waste‐Paper Tube Waste‐Plain Waste‐P.O.Y. Waste‐Press Kraft Waste‐P.T.C. Waste‐Pulping Waste‐Super Plain Waste‐Soft Wood Pulp,‐Hard Wood Pulp‐Waste Paper, ‐Poly Aluminium Chloride
Page 15company presentation 201212/03/2013
‐ Absorbent Kraft ‐ Cream Wove ‐ One Time Carbon‐ Thermal Paper‐ Kraft Paper‐ Tissue Paper ‐M.G./M.F. White & Colour
Paper‐M.G. Kraft Paper‐ Laminated Paper‐ Coated Paper‐ Embossed Paper
LIST OF PRODUCTS MANUFACTURED IN PAPER INDUSTRY
Page 16company presentation 201212/03/2013
CONTRIBUTION OF PAPER INDUSTRY IN TOTAL WASTE QUANTITY
• VWEMCL receives approx. 8000-10000 MT ofwaste every year
• It is around 8-10 % of total wastes received bythe company
Page 17company presentation 201212/03/2013
QUALITY OF PAPER WASTE IN SOLID WASTE PERSPECTIVE
• The waste from paper industry containsmoisture in the range 35-70 %
• The Calorific Value of 1500-2400 cal/gm
• The organic content is slightly higher in paperIndustry
Page 18company presentation 201212/03/2013
MAJOR PROBLEMS IN PULP AND PAPER MILL SOLID WASTE DISPOSAL TO LANDFILL
• The paper industry waste takes time for drying henceoperational problems in waste dumping and spreadingin landfilling operations occurs as wheels oftransporting vehicles skid while dumping
• The waste contains colour and fiber clay includingslowly bio -degradable organic such as cellulose,wood fibers and lignin
4
Page 19company presentation 201212/03/2013
ALTERNATIVE SOLUTIONS FOR SOLID WASTE PRE-TREATMENTS BEFORE LANDFILLING
• Effective drying mechanisms can be adopted formoisture reductions
• The waste can be used for co-processing with cementindustry after mixing or blending with relatively highCV wastes
• Treatment systems can be enhanced for the reductionof solid waste quantity at source
Page 20company presentation 201212/03/2013
• Due to high CV contents briquettes can be preparedand used for further treatments
• Plastic waste generation is a major of the industrywhich can be used as an alternative fuel for cement orother kilns
ALTERNATIVE SOLUTIONS FOR SOLID WASTEPRE-TREATMENTS BEFORE LANDFILLING
Page 21company presentation 201212/03/2013
THANK YOU
12-03-2013
1
G. V. Patel
REGIONAL OFFICER
Gujarat Pollution Control Board
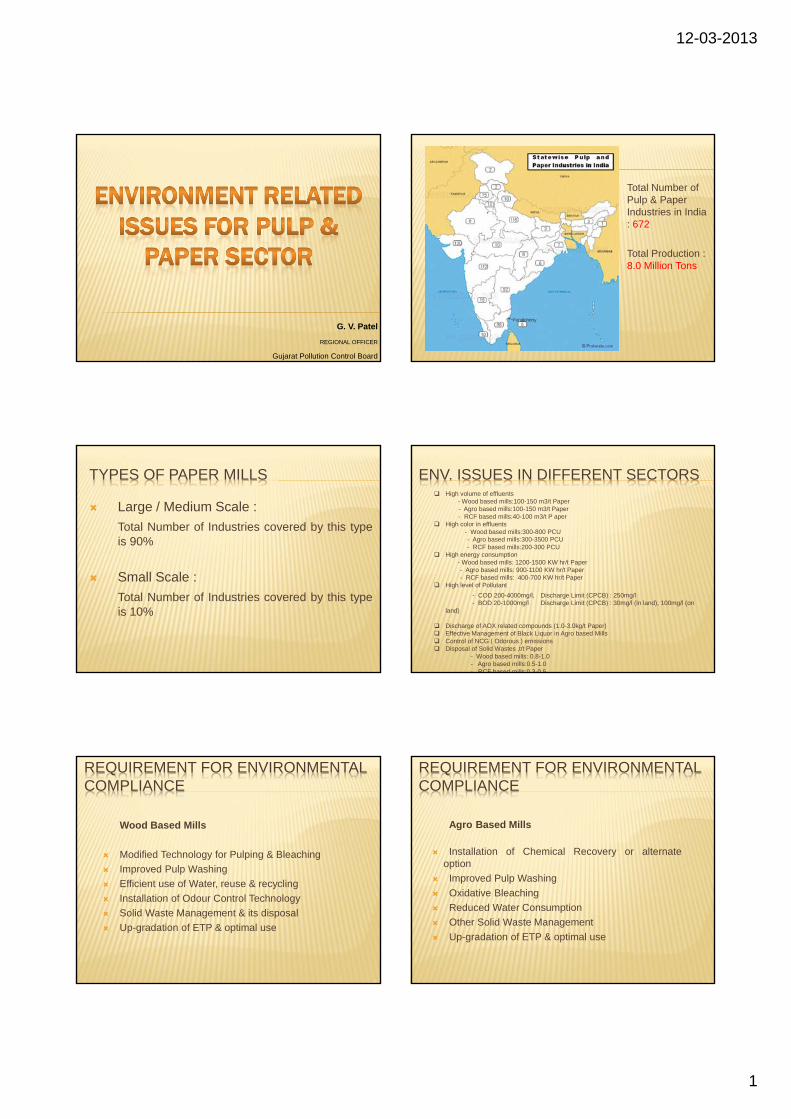
Total Number of Pulp & Paper Industries in India : 672
Total Production : 8.0 Million Tons
Large / Medium Scale :
Total Number of Industries covered by this typeis 90%
Small Scale :
Total Number of Industries covered by this typeis 10%
TYPES OF PAPER MILLS ENV. ISSUES IN DIFFERENT SECTORS High volume of effluents
- Wood based mills:100-150 m3/t Paper- Agro based mills:100-150 m3/t Paper - RCF based mills:40-100 m3/t P aper
High color in effluents - Wood based mills:300-800 PCU- Agro based mills:300-3500 PCU- RCF based mills:200-300 PCU
High energy consumption- Wood based mills: 1200-1500 KW hr/t Paper- Agro based mills: 900-1100 KW hr/t Paper - RCF based mills: 400-700 KW hr/t Paper
High level of Pollutant
- COD 200-4000mg/l, Discharge Limit (CPCB) : 250mg/l- BOD 20-1000mg/l Discharge Limit (CPCB) : 30mg/l (in land), 100mg/l (on
land)
Discharge of AOX related compounds (1.0-3.0kg/t Paper) Effective Management of Black Liquor in Agro based Mills Control of NCG ( Odorous ) emissions Disposal of Solid Wastes ,t/t Paper
- Wood based mills: 0.8-1.0- Agro based mills:0.5-1.0- RCF based mills:0.3-0.5
REQUIREMENT FOR ENVIRONMENTAL COMPLIANCE
Wood Based Mills
Modified Technology for Pulping & Bleaching
Improved Pulp Washing
Efficient use of Water, reuse & recycling
Installation of Odour Control Technology
Solid Waste Management & its disposal
Up-gradation of ETP & optimal use
REQUIREMENT FOR ENVIRONMENTAL COMPLIANCE
Agro Based Mills
Installation of Chemical Recovery or alternateoption
Improved Pulp Washing
Oxidative Bleaching
Reduced Water Consumption
Other Solid Waste Management
Up-gradation of ETP & optimal use
12-03-2013
2
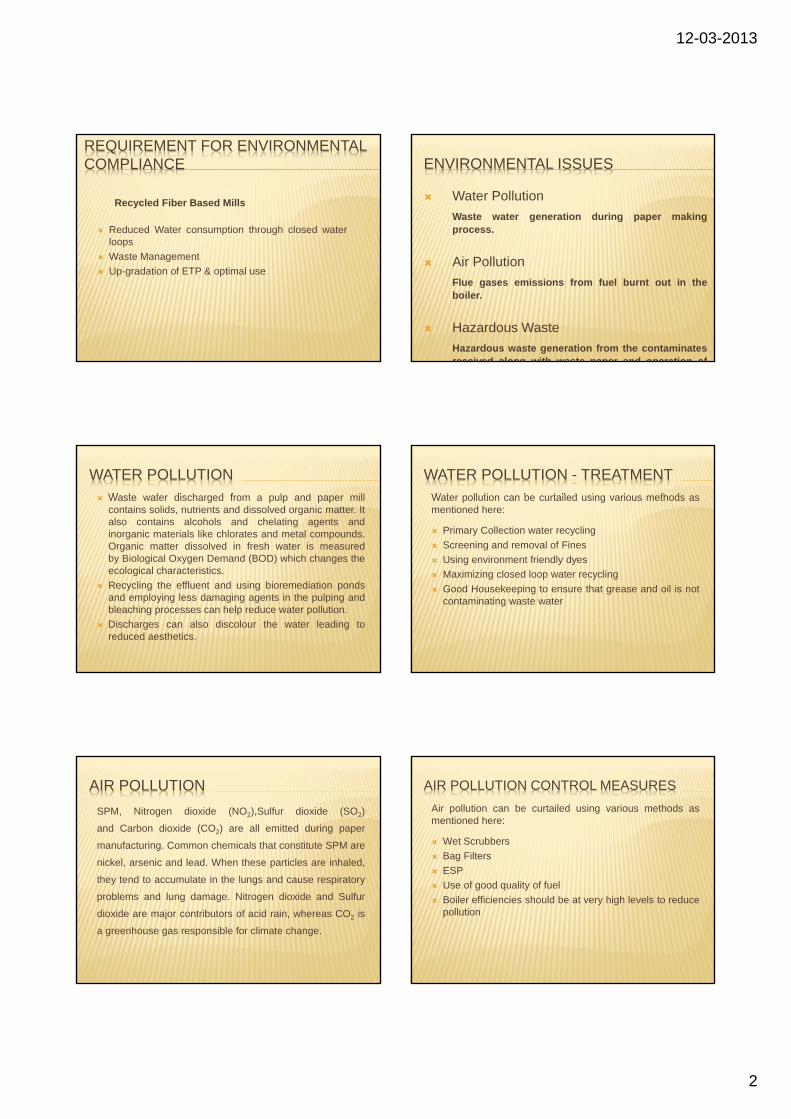
REQUIREMENT FOR ENVIRONMENTAL COMPLIANCE
Recycled Fiber Based Mills
Reduced Water consumption through closed waterloops
Waste Management
Up-gradation of ETP & optimal use
ENVIRONMENTAL ISSUES
Water Pollution
Waste water generation during paper makingprocess.
Air Pollution
Flue gases emissions from fuel burnt out in theboiler.
Hazardous Waste
Hazardous waste generation from the contaminatesreceived along with waste paper and operation of
Waste water discharged from a pulp and paper millcontains solids, nutrients and dissolved organic matter. Italso contains alcohols and chelating agents andinorganic materials like chlorates and metal compounds.Organic matter dissolved in fresh water is measuredby Biological Oxygen Demand (BOD) which changes theecological characteristics.
Recycling the effluent and using bioremediation pondsand employing less damaging agents in the pulping andbleaching processes can help reduce water pollution.
Discharges can also discolour the water leading toreduced aesthetics.
WATER POLLUTIONWater pollution can be curtailed using various methods asmentioned here:
Primary Collection water recycling
Screening and removal of Fines
Using environment friendly dyes
Maximizing closed loop water recycling
Good Housekeeping to ensure that grease and oil is notcontaminating waste water
WATER POLLUTION - TREATMENT
SPM, Nitrogen dioxide (NO2),Sulfur dioxide (SO2)
and Carbon dioxide (CO2) are all emitted during paper
manufacturing. Common chemicals that constitute SPM are
nickel, arsenic and lead. When these particles are inhaled,
they tend to accumulate in the lungs and cause respiratory
problems and lung damage. Nitrogen dioxide and Sulfur
dioxide are major contributors of acid rain, whereas CO2 is
a greenhouse gas responsible for climate change.
AIR POLLUTIONAir pollution can be curtailed using various methods asmentioned here:
Wet Scrubbers
Bag Filters
ESP
Use of good quality of fuel
Boiler efficiencies should be at very high levels to reducepollution
AIR POLLUTION CONTROL MEASURES
12-03-2013
3
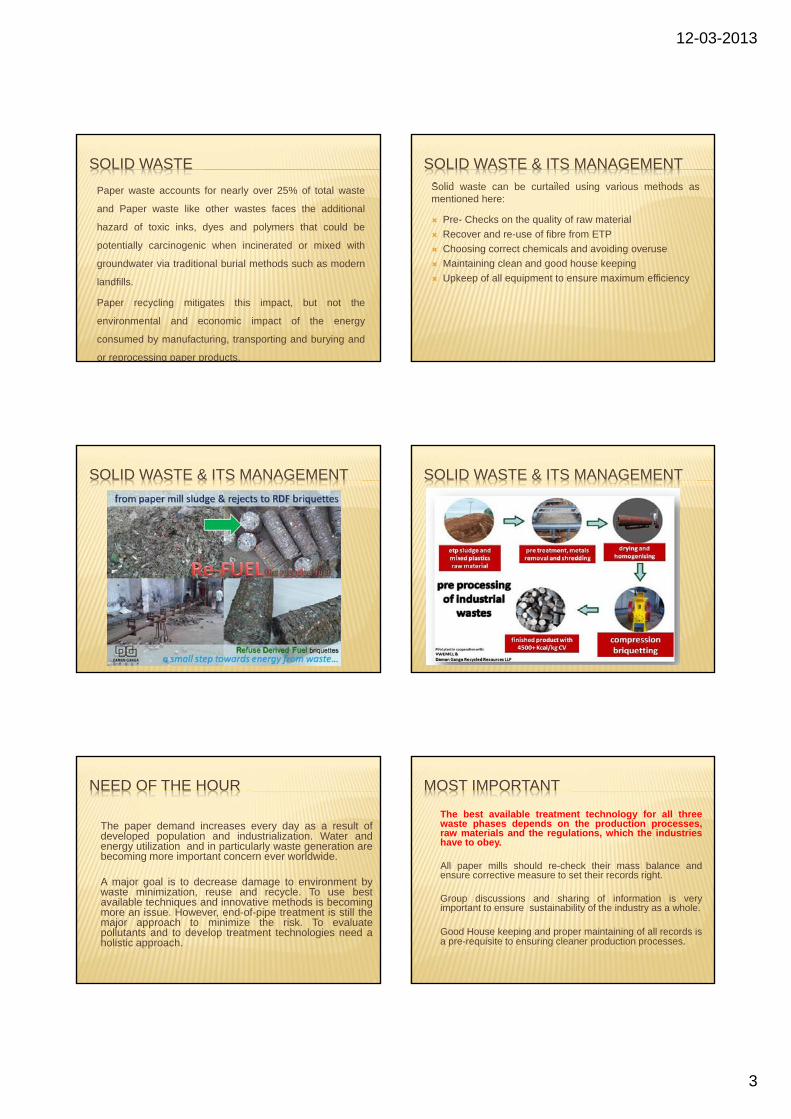
Paper waste accounts for nearly over 25% of total waste
and Paper waste like other wastes faces the additional
hazard of toxic inks, dyes and polymers that could be
potentially carcinogenic when incinerated or mixed with
groundwater via traditional burial methods such as modern
landfills.
Paper recycling mitigates this impact, but not the
environmental and economic impact of the energy
consumed by manufacturing, transporting and burying and
or reprocessing paper products.
SOLID WASTESolid waste can be curtailed using various methods asmentioned here:
Pre- Checks on the quality of raw material
Recover and re-use of fibre from ETP
Choosing correct chemicals and avoiding overuse
Maintaining clean and good house keeping
Upkeep of all equipment to ensure maximum efficiency
SOLID WASTE & ITS MANAGEMENT
SOLID WASTE & ITS MANAGEMENT SOLID WASTE & ITS MANAGEMENT
The paper demand increases every day as a result ofdeveloped population and industrialization. Water andenergy utilization and in particularly waste generation arebecoming more important concern ever worldwide.
A major goal is to decrease damage to environment bywaste minimization, reuse and recycle. To use bestavailable techniques and innovative methods is becomingmore an issue. However, end-of-pipe treatment is still themajor approach to minimize the risk. To evaluatepollutants and to develop treatment technologies need aholistic approach.
NEED OF THE HOUR
The best available treatment technology for all threewaste phases depends on the production processes,raw materials and the regulations, which the industrieshave to obey.
All paper mills should re-check their mass balance andensure corrective measure to set their records right.
Group discussions and sharing of information is veryimportant to ensure sustainability of the industry as a whole.
Good House keeping and proper maintaining of all records isa pre-requisite to ensuring cleaner production processes.
MOST IMPORTANT

12-03-2013
4

1
Page 1
Your logo
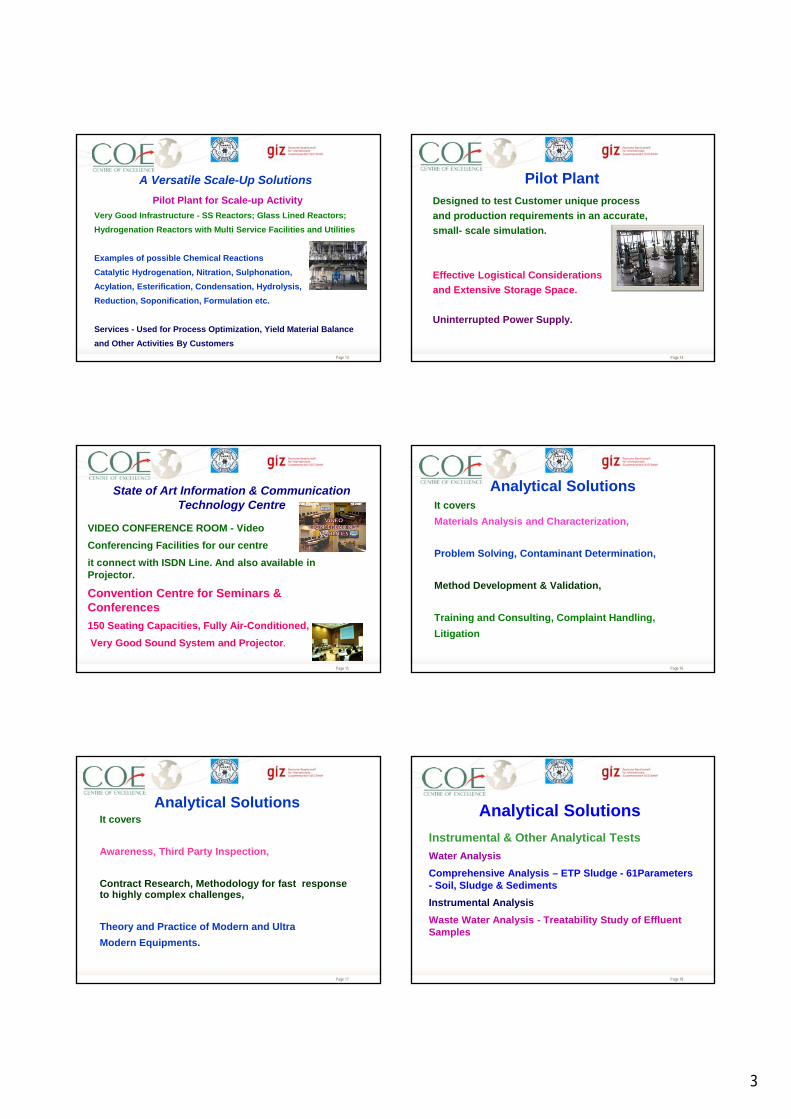
Opportunity to Utilize
Centre of Excellence,Vapi
for Research / Analytical Solutions /
Pilot Project by
Pulp & Paper Industries
Opportunity to Utilize
Centre of Excellence,Vapi
for Research / Analytical Solutions /
Pilot Project by
Pulp & Paper Industries
Page 2
Your logo
Areas Covered in Presentations
Existing Facilities in COE.
Proposed Research / Analytical Solution for Pulp &
Paper Sector.
Requirement of Policy to Utilize the COE Facilities
for R & D and Solving Environmental Issues.
Page 3
Your logo
Centre of Excellence, (COE) Vapi
A Division of Vapi Waste & Effluent Management
Company Limited, Vapi (VWEMCL).
Established under the Industrial Infrastructure
Development Scheme (IIDS) of the Ministry of
Commerce and Industry, Government of India.
Page 4
Your logo
Existing Facilities in COE
LABORATORY -ANALYTICAL & COLOUR
INFORMATION TECHNOLOGY -VIDEO CONFERENCE FACILITY &
CONVENTION CENTRE
PILOT PLANT
Page 5
Your logo
CENTRE OF EXCELLENCE
An ISO-9001:2008 Accredited Organization
World Class Analytical & Product Development
Facility Available At Vapi, Under One Roof Within
Reach At Affordable Price
In the process of getting, FDA (Food and Drugs
control Administration), and NABL (National
Accreditation Board for testing & calibration
Laboratories)Page 6
Your logo
CENTRE OF EXCELLENCE
Focusing Knowledge Sharing And Case Studies For
Sustainable Growth and Continual Innovation
Our Assets - System and Experience In Analytical
Services
Near Term Initiatives - Environmental Solutions ,
Analytical Application Research ,MOU with Gujarat
Cleaner Production Centre
2
Page 7
Your logo
Analytical Laboratory
A state of the Art Laboratory having Modern Sophisticated Instruments such as NMR, GC-MS, ICP, Particle Size Analyzer, GC and HPLC as well as DSC and TGA.
The Laboratory has capability of analyzingsamples as per various Customer Requirements
Page 8
Your logo
Services ProvidedMaterials Analysis; Problem Solving;
Method Development & Validation;
Contaminant Determination;
Third Party Inspection;
Training and Consulting etc
Page 9
Your logo
Analytical Equipments at COE
Spectroscopy,Molecular Identification
and Analysis
FTIR - FOURIER TRANSFORM INFRARED SPECTROMETER
PERKINELMER
SpectroscopyMolecular Identification
and Analysis
UV- VISIBLE SPECTROPHOTOMETERSHIMADZU
SpectroscopyMolecular Identification
and Analysis
NMR - NUCLEAR MAGNATICRESONANCE SPECTROMETER
VARIAN - 400 MHz
SpectroscopyMolecular Identification
and Analysis
ICP - OES - INDUCTIVE COUPLED PLASMA - OPTICLE EMMISION
SPECTROSCOPY,PERKINELMER
Page 10
Your logo
Analytical Equipments at COE
Chromatography IC - ION CHROMATOGRAPHY,METROHM
ChromatographyGC-MS (GAS CHROMATOGRAPH - MASS
SPECTROMETER),PERKINELMER
ChromatographyGC - GAS CHROMATOGRPHY
(WITH FID,FPD & ECD,NPD),PERKINELMER
ChromatographyHPLC - HIGH PERFORMANCE
LIQUID CHROMATOGRAPHY,SHIMADZU
ChromatographyHPTLC - HIGH PERFORMANCE THIN LAYER
CHROMATOGRAPH,CAMAG
Page 11
Your logo
Analytical Equipments at COE
Physical and Thermal Analysis
DSC - DIFFERENTIAL SCANNING CALOROMETER
PERKINELMER
Physical and Thermal Analysis
TGA - THERMOGRAVIMETRIC ANALYZER, PERKINELMER
Analysis of Total Organic Carbon
TOC - TOTAL ORGANICCARBON ANALYZERTELYDEN TEKMAR
PARTICLE SIZE ANALYZER
PARTICLE SIZE ANALYZERMALVERN
Page 12
Your logo
Analytical Equipments at COE
KARL FISCHER TITRATOR LAB-INDIA
PH-METER LAB-INDIA
TCLP MILLIPORE
BOMB CALORIMETER RICO SCIENTIFIC
VISCOMETER BROOKFIELD
3
Page 13
Your logo
A Versatile Scale-Up Solutions
Pilot Plant for Scale-up Activity
Very Good Infrastructure - SS Reactors; Glass Lined Reactors;
Hydrogenation Reactors with Multi Service Facilities and Utilities
Examples of possible Chemical Reactions
Catalytic Hydrogenation, Nitration, Sulphonation,
Acylation, Esterification, Condensation, Hydrolysis,
Reduction, Soponification, Formulation etc.
Services - Used for Process Optimization, Yield Material Balance
and Other Activities By Customers
Page 14
Your logo
Pilot PlantDesigned to test Customer unique process
and production requirements in an accurate,
small- scale simulation.
Effective Logistical Considerations
and Extensive Storage Space.
Uninterrupted Power Supply.
Page 15
Your logo
State of Art Information & Communication Technology Centre
VIDEO CONFERENCE ROOM - Video
Conferencing Facilities for our centre
it connect with ISDN Line. And also available in Projector.
Convention Centre for Seminars & Conferences
150 Seating Capacities, Fully Air-Conditioned,
Very Good Sound System and Projector.
Page 16
Your logo
Analytical SolutionsIt covers
Materials Analysis and Characterization,
Problem Solving, Contaminant Determination,
Method Development & Validation,
Training and Consulting, Complaint Handling,
Litigation
Page 17
Your logo
Analytical SolutionsIt covers
Awareness, Third Party Inspection,
Contract Research, Methodology for fast response to highly complex challenges,
Theory and Practice of Modern and Ultra
Modern Equipments.
Page 18
Your logo
Analytical Solutions
Instrumental & Other Analytical Tests
Water Analysis
Comprehensive Analysis – ETP Sludge - 61Parameters - Soil, Sludge & Sediments
Instrumental Analysis
Waste Water Analysis - Treatability Study of Effluent Samples
4
Page 19
Your logo
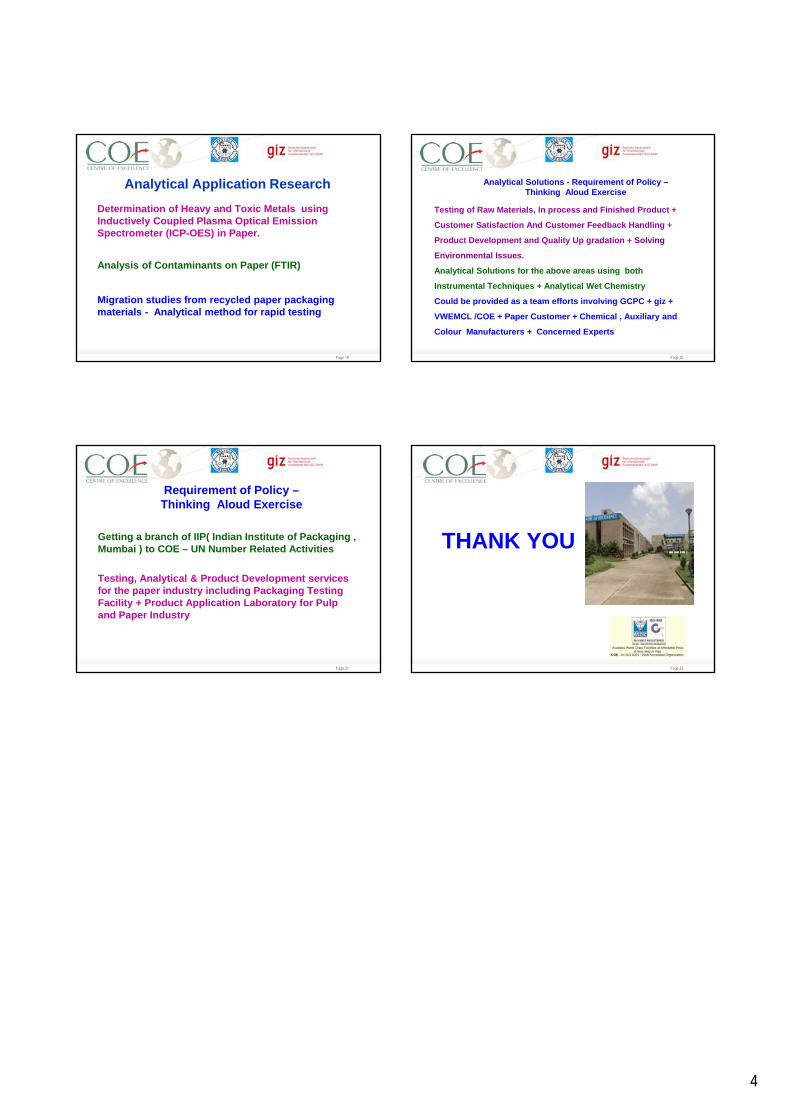
Analytical Application Research
Determination of Heavy and Toxic Metals using Inductively Coupled Plasma Optical Emission Spectrometer (ICP-OES) in Paper.
Analysis of Contaminants on Paper (FTIR)
Migration studies from recycled paper packaging materials - Analytical method for rapid testing
Page 20
Your logo
Analytical Solutions - Requirement of Policy –Thinking Aloud Exercise
Testing of Raw Materials, In process and Finished Product +
Customer Satisfaction And Customer Feedback Handling +
Product Development and Quality Up gradation + Solving
Environmental Issues.
Analytical Solutions for the above areas using both
Instrumental Techniques + Analytical Wet Chemistry
Could be provided as a team efforts involving GCPC + giz +
VWEMCL /COE + Paper Customer + Chemical , Auxiliary and
Colour Manufacturers + Concerned Experts
Page 21
Your logo
Requirement of Policy –Thinking Aloud Exercise
Getting a branch of IIP( Indian Institute of Packaging , Mumbai ) to COE – UN Number Related Activities
Testing, Analytical & Product Development services for the paper industry including Packaging Testing Facility + Product Application Laboratory for Pulp and Paper Industry
Page 22
Your logo
THANK YOU
1
Page 1Presented by : Nitesh Patel GIZ-IGEP, Gandhinagar
“Best Available Techniques Reference Document for Pulp & Paper Sector”
February 27, 2013
Page 2Presented by : Nitesh Patel GIZ-IGEP, Gandhinagar
1. The definition and thedetermination of BAT
Page 3Presented by : Nitesh Patel GIZ-IGEP, Gandhinagar
Definition of BAT according to Art. 3 para. 10 IED
Best = most effective with respect to the prevention and –where that is not practicable – the reduction of emissionsand the impact on the environment as a whole
Available = developed on a scale which allows implementation inthe relevant industrial sector, under economically andtechnically viable conditions,taking into consideration the costs and advantages,whether or not it is used in the respective Member State
Technique = includes both the technology used and the way inwhich the installation is designed, built, maintained,operated and decommissioned
Page 4Presented by : Nitesh Patel GIZ-IGEP, Gandhinagar
What is BAT for a particular industrial sector?
BAT for a particular industrial sector is identified by an information exchangeprocess for each sector between
• EU Member States
• Industry concerned
• Environmental NGOs
• EU Commission
BAT Reference Documents for the sector (BREF)
Outcome of the
information
exchange
process
BAT conclusions
Page 5Presented by : Nitesh Patel GIZ-IGEP, Gandhinagar
2. The content of BAT Reference Documents
Page 6Presented by : Nitesh Patel GIZ-IGEP, Gandhinagar
The content of BREFsGeneral outline of the BREFs:
Preface, Scope
1. General information about the sector concerned
2. Applied processes and techniques
3. Current emission and consumption levels
4. Techniques to consider in the determination of BAT
5. Best available techniques (BAT) conclusions
6. Emerging techniques
7. Concluding remarks and recommendations for future work
References, Glossary of terms and abbreviations
Annexes (dependent upon relevance and availability of information)
2
Page 7Presented by : Nitesh Patel GIZ-IGEP, Gandhinagar12.03.2013
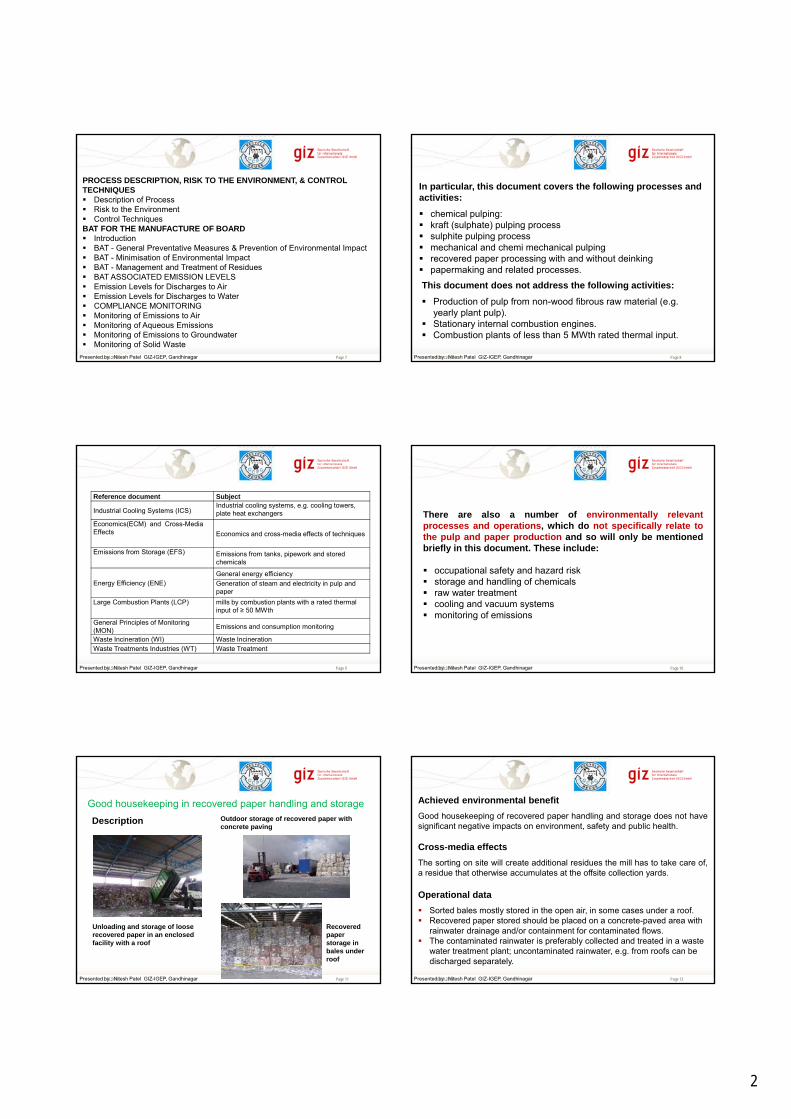
PROCESS DESCRIPTION, RISK TO THE ENVIRONMENT, & CONTROL TECHNIQUES Description of Process Risk to the Environment Control TechniquesBAT FOR THE MANUFACTURE OF BOARD Introduction BAT - General Preventative Measures & Prevention of Environmental Impact BAT - Minimisation of Environmental Impact BAT - Management and Treatment of Residues BAT ASSOCIATED EMISSION LEVELS Emission Levels for Discharges to Air Emission Levels for Discharges to Water COMPLIANCE MONITORING Monitoring of Emissions to Air Monitoring of Aqueous Emissions Monitoring of Emissions to Groundwater Monitoring of Solid Waste
Page 8Presented by : Nitesh Patel GIZ-IGEP, Gandhinagar12.03.2013
In particular, this document covers the following processes and activities:
chemical pulping: kraft (sulphate) pulping process sulphite pulping process mechanical and chemi mechanical pulping recovered paper processing with and without deinking papermaking and related processes.
This document does not address the following activities:
Production of pulp from non-wood fibrous raw material (e.g. yearly plant pulp).
Stationary internal combustion engines. Combustion plants of less than 5 MWth rated thermal input.
Page 9Presented by : Nitesh Patel GIZ-IGEP, Gandhinagar12.03.2013
Reference document Subject
Industrial Cooling Systems (ICS) Industrial cooling systems, e.g. cooling towers, plate heat exchangers
Economics(ECM) and Cross-Media Effects Economics and cross-media effects of techniques
Emissions from Storage (EFS) Emissions from tanks, pipework and stored chemicals
Energy Efficiency (ENE)General energy efficiency
Generation of steam and electricity in pulp and paper
Large Combustion Plants (LCP) mills by combustion plants with a rated thermal input of ≥ 50 MWth
General Principles of Monitoring (MON)
Emissions and consumption monitoring
Waste Incineration (WI) Waste Incineration Waste Treatments Industries (WT) Waste Treatment
Page 10Presented by : Nitesh Patel GIZ-IGEP, Gandhinagar12.03.2013
There are also a number of environmentally relevantprocesses and operations, which do not specifically relate tothe pulp and paper production and so will only be mentionedbriefly in this document. These include:
occupational safety and hazard risk storage and handling of chemicals raw water treatment cooling and vacuum systems monitoring of emissions
Page 11Presented by : Nitesh Patel GIZ-IGEP, Gandhinagar12.03.2013
Good housekeeping in recovered paper handling and storage
Description
Unloading and storage of loose recovered paper in an enclosed facility with a roof
Outdoor storage of recovered paper with concrete paving
Recovered paper storage in bales under roof
Page 12Presented by : Nitesh Patel GIZ-IGEP, Gandhinagar12.03.2013
Achieved environmental benefit
Good housekeeping of recovered paper handling and storage does not havesignificant negative impacts on environment, safety and public health.
Cross-media effects
The sorting on site will create additional residues the mill has to take care of,a residue that otherwise accumulates at the offsite collection yards.
Operational data
Sorted bales mostly stored in the open air, in some cases under a roof. Recovered paper stored should be placed on a concrete-paved area with
rainwater drainage and/or containment for contaminated flows. The contaminated rainwater is preferably collected and treated in a waste
water treatment plant; uncontaminated rainwater, e.g. from roofs can be discharged separately.
3
Page 13Presented by : Nitesh Patel GIZ-IGEP, Gandhinagar12.03.2013
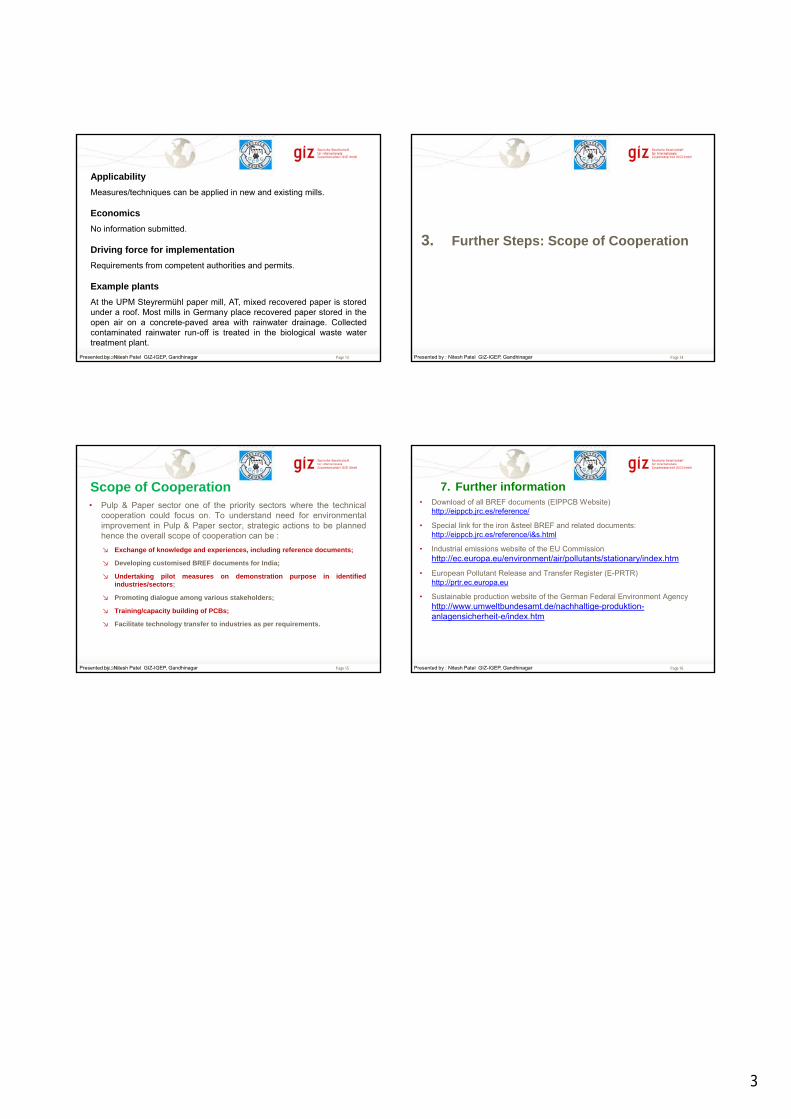
Applicability
Measures/techniques can be applied in new and existing mills.
Economics
No information submitted.
Driving force for implementation
Requirements from competent authorities and permits.
Example plants
At the UPM Steyrermühl paper mill, AT, mixed recovered paper is storedunder a roof. Most mills in Germany place recovered paper stored in theopen air on a concrete-paved area with rainwater drainage. Collectedcontaminated rainwater run-off is treated in the biological waste watertreatment plant.
Page 14Presented by : Nitesh Patel GIZ-IGEP, Gandhinagar
3. Further Steps: Scope of Cooperation
Page 15Presented by : Nitesh Patel GIZ-IGEP, Gandhinagar
• Pulp & Paper sector one of the priority sectors where the technicalcooperation could focus on. To understand need for environmentalimprovement in Pulp & Paper sector, strategic actions to be plannedhence the overall scope of cooperation can be :
↘ Exchange of knowledge and experiences, including reference documents;
↘ Developing customised BREF documents for India;
↘ Undertaking pilot measures on demonstration purpose in identifiedindustries/sectors;
↘ Promoting dialogue among various stakeholders;
↘ Training/capacity building of PCBs;
↘ Facilitate technology transfer to industries as per requirements.
12.03.2013
Scope of Cooperation
Page 16Presented by : Nitesh Patel GIZ-IGEP, Gandhinagar
7. Further information• Download of all BREF documents (EIPPCB Website)
http://eippcb.jrc.es/reference/
• Special link for the iron &steel BREF and related documents:http://eippcb.jrc.es/reference/i&s.html
• Industrial emissions website of the EU Commissionhttp://ec.europa.eu/environment/air/pollutants/stationary/index.htm
• European Pollutant Release and Transfer Register (E-PRTR) http://prtr.ec.europa.eu
• Sustainable production website of the German Federal Environment Agency http://www.umweltbundesamt.de/nachhaltige-produktion-anlagensicherheit-e/index.htm
1
Page 1
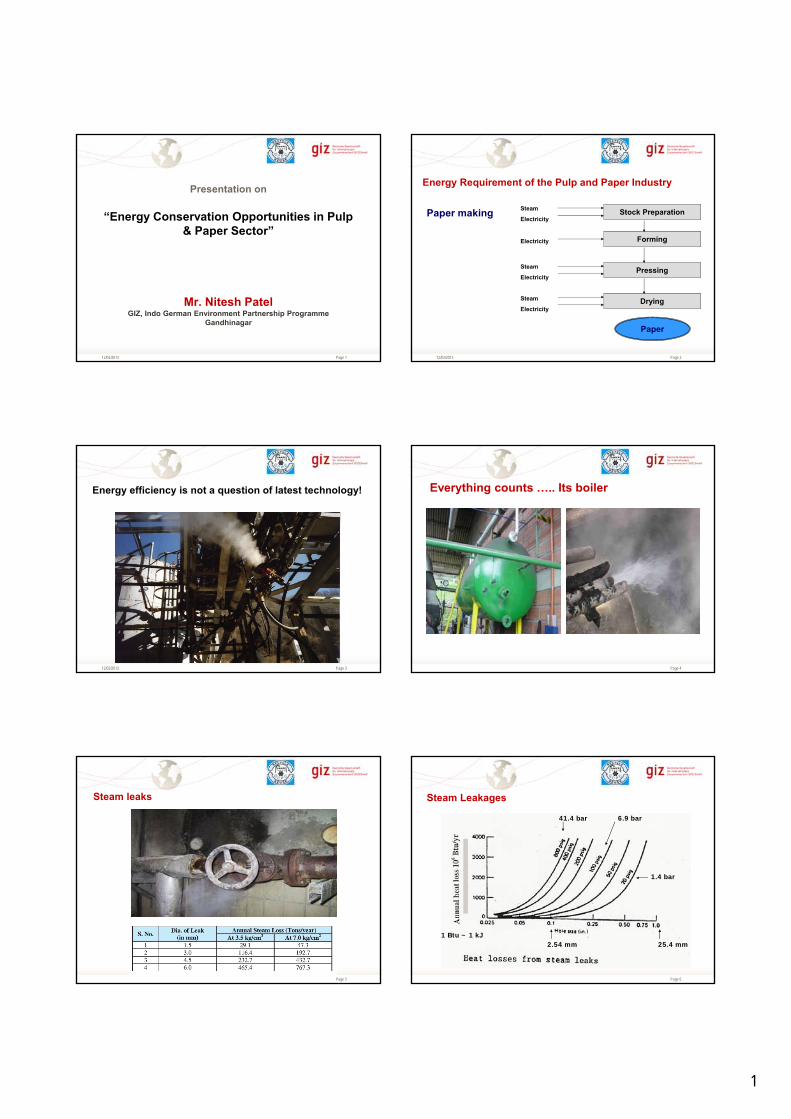
Presentation on
“Energy Conservation Opportunities in Pulp & Paper Sector”
Mr. Nitesh PatelGIZ, Indo German Environment Partnership Programme
Gandhinagar
12/03/2013 Page 212/03/2013
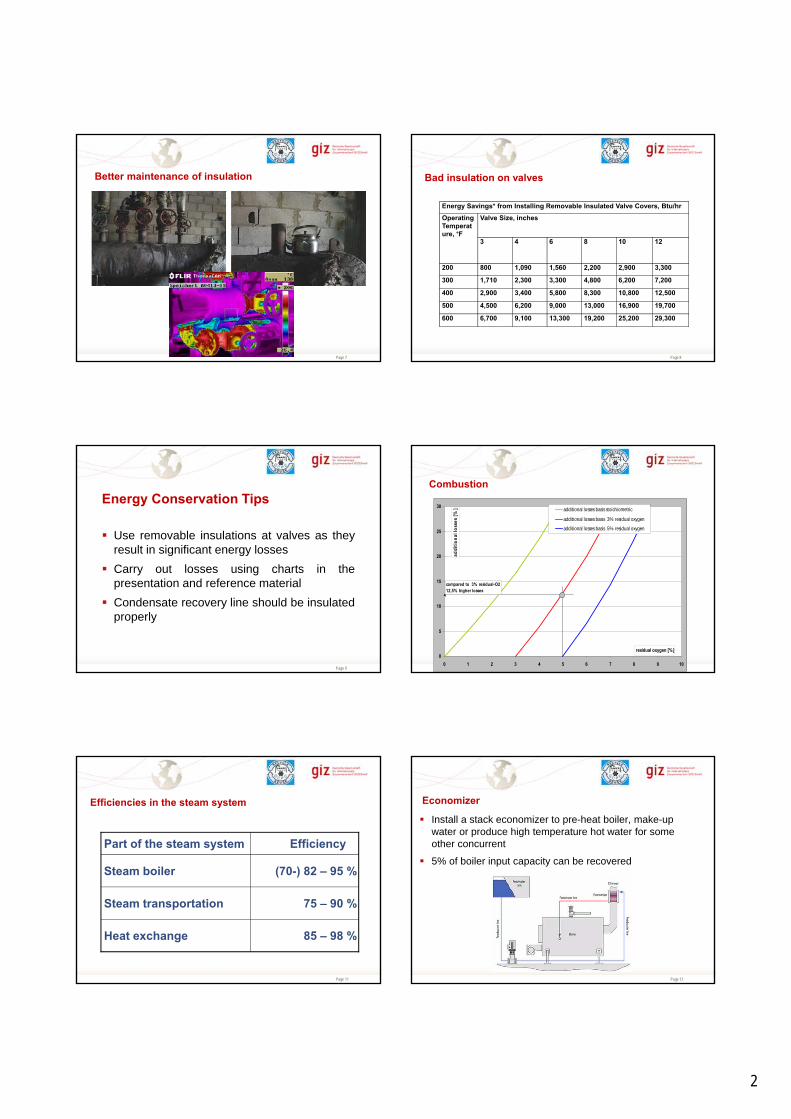
Stock Preparation
Forming
Pressing
Drying
Steam
Electricity
Electricity
Paper making
Steam
Electricity
Steam
Electricity
Paper
Energy Requirement of the Pulp and Paper Industry
Page 312/03/2013
Energy efficiency is not a question of latest technology!
Page 4
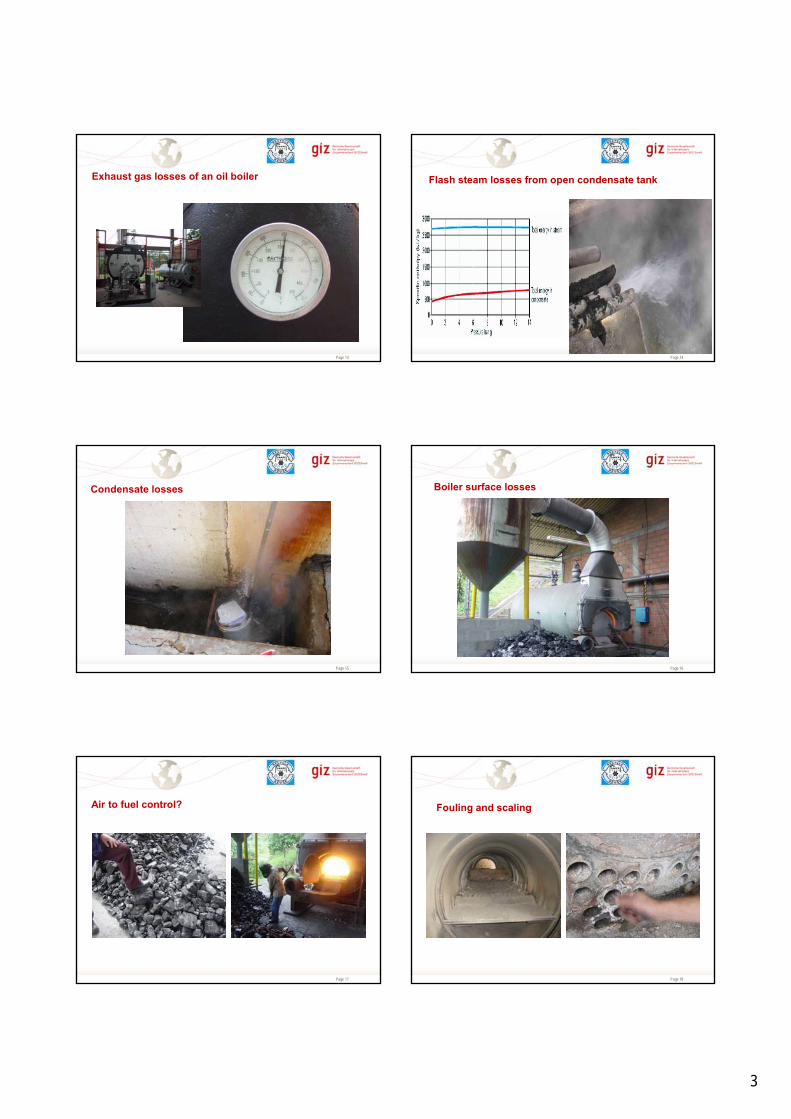
Everything counts ….. Its boiler
Page 5
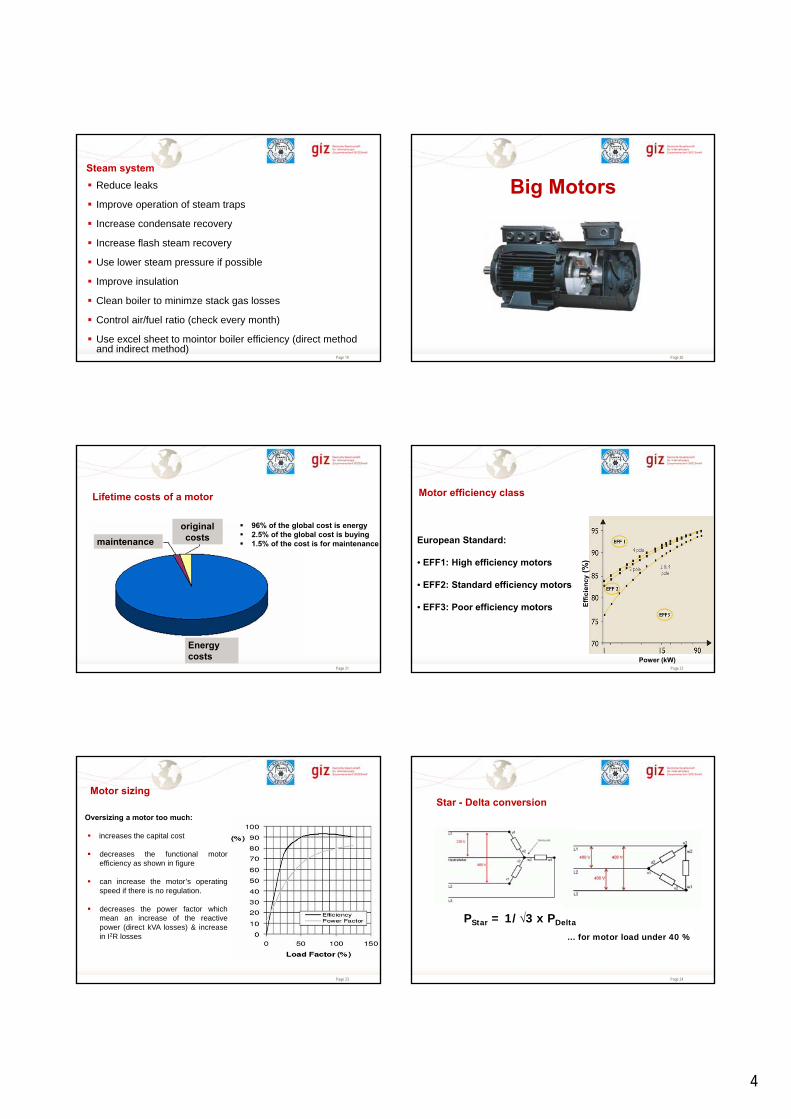
Steam leaks
Page 6
1.4 bar
6.9 bar41.4 bar
25.4 mm2.54 mm1 Btu ~ 1 kJ
Steam Leakages
2
Page 7
Better maintenance of insulation
Page 8
Bad insulation on valves
Energy Savings* from Installing Removable Insulated Valve Covers, Btu/hr
Operating Temperature, °F
Valve Size, inches
3 4 6 8 10 12
200 800 1,090 1,560 2,200 2,900 3,300
300 1,710 2,300 3,300 4,800 6,200 7,200
400 2,900 3,400 5,800 8,300 10,800 12,500
500 4,500 6,200 9,000 13,000 16,900 19,700
600 6,700 9,100 13,300 19,200 25,200 29,300
Page 9
Energy Conservation Tips
Use removable insulations at valves as theyresult in significant energy losses
Carry out losses using charts in thepresentation and reference material
Condensate recovery line should be insulatedproperly
Page 10
Combustion
0
5
10
15
20
25
30
0 1 2 3 4 5 6 7 8 9 10
residual oxygen [%]
add
itio
nal
loss
es [
%] additional losses basis stoichiometric
additional losses basis 3% residual oxygen
additional losses basis 5% residual oxygen
compared to 3% residual-O212,5% higher losses
Page 11
Efficiencies in the steam system
85 – 98 %Heat exchange
75 – 90 %Steam transportation
(70-) 82 – 95 %Steam boiler
EfficiencyPart of the steam system
Page 12
Economizer
Install a stack economizer to pre-heat boiler, make-up water or produce high temperature hot water for some other concurrent
5% of boiler input capacity can be recovered
3
Page 13
Exhaust gas losses of an oil boiler
Page 14
Flash steam losses from open condensate tank
Page 15
Condensate losses
Page 16
Boiler surface losses
Page 17
Air to fuel control?
Page 18
Fouling and scaling
4
Page 19
Steam system
Reduce leaks
Improve operation of steam traps
Increase condensate recovery
Increase flash steam recovery
Use lower steam pressure if possible
Improve insulation
Clean boiler to minimze stack gas losses
Control air/fuel ratio (check every month)
Use excel sheet to mointor boiler efficiency (direct method and indirect method)
Page 20
Big Motors
Page 21
Lifetime costs of a motor
maintenance
original costs
Energy costs
96% of the global cost is energy 2.5% of the global cost is buying 1.5% of the cost is for maintenance
Page 22
Motor efficiency class
European Standard:
• EFF1: High efficiency motors
• EFF2: Standard efficiency motors
• EFF3: Poor efficiency motors
Power (kW)
Eff
icie
ncy
(%)
Page 23
Motor sizing
Oversizing a motor too much:
increases the capital cost
decreases the functional motorefficiency as shown in figure
can increase the motor’s operatingspeed if there is no regulation.
decreases the power factor whichmean an increase of the reactivepower (direct kVA losses) & increasein I2R losses
Page 24
Star - Delta conversion
PStar = 1/√3 x PDelta
… for motor load under 40 %

5
Page 25
Energy saving potential
energy saving measure saving
Energy efficient motors 2 - 8%
Correct dimension 1 - 3%
Motors with adjustable speed drives 10 - 50%
Different gears 2 – 10%
Quality of the power supply 0.5 – 3%
fine tuning, lubrication 1 – 5%
Page 26
Increasing speed
This could lead to a significant change in imposed
load and annual energy consumption. For
example, for a fan and a pump, a small increase in
the motor speed (ex.: 1440 rpm to 1460 rpm, only
1.4%) can result in a 4% increase in the load and
in the energy consumption. …….. In same ways
savings in reverse
Page 27
Pumps
Page 28
Overall cost of a Pump
Page 29
M M
FIC
M
FIC
FC
Flow / Head Control Methods
Page 30
valve
energy saving
FC
delivery head in %
mot
or p
ower
in k
W
Comparision of Flow / Head Control Methods
Page 1
CORE ISSUES IN RECYCLE PAPER INDUSTRIES AND TECHNOLOGICAL
SOLUTION IN VAPI
company presentation 201215/01/2014
By GUIDED By
Gopal H Chaudhari Bharat Jain
Assistant Project Engineer Member Secretary
Gujarat Cleaner Production Centre
Page 2
CONTENTS
company presentation 201215/01/2014
INTRODUCTION
PRESENT SCENARIO IN VAPI PAPER MILL
CORE ISSUES AND FUTURE
INVENTORY OF APPLICATION TECHNOLOGIES FOR WASTE STREAM (SLUDGE, PLASTIC AND REJESTS)
ECO-FRIENDLY EMERGING TECHNIQUES
Page 3
INTRODUCTION
company presentation 201215/01/2014
There are 653 paper mills in India.
Out of 653, As of date, about 550 mills in India use waste paper as primary fibresource for paper, paperboard and newsprint production.
VAPI is the biggest Industrial Estate in Asia Continent.
There are 70 industries in Gujarat and all are recycle paper mill.
In and around VAPI there are as good as 40 Small and Medium scale PAPER & PAPER BOARD Manufacturers.
India’s paper manufacturing capacity is expected to grow at a Compounded Annual Growth Rate (CAGR) of 7.4 percent from 8.4 million MT per annum to 11.2 million MT per annum between 2008 and 2010.
The per capita consumption of India stands at only 9.3 kg as against 42 kg in
China, 22 kg in Indonesia, 25 kg in Malaysia, 247 Kg in Japan and 312 kg in the
US.Page 4
PRESENT SCENARIO 2013
company presentation 201215/01/2014
Raw Material Consumption Pattern
Year % Share
Wood Agro Residue Waste Paper
1970 84 9 7
2000 39 31 30
2012 31 22 47
Page 5
PRESENT SCENARIO 2013
company presentation 201215/01/2014
Comparision of Waste Paper Recovery Rate In India With Developed Countries
01020304050607080
% Recovery of Waste Paper
German
Swedan
Japan
Western Europe
USA
Italy
India
Page 6
PRESENT SCENARIO 2013
company presentation 201215/01/2014
Comparision of Per Capita Consumption of Paper In India With Global
050
100150200250300350400
US
AF
inla
ndB
elgi
um
Jap
an
Ca
na
da
Tai
wan
Sin
gapo
reS
witz
erla
nd
De
nm
ark
Ne
wZ
eal
and
Sw
ed
en
Ho
llan
dU
KG
erm
an
yC
hin
aIn
done
sia
Mal
aysi
aIn
dia
Avg Kg Per Capita Consumption of Paper USAFinlandBelgiumJapanCanadaTaiwanSingaporeSwitzerlandDenmarkNewZealandSwedenHollandUKGermanyChinaIndonesiaMalaysiaIndia
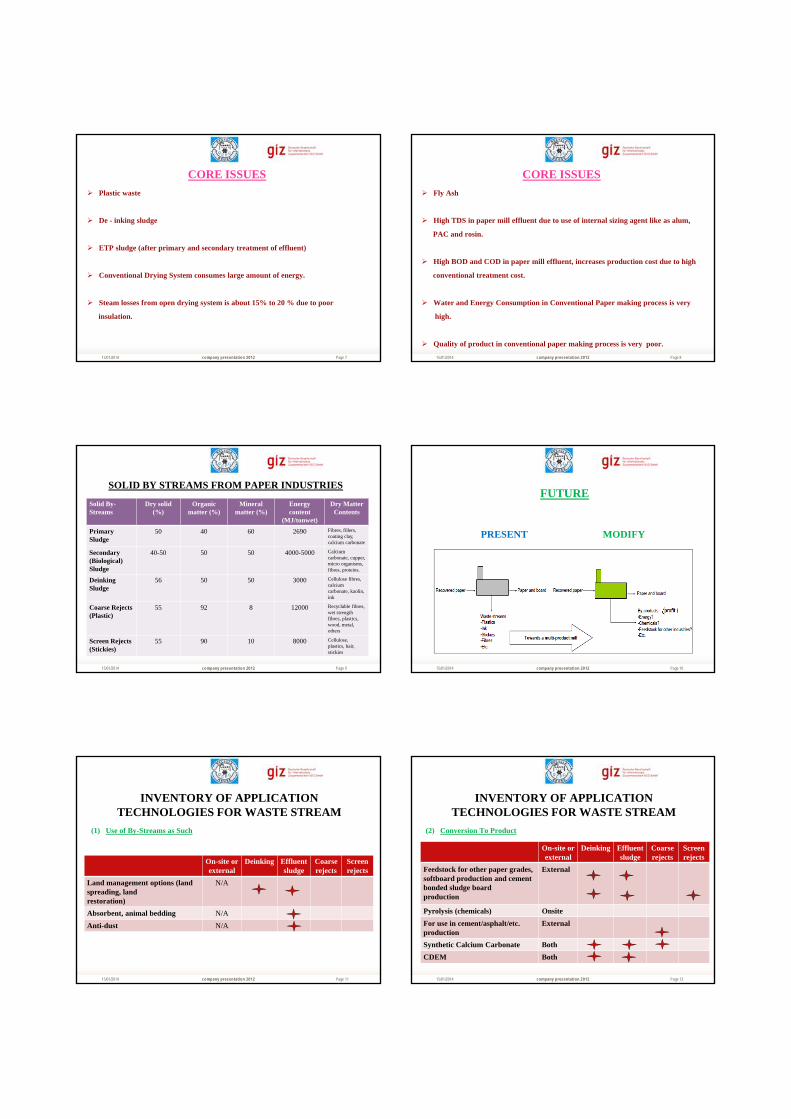
Page 7
CORE ISSUES
company presentation 201215/01/2014
Plastic waste
De - inking sludge
ETP sludge (after primary and secondary treatment of effluent)
Conventional Drying System consumes large amount of energy.
Steam losses from open drying system is about 15% to 20 % due to poor
insulation.
Page 8
CORE ISSUES
company presentation 201215/01/2014
Fly Ash
High TDS in paper mill effluent due to use of internal sizing agent like as alum,
PAC and rosin.
High BOD and COD in paper mill effluent, increases production cost due to high
conventional treatment cost.
Water and Energy Consumption in Conventional Paper making process is very
high.
Quality of product in conventional paper making process is very poor.
Page 9
SOLID BY STREAMS FROM PAPER INDUSTRIES
company presentation 201215/01/2014
Solid By-Streams
Dry solid (%)
Organic matter (%)
Mineral matter (%)
Energy content
(MJ/tonwet)
Dry Matter Contents
Primary Sludge
50 40 60 2690 Fibres, fillers, coating clay, calcium carbonate
Secondary (Biological) Sludge
40-50 50 50 4000-5000 Calcium carbonate, cupper, micro organisms,fibres, proteins.
Deinking Sludge
56 50 50 3000 Cellulose fibres, calcium carbonate, kaolin, ink
Coarse Rejects (Plastic)
55 92 8 12000 Recyclable fibres, wet strength fibres, plastics,wood, metal, others
Screen Rejects (Stickies)
55 90 10 8000 Cellulose, plastics, hair, stickies
Page 10
FUTURE
company presentation 201215/01/2014
PRESENT MODIFY
Page 11
INVENTORY OF APPLICATION TECHNOLOGIES FOR WASTE STREAM
company presentation 201215/01/2014
(1) Use of By-Streams as Such
On-site orexternal
Deinking Effluentsludge
Coarserejects
Screenrejects
Land management options (land spreading, landrestoration)
N/A
Absorbent, animal bedding N/A
Anti-dust N/A
Page 12
INVENTORY OF APPLICATION TECHNOLOGIES FOR WASTE STREAM
company presentation 201215/01/2014
(2) Conversion To Product
On-site orexternal
Deinking Effluentsludge
Coarserejects
Screenrejects
Feedstock for other paper grades, softboard production and cement bonded sludge boardproduction
External
Pyrolysis (chemicals) Onsite
For use in cement/asphalt/etc. production
External
Synthetic Calcium Carbonate Both
CDEM Both
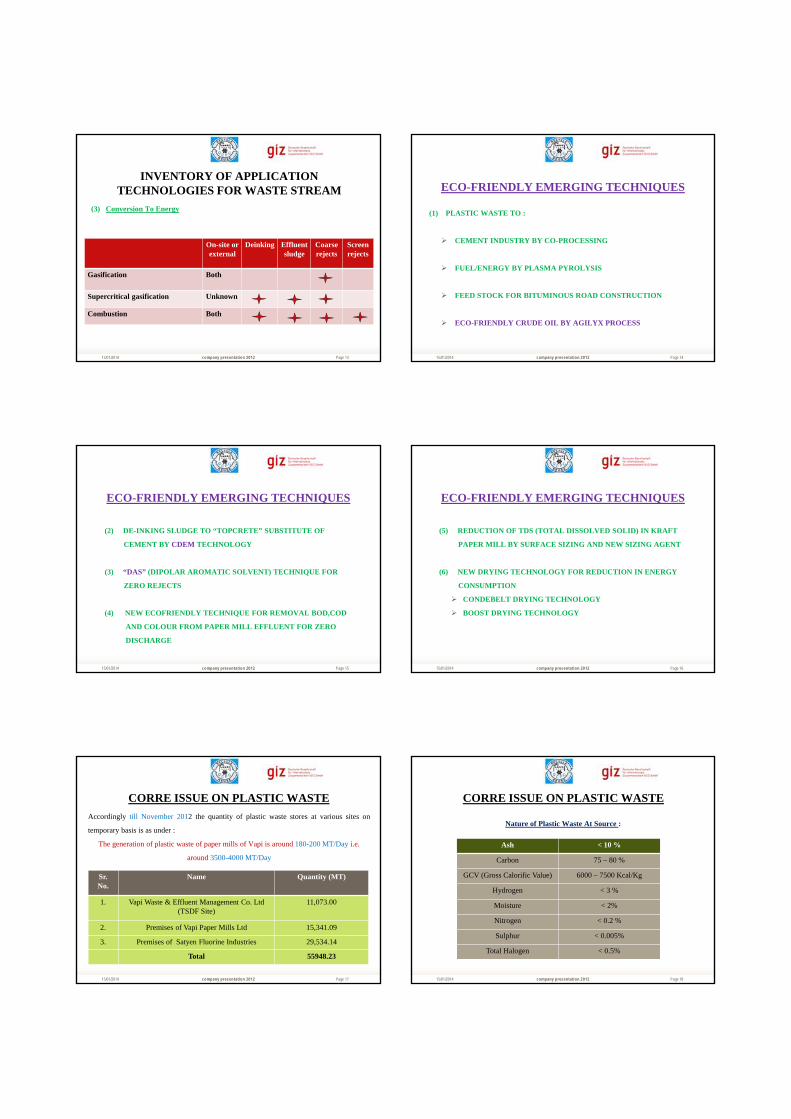
Page 13
INVENTORY OF APPLICATION TECHNOLOGIES FOR WASTE STREAM
company presentation 201215/01/2014
(3) Conversion To Energy
On-site orexternal
Deinking Effluentsludge
Coarserejects
Screenrejects
Gasification Both
Supercritical gasification Unknown
Combustion Both
Page 14
ECO-FRIENDLY EMERGING TECHNIQUES
company presentation 201215/01/2014
(1) PLASTIC WASTE TO :
CEMENT INDUSTRY BY CO-PROCESSING
FUEL/ENERGY BY PLASMA PYROLYSIS
FEED STOCK FOR BITUMINOUS ROAD CONSTRUCTION
ECO-FRIENDLY CRUDE OIL BY AGILYX PROCESS
Page 15
ECO-FRIENDLY EMERGING TECHNIQUES
company presentation 201215/01/2014
(2) DE-INKING SLUDGE TO “TOPCRETE” SUBSTITUTE OF
CEMENT BY CDEM TECHNOLOGY
(3) “DAS” (DIPOLAR AROMATIC SOLVENT) TECHNIQUE FOR
ZERO REJECTS
(4) NEW ECOFRIENDLY TECHNIQUE FOR REMOVAL BOD,COD
AND COLOUR FROM PAPER MILL EFFLUENT FOR ZERO
DISCHARGE
Page 16
ECO-FRIENDLY EMERGING TECHNIQUES
company presentation 201215/01/2014
(5) REDUCTION OF TDS (TOTAL DISSOLVED SOLID) IN KRAFT
PAPER MILL BY SURFACE SIZING AND NEW SIZING AGENT
(6) NEW DRYING TECHNOLOGY FOR REDUCTION IN ENERGY
CONSUMPTION
CONDEBELT DRYING TECHNOLOGY
BOOST DRYING TECHNOLOGY
Page 17
CORRE ISSUE ON PLASTIC WASTE
company presentation 201215/01/2014
Accordingly till November 2012 the quantity of plastic waste stores at various sites on
temporary basis is as under :
The generation of plastic waste of paper mills of Vapi is around 180-200 MT/Day i.e.
around 3500-4000 MT/Day
Sr.No.
Name Quantity (MT)
1. Vapi Waste & Effluent Management Co. Ltd (TSDF Site)
11,073.00
2. Premises of Vapi Paper Mills Ltd 15,341.09
3. Premises of Satyen Fluorine Industries 29,534.14
Total 55948.23
Page 18
CORRE ISSUE ON PLASTIC WASTE
company presentation 201215/01/2014
Nature of Plastic Waste At Source :
Ash < 10 %
Carbon 75 – 80 %
GCV (Gross Calorific Value) 6000 – 7500 Kcal/Kg
Hydrogen < 3 %
Moisture < 2%
Nitrogen < 0.2 %
Sulphur < 0.005%
Total Halogen < 0.5%

Page 19
CO-PROCESSING OF PLASTIC WASTE
company presentation 201215/01/2014
Co-Processing of Plastic Waste has been explored in the following Cement Plants in
Gujarat and other states.
Ambuja Cement Ltd (Gujarat)
Ultratech Cement Ltd., Jafarabad Unit (Gujarat)
Ultratech Cement Ltd., Kovaya Unit (Gujarat)
Sidhee Cement Ltd., Sidheegram (Gujarat)
Lafarge Cements Ltd., Sonadhi Plant (Chhattisgrah)
Lafarge Cements Ltd., Arasmeta Plant (Chhattisgrah)
Vikram Cement Works (Ultratech Cement Ltd), (Madhya Pradesh)
Aditya Cement Works, Unit – 1 (Ultratech Cement Ltd), (Rajasthan)
Page 20
PLASTIC WASTE IN BITUMINOUS ROAD CONSTRUCTION
company presentation 201215/01/2014
Page 21
PLASTIC WASTE TO FUEL/ENERGY BY PLASMA
PYROLYSIS
company presentation 201215/01/2014 Page 22
Plasma Technology
•Pyrolysis – oxygen starved
•Mass-less heat created from plasma torch – heat value of waste is irrelevant to the process
•Uniform, reactor temperatures above 1,500°C (plasma “plume” temperature > 6,000 deg. C); Controlled processing atmosphere
•Lower volume of off gas
•Depending on waste composition treated, PTDR generates 2 to 4 times the thermal energy that it consumes
•No bottom or fly ashes generated
•Production of dioxins or furans is IMPOSSIBLE
•No secondary wastes, Recovers valuable products
•Combustion –excess air required
•Heat value of waste required to maintain combustion reaction or supplementary fossil fuels required
•Operating temperatures around 1,000 °C
•Large volumes of off-gas generated
•“Cold” spots plus excess oxygen inside incineration chamber can result in Dioxins and furans
•Fly and bottom ash treatment and landfill disposal needed
Incineration Technology
Page 23
PLASTIC WASTE TO SYNTHETIC CRUDE OIL
company presentation 201215/01/2014
“An Environmentally Responsible, Anaerobic Thermal Reclamation Process”
Page 24
PLASTIC WASTE TO SYNTHETIC CRUDE OIL
company presentation 201215/01/2014
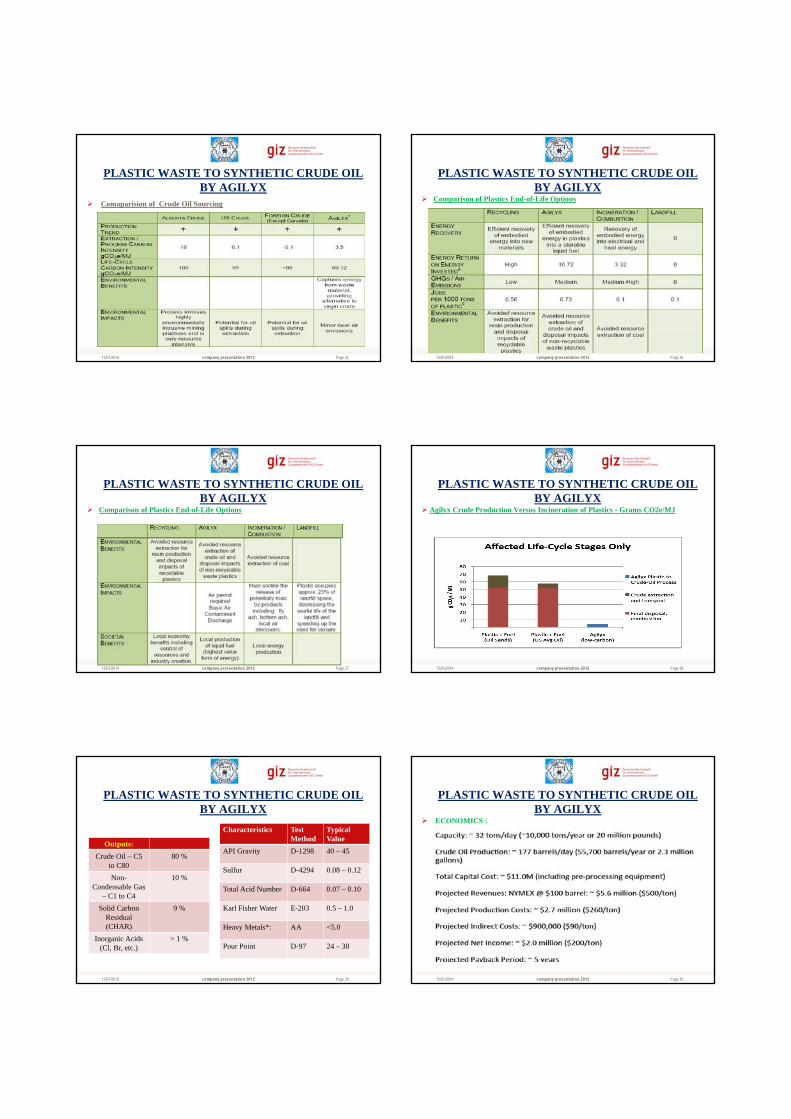
Page 25
PLASTIC WASTE TO SYNTHETIC CRUDE OILBY AGILYX
company presentation 201215/01/2014
Comaparision of Crude Oil Sourcing
Page 26
PLASTIC WASTE TO SYNTHETIC CRUDE OILBY AGILYX
company presentation 201215/01/2014
Comparison of Plastics End-of-Life Options
Page 27
PLASTIC WASTE TO SYNTHETIC CRUDE OILBY AGILYX
company presentation 201215/01/2014
Comparison of Plastics End-of-Life Options
Page 28
PLASTIC WASTE TO SYNTHETIC CRUDE OILBY AGILYX
company presentation 201215/01/2014
Agilyx Crude Production Versus Incineration of Plastics - Grams CO2e/MJ
Page 29
PLASTIC WASTE TO SYNTHETIC CRUDE OILBY AGILYX
company presentation 201215/01/2014
Outputs:
Crude Oil – C5 to C80
80 %
Non-Condensable Gas
– C1 to C4
10 %
Solid Carbon Residual (CHAR)
9 %
Inorganic Acids (Cl, Br, etc.)
> 1 %
Characteristics Test Method
Typical Value
API Gravity D-1298 40 – 45
Sulfur D-4294 0.08 – 0.12
Total Acid Number D-664 0.07 – 0.10
Karl Fisher Water E-203 0.5 – 1.0
Heavy Metals*: AA <5.0
Pour Point D-97 24 – 30
Page 30
PLASTIC WASTE TO SYNTHETIC CRUDE OILBY AGILYX
company presentation 201215/01/2014
ECONOMICS :
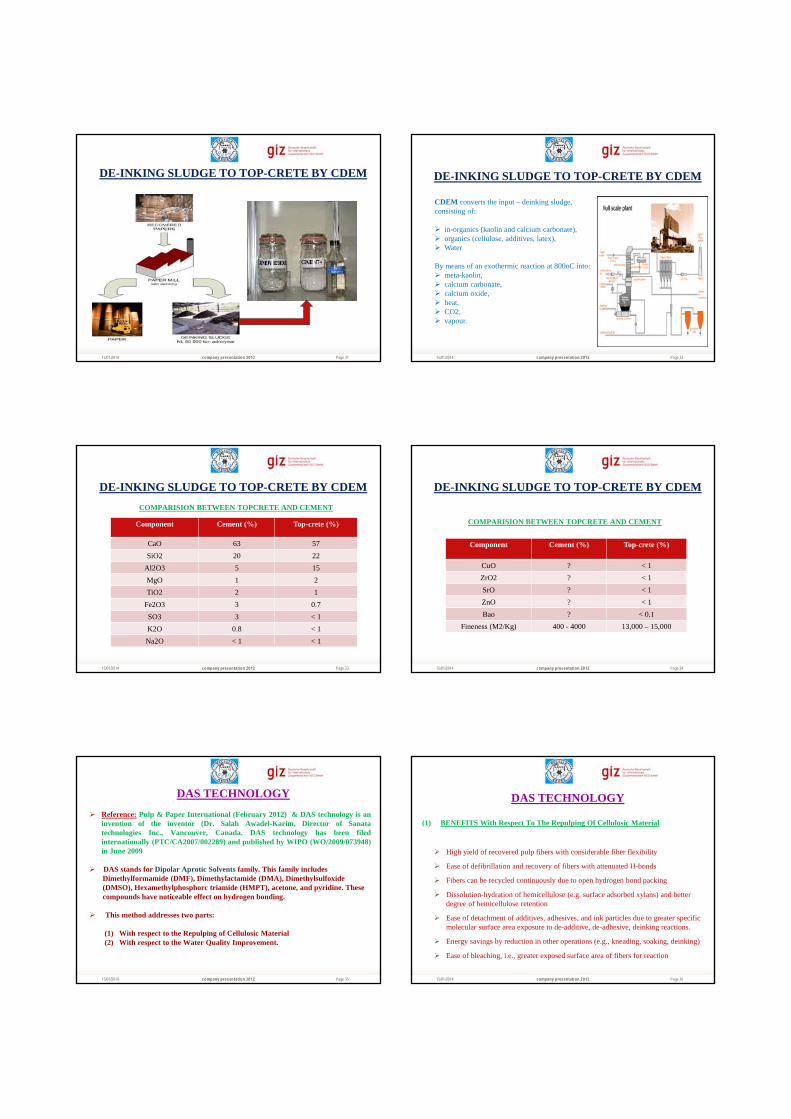
Page 31
DE-INKING SLUDGE TO TOP-CRETE BY CDEM
company presentation 201215/01/2014 Page 32
DE-INKING SLUDGE TO TOP-CRETE BY CDEM
company presentation 201215/01/2014
CDEM converts the input – deinking sludge,consisting of:
in-organics (kaolin and calcium carbonate), organics (cellulose, additives, latex), Water
By means of an exothermic reaction at 800oC into: meta-kaolin, calcium carbonate, calcium oxide, heat, CO2, vapour.
Page 33
DE-INKING SLUDGE TO TOP-CRETE BY CDEM
company presentation 201215/01/2014
COMPARISION BETWEEN TOPCRETE AND CEMENT
Component Cement (%) Top-crete (%)
CaO 63 57
SiO2 20 22
Al2O3 5 15
MgO 1 2
TiO2 2 1
Fe2O3 3 0.7
SO3 3 < 1
K2O 0.8 < 1
Na2O < 1 < 1
Page 34
DE-INKING SLUDGE TO TOP-CRETE BY CDEM
company presentation 201215/01/2014
COMPARISION BETWEEN TOPCRETE AND CEMENT
Component Cement (%) Top-crete (%)
CuO ? < 1
ZrO2 ? < 1
SrO ? < 1
ZnO ? < 1
Bao ? < 0.1
Fineness (M2/Kg) 400 - 4000 13,000 – 15,000
Page 35
DAS TECHNOLOGY
company presentation 201215/01/2014
Reference: Pulp & Paper International (February 2012) & DAS technology is aninvention of the inventor (Dr. Salah Awadel-Karim, Director of Sanatatechnologies Inc., Vancouver, Canada. DAS technology has been filedinternationally (PTC/CA2007/002289) and published by WIPO (WO/2009/073948)in June 2009
DAS stands for Dipolar Aprotic Solvents family. This family includesDimethylformamide (DMF), Dimethylactamide (DMA), Dimethylsulfoxide(DMSO), Hexamethylphosphorc triamide (HMPT), acetone, and pyridine. Thesecompounds have noticeable effect on hydrogen bonding.
This method addresses two parts:
(1) With respect to the Repulping of Cellulosic Material (2) With respect to the Water Quality Improvement.
Page 36
DAS TECHNOLOGY
company presentation 201215/01/2014
(1) BENEFITS With Respect To The Repulping Of Cellulosic Material
High yield of recovered pulp fibers with considerable fiber flexibility
Ease of defibrillation and recovery of fibers with attenuated H-bonds
Fibers can be recycled continuously due to open hydrogen bond packing
Dissolution-hydration of hemicellulose (e.g. surface adsorbed xylans) and better degree of hemicellulose retention
Ease of detachment of additives, adhesives, and ink particles due to greater specific molecular surface area exposure to de-additive, de-adhesive, deinking reactions.
Energy savings by reduction in other operations (e.g., kneading, soaking, deinking)
Ease of bleaching, i.e., greater exposed surface area of fibers for reaction
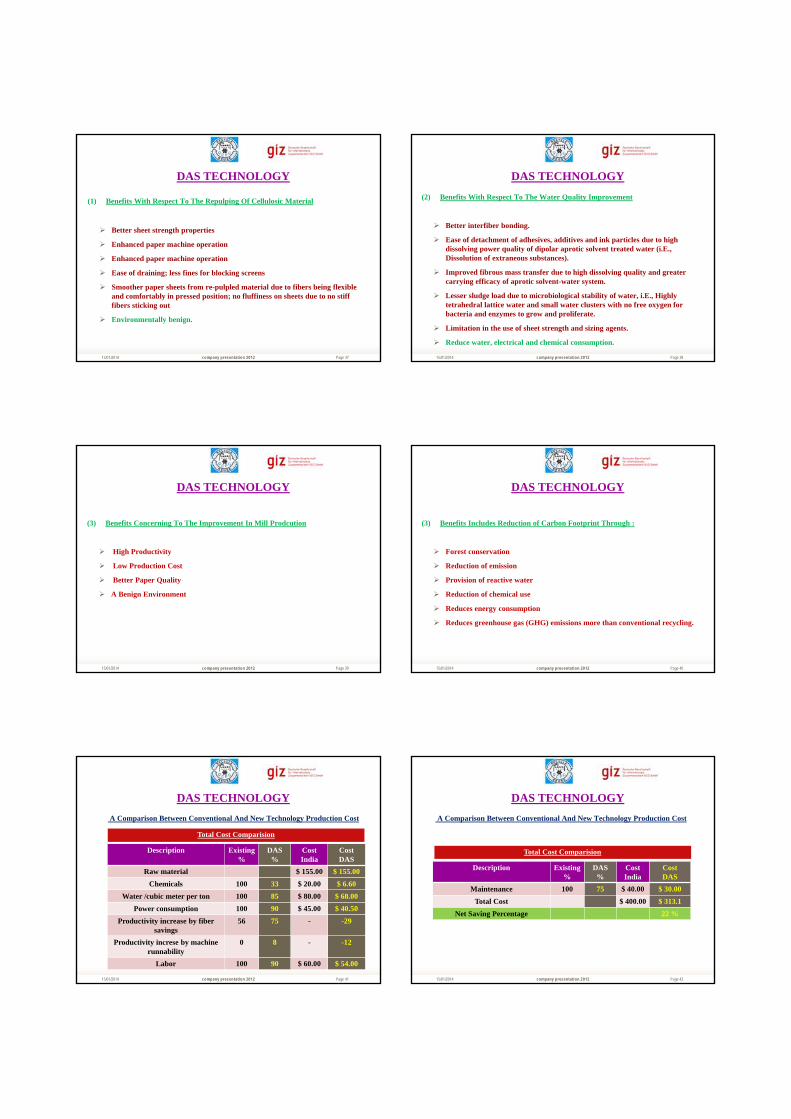
Page 37
DAS TECHNOLOGY
company presentation 201215/01/2014
(1) Benefits With Respect To The Repulping Of Cellulosic Material
Better sheet strength properties
Enhanced paper machine operation
Enhanced paper machine operation
Ease of draining; less fines for blocking screens
Smoother paper sheets from re-pulpled material due to fibers being flexible and comfortably in pressed position; no fluffiness on sheets due to no stiff fibers sticking out
Environmentally benign.
Page 38
DAS TECHNOLOGY
company presentation 201215/01/2014
(2) Benefits With Respect To The Water Quality Improvement
Better interfiber bonding.
Ease of detachment of adhesives, additives and ink particles due to high dissolving power quality of dipolar aprotic solvent treated water (i.E., Dissolution of extraneous substances).
Improved fibrous mass transfer due to high dissolving quality and greater carrying efficacy of aprotic solvent-water system.
Lesser sludge load due to microbiological stability of water, i.E., Highly tetrahedral lattice water and small water clusters with no free oxygen for bacteria and enzymes to grow and proliferate.
Limitation in the use of sheet strength and sizing agents.
Reduce water, electrical and chemical consumption.
Page 39
DAS TECHNOLOGY
company presentation 201215/01/2014
(3) Benefits Concerning To The Improvement In Mill Prodcution
High Productivity
Low Production Cost
Better Paper Quality
A Benign Environment
Page 40
DAS TECHNOLOGY
company presentation 201215/01/2014
(3) Benefits Includes Reduction of Carbon Footprint Through :
Forest conservation
Reduction of emission
Provision of reactive water
Reduction of chemical use
Reduces energy consumption
Reduces greenhouse gas (GHG) emissions more than conventional recycling.
Page 41
DAS TECHNOLOGY
company presentation 201215/01/2014
A Comparison Between Conventional And New Technology Production Cost
Description Existing %
DAS%
Cost India
CostDAS
Raw material $ 155.00 $ 155.00
Chemicals 100 33 $ 20.00 $ 6.60
Water /cubic meter per ton 100 85 $ 80.00 $ 68.00
Power consumption 100 90 $ 45.00 $ 40.50
Productivity increase by fiber savings
56 75 - -29
Productivity increse by machine runnability
0 8 - -12
Labor 100 90 $ 60.00 $ 54.00
Total Cost Comparision
Page 42
DAS TECHNOLOGY
company presentation 201215/01/2014
A Comparison Between Conventional And New Technology Production Cost
Description Existing %
DAS%
Cost India
CostDAS
Maintenance 100 75 $ 40.00 $ 30.00
Total Cost $ 400.00 $ 313.1
Net Saving Percentage 22 %
Total Cost Comparision
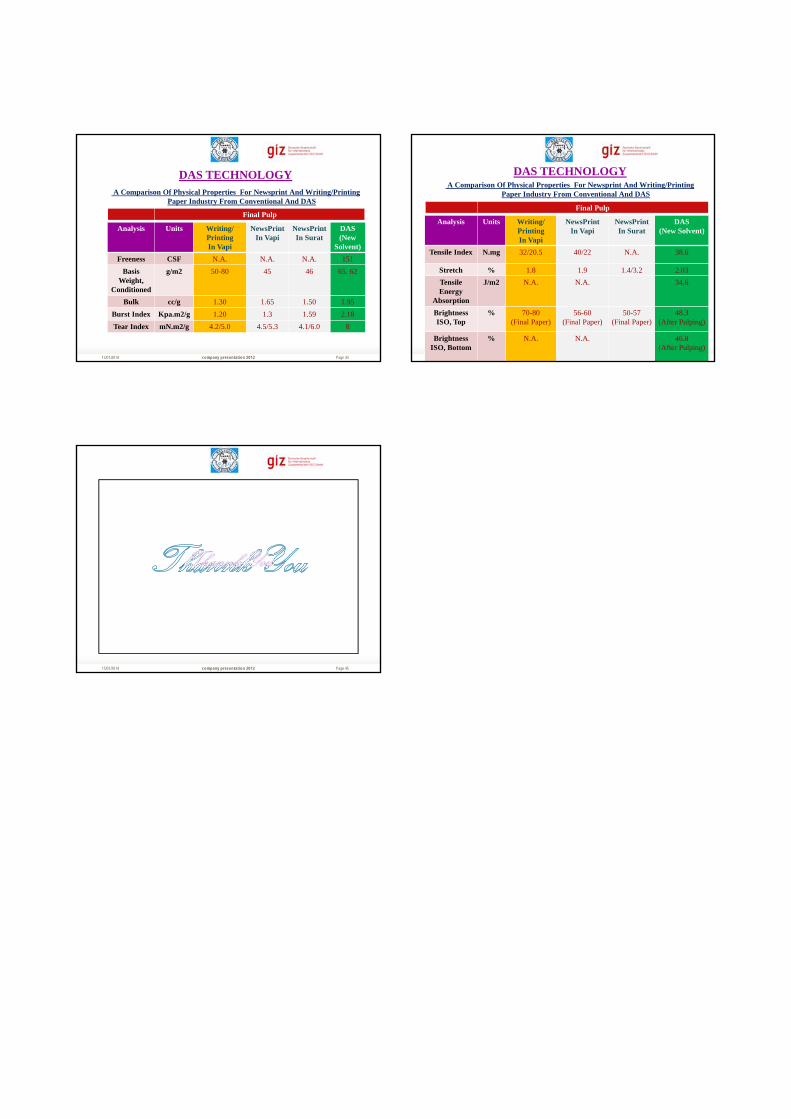
Page 43
DAS TECHNOLOGY
company presentation 201215/01/2014
A Comparison Of Physical Properties For Newsprint And Writing/Printing Paper Industry From Conventional And DAS
Analysis Units Writing/PrintingIn Vapi
NewsPrintIn Vapi
NewsPrintIn Surat
DAS(New
Solvent)
Freeness CSF N.A. N.A. N.A. 151
Basis Weight,
Conditioned
g/m2 50-80 45 46 65. 62
Bulk cc/g 1.30 1.65 1.50 1.95
Burst Index Kpa.m2/g 1.20 1.3 1.59 2.18
Tear Index mN.m2/g 4.2/5.0 4.5/5.3 4.1/6.0 8
Final Pulp
Page 44
DAS TECHNOLOGY
company presentation 201215/01/2014
A Comparison Of Physical Properties For Newsprint And Writing/Printing Paper Industry From Conventional And DAS
Analysis Units Writing/PrintingIn Vapi
NewsPrintIn Vapi
NewsPrintIn Surat
DAS(New Solvent)
Tensile Index N.mg 32/20.5 40/22 N.A. 38.6
Stretch % 1.8 1.9 1.4/3.2 2.03
Tensile Energy
Absorption
J/m2 N.A. N.A. 34.6
Brightness ISO, Top
% 70-80(Final Paper)
56-60(Final Paper)
50-57(Final Paper)
48.3 (After Pulping)
Brightness ISO, Bottom
% N.A. N.A. 46.8(After Pulping)
Final Pulp
Page 45company presentation 201215/01/2014
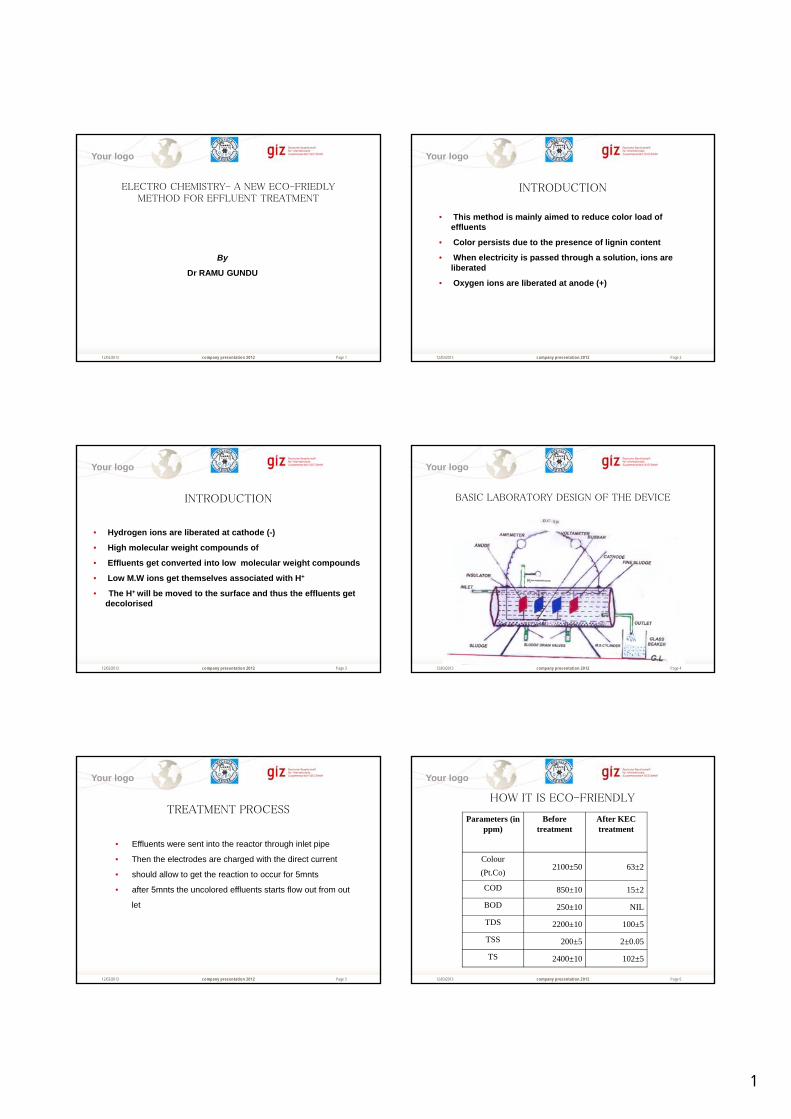
1
Page 1
Your logo
ELECTRO CHEMISTRY- A NEW ECO-FRIEDLY METHOD FOR EFFLUENT TREATMENT
company presentation 201212/03/2013
By
Dr RAMU GUNDU
Page 2
Your logo
INTRODUCTION
company presentation 201212/03/2013
• This method is mainly aimed to reduce color load of effluents
• Color persists due to the presence of lignin content
• When electricity is passed through a solution, ions are liberated
• Oxygen ions are liberated at anode (+)
Page 3
Your logo
INTRODUCTION
company presentation 201212/03/2013
• Hydrogen ions are liberated at cathode (-)
• High molecular weight compounds of
• Effluents get converted into low molecular weight compounds
• Low M.W ions get themselves associated with H+
• The H+ will be moved to the surface and thus the effluents get decolorised
Page 4
Your logo
BASIC LABORATORY DESIGN OF THE DEVICE
company presentation 201212/03/2013
Page 5
Your logo
TREATMENT PROCESS
company presentation 201212/03/2013
• Effluents were sent into the reactor through inlet pipe
• Then the electrodes are charged with the direct current
• should allow to get the reaction to occur for 5mnts
• after 5mnts the uncolored effluents starts flow out from out
let
Page 6
Your logo
HOW IT IS ECO-FRIENDLY
company presentation 201212/03/2013
Parameters (in ppm)
Before treatment
After KEC treatment
Colour
(Pt.Co)2100±50 63±2
COD 850±10 15±2
BOD 250±10 NIL
TDS 2200±10 100±5
TSS 200±5 2±0.05
TS 2400±10 102±5
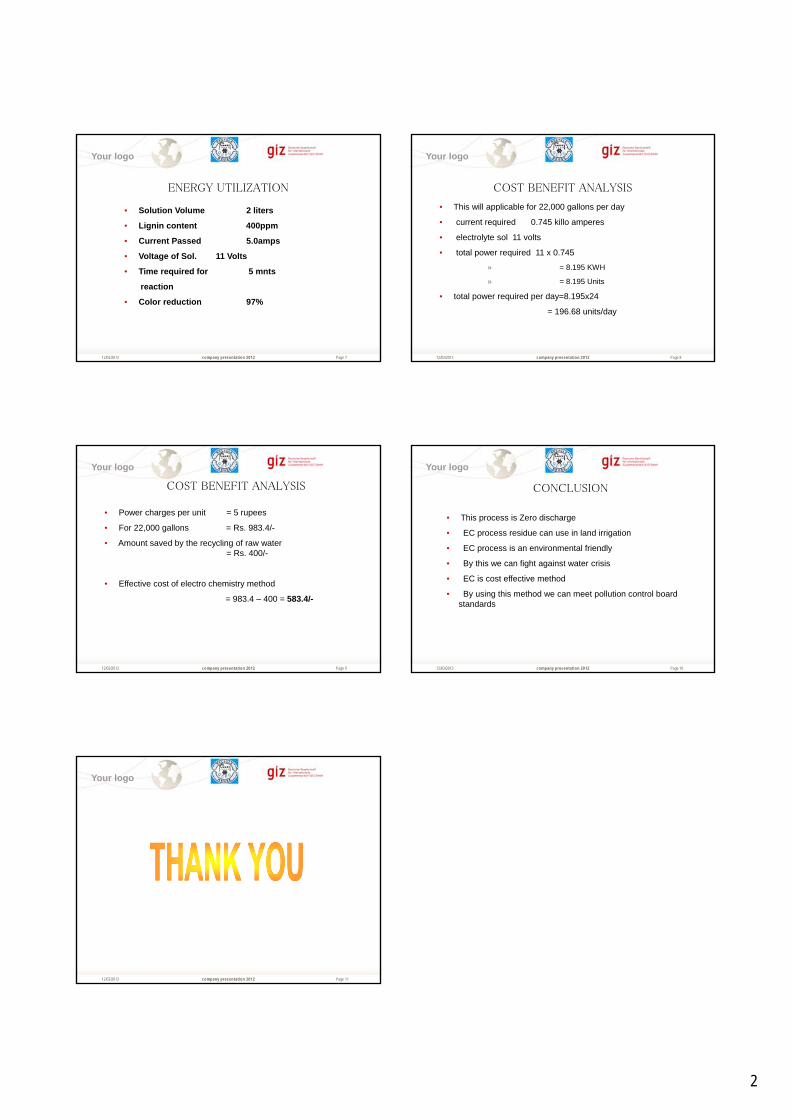
2
Page 7
Your logo
ENERGY UTILIZATION
company presentation 201212/03/2013
• Solution Volume 2 liters
• Lignin content 400ppm
• Current Passed 5.0amps
• Voltage of Sol. 11 Volts
• Time required for 5 mnts
reaction
• Color reduction 97%
Page 8
Your logo
COST BENEFIT ANALYSIS
company presentation 201212/03/2013
• This will applicable for 22,000 gallons per day
• current required 0.745 killo amperes
• electrolyte sol 11 volts
• total power required 11 x 0.745
» = 8.195 KWH
» = 8.195 Units
• total power required per day=8.195x24
= 196.68 units/day
Page 9
Your logo
company presentation 201212/03/2013
COST BENEFIT ANALYSIS
• Power charges per unit = 5 rupees
• For 22,000 gallons = Rs. 983.4/-
• Amount saved by the recycling of raw water= Rs. 400/-
• Effective cost of electro chemistry method
= 983.4 – 400 = 583.4/-
Page 10
Your logo
company presentation 201212/03/2013
CONCLUSION
• This process is Zero discharge
• EC process residue can use in land irrigation
• EC process is an environmental friendly
• By this we can fight against water crisis
• EC is cost effective method
• By using this method we can meet pollution control board standards
Page 11
Your logo
company presentation 201212/03/2013
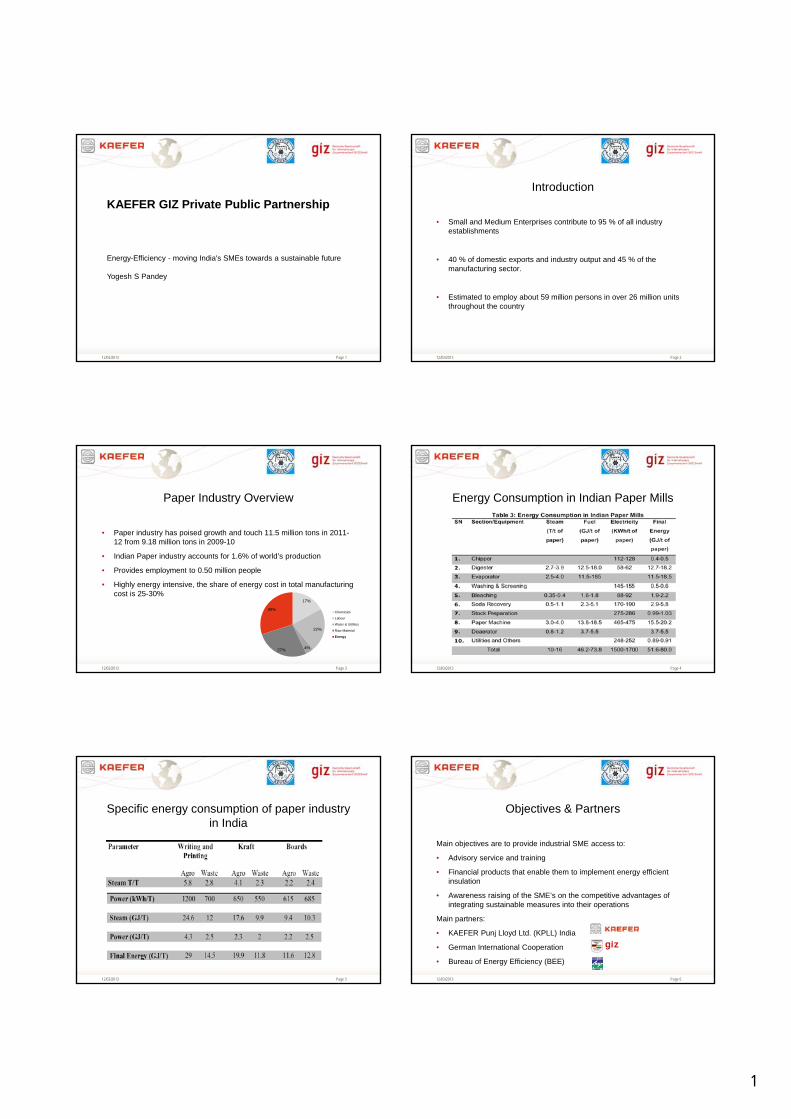
1
Page 112/03/2013
KAEFER GIZ Private Public Partnership
Energy-Efficiency - moving India's SMEs towards a sustainable future
Yogesh S Pandey
Page 2
Introduction
12/03/2013
• Small and Medium Enterprises contribute to 95 % of all industry establishments
• 40 % of domestic exports and industry output and 45 % of the manufacturing sector.
• Estimated to employ about 59 million persons in over 26 million units throughout the country
Page 3
Paper Industry Overview
12/03/2013
• Paper industry has poised growth and touch 11.5 million tons in 2011-12 from 9.18 million tons in 2009-10
• Indian Paper industry accounts for 1.6% of world’s production
• Provides employment to 0.50 million people
• Highly energy intensive, the share of energy cost in total manufacturing cost is 25-30%
17%
22%
4%27%
30%Chemicals
Labour
Water & Utilities
Raw Material
Energy
Page 4
Energy Consumption in Indian Paper Mills
12/03/2013
Page 5
Specific energy consumption of paper industry in India
12/03/2013 Page 6
Objectives & Partners
12/03/2013
Main objectives are to provide industrial SME access to:
• Advisory service and training
• Financial products that enable them to implement energy efficient insulation
• Awareness raising of the SME’s on the competitive advantages of integrating sustainable measures into their operations
Main partners:
• KAEFER Punj Lloyd Ltd. (KPLL) India
• German International Cooperation
• Bureau of Energy Efficiency (BEE)
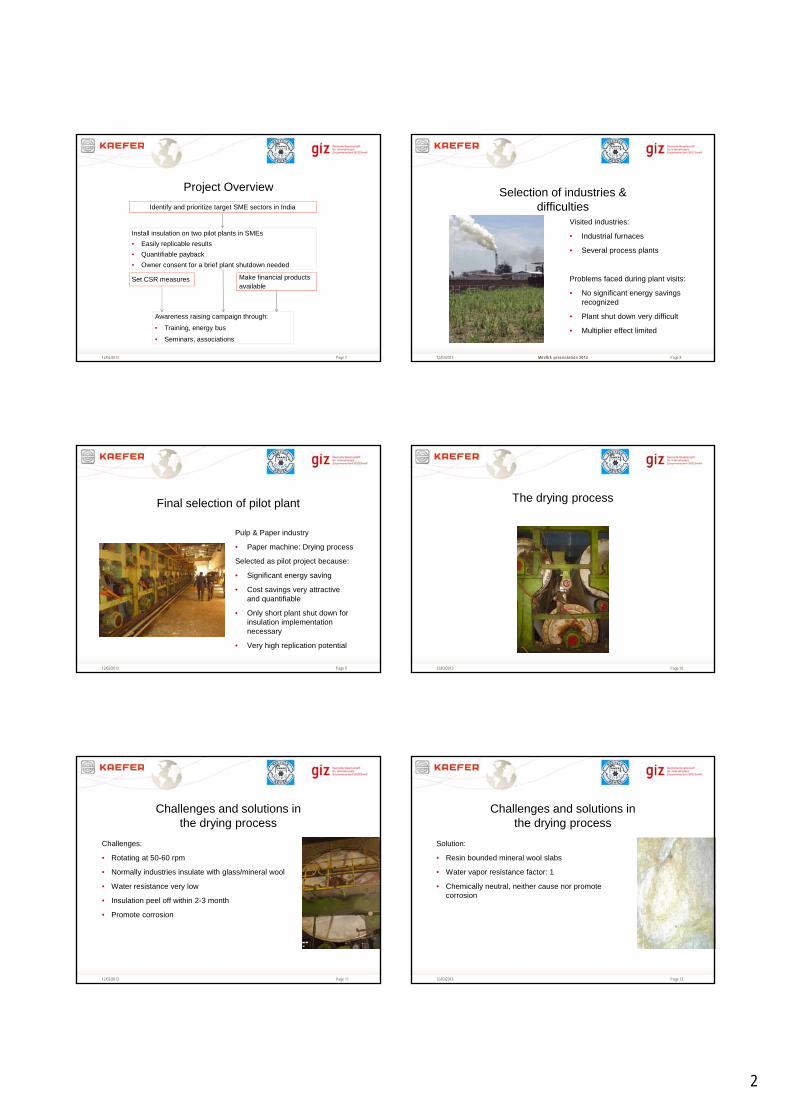
2
Page 7
Project Overview
12/03/2013
Identify and prioritize target SME sectors in India
Install insulation on two pilot plants in SMEs
• Easily replicable results
• Quantifiable payback
• Owner consent for a brief plant shutdown needed
Set CSR measures
Awareness raising campaign through:
• Training, energy bus
• Seminars, associations
Make financial products available
Page 8
Selection of industries & difficulties
MovIEE presentation 201212/03/2013
Visited industries:
• Industrial furnaces
• Several process plants
Problems faced during plant visits:
• No significant energy savings recognized
• Plant shut down very difficult
• Multiplier effect limited
Page 9
Final selection of pilot plant
12/03/2013
Pulp & Paper industry
• Paper machine: Drying process
Selected as pilot project because:
• Significant energy saving
• Cost savings very attractive and quantifiable
• Only short plant shut down for insulation implementation necessary
• Very high replication potential
Page 10
The drying process
12/03/2013
Page 11
Challenges and solutions in the drying process
12/03/2013
Challenges:
• Rotating at 50-60 rpm
• Normally industries insulate with glass/mineral wool
• Water resistance very low
• Insulation peel off within 2-3 month
• Promote corrosion
Page 12
Challenges and solutions in the drying process
12/03/2013
Solution:
• Resin bounded mineral wool slabs
• Water vapor resistance factor: 1
• Chemically neutral, neither cause nor promote corrosion
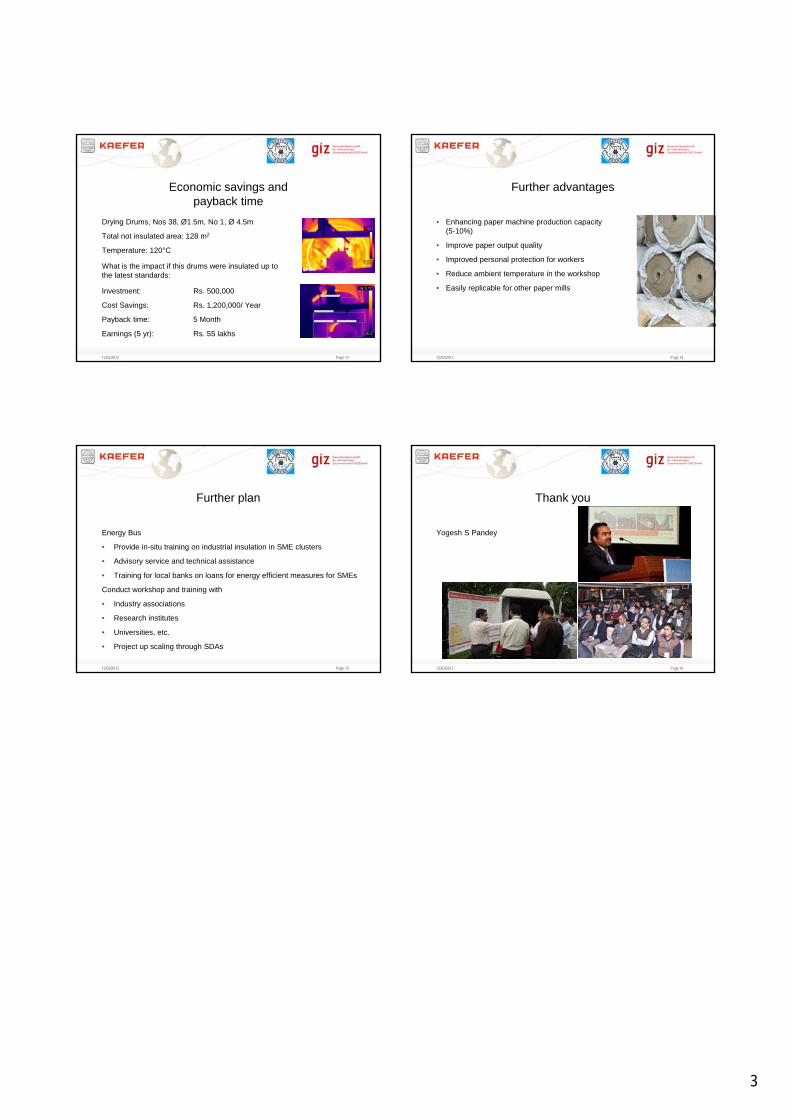
3
Page 13
Economic savings and payback time
12/03/2013
Drying Drums, Nos 38, Ø1.5m, No 1, Ø 4.5m
Total not insulated area: 128 m2
Temperature: 120°C
What is the impact if this drums were insulated up to the latest standards:
Investment: Rs. 500,000
Cost Savings: Rs. 1,200,000/ Year
Payback time: 5 Month
Earnings (5 yr): Rs. 55 lakhs
Page 14
Further advantages
12/03/2013
• Enhancing paper machine production capacity (5-10%)
• Improve paper output quality
• Improved personal protection for workers
• Reduce ambient temperature in the workshop
• Easily replicable for other paper mills
Page 15
Further plan
12/03/2013
Energy Bus
• Provide in-situ training on industrial insulation in SME clusters
• Advisory service and technical assistance
• Training for local banks on loans for energy efficient measures for SMEs
Conduct workshop and training with
• Industry associations
• Research institutes
• Universities, etc.
• Project up scaling through SDAs
Page 16
Thank you
12/03/2013
Yogesh S Pandey
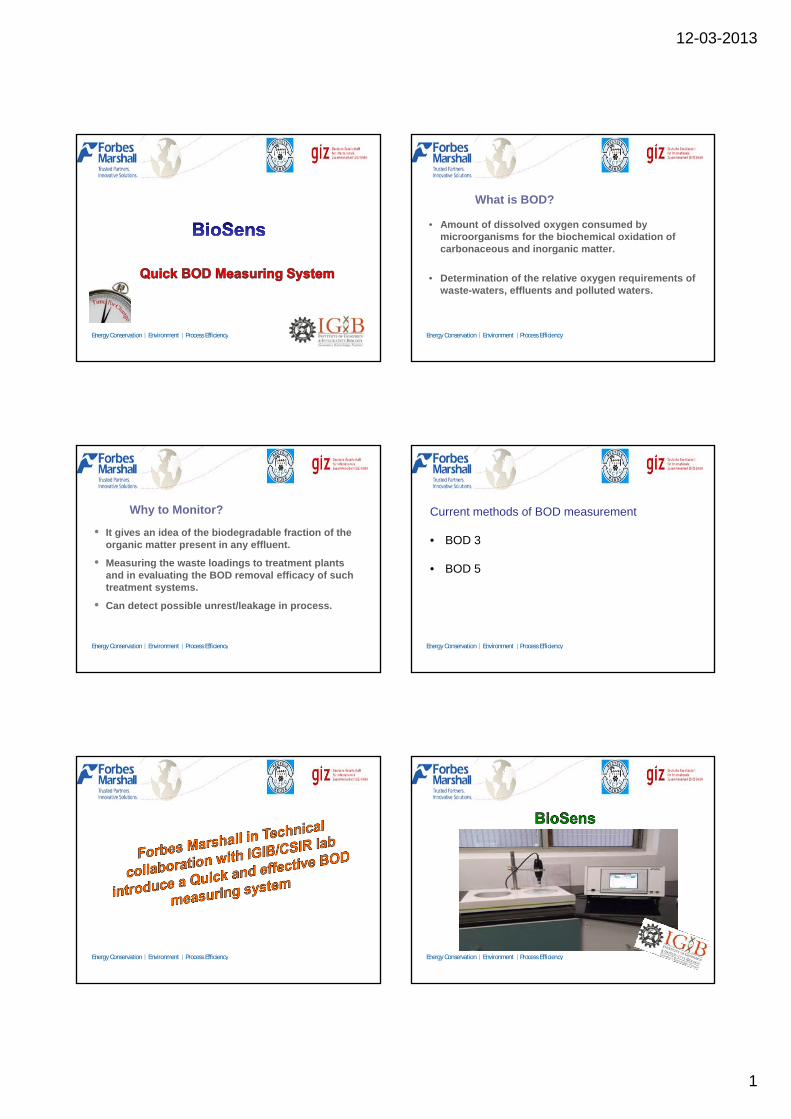
12-03-2013
1
Energy Conservation Environment Process Efficiency Energy Conservation Environment Process Efficiency
What is BOD?
• Amount of dissolved oxygen consumed by microorganisms for the biochemical oxidation of carbonaceous and inorganic matter.
• Determination of the relative oxygen requirements of waste-waters, effluents and polluted waters.
Energy Conservation Environment Process Efficiency
Why to Monitor?
• It gives an idea of the biodegradable fraction of the organic matter present in any effluent.
• Measuring the waste loadings to treatment plants and in evaluating the BOD removal efficacy of such treatment systems.
• Can detect possible unrest/leakage in process.
Energy Conservation Environment Process Efficiency
Current methods of BOD measurement
• BOD 3
• BOD 5
Energy Conservation Environment Process Efficiency Energy Conservation Environment Process Efficiency
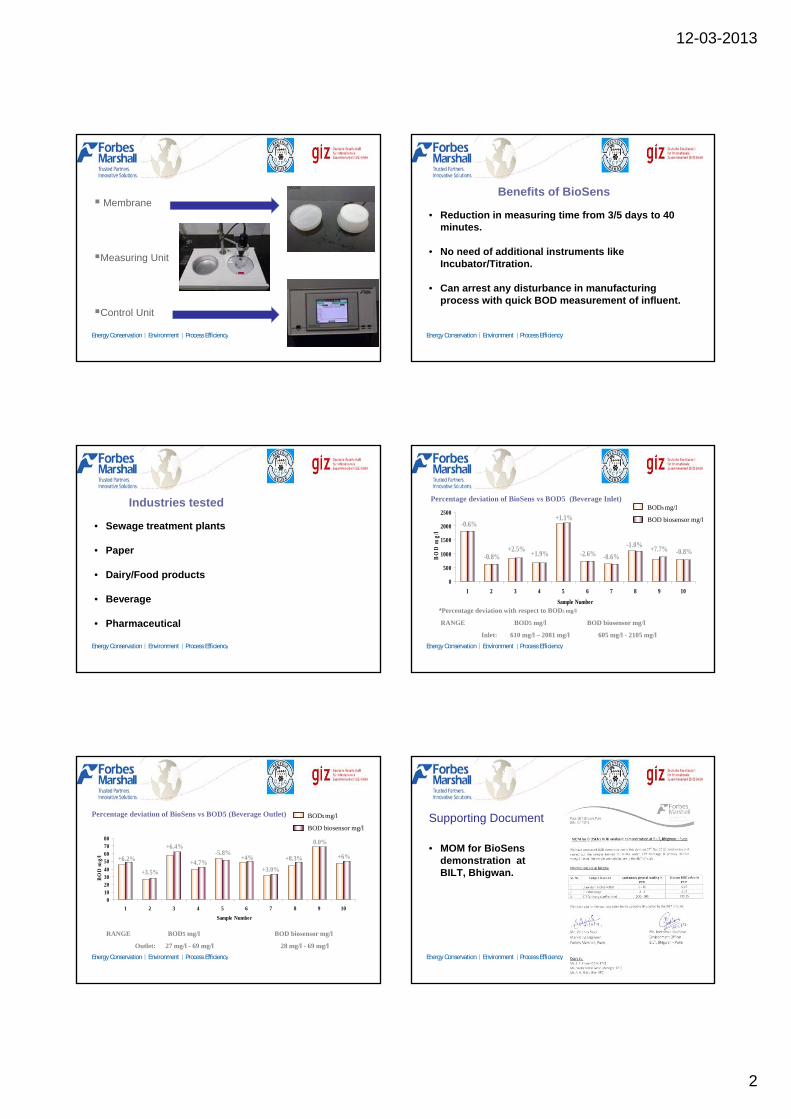
12-03-2013
2
Energy Conservation Environment Process Efficiency
Membrane
Measuring Unit
Control Unit
Energy Conservation Environment Process Efficiency
Benefits of BioSens
• Reduction in measuring time from 3/5 days to 40 minutes.
• No need of additional instruments like Incubator/Titration.
• Can arrest any disturbance in manufacturing process with quick BOD measurement of influent.
Energy Conservation Environment Process Efficiency
Industries tested
• Sewage treatment plants
• Paper
• Dairy/Food products
• Beverage
• Pharmaceutical
Energy Conservation Environment Process Efficiency
Percentage deviation of BioSens vs BOD5 (Beverage Inlet)
-0.6%
-0.8%+2.5%
-2.6%
+1.1%
+7.7%-1.0%
+1.9% -0.6%-0.8%
0
500
1000
1500
2000
2500
1 2 3 4 5 6 7 8 9 10
Sample Number
BO
D m
g/l
BOD5 mg/l
BOD biosensor mg/l
*Percentage deviation with respect to BOD5 mg/l
RANGE BOD5 mg/l BOD biosensor mg/l
Inlet: 610 mg/l – 2081 mg/l 605 mg/l - 2105 mg/l
Energy Conservation Environment Process Efficiency
Percentage deviation of BioSens vs BOD5 (Beverage Outlet)
*Percentage Deviation with respect to BOD5 mg/l
RANGE BOD5 mg/l BOD biosensor mg/l
Outlet: 27 mg/l - 69 mg/l 28 mg/l - 69 mg/l
+6.2%
+3.5%
+6.4%
+4%-5.8%
0.0%
+8.3%+4.7%
+3.0%
+6%
010203040
50607080
1 2 3 4 5 6 7 8 9 10
Sample Number
BO
D m
g/l
BOD5 mg/l
BOD biosensor mg/l
Energy Conservation Environment Process Efficiency
Supporting Document
• MOM for BioSensdemonstration at BILT, Bhigwan.
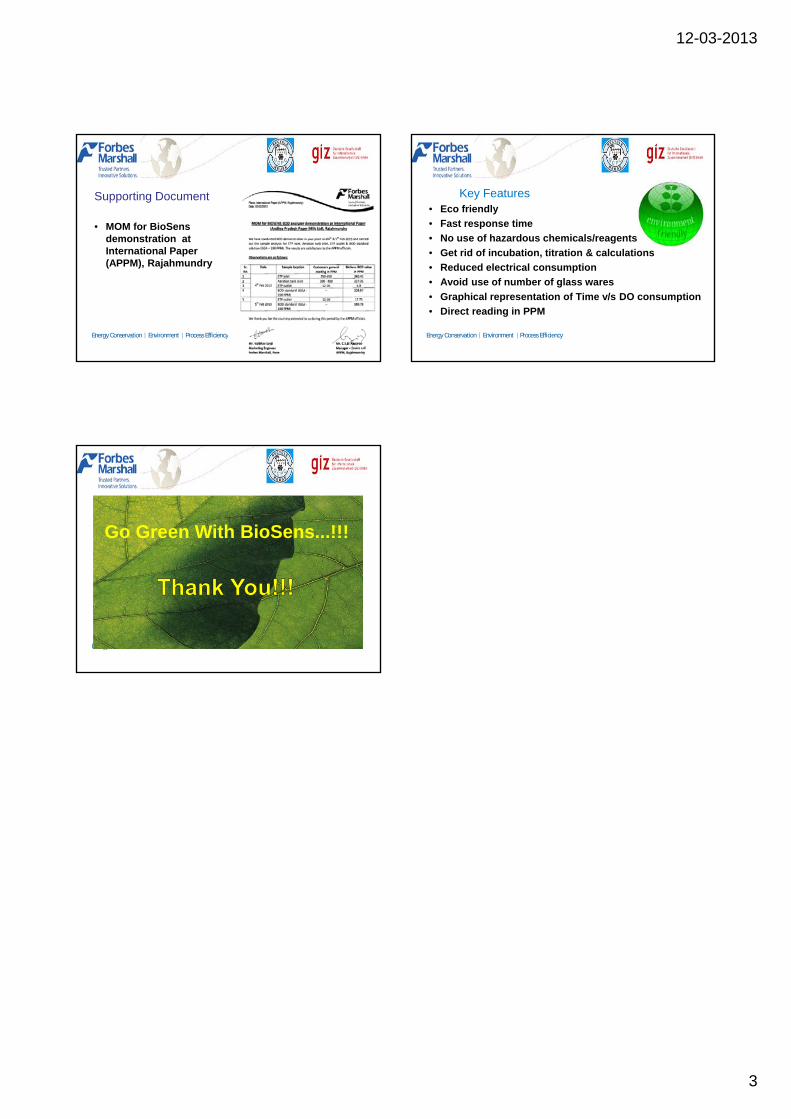
12-03-2013
3
Energy Conservation Environment Process Efficiency
Supporting Document
• MOM for BioSensdemonstration at International Paper (APPM), Rajahmundry
Energy Conservation Environment Process Efficiency
Key Features• Eco friendly
• Fast response time
• No use of hazardous chemicals/reagents
• Get rid of incubation, titration & calculations
• Reduced electrical consumption
• Avoid use of number of glass wares
• Graphical representation of Time v/s DO consumption
• Direct reading in PPM
Energy Conservation Environment Process Efficiency
Go Green With BioSens...!!!