Embed Size (px)
Citation preview
Modelling and simulation to help define MABEL and Starting dose in
FIH studies
B Laurijssens, BEL Pharm Consulting.Steven W Martin, Pharmacometrics
Group, Dept Clinical Pharmacology, Pfizer, Sandwich Labs, Kent, UK.

Slide 2
How should we select a starting dose ?
Base the starting dose on
toxicology in animals
Base the starting dose on
Pharmacology in animals
Base the starting dose on toxicology in animals
and expected pharmacology in humans
Slide 3
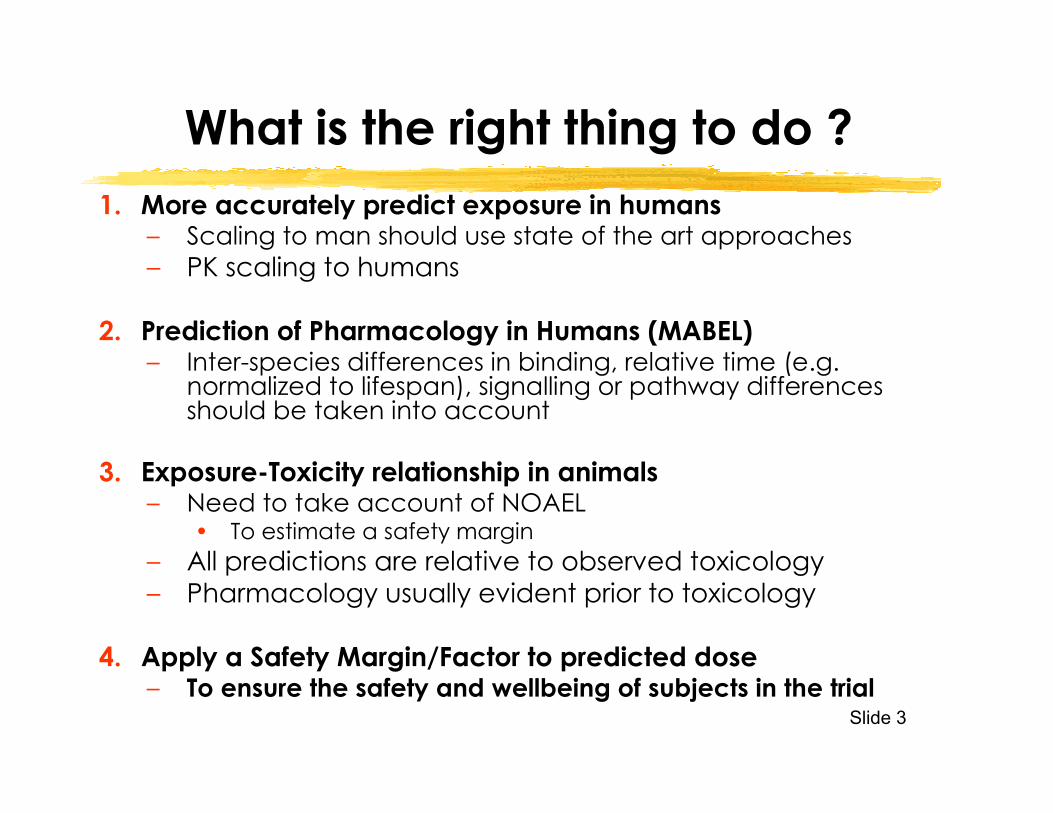
What is the right thing to do ?1. More accurately predict exposure in humans
– Scaling to man should use state of the art approaches– PK scaling to humans
2. Prediction of Pharmacology in Humans (MABEL)– Inter-species differences in binding, relative time (e.g.
normalized to lifespan), signalling or pathway differences should be taken into account
3. Exposure-Toxicity relationship in animals– Need to take account of NOAEL
• To estimate a safety margin– All predictions are relative to observed toxicology– Pharmacology usually evident prior to toxicology
4. Apply a Safety Margin/Factor to predicted dose– To ensure the safety and wellbeing of subjects in the trial
Slide 4
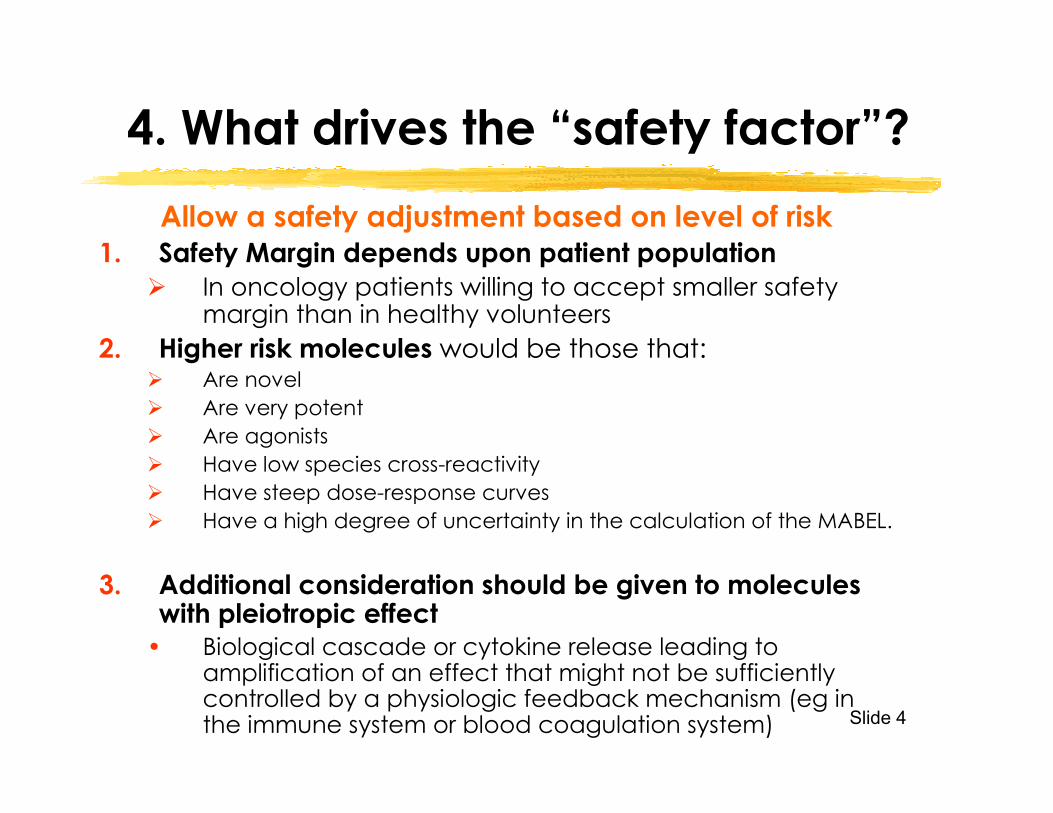
4. What drives the “safety factor”?Allow a safety adjustment based on level of risk
1. Safety Margin depends upon patient populationIn oncology patients willing to accept smaller safety margin than in healthy volunteers
2. Higher risk molecules would be those that:Are novelAre very potentAre agonistsHave low species cross-reactivity Have steep dose-response curvesHave a high degree of uncertainty in the calculation of the MABEL.
3. Additional consideration should be given to molecules with pleiotropic effect
• Biological cascade or cytokine release leading to amplification of an effect that might not be sufficiently controlled by a physiologic feedback mechanism (eg in the immune system or blood coagulation system)
Slide 5
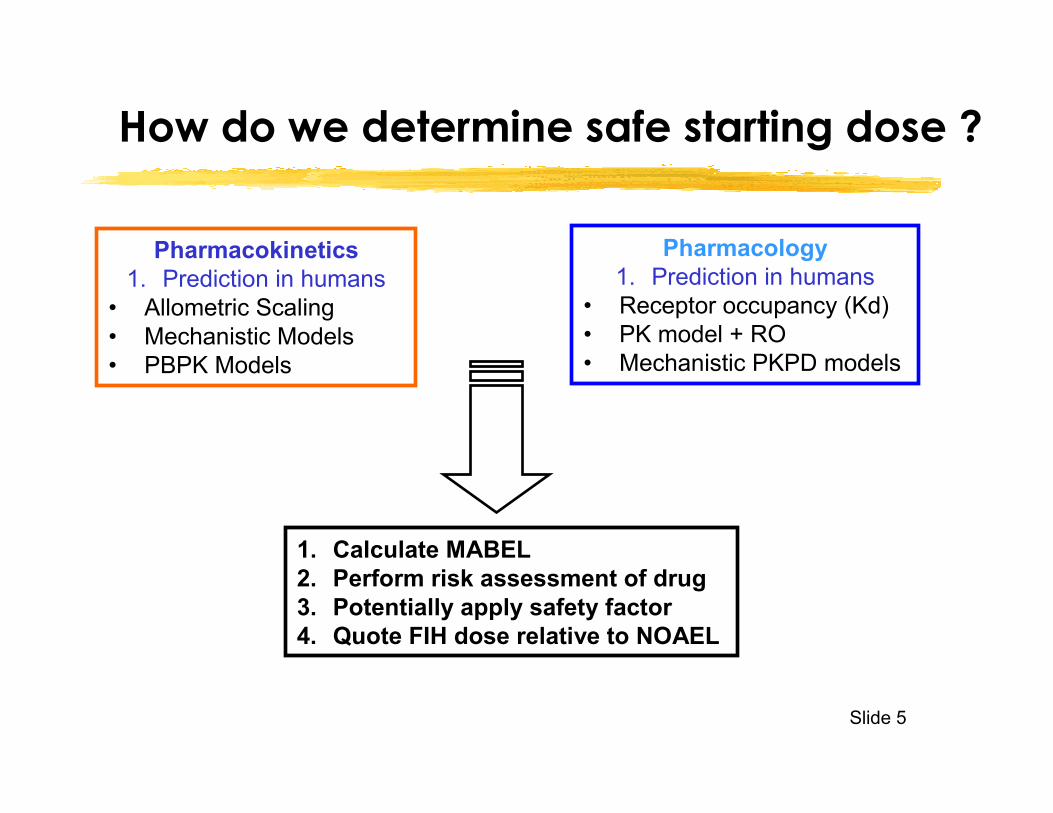
Pharmacokinetics1. Prediction in humans
• Allometric Scaling• Mechanistic Models• PBPK Models
Pharmacology1. Prediction in humans
• Receptor occupancy (Kd)• PK model + RO• Mechanistic PKPD models
1. Calculate MABEL2. Perform risk assessment of drug3. Potentially apply safety factor4. Quote FIH dose relative to NOAEL
How do we determine safe starting dose ?
Slide 6
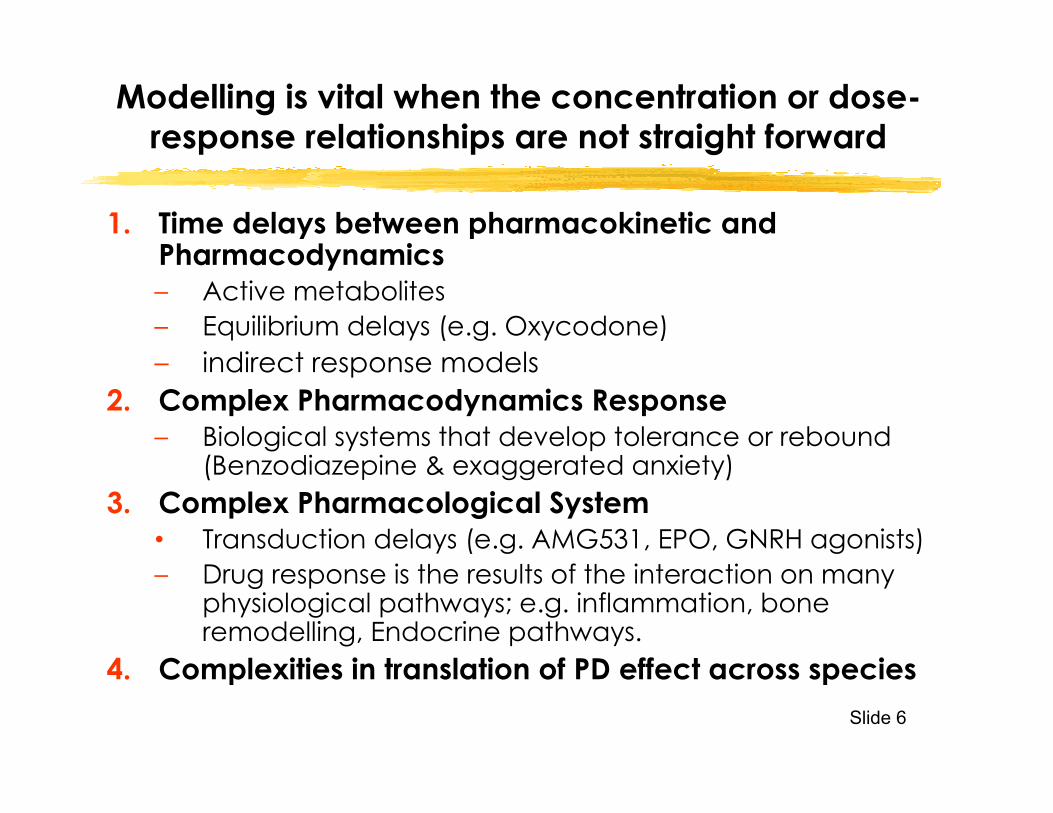
Modelling is vital when the concentration or dose-response relationships are not straight forward
1. Time delays between pharmacokinetic and Pharmacodynamics– Active metabolites– Equilibrium delays (e.g. Oxycodone)– indirect response models
2. Complex Pharmacodynamics Response– Biological systems that develop tolerance or rebound
(Benzodiazepine & exaggerated anxiety)3. Complex Pharmacological System
• Transduction delays (e.g. AMG531, EPO, GNRH agonists)– Drug response is the results of the interaction on many
physiological pathways; e.g. inflammation, bone remodelling, Endocrine pathways.
4. Complexities in translation of PD effect across species

Slide 7
When would we want to use Modelling to estimate MABEL ?
• When the drug response takes time to develop and is not directly related to plasma concentrations.
– May be due to an active metabolite or equilibrium delay between plasma concentration and biophase (eg Oxycodone) causing Hysteresis.
Oxycodone ng/mL
Elapsed time after dosing
Anticlockwise Hysteresis
Lalovic Clin Pharm Ther. 2006
Dose
Cp Ce
Pharmacokinetics
Disposition BiophaseDistribution
Direct PDResponse
Equilibrium Delay
Pupi
l Dia
m(m
m fr
om B
asel
ine)
Pharmacodynamics
Slide 8
0 1 2 3 4Time (days)
PK
PD
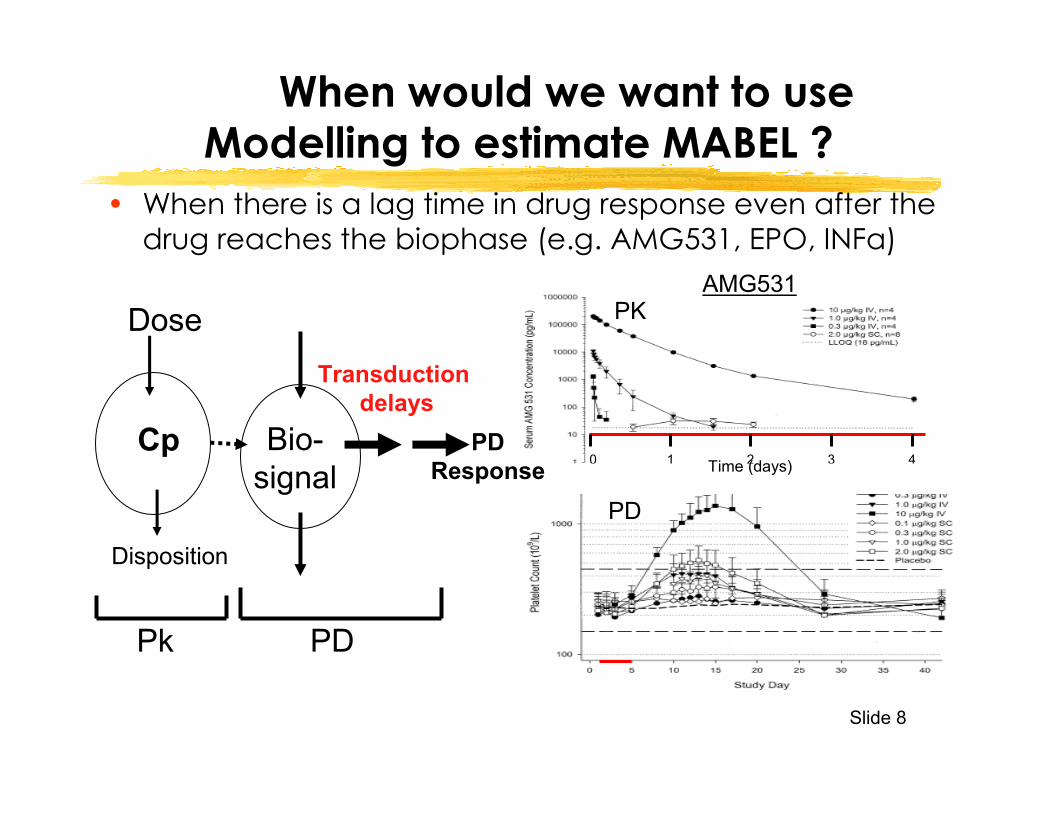
AMG531
When would we want to use Modelling to estimate MABEL ?
• When there is a lag time in drug response even after the drug reaches the biophase (e.g. AMG531, EPO, INFa)
Dose
Cp
Pk
Disposition
PDResponse
Bio-signal
PD
Transductiondelays
Slide 9
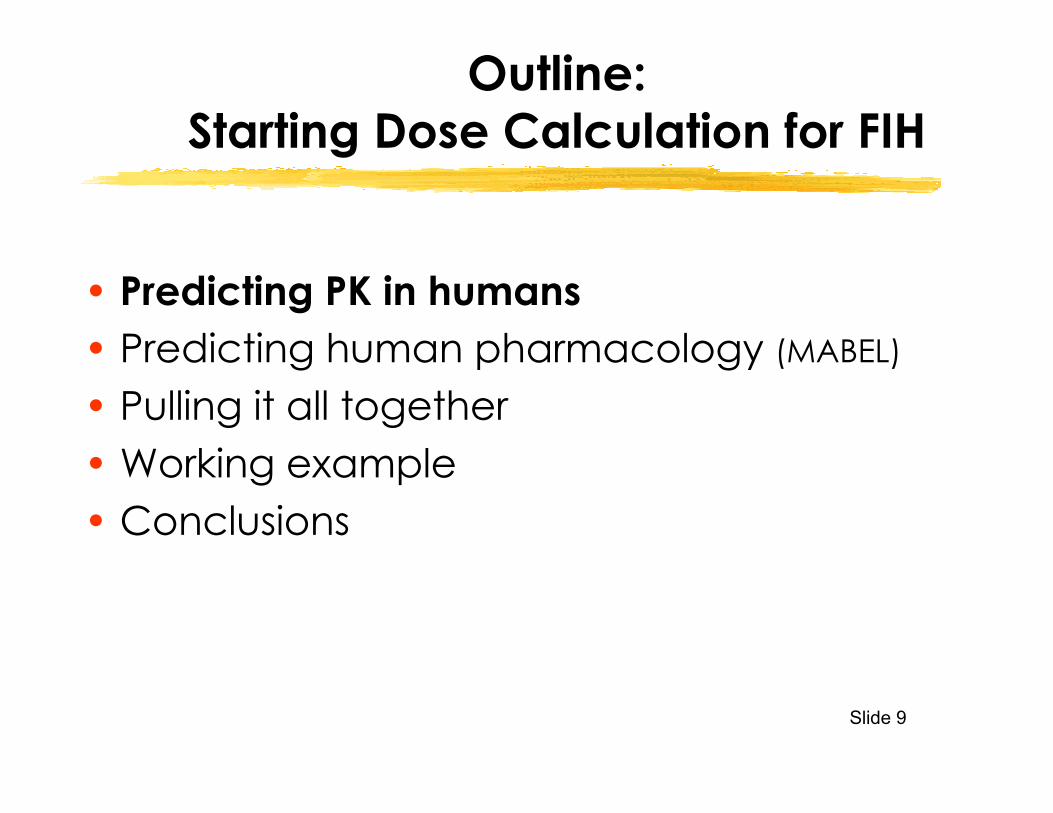
Outline: Starting Dose Calculation for FIH
• Predicting PK in humans• Predicting human pharmacology (MABEL)
• Pulling it all together• Working example• Conclusions

Slide 10
Methods for predicting human PK 1. Allometric scaling
– Simplest approach– Very reliable for some small molecules and biotherapeutics
(not TMD)– Relates PK parameter to body weight
2. (Semi-)mechanistic-based PK models– Takes into account species and disease state differences– Better for extrapolation beyond dose-range– Simcyp Simulator for small molecules
3. Physiologically-based PK models– May be most accurate method to predict across species– [not being covered in this course]

Slide 11
1. Allometric Scaling for PK Prediction
Allometric scaling relates a variable to size
• Variable: Vd, CL, • Size: Body weight, maximum life
span, brain weight, body surface area
X = a * Wb
a: coefficient, b :allometric scaling exponent
• Usually performed on log-log scale• Exponent tends to be similar across
molecules– CL: b= 0.75 [α BSA]– Vd: b = 1 [α BW]– t½: b = 0.25 [1-0.75]
Log[Bwt (Kg)]-2 -1 0 1 2 3
Log
[Vss
(mL)
]-2
0
2
4
Vss = 188*Wt(0.95)Mice
Rhesus Monkey
Human Predicted

Slide 12
Methods for predicting human PK 1. Allometric scaling
– Simplest approach– Very reliable for some small molecules and biotherapeutics (not
TMD)– Relates PK parameter to body weight
2. (Semi-)mechanistic-based PK models– More reliable for target-mediated disposition (membrane bound
targets)– Takes into account species and disease state differences– Better for extrapolation beyond dose-range– Simcyp Simulator for small molecules
3. Physiologically-based PK models– May be most accurate method to predict across species– [not being covered in this course]
Slide 13
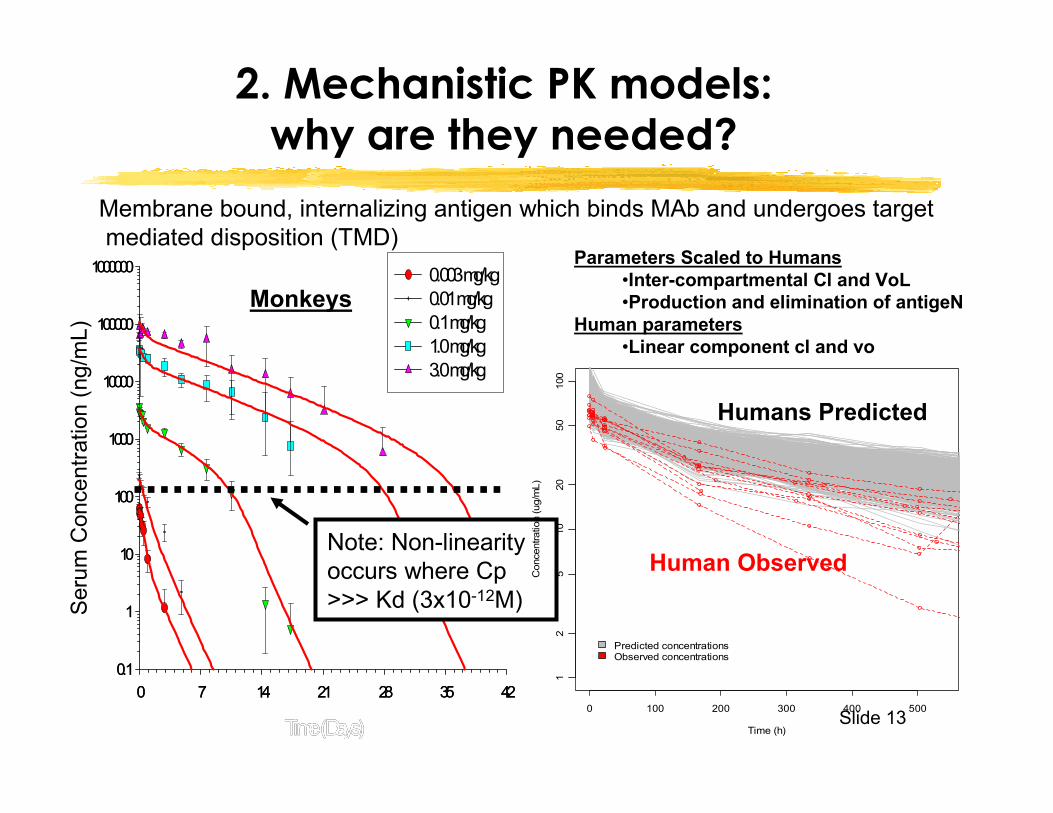
2. Mechanistic PK models: why are they needed?
Time (Days)
0 7 14 21 28 35 42
Ser
um C
once
ntra
tion
(ng/
mL)
0.1
1
10
100
1000
10000
100000
1000000 0.003 mg/kg0.01 mg/kg0.1 mg/kg1.0 mg/kg3.0 mg/kg
Time (Days)
0 7 14 21 28 35 420.1
1
10
100
1000
10000
100000
1000000
Note: Non-linearity occurs where Cp >>> Kd (3x10-12M)
Membrane bound, internalizing antigen which binds MAb and undergoes targetmediated disposition (TMD)
0 100 200 300 400 500
12
510
2050
100
Time (h)
Con
cent
ratio
n (u
g/m
L)
Predicted concentrationsObserved concentrations
Parameters Scaled to Humans•Inter-compartmental Cl and VoL•Production and elimination of antigeN
Human parameters•Linear component cl and vo
Monkeys
Humans Predicted
Human Observed
Slide 14
Outline: Starting Dose Calculation for FIH
• Predicting PK in humans• Predicting human pharmacology (MABEL)
• Pulling it all together• Working example• Conclusions
Slide 15
Methods used for predicting human pharmacology
• Predicted receptor occupancy (Kd)
• PK model coupled with receptor occupancy
• PK model coupled with ex vivo assay
• PK model as empirical “PK/PD” model in absence of biomarker or other in vivo PD data
• Mechanistic PKPD models
Slide 16
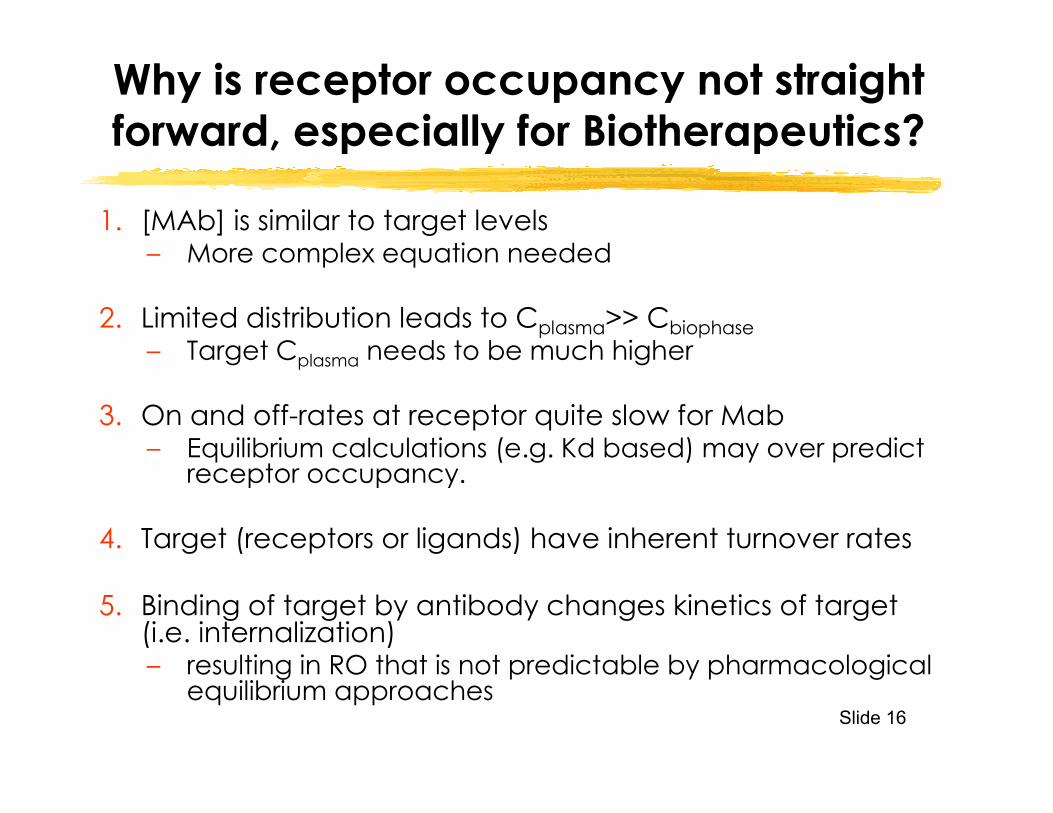
Why is receptor occupancy not straight forward, especially for Biotherapeutics?
1. [MAb] is similar to target levels– More complex equation needed
2. Limited distribution leads to Cplasma>> Cbiophase– Target Cplasma needs to be much higher
3. On and off-rates at receptor quite slow for Mab – Equilibrium calculations (e.g. Kd based) may over predict
receptor occupancy.
4. Target (receptors or ligands) have inherent turnover rates
5. Binding of target by antibody changes kinetics of target (i.e. internalization) – resulting in RO that is not predictable by pharmacological
equilibrium approaches
Slide 17
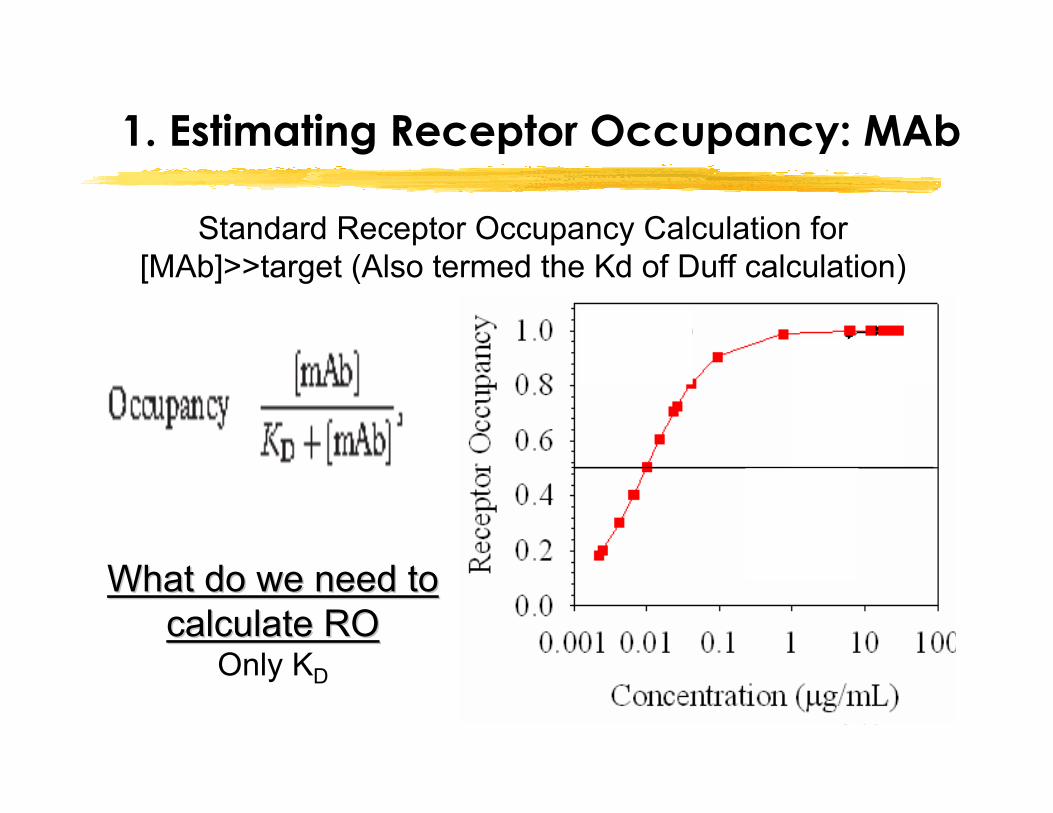
1. Estimating Receptor Occupancy: MAb
Standard Receptor Occupancy Calculation for [MAb]>>target (Also termed the Kd of Duff calculation)
What do we need to What do we need to calculate RO calculate RO
Only KD
Slide 18
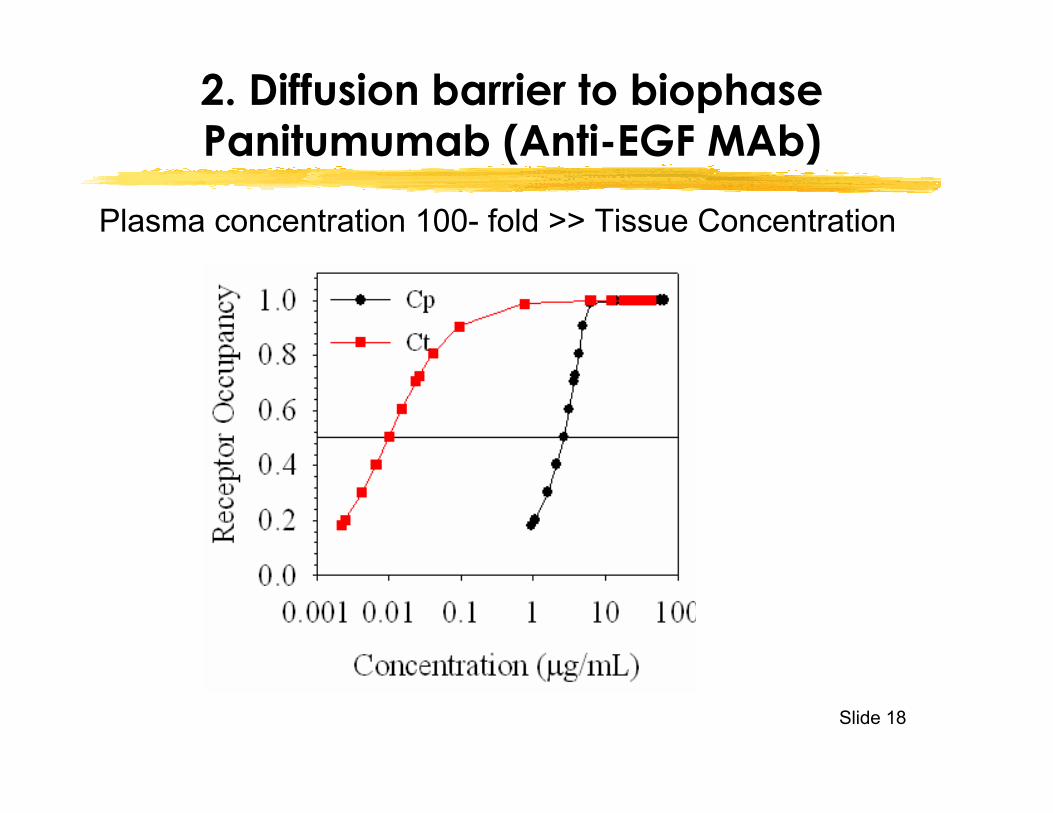
2. Diffusion barrier to biophasePanitumumab (Anti-EGF MAb)
Plasma concentration 100- fold >> Tissue Concentration

Slide 19
3. Impact of changing Koff rateon RO calculations
koff
konAgAb
Rin
kdeg
Dose
kel
+AbAg
kint
Ab
PKPD Model (TMD)
Dose
koff
konAg+ Ab
AgAb
Duff Formula

Slide 20
4. Impact of Target Turnover on RO Estimation
• At high receptor turnover rates, higher molar excess of MAb is required (Not accounted for in simple Kd model)
1.000 10.000 100.000
Receptor turnover half- life (hours)
10-3
10-2
10-1
PKPD prediction
Duff formulaD
ose
For 1
0% R
ecep
tor O
ccup
ancy
koff
konAgAb
Rin
kdeg
Dose
kel
+AbAg
kint
Ab
PKPD Model (TMD)
Dose
koff
konAg+ Ab
AgAb
Duff Formula
Slide 21
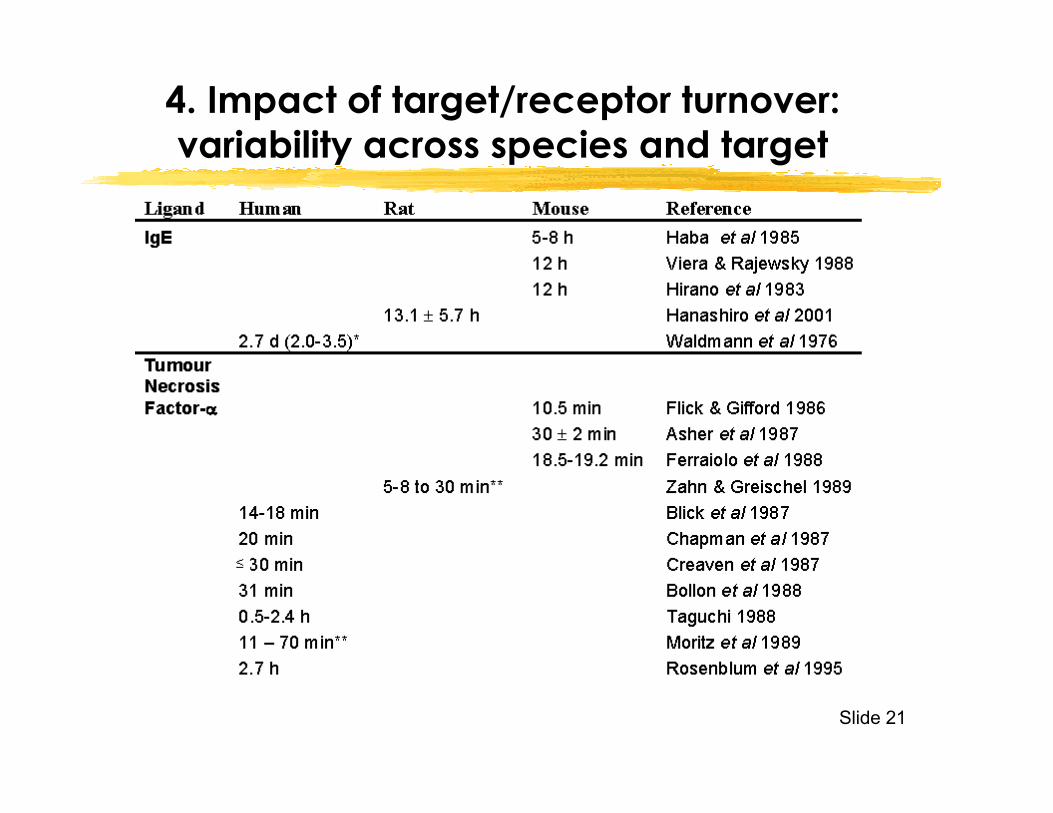
4. Impact of target/receptor turnover: variability across species and target

Slide 22
Methods used for predicting human pharmacology
• Predicted receptor occupancy (Kd)
• PK model coupled with receptor occupancy
• PK model coupled with ex vivo assay
• PK model as empirical “PK/PD” model in absence of biomarker or other in vivo PD data
• Mechanistic PKPD models

Slide 23
4. Impact of target turnover: Impact on FIH dose selection
Subcutaneous Dosing
Slide 24
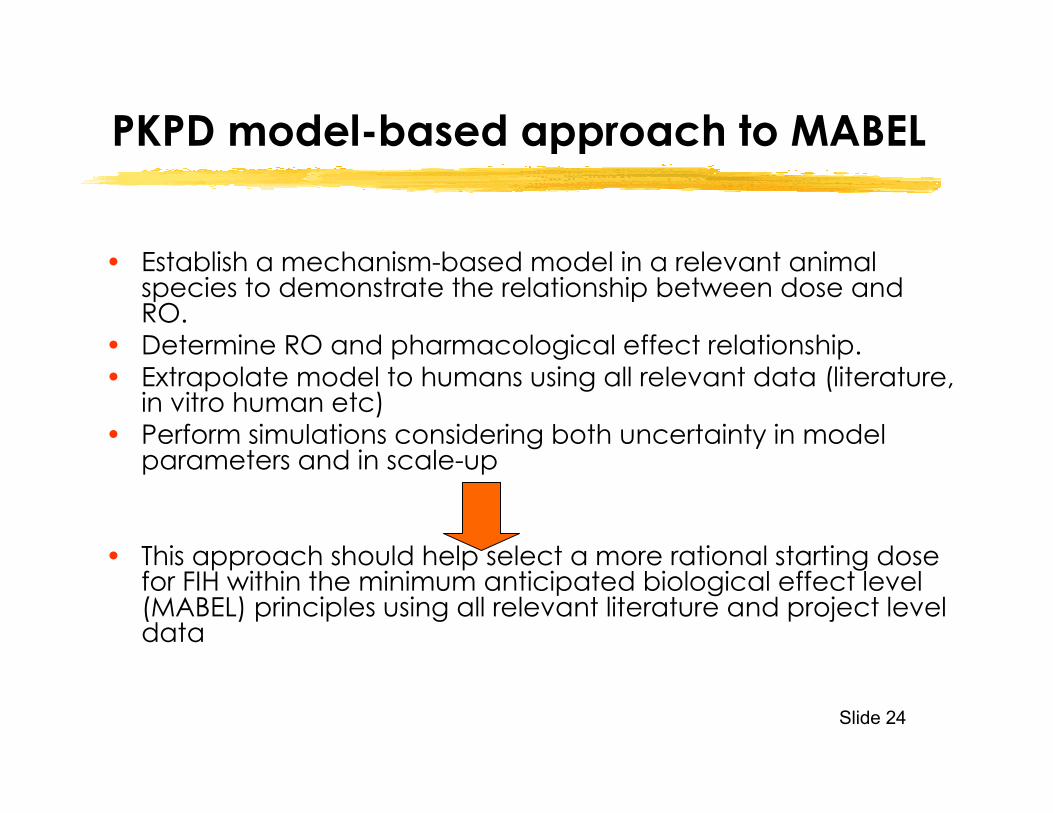
PKPD model-based approach to MABEL
• Establish a mechanism-based model in a relevant animal species to demonstrate the relationship between dose and RO.
• Determine RO and pharmacological effect relationship.• Extrapolate model to humans using all relevant data (literature,
in vitro human etc)• Perform simulations considering both uncertainty in model
parameters and in scale-up
• This approach should help select a more rational starting dose for FIH within the minimum anticipated biological effect level (MABEL) principles using all relevant literature and project level data
Slide 25
Dose (mg/kg)
0.0001 0.001 0.01 0.1 1 10
Rec
epto
r Occ
upan
cy (%
)
0
20
40
60
80
100
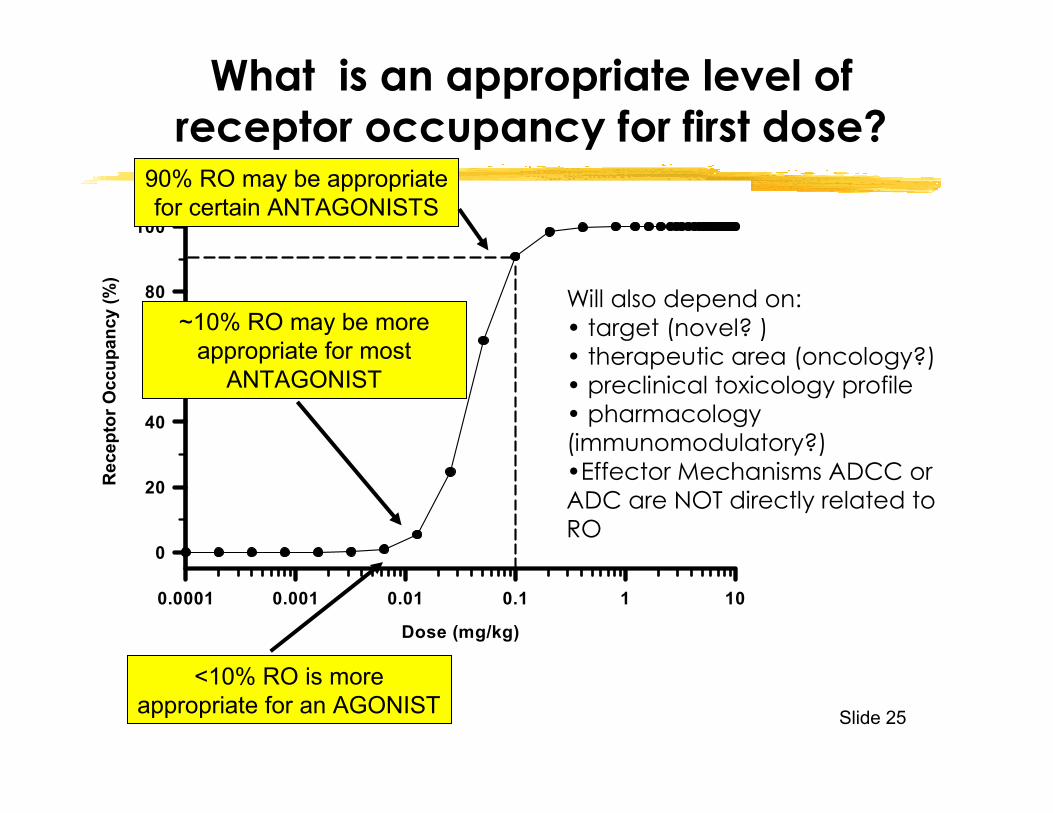
What is an appropriate level of receptor occupancy for first dose?
90% RO may be appropriate for certain ANTAGONISTS
<10% RO is more appropriate for an AGONIST
~10% RO may be more appropriate for most
ANTAGONIST
Will also depend on:• target (novel? )• therapeutic area (oncology?)• preclinical toxicology profile• pharmacology (immunomodulatory?)•Effector Mechanisms ADCC or ADC are NOT directly related to RO

Slide 26
FIH Starting Dose Working Example
• Molecule: IgG1 Fusion Protein (Peptide) NPLATE (AMG531) • Action: Agonist• Mechanism:
– Promotes the viability and growth of megakaryocyte colony-forming cells, increasing platelet production
• Target:– Binds the TPO receptor (peptide is distinctly different from TPO)
• Competitor info: – Similar mechanism Genentech rhu-TPO, Amgen PEG-MGDF
• Background information:– Molecular weight = 59,000 Da– Platelets 2.3 x 10¹¹ L– TPO Receptors/ Platelet 56– (Baseline) TPO Receptors 0.043 nM– Kd = 14 nM
Slide 27
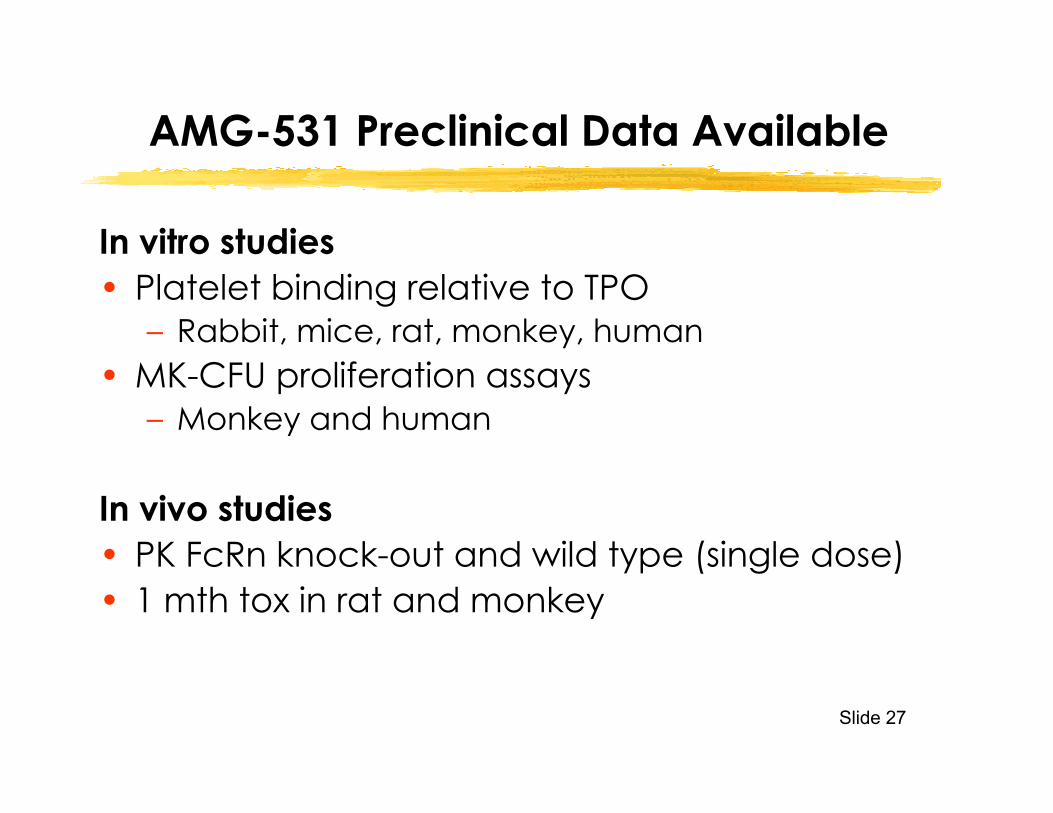
AMG-531 Preclinical Data Available
In vitro studies• Platelet binding relative to TPO
– Rabbit, mice, rat, monkey, human • MK-CFU proliferation assays
– Monkey and human
In vivo studies• PK FcRn knock-out and wild type (single dose)• 1 mth tox in rat and monkey

Slide 28
In vitro results: Platelet binding across species
Competition assay with TPO• number of receptors/platelet
• human : ~60 • monkey : ~30• rat : ~6• rabbit : ~2
MK-CFU proliferation assays •Similar results in both monkeys and humans for AMG531 and MGDF
What can you conclude from this information?• species specificity? •AMG-531 competes at least as effectively as TPO, for the same binding sites on Mpl receptor. •Monkeys appear the most similar to humans for binding and in proliferation assay, Also observed with first generation compounds
Slide 29
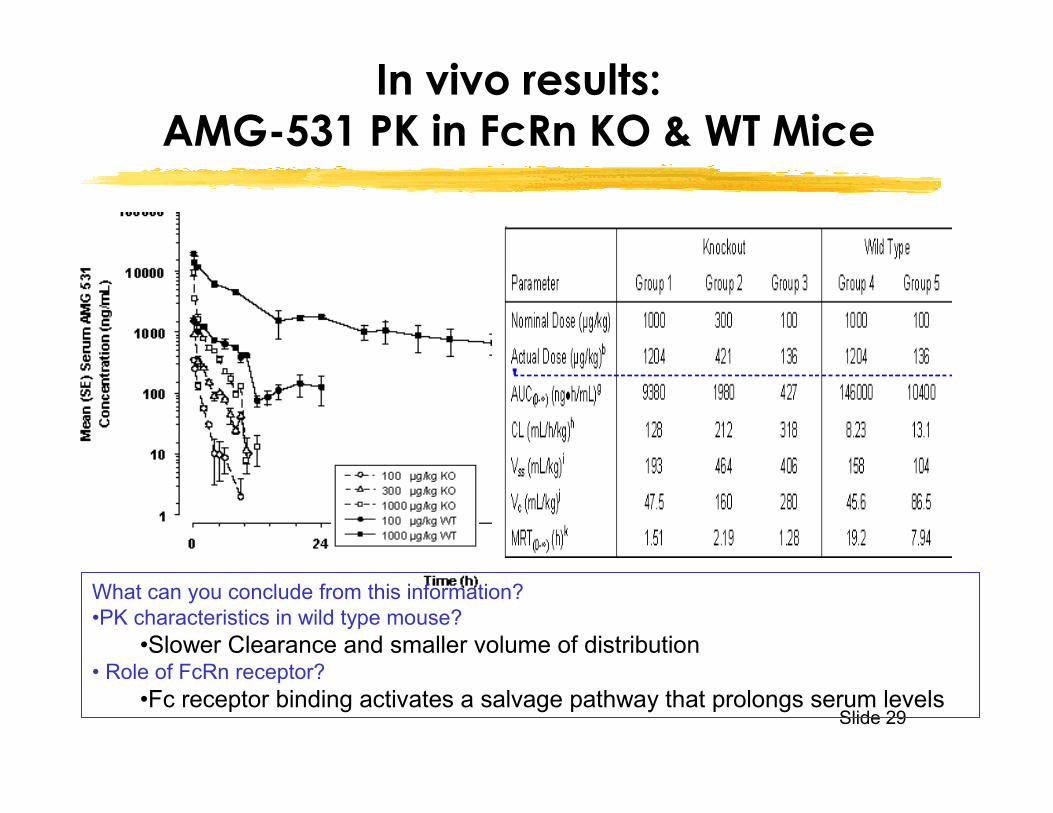
In vivo results:AMG-531 PK in FcRn KO & WT Mice
What can you conclude from this information?•PK characteristics in wild type mouse?
•Slower Clearance and smaller volume of distribution• Role of FcRn receptor?
•Fc receptor binding activates a salvage pathway that prolongs serum levels
Slide 30
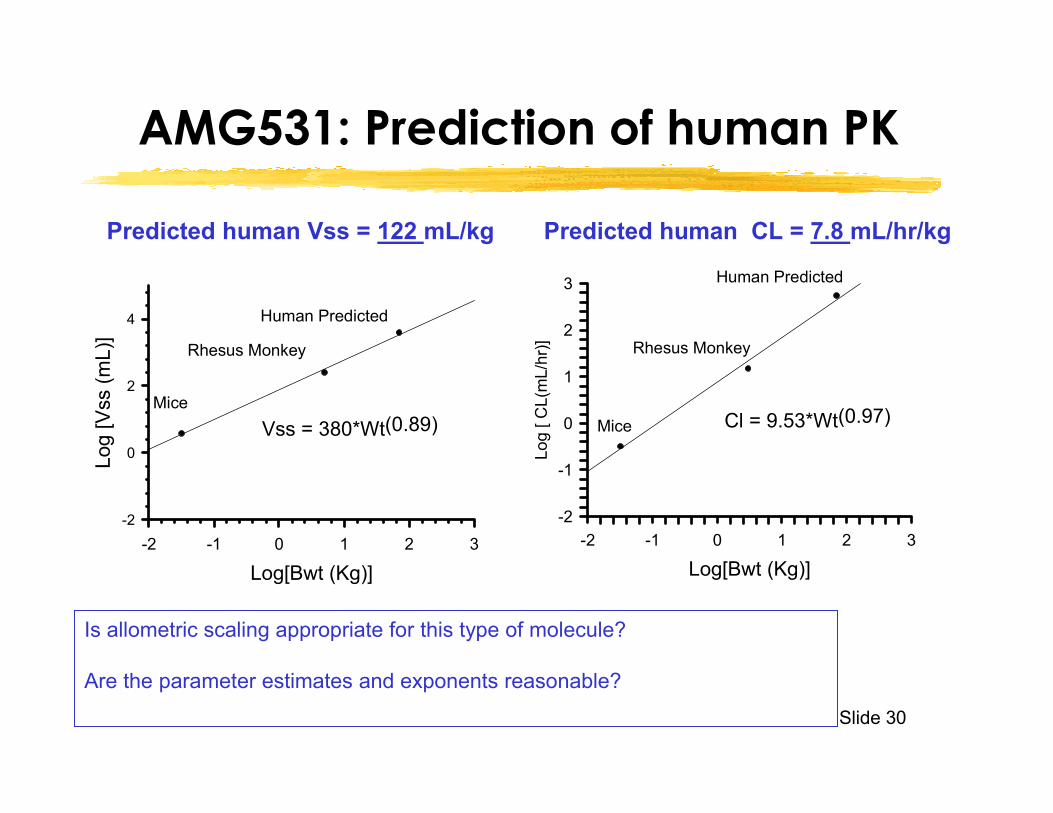
AMG531: Prediction of human PK
Log[Bwt (Kg)]-2 -1 0 1 2 3
Log
[Vss
(mL)
]
-2
0
2
4
Vss = 380*Wt(0.89)Mice
Rhesus Monkey
Human Predicted
Predicted human Vss = 122 mL/kg Predicted human CL = 7.8 mL/hr/kg
Log[Bwt (Kg)]-2 -1 0 1 2 3
Log
[ CL(
mL/
hr)]
-2
-1
0
1
2
3 Human Predicted
Rhesus Monkey
Mice Cl = 9.53*Wt(0.97)
Is allometric scaling appropriate for this type of molecule?
Are the parameter estimates and exponents reasonable?
Slide 31
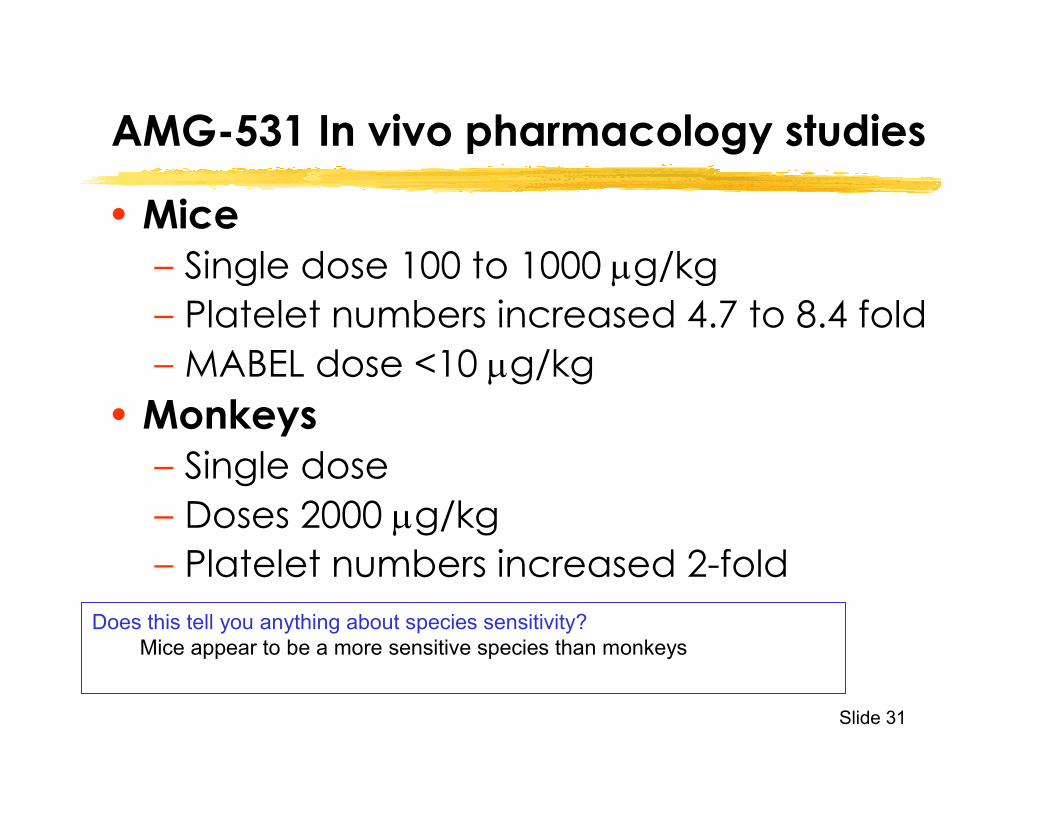
AMG-531 In vivo pharmacology studies
• Mice– Single dose 100 to 1000 µg/kg– Platelet numbers increased 4.7 to 8.4 fold– MABEL dose <10 µg/kg
• Monkeys– Single dose – Doses 2000 µg/kg– Platelet numbers increased 2-fold
Does this tell you anything about species sensitivity? Mice appear to be a more sensitive species than monkeys
Slide 32
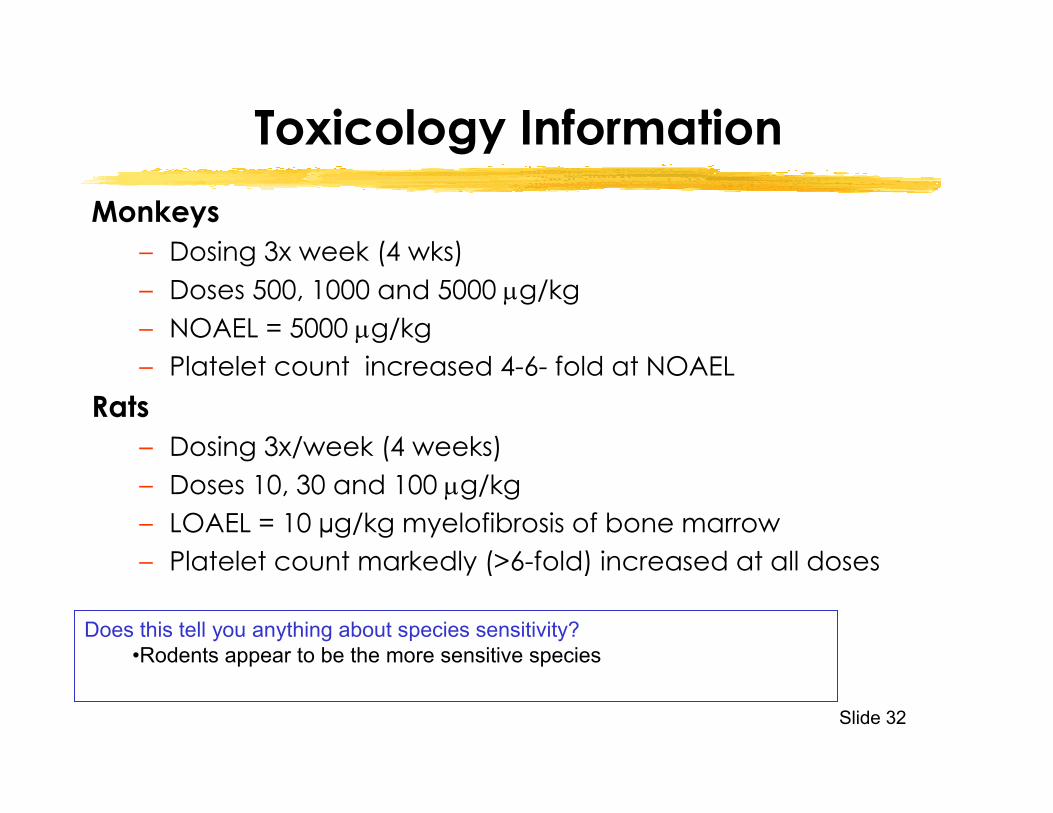
Toxicology InformationMonkeys
– Dosing 3x week (4 wks) – Doses 500, 1000 and 5000 µg/kg – NOAEL = 5000 µg/kg – Platelet count increased 4-6- fold at NOAEL
Rats– Dosing 3x/week (4 weeks) – Doses 10, 30 and 100 µg/kg– LOAEL = 10 µg/kg myelofibrosis of bone marrow– Platelet count markedly (>6-fold) increased at all doses
Does this tell you anything about species sensitivity? •Rodents appear to be the more sensitive species

Slide 33
PKPD Approach:Platelet kinetics
PKPD model of platelet kinetics was used to predict the effects of AMG-531 in humans • allometric scaling of PK• in vitro potency scaling
Predicted no effect dose in humans for AMG-531 was 10 µg/kg
Effects of PEG-rHu-MGDFPKPD Model developed for PEG-rHu-MGDF

Slide 34
Pharmacology Approach Estimate Receptor Occupancy
• Dose 0.01 mg/kg (i.e. 10ug/kg)
• Mwt ~ 59,000• Plasma Volume 2.5 L• AMG-531 = 11.86 nM
(IV Cmax )
DRUGAMG-531
Total NumberTPO Receptors
On Platelets
Drug-receptorComplex+
• Platelets 2.3 x 10¹¹ L• TPO Receptors/
Platelet = 56
• (Baseline) TPO Receptors = 0.043 nM
• AMG-531-TPO Receptor Complex
• 0.011 nM(At Equilibrium)
• 25% Receptor Occupancy
Kd = 14 nM
See Excel Spreadsheet Calculator to estimate receptor occupancy

Slide 35
Predicting Pharmacology in Humans for AMG-531
Rats• LOAEL = 10 µg/kg
– Cmax = ~200 ng/mL– AUC = ~80 ng*hr/mL
Human Equivalent (HED)• Dose§ 1.61 µg/kg
– Cmax# = ~32 ng/mL– AUC# = ~2.1 ng*hr/mL
# Based upon Allometric Scaling of CL and Volume (slide 40)§ Based upon FDA Guidance on HED; divide animal dose by 6.2 rat, 3.1 monkey.
Cynomolgus Monkeys• NOAEL = 5000 µg/kg
– Cmax = ~100 µg/mL– AUC = ~ 1000 µg*hr/mL
Human Equivalent (HED) • Dose § 1600 µg/kg
– Cmax# = ~ 32 µg/mL– AUC# = ~ 230 µg*hr/mL
Apply Safety Margin 10 foldMRSD = 0.16 µg/kg
Apply Safety Margin 10 foldMRSD = 160 µg/kg
Slide 36
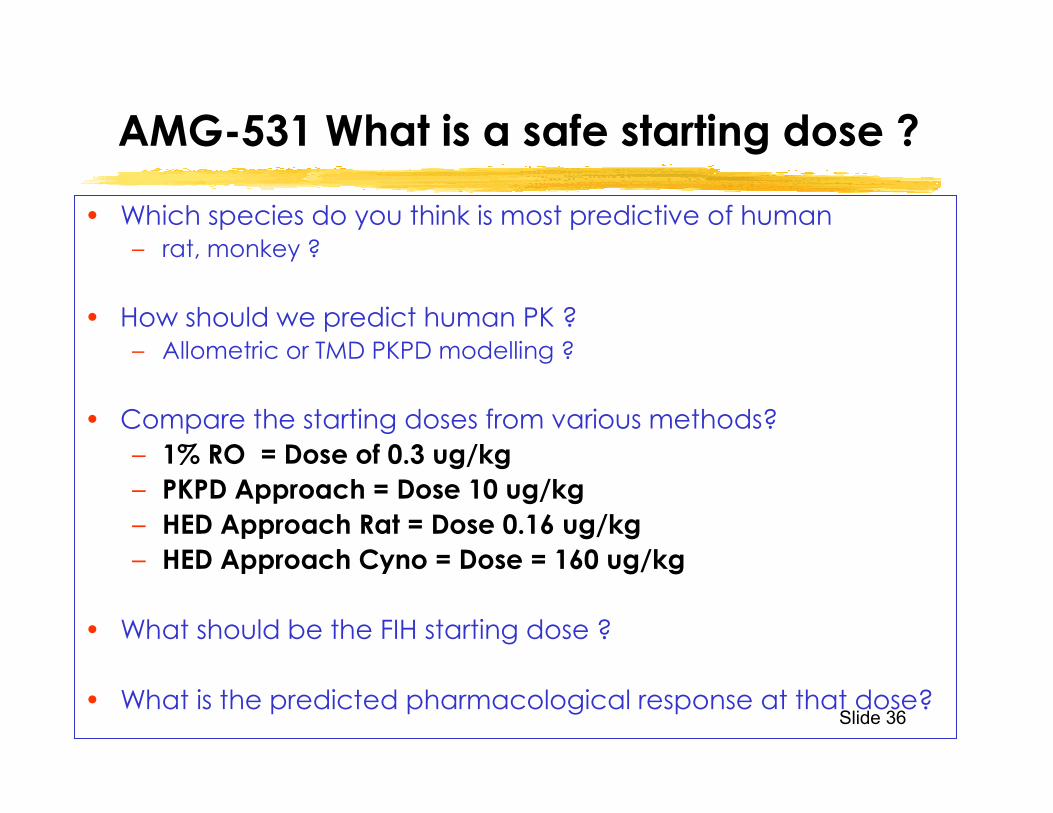
AMG-531 What is a safe starting dose ?
• Which species do you think is most predictive of human– rat, monkey ?
• How should we predict human PK ?– Allometric or TMD PKPD modelling ?
• Compare the starting doses from various methods?– 1% RO = Dose of 0.3 ug/kg– PKPD Approach = Dose 10 ug/kg– HED Approach Rat = Dose 0.16 ug/kg– HED Approach Cyno = Dose = 160 ug/kg
• What should be the FIH starting dose ?
• What is the predicted pharmacological response at that dose?
Slide 37
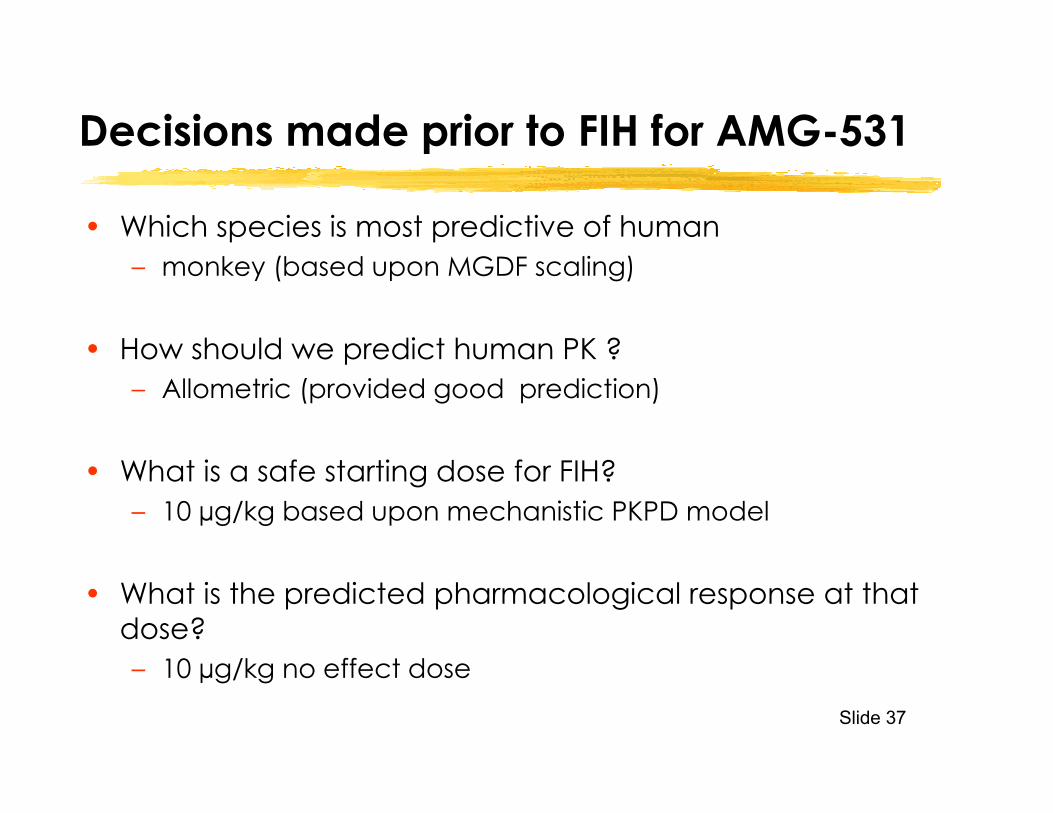
Decisions made prior to FIH for AMG-531
• Which species is most predictive of human– monkey (based upon MGDF scaling)
• How should we predict human PK ?– Allometric (provided good prediction)
• What is a safe starting dose for FIH?– 10 µg/kg based upon mechanistic PKPD model
• What is the predicted pharmacological response at that dose?– 10 µg/kg no effect dose
Slide 38
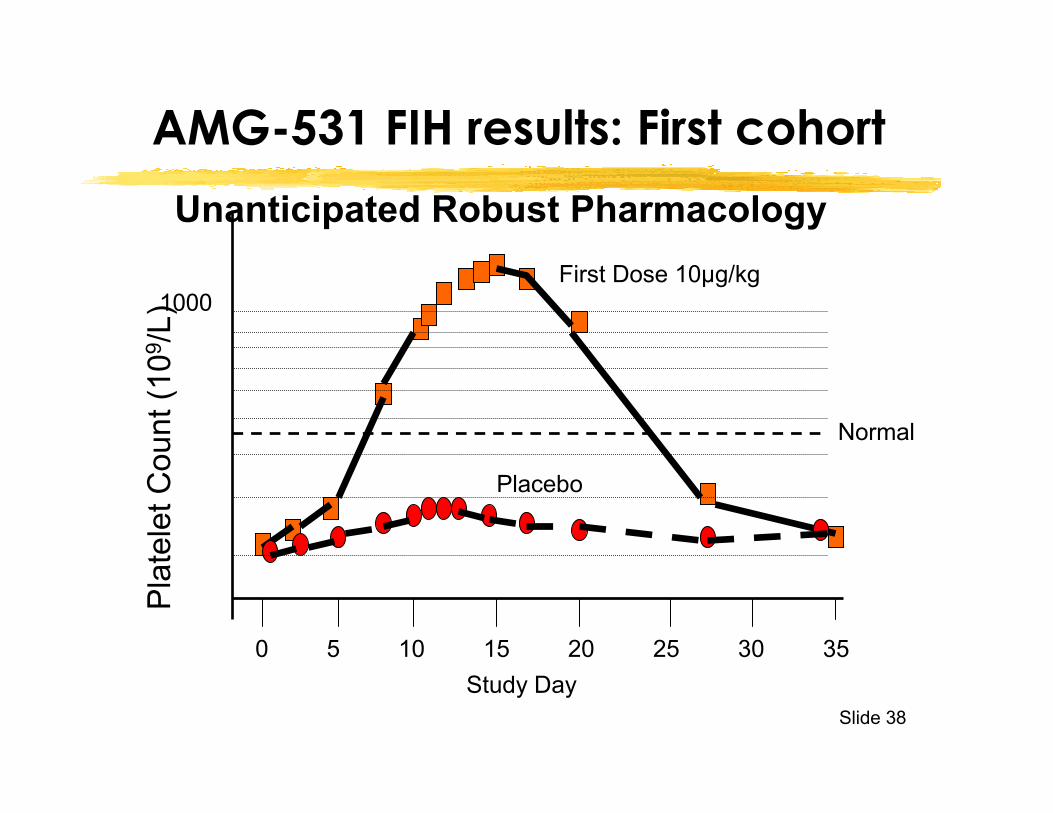
AMG-531 FIH results: First cohort
First Dose 10µg/kg
Placebo
0 5 10 15 20 25 30 35Study Day
Pla
tele
t Cou
nt (1
09/L
)1000
Normal
Unanticipated Robust Pharmacology

Slide 39
AMG531: Findings after 1st Cohort
• New In vitro binding studies showed human cell lines to have a much higher affinity (slower off rate) than monkeys –If they had more robust Koff data then FIH starting dose would have been 0.3 ug/kg
Subsequent in vitro studies indicate order of species sensitivity
Mouse>Human>Rat>Monkey>Rabbit

Slide 40
Pharmacology Approach Estimate Receptor Occupancy
• Dose 0.01 mg/kg (i.e. 10ug/kg)
• Mwt ~ 59,000• Plasma Volume 2.5 L• AMG-531 = 1.87 nM
(IV Cmax )
DRUGAMG-531
Total NumberTPO Receptors
On Platelets
Drug-receptorComplex+
• Platelets 2.3 x 10¹¹ L• TPO Receptors/
Platelet = 56
• (Baseline) TPO Receptors = 0.043 nM
• AMG-531-TPO Receptor Complex
• 0.032 nM(At Equilibrium)
• 89% Receptor Occupancy
Kd = 0.6 nM
Additional in vitro study indicates AMG-531 binds more tightly (slower off rate) to human cells than monkey to give a lower Kd
(0.6 vs 14 nM)

Slide 41
AMG531: FIH dose de-escalation
Bing Wang et al. Clinical Pharmacology & Therapeutics 2004 76(6) 628-38

Slide 42
Conclusions• Know your Human! Pharmacology
• Be clear and transparent about the underlying assumptions– quality of the data– risks– strength of assumptions made
• Manage uncertainty– Sensitivity analysis, worst case scenarios, and robust designs – safety margins, proper monitoring can address these
• Merely “calculating” RO is not sufficient you need to predict a pharmacological response in humans to estimate MABEL.
• Case by Case
• Try the new web based software from Implore Foal Labshttp://implore.glenavy.com/

Slide 43
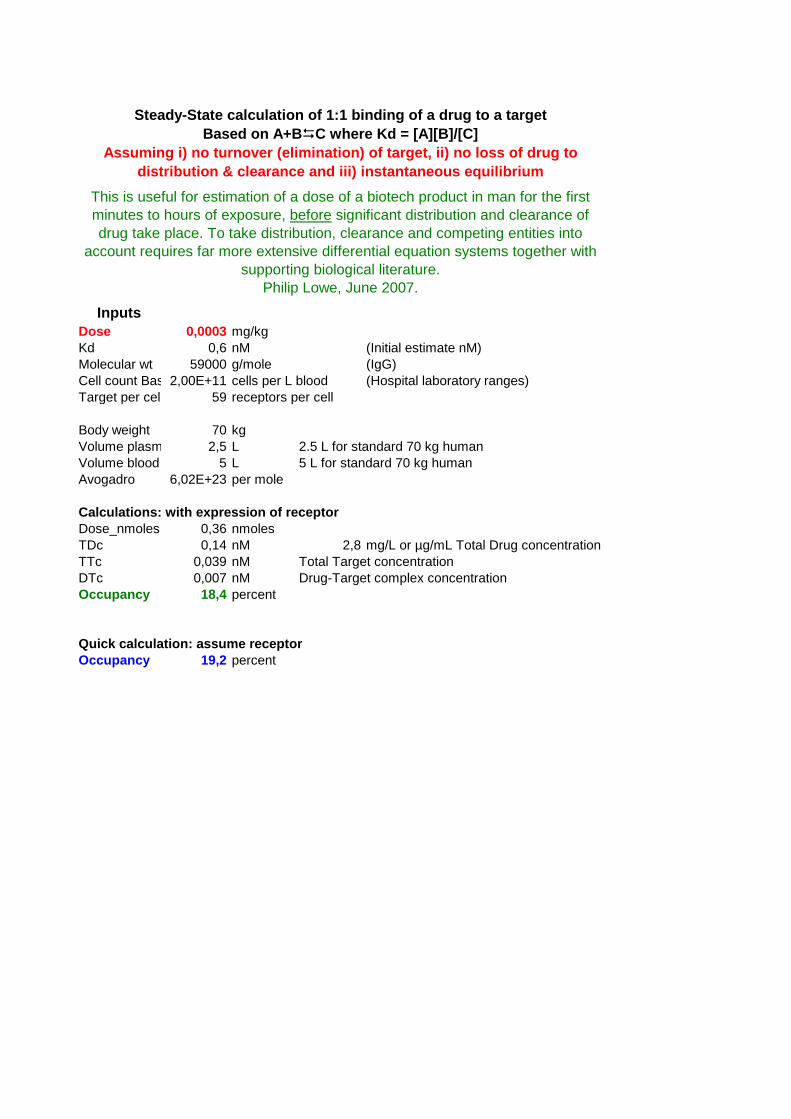
InputsDose 0,0003 mg/kgKd 0,6 nM (Initial estimate nM)Molecular wt 59000 g/mole (IgG)Cell count Bas 2,00E+11 cells per L blood (Hospital laboratory ranges)Target per cell 59 receptors per cell
Body weight 70 kgVolume plasm 2,5 L 2.5 L for standard 70 kg humanVolume blood 5 L 5 L for standard 70 kg humanAvogadro 6,02E+23 per mole
Calculations: with expression of receptorDose_nmoles 0,36 nmolesTDc 0,14 nM 2,8 mg/L or µg/mL Total Drug concentrationTTc 0,039 nM Total Target concentrationDTc 0,007 nM Drug-Target complex concentrationOccupancy 18,4 percent
Occupancy 19,2 percent
Steady-State calculation of 1:1 binding of a drug to a targetBased on A+BC where Kd = [A][B]/[C]
Assuming i) no turnover (elimination) of target, ii) no loss of drug to distribution & clearance and iii) instantaneous equilibrium
This is useful for estimation of a dose of a biotech product in man for the first minutes to hours of exposure, before significant distribution and clearance of drug take place. To take distribution, clearance and competing entities into
account requires far more extensive differential equation systems together with supporting biological literature.
Philip Lowe, June 2007.
Quick calculation: assume receptor