Embed Size (px)
Citation preview
1
Workplace diversity disclosure by global companies: An exploration
Melody Du
A Dissertation submitted to Auckland University of Technology in fulfillment of the
requirements for the Degree of Master of Business (MBus)
2018
School of Business
Primary Supervisor: Dr. Mahmood Momin
2
Table of Content
Table of Content ................................................................................................................... 2
List of Tables and Figures ................................................................................................... 4
Acknowledgement ................................................................................................................ 6
Abstract ................................................................................................................................. 7
1. Introduction .................................................................................................................. 8
1.1 Chapter overview ....................................................................................................... 8
1.2 Research background ................................................................................................ 8
1.3 Research aim and research questions ...................................................................... 9
1.4 Research methods .................................................................................................... 10
1.5 Organisation of the dissertation ............................................................................. 11
2. Literature Review ...................................................................................................... 12
2.1 Chapter overview ................................................................................................ 12
2.2 Research background – workplace diversity in management literature ....... 12
2.3 Corporate social responsibility (CSR) disclosure and workplace diversity
literatures ........................................................................................................................ 14
2.3.1 CSR disclosure literature in general ................................................................... 14
2.3.2 Workplace diversity disclosure literatures .......................................................... 16
2.4 Global Reporting Initiative (GRI) and categories of workplace diversity
disclosure ........................................................................................................................ 18
2.4.1 Global Reporting Initiative (GRI) .................................................................. 18
2.4.2 Categories of workplace diversity disclosure ................................................ 18
2.5 Theoretical framework of the research- impression management theory ..... 25
3. Research Design ......................................................................................................... 28
3.1 Sample Selection .................................................................................................. 28
3.2 Research method ................................................................................................. 29
3
3.2.1 Overview of research methods: content analysis and case study .................. 29
3.2.2 Content analysis ............................................................................................. 30
3.2.3 Case study method ......................................................................................... 37
4. Findings and discussions ........................................................................................... 38
4.1 Extent of workplace diversity disclosure ............................................................... 38
4.1.1 Overall extent of workplace diversity disclosure........................................... 38
4.1.2 Extent of specific items in workplace diversity disclosure ............................ 39
4.2 Contents of workplace diversity disclosure ........................................................... 42
4.2.1 Content of workplace diversity management approach disclosure ................ 42
4.2.2 Content of gender diversity disclosure .......................................................... 42
4.2.3 Content of age diversity disclosure ................................................................ 43
4.2.4 Content of cultural diversity disclosure ......................................................... 43
4.2.5 Content of disability diversity disclosure ...................................................... 44
4.2.6 Content of sexual-orientation diversity disclosure ........................................ 44
4.2.7 Content of workplace diversity measurement disclosure .............................. 45
4.2.8 Analysis of content findings .......................................................................... 46
4.3 Quality of workplace diversity disclosure.............................................................. 47
4.4 Impression management perspective of workplace diversity disclosure ............ 50
4.4.1 Disclosure with no back up of clear and convincing information in regard to
diversity performance of specific diversity issues. ...................................................... 51
4.4.2 Discrepancies between descriptive disclosure and statistics disclosure ........ 53
4.4.3 Disclosure with vogue information on issues that really matter .................... 53
4.4.4 Diluting negative disclosure in longer positive disclosure ............................ 54
4.4.5 Non-disclosure on diversity problems or negative impacts ........................... 55
5 Conclusion, limitation and contribution .................................................................. 58
4
List of Tables and Figures
Table 1 WDD extent binary scale ....................................................................................... 32
Table 2 Examples of quality weighting scoring ................................................................. 34
Table 3 WDD quality weighting scale ................................................................................ 36
Table 4 WDD extent summary ........................................................................................... 38
Table 5 WDD extent by disclosure items ........................................................................... 39
Table 6 WDD quality summary .......................................................................................... 47
Table 7 WDD quality by disclosure items .......................................................................... 48
Figure 1 Disclosure on gender and ethnicity by employment level of CVS Ltd ................. 55
Figure 2 Image disclosure on gender diversity of Walmart Ltd .......................................... 56
5
Attestation of Authorship
I hereby declare that this submission is my own work and that, to the best of my
knowledge and belief, it contains no material previously published or written by another
person (except where explicitly defined in the acknowledgements), nor material which to a
substantial extent has been submitted for the award of any other degree or diploma of a
university or other institution of higher learning.
Melody Du 05/02/2018
6
Acknowledgement
I would like to express the appreciation to my supervisor Mahmood Momin; without his
guidance and persistent help this dissertation would not have been possible. I would also
love to thank my parents, whose love has always been the deepest power that encourages
me to battle with difficulties and become a better myself at all times, without any fear. Last
but not least, I would like to thank all my colleagues and friends for their support,
encouragement and understanding. I am so lucky to have you all in my life.
7
Abstract
This research examines the extent, content and quality of workplace diversity disclosure
(WDD) of global companies in their 2016 corporate social responsibility (CSR) reports.
A combination of content analysis and mini-case study is employed. The sample of this
research is Fortune 100 companies. Research results indicate that the extent, content and
quality of workplace diversity disclosure of Fortune 100 companies are at a low level.
WDD is mostly made on positive tones and ignores sensitive or negative information;
disclosure on specific WD issues is made without back up evidence or with blurred
information. Furthermore, the findings of this research tend to support the argument that
workplace diversity disclosure represents vehicles for impression management strategies
aimed at persuading stakeholders.
8
1. Introduction
1.1 Chapter overview
This chapter provides a discussion on the background of the research, followed by a
description of research aim, research question and research method. Structure of the whole
dissertation is presented at the end of the chapter.
1.2 Research background
During the last few decades, there is a strong consensus of companies expanding
disclosure focus beyond the traditional financial reporting to include social, ethical,
environmental and sustainability disclosure (Russo-Spena, Tregua & de Chiara, 2016; Du,
Bhattacharya & Sen, 2010; Chatterjee & Zaman Mir, 2008). CSR disclosure has been
extensively researched in social accounting (Habek & Wolniak, 2016; Mosene et al., 2013;
Tagesson, Blank, Broberg & Collin, 2009; Chatterjee & Zaman Mir, 2008; Adams, 2004;
Watson, Shrives & Marston, 2002). Most of the extant studies focused on overall
disclosures (e.g. environmental, social, ethical) companies had in their CSR reporting.
Currently researchers are focusing on more specific disclosure issues such as
environmental disclosure (Ahmad & Mohamad, 2014; Haque & Deegan, 2010; Tagesson
et al., 2009), carbon emission disclosure (Altintas, 2013; Stanny, 2013; Kolk, Levy &
Pinkse, 2008), human rights disclosure (McPhail & Adams, 2016; Lauwo & Otusanya,
2014) and workplace diversity disclosure (Jaworska, 2016; Chatterjee & Zaman Mir, 2008;
Holton, 2005).
Workplace diversity disclosure (WDD) refers to reporting on the diversity of workforces in
regards to gender, age, culture, sexual orientation and physical and mental ability.
(Armache, 2013). As one of the specific areas of CSR reporting, workplace diversity
disclosure shows an overall maturation trend, with increasing number of companies
starting to include it in CSR reports (Jaworska, 2016). Global companies are equipped with
better resources to prepare workplace diversity disclosure and thus are argued to have
better social and environmental disclosure, including workplace diversity disclosure
(Johnson, Connolly & Carter, 2011; Tagesson et al., 2009).
9
The significance of workplace diversity made WDD an issue of importance. Bolen and
Kleiner (1996) argued that managing workplace diversity is a business case, instead of a
moral, social or a legal concern; workplace diversity has economic benefits in terms of
assisting companies attracting and retaining wider talent pool, reaching out to wider range
of customers, achieving higher customer satisfaction, and ultimately increasing business
profitability. Given the benefits of workplace diversity, there is a possibility for companies
to provide increasing amount of WDD for business reasons (Holton, 2005). However, as a
new reporting phenomenon, WDD has attracted low attention from social accounting
research (Ball, Monaco, Schmeling, Schartz, & Blanck, 2005). Indeed, there are only a
handful of studies on WDD (Jaworska, 2016; Chatterjee & Zaman Mir, 2008; Ball et al.,
2005; Holton, 2005; Bernardi, Bean & Weippert, 2002). There is a lack of understanding
on the current status of the extent, content and quality of WDD practice of global
companies. Besides, none of the existing studies have investigated why the WDD
phenomenon is growing, especially in relation to companies’ interest in impression
management, which is considered as a major vehicle of retaining self-interest. Impression
management has been argued to be a commonly used strategy that enables companies to
provide and maintain good and positive impressions to stakeholders, which ultimately
protects business image and increases company profitability (Diouf & Boiral, 2017;
Boateng, 2016; Syed & Kramar, 2009).
1.3 Research aim and research questions
Given the above background, there is an increasing need for researchers to explore the
status quo and driving factors of WDD especially in global companies. Motivated by the
scant literature on WDD on one hand and its growing importance to global companies on
the other hand, this research aims to explore the status of WDD of Fortune 100 companies
in terms of extent, content and quality of such disclosure. It also explores the driving
factors of WDD through the lens of impression management.
To fulfill the aims of the research, this research sets four research questions. These
research questions are listed as below:
10
RQ 1: What is the extent of workplace diversity disclosure made by Fortune 100
companies?
RQ 2: What are the contents of workplace diversity disclosure made by Fortune
100 companies?
RQ 3: What is the quality of workplace diversity disclosure made by Fortune 100
companies?
RQ4: To what extent do the extent, contents and quality of workplace diversity
disclosure together support the argument – highlighted in the corporate social
reporting literature – that workplace diversity disclosure represents vehicles for
impression management strategies aimed at persuading stakeholders?
1.4 Research methods
The sample of this research is the Fortune 100 companies. Standalone CSR reports for year
2016 of sample companies are studied in this research. Reason is standalone CSR reports
are argued to be widely prepared by large US firms (Moseñe et al., 2013), such as
companies on Fortune list; besides, although various other channels are used for social-
related disclosure including WDD, standalone reports are argued to present more extensive
and reliable disclosure (Ahmad & Mohamad, 2014). Standalone CSR reports in 2016 are
available with 57 out of 100 companies on Fortune list; this results in the final sample of
57 companies on Fortune 100 list.
A multi-method approach is employed in this research; this study undertakes a content
analysis on the available CSR reports in 2016 of Fortune 100 companies to explore the
extent, content and quality of WDD (research question 1, 2 and 3). These findings are
supplemented further with case studies of five companies with the highest quality WDD to
explore the extent to which workplace diversity disclosure represents vehicles for
impression management theory (research question 4).
11
Content analysis involves “codifying qualitative and quantitative information into
predefined categories in order to derive patterns in the presentation and reporting of
information” (Guthrie & Abeysekera, 2006, p.322). It is mostly used by social accounting
researchers in exploring the extent, content and quality of CSR (Mosene et al., 2013; Aribi
& Gao, 2011; Haque & Deegan, 2010; Parker, 2005). This study conducts both extent-
based content analysis (to explore extent- research question 1) and content-based content
analysis (to explore content and quality-research question 2 and 3). The main guiding
paper for content analysis of this research is the research done by Hooks and Van Staden
in 2011. As a first step in content analysis, a categorization scheme and disclosure index
for WDD based on reviewing previous literatures and GRI are prepared. Secondly,
measurement scales are developed to score each disclosure item following Hooks and Van
Staden (2011). Various extant studies have used similar types of content analysis, with
constructing disclosure index and measurement tools (Islam, 2015; Haque and Deegan,
2010; Mosene et al., 2013). With regards to case study, five companies with the highest
disclosure quality scores are qualitatively reviewed further with additional insights and
excerpts from reports at a detailed level. This supplemented quantitative content analysis
provides a deeper understanding of the issues related to the impression management
motivation. Such mini-case approach has been used by prior researchers in social
accounting research (Laine, 2009; Adams, 2004) and considered suitable for this research.
1.5 Organisation of the dissertation
The dissertation is organized in the following fashion:
Chapter two reviews literature on research background, workplace diversity disclosure-
related issues, categories of workplace diversity and WDD, and theoretical framework of
this research (impression management theory), followed by chapter three discussing the
methods used in this research. Chapter four presents research findings and analysis on the
findings. Chapter five concludes the research, discusses contributions and limitations, and
provides suggestions for future research.
12
2. Literature Review
2.1 Chapter overview
This chapter provides a summary of the literatures on workplace diversity, WDD practice,
and develops a categorization scheme for WDD. Subchapter 2.2 provides a review of
literature on workplace diversity. Subchapter 2.3 discusses literatures on CSR disclosure
and WDD practices as a part of CSR disclosure practices. Subchapter 2.4 forms a
categorization scheme and disclosure index for WDD based on previous literatures and
GRI disclosure requirements. Subchapter 2.5 reviews literature on the theoretical
framework of the research- impression management theory.
2.2 Research background – workplace diversity in management literature
Workplace diversity broadly includes gender, age, sexual orientation, culture and disability
diversity (Armache, 2013). Companies are increasingly managing workplace diversity at
least assuming they can derive economic benefits by managing diverse workforce and
reporting on diversity performance (Jaworska, 2016; Armache, 2013; Marques, 2008;
Bolen & Kleiner, 1996). Diversity at workplace enables companies to access a wider
variety of talents, which in turn assists companies adapting to fluctuating markets, and thus
helps to respond better to the changing demands of the global marketplace and ultimately
increases company profit (Armache, 2013). Similarly, Marques (2008) pointed out that
diversity is managed by companies for the purpose of reaching out to wider range of
customers and achieving higher customer satisfaction. Furthermore, Bolen and Kleiner
(1996) argued that workplace diversity is “not a moral, social or a legal concern” but a
business case. Choi and Rainey (2010) found that employee commitment, satisfaction and
loyalty improve when they are respected and recognized regardless of their social
identification. Employees gain confidence with the knowledge that the recognition of
diversity by a company opens the promotion opportunities which are not limited to certain
groups; this in turn improves employee performance. Ball et al. (2005) also argued that
intolerance divides workforce and creates barriers to the innovative and team-based
environment. A properly implemented workplace diversity plan so enhances better
decision making, greater insights and creativity, improves problem solving and idea
13
generation skills, which in turn improves company’s productivity, profitability and ability
to grow (Jaworska, 2016; Marques, 2008). Rawat and Basergekar (2016) also suggested
that diverse work environment leads to higher performance scores. The ultimate goal of
workplace diversity management is so to utilize employees to their fullest potential, reach
out to wider range of customers, and in turn increase business profitability and
effectiveness (Bolen & Kleiner, 1996). Thus, it is important for companies to manage their
diversity performance (Armache, 2013; Amla, 2008; Kochan et al., 2003).
Managing workplace diversity is especially important to global companies due to their
demographic mix of workforce and diverse customer base (Rawat & Basergekar, 2016). In
the midst of a diversifying world and globalizing economy, there is a trend of global
companies acknowledging the importance of building a diversity climate that encourages
learning from others and capturing the advantages of diverse perspectives (Roberson &
Stevens, 2006). Ball et al. (2005) stated that companies such as Fortune companies equip
themselves with more sophisticated policies and strategies to diminish and deal with
lawsuit, as they face lawsuits at a higher rate than that of smaller companies. For example,
in 1996, Chevron paid $176 million for a racial discrimination claim filed by one of their
minority employees. Soon afterwards, Chevron launched their diversity program and set
up diversity policies to eliminate racism (Mulligan & Kraul, Los Angeles Times, 1996).
Similarly, Coca-Cola settled a racial discrimination claim in 2003 by paying $192.5
million, which is one of the largest racial discrimination cases in the US (Hawkins, 2003).
After the settlement, Coca-cola put a higher level of emphasis on workplace diversity
issues.
Despite extant studies suggesting economic benefits for building and promoting diversity
at workplace in global companies and importance of diversity performance in global
companies, critics suggest that workplace diversity performance of global companies is
indeed poor (Syed, 2007). Besides, it’s required by Global Reporting Initiative (GRI) to
report on WD (GRI, 2016); Moreover, from accountability perspective it is also important
that global companies report on WD; reason is stakeholders are interested in employee
issues such as gender pay ratio and how gender, age, culture, disability diversity and
sexual orientation are respected at workplace. On the other hand, there are very few
accounting studies exploring how diversity issues are currently disclosed by global
companies. This study aims to examine the status of WDD practice of global companies.
14
2.3 Corporate social responsibility (CSR) disclosure and workplace diversity
literatures
WDD is one of the specific areas of CSR reporting; its importance is recognized by
increasing number of companies (Jaworska, 2016). This subchapter discusses literatures on
CSR disclosure in general and on WDD practice in particular.
2.3.1 CSR disclosure literature in general
CSR has been extensively studied over the last few decades, since the 1970s. The main
focuses of extant researches on CSR are the status quo of CSR disclosure (Aribi & Gao,
2011; Habek & Wolniak, 2016; Adams, 2004) and factors influencing CSR disclosure
(Chatterjee & Zaman Mir, 2008; Mosene et al., 2013; Tagesson, Blank, Broberg &
Collin, 2009; Watson, Shrives & Marston, 2002; Brammer & Pavelin, 2008).
In regards to the status quo of CSR disclosure as a whole, various studies indicated it’s at a
low level and fails to provide a complete and comprehensive disclosure (Adams, 2004;
Habek & Wolniak, 2016). For instance, Adams (2004) indicated CSR reports are
incomplete and lack accountability, with negative information being neglected. Similarly,
Habek & Wolniak (2016) argued the quality of CSR reports of European Union companies
is at a low level.
The CSR disclosure practice varies between companies due to factors including company
size, profitability and industry (Mosene et al., 2013; Tagesson et al., 2009; Watson et al.,
2002). The level of disclosure increases with firm size and profitability, as larger
companies with higher profit level have more employees and financial resources to collect
related information and prepare social disclosure, as well as more stakeholders that
demand disclosure (Mosene et al., 2013; Brammer & Pavelin, 2008). As companies on
Fortune list are all large companies, thus they are expected to provide better WDD.
More recent research studies shifted from exploring CSR reports as a whole to specific
areas of social or environmental disclosure, such as environmental disclosure (Ahmad &
Mohamad, 2014; Haque & Deegan, 2010; Tagesson et al., 2009), carbon emission
15
disclosure (Altintas, 2013; Kolk, Levy & Pinkse, 2008; Stanny, 2013) and human rights
disclosure (McPhail & Adams, 2016; Lauwo & Otusanya, 2014). Disclosure status quo and
motivations are the main focuses of these researches.
Extant studies also researched on the motivations behind increasingly growing overall
CSR disclosure in general and specific CSR disclosure in particular (Islam, Haque &
Roberts, 2017; Tata & Prasad, 2015; Lauwo & Otusanya, 2014; Mosene et al., 2013;
Colleoni, 2013; Aribi & Gao, 2011; Laine, 2009; Barkemeyer, 2007; Hooghiemstra, 2000).
These studies argued that social and environmental disclosure is used by companies as a
tool for various purposes, including managing stakeholder impressions, responding to
institutional pressure, or staying legitimate. For instance, Lauwo and Otusanya (2014)
argued companies that operate in high human right risk context tend to disclose more
human rights information, in order to ease community concerns on human rights violation.
Aribi and Gao (2011) argued the contents of CSR reports are influenced by religious
factors; they analyzed CSR disclosure contained in annual reports of Islamic financial
institutions and argued that CSR disclosure is a demonstration of companies abiding by
Islam principles and ethics. Furthermore, based on an interpretive textual analysis on the
environmental disclosure of a leading Finnish chemical company, Laine (2009) argued that
environmental disclosure is used as a rhetorical tool to respond to varying social and
institutional pressures to maintain legitimacy.
Prior studies provided overwhelming evidence that the disclosure of specific areas of
social or environmental disclosure is at a low level. Haque and Deegan (2010) investigated
the climate change disclosure and argued the climate change disclosure increases over
time, however is still at a low level. Besides, Ahmad and Mohamad (2014) investigated the
status quo of environmental disclosure of Malaysian construction companies and argued
the environmental disclosure in sample companies are neither complete nor comprehensive
enough and are largely confined to general non-verifiable statements. In terms of carbon
disclosure, Altintas (2013) found that the disclosure of carbon emission is limited, even
though the disclosure level is improving. Similarly, Jenkins and Yakovleva (2006) argued
even though environmental disclosure of mining companies shows an overall maturation
trend, the status quo of disclosure is far from being comparable, verifiable and uniform.
Furthermore, Gray and Milne (2002, p.4) criticized the reliability of social and
environmental reports, they stated “there is an awful lot of talk and very little action. Don't
16
believe what you read, and social and environmental accountability will remain a ‘nice
idea’.”
These findings overall suggest that CSR research in general moved towards exploring
more specific CSR disclosure such as environmental issues, human rights. However, the
quality of these specific disclosure remains low and the intentions behind these specific
disclosures are still heavily dominated by self-interests of the business.
2.3.2 Workplace diversity disclosure literatures
WDD refers in section LA12 of GRI-G4 (2015, p.68) to reporting on “composition of
governance bodies and breakdown of employees per employee category according to
gender, age group, minority group membership and other indicators of diversity”. As one
of the specific areas of CSR disclosure, workplace diversity disclosure has received
surprisingly little attention within the broader accounting and CSR literature. By now, only
a handful of studies looked into workplace diversity disclosure issues (Bernardi, Bean &
Weippert, 2002; Chatterjee & Zaman Mir, 2008; Ball et al., 2005; Holton, 2005; Jaworska,
2016). Similar with the overall CSR disclosure level found in subchapter 2.3.1, extant
literatures on WDD also suggest that the level of WDD is currently at a very low level.
Bernardi et al. (2002) is one of the early studies on WDD. They examined the disclosure of
a specific dimension of workplace diversity- gender diversity by examining annual reports
of 472 companies from the Fortune 500 list. They pointed out that companies that didn’t
disclose their board gender proportion have significantly less female directors, compared
with companies that disclosed their board gender proportion. Based on the above findings,
authors argued that compared to the companies with higher percentage of women on
boards, companies with lower percentage of women on boards are more hesitant to
disclose gender diversity information to stakeholders. Gender diveristy disclosure is also
researched by Chatterjee and Zaman Mir (2008), who explored gender diversity as one of
the corporate CSR disclosures and found the gender diversity disclosure is at a very low
level and largely descriptive in Thailand.
Research done by Ball et al. (2005) looked into disclosure of another dimension of WDD-
17
disclosure on disability diversity. They argued that the content of disability diversity policy
statements of Fortune 100 companies are too general and abstract, many of whom only
mirror the equal employment opportunity policy that is legally required, with little
exposition. As a result, readers are unable to assess the extent to which the statement is
meaningful.
Another early research on WDD is conducted by Holton (2005), which reviewed the
disclosure practice of 22 large European businesses on WD issues. Research results
indicated that with the lack of mandatory requirements, workplace diversity content is still
in the preliminary stage. Based on the research results, they argued that even though
various factors drive companies to disclose workplace diversity, the biggest driving factor
is company’s recognition of the economic benefits that workplace diversity brings.
More recently, Jaworska (2016) looked into WDD of selected companies listed on Warsaw
Stock Exchange from financial institutions and explored the trends of WDD. Research
results revealed that most of the sample companies are aware of the significance of
workplace diversity; however, range of diversity disclosure is narrow, with the main focus
being on gender diversity. Disclosure on other categories of diversity such as age,
disability, educational background and professional background is bare minimum.
It’s apparent that the research on WDD is currently very limited. Due to the insufficient
amount of studies, the above findings are far from being able to be generalised. Most
importantly, previous researches only focused on one or two elemnets (e.g. gender
diversity) and ignored other diversity elements recognised in GRI guidelines (e.g. religion,
age). In addition, it can be noted that none of the previous studies explored the quality of
WDD through a quality index and rather made qualitative statements about the quality of
such disclosure. This is partially due to the fact that nature of quality is complex, multi-
faceted, context-sensitive and subjective (Beattie, McInnes, & Fearnley, 2004). The nature
of quality has made it difficult to be measured. This research so aims to explore the nature
of WDD with its full categorization suggested mainly by GRI requirments. It also adds to
literature by developing a quality scoring system for WDD exploration. Finally, the paper
reflects on the driving force behind the observed WDD trend within impression
management framework. The research so adopts content analysis and mini-case study to
reflect on the main driving force of WDD - self-interest of business - recognised in
18
previous literature within the impression management framework.
2.4 Global Reporting Initiative (GRI) and categories of workplace diversity
disclosure
2.4.1 Global Reporting Initiative (GRI)
Global Reporting Initiative (GRI) was incepted in 1999 as an international reporting
guideline based on the opinions of a network of experts from multiple groups of
stakeholders together with the United Nations Environment Program (Moseñe et al., 2013).
It aims to define and homogenize the contents of reporting to assure and improve the
quality of disclosure (GRI, 2006, p.6). It’s the best known voluntary reporting guideline
for disclosing company social and environmental performance (Brown, de Jong, & Levy,
2009). It offers a unified standard and guideline for sustainability reporting which aims to
increase the balance, clarity, accuracy, timeliness, comparability and reliability of
sustainability reporting (Marimon, Alonso-Almeida, Rodríguez, & Cortez Alejandro,
2012). GRI standards and principles have been constantly evolving, driven by the rapid
evolution of information required by society. At present, G4 is the latest update of GRI
guideline; it was released in Oct 2016 (Global Reporting Initiative, 2017).
GRI is the only international guideline so far for WDD (GRI, 2016). GRI guidelines are
voluntary so companies are not legally bound to comply with all guidelines (Cho,
Michelon, & Patten, 2012). According to Sherman and Diguilio (2010), GRI is widely
followed by companies listed on the Fortune list in preparing CRS reports. GRI issued
specific guidelines regarding diversity and equal opportunity under social dimensions of
sustainability (GRI, 2016). According to GRI guidelines 405-1 and 2; G4-LA12, G4-LA13,
a company would disclose workplace diversity in categories of diversity management
approach, gender, age and other indicators of diversity; other indicators of diversity can
include culture and disability.
2.4.2 Categories of workplace diversity disclosure
19
Five out of seven of the disclosure categories in this study – diversity management
approach, gender diversity, age diversity, cultural diversity, disability are developed
according to GRI guidelines (please see appendix-two). These are discussed with other
relevant academic literatures in the following subchapter (subchapter 2.4.2.1 to 2.4.2.5).
The other two disclosure categories in this study - sexual orientation and WD measurement
are not specifically required GRI to be disclosed. Literature on these two disclosure
categories are also discussed in the following subchapter (subchapter 2.4.2.6 and 2.4.2.7).
2.4.2.1 Diversity Management Approach
Companies are required by GRI405-1 to disclose management approach for diversity and
equal opportunity (GRI, 2016).
Diversity management approach changes the context for diversity, and in turn influences
how diversity impacts company performance. For example, Kochan et al. (2003) found
racial diversity negatively influences company performance, however this effect reduces
under WD training and development. He argued that conditions including a competitive
context among teams worsen the negative effects of racial diversity on team performance;
at the same time, he also found evidences that under conditions when company culture
supports and enhances learning from diversity, racial diversity has positive effects on
performance. This emphasizes the importance of company culture. Companies are
recommended to implement management and human resource policies and practices that
build cultures of mutual learning. Another research was done by Dwyer, Richard and
Chadwick (2003), who found the positive relation between gender diversity and corporate
performance is influenced by variables such as organizational culture, vision and strategic
direction. Improper organizational culture, vision and strategic direction may weaken or
even reverse the positive relation between gender diversity and corporate performance.
It is generally agreed in literature that workplace diversity management policy and strategy
are still in their primary stage, lacking integration of diversity management into human
resource management strategies. Furthermore, there hasn’t been much record of success
(Kochan et al., 2003; Bierema, 2003). Kalev, Dobbin and Kelly (2006) led a research
based on reviewing 830 US companies’ data of 31 years and found most companies with
20
workplace diversity training programs still have a drop in the number of women and black
people in management positions. Additionally, Nancherla (2008) conducted interviews on
2556 senior HR executives; results show that 1/3 of diversity and inclusion (D&I)
programs provide no useful tools to underpin the training. Bierema (2003) found despite
companies’ claim of “being a diverse workplace”, they largely omit diversity issues due to
their concerns that diversity may threaten organizational well-being and effectiveness.
Given the GRI requirement of disclosing diversity management approach and the attention
it drew from extant literatures, this research includes diversity management approach as
one of the disclosure categories. Based on the review of literature, this research includes
WD current action, WD management policy, WD strategic vision, WD target and WD
culture as disclosure items under the category of WD management approach (see
Appendix two for supporting literatures).
2.4.2.2 Gender Diversity
Companies are required by GRI405-1 and G4-LA12 to disclose gender diversity. Gender
diversity has the longest history in corporate governance literature compared to other
workplace diversity dimensions (Grosser & Moon, 2005). The majority of previous studies
explored the relation between gender diversity and corporate performance and agreed on
an overall positive influence of it on corporate performance (Francoeur, Labelle &
Sinclair-Desgagne, 2008; Dwyer et al., 2003; Campbell & Minguez-Vera, 2008; Gul,
Srinidhi & Ng, 2011; Seierstad, Gabaldon & Mensi-Klarbach, 2017; Joecks, Pull & Vetter,
2013). However, researchers just started focusing on gender diversity disclosure as one
part of WDD (Fiona Doherty, 2017).
However, as a significant issue under gender diversity, gender pay is still unequal in
practice and under studied in literature. Moore and Tailby (2015) argued there haven’t
been significant changes in the pay gap between male and female. This argument is also
supported by Fiona (2017) who suggested that female accounts for half of Australia’s
workforce, but only earns 77% of male’s income. Although gender pay is an under-studied
area, GRI 405-2 specially requires companies to disclose ratio of basic salary and
remuneration of women to men.
21
In summary, gender diversity is a disclosure dimension with a long history and still
receives significant attention from the public. The positive influence brought by gender
diversity is widely agreed in literature. As a result, this research includes gender diversity
as one of the disclosure categories. Based on the two gender-related issues revealed by
prior literature and GRI requirement, this research adds both gender pay issues and gender
issues as disclosure items under the gender diversity category.
2.4.2.3 Age Diversity
GRI 405-1 and GR4-LA12 require companies to report on age groups.
Age diversity has been widely researched in management literature (Kapoor & Solomon,
2011; Schneid, Isidor, Steinmetz & Kabst, 2016; Tanikawa, Kim & Jung, 2017). People of
different age groups hold different perspectives on work; this brings potential conflicts
between generations, as well as strengths. The findings on how age diversity affects
company performance are mixed. For instance, based on results from a quantitative study
of 867 managers in Korean manufacturing firms, Tanikawa et al. (2017) found age
diversity in management team negatively impacts company performance. Such negative
impact weakens as managers’ average age increases. Wegge, Roth, Neubach, Schmidt &
Kanfer (2008) suggested that age diversity improves the team’s ability of solving complex
decision-making problems. Furthermore, Schneid et al. (2016) conducted meta-analysis on
prior literatures and found no significant relation between age diversity and workplace
performance in terms of financial performance, productivity, creativity and innovation,
with turnover being the only exception. The mixed findings on the impacts of age diversity
indicate age diversity brings complex influences; companies need to implement proper
policies and strategies to maximize the benefits and minimize the issues brought by age
diversity. Companies are recommended to adopt new strategies that identify characteristics
of each age group and adapt work environment to maximize productivity of every
generation (Kapoor & Solomon, 2011; Mahon & Millar, 2014).
Age diversity is a contemporary issue faced by all companies, as the number of aged
employees is increasing and the amount of younger employees is decreasing, due to low
22
fertility rate and the development of healthcare systems (Schneid et al., 2016; Boehm,
Kunze & Bruch, 2014). This makes age diversity a dimension of increasing importance.
Given its significance as a contemporary issue and GRI requirement, age diversity is
included in this research as one of the disclosure categories. Age diversity in corporate
governance bodies and by employee categories are included in this research as the two
disclosure items under category of age diversity.
2.4.2.4 Cultural diversity
Cultural diversity is included as one of the “other indicators of diversity” in GRI and
required to be disclosed (GRI, 2016). However, it has significant contemporary importance.
Cultural diversity refers to demographic variables including nationality, ethnicity, race,
religion, and social class (Ely & Thomas, 2001). The effects of cultural diversity on
company performance are mixed. While some studies reported on the conflicts caused by
culture diversity (Rao, 2012; Kochan et al., 2003), others reported a positive relation
between cultural diversity and company performance, including generating ideas of higher
quality (Mcleod, Lobel, & Taylor H. Cox, 1996) and enhancing productivity (Bellini,
Ottaviano, Pinelli & Prarole, 2013; Kochan et al., 2003).
Given the trend toward globalization, companies, especially global companies, have
increasing volumes of employees from diverse cultural backgrounds; it is important that a
company has a right policy on culture diversity and communicates its cultural diversity
performance under workplace diversity disclosure. As a result, cultural diversity is
included in this research as one of the categories; cultural diversity in corporate
governance bodies and by employee categories are included in this research as the two
disclosure items under category of cultural diversity.
2.4.2.5 Disability diversity
Disability diversity is included as one of the “other indicators of diversity” in GRI and
required by GRI to be disclosed. Disability diversity refers to the workforce with mental or
physical disability. It is a diversity dimension that has been largely neglected in literature
and company diversity practice (Ball et al., 2005).
23
Among the few papers on disability diversity, Ball et al., (2005) conducted content
analysis on Fortune 100 companies in 2003 and found that around 58% of Fortune 100
companies in 2003 exclude people with physical disabilities from their definition of a
diverse workforce. Furthermore, among the companies that didn’t exclude disability in the
definition of a diverse workforce, more than half tend to neither explicitly include nor
exclude people with disabilities in their standard equal opportunity or diversity statement.
This means companies don’t report further commitments to employing people with
disabilities. Disclosure about minority groups as a whole is normally followed by a
detailed discussion only on women and cultural minorities. This means even though
companies’ diversity policy and vision statement look inclusive, people with disabilities
are not the focus of diversity promotion.
Disability diversity is becoming increasingly important (Boehm & Dwertmann, 2015).
This is mainly because disability diversity is often intersected with age diversity; many
employees develop disabilities as they get older. However, as older employees are
encouraged to stay in the workforce (Altmann, 2015), the significance of disability
diversity disclosure is increasing. As a result, disability diversity is included as one
diversity category in this research. Disability diversity in corporate governance bodies and
by employee categories are included in this research as disclosure items under category of
cultural diversity.
2.4.2.6 Sexual-orientation diversity
Sexual orientation diversity is not specifically required by GRI to be disclosed. Sexual
orientation is a relatively new diversity dimension- an extension of gender diversity-
however with significant importance (Day & Greene, 2008). More and more organizations
start to realize the visible impacts of sexual orientation diversity on work attitude and
productivity (Williamson, Beiler-may, Locklear, & Clark, 2017). With the recognition of
the impacts of sexual orientation diversity, increasing numbers of companies start to
include lesbian, gay, bisexual and transgender (thereafter, LGBT) employees in their non-
discrimination policy and diversity training program (Williamson et al., 2017; Kersley et
al., 2006). The research done in the context of Britain looked into the improvement of
sexual orientation diversity and found that percentage of British companies that have
24
sexual orientation in their written diversity policy has increased from 56% in 1998 to 71%
in 2006 (Kersley et al., 2006). It’s commonly agreed in literature that sexual-orientation
diversity helps improve employee performance and company performance. For example,
Wright, Colan, Creegany & McKearney (2006) argued that an inclusive and comfortable
working environment aids companies attracting and retaining LGBT talents. Similarly,
Williamson et al. (2017) conducted a research on 89 same-sex couples and found that there
is a positive relation between sexual orientation disclosure at work and employee’s work-
life outcome.
However, despite the overall improving trend and the revealed positive influence,
discrimination against LGBT employees widely exist (Badgett, 2003). On the other hand,
global companies, such as companies on Fortune list, are more likely to accept LGBT
employees and are more diverse in sexual orientation, compared to smaller companies that
are considered to be uncertain and worried about the potential risks brought by sexual
orientation diversity (Day & Greene, 2008). Thus, it is interesting to investigate how
Fortune 100 companies are disclosing on LGBT diversity issues. As a result, sexual-
orientation diversity is included as one of the diversity categories in this research. Sexual-
orientation diversity in corporate governance bodies and by employee categories are
included in this research as the two disclosure items under category of sexual-orientation
diversity.
2.4.2.7 Workplace diversity measurement
WD measurement is an essential tool for companies to ensure workplace diversity
management is on track and making progress (McAllister, 1997). Even though many
companies nowadays have WD policies and programs in place, measurement on the
effectiveness of their WD policy and programs is lacking. This argument is supported by
the research finding of Nancherla (2008), who found ¼ of WD programs don’t have
systems to measure their effectiveness, based on interviews on over two thousand senior
HR executives.
Macdougall et al. (2017) emphasized on the importance for companies to disclose WD
measurement and called for more disclosure in this respect. Performance indicators are
25
utilized to measure WD. GRI3- part 2 (page 5) requires companies to disclose on
performance indicators that “elicit comparable information on the economic,
environmental, and social performance of the organization”. WD long-term progress is
suggested by extant studies as a performance indicator of the effectiveness of WD
management approach (Macdougall et al., 2017); besides, diversity leadership at senior
level, staff feedback on WD and diversity award/recognition are argued by literature as
indicators of WD performance (Macdougall et al., 2017). As a result, these four indicators
are developed as disclosure items under the category of WD measurement.
Furthermore, the poor WD performance recorded by prior studies makes WD
measurement an important issue. Extant studies have found the workplace is far from
being diverse and inclusive (Syed, 2007; Hopper & Salvaggio, 2008). Syed (2007)
suggested employees who are non-English speakers suffer higher unemployment rate,
lower pay and more barriers in promotion compared to Anglo-Australians. Besides, in
regards to gender diversity, the research conducted by Hopper and Salvaggio (2008)
demonstrated in spite of the progress that companies made on workplace diversity
management, gender barrier exists widely in workplace. In addition, De Pater, Van Vianen
& Bechtoldt (2010) found male employees are more possible to be assigned challenging
work compared to female employees, although they equally desire for challenging work.
Given the recorded poor workplace diversity performance, it is highly possible that
workplace diversity performance of Fortune 100 companies is also at a low level and has
various issues.
Based on the recorded importance of WD measurement and the fact that the recorded poor
WD performance calls for better measurement, WD measurement is included as one of the
categories in this study. Based on review of literature, WD long-term progress (year on
year), diversity leadership at senior level and staff feedback are included in this research as
the disclosure items under category of WD measurement.
2.5 Theoretical framework of the research- impression management theory
This research is informed by impression management theory. Impression management is
defined as efforts made by an actor (a natural person or an organization) through
26
information dissemination to generate, maintain or alter the impression held by others,
such as a target audience group (Bozeman & Kacmar, 1997). The phenomenon of
impression management was originally introduced and conceptualized by Goffman (1959)
within his dramaturgical model of social life in 1959. Goffman referred the people in
social interaction as “actors”, who behave and express themselves with the aim of
controlling the identity they portray. During the past decades, Goffman’s impression
management framework has been widely applied (Spear & Roper, 2013; Diouf & Boiral,
2017).
Impression management has been researched at both individual level and organisational
level. Compared to impression management studies at individual level, organisational
impression management studies are limited. One example is the research conducted by
Ball et al. (2005), which argued large global companies participate in philanthropic
activities in diverse communities in order to build on the public perception that they are
committed to diversity.
In CSR disclosure, impression management refers to companies’ attempt to shape the
impression of stakeholders by disclosing selective positive information or providing
disclosure without talking about the “truth” or “falsity” of these disclosures (Neu,
Warsame, & Pedwell, 1998). In CSR disclosure literature, impression management theory
has been used to argue disclosure as a business case (Spear & Roper, 2013; Sandberg &
Holmlund, 2015; Islam, Haque & Roberts, 2017; Tata & Prasad, 2015; Hooghiemstra,
2000). The main argument is that companies use disclosure strategies to provide good and
positive impressions to their stakeholders (Haque & Deegan, 2010; Hooghiemstra, 2000).
For example, Syed and Kramar (2009) suggested that companies use impression
management tactics when preparing sustainability reporting, in order to shape the
impression held by stakeholders and to obfuscate negative outcomes. In addition, Boateng
(2016) noted impression management as a fundamental motivating factor behind CSR
disclosure in the telecommunication industry in Ghana, with large amounts of managers
aiming for disclosing all positive information about the company to make an impression.
Neu et al. (1998) argued companies mediate environmental disclosure to shape the way
stakeholders know and feel about company performance; as a result, company disclosure
doesn’t reflect the actual performance.
27
Within the impression management framework, the extent, content and quality of WDD
are expected to be a reflection of an opportunistic behaviour that leads to a positive image
of the company to its stakeholders (Diouf & Boral, 2017; Kalev, Dobbin & Kelly, 2006).
Diouf and Boiral (2017) found there are discrepancies between the principles requested by
guidelines such as GRI and the actual quality of sustainability reports. Based on this
finding, they indicated sustainability reports are utilised as a tool to influence and distort
stakeholders’ perception. Similarly, some of the diversity strategies, such as
antidiscrimination measures, are argued by researchers to be “window dressing”, whose
fundamental purpose is not to enhance diversity (Kalev et al., 2006). Following Diouf and
Boiral’s study in 2017, we so use impression management framework to explore whether
the extent, content and quality of current WDD practice represent impression management
strategies of Fortune 100 companies.
In the next chapter, methods of the research are discussed.
28
3. Research Design
This chapter discusses the methods and processes undertaken in this research. To
investigate WDD practice of global companies, this research analyses standalone CSR
reports of Fortune 100 companies for year 2016. A multi-method approach is employed in
this research. A content analysis of CSR reports supplemented with mini-case studies of
five companies was undertaken.
3.1 Sample Selection
The sample of the research are Fortune 100 companies. A list of Fortune 100 companies
is presented in Appendix one. They are chosen due to three reasons. Firstly, Fortune 100
companies are considered by prior researchers to be most likely to have sufficient
resources to prepare social and environmental disclosure, including workplace diversity
disclosure (Mosene et al., 2013; Tagesson, Blank, Broberg & Collin, 2009; Brammer &
Pavelin, 2008; Perry & Bodkin, 2000). They are considered in this research as
representative global companies, assumed to have good workplace diversity performance
as well as disclosure in the industries that they are in. Secondly, Fortune 100 companies
are mostly multinational companies (Johnson, Connolly, & Carter, 2011); this is
consistent with the aim of this research to explore WDD of global companies. Moreover,
as the most profitable companies in the USA, their significant influences on global
economy make it valuable to explore their WDD status quo (Johnson et al., 2011).
Standalone CSR reports for year 2016 of sample companies are chosen in this research,
because literature suggests that these are widely published by large US firms to disclose
social & environmental issues, including diversity issues (Moseñe et al., 2013). Besides,
even though companies use multiple channels to disclose social-related issues including
workplace diversity issues, such as social media and annual reports, standalone CSR
reports present more extensive and reliable disclosures (Ahmad & Mohamad, 2014).
The samples are selected in the following manner. Firstly, top 100 companies listed by
Fortune magazine in FY2016 are identified. Secondly, standalone CSR reports of these
29
companies for fiscal year 2016 are searched and downloaded from Bloomberg software.
Since there are missing reports, the final sample includes 57 of FY2016 CSR reports.
Content analysis methods including preparing a categorization scheme, disclosure index
and measurement scale are done in analyzing sample data to explore WDD made in
standalone CSR reports by sample companies in 2016.
3.2 Research method
3.2.1 Overview of research methods: content analysis and case study
This research uses two main research methods: content analysis and case study.
Content analysis is a widely used research method that “involves codifying qualitative and
quantitative information into predefined categories in order to derive patterns in the
presentation and reporting of information” (Guthrie & Abeysekera, 2006a). Content
analysis is the dominant method employed in the area of social environmental disclosure
(Parker, 2005). Its validity in exploring CSR disclosure has been proved by various prior
studies (McPhail & Adams, 2016; Mosene et al., 2013; Hooks & Van Staden, 2011; Sen,
Mukherjee & Pattanayak, 2011; Aribi & Gao, 2011; Haque & Deegan, 2010; Guthrie &
Abeysekera, 2006; Beattie et al., 2004). Content analysis can be broadly divided into two
categories: extent-based and content-based analysis. Extent-based analysis quantifies the
extent of reporting and only looks at the amount of the information disclosed, without
concerning about the meaning of disclosure (Hooks & van Staden, 2011). On the other
hand, content-based analysis investigates the meaning of disclosure and aims to distinguish
between good and poor disclosure of items (Hooks & van Staden, 2011). It largely
evaluates the quality of disclosure by applying a scoring system onto a quality index. Pure
volume investigation on disclosure is insufficient to reflect objective disclosure status and
can be misleading (Hooks & van Staden, 2011). As a result, this research utilizes both
extent-based and content-based content analysis methods. Extent-based content analysis is
conducted to explore the extent of workplace diversity disclosure in 2016 CSR reports of
Fortune 100 companies (research question 1). Content-based content analysis is conducted
30
to explore the content and quality of workplace diversity disclosure in 2016 CSR reports of
Fortune 100 companies (research question 2 and 3).
On the other hand, it is also suggested by literature to combine content analysis method
with other research methods such as case study, to provide a more robust empirical
understanding of social and environmental disclosure (Parker, 2005). This research uses
content analysis and case study method together to provide an in-depth understanding of
WDD in references to the impression management framework- a core argument depicted
in previous literature under the business case motivation of CSR. This ultimately
answers research question 4.
3.2.2 Content analysis
3.2.2.1 Development of category scheme and disclosure index
An essential step in content analysis is selecting disclosure items properly (Hooks & Van
Staden, 2011; Islam, 2015; Haque & Deegan, 2010). Disclosure items are selected by
developing a categorization scheme followed by a disclosure index, following Hooks and
Van Staden (2011). A disclosure index is defined as a research tool comprising a series
of pre-selected items that indicates a level of disclosure when scored (Guthrie &
Abeysekera, 2006a). Because there are no existing disclosure categorization schemes and
indexes of WDD (other than the disclosure dimensions suggested by GRI) for this
research to refer to, this research so develops a categorization scheme and disclosure
index based on a review of prior literatures and GRI requirements (see subchapter 2-
Literature review). Appendix two provides the categorization scheme and disclosure
items of WDD undertaken for this study.
Disclosure categorization scheme broadly covers the following seven categories:
WD management approach
Gender diversity
Age diversity
Cultural diversity
31
Disability diversity
Sexual-orientation diversity
WD measurement
In sum, 22 specific disclosure items under the above seven categories are developed. This
disclosure index is used in all extent, content and quality exploration of this research.
Among the 22 disclosure indexes, 20 indexes except two- veteran and diversity
award/recognition are developed based on the review of previous literature and GRI. A
pilot test in five randomly chosen companies is done for the 20 indexes to make sure the
categories and disclosure items fit this research. Besides, two additional items are
identified and added into our existing disclosure items based on the pilot study- veteran
and diversity award/recognition. Reason is that visible amount of sample companies
disclose on veteran and diversity award/recognition, even though it is neither emphasized
by prior literatures nor required by GRI to be disclosed.
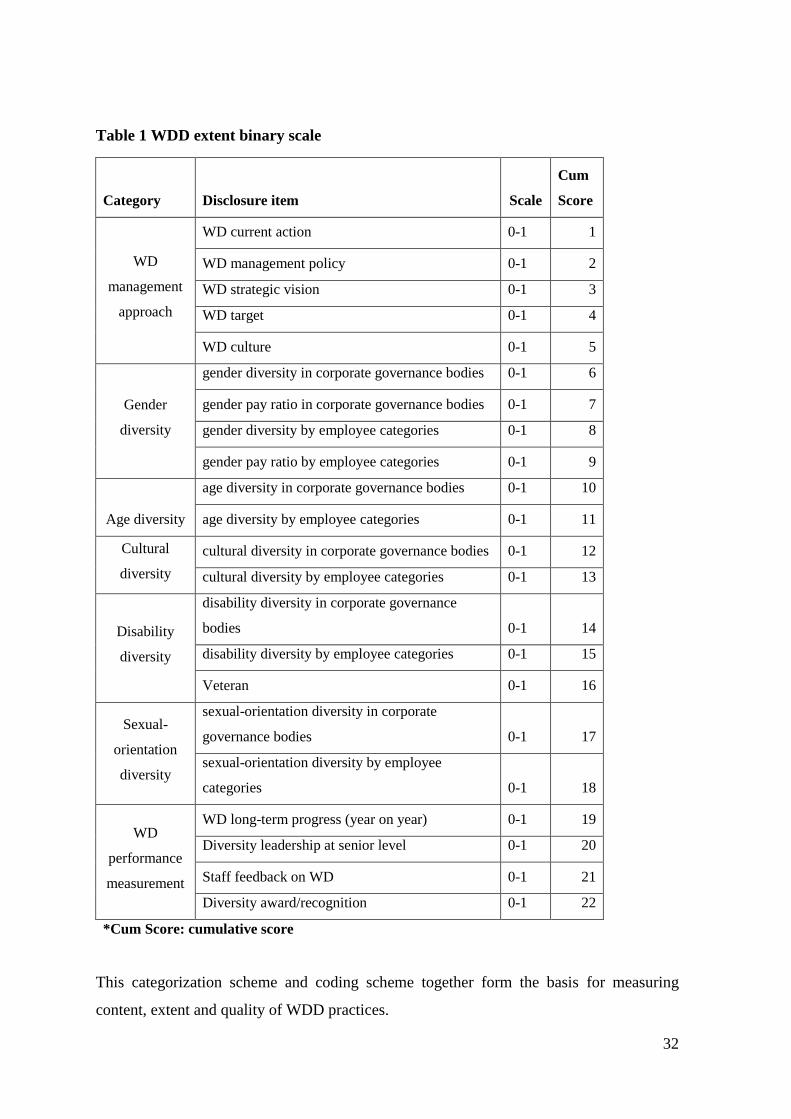
3.2.2.2 Coding workplace diversity disclosure items
Following Hooks and Staden (2011), the next step is to go through disclosure of sample
companies and code the disclosure to the disclosure item where it belongs. In order to
collect data, 2016 CSR report is reviewed sentence by sentence for each sample company.
This process has been done repeatedly to diminish the possibility of missing relevant
disclosure and keep errors to the minimum level. Around 3% variances are found when
reading reports for the second time and corrected. Around 0.5% variances are found when
reading reports for the third time, which is thought to be acceptable.
The combined use of binary scaling system and disclosure index provides an aggregated
measure of the coded disclosure (Guthrie & Abeysekera, 2006a). A 2-point scale,
following Hooks & Staden (2011) and Tooley & Guthrie (2007) has been used. Companies
get 1 mark for disclosing on the item and 0 if they don’t. The highest score a company gets
when disclosing all the 22 index items is 22. Table 1 shows the disclosure items and the
scale adopted.
32
Table 1 WDD extent binary scale
Category Disclosure item Scale
Cum
Score
WD
management
approach
WD current action 0-1 1
WD management policy 0-1 2
WD strategic vision 0-1 3
WD target 0-1 4
WD culture 0-1 5
Gender
diversity
gender diversity in corporate governance bodies 0-1 6
gender pay ratio in corporate governance bodies 0-1 7
gender diversity by employee categories 0-1 8
gender pay ratio by employee categories 0-1 9
Age diversity
age diversity in corporate governance bodies 0-1 10
age diversity by employee categories 0-1 11
Cultural
diversity
cultural diversity in corporate governance bodies 0-1 12
cultural diversity by employee categories 0-1 13
Disability
diversity
disability diversity in corporate governance
bodies 0-1 14
disability diversity by employee categories 0-1 15
Veteran 0-1 16
Sexual-
orientation
diversity
sexual-orientation diversity in corporate
governance bodies 0-1 17
sexual-orientation diversity by employee
categories 0-1 18
WD
performance
measurement
WD long-term progress (year on year) 0-1 19
Diversity leadership at senior level 0-1 20
Staff feedback on WD 0-1 21
Diversity award/recognition 0-1 22
*Cum Score: cumulative score
This categorization scheme and coding scheme together form the basis for measuring
content, extent and quality of WDD practices.
33
3.2.2.3 Measuring the extent and content of workplace diversity disclosure
For the purpose of measuring the extent and content of workplace diversity disclosure, this
research looks at what disclosure items are disclosed and what are not. It also measures the
number of disclosure items reported by each company. In the end, the total scores are
calculated for each disclosure item and each company to reflect on the extent and content
of disclosure. An excerpt from sample reports is picked as representative disclosure for
each item. A table of representative disclosure content is attached in appendix four. The
exploration of extent and content provides an overall status of WDD practice. However,
measuring the extent and content of disclosure is insufficient to reflect on the complete and
detailed status of disclosure (Hooks & van Staden, 2011). A more complex analysis
consisting all extent, content and quality measurement is deemed to be compulsory (Hooks
& van Staden, 2011). This research measures quality in addition to extent and content of
WDD practice of Fortune 100 companies. Development of the disclosure quality
measurement system is described in the next subchapter.
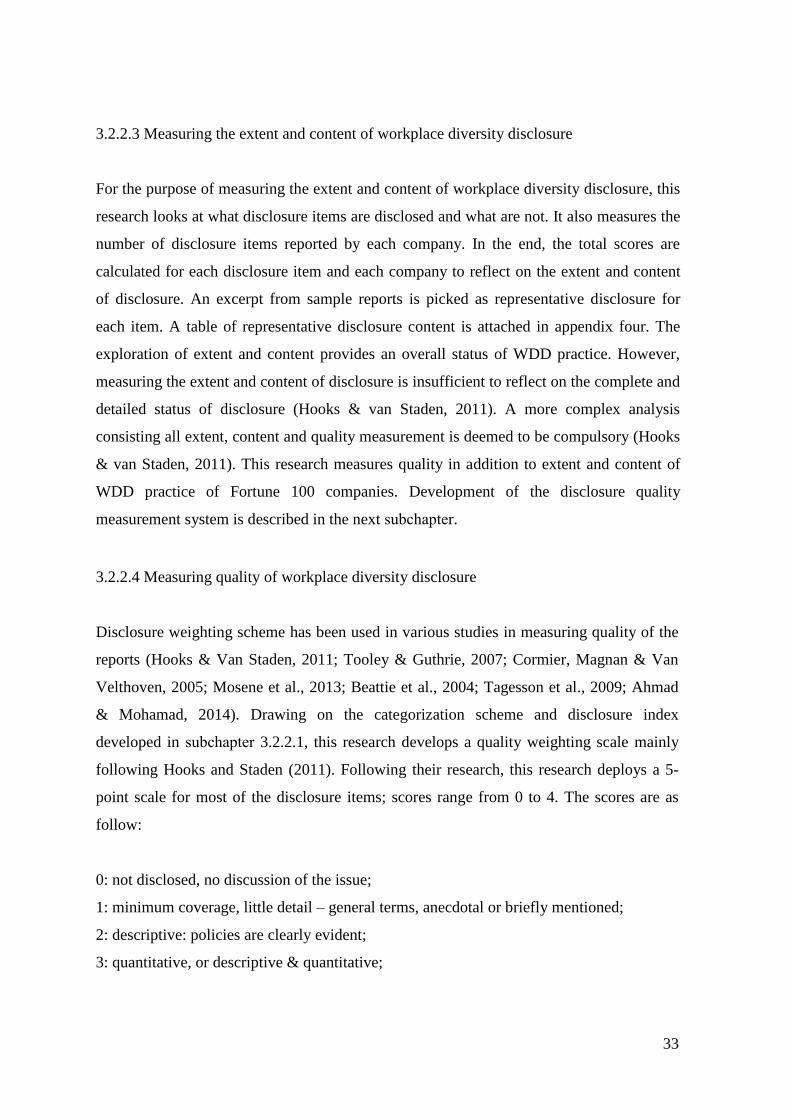
3.2.2.4 Measuring quality of workplace diversity disclosure
Disclosure weighting scheme has been used in various studies in measuring quality of the
reports (Hooks & Van Staden, 2011; Tooley & Guthrie, 2007; Cormier, Magnan & Van
Velthoven, 2005; Mosene et al., 2013; Beattie et al., 2004; Tagesson et al., 2009; Ahmad
& Mohamad, 2014). Drawing on the categorization scheme and disclosure index
developed in subchapter 3.2.2.1, this research develops a quality weighting scale mainly
following Hooks and Staden (2011). Following their research, this research deploys a 5-
point scale for most of the disclosure items; scores range from 0 to 4. The scores are as
follow:
0: not disclosed, no discussion of the issue;
1: minimum coverage, little detail – general terms, anecdotal or briefly mentioned;
2: descriptive: policies are clearly evident;
3: quantitative, or descriptive & quantitative;
34
4: truly extraordinary, benchmarking against best practice. Includes evidence of targets,
previous years and benchmarking against best practice.
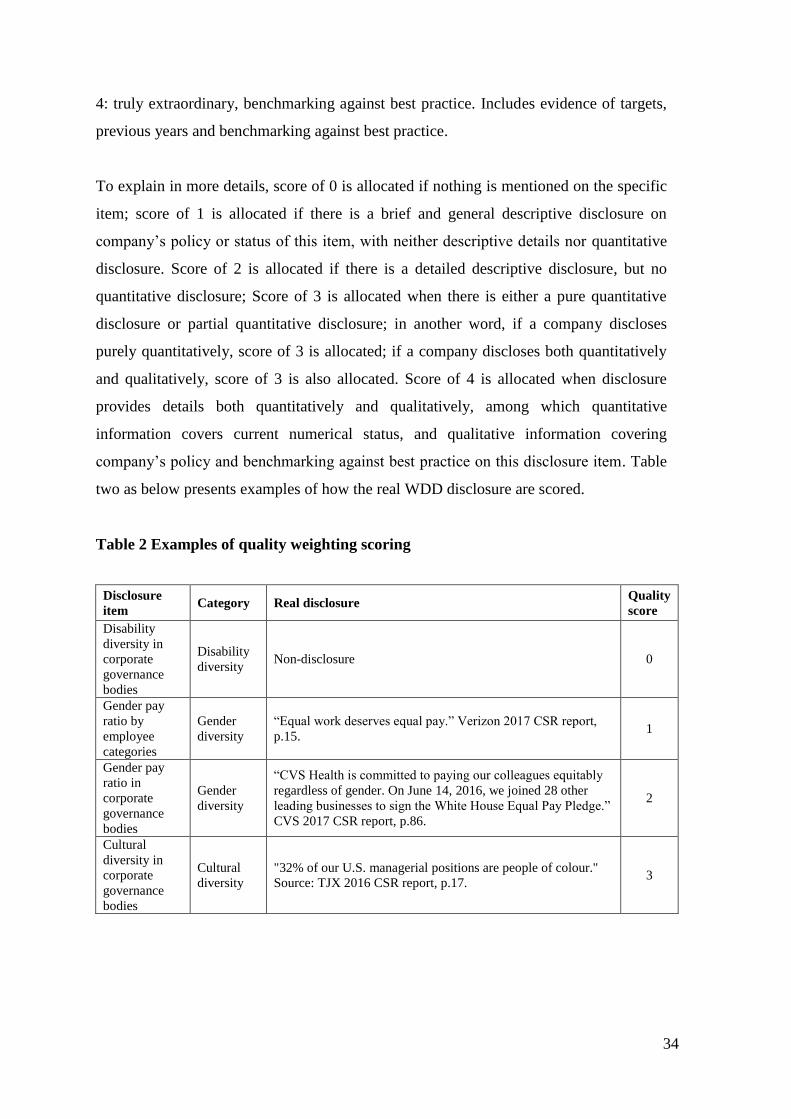
To explain in more details, score of 0 is allocated if nothing is mentioned on the specific
item; score of 1 is allocated if there is a brief and general descriptive disclosure on
company’s policy or status of this item, with neither descriptive details nor quantitative
disclosure. Score of 2 is allocated if there is a detailed descriptive disclosure, but no
quantitative disclosure; Score of 3 is allocated when there is either a pure quantitative
disclosure or partial quantitative disclosure; in another word, if a company discloses
purely quantitatively, score of 3 is allocated; if a company discloses both quantitatively
and qualitatively, score of 3 is also allocated. Score of 4 is allocated when disclosure
provides details both quantitatively and qualitatively, among which quantitative
information covers current numerical status, and qualitative information covering
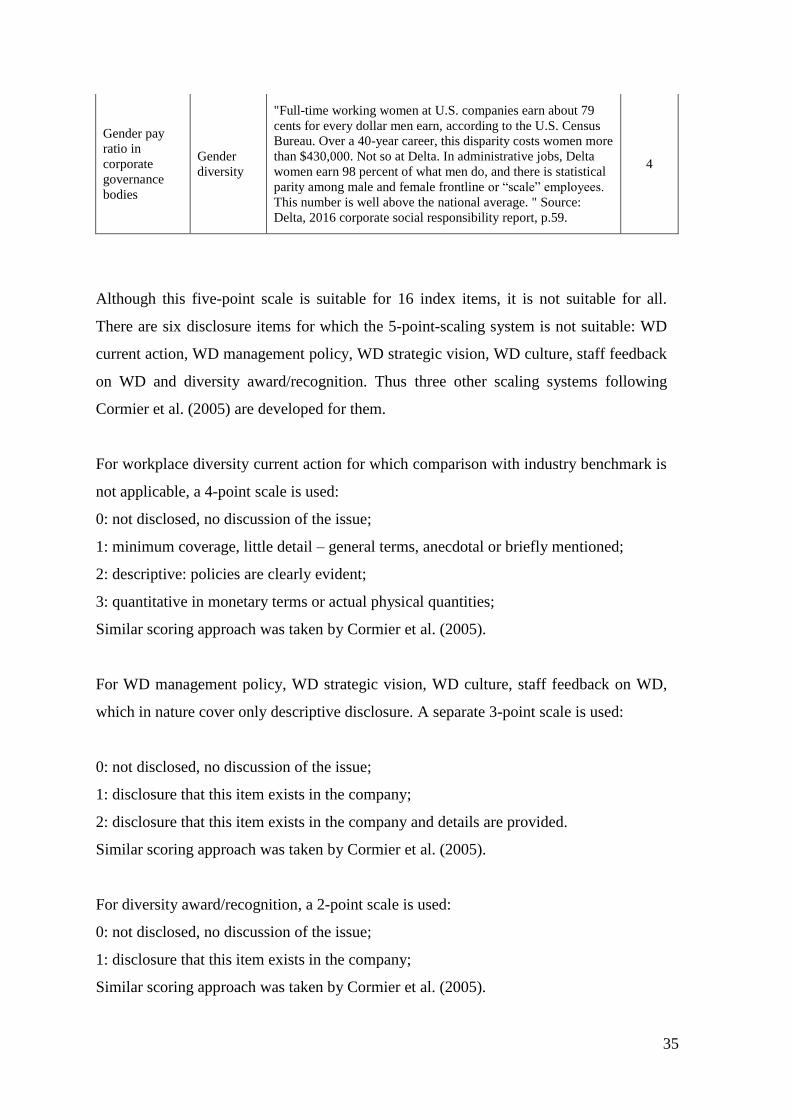
company’s policy and benchmarking against best practice on this disclosure item. Table
two as below presents examples of how the real WDD disclosure are scored.
Table 2 Examples of quality weighting scoring
Disclosure
item Category Real disclosure
Quality
score
Disability
diversity in
corporate
governance
bodies
Disability
diversity Non-disclosure 0
Gender pay
ratio by
employee
categories
Gender
diversity
“Equal work deserves equal pay.” Verizon 2017 CSR report,
p.15. 1
Gender pay
ratio in
corporate
governance
bodies
Gender
diversity
“CVS Health is committed to paying our colleagues equitably
regardless of gender. On June 14, 2016, we joined 28 other
leading businesses to sign the White House Equal Pay Pledge.”
CVS 2017 CSR report, p.86.
2
Cultural
diversity in
corporate
governance
bodies
Cultural
diversity
"32% of our U.S. managerial positions are people of colour."
Source: TJX 2016 CSR report, p.17. 3
35
Gender pay
ratio in
corporate
governance
bodies
Gender
diversity
"Full-time working women at U.S. companies earn about 79
cents for every dollar men earn, according to the U.S. Census
Bureau. Over a 40-year career, this disparity costs women more
than $430,000. Not so at Delta. In administrative jobs, Delta
women earn 98 percent of what men do, and there is statistical
parity among male and female frontline or “scale” employees.
This number is well above the national average. " Source:
Delta, 2016 corporate social responsibility report, p.59.
4
Although this five-point scale is suitable for 16 index items, it is not suitable for all.
There are six disclosure items for which the 5-point-scaling system is not suitable: WD
current action, WD management policy, WD strategic vision, WD culture, staff feedback
on WD and diversity award/recognition. Thus three other scaling systems following
Cormier et al. (2005) are developed for them.
For workplace diversity current action for which comparison with industry benchmark is
not applicable, a 4-point scale is used:
0: not disclosed, no discussion of the issue;
1: minimum coverage, little detail – general terms, anecdotal or briefly mentioned;
2: descriptive: policies are clearly evident;
3: quantitative in monetary terms or actual physical quantities;
Similar scoring approach was taken by Cormier et al. (2005).
For WD management policy, WD strategic vision, WD culture, staff feedback on WD,
which in nature cover only descriptive disclosure. A separate 3-point scale is used:
0: not disclosed, no discussion of the issue;
1: disclosure that this item exists in the company;
2: disclosure that this item exists in the company and details are provided.
Similar scoring approach was taken by Cormier et al. (2005).
For diversity award/recognition, a 2-point scale is used:
0: not disclosed, no discussion of the issue;
1: disclosure that this item exists in the company;
Similar scoring approach was taken by Cormier et al. (2005).
36
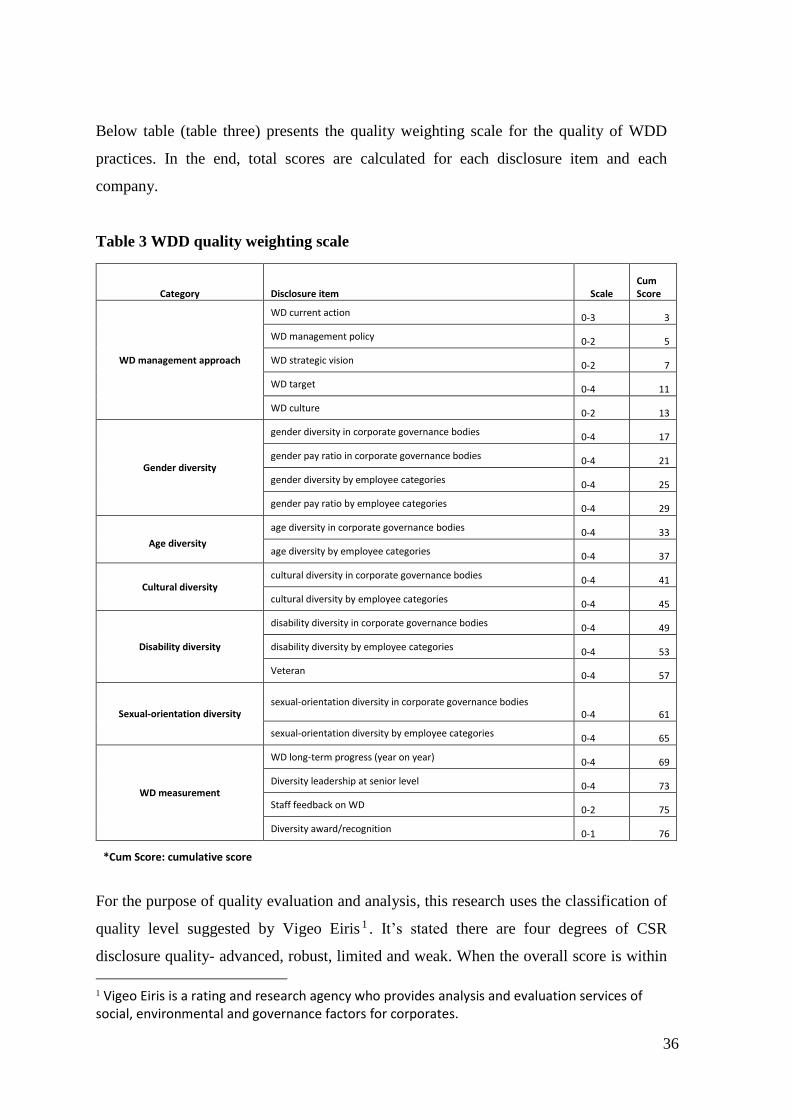
Below table (table three) presents the quality weighting scale for the quality of WDD
practices. In the end, total scores are calculated for each disclosure item and each
company.
Table 3 WDD quality weighting scale
Category Disclosure item Scale Cum Score
WD management approach
WD current action 0-3 3
WD management policy 0-2 5
WD strategic vision 0-2 7
WD target 0-4 11
WD culture 0-2 13
Gender diversity
gender diversity in corporate governance bodies 0-4 17
gender pay ratio in corporate governance bodies 0-4 21
gender diversity by employee categories 0-4 25
gender pay ratio by employee categories 0-4 29
Age diversity
age diversity in corporate governance bodies 0-4 33
age diversity by employee categories 0-4 37
Cultural diversity cultural diversity in corporate governance bodies 0-4 41
cultural diversity by employee categories 0-4 45
Disability diversity
disability diversity in corporate governance bodies 0-4 49
disability diversity by employee categories 0-4 53
Veteran 0-4 57
Sexual-orientation diversity sexual-orientation diversity in corporate governance bodies
0-4 61
sexual-orientation diversity by employee categories 0-4 65
WD measurement
WD long-term progress (year on year) 0-4 69
Diversity leadership at senior level 0-4 73
Staff feedback on WD 0-2 75
Diversity award/recognition 0-1 76
*Cum Score: cumulative score
For the purpose of quality evaluation and analysis, this research uses the classification of
quality level suggested by Vigeo Eiris 1 . It’s stated there are four degrees of CSR
disclosure quality- advanced, robust, limited and weak. When the overall score is within
1 Vigeo Eiris is a rating and research agency who provides analysis and evaluation services of social, environmental and governance factors for corporates.
37
range of 60 to 100, quality is considered as advanced; when within range of 50-59,
quality is considered as robust; when within range of 30-49, quality is considered as
limited; and when within range of 0 to 29, quality is considered as weak. WDD quality
scores are analysed according to the above quality level classification.
3.2.3 Case study method
It’s recommended by literature to combine content analysis with other research methods
to provide a richer and deeper empirical understanding of company reporting (Guthrie &
Abeysekera, 2006a). In the end, five companies with the highest quality scores are
chosen for further study. Case study method has been extensively used in prior social
accounting research (Laine, 2009; Adams, 2004; Lauwo & Otusanya, 2014).
This case study on five companies with top disclosure quality is done in order to provide
a deeper understanding on the issues raised by the content analysis. We choose five
companies with the highest quality scores because they are significant individual cases
and are the representative best workplace diversity disclosers. This approach is
consistent with prior researcher’s suggestion that the choice of cases should focus on
significant individual cases which are either unusual or of general public interest or are
issues of national importance, either in theoretical, policy or practical items (Seawright
& Gerring, 2008).
Reports of five top disclosure companies are then qualitatively reviewed, through the
lens of impression management, at a detailed level. In addition to CSR reports, all the
other available information about the five case companies are also taken into account to
provide evidences in impression management explanations. We understand that case
study method requires a greater amount of resources (e.g. time) and checking multiple
data sources to construct in-depth understandings of the phenomena within the chosen
cases, however for time and resource constraints we are only able to manage minimal
additional data for five top-most WDD practicers from our sample companies. This we
refer as one limitation of the study.
38
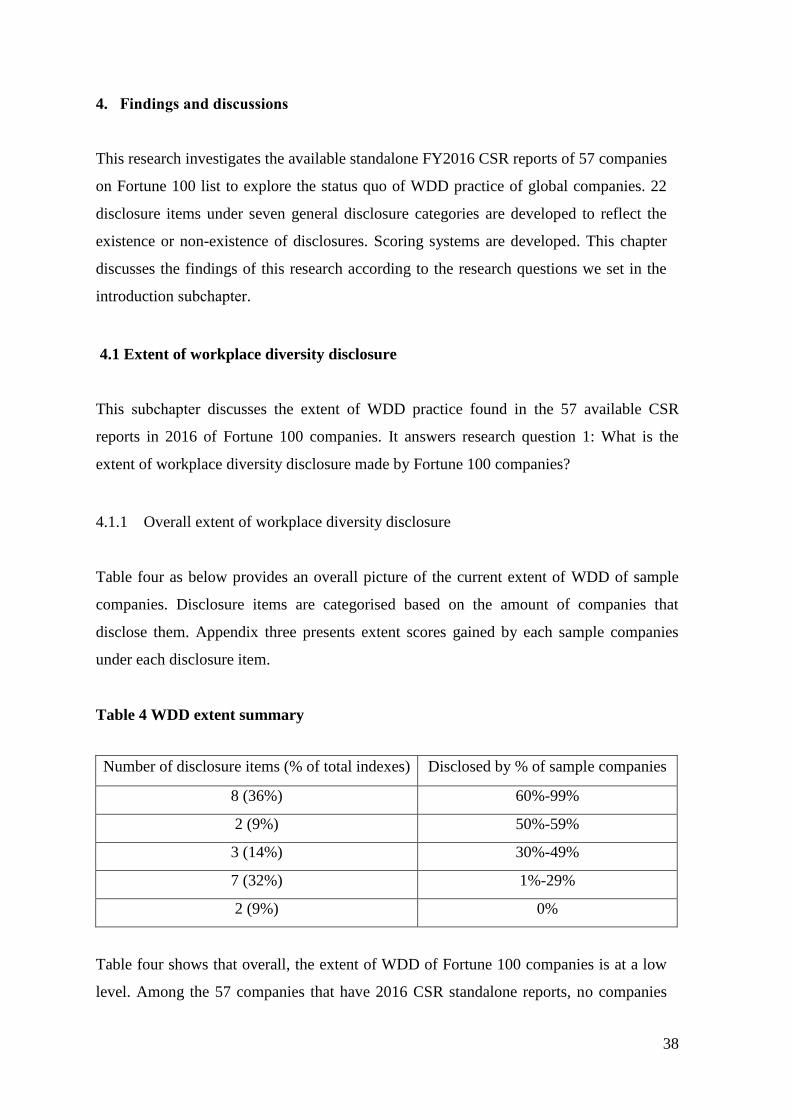
4. Findings and discussions
This research investigates the available standalone FY2016 CSR reports of 57 companies
on Fortune 100 list to explore the status quo of WDD practice of global companies. 22
disclosure items under seven general disclosure categories are developed to reflect the
existence or non-existence of disclosures. Scoring systems are developed. This chapter
discusses the findings of this research according to the research questions we set in the
introduction subchapter.
4.1 Extent of workplace diversity disclosure
This subchapter discusses the extent of WDD practice found in the 57 available CSR
reports in 2016 of Fortune 100 companies. It answers research question 1: What is the
extent of workplace diversity disclosure made by Fortune 100 companies?
4.1.1 Overall extent of workplace diversity disclosure
Table four as below provides an overall picture of the current extent of WDD of sample
companies. Disclosure items are categorised based on the amount of companies that
disclose them. Appendix three presents extent scores gained by each sample companies
under each disclosure item.
Table 4 WDD extent summary
Number of disclosure items (% of total indexes) Disclosed by % of sample companies
8 (36%) 60%-99%
2 (9%) 50%-59%
3 (14%) 30%-49%
7 (32%) 1%-29%
2 (9%) 0%
Table four shows that overall, the extent of WDD of Fortune 100 companies is at a low
level. Among the 57 companies that have 2016 CSR standalone reports, no companies
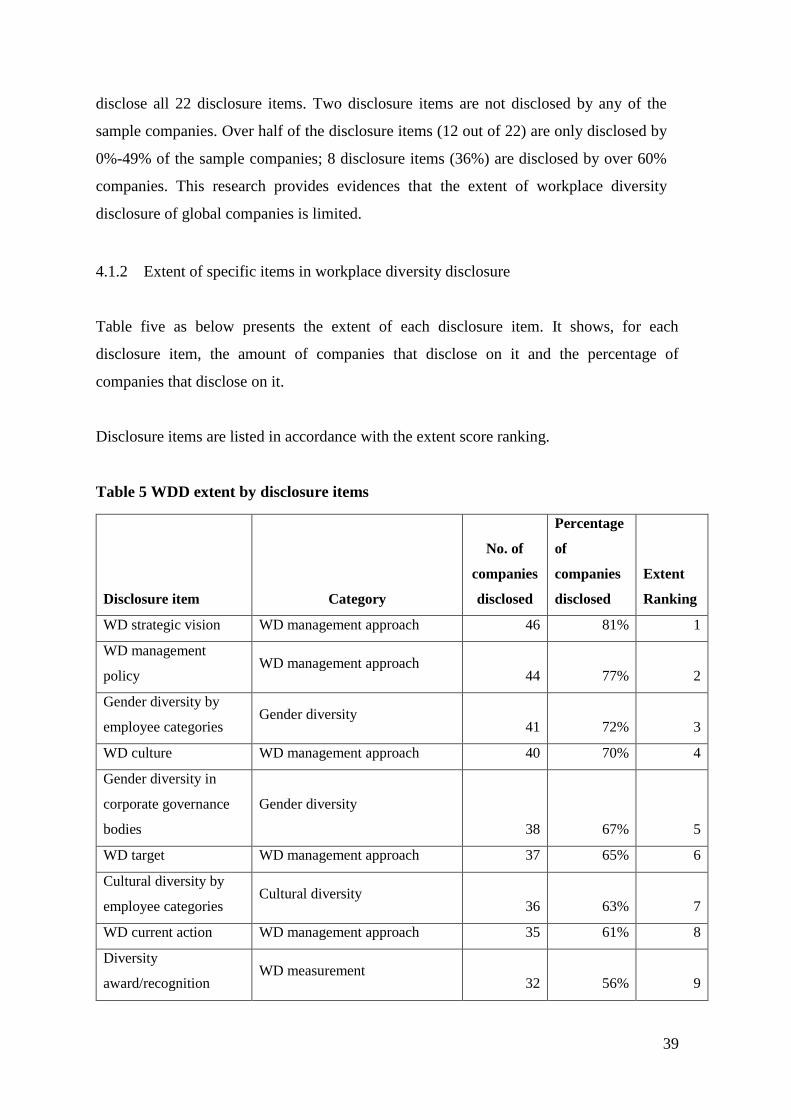
39
disclose all 22 disclosure items. Two disclosure items are not disclosed by any of the
sample companies. Over half of the disclosure items (12 out of 22) are only disclosed by
0%-49% of the sample companies; 8 disclosure items (36%) are disclosed by over 60%
companies. This research provides evidences that the extent of workplace diversity
disclosure of global companies is limited.
4.1.2 Extent of specific items in workplace diversity disclosure
Table five as below presents the extent of each disclosure item. It shows, for each
disclosure item, the amount of companies that disclose on it and the percentage of
companies that disclose on it.
Disclosure items are listed in accordance with the extent score ranking.
Table 5 WDD extent by disclosure items
Disclosure item Category
No. of
companies
disclosed
Percentage
of
companies
disclosed
Extent
Ranking
WD strategic vision WD management approach 46 81% 1
WD management
policy WD management approach
44 77% 2
Gender diversity by
employee categories Gender diversity
41 72% 3
WD culture WD management approach 40 70% 4
Gender diversity in
corporate governance
bodies
Gender diversity
38 67% 5
WD target WD management approach 37 65% 6
Cultural diversity by
employee categories Cultural diversity
36 63% 7
WD current action WD management approach 35 61% 8
Diversity
award/recognition WD measurement
32 56% 9
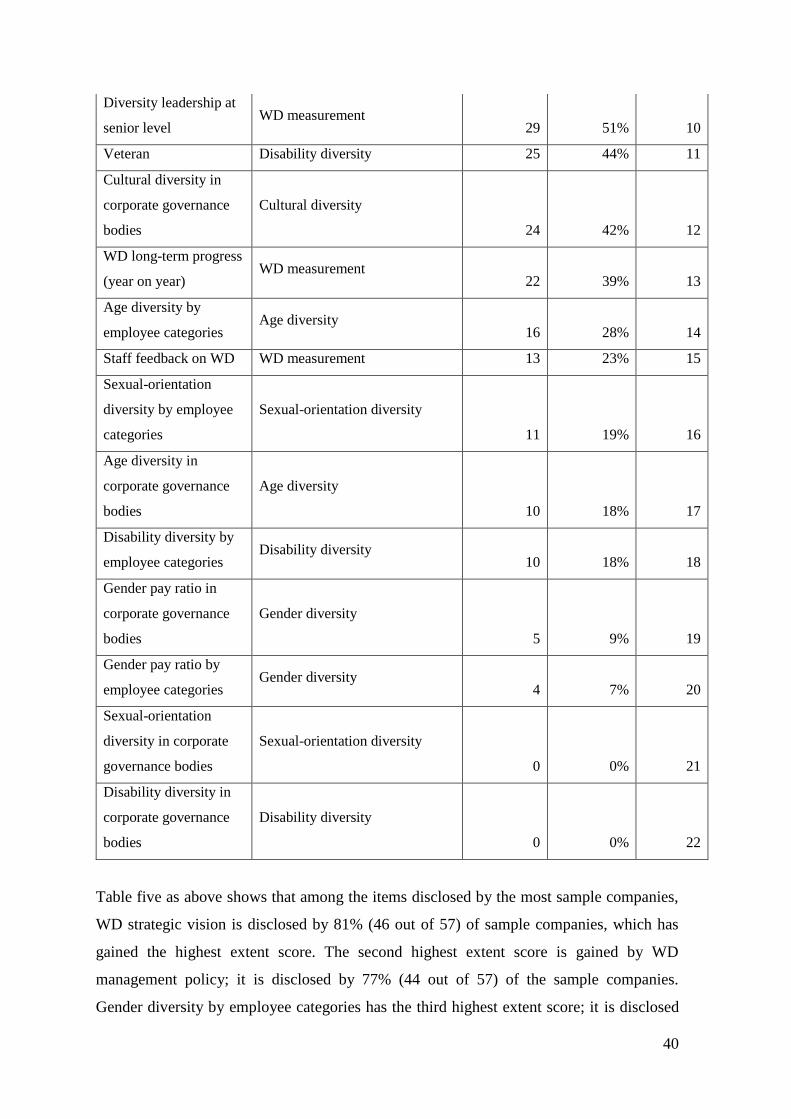
40
Diversity leadership at
senior level WD measurement
29 51% 10
Veteran Disability diversity 25 44% 11
Cultural diversity in
corporate governance
bodies
Cultural diversity
24 42% 12
WD long-term progress
(year on year) WD measurement
22 39% 13
Age diversity by
employee categories Age diversity
16 28% 14
Staff feedback on WD WD measurement 13 23% 15
Sexual-orientation
diversity by employee
categories
Sexual-orientation diversity
11 19% 16
Age diversity in
corporate governance
bodies
Age diversity
10 18% 17
Disability diversity by
employee categories Disability diversity
10 18% 18
Gender pay ratio in
corporate governance
bodies
Gender diversity
5 9% 19
Gender pay ratio by
employee categories Gender diversity
4 7% 20
Sexual-orientation
diversity in corporate
governance bodies
Sexual-orientation diversity
0 0% 21
Disability diversity in
corporate governance
bodies
Disability diversity
0 0% 22
Table five as above shows that among the items disclosed by the most sample companies,
WD strategic vision is disclosed by 81% (46 out of 57) of sample companies, which has
gained the highest extent score. The second highest extent score is gained by WD
management policy; it is disclosed by 77% (44 out of 57) of the sample companies.
Gender diversity by employee categories has the third highest extent score; it is disclosed
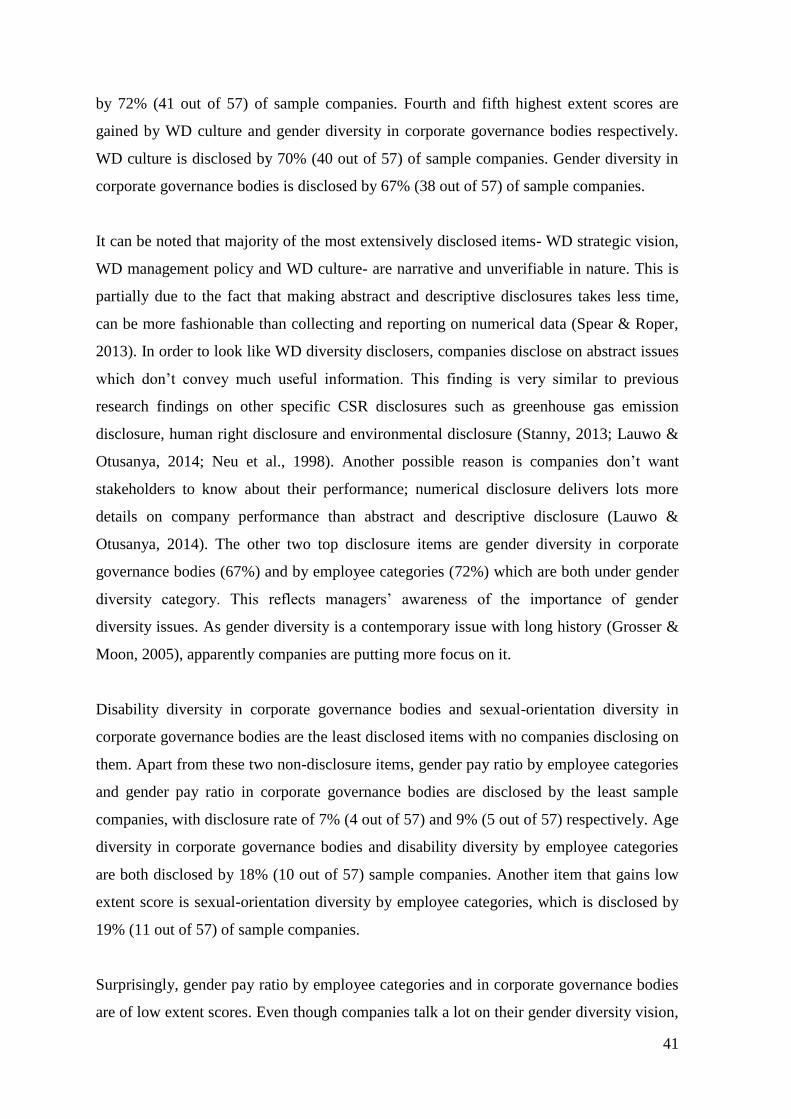
41
by 72% (41 out of 57) of sample companies. Fourth and fifth highest extent scores are
gained by WD culture and gender diversity in corporate governance bodies respectively.
WD culture is disclosed by 70% (40 out of 57) of sample companies. Gender diversity in
corporate governance bodies is disclosed by 67% (38 out of 57) of sample companies.
It can be noted that majority of the most extensively disclosed items- WD strategic vision,
WD management policy and WD culture- are narrative and unverifiable in nature. This is
partially due to the fact that making abstract and descriptive disclosures takes less time,
can be more fashionable than collecting and reporting on numerical data (Spear & Roper,
2013). In order to look like WD diversity disclosers, companies disclose on abstract issues
which don’t convey much useful information. This finding is very similar to previous
research findings on other specific CSR disclosures such as greenhouse gas emission
disclosure, human right disclosure and environmental disclosure (Stanny, 2013; Lauwo &
Otusanya, 2014; Neu et al., 1998). Another possible reason is companies don’t want
stakeholders to know about their performance; numerical disclosure delivers lots more
details on company performance than abstract and descriptive disclosure (Lauwo &
Otusanya, 2014). The other two top disclosure items are gender diversity in corporate
governance bodies (67%) and by employee categories (72%) which are both under gender
diversity category. This reflects managers’ awareness of the importance of gender
diversity issues. As gender diversity is a contemporary issue with long history (Grosser &
Moon, 2005), apparently companies are putting more focus on it.
Disability diversity in corporate governance bodies and sexual-orientation diversity in
corporate governance bodies are the least disclosed items with no companies disclosing on
them. Apart from these two non-disclosure items, gender pay ratio by employee categories
and gender pay ratio in corporate governance bodies are disclosed by the least sample
companies, with disclosure rate of 7% (4 out of 57) and 9% (5 out of 57) respectively. Age
diversity in corporate governance bodies and disability diversity by employee categories
are both disclosed by 18% (10 out of 57) sample companies. Another item that gains low
extent score is sexual-orientation diversity by employee categories, which is disclosed by
19% (11 out of 57) of sample companies.
Surprisingly, gender pay ratio by employee categories and in corporate governance bodies
are of low extent scores. Even though companies talk a lot on their gender diversity vision,
42
policy, history, achievement in reaching equal number of male and female employees,
gender pay issue is ignored. Linking with literature that there have been big improvements
in female employment rate (Fiona Doherty, 2017), while gender pay gap exists extensively
(Moore & Tailby, 2015; Fiona Doherty, 2017; Ryan & Haslam, 2005), our finding
indicates Fortune 100 companies are hesitating to disclose on the workplace diversity
items that they perform weakly on.
4.2 Contents of workplace diversity disclosure
This subchapter provides details on the content of WDD practices. It answers research
question 2: What are the contents of workplace diversity disclosure made by Fortune 100
companies? Appendix four shows overall WDD disclosure made by Fortune 100
companies that prepared CSR reports in 2016. Sample companies are disclosing all
disclosure items except two disclosure items- sexual orientations and disability at
corporate governance bodies. Details on these disclosure items which are discussed as
follow.
4.2.1 Content of workplace diversity management approach disclosure
All five disclosure items under workplace diversity management approach are disclosed.
Lots of details are provided in disclosure of this category. However, disclosures on all
items under this category are narrative, as these disclosure items are all of descriptive
nature. The validity of disclosure on this category is non-verifiable. One example of the
non-verifiable disclosure on workplace diversity management strategy category is:
“As a company, Cisco emphasizes a culture that provides our employees with the
most innovative experience, where they can learn, live their passions, and be their
best selves.” Source: Cisco, 2016 corporate social responsibility report, p.8.
4.2.2 Content of gender diversity disclosure
All the four items under gender diversity category are disclosed. Sample companies
disclose all their performance, action and policy regarding gender number in corporate
governance bodies and by employee categories; on the other hand, sample companies tend
to only disclose abstract policies regarding gender pay ratio in corporate governance
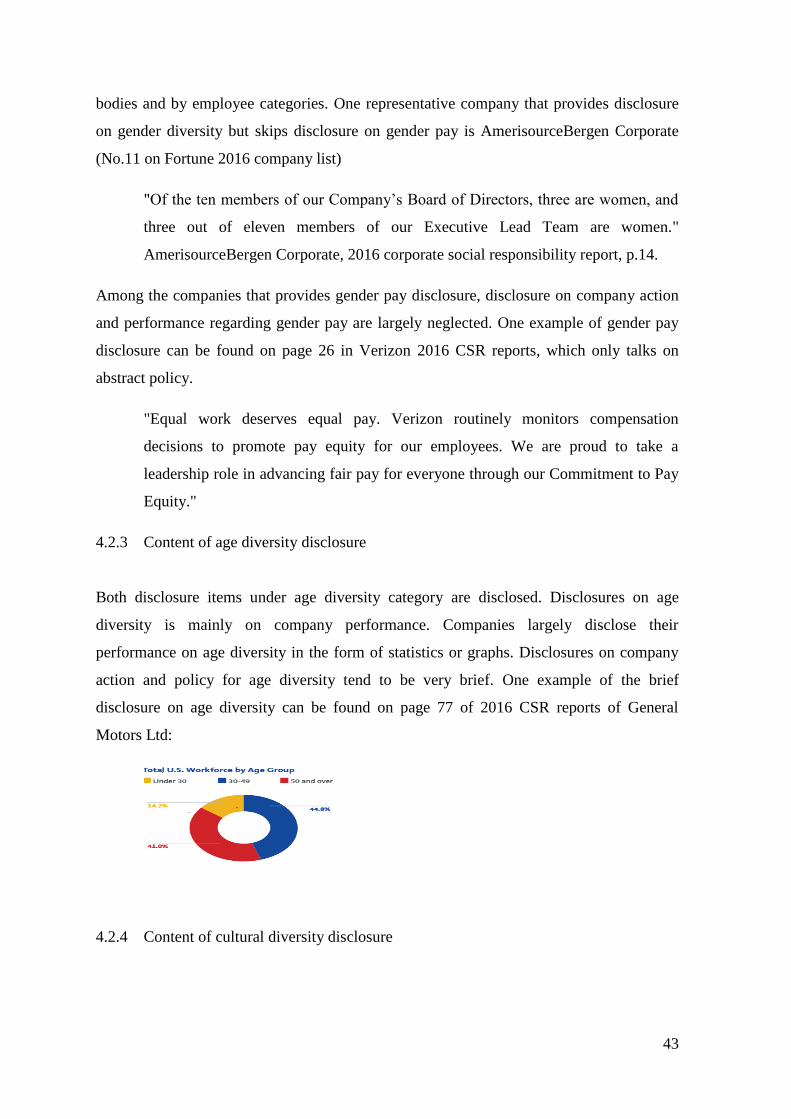
43
bodies and by employee categories. One representative company that provides disclosure
on gender diversity but skips disclosure on gender pay is AmerisourceBergen Corporate
(No.11 on Fortune 2016 company list)
"Of the ten members of our Company’s Board of Directors, three are women, and
three out of eleven members of our Executive Lead Team are women."
AmerisourceBergen Corporate, 2016 corporate social responsibility report, p.14.
Among the companies that provides gender pay disclosure, disclosure on company action
and performance regarding gender pay are largely neglected. One example of gender pay
disclosure can be found on page 26 in Verizon 2016 CSR reports, which only talks on
abstract policy.
"Equal work deserves equal pay. Verizon routinely monitors compensation
decisions to promote pay equity for our employees. We are proud to take a
leadership role in advancing fair pay for everyone through our Commitment to Pay
Equity."
4.2.3 Content of age diversity disclosure
Both disclosure items under age diversity category are disclosed. Disclosures on age
diversity is mainly on company performance. Companies largely disclose their
performance on age diversity in the form of statistics or graphs. Disclosures on company
action and policy for age diversity tend to be very brief. One example of the brief
disclosure on age diversity can be found on page 77 of 2016 CSR reports of General
Motors Ltd:
4.2.4 Content of cultural diversity disclosure
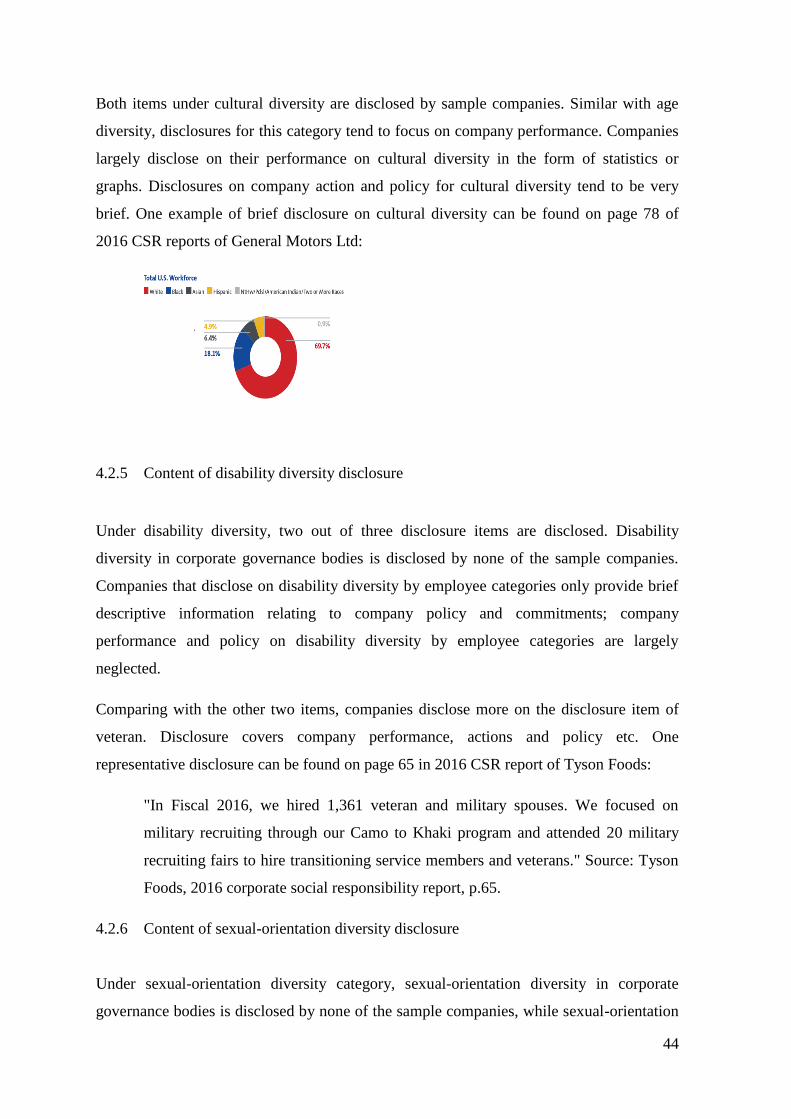
44
Both items under cultural diversity are disclosed by sample companies. Similar with age
diversity, disclosures for this category tend to focus on company performance. Companies
largely disclose on their performance on cultural diversity in the form of statistics or
graphs. Disclosures on company action and policy for cultural diversity tend to be very
brief. One example of brief disclosure on cultural diversity can be found on page 78 of
2016 CSR reports of General Motors Ltd:
4.2.5 Content of disability diversity disclosure
Under disability diversity, two out of three disclosure items are disclosed. Disability
diversity in corporate governance bodies is disclosed by none of the sample companies.
Companies that disclose on disability diversity by employee categories only provide brief
descriptive information relating to company policy and commitments; company
performance and policy on disability diversity by employee categories are largely
neglected.
Comparing with the other two items, companies disclose more on the disclosure item of
veteran. Disclosure covers company performance, actions and policy etc. One
representative disclosure can be found on page 65 in 2016 CSR report of Tyson Foods:
"In Fiscal 2016, we hired 1,361 veteran and military spouses. We focused on
military recruiting through our Camo to Khaki program and attended 20 military
recruiting fairs to hire transitioning service members and veterans." Source: Tyson
Foods, 2016 corporate social responsibility report, p.65.
4.2.6 Content of sexual-orientation diversity disclosure
Under sexual-orientation diversity category, sexual-orientation diversity in corporate
governance bodies is disclosed by none of the sample companies, while sexual-orientation
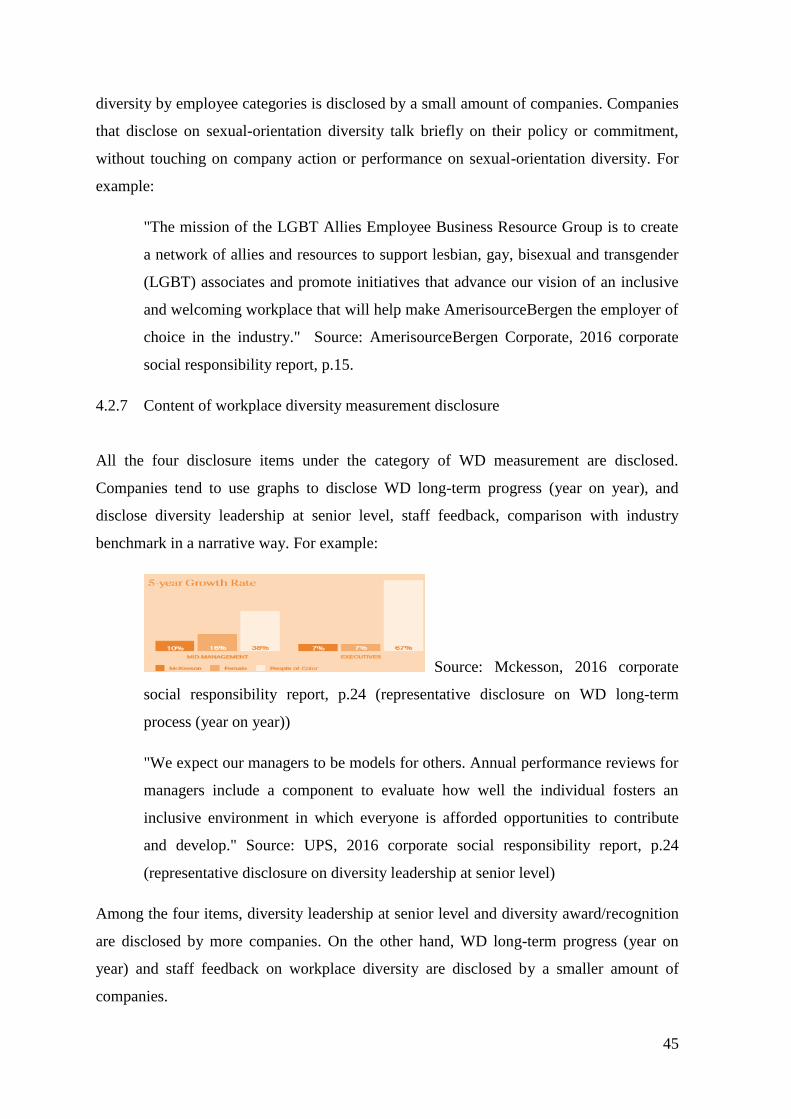
45
diversity by employee categories is disclosed by a small amount of companies. Companies
that disclose on sexual-orientation diversity talk briefly on their policy or commitment,
without touching on company action or performance on sexual-orientation diversity. For
example:
"The mission of the LGBT Allies Employee Business Resource Group is to create
a network of allies and resources to support lesbian, gay, bisexual and transgender
(LGBT) associates and promote initiatives that advance our vision of an inclusive
and welcoming workplace that will help make AmerisourceBergen the employer of
choice in the industry." Source: AmerisourceBergen Corporate, 2016 corporate
social responsibility report, p.15.
4.2.7 Content of workplace diversity measurement disclosure
All the four disclosure items under the category of WD measurement are disclosed.
Companies tend to use graphs to disclose WD long-term progress (year on year), and
disclose diversity leadership at senior level, staff feedback, comparison with industry
benchmark in a narrative way. For example:
Source: Mckesson, 2016 corporate
social responsibility report, p.24 (representative disclosure on WD long-term
process (year on year))
"We expect our managers to be models for others. Annual performance reviews for
managers include a component to evaluate how well the individual fosters an
inclusive environment in which everyone is afforded opportunities to contribute
and develop." Source: UPS, 2016 corporate social responsibility report, p.24
(representative disclosure on diversity leadership at senior level)
Among the four items, diversity leadership at senior level and diversity award/recognition
are disclosed by more companies. On the other hand, WD long-term progress (year on
year) and staff feedback on workplace diversity are disclosed by a smaller amount of
companies.
46
4.2.8 Analysis of content findings
From the above findings, it can be noted that in cases of sexual-orientation diversity and
disability diversity, even though companies disclose information by employee categories,
they don’t specifically disclose them in corporate governance bodies. A possible reason of
this disclosure phenomenon is companies on one hand want to show their care about these
employee groups and to create a positive impression; on the other hand, managers may
have negative social perceptions that the existence of LGBT or physically disabled people
in corporate governance bodies could have negative effects on their business images and
on stakeholder confidence (M.V. Lee Badgett, Sears, Holning Lau, & Deborah Ho, 2009).
Besides, companies in practice may discourage disability and LGBT diversity in corporate
governance bodies; thus, they avoid disclosing on these two disclosure items to avoid
receiving public pressure and criticize (Badgett, Lau, Sears, & Ho, 2007).
However, a better understanding of these reasons can be made by conducting interviews
with top managers with regards to the absence of such disclosures. This research pointed
out this non-disclosure phenomena in WDD and future research can be done to focus more
on the reasons behind the phenomena.
Surprisingly, under sexual-orientation and disability diversity categories, even though all
other items are either of none disclosure or weak disclosure, veteran has been disclosed
better, with details on company performance, action and policy in both descriptive and
numerical ways. Most of the numerical disclosure is about companies’ efforts and
achievements in veteran recruitment; this reflects companies’ confidence in their
performance on veteran issues.
There could be a few reasons behind prominence of veteran. For example, sample
companies are mostly US companies, and veteran is potentially a social issue in US that
receives more attention than other items under WDD (Kleykamp, 2013; Smith, 2014).
Companies may use such social issues to create an impression on them (Ball et al., 2005).
Secondly, it seems from the reports that compared to other disclosure items under sexual-
orientation and disability diversity categories, companies in practice perform better in this
area; this may motivate them to report their positive performance and create an impression
with veterans.
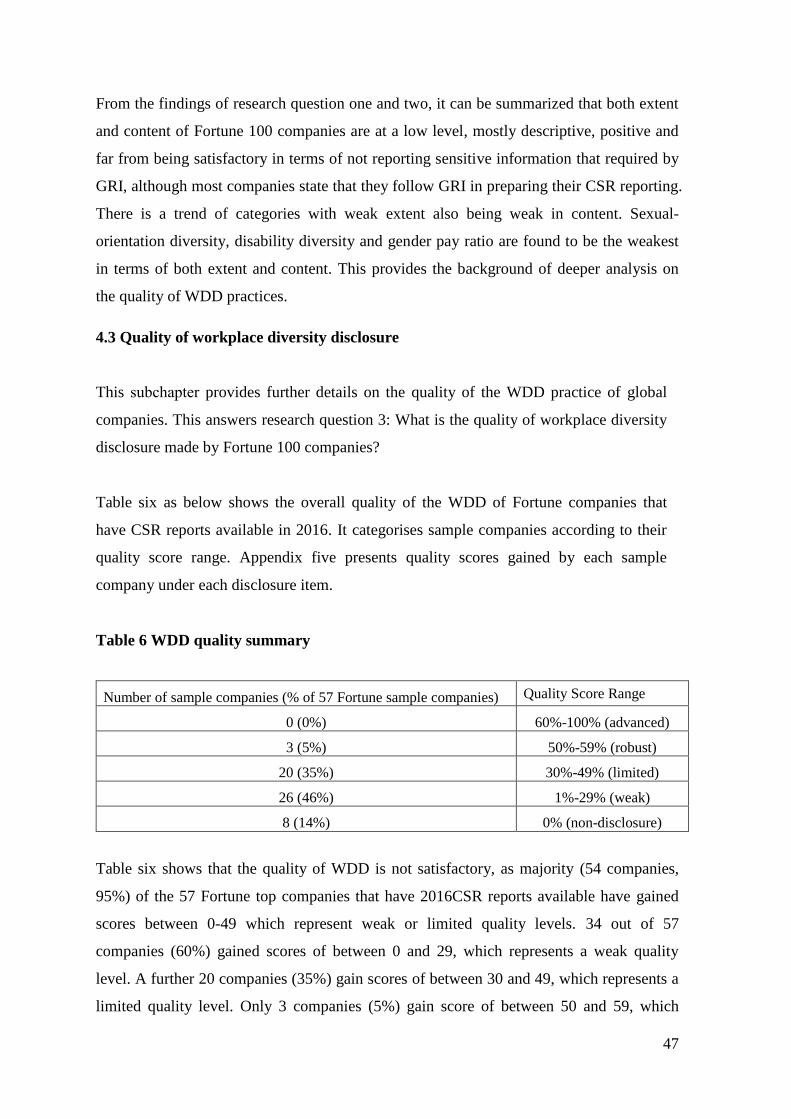
47
From the findings of research question one and two, it can be summarized that both extent
and content of Fortune 100 companies are at a low level, mostly descriptive, positive and
far from being satisfactory in terms of not reporting sensitive information that required by
GRI, although most companies state that they follow GRI in preparing their CSR reporting.
There is a trend of categories with weak extent also being weak in content. Sexual-
orientation diversity, disability diversity and gender pay ratio are found to be the weakest
in terms of both extent and content. This provides the background of deeper analysis on
the quality of WDD practices.
4.3 Quality of workplace diversity disclosure
This subchapter provides further details on the quality of the WDD practice of global
companies. This answers research question 3: What is the quality of workplace diversity
disclosure made by Fortune 100 companies?
Table six as below shows the overall quality of the WDD of Fortune companies that
have CSR reports available in 2016. It categorises sample companies according to their
quality score range. Appendix five presents quality scores gained by each sample
company under each disclosure item.
Table 6 WDD quality summary
Number of sample companies (% of 57 Fortune sample companies) Quality Score Range
0 (0%) 60%-100% (advanced)
3 (5%) 50%-59% (robust)
20 (35%) 30%-49% (limited)
26 (46%) 1%-29% (weak)
8 (14%) 0% (non-disclosure)
Table six shows that the quality of WDD is not satisfactory, as majority (54 companies,
95%) of the 57 Fortune top companies that have 2016CSR reports available have gained
scores between 0-49 which represent weak or limited quality levels. 34 out of 57
companies (60%) gained scores of between 0 and 29, which represents a weak quality
level. A further 20 companies (35%) gain scores of between 30 and 49, which represents a
limited quality level. Only 3 companies (5%) gain score of between 50 and 59, which
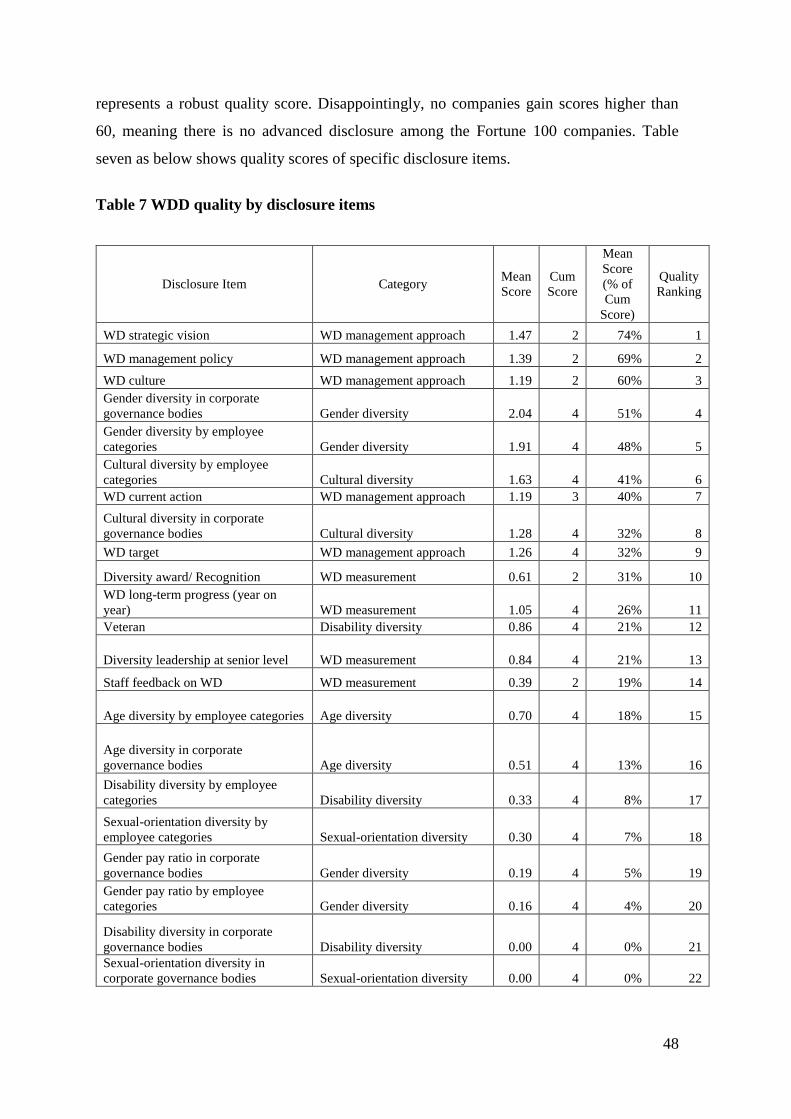
48
represents a robust quality score. Disappointingly, no companies gain scores higher than
60, meaning there is no advanced disclosure among the Fortune 100 companies. Table
seven as below shows quality scores of specific disclosure items.
Table 7 WDD quality by disclosure items
Disclosure Item Category Mean
Score
Cum
Score
Mean
Score
(% of
Cum
Score)
Quality
Ranking
WD strategic vision WD management approach 1.47 2 74% 1
WD management policy WD management approach 1.39 2 69% 2
WD culture WD management approach 1.19 2 60% 3
Gender diversity in corporate
governance bodies Gender diversity 2.04 4 51% 4
Gender diversity by employee
categories Gender diversity 1.91 4 48% 5
Cultural diversity by employee
categories Cultural diversity 1.63 4 41% 6
WD current action WD management approach 1.19 3 40% 7
Cultural diversity in corporate
governance bodies Cultural diversity 1.28 4 32% 8
WD target WD management approach 1.26 4 32% 9
Diversity award/ Recognition WD measurement 0.61 2 31% 10
WD long-term progress (year on
year) WD measurement 1.05 4 26% 11
Veteran Disability diversity 0.86 4 21% 12
Diversity leadership at senior level WD measurement 0.84 4 21% 13
Staff feedback on WD WD measurement 0.39 2 19% 14
Age diversity by employee categories Age diversity 0.70 4 18% 15
Age diversity in corporate
governance bodies Age diversity 0.51 4 13% 16
Disability diversity by employee
categories Disability diversity 0.33 4 8% 17
Sexual-orientation diversity by
employee categories Sexual-orientation diversity 0.30 4 7% 18
Gender pay ratio in corporate
governance bodies Gender diversity 0.19 4 5% 19
Gender pay ratio by employee
categories Gender diversity 0.16 4 4% 20
Disability diversity in corporate
governance bodies Disability diversity 0.00 4 0% 21
Sexual-orientation diversity in
corporate governance bodies Sexual-orientation diversity 0.00 4 0% 22
49
In analysing quality of each disclosure item, this subchapter discusses the disclosure items
with the highest quality mean score and the disclosure items with the lowest quality mean
score.
Among the 22 disclosure items, WD strategic vision gains the highest quality mean score
(74 out of 100); followed by WD management policy (69 out of 100). WD culture and
gender diversity in corporate governance bodies are ranked 3rd and 4th with mean scores of
60 and 51 respectively. The fifth highest quality score is gained by gender diversity by
employee categories, with mean score of 48 out of 100.
Among the top-quality disclosure items, WD strategic vision, WD management policy,
WD culture are all of descriptive nature. In another word, descriptive items are disclosed
in a higher quality than others. Apart from descriptive items, disclosure of gender diversity
in corporate governance bodies and gender diversity by employee categories are also of
higher quality, based on the scores they gained. However, gender pay ratio by employee
categories is of the lowest quality apart from the two non-disclosure items. Similarly,
gender pay ratio in corporate governance bodies gains low quality scores. Disappointingly,
even though companies provide disclosure in high quality for gender diversity in corporate
governance bodies, they only provide disclosure of gender pay information in a very low
quality. The disclosure doesn’t convey much useful information.
A representative disclosure of low quality for gender pay ratio in corporate governance
bodies and by employee categories can be found in Golden Sachs’ 2016 CSR report:
"Goldman Sachs has long been committed to equal employment opportunity,
including compensating all of our employees equitably at all levels of the firm."
(Page 5).
This disclosure only provides a general and abstract statement on company’s commitment
to equal pay at all levels of the firm. No numerical information is provided; company’s
performance is not reflected. Thus, readers are not able to get useful information and not
able to tell how true this commitment is.
50
Sexual-orientation diversity by employee categories are ranked the fifth lowest for quality.
A representative disclosure of low quality for sexual-orientation diversity by employee
categories can be found on page 15 in AmerisourceBergen Corporate’s 2016 CSR report:
"The mission of the LGBT Allies Employee Business Resource Group is to create
a network of allies and resources to support lesbian, gay, bisexual and transgender
(LGBT) associates and promote initiatives that advance our vision of an inclusive
and welcoming workplace that will help make AmerisourceBergen the employer of
choice in the industry."
Similarly, the disclosure of disability diversity by employee categories is also very
abstract. No numerical information is provided; company’s performance is not reflected. A
representative disclosure of low quality for disability diversity by employee categories can
be found on page 92 in EXC’s 2016 CSR report:
“We partner with organizations that support recruiting and hiring of individuals
with disabilities. In 2016, Exelon strengthened our relationship with
GettingHired.com, a talent acquisition site that enables all of Exelon’s job postings
to be fully accessible to individuals with disabilities.”
Overall, the findings on the quality of WDD of Fortune 100 companies indicate a very low
quality of disclosure mostly in the sensitive information with a few high-quality
information related to narrative diversity issues. Furthermore, extent, content and quality
of WDD all indicate towards an impression management perspective of WDD practice.
4.4 Impression management perspective of workplace diversity disclosure
This subchapter discusses further findings on impression management perspective of
WDD practices. This answers the research question 4: To what extent do the extent,
content and quality of workplace diversity together support the argument – highlighted in
the corporate social reporting literature – that workplace diversity disclosure represents
vehicles for impression management strategies aimed at persuading stakeholders?
51
Appendix six provides a summary of background information of companies with the
highest WDD quality scores, together with their quality scores. Based on the quality
scoring system, CVS Health Ltd (No. 7 in Fortune list; from health care: pharmacy and
other service industry sector; quality score: 42 out of 76) has the best quality WDD among
Fortune 100 companies, followed by Citigroup Ltd (No.30 in Fortune list; from
commercial banks industry; quality score: 39 out of 76). Company with the 3rd highest
quality WDD is Exelon (No. 89 in Fortune list, from utilities: gas and electric industry;
quality score: 38 out of 76). Fourth and fifth are Walmart (No.1 in Fortune list, from
general merchandisers industry and Johnson & Johnson (No.35 in Fortune list, from
pharmaceuticals industry), which both gained quality score of 34 out of 76. The above
companies are so considered for further study on their WDD practices. Findings from
these companies are described in the following subchapters.
4.4.1 Disclosure with no back up of clear and convincing information in regard to
diversity performance of specific diversity issues.
In addition to the findings gathered above in regards to the overall extent, content and
quality of WDD, Exelon’s disability diversity disclosure deserves additional scrutiny.
Exelon states on page 92 in 2016 CSR report:
“We attended seven disability-specific career fairs in 2016 and participated in many events
to offer guidance and support, such as resume reviews and mock interviews, for candidates
with disabilities.”
The above disclosure indicates Exelon is a leader in disability diversity area, as they
emphasize on participating in many disability events and offering guidance and support.
However, EXC doesn’t disclose on their disability performance. There is insufficient
evidence that EXC takes the responsibility as being a leader in disability diversity area at
least within the industry they belong to. Thus, the fact that they “offer guidance and
support” on disability-specific issues lacks support of evidences and it seems that this is
just conveying a positive message that they are doing well in disability diversity area
without much substances.
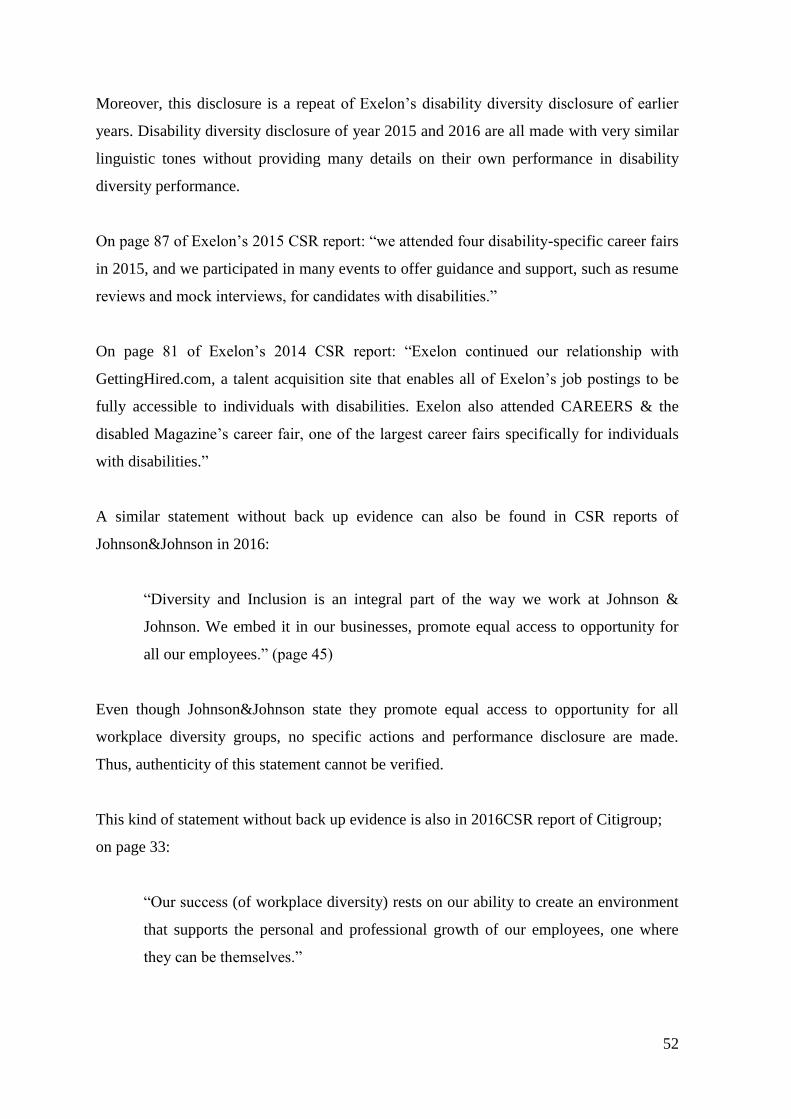
52
Moreover, this disclosure is a repeat of Exelon’s disability diversity disclosure of earlier
years. Disability diversity disclosure of year 2015 and 2016 are all made with very similar
linguistic tones without providing many details on their own performance in disability
diversity performance.
On page 87 of Exelon’s 2015 CSR report: “we attended four disability-specific career fairs
in 2015, and we participated in many events to offer guidance and support, such as resume
reviews and mock interviews, for candidates with disabilities.”
On page 81 of Exelon’s 2014 CSR report: “Exelon continued our relationship with
GettingHired.com, a talent acquisition site that enables all of Exelon’s job postings to be
fully accessible to individuals with disabilities. Exelon also attended CAREERS & the
disabled Magazine’s career fair, one of the largest career fairs specifically for individuals
with disabilities.”
A similar statement without back up evidence can also be found in CSR reports of
Johnson&Johnson in 2016:
“Diversity and Inclusion is an integral part of the way we work at Johnson &
Johnson. We embed it in our businesses, promote equal access to opportunity for
all our employees.” (page 45)
Even though Johnson&Johnson state they promote equal access to opportunity for all
workplace diversity groups, no specific actions and performance disclosure are made.
Thus, authenticity of this statement cannot be verified.
This kind of statement without back up evidence is also in 2016CSR report of Citigroup;
on page 33:
“Our success (of workplace diversity) rests on our ability to create an environment
that supports the personal and professional growth of our employees, one where
they can be themselves.”
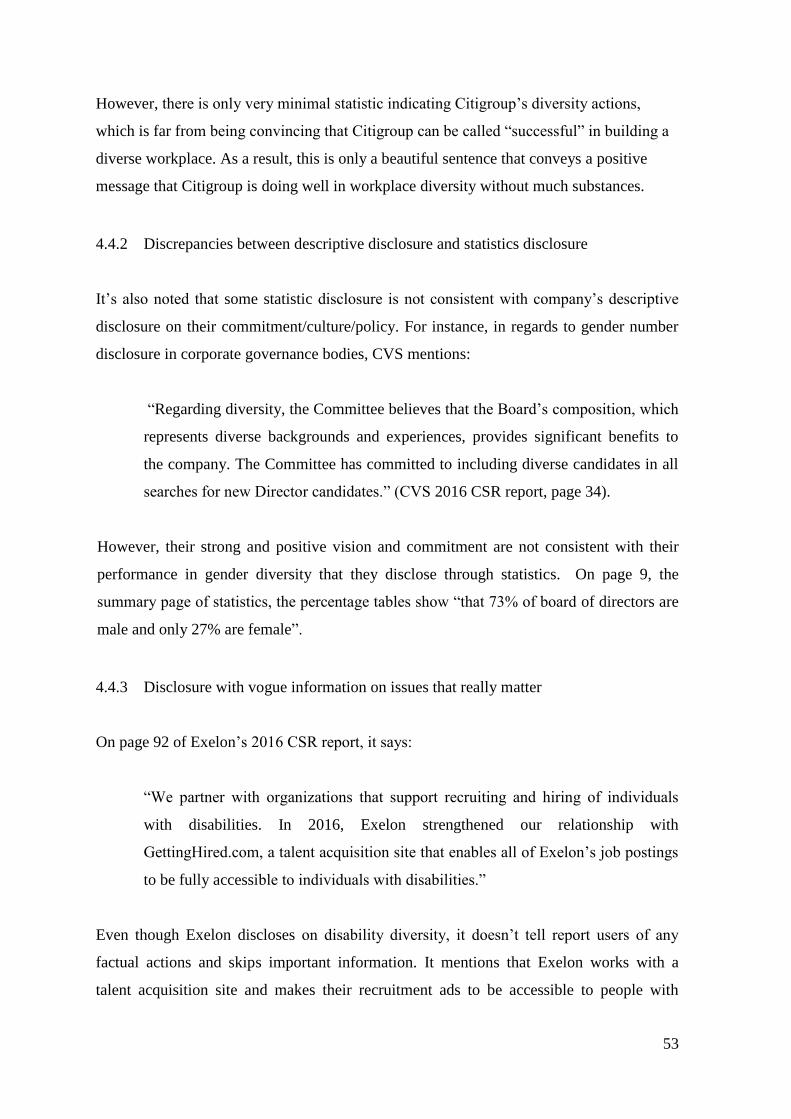
53
However, there is only very minimal statistic indicating Citigroup’s diversity actions,
which is far from being convincing that Citigroup can be called “successful” in building a
diverse workplace. As a result, this is only a beautiful sentence that conveys a positive
message that Citigroup is doing well in workplace diversity without much substances.
4.4.2 Discrepancies between descriptive disclosure and statistics disclosure
It’s also noted that some statistic disclosure is not consistent with company’s descriptive
disclosure on their commitment/culture/policy. For instance, in regards to gender number
disclosure in corporate governance bodies, CVS mentions:
“Regarding diversity, the Committee believes that the Board’s composition, which
represents diverse backgrounds and experiences, provides significant benefits to
the company. The Committee has committed to including diverse candidates in all
searches for new Director candidates.” (CVS 2016 CSR report, page 34).
However, their strong and positive vision and commitment are not consistent with their
performance in gender diversity that they disclose through statistics. On page 9, the
summary page of statistics, the percentage tables show “that 73% of board of directors are
male and only 27% are female”.
4.4.3 Disclosure with vogue information on issues that really matter
On page 92 of Exelon’s 2016 CSR report, it says:
“We partner with organizations that support recruiting and hiring of individuals
with disabilities. In 2016, Exelon strengthened our relationship with
GettingHired.com, a talent acquisition site that enables all of Exelon’s job postings
to be fully accessible to individuals with disabilities.”
Even though Exelon discloses on disability diversity, it doesn’t tell report users of any
factual actions and skips important information. It mentions that Exelon works with a
talent acquisition site and makes their recruitment ads to be accessible to people with
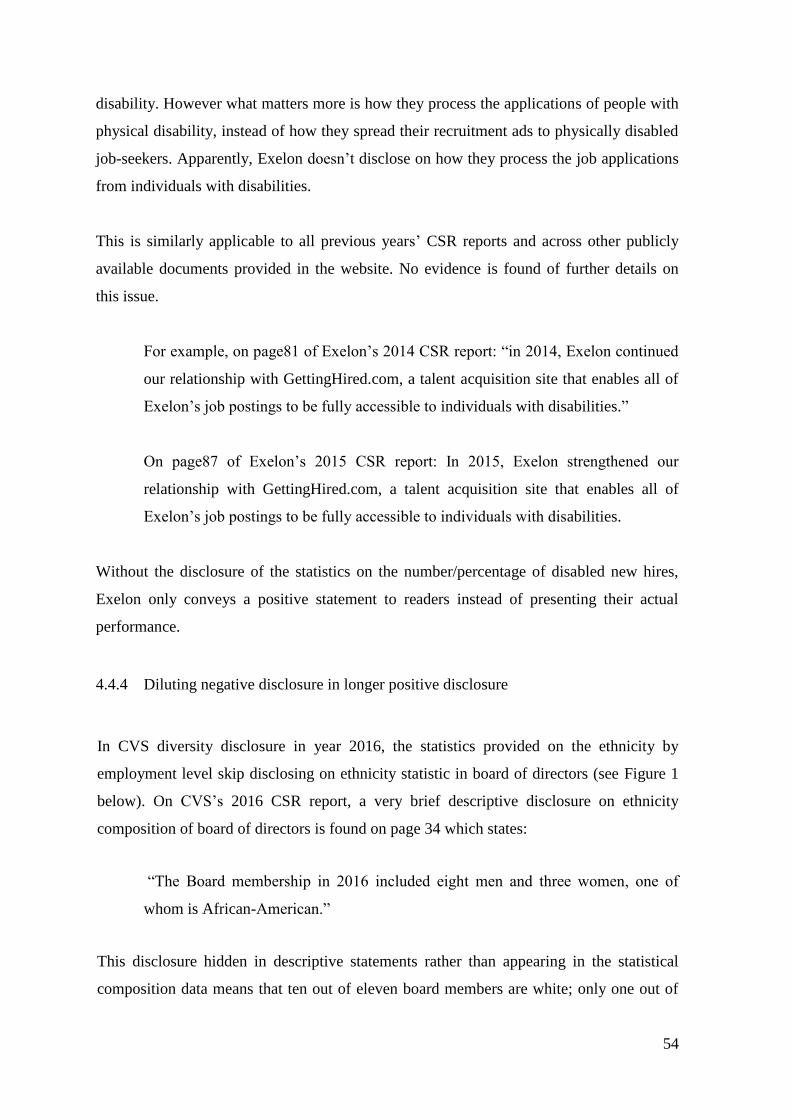
54
disability. However what matters more is how they process the applications of people with
physical disability, instead of how they spread their recruitment ads to physically disabled
job-seekers. Apparently, Exelon doesn’t disclose on how they process the job applications
from individuals with disabilities.
This is similarly applicable to all previous years’ CSR reports and across other publicly
available documents provided in the website. No evidence is found of further details on
this issue.
For example, on page81 of Exelon’s 2014 CSR report: “in 2014, Exelon continued
our relationship with GettingHired.com, a talent acquisition site that enables all of
Exelon’s job postings to be fully accessible to individuals with disabilities.”
On page87 of Exelon’s 2015 CSR report: In 2015, Exelon strengthened our
relationship with GettingHired.com, a talent acquisition site that enables all of
Exelon’s job postings to be fully accessible to individuals with disabilities.
Without the disclosure of the statistics on the number/percentage of disabled new hires,
Exelon only conveys a positive statement to readers instead of presenting their actual
performance.
4.4.4 Diluting negative disclosure in longer positive disclosure
In CVS diversity disclosure in year 2016, the statistics provided on the ethnicity by
employment level skip disclosing on ethnicity statistic in board of directors (see Figure 1
below). On CVS’s 2016 CSR report, a very brief descriptive disclosure on ethnicity
composition of board of directors is found on page 34 which states:
“The Board membership in 2016 included eight men and three women, one of
whom is African-American.”
This disclosure hidden in descriptive statements rather than appearing in the statistical
composition data means that ten out of eleven board members are white; only one out of
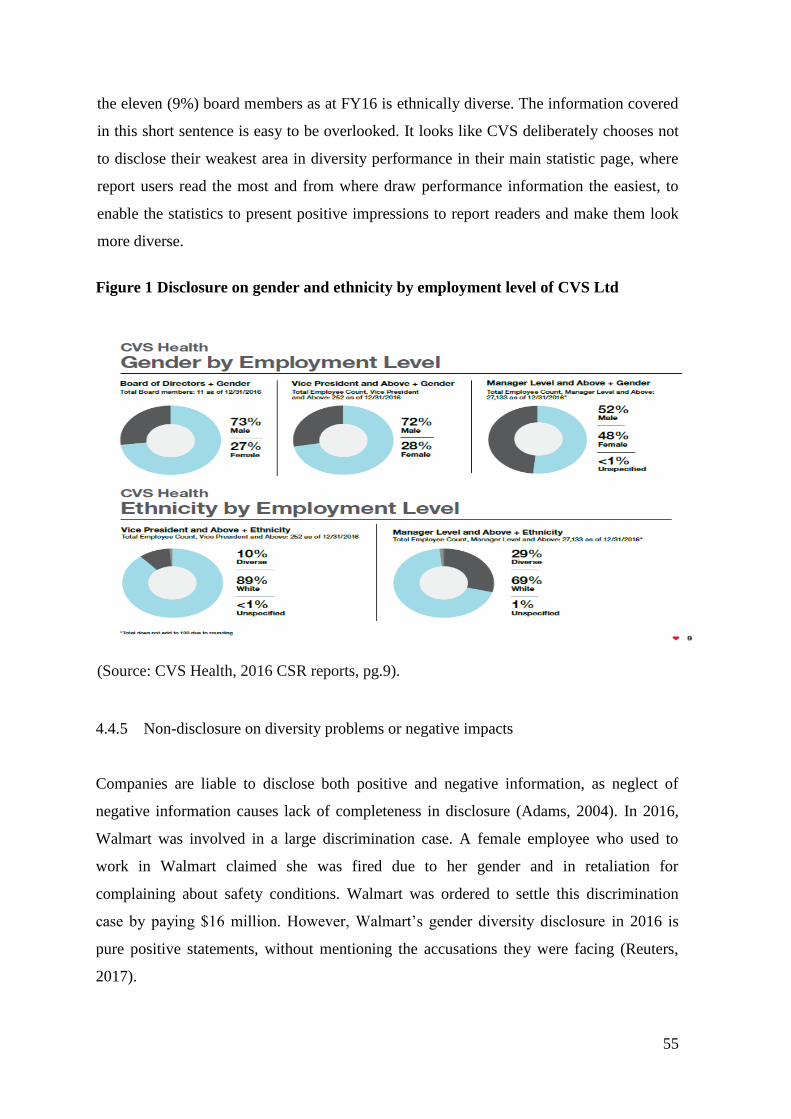
55
the eleven (9%) board members as at FY16 is ethnically diverse. The information covered
in this short sentence is easy to be overlooked. It looks like CVS deliberately chooses not
to disclose their weakest area in diversity performance in their main statistic page, where
report users read the most and from where draw performance information the easiest, to
enable the statistics to present positive impressions to report readers and make them look
more diverse.
Figure 1 Disclosure on gender and ethnicity by employment level of CVS Ltd
(Source: CVS Health, 2016 CSR reports, pg.9).
4.4.5 Non-disclosure on diversity problems or negative impacts
Companies are liable to disclose both positive and negative information, as neglect of
negative information causes lack of completeness in disclosure (Adams, 2004). In 2016,
Walmart was involved in a large discrimination case. A female employee who used to
work in Walmart claimed she was fired due to her gender and in retaliation for
complaining about safety conditions. Walmart was ordered to settle this discrimination
case by paying $16 million. However, Walmart’s gender diversity disclosure in 2016 is
pure positive statements, without mentioning the accusations they were facing (Reuters,
2017).
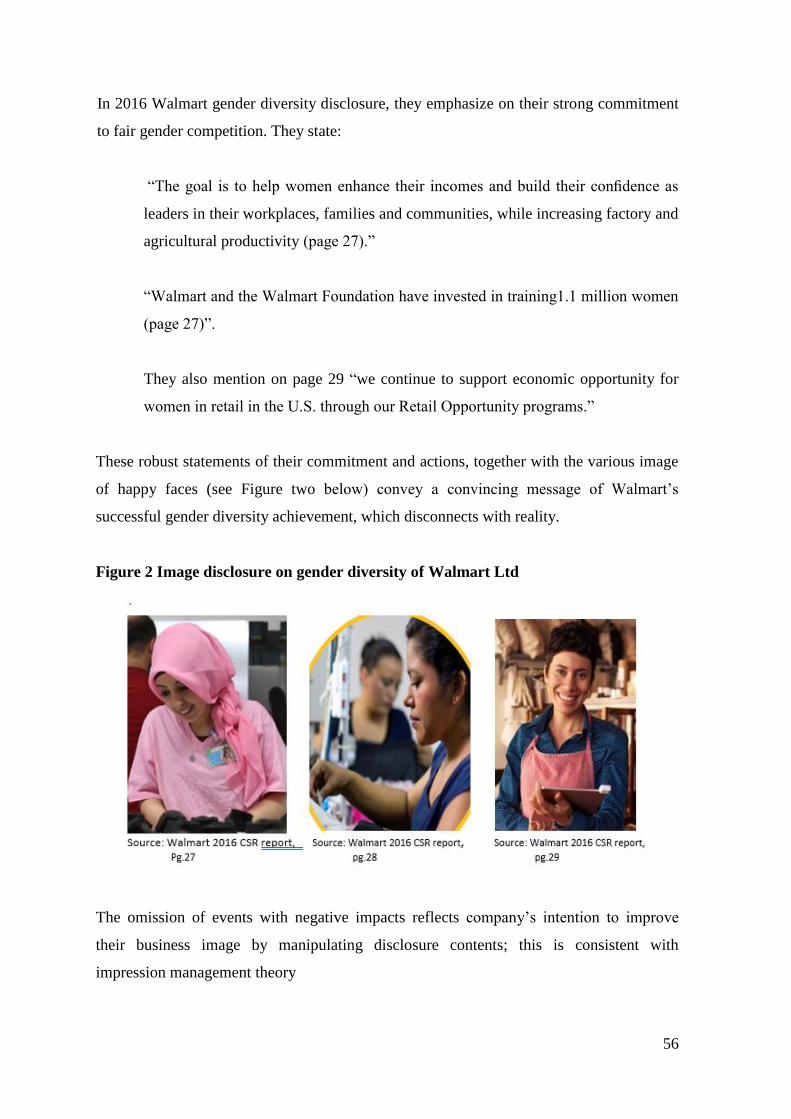
56
In 2016 Walmart gender diversity disclosure, they emphasize on their strong commitment
to fair gender competition. They state:
“The goal is to help women enhance their incomes and build their confidence as
leaders in their workplaces, families and communities, while increasing factory and
agricultural productivity (page 27).”
“Walmart and the Walmart Foundation have invested in training1.1 million women
(page 27)”.
They also mention on page 29 “we continue to support economic opportunity for
women in retail in the U.S. through our Retail Opportunity programs.”
These robust statements of their commitment and actions, together with the various image
of happy faces (see Figure two below) convey a convincing message of Walmart’s
successful gender diversity achievement, which disconnects with reality.
Figure 2 Image disclosure on gender diversity of Walmart Ltd
The omission of events with negative impacts reflects company’s intention to improve
their business image by manipulating disclosure contents; this is consistent with
impression management theory
57
Overall, the case studies of companies with top quality scores on WDD tend to support the
argument that WDD of five Fortune companies with top disclosure quality reflects the
impression management perspective used by companies to emphasize the positive areas of
their WD performance and to obfuscate negative outcomes.
58
5 Conclusion, limitation and contribution
This research is a first attempt to measure and evaluate WDD of global companies. A
combination of content analysis and case study is used to explore the extent, content and
quality of workplace diversity disclosure made in 2016 CSR reports by Fortune 100
companies drawing on impression management perspective of CSR disclosure. CSR
reports are obtained for 57 out of 100 Fortune top companies for the year 2016 based on
the availability of their standalone CSR reports. A category scheme and disclosure index
with regards to WDD are developed from previous studies and following GRI
requirements on diversity. WDD practices of sample companies are then analysed based
on the categorization and disclosure indexes. Findings of content analysis are
supplemented with case studies of the five companies with the highest WDD quality
scores.
Findings suggest that, in terms of disclosure contents, companies provide uneven
disclosure for workplace diversity categories. More focus is put on disclosing narrative and
non-verifiable category (WD management approach category) and gender number issue.
There is no disclosure on company performance for sexual-orientation diversity, disability
diversity and gender pay issues. In terms of disclosure extent, majority of the disclosure
items are disclosed by less than half of the sample companies. Narrative and non-verifiable
category (WD management approach) and gender number issue are disclosed by the
widest extent of companies. Sexual-orientation diversity, disability diversity and gender
pay issues have the most limited extent. The quality of workplace diversity disclosure of
Fortune 100 companies is low, as among the 57 Fortune companies that have available
CSR reports in 2016, majority gain scores between 0-49 which represent weak or limited
quality levels. Narrative and non-verifiable category (workplace diversity management
approach) has the highest quality disclosure. Sexual-orientation diversity, disability
diversity and gender pay have the lowest disclosure quality.
It can also be noted that items and categories with lower extent tend to have weaker
content and quality. Overall, WDD of Fortune 100 companies is neither complete nor
comprehensive enough and is largely confined to general, narrative statements which
cannot be verified.
59
Besides, research findings tend to support impression management theory. Fortune 100
companies seem using WDD as a tool to emphasize the positive areas of workplace
diversity performance and to obfuscate negative outcomes.
This research is exploratory in nature, due to the scant literature on WDD practice of
global companies. The findings of this research provide a background for later studies in
WDD practice. It has a few contributions. Firstly, this research contributes to the scant
social and environmental accounting literature by offering an overview of the reporting
practices of global companies in respect of their workplace diversity. As far as I am aware,
there is no research in this area so far. Secondly, this research has developed a WDD
categorization scheme and examined its implementation in Fortune 100 companies. This
categorization scheme is useful for companies who want to adopt WDD and would help
them to capture the core areas of workplace diversity. This category scheme would also be
of relevance to investors and other stakeholders in assessing the accountability of
companies in regards to their workplace diversity performance. Thirdly, this research
provides policy makers with insights of corporate WDD and provides a frame of reference
for further developments of related disclosure guidance and regulations. Fourthly, this
research contributes to literature by responding to the call of Guthrie & Abeysekera (2006)
for combining other research methods with content analysis in exploring the status quo of
social and environmental reports. Guthrie & Abeysekera (2006) argued few attempts have
been made to combine content analysis method with other methods, even though it has
been approved fruitful by the limited investigation conducted in exploring social and
environment reports. Fifthly, as far as I am aware, this research is the first attempt to
provide an impression management theory explanations of workplace diversity disclosure.
This research has a few limitations. Firstly, the small amount of sample limits the
generalisation of research findings. Future research could examine the findings with larger
sample. Secondly, this research examines workplace diversity with a narrow theoretical
framework (pure impression management) with mini-cases. Future researches could
examine the motivations behind WDD practices in a purely qualitative research fashion
and by conducting in-depth interviews. Exploring WDD within other theoretical
frameworks such as stakeholder theory, legitimacy theory, and institutional theory would
extend the research in WDD.
60
Reference List
Adams, C. A. (2004). The ethical, social and environmental reporting-performance
portrayal gap. Accounting, Auditing & Accountability Journal, 17(5), 731-757.
Ahmad, N. N. N., & Mohamad, N. A. (2014). Environmental disclosures by the Malaysian
construction sector: Exploring extent and quality. Corporate Social Responsibility and
Environmental Management, 21(4), 240-252.
Altintas, N. N. Carbon Disclosure Practices in Turkey: A Study on ISE Listed Companies.
IOSR Journal of Business and Management, 13(1), 35–42.
Altmann, R. (2015). A new vision for older workers: retain, retrain, recruit. London:
Department for Work and Pensions.
Amla, I. (2008). Managing and sustaining a world of workplace diversity: the Accenture
experience. Strategic HR Review, 7(5), 11-16.
Aribi, Z. A., & Gao, S. S. (2011). Narrative disclosure of corporate social responsibility in
Islamic financial institutions. Managerial Auditing Journal, 27(2), 199-222.
Armache, J. (2012). Diversity in the Workplace: Benefits and Challenges. Journal of
International Diversity, 2012(1), 59–75.
Badgett, M. V. (2003). Employment and sexual orientation: Disclosure and discrimination
in the workplace. Psychological Perspectives on Lesbian, Gay, and Bisexual Experiences
(2nd Ed.), 8720(October 2013), 327–348.
M.V. Lee Badgett, Sears, B., Holning Lau, & Deborah Ho. (2009). Bias in the workplace:
Consistent evidence of sexual orientation and gender identity discrimination 1998-2008.
Chicago-Kent Law Review, 84(2), 559–595.
Ball, P., Monaco, G., Schmeling, J., Schartz, H., & Blanck, P. (2005). Disability as
diversity in Fortune 100 companies. Behavioral Sciences & the Law, 23(1), 97-121.
Barkemeyer, R. (2007). Legitimacy as a Key Driver and Determinant of CSR in
Developing Countries. System, 44(June), 1–23.
61
Beattie, V., McInnes, B., & Fearnley, S. (2004). A methodology for analysing and
evaluating narratives in annual reports: a comprehensive descriptive profile and metrics for
disclosure quality attributes. Accounting Forum, 28(3), 205–236.
Bellini, E., Ottaviano, G. I., Pinelli, D., & Prarolo, G. (2013). Geography, institutions and
regional economic performance.
Bernardi, R. A., Bean, D. F., & Weippert, K. M. (2002). Signaling gender diversity
through annual report pictures: A research note on image management. Accounting,
Auditing & Accountability Journal, 15(4), 609-616.
Bierema, L. L. (2003). Resisting HRD’s resistance to diversity. Journal of European
Industrial Training, 34(11), 565–576. doi: 10.1108/03090591011061239
Boateng, H. (2016). An evaluation of corporate social responsibility communication on the
websites of banks operating in Ghana. Journal of Information, Communication and Ethics
in Society, 42(1), 100–118. doi: 10.1108/JICES-01-2016-0003
Boehm, S. A., & Dwertmann, D. J. (2015). Forging a single-edged sword: Facilitating
positive age and disability diversity effects in the workplace through leadership, positive
climates, and HR practices. Work, Aging and Retirement, 1(1), 41-63.
doi:10.1093/workar/wau008
Boehm, S. A., Kunze, F., & Bruch, H. (2014). Spotlight on Age-Diversity Climate: The
Impact of Age-Inclusive HR Practices on Firm-Level Outcomes. Personnel Psychology,
67, 667–704. doi: 10.1111/peps.12047
Bolen, L., & Kleiner, B. H. (1996). Managing diversity in the workplace. Cross Cultural
Management: An International Journal, 3(4), 3–8.
Bozeman, D. P., & Kacmar, K. M. (1997). A Cybernetic Model of Impression
Management Processes in Organizations. Organizational Behavior and Human Decision
Processes, 69(1), 9–30.
Brammer, S., & Pavelin, S. (2008). Factors influencing the quality of corporate
environmental disclosure. Business Strategy and the Environment, 17(2), 120–136. doi:
10.1002/bse.506
62
Brown, H. S., de Jong, M., & Levy, D. L. (2009). Building institutions based on
information disclosure: lessons from GRI’s sustainability reporting. Journal of Cleaner
Production, 17(6), 571–580.
Campbell, K., & Mínguez-Vera, A. (2008). Gender diversity in the boardroom and firm
financial performance. Journal of Business Ethics, 83(3), 435–451. doi: 10.1007/s10551-
007-9630-y
Chatterjee, B., & Zaman Mir, M. (2008). The current status of environmental reporting by
Indian companies. Managerial Auditing Journal, 23(6), 609–629. doi:
10.1108/02686900810882138
Cho, C. H., Michelon, G., & Patten, D. M. (2012). Impression management in
sustainability reports: An empirical investigation of the use of graphs. Accounting and the
Public Interest, 12(1), 16–37. doi: 10.2308/apin-10249
Choi, S., & Rainey, H. G. (2010). Managing Diversity in U.S. Federal Agencies: Effects of
Diversity and Diversity Management on Employee Perceptions of Organizational
Performance. Public Administration Review, 70(1), 109–121.
Colleoni, E. (2013). CSR communication strategies for organizational legitimacy in social
media. Corporate Communications: An International Journal, 18(2), 228–248. doi:
10.1108/13563281311319508
Cormier, D., Magnan, M., & Van Velthoven, B. (2005). Environmental disclosure quality
in large German companies: Economic incentives, public pressures or institutional
conditions? European Accounting Review, 14(1), 3–39. doi:
10.1080/0963818042000339617
Day, N., & Greene, P. (2008). A Case for Sexual Orientation Diversity Management in
Small and Large Organizations. Human Resource Management, 47(3), 637–654. doi:
10.1002/hrm.20235
De Pater, I. E., Van Vianen, A. E. M., & Bechtoldt, M. N. (2010). Gender differences in
job challenge: A matter of task allocation. Gender, Work and Organization, 17(4), 433–
453. doi: 10.1111/j.1468-0432.2009.00477.x
63
Diouf, D., & Boiral, O. (2017). The Quality of Sustainability Reports and Impression
Management A Stakeholder Perspective. Accounting, Auditing & Accountability Journal,
30(3), 643–667. doi: 10.1108/AAAJ-04-2015-2044
Du, S., Bhattacharya, C. B., & Sen, S. (2010). Maximizing business returns to corporate
social responsibility (CSR): The role of CSR communication. International Journal of
Management Reviews, 12(1), 8–19. doi: 10.1111/j.1468-2370.2009.00276.x
Dwyer, S., Richard, O. C., & Chadwick, K. (2003). Gender diversity in management and
firm performance: The influence of growth orientation and organizational culture. Journal
of Business Research, 56(12), 1009–1019. doi:10.1016/S0148-2963(01)00329-0
Ely, R. J., & Thomas, D. A. (2001). Cultural Diversity at Work: The Effects of Diversity
Perspectives on Work Group Processes and Outcomes. Administrative Science Quarterly,
46(2), 229. doi: 10.2307/2667087
F. Mahon, J., & C.J.M. Millar, C. (2014). Management: the challenges of global age
diversity for corporations and governments. Journal of Organizational Change
Management, 27(4), 553–568. doi: 10.1108/JOCM-05-2014-0100
Fiona Doherty. (2017). DIVERSITY & INCLUSION. The Building Economict, (March),
10–18.
Francoeur, C., Labelle, R., & Sinclair-Desgagné, B. (2008). Gender diversity in corporate
governance and top management. Journal of Business Ethics, 81(1), 83–95. doi:
10.1007/s10551-007-9482-5
Goffman, E. (1959). The presentation of self in everyday life. New York: Doubleday
Anchor Books.
Gray, R., & Milne, M. J. (2002). Sustainability Reporting: Who’s Kidding Whom ?
Chartered Accountants Journal of New Zealand, 81(6), 66–70.
Global Reporting Initiative. (2016), Reporting Guidelines, Retrieved from:
https://www.globalreporting.org/standards
Global Reporting Initiative. (2017). Global Reporting Initiative. Retrieved from:
http://www.globalreporting.org/information/g4/page/default.aspx.
64
Grosser, K., & Moon, J. (2005). Gender mainstreaming and corporate social responsibility:
Reporting workplace issues. Journal of Business Ethics, 62(4), 327–340.
doi:10.1007/s10551-005-5334-3
Gul, F. A., Srinidhi, B., & Ng, A. C. (2011). Does board gender diversity improve the
informativeness of stock prices? Journal of Accounting and Economics, 51(3), 314–338.
doi: 10.1016/j.jacceco.2011.01.005
Guthrie, J., & Abeysekera, I. (2006). Content analysis of social, environmental reporting:
what is new? Journal of Human Resource Costing & Accounting, 10(2), 114–126. doi:
10.1108/14013380610703120
Hąbek, P., & Wolniak, R. (2016). Assessing the quality of corporate social responsibility
reports: the case of reporting practices in selected European Union member states. Quality
& Quantity, 50(1), 399–420. doi:10.1007/s11135-014-0155-z
Haque, S., & Deegan, C. (2010). Corporate Climate Change-Related Governance Practices
and Related Disclosures: Evidence from Australia. Australian Accounting Review, 20(4),
317–333. doi: 10.1111/j.1835-2561.2010.00107.x
Hawkins, M. W. (2003). Current Trends in Class Action Employment Litigation. The
Labor Lawyer, 19(1), 33–62.
Holton, V. (2005). Diversity reporting: how European business is reporting on diversity
and equal opportunities. Women in Management Review, 20(1), 72–77. doi:
10.1108/09649420510579586
Hooghiemstra, R. (2000). Corporate communication and impression management–new
perspectives why companies engage in corporate social reporting. Journal of Business
Ethics, 28(1/2), 55–68.
Hooks, J., & van Staden, C. J. (2011). Evaluating environmental disclosures: The
relationship between quality and extent measures. British Accounting Review, 43(3), 200–
213. doi:10.1016/j.bar.2011.06.005
Hopper, J. E., & Salvaggio, N. (2008). Report from SIOP diversifying diversity: moving
beyond race and gender. Equal Opportunities International, 27(5), 465–470. doi:
10.1108/02610150810882314
65
Islam, M. A. (2015). Human Rights Performance Reporting: a study of Corporations
within Australian Financial Sector. 1–29.
Islam, M. A., Haque, S., & Roberts, R. (2017). Human Rights Performance Disclosure by
Companies with Operations in High Risk Countries: Evidence from the Australian
Minerals Sector. Australian Accounting Review, 27(1), 34–51. doi: 10.1111/auar.12108
Jaworska, E. (2016). Diversity Management and Reporting in Selected Companies.
Research Papers of the Wroclaw University of Economics, (434).
Jenkins, H., & Yakovleva, N. (2006). Corporate social responsibility in the mining
industry: Exploring trends in social and environmental disclosure. Journal of Cleaner
Production, 14(3–4), 271–284. doi:10.1016/j.jclepro.2004.10.004
Joecks, J., Pull, K., & Vetter, K. (2013). Gender Diversity in the Boardroom and Firm
Performance: What Exactly Constitutes a “Critical Mass?”. Journal of Business Ethics,
118(1), 61–72
Johnson, B. R., Connolly, E., & Carter, T. S. (2011). Corporate social responsibility: The
role of Fortune 100 companies in domestic and international natural disasters. Corporate
Social Responsibility and Environmental Management, 18(6), 352–369. doi:
10.1002/csr.253
Kalev, A., Dobbin, F., & Kelly, E. (2006). Best Practices or Best Guesses? Assessing the
Efficacy of Corporate Affirmative Action and Diversity Policies. American Sociological
Review, 71, 589–617.
Kapoor, C., & Solomon, N. (2011). Understanding and managing generational differences
in the workplace. Worldwide Hospitality and Tourism Themes, 3(4), 308–318. doi:
10.1108/17554211111162435
Kleykamp, M. (2013). Unemployment, earnings and enrollment among post 9/11 veterans.
Social Science Research, 42(3), 836–851. doi: 10.1016/j.ssresearch.2012.12.017
Kochan, T., Bezrukova, K., Ely, R., Jackson, S., Joshi, A., Jehn, K., … Thomas, D. (2003).
The effects of diversity on business performance: Report of the diversity research network.
Human Resource Management, 42(1), 3–21. doi: 10.1002/hrm.10061
66
Kolk, A., Levy, D., & Pinkse, J. (2008). Corporate responses in an emerging climate
regime: The institutionalization and commensuration of carbon disclosure. European
Accounting Review, 17(4), 719–745. doi: 10.1080/09638180802489121
Laine, M. (2009). Ensuring legitimacy through rhetorical changes? Accounting, Auditing
& Accountability Journal, 22(7), 1029–1054. doi: 10.1108/09513570910987367
Lauwo, S., & Otusanya, O. J. (2014). Corporate accountability and human rights
disclosures: A case study of Barrick Gold Mine in Tanzania. Accounting Forum, 38(2),
91–108. doi: 10.1016/j.accfor.2013.06.002
M.V. Lee Badgett, Sears, B., Holning Lau, & Deborah Ho. (2009). Bias in the workplace:
Consistent evidence of sexual orientation and gender identity discrimination 1998-2008.
Chicago-Kent Law Review, 84(2), 559–595.
Macdougall, B. A., Valley, J., Adler, J., Bettel, C., Param, A., Schmidt, J., … Suppa, O.
(2017). 2017 Diversity Disclosure Practices.
Marimon, F., Alonso-Almeida, M. D. M., Rodríguez, M. D. P., & Cortez Alejandro, K. A.
(2012). The worldwide diffusion of the global reporting initiative: What is the point?
Journal of Cleaner Production, 33, 132–144. doi:10.1016/j.jclepro.2012.04.017
Marques, J. (2008). Workplace diversity: developing a win‐ win‐ win strategy.
Development and Learning in Organizations: An International Journal, 22(5), 5–8. doi:
10.1108/14777280810896372
McAllister, M. (1997). Profiting from Diversity. Equal Opportunities International, 16,
23–33.
McLeod, P. L., Lobel, S. A., & Cox Jr, T. H. (1996). Ethnic diversity and creativity in
small groups. Small group research, 27(2), 248-264.
McPhail, K., & Adams, C. A. (2016). Corporate respect for human rights: meaning, scope,
and the shifting order of discourse. Accounting, Auditing & Accountability Journal, 29(4),
650-678. doi: 10.1108/AAAJ-09-2015-2241
67
Moore, S., & Tailby, S. (2015). The changing face of employment relations: equality and
diversity. Employee Relations, 37(6), 705–719. doi: 10.1108/ER-06-2015-0115
Moseñe, J. A., Burritt, R. L., Sanagustín, M. V., Moneva, J. M., & Tingey-Holyoak, J.
(2013). Environmental reporting in the Spanish wind energy sector: An institutional view.
Journal of Cleaner Production, 40, 199–211.
Mullian,. S., & Krual, C. (1996, 11 16). Retrieved from Log Angeles Times:
http://articles.latimes.com/1996-11-16/news/mn-65290_1_texaco-settles-race-bias-suit
Nancherla, A. (2008). Nobody’s Perfect: Diversity Training Study Finds Common Flaws.
T+D, (May), 20.
Neu, D., Warsame, H., & Pedwell, K. (1998). Managing Public Impressions:
Environmental Disclosures in Annual Reports. Accounting, Organizations and Society,
23(3), 265–282.
Parker, L. D. (2005). Social and environmental accountability research: A view from the
commentary box. Accounting, Auditing & Accountability Journal, 18(6), 842-860. doi:
10.1108/09513570510627739
Perry, M., & Bodkin, C. (2000). Content analysis of 100 company web sites. Corporate
Communications: An International Journal, 5(2), 87–97.
Rao, A. (2012). Managing diversity: Impact of religion in the Indian workplace. Journal of
World Business, 47(2), 232–239. doi:10.1016/j.jwb.2011.04.010
Rawat, P. S., & Basergekar, P. (2016). Managing workplace diversity: Performance of
minority employees. Indian Journal of Industrial Relations, 51(3), 488–501.
Reuters. (2017, Jan 11). Retrieved from http://www.reuters.com/article/walmart-
verdict/wal-mart-told-to-pay-pharmacist-16-08-mln-for-gender-bias-sum-may-drop-
idUSL1N1F0184.
Russo-Spena, T., Tregua, M., & de Chiara, A. (2016). Trends and Drivers in CSR
Disclosure: A Focus on Reporting Practices in the Automotive Industry. Journal of
Business Ethics, 1–16. doi: 10.1007/s10551-016-3235-2
68
Ryan, M. K., & Haslam, S. A. (2005). The glass cliff: Evidence that women are over-
represented in precarious leadership positions. British Journal of Management, 16(2), 81–
90. doi: 10.1111/j.1467-8551.2005.00433.x
Sandberg, M., & Holmlund, M. (2015). Impression management tactics in sustainability
reporting. Social Responsibility Journal, 11(4), 677–689. doi: 10.1108/SRJ-12-2013-0152
Schneid, M., Isidor, R., Steinmetz, H., & Kabst, R. (2016). Age diversity and team
outcomes: a quantitative review. Journal of Managerial Psychology, 31(1), 2–17. doi:
10.1108/JMP-07-2012-0228
Seawright, J., & Gerring, J. (2008). Case Selection Techniques in Case Study Research A
Menu of Qualitative and Quantitative Options. Political Research Quarterly, 61226(2),
294–308. doi: 10.1177/1065912907313077
Seierstad, C., Gabaldon, P., & Mensi-Klarbach, H. (2017). Gender Diversity in the
Boardroom, 1(November), 1–263.
Sen, M., Mukherjee, K., & Pattanayak, J. K. (2011). Corporate environmental disclosure
practices in India. Journal of Applied Accounting Research, 12(2), 139–156. doi:
10.1108/09675421111160709
DiGuilio, L. (2010). The Second Round of G3 Reports: Is Triple Bottom Line Reporting
Becoming More Comparable? Journal of Business & Economics Research, 8(9).
Smith, D. L. (2014). The relationship between employment and veteran status, disability
and gender from 2004-2011 Behavioral Risk Factor Surveillance System (BRFSS). Work,
49(2), 325–334. doi: 10.3233/WOR-131648
Spear, S., & Roper, S. (2013). Using corporate stories to build the corporate brand: an
impression management perspective. Journal of Product & Brand Management, 22(7),
491–501. doi: 10.1108/JPBM-09-2013-0387
Stanny, E. (2013). Voluntary Disclosures of Emissions by US Firms. Business Strategy
and the Environment, 22(3), 145–158. doi: 10.1002/bse.1732
69
Syed, J. (2007). “The other woman” and the question of equal opportunity in Australian
organizations. The International Journal of Human Resource Management, 18(11), 1954–
1978. doi: 10.1080/09585190701638184
Syed, J., & Kramar, R. (2009). What is the Australian model for managing cultural
diversity? Personnel Review, 39(1), 96–115. doi: 10.1108/00483481011007887
Tagesson, T., Blank, V., Broberg, P., & Collin, S.-O. (2009). What explains the extent and
content of social disclosures on corporate websites? A Study of Social and Environmental
Reporting in Swedish Listed Corporations. Corporate Social Responsibility and
Environmental Management, 364(3), 352–364. doi: 10.1002/csr.194
Tanikawa, T., Kim, S., & Jung, Y. (2017). Top management team diversity and firm
performance: exploring a function of age. Team Performance Management, 23(3/4), 156–
170.
Tata, J., & Prasad, S. (2015). CSR Communication: An Impression Management
Perspective. Journal of Business Ethics, 132(4), 765–778. doi: 10.1007/s10551-014-2328-
z
Tooley, S., & Guthrie, J. (2007a). Reporting Performance by New Zealand Secondary
Schools: An Analysis of Disclosures. Financial Accountability & Management, 23(4),
351–374. doi: 10.1111/j.1468-0408.2007.00433.x
Tooley, S., & Guthrie, J. (2007b). Reporting Performance by New Zealand Secondary
Schools: An Analysis of Disclosures. Financial Accountability & Management, 23(4),
351–374.
Watson, A., Shrives, P., & Marston, C. (2002). Voluntary disclosure of accounting ratios
in the UK. The British Accounting Review, 34(4), 289-313. doi: 10.1006/S0890-
8389(02)00077-x
Wegge, J., Roth, C., Neubach, B., Schmidt, K. H., & Kanfer, R. (2008). Age and gender
diversity as determinants of performance and health in a public organization: the role of
task complexity and group size. Journal of Applied Psychology, 93(6), 1301–1313. doi:
10.1037/a0012680
Williamson, R. L., Beiler-May, A., Locklear, L. R., & Clark, M. A. (2017). Bringing home
what I′ m hiding at work: The impact of sexual orientation disclosure at work for same-sex
couples. Journal of Vocational Behavior, 103, 7-22.
70
Wright, T., Colgan, F., Creegany, C., & McKearney, A. (2006). Lesbian, gay and bisexual
workers: equality, diversity and inclusion in the workplace. Equal Opportunities
International, 25(6), 465–470. doi: 10.1108/02610150610713782
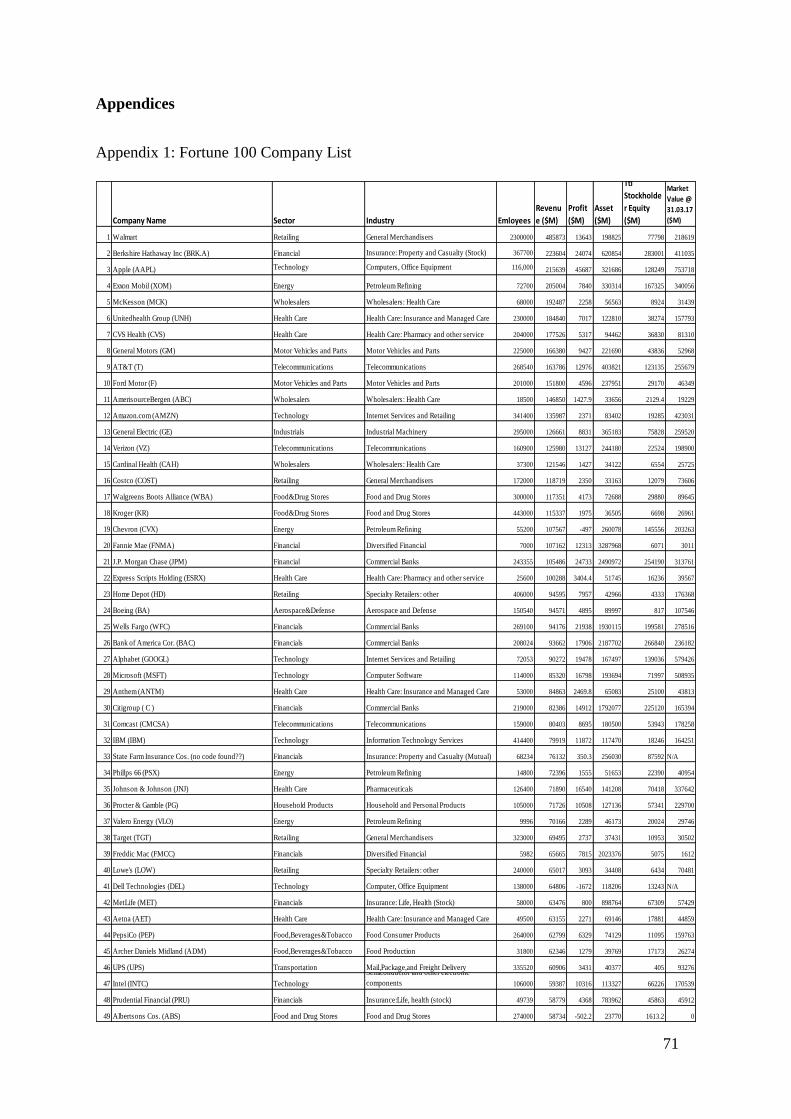
71
Appendices
Appendix 1: Fortune 100 Company List
Company Name Sector Industry Emloyees
Revenu
e ($M)
Profit
($M)
Asset
($M)
Ttl
Stockholde
r Equity
($M)
Market
Value @
31.03.17
($M)
1 Walmart Retailing General Merchandisers 2300000 485873 13643 198825 77798 218619
2 Berkshire Hathaway Inc (BRK.A) Financial Insurance: Property and Casualty (Stock) 367700 223604 24074 620854 283001 411035
3 Apple (AAPL) Technology Computers, Office Equipment 116,000 215639 45687 321686 128249 753718
4 Exxon Mobil (XOM) Energy Petroleum Refining 72700 205004 7840 330314 167325 340056
5 McKesson (MCK) Wholesalers Wholesalers: Health Care 68000 192487 2258 56563 8924 31439
6 Unitedhealth Group (UNH) Health Care Health Care: Insurance and Managed Care 230000 184840 7017 122810 38274 157793
7 CVS Health (CVS) Health Care Health Care: Pharmacy and other service 204000 177526 5317 94462 36830 81310
8 General Motors (GM) Motor Vehicles and Parts Motor Vehicles and Parts 225000 166380 9427 221690 43836 52968
9 AT&T (T) Telecommunications Telecommunications 268540 163786 12976 403821 123135 255679
10 Ford Motor (F) Motor Vehicles and Parts Motor Vehicles and Parts 201000 151800 4596 237951 29170 46349
11 AmerisourceBergen (ABC) Wholesalers Wholesalers: Health Care 18500 146850 1427.9 33656 2129.4 19229
12 Amazon.com (AMZN) Technology Internet Services and Retailing 341400 135987 2371 83402 19285 423031
13 General Electric (GE) Industrials Industrial Machinery 295000 126661 8831 365183 75828 259520
14 Verizon (VZ) Telecommunications Telecommunications 160900 125980 13127 244180 22524 198900
15 Cardinal Health (CAH) Wholesalers Wholesalers: Health Care 37300 121546 1427 34122 6554 25725
16 Costco (COST) Retailing General Merchandisers 172000 118719 2350 33163 12079 73606
17 Walgreens Boots Alliance (WBA) Food&Drug Stores Food and Drug Stores 300000 117351 4173 72688 29880 89645
18 Kroger (KR) Food&Drug Stores Food and Drug Stores 443000 115337 1975 36505 6698 26961
19 Chevron (CVX) Energy Petroleum Refining 55200 107567 -497 260078 145556 203263
20 Fannie Mae (FNMA) Financial Diversified Financial 7000 107162 12313 3287968 6071 3011
21 J.P. Morgan Chase (JPM) Financial Commercial Banks 243355 105486 24733 2490972 254190 313761
22 Express Scripts Holding (ESRX) Health Care Health Care: Pharmacy and other service 25600 100288 3404.4 51745 16236 39567
23 Home Depot (HD) Retailing Specialty Retailers: other 406000 94595 7957 42966 4333 176368
24 Boeing (BA) Aerospace&Defense Aerospace and Defense 150540 94571 4895 89997 817 107546
25 Wells Fargo (WFC) Financials Commercial Banks 269100 94176 21938 1930115 199581 278516
26 Bank of America Cor. (BAC) Financials Commercial Banks 208024 93662 17906 2187702 266840 236182
27 Alphabet (GOOGL) Technology Internet Services and Retailing 72053 90272 19478 167497 139036 579426
28 Microsoft (MSFT) Technology Computer Software 114000 85320 16798 193694 71997 508935
29 Anthem (ANTM) Health Care Health Care: Insurance and Managed Care 53000 84863 2469.8 65083 25100 43813
30 Citigroup ( C ) Financials Commercial Banks 219000 82386 14912 1792077 225120 165394
31 Comcast (CMCSA) Telecommunications Telecommunications 159000 80403 8695 180500 53943 178258
32 IBM (IBM) Technology Information Technology Services 414400 79919 11872 117470 18246 164251
33 State Farm Insurance Cos. (no code found??) Financials Insurance: Property and Casualty (Mutual) 68234 76132 350.3 256030 87592 N/A
34 Phillps 66 (PSX) Energy Petroleum Refining 14800 72396 1555 51653 22390 40954
35 Johnson & Johnson (JNJ) Health Care Pharmaceuticals 126400 71890 16540 141208 70418 337642
36 Procter & Gamble (PG) Household Products Household and Personal Products 105000 71726 10508 127136 57341 229700
37 Valero Energy (VLO) Energy Petroleum Refining 9996 70166 2289 46173 20024 29746
38 Target (TGT) Retailing General Merchandisers 323000 69495 2737 37431 10953 30502
39 Freddic Mac (FMCC) Financials Diversified Financial 5982 65665 7815 2023376 5075 1612
40 Lowe's (LOW) Retailing Specialty Retailers: other 240000 65017 3093 34408 6434 70481
41 Dell Technologies (DEL) Technology Computer, Office Equipment 138000 64806 -1672 118206 13243 N/A
42 MetLife (MET) Financials Insurance: Life, Health (Stock) 58000 63476 800 898764 67309 57429
43 Aetna (AET) Health Care Health Care: Insurance and Managed Care 49500 63155 2271 69146 17881 44859
44 PepsiCo (PEP) Food,Beverages&Tobacco Food Consumer Products 264000 62799 6329 74129 11095 159763
45 Archer Daniels Midland (ADM) Food,Beverages&Tobacco Food Production 31800 62346 1279 39769 17173 26274
46 UPS (UPS) Transportation Mail,Package,and Freight Delivery 335520 60906 3431 40377 405 93276
47 Intel (INTC) Technology
Semiconductor and other electronic
components 106000 59387 10316 113327 66226 170539
48 Prudential Financial (PRU) Financials Insurance:Life, health (stock) 49739 58779 4368 783962 45863 45912
49 Albertsons Cos. (ABS) Food and Drug Stores Food and Drug Stores 274000 58734 -502.2 23770 1613.2 0
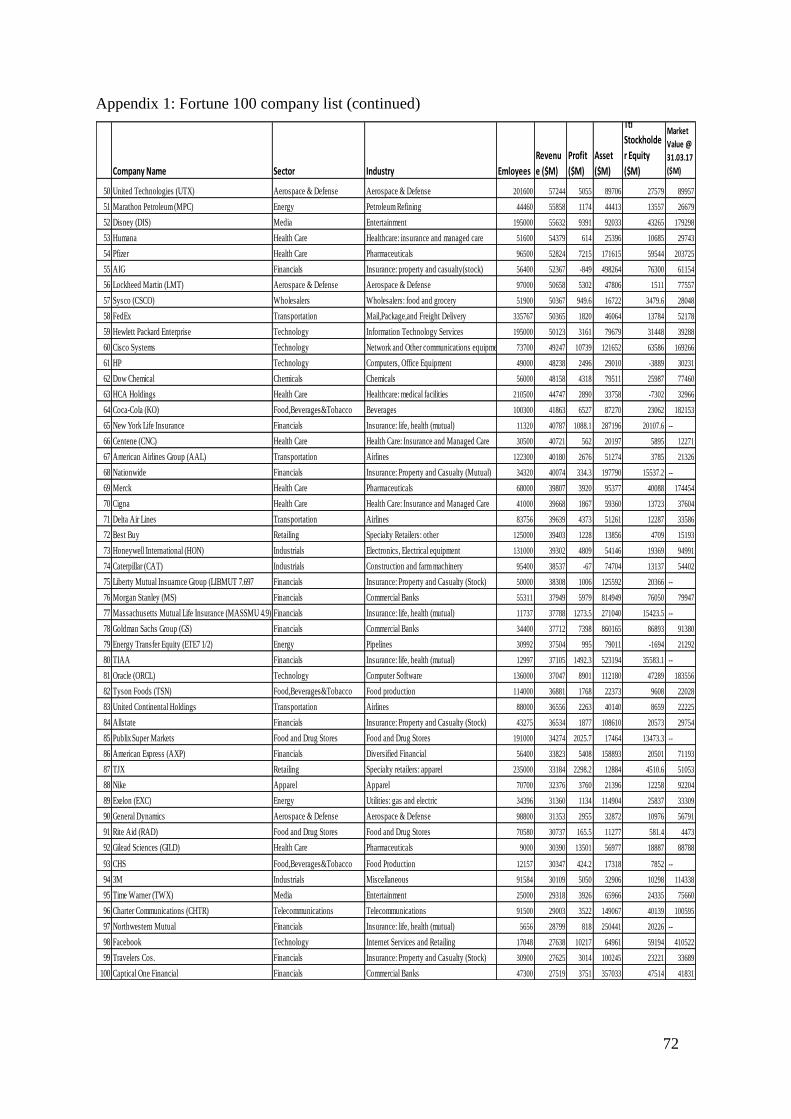
72
Appendix 1: Fortune 100 company list (continued)
Company Name Sector Industry Emloyees
Revenu
e ($M)
Profit
($M)
Asset
($M)
Ttl
Stockholde
r Equity
($M)
Market
Value @
31.03.17
($M)
50 United Technologies (UTX) Aerospace & Defense Aerospace & Defense 201600 57244 5055 89706 27579 89957
51 Marathon Petroleum (MPC) Energy Petroleum Refining 44460 55858 1174 44413 13557 26679
52 Disney (DIS) Media Entertainment 195000 55632 9391 92033 43265 179298
53 Humana Health Care Healthcare: insurance and managed care 51600 54379 614 25396 10685 29743
54 Pfizer Health Care Pharmaceuticals 96500 52824 7215 171615 59544 203725
55 AIG Financials Insurance: property and casualty(stock) 56400 52367 -849 498264 76300 61154
56 Lockheed Martin (LMT) Aerospace & Defense Aerospace & Defense 97000 50658 5302 47806 1511 77557
57 Sysco (CSCO) Wholesalers Wholesalers: food and grocery 51900 50367 949.6 16722 3479.6 28048
58 FedEx Transportation Mail,Package,and Freight Delivery 335767 50365 1820 46064 13784 52178
59 Hewlett Packard Enterprise Technology Information Technology Services 195000 50123 3161 79679 31448 39288
60 Cisco Systems Technology Network and Other communications equipment 73700 49247 10739 121652 63586 169266
61 HP Technology Computers, Office Equipment 49000 48238 2496 29010 -3889 30231
62 Dow Chemical Chemicals Chemicals 56000 48158 4318 79511 25987 77460
63 HCA Holdings Health Care Healthcare: medical facilities 210500 44747 2890 33758 -7302 32966
64 Coca-Cola (KO) Food,Beverages&Tobacco Beverages 100300 41863 6527 87270 23062 182153
65 New York Life Insurance Financials Insurance: life, health (mutual) 11320 40787 1088.1 287196 20107.6 --
66 Centene (CNC) Health Care Health Care: Insurance and Managed Care 30500 40721 562 20197 5895 12271
67 American Airlines Group (AAL) Transportation Airlines 122300 40180 2676 51274 3785 21326
68 Nationwide Financials Insurance: Property and Casualty (Mutual) 34320 40074 334.3 197790 15537.2 --
69 Merck Health Care Pharmaceuticals 68000 39807 3920 95377 40088 174454
70 Cigna Health Care Health Care: Insurance and Managed Care 41000 39668 1867 59360 13723 37604
71 Delta Air Lines Transportation Airlines 83756 39639 4373 51261 12287 33586
72 Best Buy Retailing Specialty Retailers: other 125000 39403 1228 13856 4709 15193
73 Honeywell International (HON) Industrials Electronics, Electrical equipment 131000 39302 4809 54146 19369 94991
74 Caterpillar (CAT) Industrials Construction and farm machinery 95400 38537 -67 74704 13137 54402
75 Liberty Mutual Insuarnce Group (LIBMUT 7.697 Financials Insurance: Property and Casualty (Stock) 50000 38308 1006 125592 20366 --
76 Morgan Stanley (MS) Financials Commercial Banks 55311 37949 5979 814949 76050 79947
77 Massachusetts Mutual Life Insurance (MASSMU 4.9) Financials Insurance: life, health (mutual) 11737 37788 1273.5 271040 15423.5 --
78 Goldman Sachs Group (GS) Financials Commercial Banks 34400 37712 7398 860165 86893 91380
79 Energy Transfer Equity (ETE7 1/2) Energy Pipelines 30992 37504 995 79011 -1694 21292
80 TIAA Financials Insurance: life, health (mutual) 12997 37105 1492.3 523194 35583.1 --
81 Oracle (ORCL) Technology Computer Software 136000 37047 8901 112180 47289 183556
82 Tyson Foods (TSN) Food,Beverages&Tobacco Food production 114000 36881 1768 22373 9608 22028
83 United Continental Holdings Transportation Airlines 88000 36556 2263 40140 8659 22225
84 Allstate Financials Insurance: Property and Casualty (Stock) 43275 36534 1877 108610 20573 29754
85 Publix Super Markets Food and Drug Stores Food and Drug Stores 191000 34274 2025.7 17464 13473.3 --
86 American Express (AXP) Financials Diversified Financial 56400 33823 5408 158893 20501 71193
87 TJX Retailing Specialty retailers: apparel 235000 33184 2298.2 12884 4510.6 51053
88 Nike Apparel Apparel 70700 32376 3760 21396 12258 92204
89 Exelon (EXC) Energy Utilities: gas and electric 34396 31360 1134 114904 25837 33309
90 General Dynamics Aerospace & Defense Aerospace & Defense 98800 31353 2955 32872 10976 56791
91 Rite Aid (RAD) Food and Drug Stores Food and Drug Stores 70580 30737 165.5 11277 581.4 4473
92 Gilead Sciences (GILD) Health Care Pharmaceuticals 9000 30390 13501 56977 18887 88788
93 CHS Food,Beverages&Tobacco Food Production 12157 30347 424.2 17318 7852 --
94 3M Industrials Miscellaneous 91584 30109 5050 32906 10298 114338
95 Time Warner (TWX) Media Entertainment 25000 29318 3926 65966 24335 75660
96 Charter Communications (CHTR) Telecommunications Telecommunications 91500 29003 3522 149067 40139 100595
97 Northwestern Mutual Financials Insurance: life, health (mutual) 5656 28799 818 250441 20226 --
98 Facebook Technology Internet Services and Retailing 17048 27638 10217 64961 59194 410522
99 Travelers Cos. Financials Insurance: Property and Casualty (Stock) 30900 27625 3014 100245 23221 33689
100 Captical One Financial Financials Commercial Banks 47300 27519 3751 357033 47514 41831
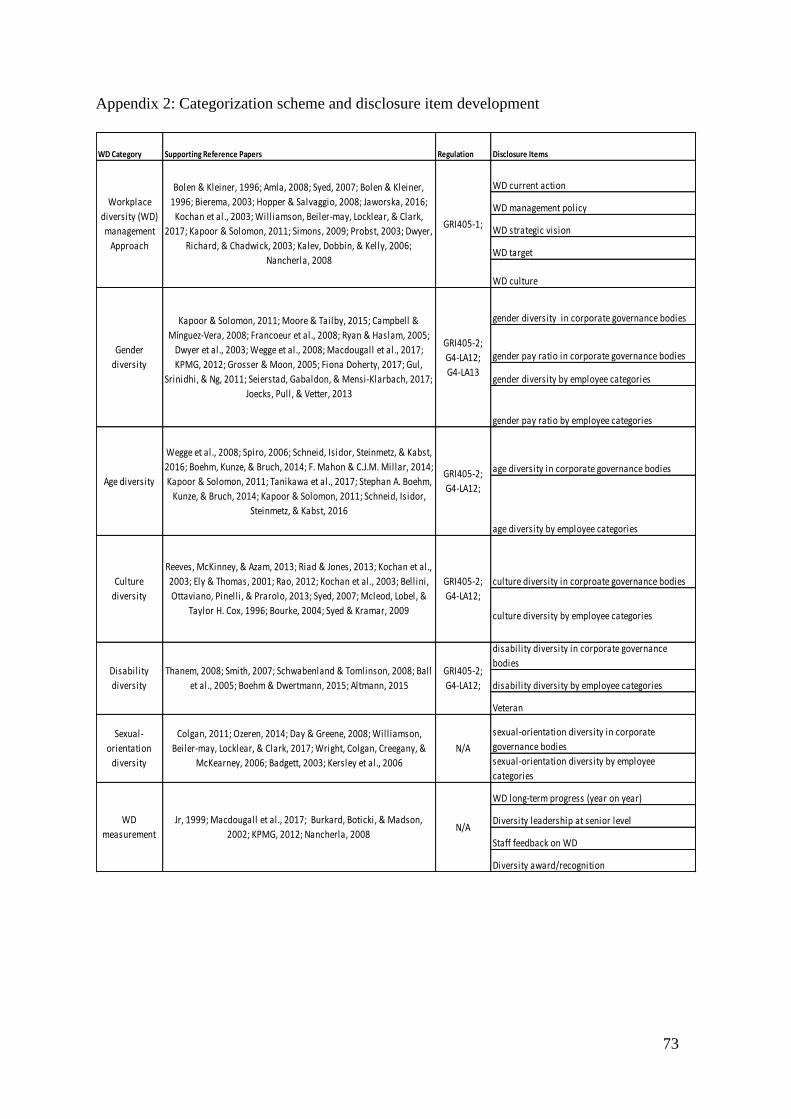
73
Appendix 2: Categorization scheme and disclosure item development
WD Category Supporting Reference Papers Regulation Disclosure Items
WD current action
WD management policy
WD strategic vision
WD target
WD culture
gender diversity in corporate governance bodies
gender pay ratio in corporate governance bodies
gender diversity by employee categories
gender pay ratio by employee categories
age diversity in corporate governance bodies
age diversity by employee categories
culture diversity in corproate governance bodies
culture diversity by employee categories
disability diversity in corporate governance
bodies
disability diversity by employee categories
Veteran
sexual-orientation diversity in corporate
governance bodies
sexual-orientation diversity by employee
categories
WD long-term progress (year on year)
Diversity leadership at senior level
Staff feedback on WD
Diversity award/recognition
GRI405-2;
G4-LA12;
GRI405-2;
G4-LA12;
N/A
Thanem, 2008; Smith, 2007; Schwabenland & Tomlinson, 2008; Ball
et al., 2005; Boehm & Dwertmann, 2015; Altmann, 2015
Colgan, 2011; Ozeren, 2014; Day & Greene, 2008; Will iamson,
Beiler-may, Locklear, & Clark, 2017; Wright, Colgan, Creegany, &
McKearney, 2006; Badgett, 2003; Kersley et al., 2006
Wegge et al., 2008; Spiro, 2006; Schneid, Isidor, Steinmetz, & Kabst,
2016; Boehm, Kunze, & Bruch, 2014; F. Mahon & C.J.M. Millar, 2014;
Kapoor & Solomon, 2011; Tanikawa et al., 2017; Stephan A. Boehm,
Kunze, & Bruch, 2014; Kapoor & Solomon, 2011; Schneid, Isidor,
Steinmetz, & Kabst, 2016
Age diversity
Culture
diversity
N/A
Reeves, McKinney, & Azam, 2013; Riad & Jones, 2013; Kochan et al.,
2003; Ely & Thomas, 2001; Rao, 2012; Kochan et al., 2003; Bellini,
Ottaviano, Pinelli , & Prarolo, 2013; Syed, 2007; Mcleod, Lobel, &
Taylor H. Cox, 1996; Bourke, 2004; Syed & Kramar, 2009
GRI405-2;
G4-LA12;
Jr, 1999; Macdougall et al., 2017; Burkard, Boticki, & Madson,
2002; KPMG, 2012; Nancherla, 2008
GRI405-1;
Workplace
diversity (WD)
management
Approach
Gender
diversity
Disability
diversity
Sexual-
orientation
diversity
WD
measurement
Kapoor & Solomon, 2011; Moore & Tailby, 2015; Campbell &
Mínguez-Vera, 2008; Francoeur et al., 2008; Ryan & Haslam, 2005;
Dwyer et al., 2003; Wegge et al., 2008; Macdougall et al., 2017;
KPMG, 2012; Grosser & Moon, 2005; Fiona Doherty, 2017; Gul,
Srinidhi, & Ng, 2011; Seierstad, Gabaldon, & Mensi-Klarbach, 2017;
Joecks, Pull, & Vetter, 2013
GRI405-2;
G4-LA12;
G4-LA13
Bolen & Kleiner, 1996; Amla, 2008; Syed, 2007; Bolen & Kleiner,
1996; Bierema, 2003; Hopper & Salvaggio, 2008; Jaworska, 2016;
Kochan et al., 2003; Will iamson, Beiler-may, Locklear, & Clark,
2017; Kapoor & Solomon, 2011; Simons, 2009; Probst, 2003; Dwyer,
Richard, & Chadwick, 2003; Kalev, Dobbin, & Kelly, 2006;
Nancherla, 2008
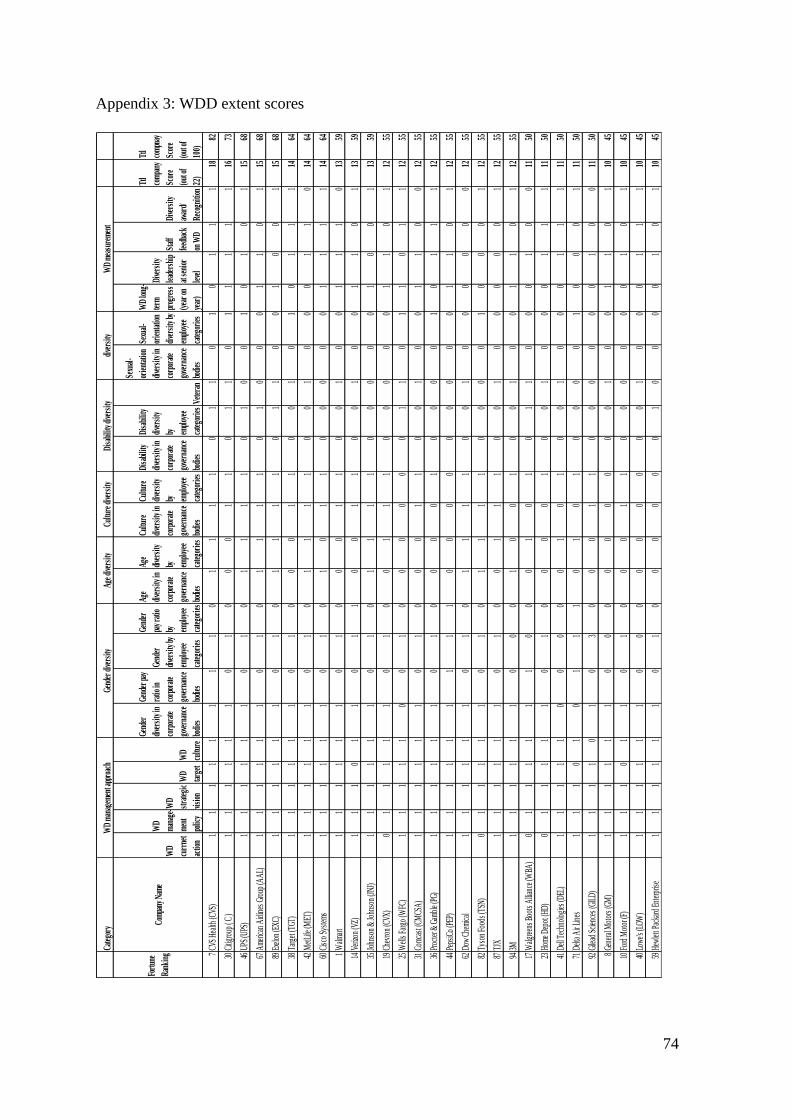
74
Appendix 3: WDD extent scores
Cate
gory
Fort
une
Rank
ing
Com
pany
Nam
eW
D
curr
net
actio
n
WD
man
age-
men
t
polic
y
WD
stra
tegi
c
visio
n
WD
targ
et
WD
cultu
re
Gend
er
dive
rsity
in
corp
orat
e
gove
rnan
ce
bodi
es
Gend
er pa
y
ratio
in
corp
orat
e
gove
rnan
ce
bodi
es
Gend
er
dive
rsity
by
empl
oyee
cate
gori
es
Gend
er
pay r
atio
by
empl
oyee
cate
gori
es
Age
dive
rsity
in
corp
orat
e
gove
rnan
ce
bodi
es
Age
dive
rsity
by
empl
oyee
cate
gori
es
Cultu
re
dive
rsity
in
corp
orat
e
gove
rnan
ce
bodi
es
Cultu
re
dive
rsity
by
empl
oyee
cate
gori
es
Disa
bilit
y
dive
rsity
in
corp
orat
e
gove
rnan
ce
bodi
es
Disa
bilit
y
dive
rsity
by
empl
oyee
cate
gori
esVe
tera
n
Sexu
al-
orie
ntat
ion
dive
rsity
in
corp
orat
e
gove
rnan
ce
bodi
es
Sexu
al-
orie
ntat
ion
dive
rsity
by
empl
oyee
cate
gori
es
WD
long
-
term
prog
ress
(yea
r on
year
)
Dive
rsity
lead
ersh
ip
at se
nior
leve
l
Staf
f
feed
back
on W
D
Dive
rsity
awar
d/
Reco
gniti
on
Ttl
com
pany
Scor
e
(out
of
22)
Ttl
com
pnay
Scor
e
(out
of
100)
7CV
S He
alth
(CVS
)1
11
11
11
10
11
11
01
10
10
11
118
82
30Ci
tigro
up (
C )
11
11
11
01
00
01
10
11
01
11
11
1673
46UP
S (U
PS)
11
11
11
01
01
11
10
10
01
01
01
1568
67A
meric
an A
irlin
es G
roup
(AA
L)1
11
11
10
10
11
11
01
00
01
10
115
68
89Ex
elon
(EXC
)1
11
11
10
10
11
11
01
10
01
00
115
68
38Ta
rget
(TGT
)1
11
11
10
10
00
11
00
10
10
11
114
64
42M
etLi
fe (M
ET)
11
11
11
01
01
11
10
01
00
01
10
1464
60Ci
sco
Syst
ems
11
11
11
01
01
01
10
00
00
11
11
1464
1W
almar
t1
11
11
10
10
00
11
00
10
01
11
013
59
14Ve
rizon
(VZ)
11
10
11
01
10
01
10
01
00
11
01
1359
35Jo
hnso
n &
John
son
(JNJ)
11
11
11
01
01
11
10
00
00
10
01
1359
19Ch
evro
n (C
VX)
01
11
11
01
00
11
10
00
00
11
01
1255
25W
ells F
argo
(WFC
)1
11
11
00
10
00
00
01
10
11
01
112
55
31Co
mcas
t (CM
CSA
)1
11
11
10
10
00
11
00
10
01
10
012
55
36Pr
octe
r & G
ambl
e (PG
)1
11
11
10
10
00
01
00
00
10
11
112
55
44Pe
psiC
o (P
EP)
11
11
11
11
10
00
00
00
00
11
01
1255
62Do
w Ch
emica
l1
11
11
10
10
11
11
00
10
00
00
012
55
82Ty
son
Food
s (TS
N)0
11
11
10
10
11
11
00
00
10
00
112
55
87TJ
X1
11
11
10
10
01
11
00
10
00
00
112
55
943M
11
11
11
00
01
00
10
01
00
11
01
1255
17W
algre
ens B
oots
Allia
nce (
WBA
)0
11
11
11
00
01
01
01
10
00
10
011
50
23Ho
me D
epot
(HD)
01
11
11
01
00
00
10
01
00
01
11
1150
41De
ll Tec
hnol
ogies
(DEL
)1
11
11
00
00
01
01
00
10
00
11
111
50
71De
lta A
ir Li
nes
11
10
10
11
10
10
10
00
01
00
01
1150
92Gi
lead
Scien
ces (
GILD
)1
11
10
10
30
00
11
00
00
00
10
011
50
8Ge
nera
l Mot
ors (
GM)
11
11
11
00
00
00
00
01
00
11
01
1045
10Fo
rd M
otor
(F)
11
10
11
01
00
01
10
00
00
01
01
1045
40Lo
we's
(LOW
)1
11
11
10
00
00
00
00
10
00
11
110
45
59He
wlet
t Pac
kard
Ent
erpr
ise1
11
11
10
10
00
00
01
00
00
10
110
45
WD
man
agem
ent a
ppro
ach
Gend
er di
vers
ity
Age d
ivers
ityCu
lture
dive
rsity
Disa
bilit
y dive
rsity
Sexu
al-o
rien
tatio
n
dive
rsity
WD
mea
sure
men
t
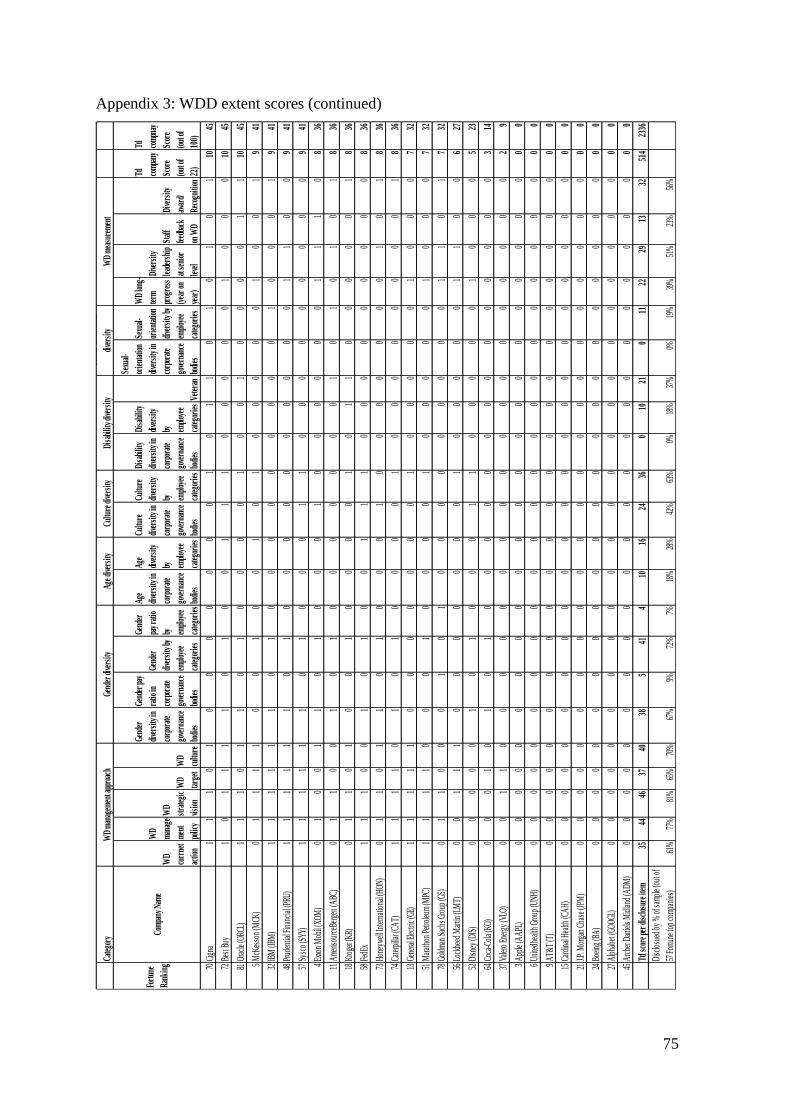
75
Appendix 3: WDD extent scores (continued)
Cate
gory
Fort
une
Rank
ing
Com
pany
Nam
eW
D
curr
net
actio
n
WD
man
age-
men
t
polic
y
WD
stra
tegi
c
visio
n
WD
targ
et
WD
cultu
re
Gend
er
dive
rsity
in
corp
orat
e
gove
rnan
ce
bodi
es
Gend
er pa
y
ratio
in
corp
orat
e
gove
rnan
ce
bodi
es
Gend
er
dive
rsity
by
empl
oyee
cate
gori
es
Gend
er
pay r
atio
by
empl
oyee
cate
gori
es
Age
dive
rsity
in
corp
orat
e
gove
rnan
ce
bodi
es
Age
dive
rsity
by
empl
oyee
cate
gori
es
Cultu
re
dive
rsity
in
corp
orat
e
gove
rnan
ce
bodi
es
Cultu
re
dive
rsity
by
empl
oyee
cate
gori
es
Disa
bilit
y
dive
rsity
in
corp
orat
e
gove
rnan
ce
bodi
es
Disa
bilit
y
dive
rsity
by
empl
oyee
cate
gori
esVe
tera
n
Sexu
al-
orie
ntat
ion
dive
rsity
in
corp
orat
e
gove
rnan
ce
bodi
es
Sexu
al-
orie
ntat
ion
dive
rsity
by
empl
oyee
cate
gori
es
WD
long
-
term
prog
ress
(yea
r on
year
)
Dive
rsity
lead
ersh
ip
at se
nior
leve
l
Staf
f
feed
back
on W
D
Dive
rsity
awar
d/
Reco
gniti
on
Ttl
com
pany
Scor
e
(out
of
22)
Ttl
com
pnay
Scor
e
(out
of
100)
70Ci
gna
11
10
10
00
00
00
10
11
01
01
01
1045
72Be
st B
uy1
01
11
10
10
01
11
00
00
01
00
010
45
81Or
acle
(ORC
L)1
11
01
10
10
00
01
00
10
00
01
110
45
5M
cKes
son
(MCK
)0
11
11
00
10
01
01
00
00
01
00
19
41
32IB
M (I
BM)
11
11
11
01
00
00
00
00
01
00
01
941
48Pr
uden
tial F
inan
cial (
PRU)
11
11
11
01
00
00
00
00
00
11
00
941
57Sy
sco
(SYY
)1
11
11
10
10
00
11
00
00
00
00
09
41
4Ex
xon
Mob
il (XO
M)
01
00
11
01
00
01
00
00
00
11
10
836
11A
meris
ourc
eBer
gen
(ABC
)0
11
00
10
10
00
00
00
10
10
10
18
36
18Kr
oger
(KR)
01
10
10
01
00
00
10
11
00
00
01
836
58Fe
dEx
11
10
01
01
00
11
10
00
00
00
00
836
73Ho
neyw
ell In
tern
atio
nal (
HON)
01
10
11
01
00
01
00
00
00
01
01
836
74Ca
terp
illar (
CAT)
11
11
01
01
00
00
10
00
00
00
01
836
13Ge
nera
l Elec
tric (
GE)
11
11
10
00
00
00
10
00
00
10
00
732
51M
arat
hon
Petro
leum
(MPC
)1
11
10
00
10
00
01
00
00
01
00
07
32
78Go
ldma
n Sa
chs G
roup
(GS)
01
10
00
10
10
00
00
00
00
11
01
732
56Lo
ckhe
ed M
artin
(LM
T)0
01
11
00
00
00
01
00
00
01
10
06
27
52Di
sney
(DIS
)0
00
00
10
10
00
11
00
00
01
00
05
23
64Co
ca-C
ola (
KO)
00
01
01
01
00
00
00
00
00
00
00
314
37Va
lero
Ener
gy (V
LO)
00
11
00
00
00
00
00
00
00
00
00
29
3A
pple
(AA
PL)
00
00
00
00
00
00
00
00
00
00
00
00
6Un
itedh
ealth
Gro
up (U
NH)
00
00
00
00
00
00
00
00
00
00
00
00
9A
T&T
(T)
00
00
00
00
00
00
00
00
00
00
00
00
15Ca
rdin
al He
alth
(CA
H)0
00
00
00
00
00
00
00
00
00
00
00
0
21J.P
. Mor
gan
Chas
e (JP
M)
00
00
00
00
00
00
00
00
00
00
00
00
24Bo
eing
(BA
)0
00
00
00
00
00
00
00
00
00
00
00
0
27A
lpha
bet (
GOOG
L)0
00
00
00
00
00
00
00
00
00
00
00
0
45A
rche
r Dan
iels M
idlan
d (A
DM)
00
00
00
00
00
00
00
00
00
00
00
00
Ttl s
core
per d
iscl
osur
e ite
m35
4446
3740
385
414
1016
2436
010
210
1122
2913
3251
423
36
Disc
losu
ed b
y %
of s
ampl
e (ou
t of
57 F
ortu
ne to
p co
mpan
ies)
61%
77%
81%
65%
70%
67%
9%72
%7%
18%
28%
42%
63%
0%18
%37
%0%
19%
39%
51%
23%
56%
WD
mea
sure
men
tW
D m
anag
emen
t app
roac
hGe
nder
dive
rsity
Ag
e dive
rsity
Cultu
re di
vers
ityDi
sabi
lity d
ivers
ity
Sexu
al-o
rien
tatio
n
dive
rsity
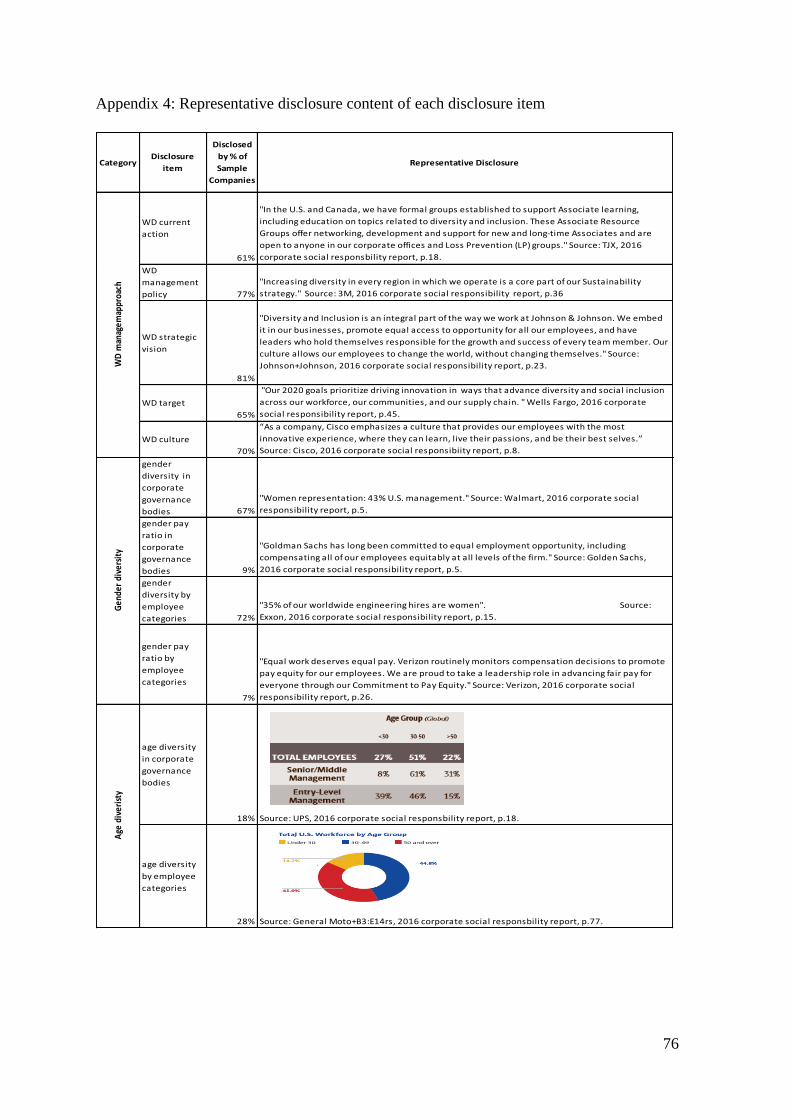
76
Appendix 4: Representative disclosure content of each disclosure item
CategoryDisclosure
item
Disclosed
by % of
Sample
Companies
Representative Disclosure
WD current
action
61%
"In the U.S. and Canada, we have formal groups established to support Associate learning,
including education on topics related to diversity and inclusion. These Associate Resource
Groups offer networking, development and support for new and long-time Associates and are
open to anyone in our corporate offices and Loss Prevention (LP) groups." Source: TJX, 2016
corporate social responsbility report, p.18.
WD
management
policy 77%
"Increasing diversity in every region in which we operate is a core part of our Sustainability
strategy." Source: 3M, 2016 corporate social responsibility report, p.36
WD strategic
vision
81%
"Diversity and Inclusion is an integral part of the way we work at Johnson & Johnson. We embed
it in our businesses, promote equal access to opportunity for all our employees, and have
leaders who hold themselves responsible for the growth and success of every team member. Our
culture allows our employees to change the world, without changing themselves." Source:
Johnson+Johnson, 2016 corporate social responsibility report, p.23.
WD target
65%
"Our 2020 goals prioritize driving innovation in ways that advance diversity and social inclusion
across our workforce, our communities, and our supply chain. " Wells Fargo, 2016 corporate
social responsibility report, p.45.
WD culture
70%
“As a company, Cisco emphasizes a culture that provides our employees with the most
innovative experience, where they can learn, live their passions, and be their best selves.”
Source: Cisco, 2016 corporate social responsibiity report, p.8.
gender
diversity in
corporate
governance
bodies 67%
"Women representation: 43% U.S. management." Source: Walmart, 2016 corporate social
responsibility report, p.5.
gender pay
ratio in
corporate
governance
bodies 9%
"Goldman Sachs has long been committed to equal employment opportunity, including
compensating all of our employees equitably at all levels of the firm." Source: Golden Sachs,
2016 corporate social responsibility report, p.5.
gender
diversity by
employee
categories 72%
"35% of our worldwide engineering hires are women". Source:
Exxon, 2016 corporate social responsibility report, p.15.
gender pay
ratio by
employee
categories
7%
"Equal work deserves equal pay. Verizon routinely monitors compensation decisions to promote
pay equity for our employees. We are proud to take a leadership role in advancing fair pay for
everyone through our Commitment to Pay Equity." Source: Verizon, 2016 corporate social
responsibility report, p.26.
age diversity
in corporate
governance
bodies
18% Source: UPS, 2016 corporate social responsbility report, p.18.
age diversity
by employee
categories
28% Source: General Moto+B3:E14rs, 2016 corporate social responsbility report, p.77.
Gen
der
dive
rsit
yW
D m
anag
emap
proa
chA
ge d
iver
isty
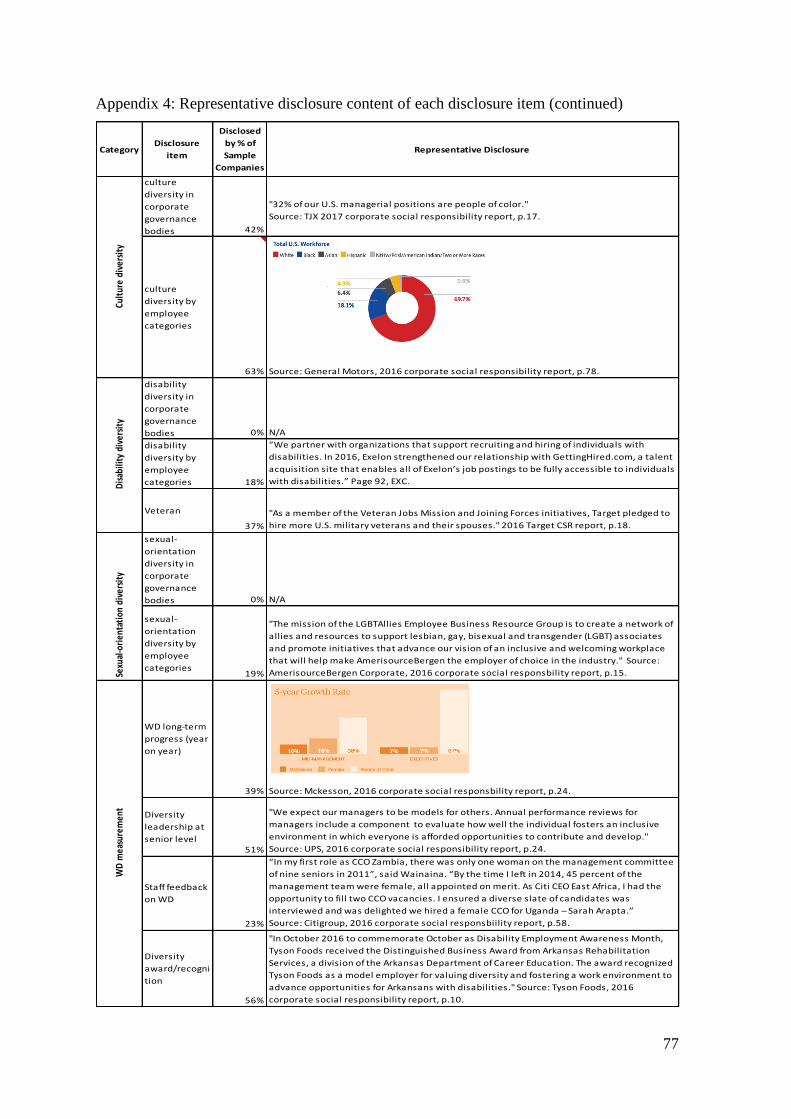
77
Appendix 4: Representative disclosure content of each disclosure item (continued)
CategoryDisclosure
item
Disclosed
by % of
Sample
Companies
Representative Disclosure
culture
diversity in
corporate
governance
bodies 42%
"32% of our U.S. managerial positions are people of color."
Source: TJX 2017 corporate social responsibility report, p.17.
culture
diversity by
employee
categories
63% Source: General Motors, 2016 corporate social responsibility report, p.78.
disability
diversity in
corporate
governance
bodies 0% N/A
disability
diversity by
employee
categories 18%
“We partner with organizations that support recruiting and hiring of individuals with
disabilities. In 2016, Exelon strengthened our relationship with GettingHired.com, a talent
acquisition site that enables all of Exelon’s job postings to be fully accessible to individuals
with disabilities.” Page 92, EXC.
Veteran
37%
"As a member of the Veteran Jobs Mission and Joining Forces initiatives, Target pledged to
hire more U.S. military veterans and their spouses." 2016 Target CSR report, p.18.
sexual-
orientation
diversity in
corporate
governance
bodies 0% N/A
sexual-
orientation
diversity by
employee
categories19%
"The mission of the LGBTAllies Employee Business Resource Group is to create a network of
allies and resources to support lesbian, gay, bisexual and transgender (LGBT) associates
and promote initiatives that advance our vision of an inclusive and welcoming workplace
that will help make AmerisourceBergen the employer of choice in the industry." Source:
AmerisourceBergen Corporate, 2016 corporate social responsbility report, p.15.
WD long-term
progress (year
on year)
39% Source: Mckesson, 2016 corporate social responsbility report, p.24.
Diversity
leadership at
senior level51%
"We expect our managers to be models for others. Annual performance reviews for
managers include a component to evaluate how well the individual fosters an inclusive
environment in which everyone is afforded opportunities to contribute and develop."
Source: UPS, 2016 corporate social responsibility report, p.24.
Staff feedback
on WD
23%
“In my first role as CCO Zambia, there was only one woman on the management committee
of nine seniors in 2011”, said Wainaina. “By the time I left in 2014, 45 percent of the
management team were female, all appointed on merit. As Citi CEO East Africa, I had the
opportunity to fill two CCO vacancies. I ensured a diverse slate of candidates was
interviewed and was delighted we hired a female CCO for Uganda – Sarah Arapta.”
Source: Citigroup, 2016 corporate social responsbiility report, p.58.
Diversity
award/recogni
tion
56%
"In October 2016 to commemorate October as Disability Employment Awareness Month,
Tyson Foods received the Distinguished Business Award from Arkansas Rehabilitation
Services, a division of the Arkansas Department of Career Education. The award recognized
Tyson Foods as a model employer for valuing diversity and fostering a work environment to
advance opportunities for Arkansans with disabilities." Source: Tyson Foods, 2016
corporate social responsibility report, p.10.
WD
mea
sure
men
tD
isab
ility
div
ersi
tySe
xual
-ori
enta
tion
div
ersi
tyCu
ltur
e di
vers
ity
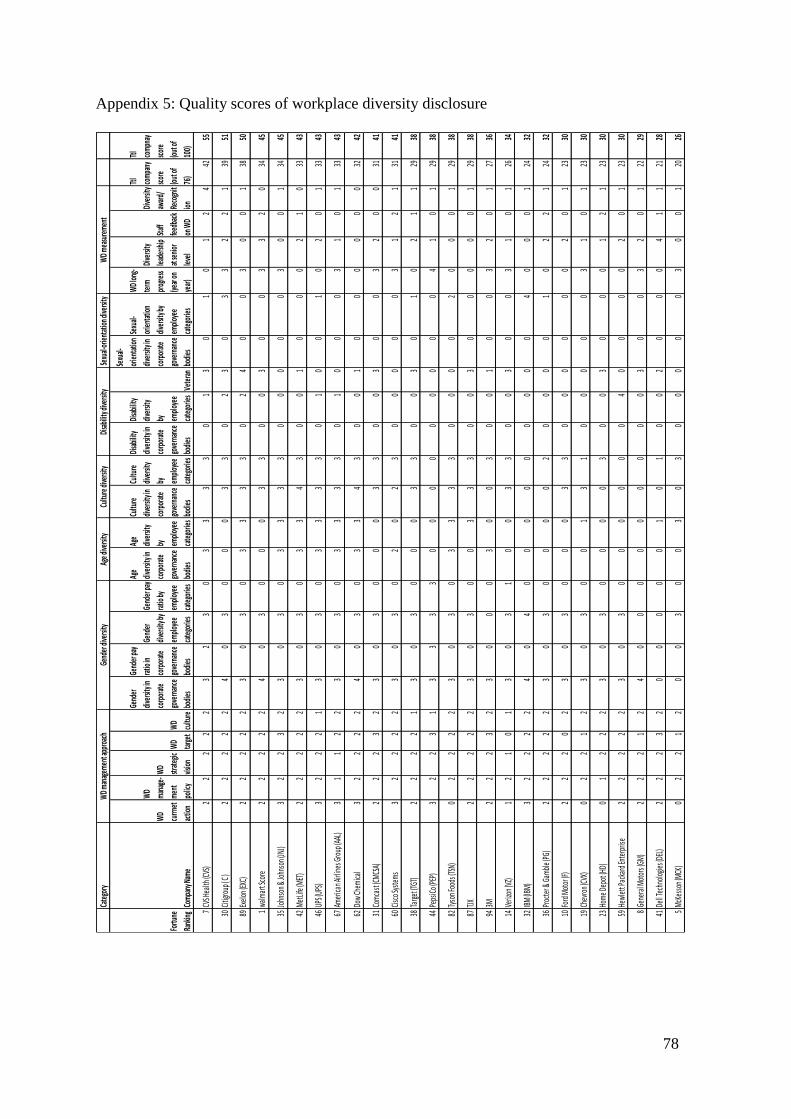
78
Appendix 5: Quality scores of workplace diversity disclosure
Cate
gory
Fortu
ne
Rank
ingCo
mpan
y Nam
e
WD
currn
et
actio
n
WD
mana
ge-
ment
polic
y
WD
strate
gic
vision
WD
targe
t
WD
cultu
re
Gend
er
diver
sity i
n
corp
orate
gove
rnan
ce
bodie
s
Gend
er pa
y
ratio
in
corp
orate
gove
rnan
ce
bodie
s
Gend
er
diver
sity b
y
emplo
yee
cate
gorie
s
Gend
er pa
y
ratio
by
emplo
yee
cate
gorie
s
Age
diver
sity i
n
corp
orate
gove
rnan
ce
bodie
s
Age
diver
sity
by
emplo
yee
cate
gorie
s
Cultu
re
diver
sity i
n
corp
orate
gove
rnan
ce
bodie
s
Cultu
re
diver
sity
by
emplo
yee
cate
gorie
s
Disab
ility
diver
sity i
n
corp
orate
gove
rnan
ce
bodie
s
Disab
ility
diver
sity
by
emplo
yee
cate
gorie
sVe
teran
Sexu
al-
orien
tation
diver
sity i
n
corp
orate
gove
rnan
ce
bodie
s
Sexu
al-
orien
tation
diver
sity b
y
emplo
yee
cate
gorie
s
WD l
ong-
term
prog
ress
(year
on
year)
Dive
rsity
leade
rship
at se
nior
level
Staff
feedb
ack
on W
D
Dive
rsity
award
/
Reco
gnit
ion
Ttl
comp
any
score
(out o
f
76)
Ttl
comp
nay
score
(out o
f
100)
7CV
S Hea
lth (C
VS)
22
22
23
23
03
33
30
13
01
01
24
4255
30Cit
igrou
p ( C
)2
22
22
40
30
00
33
02
30
33
22
139
51
89Ex
elon (
EXC)
22
22
23
03
03
33
30
24
00
30
01
3850
1wa
lmar
t Sco
re2
22
22
40
30
00
33
00
30
03
32
034
45
35Jo
hnso
n & Jo
hnso
n (JN
J)3
22
32
30
30
33
33
00
00
03
00
134
45
42Me
tLife
(MET
)2
22
22
30
30
33
43
00
10
00
21
033
43
46UP
S (UP
S)3
22
21
30
30
33
33
01
00
10
20
133
43
67Am
erica
n Airl
ines G
roup
(AAL
)3
11
22
30
30
33
33
01
00
03
10
133
43
62Do
w Ch
emica
l3
22
22
40
30
33
43
00
10
00
00
032
42
31Co
mcas
t (CMC
SA)
22
23
23
03
00
03
30
03
00
32
00
3141
60Cis
co Sy
stems
32
22
23
03
02
02
30
00
00
31
21
3141
38Ta
rget (T
GT)
22
22
13
03
00
03
30
03
01
02
11
2938
44Pe
psiCo
(PEP
)3
22
31
33
33
00
00
00
00
04
10
129
38
82Ty
son F
oods
(TSN
)0
22
22
30
30
33
33
00
00
20
00
129
38
87TJX
22
22
23
03
00
33
30
03
00
00
01
2938
943M
22
23
23
00
03
00
30
01
00
32
01
2736
14Ve
rizon
(VZ)
12
10
13
03
10
03
30
03
00
31
01
2634
32IBM
(IBM)
32
22
24
04
00
00
00
00
04
00
01
2432
36Pr
octe
r & Ga
mble
(PG)
22
22
23
03
00
00
20
00
01
02
21
2432
10Fo
rd M
otor
(F)
22
20
23
03
00
03
30
00
00
02
01
2330
19Ch
evro
n (CV
X)0
22
12
30
30
01
31
00
00
03
10
123
30
23Ho
me De
pot (H
D)0
12
22
30
30
00
03
00
30
00
12
123
30
59He
wlet
t Pac
kard
Ente
rpris
e2
22
22
30
30
00
00
04
00
00
20
123
30
8Ge
nera
l Mot
ors (
GM)
22
21
24
00
00
00
00
03
00
32
01
2229
41De
ll Tec
hnolo
gies (
DEL)
22
23
20
00
00
10
10
02
00
04
11
2128
5Mc
Kess
on (M
CK)
02
21
20
03
00
30
30
00
00
30
01
2026
WD m
easu
reme
ntW
D man
agem
ent a
ppro
ach
Gend
er di
versi
ty Ag
e dive
rsity
Cultu
re di
versi
tyDi
sabilit
y dive
rsity
Sexu
al-or
ientat
ion di
versi
ty
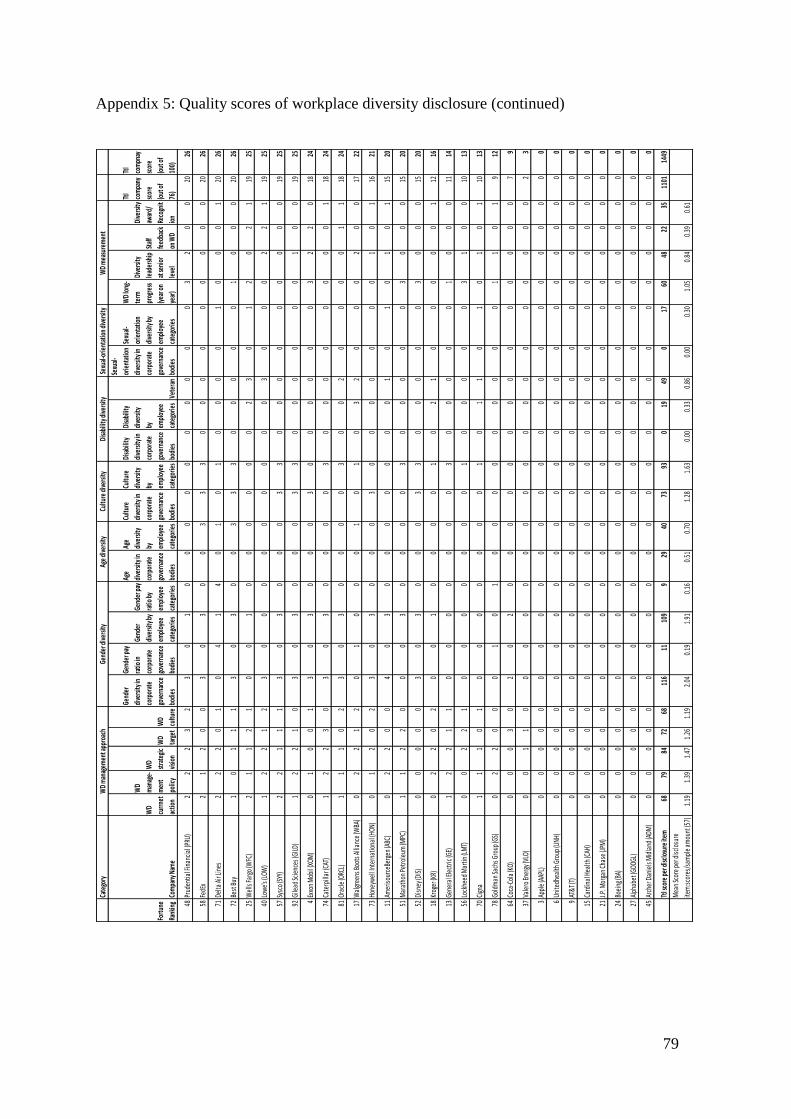
79
Appendix 5: Quality scores of workplace diversity disclosure (continued)
Cate
gory
Fortu
ne
Rank
ing
Com
pany
Nam
e
WD
currn
et
actio
n
WD
man
age-
men
t
polic
y
WD
strat
egic
visio
n
WD
targ
et
WD
cultu
re
Gend
er
dive
rsity
in
corp
orat
e
gove
rnan
ce
bodi
es
Gend
er pa
y
ratio
in
corp
orat
e
gove
rnan
ce
bodi
es
Gend
er
dive
rsity
by
empl
oyee
cate
gorie
s
Gend
er pa
y
ratio
by
empl
oyee
cate
gorie
s
Age
dive
rsity
in
corp
orat
e
gove
rnan
ce
bodi
es
Age
dive
rsity
by
empl
oyee
cate
gorie
s
Cultu
re
dive
rsity
in
corp
orat
e
gove
rnan
ce
bodi
es
Cultu
re
dive
rsity
by
empl
oyee
cate
gorie
s
Disa
bilit
y
dive
rsity
in
corp
orat
e
gove
rnan
ce
bodi
es
Disa
bilit
y
dive
rsity
by
empl
oyee
cate
gorie
sVe
tera
n
Sexu
al-
orie
ntat
ion
dive
rsity
in
corp
orat
e
gove
rnan
ce
bodi
es
Sexu
al-
orie
ntat
ion
dive
rsity
by
empl
oyee
cate
gorie
s
WD
long
-
term
prog
ress
(year
on
year
)
Dive
rsity
lead
ersh
ip
at se
nior
leve
l
Staff
feed
back
on W
D
Dive
rsity
awar
d/
Reco
gnit
ion
Ttl
com
pany
scor
e
(out
of
76)
Ttl
com
pnay
scor
e
(out
of
100)
48Pr
uden
tial F
inan
cial (P
RU)
22
23
23
01
00
00
00
00
00
32
00
2026
58Fe
dEx
21
20
03
03
00
33
30
00
00
00
00
2026
71De
lta Ai
r Lin
es2
22
01
04
14
01
01
00
00
10
00
120
26
72Be
st Bu
y1
01
11
30
30
03
33
00
00
01
00
020
26
25W
ells
Farg
o (W
FC)
21
12
10
01
00
00
00
23
01
20
21
1925
40Lo
we's
(LOW
)1
22
12
30
00
00
00
00
30
00
22
119
25
57Sy
sco (
SYY)
22
11
13
03
00
03
30
00
00
00
00
1925
92Gi
lead
Scie
nces
(GILD
)1
22
10
30
30
00
33
00
00
00
10
019
25
4Ex
xon M
obil (
XOM
)0
10
01
30
30
00
30
00
00
03
22
018
24
74Ca
terp
illar
(CAT
)1
22
30
30
30
00
03
00
00
00
00
118
24
81Or
acle
(ORC
L)1
11
02
30
30
00
03
00
20
00
01
118
24
17W
algr
eens
Boot
s Alli
ance
(WBA
)0
22
12
01
00
01
01
03
20
00
20
017
22
73Ho
neyw
ell In
tern
atio
nal (H
ON)
01
20
23
03
00
03
00
00
00
01
01
1621
11Am
eriso
urce
Berg
en (A
BC)
02
20
04
03
00
00
00
01
01
01
01
1520
51M
arat
hon P
etro
leum
(MPC
)1
12
20
00
30
00
03
00
00
03
00
015
20
52Di
sney
(DIS)
00
00
03
03
00
03
30
00
00
30
00
1520
18Kr
oger
(KR)
02
20
20
01
00
00
10
21
00
00
01
1216
13Ge
nera
l Ele
ctric
(GE)
12
21
10
00
00
00
30
00
00
10
00
1114
56Lo
ckhe
ed M
artin
(LM
T)0
02
21
00
00
00
01
00
00
03
10
010
13
70Ci
gna
11
10
10
00
00
00
10
11
01
01
01
1013
78Go
ldm
an Sa
chs G
roup
(GS)
02
20
00
10
10
00
00
00
00
11
01
912
64Co
ca-C
ola (
KO)
00
03
02
02
00
00
00
00
00
00
00
79
37Va
lero
Ener
gy (V
LO)
00
11
00
00
00
00
00
00
00
00
00
23
3Ap
ple (
AAPL
)0
00
00
00
00
00
00
00
00
00
00
00
0
6Un
itedh
ealth
Gro
up (U
NH)
00
00
00
00
00
00
00
00
00
00
00
00
9AT
&T (T
)0
00
00
00
00
00
00
00
00
00
00
00
0
15Ca
rdin
al H
ealth
(CAH
)0
00
00
00
00
00
00
00
00
00
00
00
0
21J.P
. Mor
gan C
hase
(JPM
)0
00
00
00
00
00
00
00
00
00
00
00
0
24Bo
eing
(BA)
00
00
00
00
00
00
00
00
00
00
00
00
27Al
phab
et (G
OOGL
)0
00
00
00
00
00
00
00
00
00
00
00
0
45Ar
cher
Dan
iels
Mid
land
(ADM
)0
00
00
00
00
00
00
00
00
00
00
00
0
Ttl s
core
per d
isclo
sure
item
6879
8472
6811
611
109
929
4073
930
1949
017
6048
2235
1101
1449
Mea
n Sco
re pe
r disc
losu
re
item
:scor
es/s
ampl
e am
ount
(57)
1.19
1.39
1.47
1.26
1.19
2.04
0.19
1.91
0.16
0.51
0.70
1.28
1.63
0.00
0.33
0.86
0.00
0.30
1.05
0.84
0.39
0.61
WD
man
agem
ent a
ppro
ach
Gend
er di
versi
ty
Age d
iversi
tyCu
lture
dive
rsity
Disa
bilit
y dive
rsity
Sexu
al-or
ient
atio
n dive
rsity
WD
mea
sure
men
t
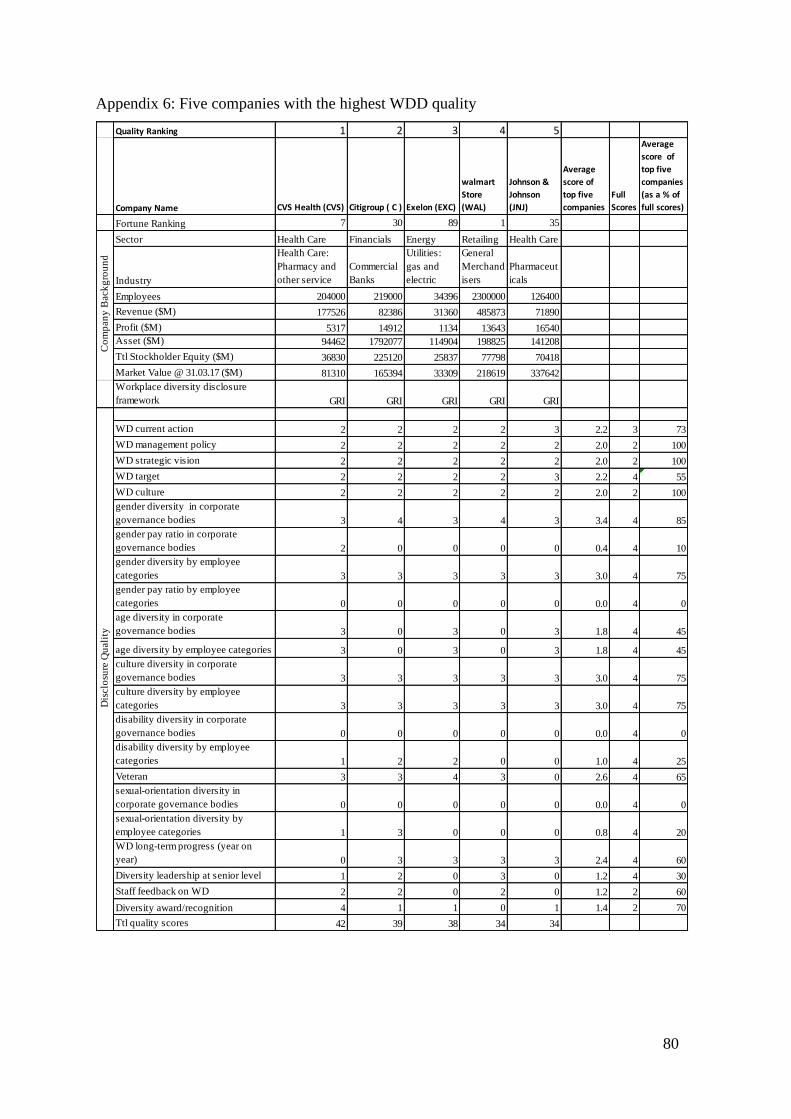
80
Appendix 6: Five companies with the highest WDD quality
Quality Ranking 1 2 3 4 5
Company Name CVS Health (CVS) Citigroup ( C ) Exelon (EXC)
walmart
Store
(WAL)
Johnson &
Johnson
(JNJ)
Average
score of
top five
companies
Full
Scores
Average
score of
top five
companies
(as a % of
full scores)
Fortune Ranking 7 30 89 1 35
Sector Health Care Financials Energy Retailing Health Care
Industry
Health Care:
Pharmacy and
other service
Commercial
Banks
Utilities:
gas and
electric
General
Merchand
isers
Pharmaceut
icals
Employees 204000 219000 34396 2300000 126400
Revenue ($M) 177526 82386 31360 485873 71890
Profit ($M) 5317 14912 1134 13643 16540
Asset ($M) 94462 1792077 114904 198825 141208
Ttl Stockholder Equity ($M) 36830 225120 25837 77798 70418
Market Value @ 31.03.17 ($M) 81310 165394 33309 218619 337642
Workplace diversity disclosure
framework GRI GRI GRI GRI GRI
WD current action 2 2 2 2 3 2.2 3 73
WD management policy 2 2 2 2 2 2.0 2 100
WD strategic vision 2 2 2 2 2 2.0 2 100
WD target 2 2 2 2 3 2.2 4 55
WD culture 2 2 2 2 2 2.0 2 100
gender diversity in corporate
governance bodies 3 4 3 4 3 3.4 4 85
gender pay ratio in corporate
governance bodies 2 0 0 0 0 0.4 4 10
gender diversity by employee
categories 3 3 3 3 3 3.0 4 75
gender pay ratio by employee
categories 0 0 0 0 0 0.0 4 0
age diversity in corporate
governance bodies 3 0 3 0 3 1.8 4 45
age diversity by employee categories 3 0 3 0 3 1.8 4 45
culture diversity in corporate
governance bodies 3 3 3 3 3 3.0 4 75
culture diversity by employee
categories 3 3 3 3 3 3.0 4 75
disability diversity in corporate
governance bodies 0 0 0 0 0 0.0 4 0
disability diversity by employee
categories 1 2 2 0 0 1.0 4 25
Veteran 3 3 4 3 0 2.6 4 65
sexual-orientation diversity in
corporate governance bodies 0 0 0 0 0 0.0 4 0
sexual-orientation diversity by
employee categories 1 3 0 0 0 0.8 4 20
WD long-term progress (year on
year) 0 3 3 3 3 2.4 4 60
Diversity leadership at senior level 1 2 0 3 0 1.2 4 30
Staff feedback on WD 2 2 0 2 0 1.2 2 60
Diversity award/recognition 4 1 1 0 1 1.4 2 70
Ttl quality scores 42 39 38 34 34
Co
mp
an
y B
ack
gro
un
dD
isclo
sure
Qu
ali
ty


![Diversity in the Workplace [INFOGRAPHIC]](https://img.pdfslide.us/doc/110x75/545dde39af7959b9098b4ef6/diversity-in-the-workplace-infographic.jpg)