Embed Size (px)
Citation preview
Oasis montaj How-To Guide
Working with Spreadsheets in Oasis montajThis How-To Guide walks you through displaying, editing and processing Geosoft database data in the Spreadsheet view.
SpreadsheetsWhen you create or open a database, you see a spreadsheet. The Spreadsheet view is your “window” to the Geosoft database and it also provides you with flexibility in setting up your working environment. All data is stored securely in the underlying database (*.GDB) — you simply decide which data you want to display in the spreadsheet and keep all other data in the background, hidden from view.
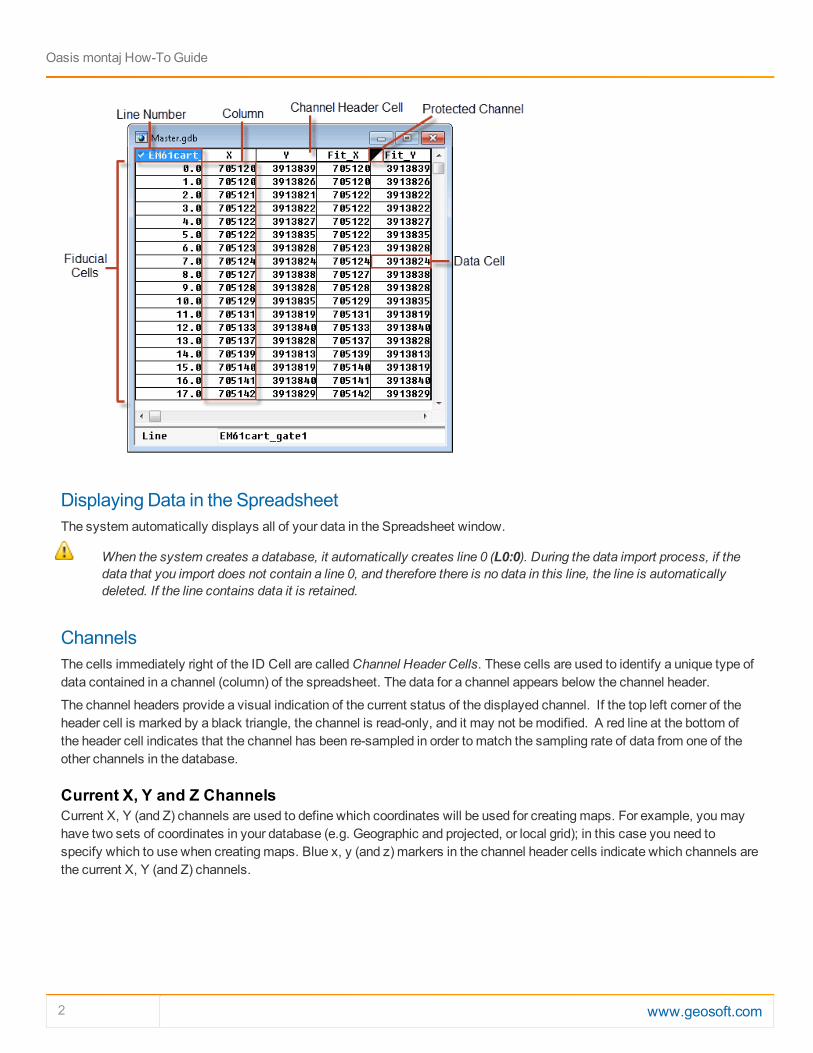
The spreadsheet is organized in rows, channels (columns) and lines (also called groups in other applications such as drillhole plotting). Rows and columns work similar to standard spreadsheets in that you can edit and delete them as needed. The system also enables multiple “worksheets” in your database. Depending on the type of data you are working with (line, random line or drillhole), the worksheets have different names. To see what type of name is used, look at the Line Header Cell located at the top left corner of the spreadsheet. An “L” for example, indicates that you are working with line data. If your data has not been collected on a line basis, such as Geochemistry data, you can store all data in a single line.
General spreadsheet capabilities include:
The ability to display data from your database through a spreadsheet windowHandling of any sample intervalFull editing and mathematical processing capabilitiesProcess selected samples, selected channels and selected lines or groups
How the Spreadsheet Displays Project DataThe spreadsheet does not display your actual data, but rather a view of the data. This enables you to work with data in the spreadsheet without actually making changes to the data until you decide to save the database. After you save the database, your changes are permanent.
Depending on your type of project, the spreadsheet will display your data as either values or arrays.
For surveys where a single value is recorded at each station (for example, magnetic surveys) each data cell will contain a single value.For surveys where multiple readings were recorded at each station (for example, an Induced Polarisation or electromagnetic survey) each data cell will contain multiple values.This is what we refer to as an Array database.
www.geosoft.com 1
2 www.geosoft.com
Displaying Data in the SpreadsheetThe system automatically displays all of your data in the Spreadsheet window.
When the system creates a database, it automatically creates line 0 (L0:0). During the data import process, if the data that you import does not contain a line 0, and therefore there is no data in this line, the line is automatically deleted. If the line contains data it is retained.
ChannelsThe cells immediately right of the ID Cell are called Channel Header Cells. These cells are used to identify a unique type of data contained in a channel (column) of the spreadsheet. The data for a channel appears below the channel header.
The channel headers provide a visual indication of the current status of the displayed channel. If the top left corner of the header cell is marked by a black triangle, the channel is read-only, and it may not be modified. A red line at the bottom of the header cell indicates that the channel has been re-sampled in order to match the sampling rate of data from one of the other channels in the database.
Current X, Y and Z ChannelsCurrent X, Y (and Z) channels are used to define which coordinates will be used for creating maps. For example, you may have two sets of coordinates in your database (e.g. Geographic and projected, or local grid); in this case you need to specify which to use when creating maps. Blue x, y (and z) markers in the channel header cells indicate which channels are the current X, Y (and Z) channels.
Oasis montaj How-To Guide
Oasis montaj How-To Guide
Typically, you will use only X and Y, but you can also assign a Z. The Z is used in Drillhole databases, where DH_EAST = X, DH_NORTH = Y and DH_RL = Z.
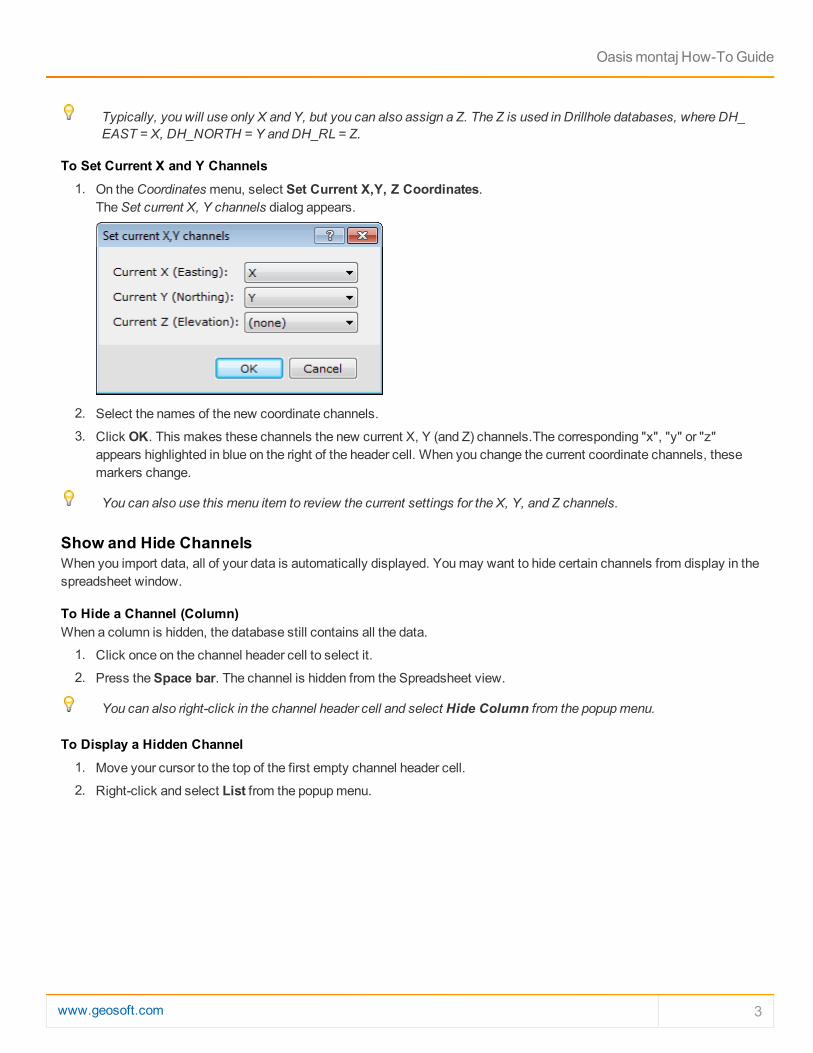
To Set Current X and Y Channels 1. On the Coordinates menu, select Set Current X,Y, Z Coordinates.
The Set current X, Y channels dialog appears.
2. Select the names of the new coordinate channels.
3. Click OK. This makes these channels the new current X, Y (and Z) channels.The corresponding "x", "y" or "z" appears highlighted in blue on the right of the header cell. When you change the current coordinate channels, these markers change.
You can also use this menu item to review the current settings for the X, Y, and Z channels.
Show and Hide ChannelsWhen you import data, all of your data is automatically displayed. You may want to hide certain channels from display in the spreadsheet window.
To Hide a Channel (Column)When a column is hidden, the database still contains all the data.
1. Click once on the channel header cell to select it.
2. Press the Space bar. The channel is hidden from the Spreadsheet view.
You can also right-click in the channel header cell and select Hide Column from the popup menu.
To Display a Hidden Channel 1. Move your cursor to the top of the first empty channel header cell.
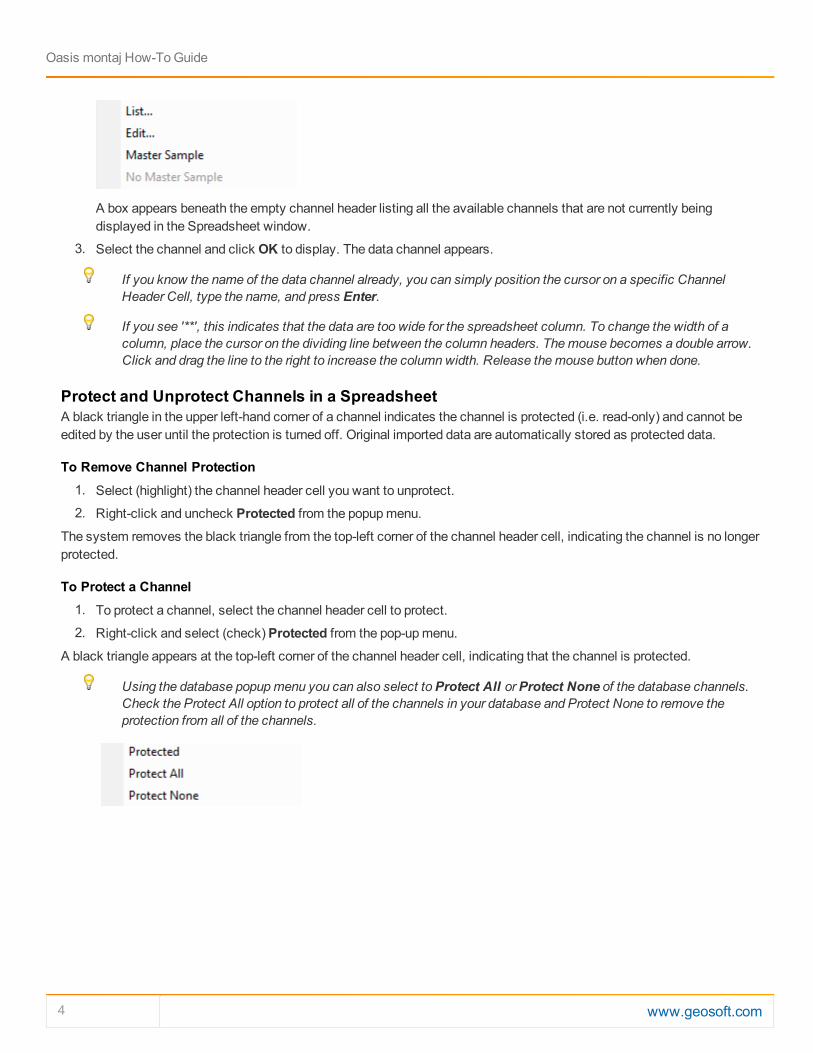
2. Right-click and select List from the popup menu.
www.geosoft.com 3
4 www.geosoft.com
A box appears beneath the empty channel header listing all the available channels that are not currently being displayed in the Spreadsheet window.
3. Select the channel and click OK to display. The data channel appears.
If you know the name of the data channel already, you can simply position the cursor on a specific Channel Header Cell, type the name, and press Enter.
If you see '**', this indicates that the data are too wide for the spreadsheet column. To change the width of a column, place the cursor on the dividing line between the column headers. The mouse becomes a double arrow. Click and drag the line to the right to increase the column width. Release the mouse button when done.
Protect and Unprotect Channels in a SpreadsheetA black triangle in the upper left-hand corner of a channel indicates the channel is protected (i.e. read-only) and cannot be edited by the user until the protection is turned off. Original imported data are automatically stored as protected data.
To Remove Channel Protection 1. Select (highlight) the channel header cell you want to unprotect.
2. Right-click and uncheck Protected from the popup menu.
The system removes the black triangle from the top-left corner of the channel header cell, indicating the channel is no longer protected.
To Protect a Channel 1. To protect a channel, select the channel header cell to protect.
2. Right-click and select (check) Protected from the pop-up menu.
A black triangle appears at the top-left corner of the channel header cell, indicating that the channel is protected.
Using the database popup menu you can also select to Protect All or Protect None of the database channels. Check the Protect All option to protect all of the channels in your database and Protect None to remove the protection from all of the channels.
Oasis montaj How-To Guide
Oasis montaj How-To Guide
Create Working Channels in the Geosoft DatabaseYou can create new channels in your database to store the results of filters, mathematical expressions, or any other processing operations that you may apply to your data. We recommend that you create a new channel for storing any changes you make to the original imported data.
To Create a New Channel 1. From the top of an empty column, select the channel header cell (single click).
2. Type the name of the new channel.
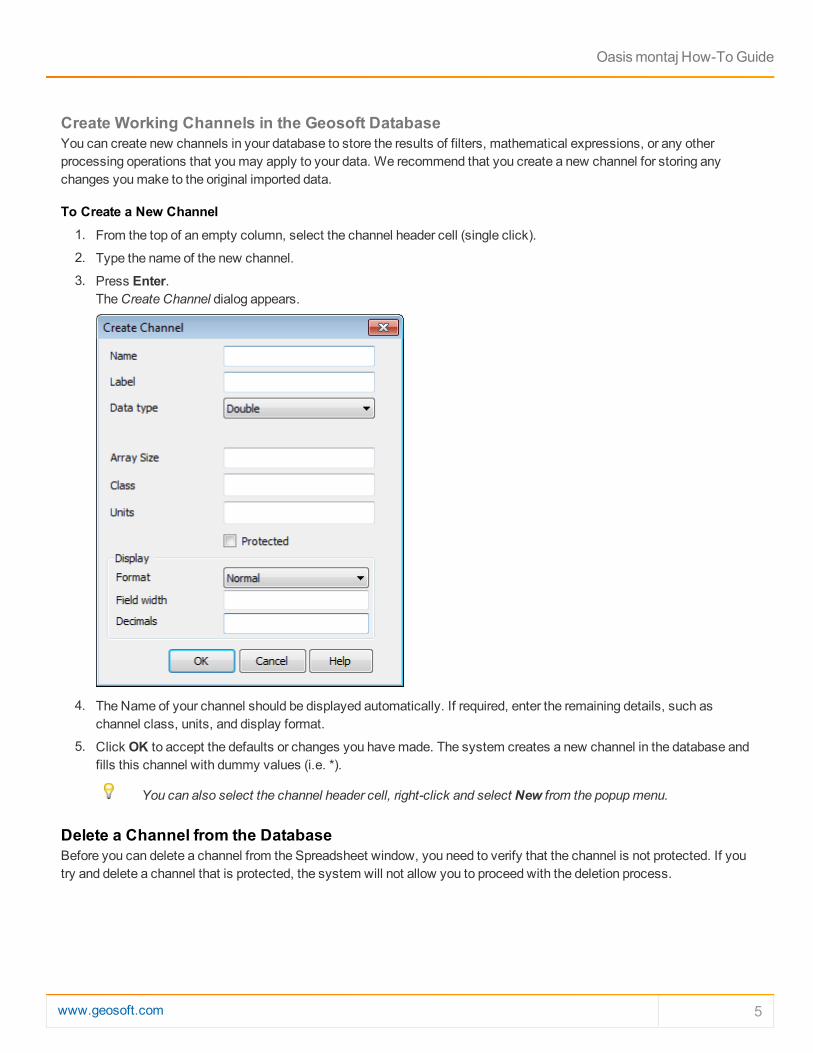
3. Press Enter. The Create Channel dialog appears.
4. The Name of your channel should be displayed automatically. If required, enter the remaining details, such as channel class, units, and display format.
5. Click OK to accept the defaults or changes you have made. The system creates a new channel in the database and fills this channel with dummy values (i.e. *).
You can also select the channel header cell, right-click and select New from the popup menu.
Delete a Channel from the DatabaseBefore you can delete a channel from the Spreadsheet window, you need to verify that the channel is not protected. If you try and delete a channel that is protected, the system will not allow you to proceed with the deletion process.
www.geosoft.com 5
6 www.geosoft.com
It is important to realize that deleting a channel is very different than just hiding a channel from Spreadsheet view. When you hide a channel from the spreadsheet, it is still in the database and can be retrieved simply by listing the channel again. When you delete a channel, it is removed from the Spreadsheet view and also deleted from the database.
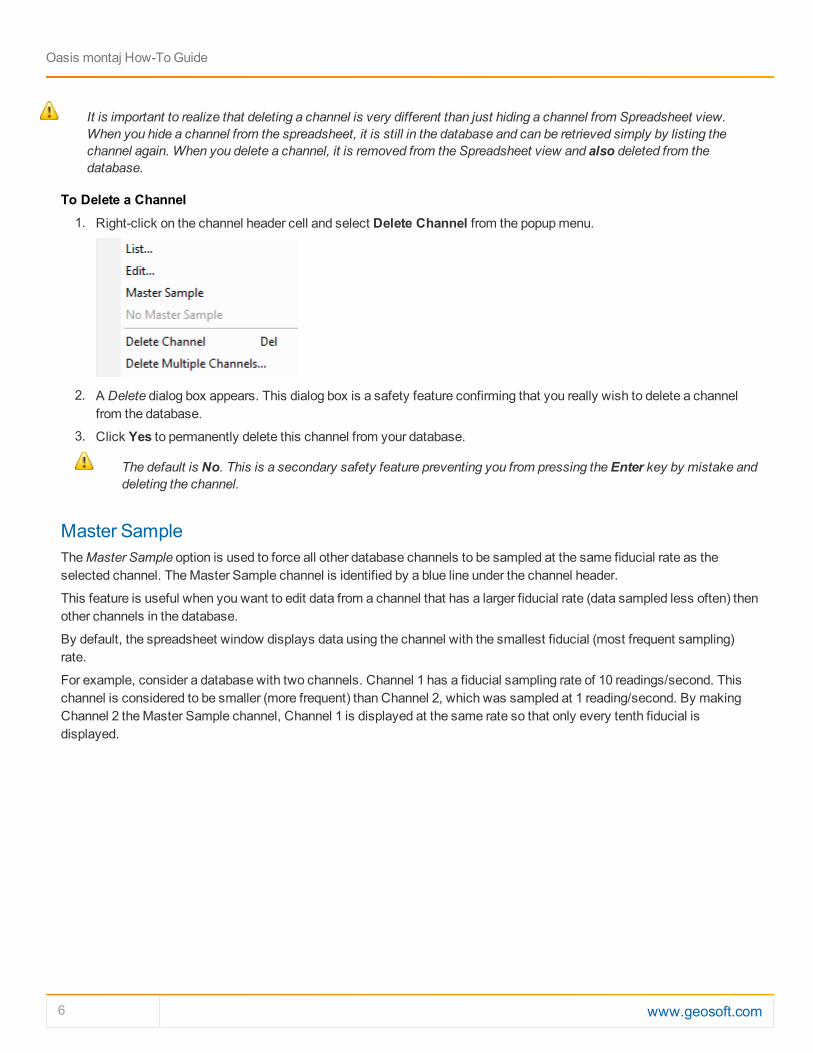
To Delete a Channel 1. Right-click on the channel header cell and select Delete Channel from the popup menu.
2. A Delete dialog box appears. This dialog box is a safety feature confirming that you really wish to delete a channel from the database.
3. Click Yes to permanently delete this channel from your database.
The default is No. This is a secondary safety feature preventing you from pressing the Enter key by mistake and deleting the channel.
Master SampleThe Master Sample option is used to force all other database channels to be sampled at the same fiducial rate as the selected channel. The Master Sample channel is identified by a blue line under the channel header.
This feature is useful when you want to edit data from a channel that has a larger fiducial rate (data sampled less often) then other channels in the database.
By default, the spreadsheet window displays data using the channel with the smallest fiducial (most frequent sampling) rate.
For example, consider a database with two channels. Channel 1 has a fiducial sampling rate of 10 readings/second. This channel is considered to be smaller (more frequent) than Channel 2, which was sampled at 1 reading/second. By making Channel 2 the Master Sample channel, Channel 1 is displayed at the same rate so that only every tenth fiducial is displayed.
Oasis montaj How-To Guide
Oasis montaj How-To Guide
To Activate the Master Sample 1. Right-click on the database channel header.
2. Select Master Sample from the popup menu. A blue line is displayed under the channel header.
To Remove the Master Sample 1. Right-click on the database channel header.
2. Select No Master Sample from the popup menu. The blue line is removed from under the channel header.
Displaying Data in the Profile ViewAfter you open a spreadsheet and display one or more channels, you have the option of displaying them in graphical (profile) form in a Profile window. The Profile window is composed of sub-windows called panes, which appear directly below its corresponding database. You can display up to five separate panes with 32 channels of data in each pane.
For additional information, see the application help Help/Help Topics.
Display ProfilesThe Profile view is your "graphical window" to the Geosoft database. Profile windows are linked dynamically to their corresponding database. When you select a value or range of values in either the database or profile window respectively, they are also highlighted in the other window.
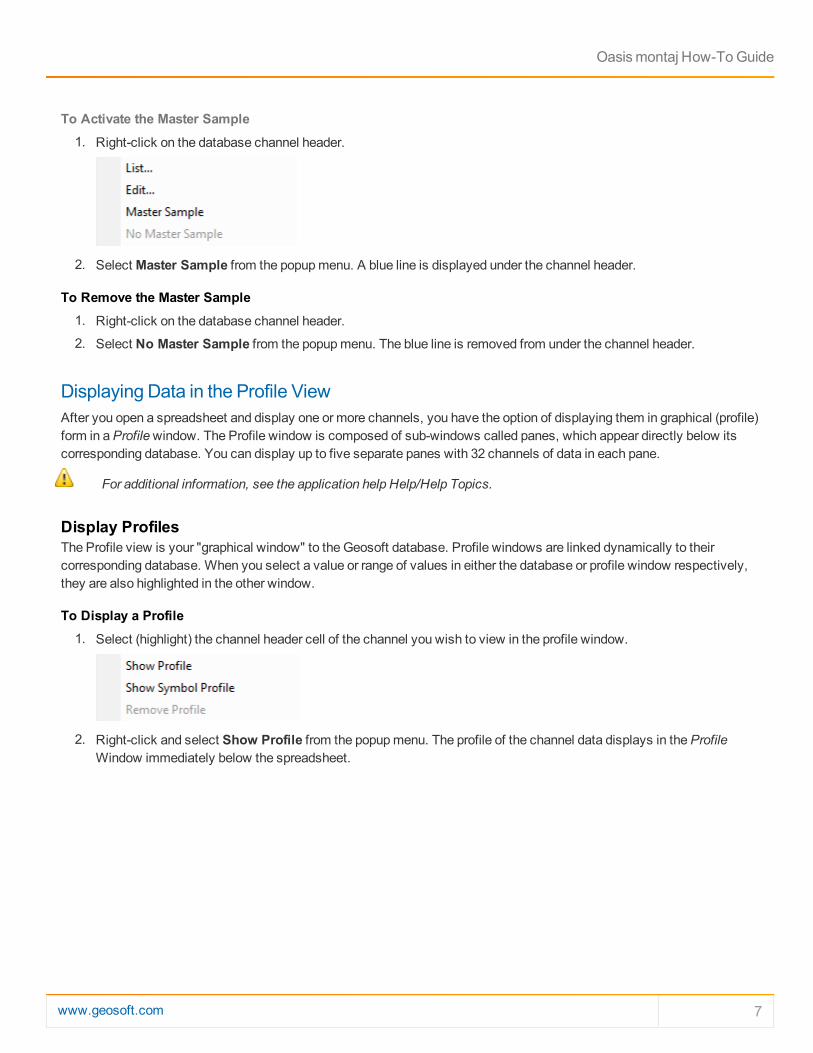
To Display a Profile 1. Select (highlight) the channel header cell of the channel you wish to view in the profile window.
2. Right-click and select Show Profile from the popup menu. The profile of the channel data displays in the Profile Window immediately below the spreadsheet.
www.geosoft.com 7
8 www.geosoft.com
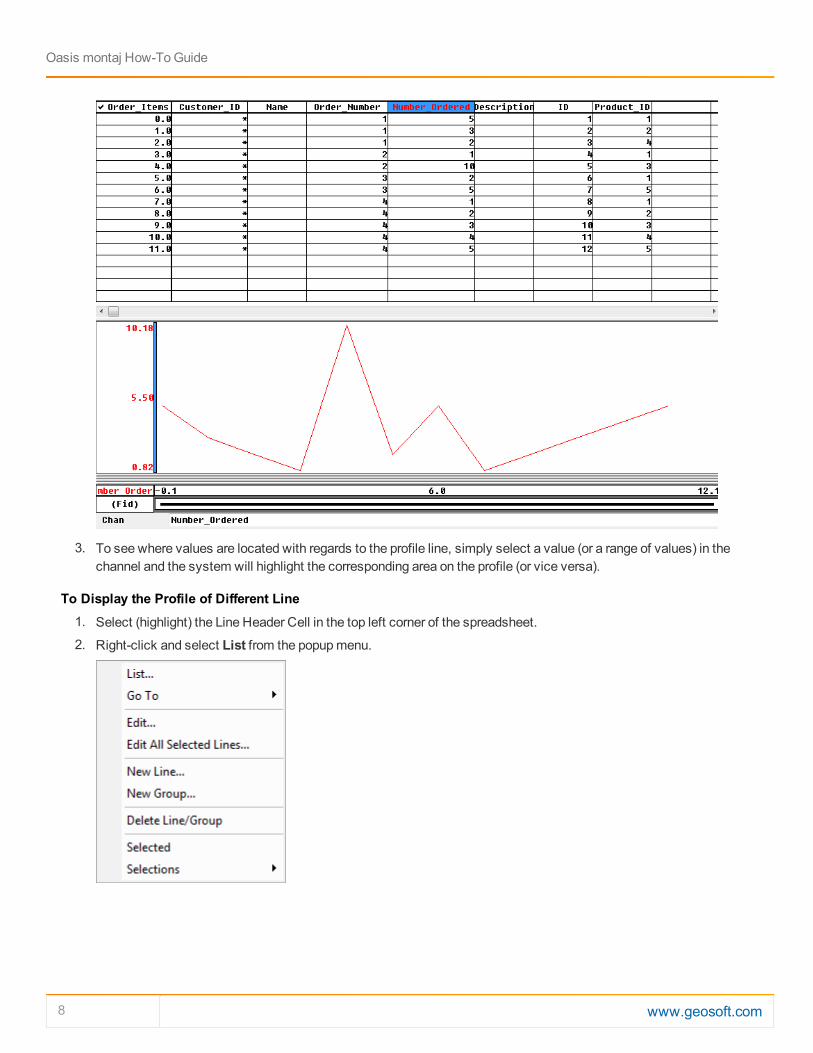
3. To see where values are located with regards to the profile line, simply select a value (or a range of values) in the channel and the system will highlight the corresponding area on the profile (or vice versa).
To Display the Profile of Different Line 1. Select (highlight) the Line Header Cell in the top left corner of the spreadsheet.
2. Right-click and select List from the popup menu.
Oasis montaj How-To Guide
Oasis montaj How-To Guide
A list of all the line numbers in the current database will be displayed. You can think of each line number as a worksheet in the Spreadsheet window. When you view a new line number, a new worksheet is opened in the Spreadsheet window with corresponding data for that line number.
3. Click the line to display. The Profile window now displays the selected line.
When the Line Header Cell is highlighted, you can use the Database Tools Bar to scroll through the lines by selecting Previous Line/Group or Next Line/Group.
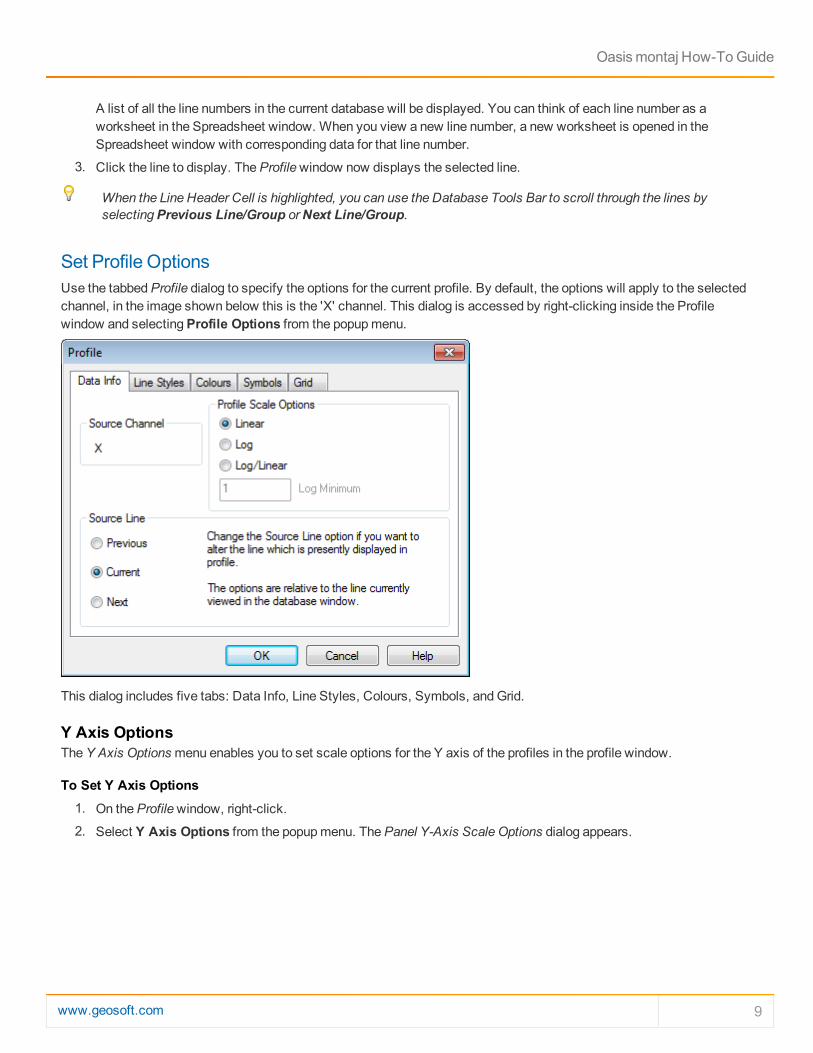
Set Profile OptionsUse the tabbed Profile dialog to specify the options for the current profile. By default, the options will apply to the selected channel, in the image shown below this is the 'X' channel. This dialog is accessed by right-clicking inside the Profile window and selecting Profile Options from the popup menu.
This dialog includes five tabs: Data Info, Line Styles, Colours, Symbols, and Grid.
Y Axis OptionsThe Y Axis Options menu enables you to set scale options for the Y axis of the profiles in the profile window.
To Set Y Axis Options 1. On the Profile window, right-click.
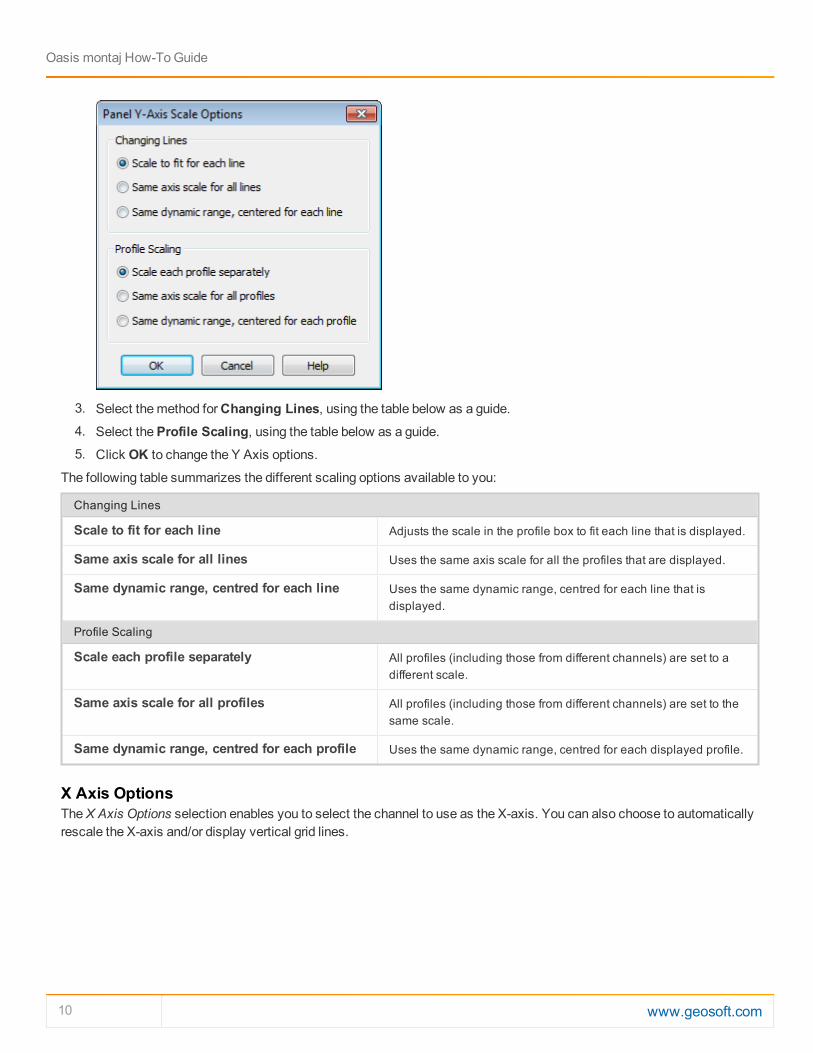
2. Select Y Axis Options from the popup menu. The Panel Y-Axis Scale Options dialog appears.
www.geosoft.com 9
10 www.geosoft.com
3. Select the method for Changing Lines, using the table below as a guide.
4. Select the Profile Scaling, using the table below as a guide.
5. Click OK to change the Y Axis options.
The following table summarizes the different scaling options available to you:
Changing Lines
Scale to fit for each line Adjusts the scale in the profile box to fit each line that is displayed.
Same axis scale for all lines Uses the same axis scale for all the profiles that are displayed.
Same dynamic range, centred for each line Uses the same dynamic range, centred for each line that is displayed.
Profile Scaling
Scale each profile separately All profiles (including those from different channels) are set to a different scale.
Same axis scale for all profiles All profiles (including those from different channels) are set to the same scale.
Same dynamic range, centred for each profile Uses the same dynamic range, centred for each displayed profile.
X Axis OptionsThe X Axis Options selection enables you to select the channel to use as the X-axis. You can also choose to automatically rescale the X-axis and/or display vertical grid lines.
Oasis montaj How-To Guide
Oasis montaj How-To Guide
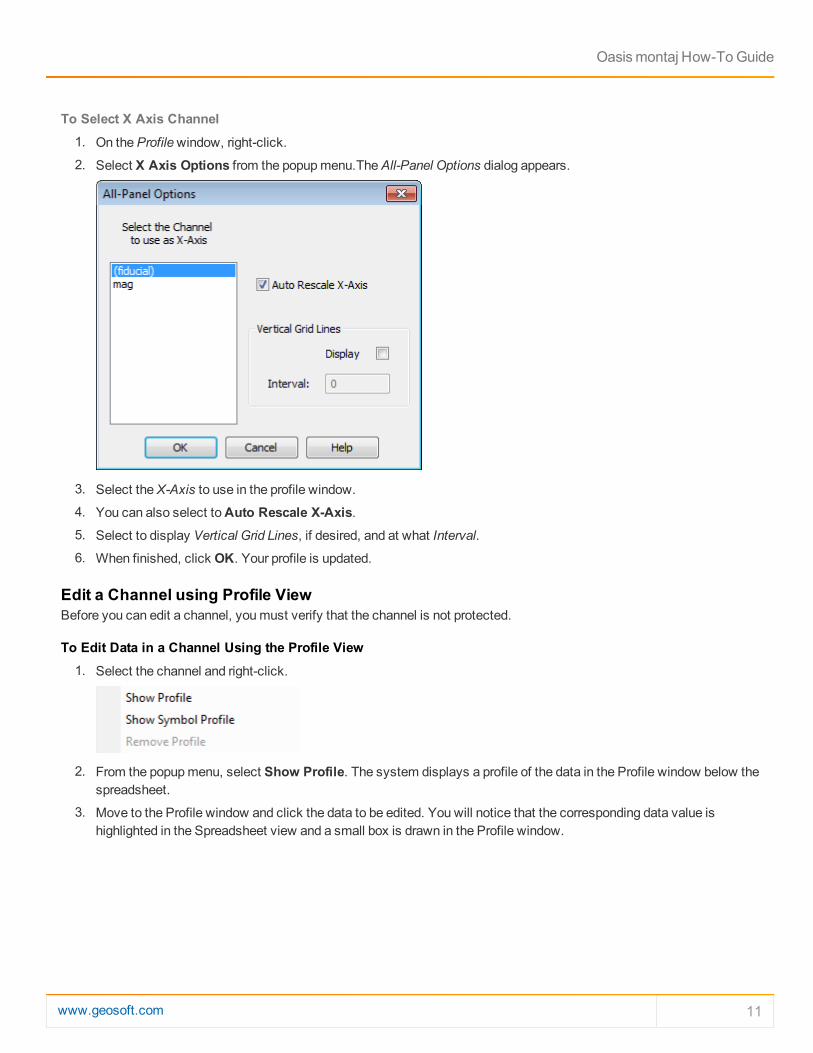
To Select X Axis Channel 1. On the Profile window, right-click.
2. Select X Axis Options from the popup menu.The All-Panel Options dialog appears.
3. Select the X-Axis to use in the profile window.
4. You can also select to Auto Rescale X-Axis.
5. Select to display Vertical Grid Lines, if desired, and at what Interval.
6. When finished, click OK. Your profile is updated.
Edit a Channel using Profile ViewBefore you can edit a channel, you must verify that the channel is not protected.
To Edit Data in a Channel Using the Profile View 1. Select the channel and right-click.
2. From the popup menu, select Show Profile. The system displays a profile of the data in the Profile window below the spreadsheet.
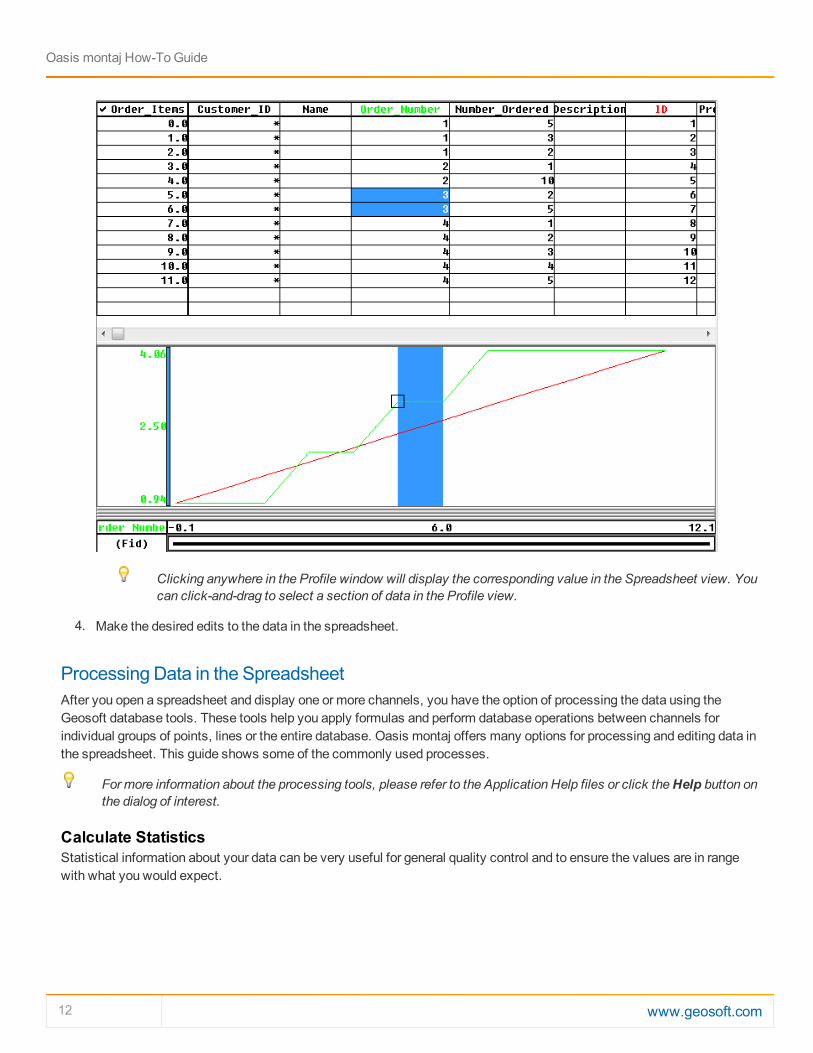
3. Move to the Profile window and click the data to be edited. You will notice that the corresponding data value is highlighted in the Spreadsheet view and a small box is drawn in the Profile window.
www.geosoft.com 11
12 www.geosoft.com
Clicking anywhere in the Profile window will display the corresponding value in the Spreadsheet view. You can click-and-drag to select a section of data in the Profile view.
4. Make the desired edits to the data in the spreadsheet.
Processing Data in the SpreadsheetAfter you open a spreadsheet and display one or more channels, you have the option of processing the data using the Geosoft database tools. These tools help you apply formulas and perform database operations between channels for individual groups of points, lines or the entire database. Oasis montaj offers many options for processing and editing data in the spreadsheet. This guide shows some of the commonly used processes.
For more information about the processing tools, please refer to the Application Help files or click the Help button on the dialog of interest.
Calculate StatisticsStatistical information about your data can be very useful for general quality control and to ensure the values are in range with what you would expect.
Oasis montaj How-To Guide
Oasis montaj How-To Guide
To Calculate Basic Statistics on a Channel 1. Select the data to perform the statistics on using either a double or triple click of the mouse.
Clicking (highlighting) the channel header once selects the header cell, clicking twice selects the channel and clicking three times selects the channel in all of the selected lines (groups) in the database.
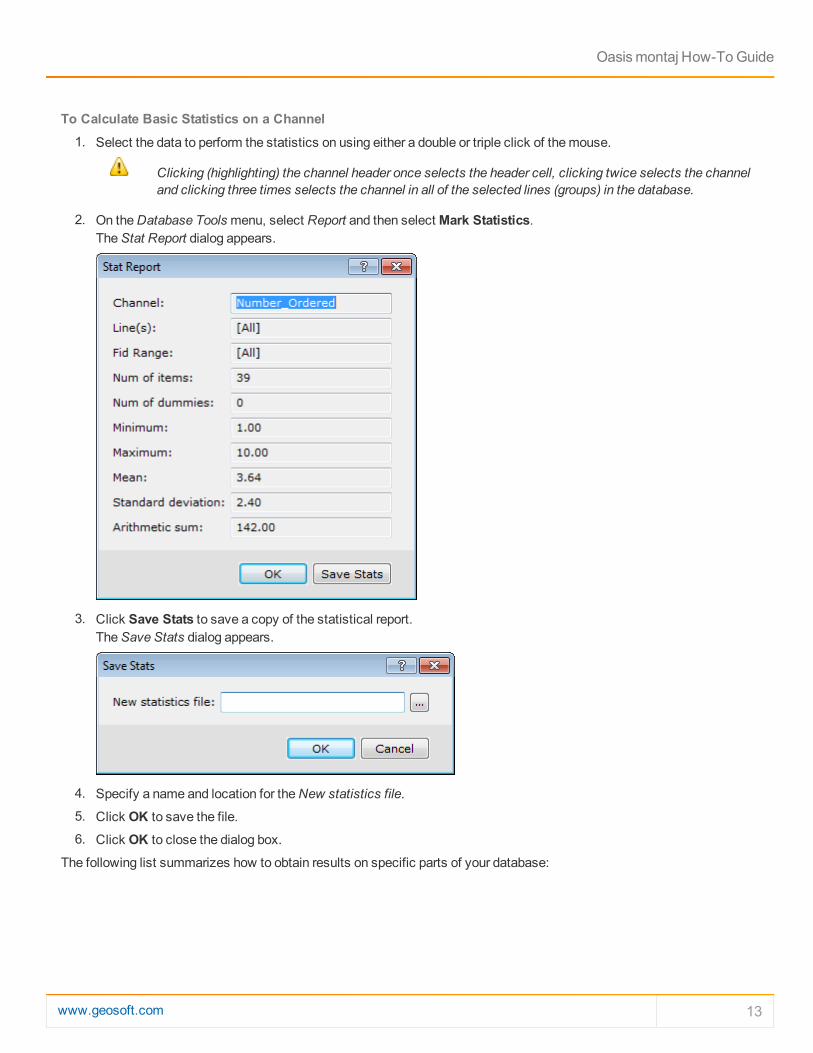
2. On the Database Tools menu, select Report and then select Mark Statistics. The Stat Report dialog appears.
3. Click Save Stats to save a copy of the statistical report. The Save Stats dialog appears.
4. Specify a name and location for the New statistics file.
5. Click OK to save the file.
6. Click OK to close the dialog box.
The following list summarizes how to obtain results on specific parts of your database:
www.geosoft.com 13
14 www.geosoft.com
Click once on the channel header cell to highlight the header cell.
No statistics can be calculated.
Click twice (double click) on the channel header cell to highlight the data in the current line (group).
Statistics are calculated for that specific line (group) of the database.
Click three times on the channel header cell to highlight the data in all of the selected lines (groups) in the database.
Channel statistics are calculated for all of the selected lines (groups) in the database.
Edit Data using Conditional ExpressionsConditional math expressions can be used to edit data as required. For example, data spikes may be removed from a dataset.
Example
mag<9000?mag:dummy
This formula states that if the mag value is less than 9000, the channel value will equal the mag value; otherwise it is set to the dummy value.
To Use Conditional Expressions 1. Select the channel by double clicking the channel header (to highlight the data in the current line/group) or triple click
(to highlight the data in all the selected lines/groups in the database).
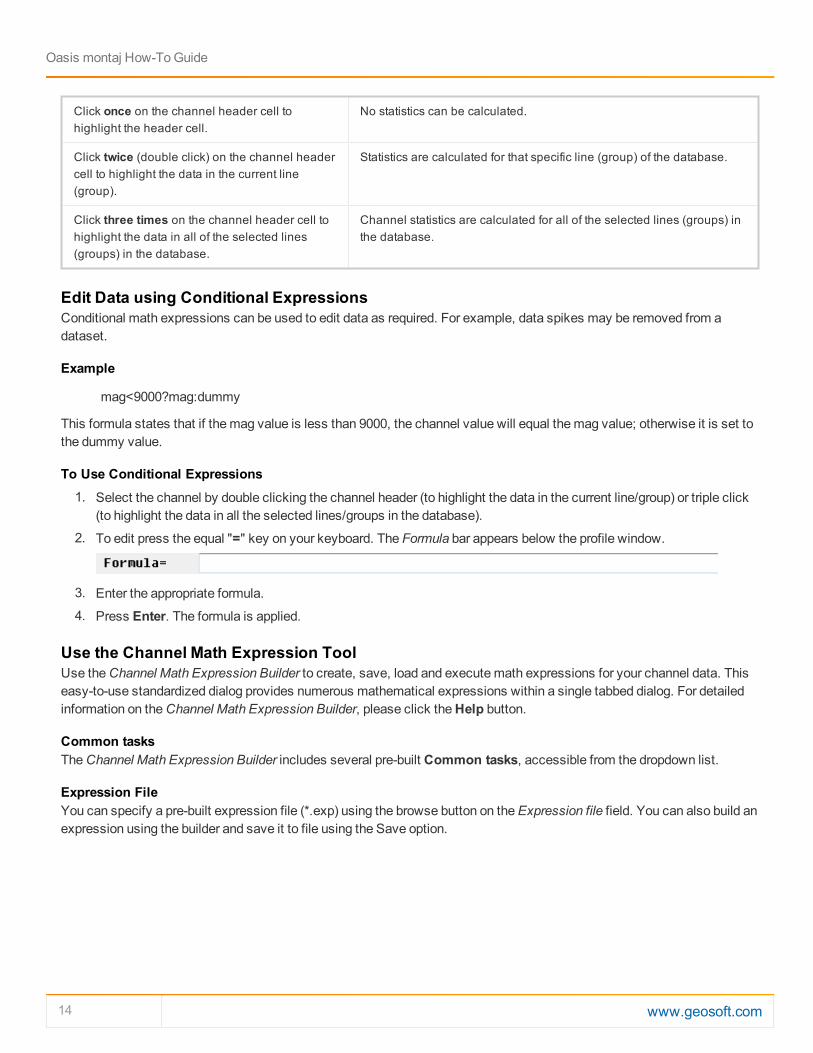
2. To edit press the equal "=" key on your keyboard. The Formula bar appears below the profile window.
3. Enter the appropriate formula.
4. Press Enter. The formula is applied.
Use the Channel Math Expression ToolUse the Channel Math Expression Builder to create, save, load and execute math expressions for your channel data. This easy-to-use standardized dialog provides numerous mathematical expressions within a single tabbed dialog. For detailed information on the Channel Math Expression Builder, please click the Help button.
Common tasksThe Channel Math Expression Builder includes several pre-built Common tasks, accessible from the dropdown list.
Expression FileYou can specify a pre-built expression file (*.exp) using the browse button on the Expression file field. You can also build an expression using the builder and save it to file using the Save option.
Oasis montaj How-To Guide
Oasis montaj How-To Guide
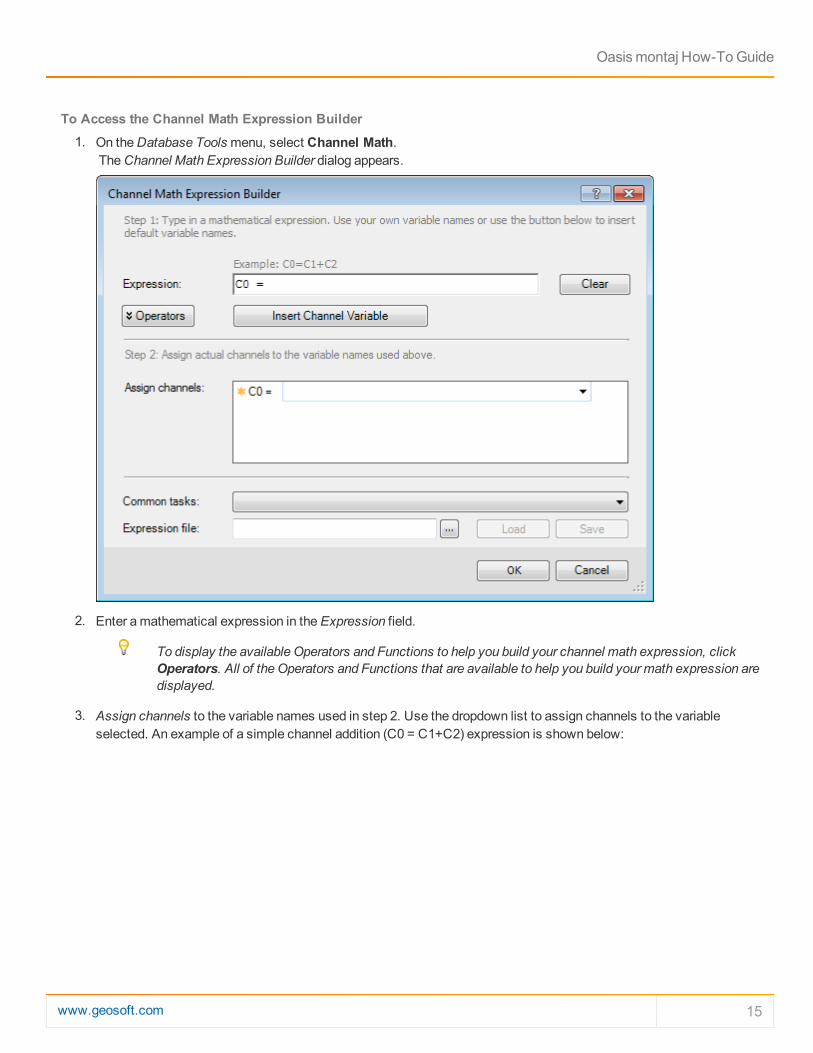
To Access the Channel Math Expression Builder 1. On the Database Tools menu, select Channel Math.
The Channel Math Expression Builder dialog appears.
2. Enter a mathematical expression in the Expression field.
To display the available Operators and Functions to help you build your channel math expression, click Operators. All of the Operators and Functions that are available to help you build your math expression are displayed.
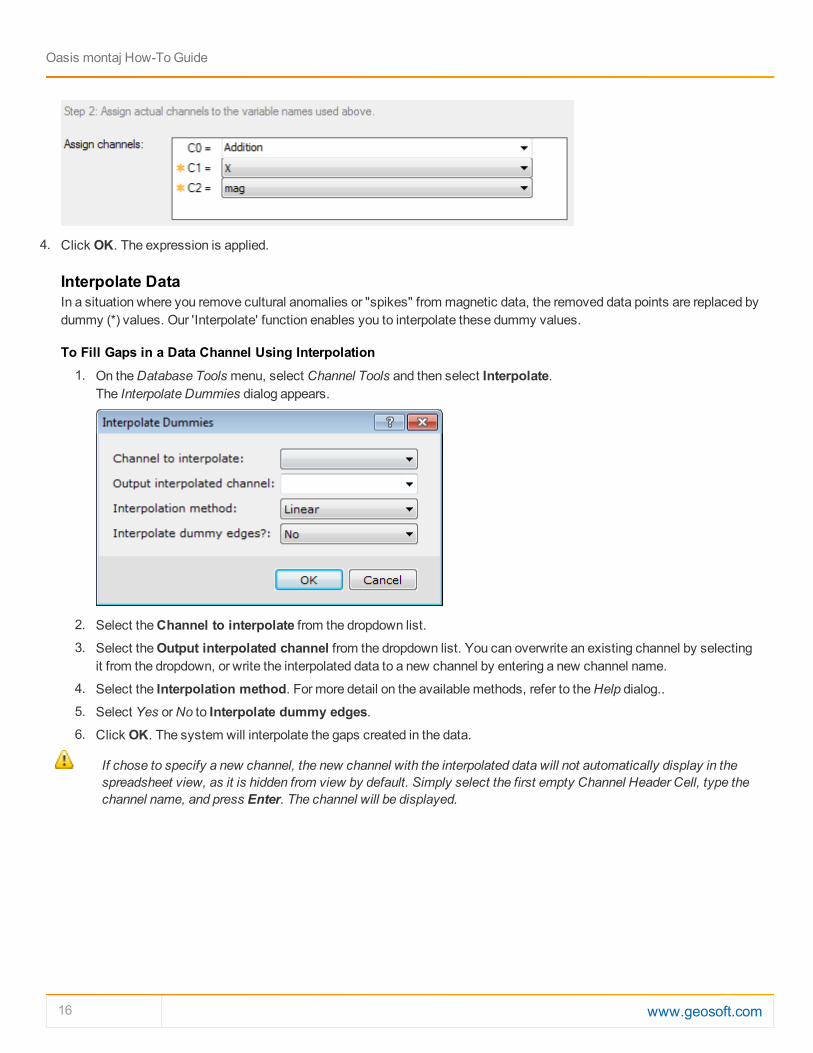
3. Assign channels to the variable names used in step 2. Use the dropdown list to assign channels to the variable selected. An example of a simple channel addition (C0 = C1+C2) expression is shown below:
www.geosoft.com 15
16 www.geosoft.com
4. Click OK. The expression is applied.
Interpolate DataIn a situation where you remove cultural anomalies or "spikes" from magnetic data, the removed data points are replaced by dummy (*) values. Our 'Interpolate' function enables you to interpolate these dummy values.
To Fill Gaps in a Data Channel Using Interpolation 1. On the Database Tools menu, select Channel Tools and then select Interpolate.
The Interpolate Dummies dialog appears.
2. Select the Channel to interpolate from the dropdown list.
3. Select the Output interpolated channel from the dropdown list. You can overwrite an existing channel by selecting it from the dropdown, or write the interpolated data to a new channel by entering a new channel name.
4. Select the Interpolation method. For more detail on the available methods, refer to the Help dialog..
5. Select Yes or No to Interpolate dummy edges.
6. Click OK. The system will interpolate the gaps created in the data.
If chose to specify a new channel, the new channel with the interpolated data will not automatically display in the spreadsheet view, as it is hidden from view by default. Simply select the first empty Channel Header Cell, type the channel name, and press Enter. The channel will be displayed.
Oasis montaj How-To Guide
Oasis montaj How-To Guide
Dynamic Links: Geographic Connections to your DataDynamic data links are "virtual" georeferenced connections between spreadsheets, profiles and maps. Links are graphical connections that connect what you see on a map to the same location in other displayed Map windows and to the original data in Spreadsheet and Profile windows. These links work in multi-directions so you can select any window and see the equivalent data in the other windows you are using.
Dynamic linking helps you to build knowledge quickly and make more informed decisions, through enabling real-time and visual quality control, processing and analysis of your data.
Working with Dynamic LinkingAt the most basic level, you can use dynamic linking to link spreadsheet data and profiles.
1. When you work with Spreadsheet and Profile windows and select one or more cells in the spreadsheet, the system automatically shows you and locates the corresponding data in the Profile window (or vice-versa).
2. When you work with spreadsheet, profile, and map windows and select a point on the map, the system automatically highlights the corresponding data in the other windows (or vice-versa).
3. You can access the data linking tools on the Map Tools toolbar . The Shadow Cursor button ( ) enables you to view
data for a single line/group. To view data for multiple lines/groups use the Shadow Cursor Data Linking button ( ).
4. You can also create links between map extents (i.e. pan and zoom multiple maps will occur simultaneously). This
functionality is enabled via the Change Extent tools ( ), on the Map Tools toolbar.
Note that, you can only use database linking if your map contains line/group linking items (i.e. survey lines, symbols, down hole sections or an ArcGIS LYR file).The system scrolls through the corresponding database, updating the Spreadsheet and Profile windows automatically to reflect the currently selected line/group.
Link Data DynamicallyDynamic links are “virtual” georeferenced connections between spreadsheets, profiles and maps. These links work in two-directions so you can select any window and see the equivalent data in the other windows you are using.
To Link Spreadsheet, Profile and Map DataDesktop linking enables you to place a special Link cursor on one or more maps and locate a specific part of the data.
1. Make sure only the desired map and the database are open in your project.
Do not remove them from your project, just close (minimise) any other map, grid or database items that are currently open in your project.
2. From the Window menu, select Tile Vertically. The system arranges your database window and map window side by side.
3. The system automatically turns on a map link and activates the Shadow Cursors button on the Map Editing toolbar. You can tell a button is activated because it will appear to be depressed more than the other buttons on the toolbar.
www.geosoft.com 17
18 www.geosoft.com
4. Click on a value in the database or on a point in the profile view, and you see that the Link cursor (large black cross) moves to the same location on the map. This type of linking enables you to quickly identify discrete anomalies on a map and view their corresponding values in the database.
5. You can display multiple maps and use this function to locate and visualize the same anomaly locations for different data types. It is quite useful for quality control (searching for anomalous noise spikes, for example) and for multi-parameter interpretation.
How-To Guide Publication Date: 29/04/2014
Copyright 2014 Geosoft Inc. All rights reserved.
Oasis montaj How-To Guide