Embed Size (px)
Citation preview

Working Together to Improve Student Achievement and Close Gaps----Oregon’s Superintendents’ Summer Institute

2006 Superintendents’ Summer Institute:“Strategies for Student Success”State Department of Education
Portland, Oregon August 7, 2006

First, some good news.
After more than a decade of fairly flat achievement and stagnant or growing gaps, we appear to be
turning the corner.

NAEP Reading, 9 Year-Olds:Record Performance for All
Groups
150
170
190
210
230
250
1971 1975 1980 1984 1988 1990 1992 1994 1996 1999 2004
Ave
rag
e S
cale
Sco
re
African American Latino White
Source: National Center for Education Statistics, NAEP 2004 Trends in Academic Progress
Note: Long-Term Trends NAEP

African American-White Gap Narrows to Smallest Size in History
NAEP Reading, 9 Year-Olds
150
170
190
210
230
250
1971 1975 1980 1984 1988 1990 1992 1994 1996 1999 2004
Avera
ge S
cale
Sco
re
African American White
29 3526
Source: National Center for Education Statistics, NAEP 2004 Trends in Academic Progress
Note: Long-Term Trends NAEP

Latino-White Gap Narrows to Smallest Size in History
NAEP Reading, 9 Year-Olds
150
170
190
210
230
250
1971 1975 1980 1984 1988 1990 1992 1994 1996 1999 2004
Ave
rag
e S
cale
Sco
re
Latino White
24 2821
Source: National Center for Education Statistics, NAEP 2004 Trends in Academic Progress
Note: Long-Term Trends NAEP

NAEP Reading, 13 Year-Olds
200
220
240
260
280
300
1971 1975 1980 1984 1988 1990 1992 1994 1996 1999 2004
Avera
ge S
cale
Sco
re
African American Latino White
Source: National Center for Education Statistics, NAEP 2004 Trends in Academic Progress
Note: Long-Term Trends NAEP

NAEP Math, 13 Year-Olds:Increases and Record
Performance for All Groups
200
220
240
260
280
300
1973 1978 1982 1986 1990 1992 1994 1996 1999 2004
Avera
ge S
cale
Sco
re
African American Latino White
Source: National Center for Education Statistics, NAEP 2004 Trends in Academic Progress
Note: Long-Term Trends NAEP

Bottom Line:When We Really Focus on
Something, We Make Progress

Clearly, much more remains to be done in elementary and
middle schoolToo many youngsters still
enter high school way behind.

2005 NAEP Grade 8 MathAll Students, Nation
32
39
29
0%
20%
40%
60%
80%
100%
All Students
Perc
en
t o
f S
tud
en
ts
Proficient/Advanced
Basic
Below Basic
Source: National Center for Education Statistics, NAEP Data Explorer, http://nces.ed.gov/nationsreportcard/nde/

2005 NAEP Grade 8 Mathby Race/Ethnicity, Nation
59
19
50 45
21
33
34
38 41
42
9
47
13 15
37
0%
20%
40%
60%
80%
100%
AfricanAmerican
Asian Latino NativeAmerican
White
Perc
ent
of
Stu
dents
Proficient/Advanced
Basic
Below Basic
Source: National Center for Education Statistics, NAEP Data Explorer, http://nces.ed.gov/nationsreportcard/nde/

2005 NAEP Grade 8 Mathby Family Income, Nation
49
21
38
41
13
38
0%
20%
40%
60%
80%
100%
Poor Non-Poor
Perc
en
t o
f S
tud
en
ts
Proficient/Advanced
Basic
Below Basic
Source: National Center for Education Statistics, NAEP Data Explorer, http://nces.ed.gov/nationsreportcard/nde/

But at least we have some traction on these
problems.

The Same is NOT
True of High School

High School

Age 17: Math and Science NAEP Long-Term Trends
280
285
290
295
300
305
310
315
1986 1990 1992 1994 1996 1999 2004
Sca
le S
core
MathScience
Source: NAEP 2004 Trends in Academic Progress and NAEP 1999 Trends in Academic Progress.
Note: Long-Term Trends NAEP

Age 17: Reading and Writing NAEP Long-Term Trends
250255260265270275280285290295300
1984 1988 1990 1992 1994 1996 1999 2004
Sca
le S
core READING
WRITING
Source: NAEP 2004 Trends in Academic Progress.
Note: Long-Term Trends NAEP

Gaps between groups wider today than in 1990

NAEP Reading, 17 Year-Olds
220
240
260
280
300
320
1971 1975 1980 1984 1988 1990 1992 1994 1996 1999 2004
Avera
ge S
cale
Sco
re
African American Latino White
21 29
Source: National Center for Education Statistics, NAEP 2004 Trends in Academic Progress
Note: Long-Term Trends NAEP

NAEP Math, 17 Year-Olds
220
240
260
280
300
320
1973 1978 1982 1986 1990 1992 1994 1996 1999 2004
Avera
ge S
cale
Sco
re
African American Latino White
20 28
Source: National Center for Education Statistics, NAEP 2004 Trends in Academic Progress
Note: Long-Term Trends NAEP

Students Make More Growth Grade 5 to 8
than Grade 9 to 12

Value Added in High School Declined During
the Nineties

Not just a pattern on NAEP.State assessments show
similar trends.

Hormones?

Students in Other Countries Gain far More in
Secondary School TIMSS

2003: U.S. Ranked 24th out of 29 OECD Countries in Mathematics
300
350
400
450
500
550
Fin
lan
dK
ore
aN
eth
erla
nds
Japa
nC
ana
daB
elgi
um
Sw
itzer
land
New
Ze
ala
ndA
ustr
alia
Cze
ch R
epu
blic
Icel
and
Den
mar
kF
ranc
eS
wed
en
Aus
tria
Ger
man
yIr
ela
ndO
EC
D A
vera
geS
lova
ck R
epu
blic
Nor
way
Luxe
mbo
urg
Pol
and
Hun
gar
yS
pain
Uni
ted
Sta
tes
Por
tuga
l
Italy
Gre
ece
Tu
rkey
Mex
ico
Ave
rag
e S
cale
Sco
re
Source: Organization for Economic Cooperation and Development (OECD), PISA 2003 Results , data available at http://www.oecd.org/

Problems are not limited to our high-poverty and high-
minority schools . . .

U.S. Ranks Low in the Percent of Students in the Highest Achievement Level (Level 6)
in Math
0
2
4
6
8
10
Bel
giu
m
Kor
ea
Japa
nF
inla
nd
Net
her
land
sN
ew Z
eal
and
Sw
itzer
land
Aus
tral
iaC
ana
daC
zech
Re
pub
licIc
ela
ndD
enm
ark
Sw
ede
nO
EC
D A
vera
geA
ustr
iaG
erm
any
Fra
nce
Slo
vak
Rep
ublic
Nor
way
Ire
land
Pol
and
Luxe
mbo
urg
Hun
gar
yU
nite
d S
tate
s
Italy
Tu
rkey
Spa
inP
ortu
gal
Gre
ece
Mex
ico
Per
cen
t o
f S
tud
ents
Source: Organization for Economic Cooperation and Development (OECD), PISA 2003 Results, data available at http://www.oecd.org/

U.S. Ranks 23rd out of 29OECD Countries in the Math
Achievement of High-SES Students
300
350
400
450
500
550
600
Bel
giu
mN
eth
erla
nds
Fin
lan
dC
zech
Re
pub
licC
ana
daJa
pan
Kor
ea
Sw
itzer
land
Aus
tral
iaG
erm
any
New
Ze
ala
ndF
ranc
eD
enm
ark
Sw
ede
nA
ustr
iaH
ung
ary
OE
CD
AV
ER
AG
ES
lova
k R
epub
licLu
xem
bour
gIr
ela
ndIc
ela
ndP
olan
dN
orw
ayU
nite
d S
tate
sS
pain
Por
tuga
lIta
lyG
reec
eT
urk
eyM
exic
o
Ave
rag
e S
cale
Sco
re
Source: Organization for Economic Cooperation and Development (OECD), PISA 2003 Results, data available at http://www.oecd.org/

Problems not limited to math, either.

Let’s Take A Quick Look At Achievement in Oregon

NAEP 4th Grade Reading: All

White 4th graders: NAEP Reading
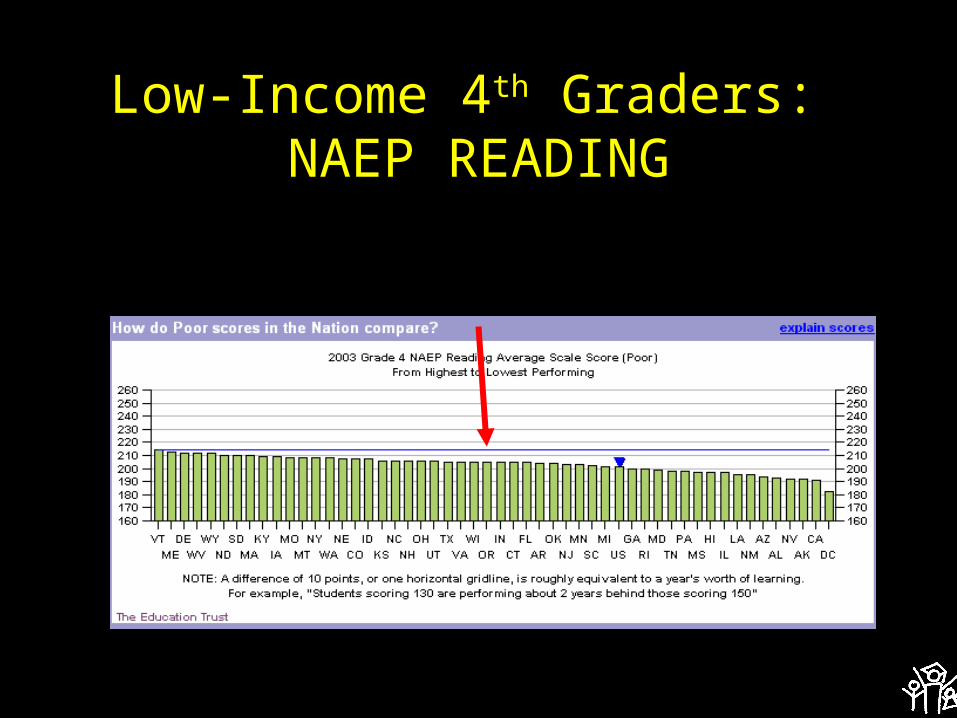
Low-Income 4th Graders: NAEP READING

NAEP 8th Grade Math: All

Low Income 8th Graders? NAEP MATH

White 8th Graders: NAEP Math

According to the National Assessment of Education Progress (NAEP), only 31% of
Oregon’s 4th graders read at the proficient level.

Though state test scores suggest much higher levels of proficiency, they also
show large gaps.
64
79
50
66
81
0
20
40
60
80
100
AfricanAmerican
Asian Latino NativeAmerican
White
Per
cen
t P
rofi
cien
t
2003 Oregon Statewide Assessment (OSA), Grade 5 Reading & Literature
Source: The Education Trust * Edwatch Online 2004 * State Summary Report

Similarly, according to NAEP, only 32% of Oregon’s 8th grade students possess
proficient level math skills.

Here again, state assessment data show higher scores but large gaps.
36
71
3140
63
0
20
40
60
80
100
AfricanAmerican
Asian Latino NativeAmerican
White
Per
cen
t P
rofi
cien
t
2003 Oregon Statewide Assessment (OSA), Grade 8 Math
Source: The Education Trust * Edwatch Online 2004 * State Summary Report

Latino students in Oregon score significantly lower than Latino students
from other states.

Latino students, in contrast to their White peers, are underrepresented in
Advanced Placement courses.

Latino students go to college at rates much lower than their White
counterparts.

Statewide, Oregon lags a little behind top states in its college participation
rates.

Oregon ranks 12th in the nation for its education funding effort
in relation to its per capita income.
Source: Kevin Carey, “State Poverty-Based Education Funding: A Survey of Current Programs and Options for Improvement”, Center on Budget and Policy Priorities, November 2002

Oregon spends an above average percent of its per capita income on
education funding, ranking 12th in the nation for its effort.
115.70%100%
0%
20%
40%
60%
80%
100%
120%
U.S. Average Oregon
The ratio of K-12 per-pupil spending in relation to state per-capita income
Source: Kevin Carey, “State Poverty-Based Education Funding: A Survey of Current Programs and Options for Improvement”, Center on Budget and Policy Priorities, November 2002

Oregon funds its high-poverty districts with more per-student than its low-poverty districts,
though not as generously as states like Minnesota and New Jersey.
Source: Education Trust calculations based on U.S. Department of Education, school district revenue data for the 2000-2001 school year.

Oregon’s high-minority districts receive $353 more per student than its low-
minority districts.
That translates into:• $8,825 more for a classroom of 25 each
year• $141,200 more for a school of 400 each
year
Source: Education Trust calculations based on U.S. Department of Education, school district revenue data for the 2000-2001 school year.

Federal funding for K-12 in Oregon has increased by 42% since 2001.
Source: U.S Department of Education, “Funds for State-Allocated Student-Aid programs (estimates for 2004-2005 school year).
$182
$136
$211$235
$0
$50
$100
$150
$200
$250
2001 2002 2003 2004 (estimate)
Mill
ion
s o
f D
olla
rs
Designated funding for the No Child Left Behind Act of 2001

Since NCLB’s passage, Oregon’s Grade 5 Reading Scores have
Declined by 3 Points
77 79 76 76
0
20
40
60
80
100
Per
cen
t M
eets
an
d E
xcee
ds
2001
2002
2003
2004
Source: Oregon Department of Education, http://www.ode.state.or.us/
Oregon Statewide Assessment (OSA)

The African American-White 5th grade reading gap narrowed by 4 Points.
58
80
6563
8183
0
20
40
60
80
100
2001 2002 2003 2004
Perc
en
t M
eets
an
d E
xceed
s
African American
White
Source: Oregon Department of Education, http://www.ode.state.or.us/
22 1620
Oregon Statewide Assessment (OSA)

The Latino-White 5th grade reading gap narrowed by 1 point.
51
80
5455
8183
0
20
40
60
80
100
2001 2002 2003 2004
Perc
en
t M
eets
an
d E
xceed
s
Latino
White
Source: Oregon Department of Education, http://www.ode.state.or.us/
29 2728
Oregon Statewide Assessment (OSA)

However, Oregon’s Grade 5 Math Scores have Increased by 4 Points
since NCLB’s passage
73 75 76 79
0
20
40
60
80
100
Perc
en
t M
eets
an
d E
xceed
s
2001
2002
2003
2004
Source: Oregon Department of Education, http://www.ode.state.or.us/
Oregon Statewide Assessment (OSA)

The African American-White 5th grade math gap narrowed by 6 points.
59
77
6657
8279
0
20
40
60
80
100
2001 2002 2003 2004
Perc
en
t M
eets
an
d E
xceed
s
African American
White
Source: Oregon Department of Education, http://www.ode.state.or.us/
181622
Oregon Statewide Assessment (OSA)

The Latino-White 5th grade math gap narrowed by 7 Points.
47
77
60
50
8279
0
20
40
60
80
100
2001 2002 2003 2004
Perc
en
t M
eets
an
d E
xceed
s
Latino
White
Source: Oregon Department of Education, http://www.ode.state.or.us/
30 2229
Oregon Statewide Assessment (OSA)

One measure on which we rank high?
Inequality!

These gaps begin before children arrive at the
schoolhouse door.But, rather than organizing our
educational system to ameliorate this problem, we organize it to
exacerbate the problem.
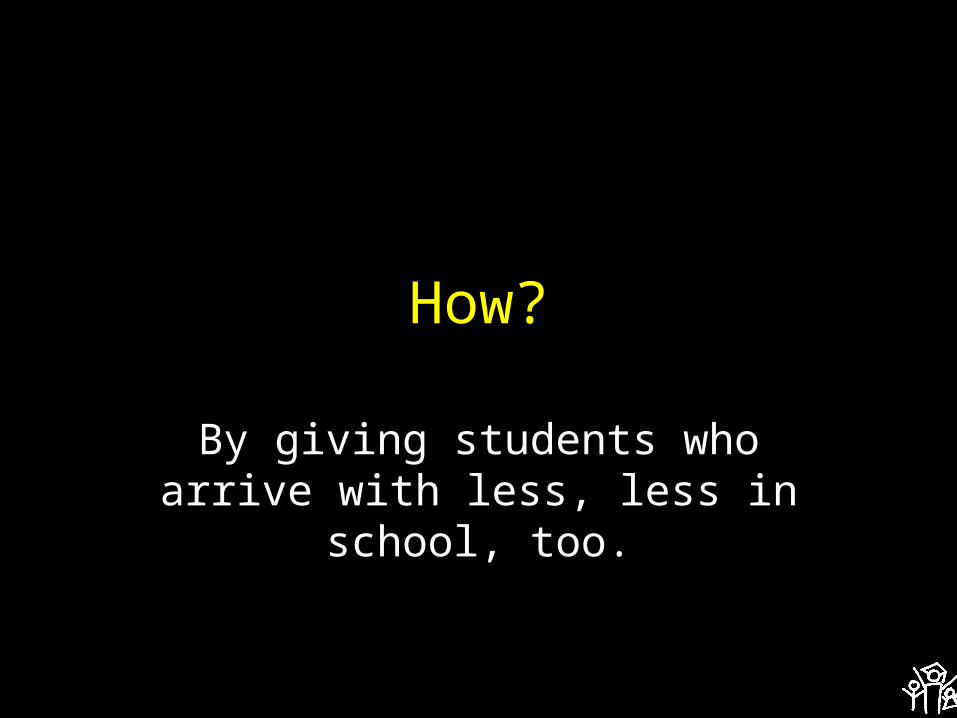
How?
By giving students who arrive with less, less in school, too.

Some of these “lesses” are a result of choices that policymakers make.

Nation:Inequities in State and Local
Revenue Per StudentGap
High Poverty vs. Low Poverty Districts
-$907 per student
High Minority vs. Low Minority Districts
-$614 per student
Source: The Education Trust, The Funding Gap 2005. Data are for 2003
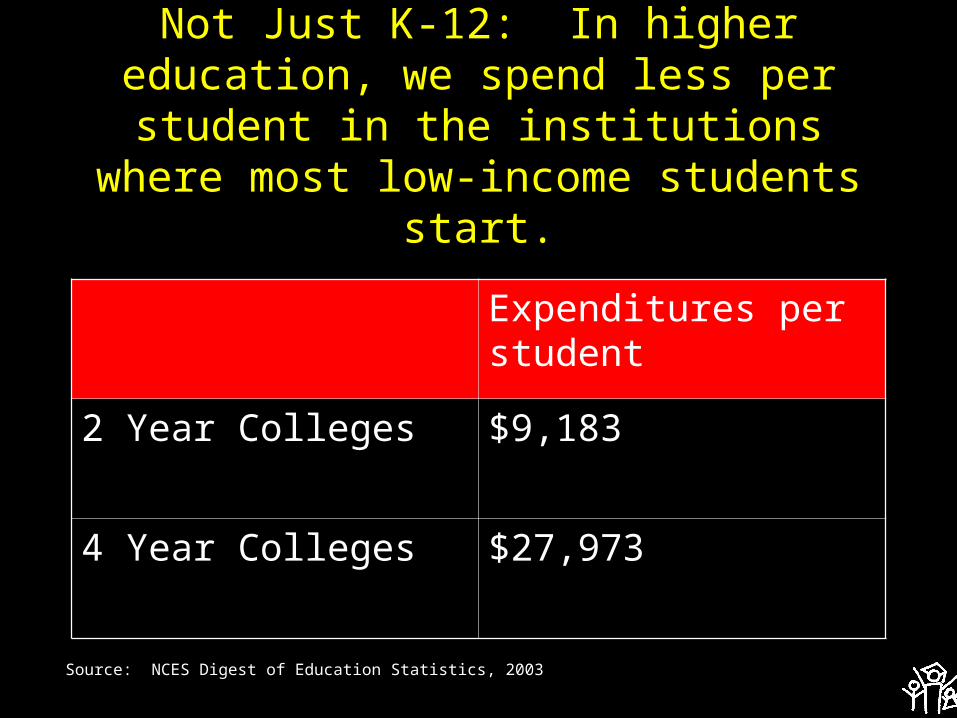
Not Just K-12: In higher education, we spend less per student in the
institutions where most low-income students start.
Expenditures per student
2 Year Colleges $9,183
4 Year Colleges $27,973
Source: NCES Digest of Education Statistics, 2003

But some of the “lesses”–indeed, perhaps the most
devastating ones—are a function of choices that
educators make.

Choices we make about what to expect of whom…

Choices we make about what to teach whom…

Source: CCSSO, State Indicators of Science and Mathematics Education, 2005
Fewer Latino students are enrolled
in Algebra 1 in Grade 8
2429
0
50
2003
Per
cen
t En
rolle
d
Latino
White

Source: CCSSO, State Indicators of Science and Mathematics Education, 2001
Fewer Latino students are enrolled
in Algebra 2
45
62
0
80
1998
Per
cen
t En
rolle
d
Latino
White

And choices we make about Who
teaches whom…

More Classes in High-Poverty, High-Minority Schools Taught By Out-of-
Field Teachers
34%
19%
29%
21%
0%
50%
Per
cen
t o
f C
lass
es T
aug
ht
by
Ou
t o
f F
ield
Tea
cher
s
*Teachers lacking a college major or minor in the field. Data for secondary-level core academic classes.Source: Richard M. Ingersoll, University of Pennsylvania. Original analysis for the Ed Trust of 1999-2000 Schools and Staffing Survey .
High poverty Low poverty High minority Low minorityNote: High Poverty school-50% or more of the students are eligible for free/reduced price lunch. Low-poverty school -15% or fewer of the students are eligible for free/reduced price lunch.
High-minority school - 50% or more of the students are nonwhite. Low-minority school- 15% or fewer of the students are nonwhite.

Poor and Minority Students Get More Inexperienced*
Teachers20%
11%
21%
10%
0%
25%
Perc
en
t o
f T
each
ers
Wh
o A
re
Inexp
eri
en
ced
Source: National Center for Education Statistics, “Monitoring Quality: An Indicators Report,” December 2000.
*Teachers with 3 or fewer years of experience.
High poverty Low poverty High minority Low minority
Note: High poverty refers to the top quartile of schools with students eligible for free/reduced price lunch. Low poverty-bottom quartile of schools with students eligible for free/reduced price lunch. High minority-top quartile; those schools with the highest concentrations of minority students. Low minority-bottom quartile of schools with the lowest concentrations of minority students

Results are devastating.
Kids who come in a little behind, leave a lot behind.
By the end of high school?

African American and Latino 17 Year-Olds Do Math at Same Levels
As White 13 Year-Olds
0%
100%
200 250 300 350
Average Scale Score
Per
cent
of
Stud
ents
White 13 Year-Olds African American 17 Year-Olds Latino 17-Year Olds
Source: National Center for Education Statistics, NAEP 2004 Trends in Academic Progress
Note: Long-Term Trends NAEP

African American and Latino 17 Year-Olds Read at Same Levels As
White 13 Year-Olds
0%
100%
150 200 250 300 350
Average Scale Score
Per
cent
of
Stud
ents
White 13 Year-Olds African American 17 Year-Olds Latino 17 Year-Olds
Source: National Center for Education Statistics, NAEP 2004 Trends in Academic Progress
Note: Long-Term Trends NAEP

Students Graduate From High School At Different Rates
* 4-Year Graduation Rates
55%
72%
53%
78%
0%
100%
Perc
ent
of
Stu
dents
G
raduati
ng in 4
Years
African American Asian Latino White
Source: Jay P. Greene and Marcus A. Winters, The Manhattan Institute, 2006. Leaving Boys Behind: Public High SchoolGraduation Rates.
Data is for the class of 2003.

ADD IT ALL UP...

Of Every 100 White Kindergartners:
94 Graduate from high school
66 Complete at least some college
34 Obtain at least a Bachelor’s Degree
(25-to 29-Year-Olds)
Source: US Department of Commerce, Bureau of the Census. March Current Population Surveys, 1971-2003, in The Condition of Education 2005. http://nces.ed.gov/programs/coe/2005/section3/indicator23.asp#info

Of Every 100 African American Kindergartners:
89 Graduate from High School
51 Complete at Least Some College
18 Obtain at Least a Bachelor’s Degree
(25-to 29-Year-Olds)
Source: US Department of Commerce, Bureau of the Census. March Current Population Surveys, 1971-2003, in The Condition of Education 2005. http://nces.ed.gov/programs/coe/2005/section3/indicator23.asp#info

Of Every 100 Latino Kindergartners:
62 Graduate from high school
31 Complete at least some college
10 Obtain at least a Bachelor’s Degree
(25-to 29-Year-Olds)
Source: US Department of Commerce, Bureau of the Census. March Current Population Surveys, 1971-2003, in The Condition of Education 2005. http://nces.ed.gov/programs/coe/2005/section3/indicator23.asp#info

Of Every 100 American Indian/Alaskan Native
Kindergartners:
(25 Years Old and Older)
Source: U.S. Census Bureau, We the People: American Indians and Alaska Natives in the United States. Data source: Census 2000, www.census.gov/population/www/socdemo/race/censr-28.pdf
71 Graduate from high school
30 Complete at least some college
12 Obtain at least a Bachelor’s Degree

College Graduates by Age 26
Young People From High Income Families
60%
Young People From Low Income Families
7%
SES is a weighted variable developed by NCES, which includes parental education levels and occupations and family income. “High” and “low” refer to the highest and lowest quartiles of SES.
Source: National Center for Education Statistics, Coming of Age in the 1990’s: The Eighth Grade Class of 1988 12 Years Later, March, 2002. http://nces.ed.gov/pubsearch/pubsinfo.asp?pubid=2002321

Why do these gaps in achievement exist?

What We Hear Many Educators Say:
• They’re poor;• Their parents don’t care;• They come to schools without
breakfast; • Not enough books• Not enough parents . . .

But if they are right, why are low-income students and
students of color performing so high in some schools…

George Mason Elementary, Richmond City Public Schools
• 319 Students PK-Grade 5• 99.7% African American• 75% Low-Income• Made AYP in 2005
Source: School Matters, www.schoolmatters.com

George Mason Gains in Grade 5 Reading
34
90
0
20
40
60
80
100
2002 2003 2004 2005
Per
cen
t P
rofi
cien
t an
d A
dva
nce
d
Source: School Matters, www.schoolmatters.com

George Mason Gains in Grade 5 Math
31
94
0
20
40
60
80
100
2002 2003 2004 2005
Per
cen
t P
rofi
cien
t an
d A
dva
nce
d
Source: School Matters, www.schoolmatters.com

Centennial Place Elementary School
Atlanta, Georgia
• 528 students in grades K-5• 92% African American• 62% Low-Income
Source: School Information Partnership, http://www.schoolmatters.com

Centennial PlaceHigh Achievement for All Students
Grade 5 Math, 200592 92 92 92
0
20
40
60
80
100
Overall AfricanAmerican
Poor Non-Poor
Perc
en
t P
rofi
cie
nt
Source: School Information Partnership, http://www.schoolmatters.com

Centennial PlaceHigh Achievement for All Students
Grade 5 Reading, 200591 91 90 92
0
20
40
60
80
100
Overall AfricanAmerican
Poor Non-Poor
Perc
en
t P
rofi
cie
nt
Source: School Information Partnership, http://www.schoolmatters.com

Frankford ElementaryFrankford, Delaware
• 29% African-American• 34% Latino• 34% White• 76% Low-Income
Source: Delaware Department of Education Online School Profiles,
http://issm.doe.state.de.us/profiles/EntitySearch.ASPX

Frankford ElementaryClosing Gaps, Grade 5 Math
70
9696 94
0
20
40
60
80
100
2003 2005
Pe
rce
nt
Me
eti
ng
or
Ex
ce
ed
ing
Sta
nd
ard
s
Poor
Non-Poor
Source: Delaware Department of Education, DSTP Online Reports, http://dstp.doe.k12.de.us/DSTPmart/default.asp

Elmont Memorial Junior-Senior High Elmont, New York
• 75% African American• 12% Latino• 11% Asian/Pacific Islander/American
Ind.• 3% White• 24% Low-Income
Source: http://emsc33.nysed.gov/repcrd2004/cir/280252070002.pdf

Elmont MemorialHigh Achievement in
Mathematics969797 100100100 949495
0%
20%
40%
60%
80%
100%
AfricanAmerican
Latino Low IncomePer
cen
t M
eeti
ng
Gra
du
atio
n
Req
uir
emen
t
1998 Cohort 1999 Cohort 2000 Cohort (Class of 2004)
Source: http://emsc33.nysed.gov/repcrd2004/overview-analysis/280252070002.pdf

Elmont Memorial High Achievement in English
969796 9897100 10010099
0%
20%
40%
60%
80%
100%
AfricanAmerican
Latino Low Income
Pe
rce
nt
Me
eti
ng
Gra
du
ati
on
R
eq
uir
em
en
t
1998 Cohort 1999 Cohort 2000 Cohort (Class of 2004)
Source: http://emsc33.nysed.gov/repcrd2004/overview-analysis/280252070002.pdf

Some of Oregon’s schools have been particularly
successful at helping all students to succeed at high
levels.

Kenton Elementary SchoolPortland, Oregon
• 24% Low-Income• 33% African American• Made AYP for 2003-04
SOURCE: Oregon Department of Education, http://www.ode.state.or.us

Closing the Income Gap at Kenton2003 ELA Composite and Math
Composite
7368
8074
0
20
40
60
80
100
English/Language Arts Math
Pe
rce
nt
Me
eti
ng
or
Ex
ce
ed
ing
Sta
nd
ard
s
All
Low Income
SOURCE: Oregon Department of Education, http://www.ode.state.or.us

Ball Elementary SchoolPortland, Oregon
• 80% Low-Income• 33% African American• 21% Latino• Made AYP for 2003-04
SOURCE: Oregon Department of Education, http://www.ode.state.or.us; Dispelling the Myth Online, http://www.edtrust.org

Academic Progress at Ball Elementary
Composite Math scores, 2004
Source: Dispelling the Myth Online, http://www.edtrust.org; Oregon Department of Education, http://www.ode.state.or.us/data/reportcard/RCpdfs/04/04-ReportCard-829.pdf
93%
57%
63%52%
0
20
40
60
80
100
2000 2001 2002 2003
Perc
en
t P
rofi
cie
nt
State AYP target (2003)= 39% Proficiency
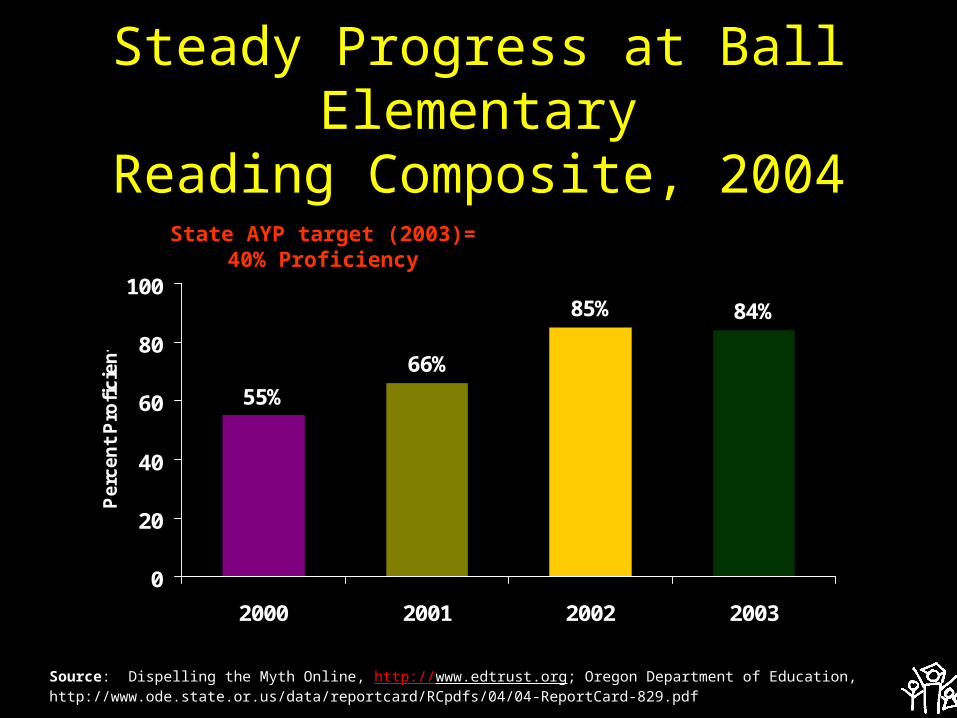
Steady Progress at Ball Elementary
Reading Composite, 2004
Source: Dispelling the Myth Online, http://www.edtrust.org; Oregon Department of Education, http://www.ode.state.or.us/data/reportcard/RCpdfs/04/04-ReportCard-829.pdf
84%85%
66%
55%
0
20
40
60
80
100
2000 2001 2002 2003
Perc
en
t P
rofi
cie
nt
State AYP target (2003)= 40% Proficiency

Guess What?Also very big differences in
college results…even among those who serve “same”
kinds of students.

Higher education institutions graduation rates

College Results Online

Bottom Line:At Every Level of Education, What We Do Matters A Lot!

MOVING FORWARD

So What Can We Do?

#1. Don’t be bashful about pressing for all students to
graduate high school “college ready.”
High impact schools aim high for all students. Even when they start with high dropout rates, they aim
students toward college and careers.

That’s Good, Because Education Pays: 2000 U.S. Median Earnings
$15,000
$21,000$22,700
$28,200
$36,000
$0
$20,000
$40,000
Less ThanHigh School
High SchoolGraduate
Some College AssociateDegree
BaccalaureateDegree
2000
U.S
. Med
ian
Ear
nin
gs
Source: U.S. Census Bureau, 2000 Public Use Microdata Samples (based on the 2000 Decennial Census)

75% OF NEW JOB GROWTH REQUIRES SOME LEVEL OF
POST-SECONDARY TRAINING

Growing Need for Higher Levels of Education:
Projections of Education Shortages and Surpluses in 2012
-4,000,000 -3,000,000 -2,000,000 -1,000,000 0 1,000,000 2,000,000 3,000,000 4,000,000
Less Than HighSchool
High School
Associates Degree
Some College
Shortage Surplus
Source: Analysis by Anthony Carnevale, 2006 of Current Population Survey (1992-2004) and Census Population Projection Estimates
Bachelor’s Degree

NEW STUDY FROM ACT:College ready, workforce
training ready=same thing

#2. Add your voice to the movement to make the
“college prep” curriculum the default curriculum for all
students.

Single biggest predictor post-
high school success is
QUALITY AND INTENSITY OF
HIGH SCHOOL CURRICULUM
Source: Cliff Adelman, 2006, The Toolbox Revisited, U.S. Department of Education.

Oregon’s Diploma Project: College prep curriculum has benefits far beyond
college.

Students of all sorts will learn more...

Source: USDOE, NCES, Vocational Education in the United States: Toward the Year 2000, in Issue Brief: Students Who Prepare for College and Vocation
*Grade 8-grade 12 test score gains based on 8th grade achievement.
Low Quartile Students Gain More From College
Prep Courses*
1916
28
20
0
30
Math Reading
NE
LS
Sco
re G
ain
Vocational College Prep

They will also fail less often...

Challenging Curriculum Results in Lower Failure Rates, Even for Lowest Achievers
16
23
47
31
0
50
Quartile I (Lowest) Quartile 2
Per
cen
t E
arn
ing
"D
" o
r "F
"
College Prep Low Level
Source: SREB, “Middle Grades to High School: Mending a Weak Link”. Unpublished Draft, 2002.
Ninth-grade English performance, by high/low level course, and eighth-grade reading achievement quartiles

And they’ll be better prepared for the
workplace.

Leading districts, states making college prep the
default curriculum.
Texas, Indiana, Arkansas, Oklahoma, Kentucky, Kansas.

#3. Getting All Students in Courses With the Right
Labels Isn’t Enough.
Higher education can be strong partner in quality assurance strategies.

Historically, most of the really important decisions
about what students should learn and what kind
of work was “good enough” left to individual
teachers.

Result? A System That:
• Doesn’t expect very much from MOST students; and,
• Expects much less from some types of students than others.

Students can do no better than
the assignments they are given...

Grade 10 Writing Assignment
A frequent theme in literature is the conflict between the individual and society. From literature you have read, select a character who struggled with society. In a well-developed essay, identify the character and explain why this character’s conflict with society is important.

Grade 10 Writing Assignment
Write a composition of at least 4 paragraphs on Martin Luther King’s most important contribution to this society. Illustrate your work with a neat cover page. Neatness counts.

#4. Good teachers matter big time.

Students in Dallas Gain More in Math with Effective Teachers: One Year Growth From 3rd-4th
Grade
7
16
0
24
6
810
12
1416
18
Students with Teachers inLowest Quintile of
Effectiveness
Students with Teachers inHighest Quintile of
Effectiveness
Ave
rag
e N
orm
al
Cu
rve
Eq
uiv
alen
ts
Source: Heather Jordan, Robert Mendro, and Dash Weerasinghe, The Effects of Teachers on Longitudinal Student Achievement, 1997.

Cumulative Teacher Effects On Students’ Math Scores in
Dallas (Grades 3-5)
76
27
0
10
20
30
40
50
60
70
80
90
100
Ave
rag
e P
erce
nti
le R
ank
Dallas StudentsAssigned to 3Highly EffectiveTeachers in aRow
Dallas StudentsAssigned to 3IneffectiveTeachers in aRow
Source: Heather Jordan, Robert Mendro, and Dash Weerasinghe, The Effects of Teachers on Longitudinal Student Achievement, 1997.
Beginning Grade 3Percentile Rank= 55
Beginning Grade 3Percentile Rank= 57

Good teachers matter a lot.
But some groups of kids don’t get their fair share of quality
teachers.

Classes in High Poverty High Schools More Often Taught by
Misassigned* Teachers
28%
14%19%
16%
40%
20%
31%
18%
0%
50%
Math Science English Social Studies
less than 20% Free Lunch greater than 49% Free Lunch
*Teachers who lack a major or minor in the fieldSource: National Commission on Teaching and America’s Future, What Matters Most: Teaching for America’s Future (p.16) 1996.

Impact?

Four Concrete Things That Higher Education Can Do To
Help1. Help build the data systems necessary to
understand teacher effectiveness and how it is distributed;
2. Help us understand the practices and characteristics of teachers who produce strong learning gains for students;
3. Produce more teachers with the commitment and skills to teach all students to high levels, and don’t put your stamp of approval on those without the necessary characteristics; and,
4. Join in the effort to make sure that students in high poverty and high minority schools get the teachers they need to succeed.

5. Finally, we’ve got to get serious about success in higher education, too.

Many institutions putting higher priority on access
than success.High Impact Colleges:
See AASCU and EdTrust reports

Bottom line clear: Leadership Matters
Student success must become a higher priority for
all academic units.

YOUcan help to make this happen
by setting stretch goals on student success for each of your institutions, publishing
data on results, and rewarding progress.

Surely we can do better.

The Education TrustPaul F. Ruiz, PhD; Principal Partner
The Education Trust [email protected] www.edtrust.org
Washington, DC: 202-293-1217San Antonio, TX: 210-979-0575