Embed Size (px)
Citation preview
Working report on Clot Waveform Analysis
Towards standardization and recommendations for clot waveform analysis
Midori Shima1, Jecko Thachil2, Sukesh C Nair3, Alok Srivastava4 1Department of Pediatrics, Nara Medical University, Kashihara, Nara, Japan,2Department of
Haematology, Roald Dahl Haemostasis and Thrombosis Centre, Royal Liverpool University
Hospital, Liverpool, UK,3 Department of Transfusion Medicine and Immunohaematology, Christian
Medical College, Vellore, India,4 Department of Haematology at Christian Medical College, Vellore,
India.
Introduction
Automated coagulation analyzers are being relied upon increasingly in response to the
heightened demand for blood clotting investigations and the need for rapid results. The
automated systems can provide a wealth of information in addition to that provided by
conventional clotting tests such as the prothrombin time (PT) and the activated partial
thromboplastin time (APTT), which are often considered of limited use for clinical purposes [1-3].
One particular type of analysis, the clot waveform, which is provided by the Multichannel Discrete
Analyzer (MDA series; Organon, Technika), defines changes in light transmittance which occur
during the process of clot formation.
A number of recent reports have described the use of this type of automated clotting instrument
for clot waveform analysis (CWA), and there appears to be significant advantages in using this
system for the assessment of global coagulation function. Principally, CWA can be conveniently
performed simultaneously with routine coagulation tests, and no dedicated apparatus is required
in laboratories equipped with the appropriate automated analyser. In addition, quantitative
measures of several novel parameters reflecting coagulation velocity and acceleration are
provided alongside the qualitative observations of waveform.
Principles of Waveform
The principles of waveform analysis can be illustrated using the APTT performed on the MDA-II
system utilising Platelin LS, 0.025mM CaCl2, and Verify reference plasma. The waveform is
visualized, recorded and a hard copy printed. The data are automatically processed
mathematically by the MDA-II system using algorithms built into the commercial software [3]. The
CWA results are accessed using exporting software. Changes in light transmittance are
determined by continuous measurements during the APTT and are designated the clot waveform
(Fig 1). This clotting process is categorized into the three parts; the pre-coagulation phase, the
coagulation phase and post-coagulation phase. Pre-coagulation is described as the first segment

of the trace, from the beginning of the signal to the onset of coagulation. Usually, this phase is
horizontal, except in waveforms in patients with DIC induced by septicemia (see below). After the
onset of coagulation, light transmittance is decreased by the formation of fibrin and is defined by a
slope in the waveform. At the end of coagulation, light transmittance tends to stabilize and is
characterized again by a linear segment. If fibrinolysis is enhanced due to acquired or congenital
pathological disturbances such as plasminogen inhibitor deficiency, light transmittance may be
increase again in the post-coagulation phase.
Various commercial APTT reagents can be utilized for both CWA and routine coagulation assays.
It is noteworthy, however, that selection of reagents is most important for optimal CWA results.
Colourless reagents, without opacity, are recommended to detect sensitive changes in
transmittance or absorbance, and for subsequent precise measurements of the various
parameters. In addition, the APTT clotting time should be adjusted in order to increase sensitivity
for the assessment of impaired clotting function as in coagulation factor deficiencies. Hence, the
APTT time-scale may be too short using some currently available, standard APTT reagents, and
these reagents should be diluted appropriately to adjust the clotting time to approximately 30-40
sec. with normal plasma and > 90 sec with FVIII deficient plasma.
Quantitative assessment of waveform parameters
In the MDA-II system, a set of nine parameters are used to describe the characteristic optical
profiles obtained during APTT and PT assays [1-3]. Slope 1 is initial slope of the pre-coagulation
phase before the onset of coagulation and is derived from mean slope during this phase. tmin2 is
the time at the onset of coagulation, and min2 is the minimum value of the second derivative of
the transmittance. The absolute value of min2 (|min2|) reflects maximum coagulation acceleration.
tmin1 is the time at the mid-point of the coagulation phase. min1 is the minimum value of the first
derivative of the transmittance. The absolute value of min1 (|min1|) reflects the maximum
coagulation velocity. tmax2 is the time at the end of the coagulation phase, and is recorded at the
maximum deceleration rate of coagulation, max2, is derived from the second derivative. slope 3 is
mean slope in the post-coagulation phase. delta is amplitude of signal change. This value reflects
fibrinogen concentration.
CWA in various coagulation disorders
Initial evaluation of clotting function by CWA is undertaken by qualitative assessment of the CW
pattern. In particular, two characteristic CW patterns are observed in various coagulation
abnormalities compared with normal reference plasma (Fig 2). In normal plasma, the
pre-coagulation phase is short and the slope, reflecting the coagulation phase, is steep. In factor
V (FV) deficiency and factor VIII (FVIII) deficiency, and in the anti-phospholipid syndrome (APS),
the pre-coagulation phase is prolonged but the changes in slope are different. In APS, the
waveform shifts towards a normal pattern after the addition of phospholipid, Changes in slope are
most evident in FVIII deficiency. In APS, the steepness of the slope is similar to that of reference
plasma, although the pre-coagulation phase is prolonged. This particular pattern might provide a
useful index in the investigation of APS. Thus, qualitative analysis of CW may have diagnostic
value is various clinical settings with impaired clotting function.
It is very important to understand how CW patterns reflect the concentration of deficient clotting
factors. This can be demonstrated by analyzing mixtures of deficient plasma and various amounts
of normal plasma. In FVIII deficiency, the CW pattern changes dose dependently on the addition
of FVIII (Fig 3A). As the FVIII level is decreased, the pre-coagulation phase is prolonged and
slope becomes slower. Furthermore, Interestingly, this feature is most prominent in the presence
of concentrations of FVIII less than 5%. At higher concentrations, the changes in CW patterns are
less marked compared to that of reference plasma. Similar results are seen in FV deficiency
except that differences between higher and lower concentrations of FV are not as remarkable (Fig
3B). It may be that these results reflect the likelihood that global clotting function is more abnormal
in the presence of less than 5% FVIII.
Quantitative evaluation of CW parameters in factors II, V, VIII, IX, X, XI and XII deficiency shows
that tmin2 and min2, representing coagulation acceleration, remain within the normal range at
clotting factor concentrations higher than 50%, but gradually increase at less than 50% and are
markedly abnormal at less than 5%. In contrast, no changes in CW patterns are seen in factor VII
and protein C deficiency [3].
Evaluation of clotting function in hemophilia A
The clinical severity in hemophilia A (HA) generally correlates with the level of FVIII activity
(FVIII:C). Hence, hemophilia A is classified into three categories on the basis of FVIII:C activity;
severe (FVIII:C<1.0 IU/dl), moderate (FVIII:C 1.0-5.0 IU/dl) and mild (FVIII:C >5 IU/dl). Studies
have indicated that CWA in a number of patients with severe HA diagnosed by conventional
clotting assays differed from patient to patient. The APTT clotting time was prolonged in all
patients with severe HA, but there was variation in the slope [4]. Using mixtures of severe HA
plasma and exogenous FVIII ranging from zero to 1.0 IU/dl, the slope and the APTT clot time and
the min2 appeared to change in a dose-dependent manner. Similarly, in experiments with 36
patients with severe HA, significant correlations between min2 and FVIII:C were confirmed [4] .
These results indicated that in some patients, the presence of very low levels of FVIII mediated
higher coagulation acceleration characterized by the steeper slope, although It was possible that
factors other than FVIII:C alone may have influenced clotting kinetics reflected in the waveform
profile. Nevertheless, the data suggested that CWA could discriminate between different levels of
FVIII:C in this critical category of severe HA defined as having <1.0 IU/dl FVIII:C by conventional

assays (Figure 4).
Some HA patients classified as severe on the basis of coagulation assay exhibit milder clinical
symptoms. Similarly, some patients who may be initially identified in the moderate-mild category
demonstrate a severe clinical phenotype with frequent bleeding symptoms. CWA, therefore, might
provide very important data for evaluating in vivo clotting function in various types of hemophilia A.
To validate this proposal, hemophilia A patients were divided into clinically severe and non severe
groups. Severe patients were characterized by the presence of spontaneous bleeding episodes at
the age of < 1 year, the onset of joint or muscular bleeding before the age of three years old, or
the presence of severe bleeding such as intracranial bleeding or refractory oral bleeding. The
differences between the severe and the non severe phonotype were significant for four CW
parameters; clot time, maximal coagulation velocity (Min1), maximal coagulation acceleration
(Min2) and maximal coagulation deceleration (Max2), These results suggested, therefore, that
CW parameters reflect clinical severity (Fig. 5).
According to the cell based coagulation model, thrombin generation is considered to provide an
important means for global clotting assessment. It may be valuable, therefore, to compare the
results obtained from CWA with those of the thrombin generation test (TGT). CWA and TGT were
performed simultaneously on FVIII-and FIX-deficient plasma, which had been reconstituted with
known concentrations of FVIII and FIX. Overall, the results obtained with both assays showed
good correlation with FVIII and FIX levels, confirming that the changes in CWA coincided with
changes in TG. This study demonstrated, however, that the CWA was more sensitive than TGT
especially at low levels of these clotting factors [5].
Biphasic pattern (BPW) in sepsis and DIC
The normal sigmoid appearance of the APTT transmittance waveform appears to be modified to a
“biphasic” pattern in patients with sepsis and disseminated intravascular coagulation (DIC), CWA,
therefore might provide important data for the prediction this major complication of septicaemia [7].
As demonstrated above, a normal APTT-CW on the MDA-II illustrates an initial plateau phase
followed by a downward slope, providing the typical sigmoid appearance for the entire curve. This
pattern is maintained in patients with clotting factor deficiencies, including those with hemophilia
and inhibitors, and individuals who are receiving anticoagulant agents including heparin and
plasma expanders, although the plateau phase can be prolonged in association with the degree of
prolongation of the APTT [8]. The biphasic wave form profile is characterized by the development
of an initial low-gradient slope followed by a much steeper slope (Fig 6) [8,9]. This biphasic
pattern (BPW) persisted in sepsis even in the presence of a normal APTT and was not influenced
by pre-analytical variables such as time from venipuncture and the presence or absence of
platelets [8]. The wave pattern was not consistently demonstrated, however, using the PT test
except in cases with a prolonged PT [9]. In this clinical group, the distinct waveform with a greater
steepness of the initial slope correlated with levels of D-dimer greater than 10mg/L but did not
correlate with changes in plasma fibrinogen level. Some workers have defined the BPW as when
the slope of the pre-coagulation phase exceeds a threshold value of -0.25%T/sec [10-11].
Future Vision on CWA
Although CWA is a very convenient global clotting technique, limitations with the MDA series of
coagulation analysers have hampered the wider use of this method. Automated CWA is not
always available, although most of the currently purchased instruments include software to
process the changes in transmittance or absorbance. Even if the relevant computer software is
not included with the system, however, it would be possible to perform CWA using standard
programmes such as Microsoft Excel if raw data can be extracted. The next stage for the future
development CWA is to compare the results using different analytical platforms and to standardize
the evaluation based on selected test reagents and agreed parameters. It will also be important to
examine this technique in various other clinical settings, such as monitoring
hemostasis-bypassing therapy and inhibitor neutralization [6,12] .
References
1) Braumann P, Juergensen T, Heuck C-C. Computerized analysis of the in vitro activation of the
plasmatic clotting system. Haemostais 1989 19 309-21
2) Givens TB, Braun P, Fischer TJ. Predicting the presence of plasma heparin using neural
networks to analyze coagulation screening assay optical profiles. Comput Biol Med 1996
26:463-476.
3) Braun PJ, Givens TB, Stead AG, Beck LR, Gooch SA, Swan RJ, Fischer TJ. Properties of
optical data from activated partial thromboplastin time and prothrombin time assays. Thromb
Haemost. 1997 ;78:1079-87.
4) Shima M, Matsumoto T, Fukuda K, Kubota Y, Tanaka I, Nishiya K, Giles AR, Yoshioka A. The
utility of activated partial thromboplastin time (aPTT) clot waveform analysis in the
investigation of hemophilia A patients with very low levels of factor VIII activity (FVIII:C).
Thromb Haemost. 2002;87:436-41.
5) Matsumoto T, Shima M, Takeyama M, Yoshida K, Tanaka I, Sakurai Y, Giles AR, Yoshioka A.
The measurement of low levels of factor VIII or factor IX in hemophilia A and hemophilia B
plasma by clot waveform analysis and thrombin generation assay. J Thromb Haemost.
2006;4:377-84.
6) Shima M, Matsumoto T, Ogiwara K. New assays for monitoring haemophilia treatment.

Haemophilia. 2008;14:83-92.
7) Toh CH, Ticknor LO, Downey C, Giles AR, Paton RC, Wenstone R. Early identification of
sepsis and mortality risks through simple, rapid clot-waveform analysis. Implications of
lipoprotein-complexed C reactive protein formation. Intensive Care Med. 2003;29:55-61.
8) Downey C, Kazmi R, Toh CH. Novel and diagnostically applicable information from optical
waveform analysis of blood coagulation in disseminated intravascular coagulation. Br J
Haematol. 1997;98:68-73.
9) Downey C, Kazmi R, Toh CH. Early identification and prognostic implications in disseminated
intravascular coagulation through transmittance waveform analysis. Thromb Haemost.
1998;80:65-9.
10) Chopin N, Floccard B, Sobas F, Illinger J, Boselli E, Benatir F, Levrat A, Guillaume C, Crozon
J, Négrier C, Allaouchiche B. Activated partial thromboplastin time waveform analysis: a new
tool to detect infection? Crit Care Med. 2006;34:1654-60.
11) Dempfle CE, Lorenz S, Smolinski M, Wurst M, West S, Houdijk WP, Quintel M, Borggrefe M.
Utility of activated partial thromboplastin time waveform analysis for identification of sepsis
and overt disseminated intravascular coagulation in patients admitted to a surgical intensive
care unit. Crit Care Med. 2004;32:520-4.
12) Kasuda S, Tanaka I, Shima M, Matsumoto T, Sakurai Y, Nishiya K, Giles AR, Yoshioka A.
Effectiveness of factor VIII infusions in haemophilia A patients with high responding inhibitors.
Haemophilia. 2004 10:341-346.
Figure legends
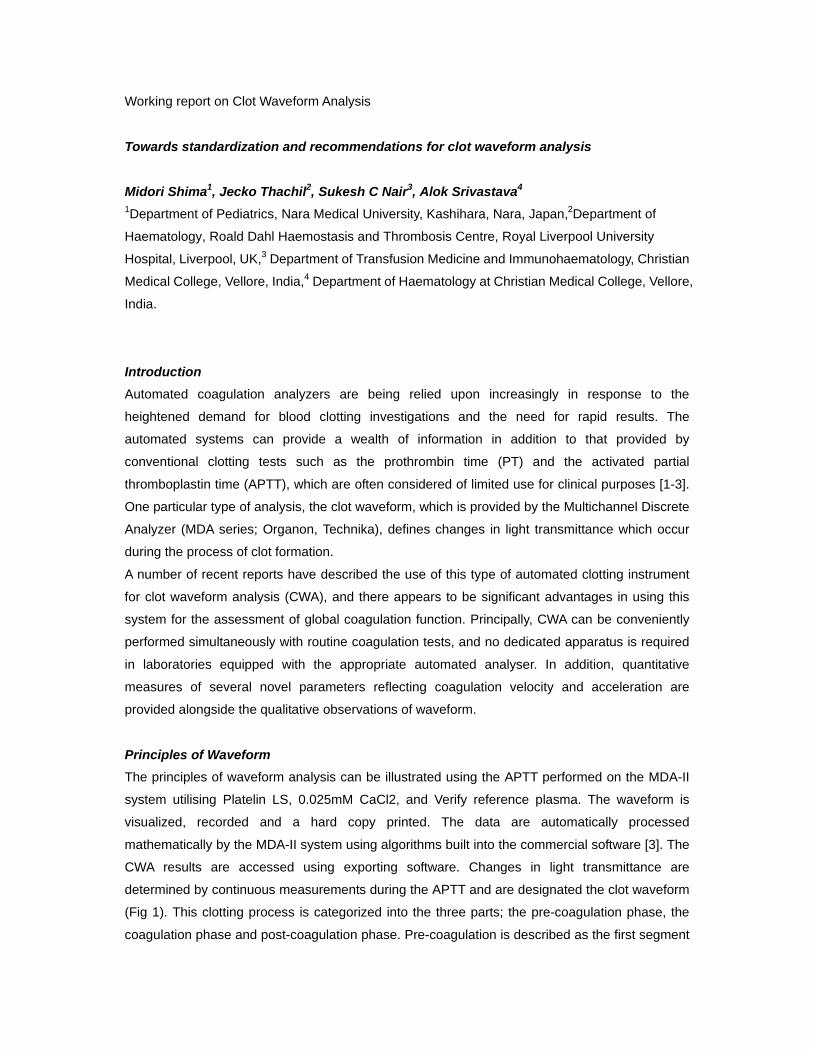
Figure 1. Optical transmittance vs. time for APTT assay of a normal specimen.
The upper trace shows the changes in light transmittance observed during the performance of
APTT with normal reference plasma. Point ” A” marks the beginning of the recording by the
instrument which occurs 8 sec. after the addition of CaCl2, Point “B” indicates the initiation of
coagulation, namely fibrin formation. The clot waveform is separated into the pre-coagulation
phase (A-B), the coagulation phase (B-D), and the post-coagulation phase (D-E)
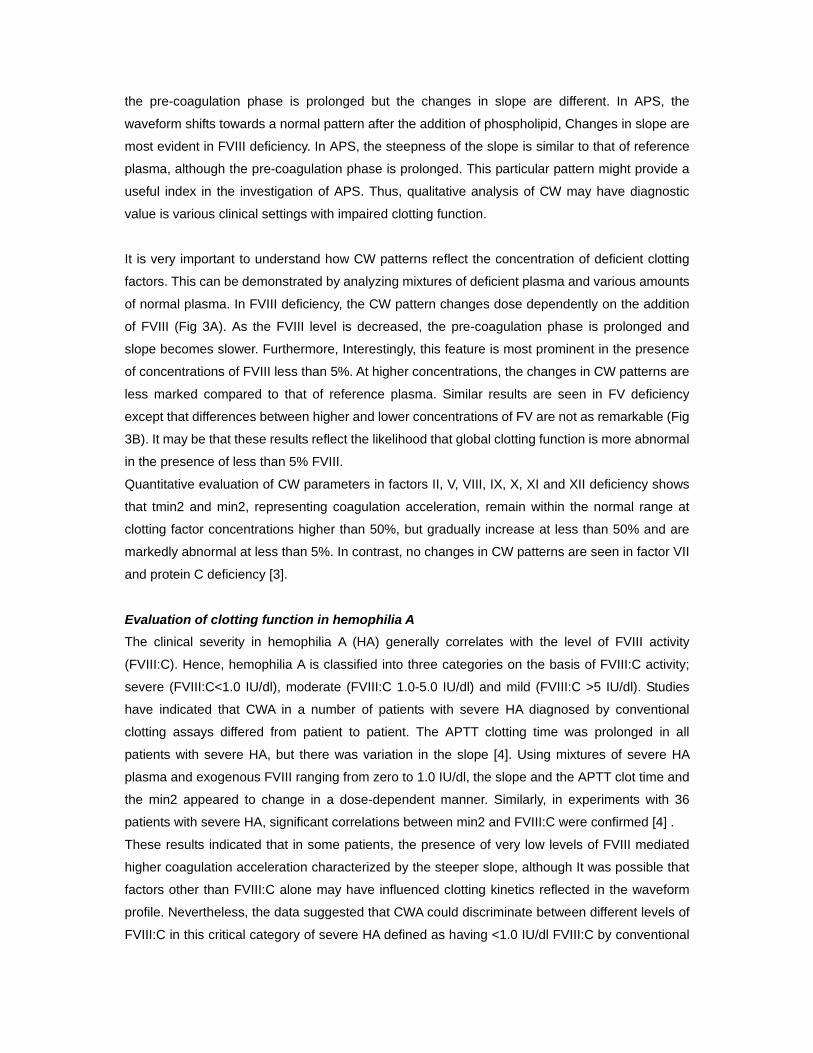
Figure 2. Examples of normal and variant APTT optical data.
The light blue colored WA shows typical results in patients with anti-phospholipid antibody
syndrome (APS). The yellow and green curves represent FV and FVIII-deficient plasma
respectively (George King INC. Overlnd Park, KS, USA). In these instances, the pre-coagulation
phase is markedly prolonged compared with that of the normal plasma, and slope 2, reflecting the
coagulation phase, is relatively gentle.

Figure 3 Dose-dependent waveform changes in plasma containing various concentrations
of FVIII (A) and FV (B).
Normal reference plasma was mixed with FVIII (A) or FV (B) deficient plasma to derive a series of
standard factor deficient plasmas with 100, 50, 10, 5, 1 IU/dl.
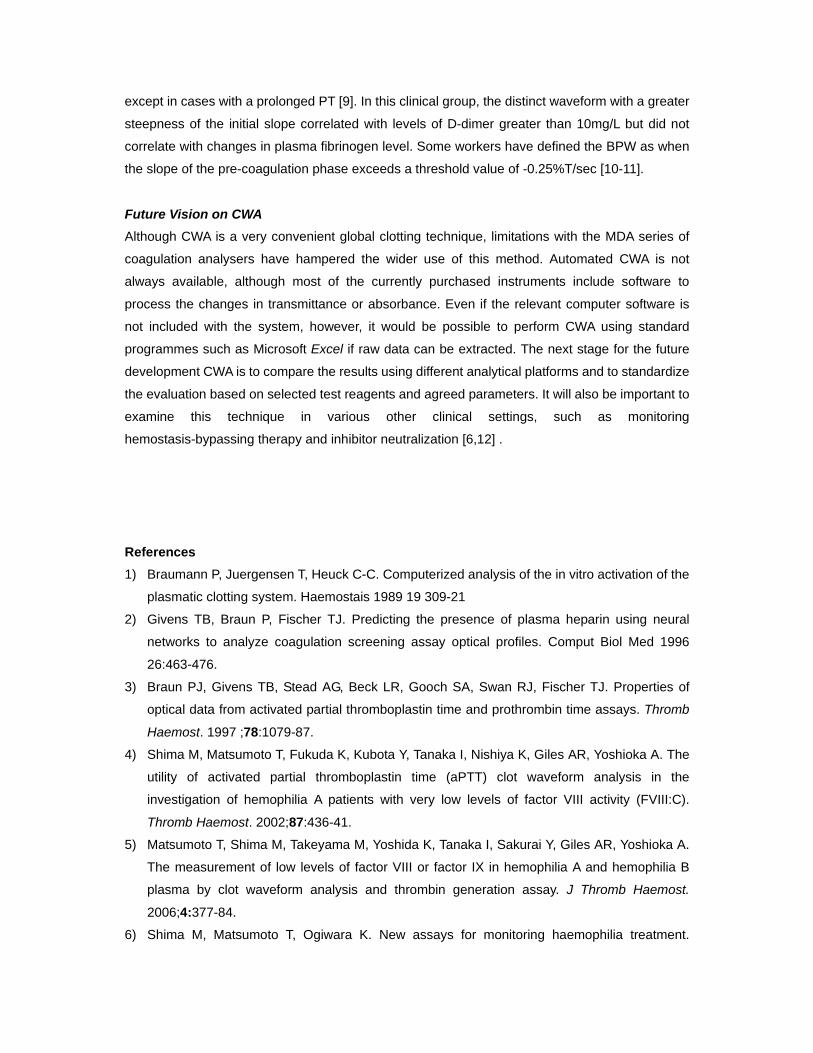
Figure 4 Significance in difference in CW parameters among hemophilia A.
Hemophilia A patients were classified into three categories; a severe group with FVIII less than
0.2 IU/dl, a group with FVIII of 0.2-1.0 IU/dl, a group with inhibitor. Three CW parameters, Min1
(maximal coagulation velocity), MIn2 (maximal coagulation acceleration) and clot time of each
patient group were tested and compared.
Figure 5. CWA parameters and clinical severity of hemophilia A.
The criteria for defining the clinically severe phenotype were spontaneous bleeding episode at the
age of < 1 year, the onset of joint or muscular bleeding before the age of three years old, or the
presence of severe bleeding such as intracranial bleeding or refractory oral bleeding.
Figure.6 Activated partial thromboplastin time (APTT) waveform patterns: (A) normal, (B)
biphasic. Dashed lines denote transmittance level at 18 s (TL18) as the quantitative index (In (A)
TL18=100 and in (B) TL18=63)

Figue 1
A B
C
D E
|Min2|
↑↓
Second Derivative, d2T/dt2
First Derivative, dT/dt
Transmittance (T)
time(t)
max2

Figure 2
0
20
40
60
80
100
120
0 50 100 150 200 250
TR(%
)
Time(sec)
NP
FVIII def.
FV def.
APS

0
20
40
60
80
100
120
0 50 100 150 200 250
TR(%
)
Time(sec)
FVIII 0
VIII 1
VIII 5
VIII 10
VIII 50
NP 100%
(A)
0
20
40
60
80
100
120
0 50 100 150 200 250
TR(%
)
Time(sec)
FV 0
V 1
V 5
V 10
V 50
NP 100%
(B)
Figure 3

0
0.5
1
1.5
2
2.5
0.2‐1.0 severe(<0.2%) inhibitor
|min 1|
|min 1|
0
50
100
150
200
0.2‐1.0 severe(<0.2%) inhibitorclot time(sec)
Clot time
0
0.05
0.1
0.15
0.2
0.25
0.2‐1.0 severe(<0.2%) inhibitor
|min 2|
|min 2|
p<0.01 p<0.01
p<0.01 p<0.01 p<0.01 p<0.01
Figure 4

Figure 5
0
50
100
150
Severe non‐severe
Clot time(sec)
0
0.5
1
1.5
2
2.5
3
Severe non‐severe
|min 1|
p<0.05
0
0.05
0.1
0.15
0.2
Severe non‐severe
|min 2|
0
0.05
0.1
0.15
0.2
Severe non‐severe
max 2
p<0.05
p<0.05 p<0.05

Figure 6