Embed Size (px)
Citation preview

http://www.aegern.udl.cat/ca/recerca/papers.htmlWorking papersNew trends in accounting and management
ISSN 2013-4916Número 3/2010
Measuring Service Quality in Sport ManagementAn Application of the SERVQUAL Scale
Eduard Cristóbal FransiUniversity of Lleida
María Jesús Gómez AdillónUniversity of Lleida
Ann ThorssonRovira i Virgili University
Natalia Daries Ramon Open University of Catalunya
Working papers “new trends in accounting and management”
Comité Editorial
José Luís Gallizo Larraz (Director)Departament AEGERNUniversitat de LleidaOriol Amat i SalasDepartament d’Economia i EmpresaUniversitat Pompeu FabraLeonor Fernandes FerreiraFaculdade de EconomiaUniversidade Nova de Lisboa (PT)Stuart McLeayDivision of Financial StudiesBangor University (UK)Ricard Monclús GuitartDepartament de Gestió d’EmpresesUniversitat Rovira i VirgiliJoaquim Rabaseda TarresDepartament d’EmpresaUniversitat de GironaRamon Saladrigues SoléDepartament AEGERNUniversitat de LleidaAna M. Vendrell Vilanova (Coordinadora)Departament AEGERNUniversitat de Lleida
objetivos
La colección pretende ser un instrumento de difusión de la investigación actual, realizada dentro del ámbito de Administración de Empresas, por los miembros de las Universidades coparticipantes, así como de los investigadores visitantes de las mismas, que todavía no haya sido publicada en una revista o en un libro. Con su publicación se pretende dar a conocer el estado actual de la investigación para que sea discutida y mejorada a partir de las sugerencias recibidas.
http://www.aegern.udl.cat/ca/recerca/papers.html
Working papers 3.indd 2 31/03/2010 12:36:11

Working papersNew trends in accounting and management
Measuring Service Quality in Sport Management: an Application of the SERVQUAL Scale
Eduard Cristóbal FransiUniversity of Lleida
María Jesús Gómez AdillónUniversity of Lleida
Ann ThorssonRovira i Virgili [email protected]
Natalia Daries Ramon Open University of Catalunya
ISSN 2013-4916Número 3/2010
Working papers 3.indd 3 12/04/2010 12:35:46

DL: L-427-2009ISSN: 2013-4916
Disseny de coberta: cat & casMaquetació: Edicions i Publicacions de la UdL© Edicions de la Universitat de Lleida, 2010© AEGERN (UdL) c/ Jaume II, 73 (25001 Lleida) Tf. 973 70 32 06 / Fax: 973 70 33 43 e-mail: [email protected]
Working papers 3.indd 4 31/03/2010 12:36:11
Working papers “neW trends in accounting and management” Wp 3/2010 5
MEasuring sErviCE Quality in sport ManagEMEnt: an appliCation of thE sErvQual sCalE
abstract
The aim of this study is to provide an instrument for measuring service quality in sports en-terprises from the point of view of the customers. For this purpose we intend to elaborate an enquiry starting out from a more general scale called SERVIQUAL.
We have limited our research project to sports enterprises where the customer participates actively, i.e., we have excluded sports clubs and other organizations which offer sport as en-tertainment. Our choice is mainly due to the fact that few studies have been carried out in this area and that sports has been earning an increasing amount of adepts during the last decades in Spain. The DELPHI method has been applied with the collaboration of a panel of experts in order to evaluate the viability and adequacy of the modified SERVQUAL scale.
Key words
Service Quality, Sports Marketing, SERVQUAL scale, DELPHI method.
Working papers 3.indd 5 31/03/2010 12:36:11

Working papers “neW trends in accounting and management” Wp 3/20106
1. introDuCtion
Today the importance of quality is generally recognized in all sectors of our modern society. Consequently, quality also has considerable influence on the economy of all kinds of business enterprises, since it improves the production of goods and brings competitiveness at the same time as it motivates human resources and ensures an increasing market share.
The quality of a particular product is easy to evaluate in terms of resistance, utility, speed, effectiveness, design, etc., but this is not the case when we attempt to determine the character-istics of a service. Today, the increasing predominance of the service industry, in production as well as in employment, has brought a need for an instrument which measures the quality of these services. It should be taken into account that the service sector accounts for more than 66.44% of the GDP and employs more than 98 million people in the European Community, according to EUROSTAT (2009) 1.
2. oBJECtivEs
In recent decades, the Spanish people have increasingly incorporated some kind of indivi-dual or corporative sport into their leisure activities for reasons of enjoyment and health. Nowadays, over 33% of the Spanish people practise sports (CIS, Spain, 2005). Consequently, it has become necessary to create systems which measure the degree of satisfaction the custo-mers perceive from the enterprises and organizations which render this kind of service.
The present paper intends to analyse of the instrument SERVQUAL, in order to establish its usefulness as a means of measuring the quality of the services given by enterprises related to sports. As the concept of sports enterprise includes a great number of heterogeneous organi-zations which cannot be studied in full by the present research, we have decided to concen-trate on the services provided by institutions where the customer participates actively: that is, gyms, swimming-pools, bowling halls, tennis or squash clubs, riding schools, etc.
3. MarKEting in sports EntErprisEs
Marketing in sports enterprises is a specific adaptation of the traditional concept of marketing, which can be defined as those activities designed to identify the consumers’ necessities on the one hand and the shortcomings of the “product sport” on the other, through processes of
1. Documento disponible en http://ec.europa.eu/.
Working papers 3.indd 6 31/03/2010 12:36:11
Working papers “neW trends in accounting and management” Wp 3/2010 7
interchange. It is a field of study that has collected numerous works in recent times (Triadó, 1996; Beech and Chadwick, 2006; Parks, et al. 2007; Mullin et al. 2007). There are two main types of marketing:
• Marketing of products and services directly to the consumers.• Marketing of other consumer goods or services through sponsorships.
As mentioned above, we will limit our research to those enterprises which offer their custo-mers active participation. In spite of their reduced size in an atomized sector, they are organi-zed and structured units that function as real enterprises and they make more or less important investments in order to create and sell their products with the greatest possible profits. To reach their objectives, they need to draw up a marketing strategy (see P. Kotler et al. 2000): this process consists in analyzing the opportunities on the market and choosing a position, plans of action and a control system which allow the enterprises to fulfil their commitments.
In this type of company, the market strategies applied can be observed at two levels:
• The search for a unique position in the sports activities market by producing an innovative and high quality sports service.
• The search for different positions versus the competitors by offering additional values.
4. thE ConstruCt “sErviCE Quality” anD its assEssMEnt
Service quality has been defined in many ways. Probably, the most accepted and used defini-tions is Zeithaml one (1988, p.3): “Consumer opinion about the excellence or superiority of a product or service” or Bitner and Hubber (1994, p. 7): “Global consumer impression about the relative superiority or inferiority of an organization and its services”. That is, it is understood that the perceived quality is a consumer attitude toward service, a subjective assessment of their level of excellence.
The inherent characteristics of services are: intangibility, heterogeneity and impossibility of separating the production and the act of consumption. These factors make the quality offe-red by the company at the moment of rendering the service the basic element which brings differential profits. It is precisely its heterogeneous character which makes it difficult to stan-dardize, assess and monitor the service rendered. (Zeithaml, Parasuraman and Berry, 1985).
The nature of the services offered by sports enterprises implies a continuous contact or in-teraction between the client and the employees. During these encounters —“the moment of truth”— (Normann, 1984), value is created. If these interactions are not carried out properly, the customer’s perception of quality will be negatively affected.
Working papers 3.indd 7 31/03/2010 12:36:12
Working papers “neW trends in accounting and management” Wp 3/20108
Quality has been focused on from various points of view. At present three different appro-aches can be distinguished:
1. The first one is the pattern of industrial quality, postulated by Juran (1990), Deming (1989), Garvin (1988) and Berry (1990), among others. These authors state that the function of quality is to guarantee the quality of the products launched on the market through methods of strategic planning, the establishment of objectives and the mobilization of the entire organization, making all its members responsible for the success of the enterprise.
The second and third approaches concentrate on the management of the services and are based on the clients’ perceptions. Consequently, enterprises must know their customers’ expecta-tions in order to be able to design a service of desirable quality.
2. The “Image Model” was created by Grönroos (1988, 1994) and relates quality to the cor-porative image, since it influences the client’s expectations of the service. The conceptual model formulated presents the total perceived quality as the combination of three factors: the technical dimension of the result or the technical quality, the functional dimension of the processes and the corporative image.
3. The “Deficiencies or Discrepancies Model” was created by Parasuraman, Berry and Zeithaml (1983, 1991, 1993); Parasuraman, Zeithaml and Berry (1985, 1988); Zeithaml, Berry and Parasuraman (1988) and Zeithaml, Parasuraman and Berry (1985, 1993). This model attempts to analyze the causes and circumstances which produce deficiencies in the rendering of the services. For these authors, the difference between the expected and the perceived service is the result of four gaps in the internal functioning of the enterprise as a direct consequence of the ignorance of the customers’ necessities and expectations.
The authors of the Deficiencies or Discrepancies model developed an instrument to measure the clients’ expectations and perceptions of the service offered: the SERVQUAL instrument. This scale consists of 22 pairs of questions divided into two sections, the first one for expec-tations and the second one for perceptions. The expectation section focuses on the client’s expectation for a generic category of services; the perception sector measures the customer’s evaluation of one enterprise in particular. Both the expectations and the perceptions are mea-sured on a 7-point Likert scale (from 1: strongly disagreeing to 7: strongly agreeing). The score of the quality of the service rendered consists of the sum of the differences (perceptions minus expectations) between the items.
Working papers 3.indd 8 31/03/2010 12:36:12
Working papers “neW trends in accounting and management” Wp 3/2010 9
5. CritiCisM of sErvQual
Although several authors have expressed their criticism of SERVQUAL, today it is still the main benchmark in measuring service quality. The main criticisms are of whether or not ex-pectations should be taken into account.
Thus Cronin and Taylor (1992, 1994) and Babakus and Boller (1992) direct their criticism towards the taking into account of the client’s expectations during the process of measuring quality. As an alternative they propose the SERVPERF scale, which consists of the same items as the SERVQUAL scale, but does not include the expectations. The core concept is the client’s satisfaction.
On the other hand, Teas (1993) points out, as the authors of SERVQUAL also admit, that the SERVQUAL model that contrasts perceptions and expectations may be problematic under certain conditions (Parasuraman, Zeithaml and Berry, 1994).
The three weak aspects that Teas (1993) mentions as basic and which, in his opinion, cast doubt on the validity of the SERVQUAL model are: a) problems of concept and definition of expectations, b) theoretical justification as a component of the expectable perception fra-mework, c) the validity of this type of measuring procedure.
6. sport ManagEMEnt anD sErviCE Quality
There is a lot of research about the measurement of perceived quality in sport services. A review of these studies can be found in Ko and Pastore (2004), Barry et al. (2005), Tsitskari et al. (2006), Ko et al. (2008), Martínez and Martínez (2009), or Calabuig, et al. (2008). These last authors includes most of the contributions have been made in the Spanish context. All these studies have in common the identification of dimensions or quality attributes, which are evaluated based on the perceptions of individuals in relation to the received service.
The study of Ko and Pastore (2004, 2005) is of particular relevance. This work adopt the hierarchical conception of Dabholkar et al. (1996) and Brady and Cronin (2001) for mea-suring perceived quality and make an exhaustive review of the literature on various areas of the sports industry that have been investigated. Ko and Pastore (2004, 2005) justify the dimensions and subdimensions of its model after studying the literature on the sports industry and service quality, identifying each construct in previous literature, and developing a model composed of four dimensions (program quality, interaction quality, quality of results, physi-cal environment quality), which are broken down into several subdomains. This model was refined following a qualitative phase, through a panel of experts and a pretest, culminating
Working papers 3.indd 9 31/03/2010 12:36:12
Working papers “neW trends in accounting and management” Wp 3/201010
in a final questionnaire of 49 items that defined the 11 subdimensions proposals. The authors tested their instrument through structural equation models.
We can find differences in the quality dimensions or attributes identified in different studies of sports services. Thus different measuring instruments are using depending on the type of service. For example, there are differences between the measurements of quality of physical activity programs (Morales et al., 2005) or quality of water services (Calabuig et al., 2008). However, there are also similarities in areas such as tangible items or physical environment (Calabuig et al., 2008, Ko et al., 2008, Morales et al., 2005) or personal interaction (Mañas et al., 2008, Ko and Pastore, 2005; Morales, et al., 2005). The service quality literature has often not included in its definition of quality concepts such as price, satisfaction, corporate image, or trust, as these concepts relate to the literature on perceived value, satisfaction, image and rela-tionship marketing respectively. For example, Dabholkar et al. (1996) and Brady and Cronin (2001) explicitly indicate that the price should not be included in models of perceived quality.
In the field of sports services can also be seen this way of proceeding. Most models are based on modifications or adaptations of scales proposed in the general literature, such SERVQUAL. In addition, it also tends to distinguish the quality of satisfaction, being a common practice done to analyze what size or quality attributes greater influence on consumer satisfaction of sports services (Mañas et al., 2008).
It is important to stand out one work that has resulted a measured tool of sports services qua-lity perceived in Korea, the QUESC (Kim and Kim, 1995, p.211). The authors justify their decision to develop a new measuring scale, by the vagueness of SERVQUAL of Parasuraman et al. (1988) for determining the dimensions of service. They say with this instrument the dimensions «depend on the category service under investigation. The dimensions obtained by the QUESC are: environment, employee attitudes, reliability, information, scheduling, perso-nal consideration, price, exclusivity, privacy, convenience, stimulation and social opportunity. According to the authors, of the twelve dimensions found, only seven shows correspondence with SERVQUAL.
7. thE sElECtion CritEria
In order to carry out the present research, we have studied the evaluation instruments of mea-suring quality described in the existing literature. After careful examination, we decided to use the SERVQUAL instrument. There were two main reasons for our choice. Firstly, it measures the customers’ expectations as well as their perceptions, which gives us a wider conception of their satisfaction. Secondly, it has been used for measuring quality in a wide variety of
Working papers 3.indd 10 31/03/2010 12:36:12
Working papers “neW trends in accounting and management” Wp 3/2010 11
sectors —to our knowledge, none of them related to sports— providing us with experiences and documentation that we can use for purposes of comparison.
In Spain, previous studies have been carried out in many different fields and sectors, some of which are stated below: the tourism sector (Bigné, Martinez, Miquel and Belloch, 1996); the railway network (Bigné, Sánchez, Moliner and Vallet, 1996); financial compa-nies, (Fernández-Barcala, 2000); the ceramic sector (Camisón and Bou, 2000); education (Camisón, Gil and Roca, 1999); the health sector (Bigné, Moliner and Sánchez, 1997); the public sector (Fernández, Junquera and Muñiz, 1997).
The fact that no research had been carried out through the SERVQUAL system on sports enterprises encouraged us to do research in this field. With this purpose, we made a detailed analysis in order to adapt the 22 general statements of the original scale to the peculiarities of the sports sector.
8. MEthoDology
In order to analyze the viability of the SERVQUAL scale, and after evaluating several al-ternatives, we decided to use a technique called DELPHI. According to Dalkey, Brown and Cochran (1972), the DELPHI method has considerable advantages over other subjective me-thods of prediction: the lack of influence of dominant individuals, the absence of semantic noise and the lack of pressure on the group to conform. Pulido (1989) points out that this method has a special polling technique for experts and states the following characteristics:
• Subjective selection of the participants• Anonymous replies• Controlled feedback• Questions with quantitative replies • Statistical group replies
The DELPHI method consists in questioning a panel of experts through a sequence of ques-tionnaires, in such a way that the replies to one questionnaire are used to design the following questionnaire. It starts by asking each expert for an opinion about a particular phenomenon. Once the first answers have been obtained, a document synthesizing the coincidences and discrepancies is drawn up.
In the field of sport this method of research has previously used. In the international level there is the work of Lam, Zhang and Jensen (2005). These authors designed a questionnaire of service quality in fitness centers where experts will reduce an initial questionnaire of 56 items
Working papers 3.indd 11 31/03/2010 12:36:12
Working papers “neW trends in accounting and management” Wp 3/201012
to 46, which is then tested as a pilot questionnaire. Nationally, we find the work of Calabuig and Crespo (2009) which is used to develop an instrument measuring the perceived quality of the spectators of sports events.
Each group on the panel, at each stage of the process, receives a new questionnaire which in-cludes the values and suggestions formulated by the group members. The process is continued until the main differences have been smoothened out and a sufficient consensus is reached among all the participants.
The objective is to achieve a distribution of the answers which is the least disperse possible, so that in each phase the experts can compare their own replies with those of the majority represented by the median and thus reduce the interquartile range (see Menguzzato and Renau 1991).
The panel of experts consisted of 14 members, all of whom satisfied the following require-ments:
• Academic or professional experience in sports activities • Interest and awareness of the sports service as well as the problems involved • Knowledge of service quality
The initial questionnaire was based on the Spanish translation of the SERVQUAL scale by Zeithaml, Parasuraman and Berry (1993). The questionnaire, in the present study, was sent out to the participants with an introductory letter and instructions explaining the procedures to follow. It was made clear that a sports company was not being judged in this case, but the degree of suitability of the 22 statements on the questionnaire.
In the questionnaire the participants were asked to mark on a scale of 1 - 5 to what extent they agreed or disagreed with the 22 statements assessing the services rendered in sports enterprises.
The members of the panel were informed about the possibility of modifying the statements. After the receipt of each packet of answers, the questionnaire was modified and revised taking the participants’ suggestions into account. Three different questionnaires were sent out at 10-day intervals. In each phase, a statistic analysis was carried out consisting in calculating the median and the interquartile range. When the dispersion in the replies was small, the process was ended.
Working papers 3.indd 12 31/03/2010 12:36:12

Working papers “neW trends in accounting and management” Wp 3/2010 13
table 1. results of the first version of the questionnaire
statements Median 1st quartile
3rd quartile
interquart. range
1. The enterprise has up-to-date equipment 4 3.75 5 1.25
2. The physical facilities are visually appealing 4 3.75 5 1.25
3. Employees are well dressed and appear neat 4 3.75 5 1.25
4. The materials related to the service (pamphlets, timetable, cards, etc.) are visually appealing
4 3 3 1
5. When they promise to do something by a cer-tain time, they do so
4 3.75 5 1.25
6. When the customer has a problem, they show sincere interest in solving it
4.5 4 5 1
7. They carry out the service satisfactorily the first time
4 4 5 1
8. They conclude the service within the time promised
3.5 3 5 2
9. They insist on keeping the records free from errors
3.5 2 4.25 2.25
10. Employees inform the clients about when the service will conclude
4 3 4.25 1.25
11. Employees offer their clients a prompt service 4.5 4 5 1
12. Employees are always ready to help the clients 4.5 3 5 2
13. Employees are never too busy to answer the clients’ questions
3.5 3 5 2
14. Employees’ behaviour convey confidence 5 4 5 1
15. Clients feel confident in their transactions with the organization
4 3 5 2
16. Employees are always friendly with the clients 5 3.75 5 1.25
17. Employees have enough knowledge to answer the clients’ questions
5 4 5 1
18. Employees assist the clients individually 4 3 5 2
19. They have operating hours convenient to all their clients
4 3 5 2
Working papers 3.indd 13 31/03/2010 12:36:12
Working papers “neW trends in accounting and management” Wp 3/201014
20. Employees offer personalized attention 4 2.75 5 2.25
21. They have their customers’ best at heart 4 2.75 5 2.25
22. They understand the specific interests of their clients
4 4 5 1
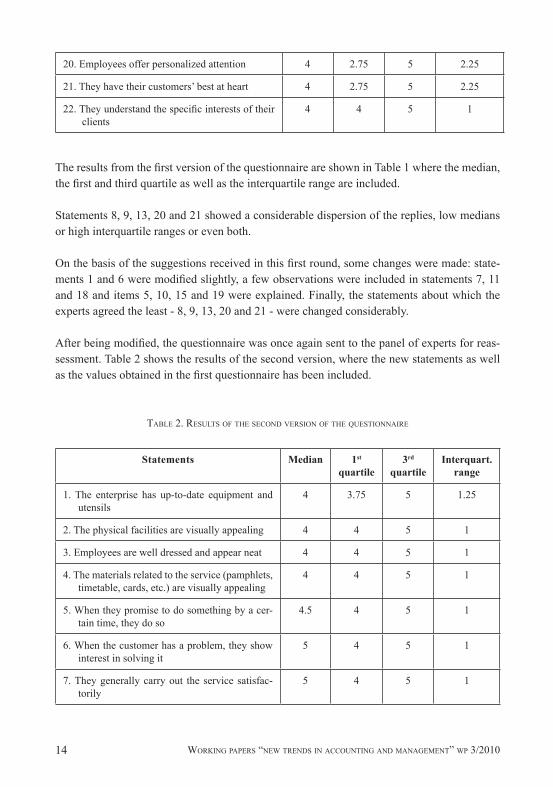
The results from the first version of the questionnaire are shown in Table 1 where the median, the first and third quartile as well as the interquartile range are included.
Statements 8, 9, 13, 20 and 21 showed a considerable dispersion of the replies, low medians or high interquartile ranges or even both.
On the basis of the suggestions received in this first round, some changes were made: state-ments 1 and 6 were modified slightly, a few observations were included in statements 7, 11 and 18 and items 5, 10, 15 and 19 were explained. Finally, the statements about which the experts agreed the least - 8, 9, 13, 20 and 21 - were changed considerably.
After being modified, the questionnaire was once again sent to the panel of experts for reas-sessment. Table 2 shows the results of the second version, where the new statements as well as the values obtained in the first questionnaire has been included.
table 2. results of the second version of the questionnaire
statements Median 1st quartile
3rd quartile
interquart. range
1. The enterprise has up-to-date equipment and utensils
4 3.75 5 1.25
2. The physical facilities are visually appealing 4 4 5 1
3. Employees are well dressed and appear neat 4 4 5 1
4. The materials related to the service (pamphlets, timetable, cards, etc.) are visually appealing
4 4 5 1
5. When they promise to do something by a cer-tain time, they do so
4.5 4 5 1
6. When the customer has a problem, they show interest in solving it
5 4 5 1
7. They generally carry out the service satisfac-torily
5 4 5 1
Working papers 3.indd 14 31/03/2010 12:36:13
Working papers “neW trends in accounting and management” Wp 3/2010 15
8. They render the service within the time promised 4.5 3 5 2
9. They make sure no errors are made on the records
3.5 3 5 2
10. Employees inform in due time and exhaus-tively about the different services
4.5 4 5 1
11. Employees offer their clients a prompt and ef-ficient service
4.5 3.75 5 1.25
12. Employees are always ready to help the clients 4.5 3.75 5 1.25
13. Employees spend the necessary time with each client to respond to their requests with-out hurries
4.5 3 5 2
14. Employees’ behaviour convey confidence 4.5 4 5 1
15. Clients feel confidence in the functioning of the organization
4 4 5 1
16. Employees are always friendly with the clients 5 4 5 1
17. Employees have enough knowledge to an-swer the clients’ questions
5 4 5 1
18. Employees check the clients’ evolution indi-vidually
4.5 3 5 2
19. They have flexible operating hours conven-ient to different types of clients
4 3.75 5 1.25
20. They offer their clients personalized informa-tion
5 3.75 5 1.25
21. They have the different types of customers’ best at heart
4 3.75 5 1.25
22. They understand the specific interests of their clients
4 4 5 1
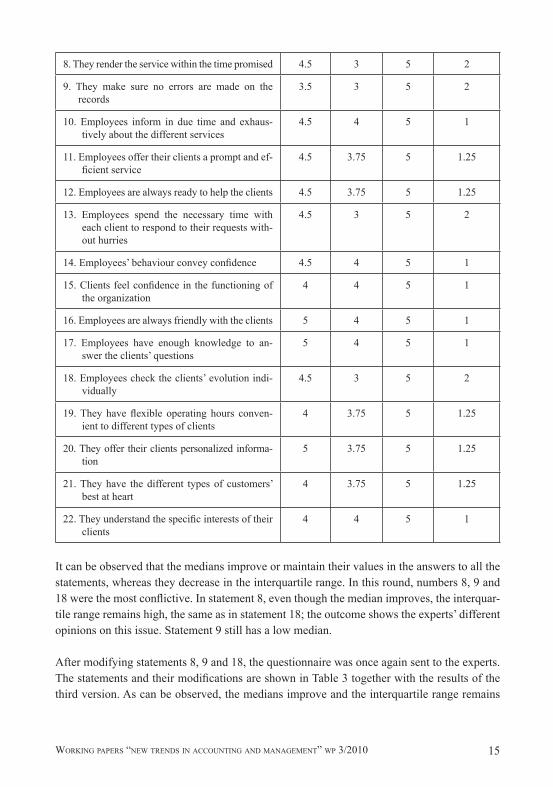
It can be observed that the medians improve or maintain their values in the answers to all the statements, whereas they decrease in the interquartile range. In this round, numbers 8, 9 and 18 were the most conflictive. In statement 8, even though the median improves, the interquar-tile range remains high, the same as in statement 18; the outcome shows the experts’ different opinions on this issue. Statement 9 still has a low median.
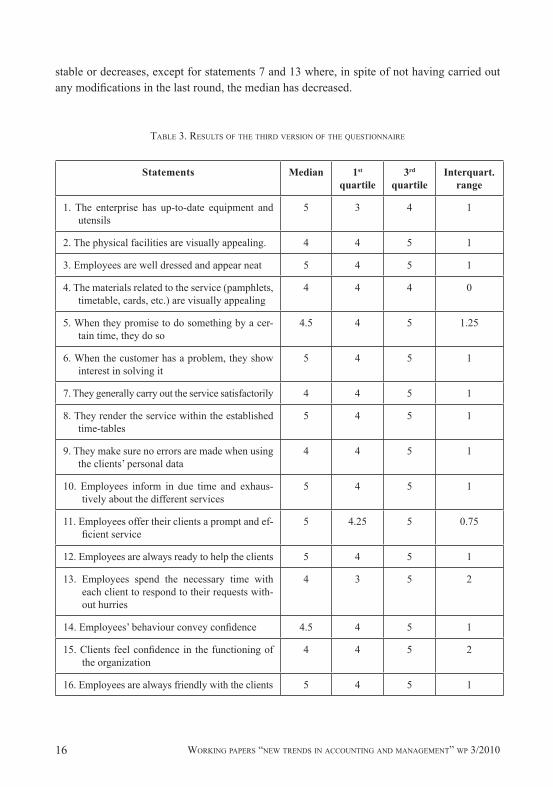
After modifying statements 8, 9 and 18, the questionnaire was once again sent to the experts. The statements and their modifications are shown in Table 3 together with the results of the third version. As can be observed, the medians improve and the interquartile range remains
Working papers 3.indd 15 31/03/2010 12:36:13
Working papers “neW trends in accounting and management” Wp 3/201016
stable or decreases, except for statements 7 and 13 where, in spite of not having carried out any modifications in the last round, the median has decreased.
table 3. results of the third version of the questionnaire
statements Median 1st quartile
3rd quartile
interquart. range
1. The enterprise has up-to-date equipment and utensils
5 3 4 1
2. The physical facilities are visually appealing. 4 4 5 1
3. Employees are well dressed and appear neat 5 4 5 1
4. The materials related to the service (pamphlets, timetable, cards, etc.) are visually appealing
4 4 4 0
5. When they promise to do something by a cer-tain time, they do so
4.5 4 5 1.25
6. When the customer has a problem, they show interest in solving it
5 4 5 1
7. They generally carry out the service satisfactorily 4 4 5 1
8. They render the service within the established time-tables
5 4 5 1
9. They make sure no errors are made when using the clients’ personal data
4 4 5 1
10. Employees inform in due time and exhaus-tively about the different services
5 4 5 1
11. Employees offer their clients a prompt and ef-ficient service
5 4.25 5 0.75
12. Employees are always ready to help the clients 5 4 5 1
13. Employees spend the necessary time with each client to respond to their requests with-out hurries
4 3 5 2
14. Employees’ behaviour convey confidence 4.5 4 5 1
15. Clients feel confidence in the functioning of the organization
4 4 5 2
16. Employees are always friendly with the clients 5 4 5 1
Working papers 3.indd 16 31/03/2010 12:36:13

Working papers “neW trends in accounting and management” Wp 3/2010 17
17. Employees have enough knowledge to answer the clients’ questions
5 4 5 1
18. Employees check the clients’ eVol.ution indi-vidually
4 3 4.75 1.75
19. They have flexible operating hours conven-ient to different types of clients
5 3.75 5 1.25
20. They offer their clients personalized informa-tion
5 3.75 5 1.25
21. They have the different types of customers’ best at heart
4.5 4 5 1
22. They understand the specific interests of their clients
4.5 4 5 1
9. ConClusions
Having examined the experts’ responses to the questionnaires and after making an exhaustive analysis of the generic bibliography about service quality and specifically about the service rendered by sports enterprises, we chose the SERVQUAL scale as the appropriate instrument for assessing the quality perceived by the consumers of this type of services. We would like to highlight the following points about the process followed and the DELPHI method:
• The DELPHI method proved to be appropriate and innovating for assessing the perceived quality of the service rendered by sports entities
• Most of the experts evaluated the statements on the scale positively. In the last round, all the statements exceeded 4 as the median, and the interquartile range was between 0 and 2, which shows that the statements have little dispersion; consequently there is a high level of consensus
• After the appropriate modifications, determinations, explanations and changes had been carried out, the usefulness of the scale for the sports sector improved
Nevertheless, the fact that SERVQUAL has not previously been used to asses the perceived quality in this type of enterprises prevented us from making an empirical study on a large scale. In the same line of research, we deem it necessary to apply this instrument to a reduced number of sports customers in order to further improve and adapt it to the sports sector, before distributing it to sports enterprises in general.
We recognize that this is a preliminary and exploratory work in order to define a first version of a scale measuring the perceived quality of service provided by a sports organization. In the
Working papers 3.indd 17 31/03/2010 12:36:13
Working papers “neW trends in accounting and management” Wp 3/201018
future, this scale will be applied to users in this type of service, and to be tested to determine its validity and reliability.
We firmly believe that the present research is a step forward in determining the appropriate scale for studying service quality in sports enterprises, and we are convinced that it will serve as a basis for further research in this field.
Working papers 3.indd 18 31/03/2010 12:36:13

Working papers “neW trends in accounting and management” Wp 3/2010 19
BiBliography
barry, d. et al. (2005). “Service improvement in a sports environment: a study of spectator attendance”, Managing Service Quality, vol. 15, Iss. 5. pp. 470-485.
beech, J. and chadWick s. (2006). The marketing of Sport, ed. Pearson. P. 592.berry, l. (1980). “Services Marketing is Different”, Business, May-June.berry, l. l., bennett, d. r. and broWn, c. W. (1989). Calidad de servicio: una ventaja
estratégica para instituciones financieras, ed. Díaz de Santos, Madrid.berry l. l., Zeithaml, v. a. and parasunaman, a. (1990). “Five imperatives for Improving
Service Quality”, Sloan Management Review, pp. 29-38.bigné, J. e. et al. (1996). “La calidad de servicio en las agencias de viaje. Una adaptación de
la escala SERVQUAL”, Revista Europea de Dirección y Economía de la Empresa, vol. 5, Num. 2, pp. 7-18.
bigné, J. e., moliner, m. a. and sáncheZ, J. (1997). “Calidad y satisfacción en los servicios hospitalarios esenciales y periféricos”, Investigación y Marketing, num. 57. December. pp. 55-61.
bitner, m. J. and hubber, a. r. (1994). “Encounter satisfaction versus overall satisfaction versus quality”, in Rust, R. R. and Oliver, R. L. (Eds), Service Quality: New Directions in Theory and Practice, Sage Publications, Thousand Oaks, CA, pp. 311-29.
brady, m. k., and cronin, J. J. (2001). “Some new thoughts on conceptualizing perceived service quality: a hierarchical approach”, Journal of Marketing, 5, 34-49.
calabuig, f. and crespo J. (2009). “Uso del método Delphi para la elaboración de una medida de la calidad percibida de los espectadores de eventos deportivos”, retos. Nuevas tenden-cias en Educación Física, Deporte y Recreación, num. 15, (1º semester).
calabuig, f., quintanilla, i. and mundina, J. (2008). “La calidad percibida de los servicios deportivos: diferencias según instalación, género, edad y tipo de usuario en servicios náu-ticos”, Revista Internacional de Ciencias del Deporte, 10 (4), 25-43.
camisón, c. and bou, J. c. (2000). “Calidad percibida de la empresa: desarrollo y validación de un instrumento de medida”, Revista Europea de Dirección y Economía de la Empresa, vol. 9, num. 1, pp. 9-24.
camisón, c., gil edo, m. t. and roca, v. (1999). “Hacia modelos de calidad de servicio orientados al cliente en las universidades públicas: el caso de la Universitat Jaume I”, Investigaciones Europeas de Dirección y Economía de la Empresa, vol. 5, num. 2, pp. 69-92.
carman, J. m. (1990). “Consumer Perceptions of Service Quality: An Assessment of the SERVQUAL dimensions”, Journal of Retailing, vol. 66, num. 1 Spring.
cis (centro de investigaciones sociológicas) (2005). “Encuesta de hábitos deportivos de los españoles”. Documento disponible: http://www.cis.es/cis/.
cronin, J. and taylor, s. a. (1992). “Measuring Service Quality: A Reexamination and Extension”, Journal of Marketing, num. 56, July, pp. 55-68.
Working papers 3.indd 19 31/03/2010 12:36:14
Working papers “neW trends in accounting and management” Wp 3/201020
___. (1994). “SERVPERF versus SERVQUAL: Reconciling Performance-based and Perceptions minus Expectations Measurement of Service Quality”, Journal of Marketing, num. 58, January, pp. 125-131.
dabholkar, p. a., thorpe, d. i., and rentZ, J. o. (1996). “A measure of service quality for retail stores: scale development and validation”, Journal of the Academy of Marketing Science, 24 (1), 3-16.
fernándeZ, m. (2000). “Validación de SERVQUAL como instrumento de medida de la cali-dad del servicio bancario”, Revista Europea de Dirección y Economía de la Empresa, vol. 9, num. 2, pp. 57-70.
fernandeZ, m., Junquera, b. and muñiZ, m. (1997). “La valoración de la calidad en los servicios públicos: análisis de un caso”, Revista Europea de Dirección y Economía de la Empresa, vol. 6, num. 1, pp. 7-20.
gil saura, i. (1996). “La evaluación de la calidad de servicio percibida y las limitaciones de la herramienta SERVQUAL”, Revista Europea de Dirección y Economía de la Empresa, vol. 5, num. 2, pp. 19-31.
grönroos, ch. (1978). “A Service Oriented Approach to Marketing of Services”, European Journal of Marketing, 12, num. 8, pp. 588-601.
grönroos, c. (1994). Marketing y Gestión de Servicios, ed. Díaz de Santos, Madrid.hansen, h. and gauthier, r. (1992). “Marketing Objectives of Professional and University
Sport Organizations”, Journal of Sport Management, vol. 6, num. 2 May, pp. 27-37.kim, d. and kim, s. (1995). “QUESC: An instrument for assessing the service quality of sport
centres in Korea”, Journal of Sport Management, 9, 208-220.ko, y. J., durrant, s. m. and mangiantini, J. (2008). “Assessment of services provided to
NCAA Division I athletes: Development of a model and instrument”, Sport Management Review, 11 (2), 193-214.
ko, y. J. and pastore, d. l. (2004). “Current issues and conceptualizations of service in the recreational sport industry”, Sport Marketing Quarterly, 13 (3), 159-167.
___. 2005). “A hierarchical model of service quality for the recreational sport industry”, Sport Marketing Quarterly, 14 (2), 84-97.
kotler, p. et al. (2000). Dirección de Marketing, décima edición, Prentice Hall. Madrid.lam, e., Zhang, J. and Jensen, b. (2005). “Service quality assessment scale (SQAS): an in-
strument for evaluating service quality of health-fitness clubs”, Measurement in Physical Education and Exercise Science, 9 (2), 79-111.
loret, a. and bessy o. (1993). “Les stratégies marketing des centres de mise en forme”, Sport et Management, Dunot, Chapitre 13, pp. 235-247.
loret, a., michon, b. and ohl f. (1993). “Marketing et sociologie: analyse de la consomma-tion de produits sportifs”, Sport et Management, Dunot, Chapitre 12, pp. 208-233.
lovelock, ch. h. (1983). “Classifying Services to Gain Strategic Marketing Insights”, Journal of Marketing, num. 47, summer, pp. 9-20.
Working papers 3.indd 20 31/03/2010 12:36:14
Working papers “neW trends in accounting and management” Wp 3/2010 21
mañas, m. et al. (2008). “Los tangibles como predictores de la satisfacción del usuario: un estudio de campo en servicios deportivos”, Psicothema, 20 (2), 243-248.
martin, c. l. (1990). “The Employee/Customer Interface: An Empirical Investigation of Employee Behaviours and Customer Perceptions”, Journal of Sport Management, vol. 4, num. 2, January, pp. 1-20.
martíneZ, J. a. and martíneZ, l. (2009). “La calidad percibida en servicios deportivos; mapas conceptuales de marca”, Revista Internacional de Medicina y Ciencias de la Actividad Física y el Deporte, vol. 9 (35), pp. 232-253.
maWson, m. l. (1993). “Total Quality Management: Perspectives for Sport Managers”, Journal of Sport Management, vol. 7, num. 2, pp.101-106.
minquet, J. p. (1992). “Le produit sport”, Revue Française du Marketing, num. 138, pp. 27-35.
morales, v., hernándeZ, a. and blanco, a. (2005). “Evaluación de la calidad en los progra-mas de actividad física”, Psicothema, 17 (2), 292-298.
mullin, b. J., hardy, s. and sutton, W. a. (2007). Sport Marketing. Human Kinetics Publications, Illinois.
parasuraman, a., Zeithaml, v. and berry, l. (1985). “A Conceptual Model of Service Quality and its Implications for Future Research”, Journal of Marketing, vol. 49, num. 4, pp. 41-50.
___. (1988). “Servqual: a Multiple-item Scale for Measuring Consumer Perceptions of Services Quality”, Journal of Retailing, Vol. 64 Num. 1, pp. 12-40.
parasuraman, a., berry, l. and Zeithaml, v. a. (1991). “Refinement and Reassessment of the SERVQUAL Scale”, Journal of Retailing, vol. 67, num. 4, pp. 420-450.
___. (1991). “Understanding Customer Expectations of Service”, Sloan Management Review, num. 32, pp. 39-48.
___. (1994). “Reassessment of Expectations as a Comparison Standard in Measuring Service Quality: Implications for Further Research”, Journal of Marketing, num. 58, pp. 111-124.
parks J. b., quarterman J. and thibault l. (2007). Contemporary sport management, ed. Human Kinetics.
pulido, a. (1989). Predicción económica y empresarial, ed. Pirámide, Madrid.teas, r. k. (1994). “Expectations as a Comparison Standard in Measuring Service Quality:
An Assessment of a Reassessment”, Journal of Marketing, vol. 58, pp. 132-139.___. (1993). “Expectations, Performance Evaluation and Consumer’s Perception of Quality”,
Journal of Marketing 57, num. 4, October, pp. 18-34.triadó ivern, X. (1996). El Marketing en la gestión deportiva. GPE, Barcelona.tsitskari. e., tsiotras, d. and tsiotras, g. (2006). “Measuring service quality in sport serv-
ices”, Total Quality Management & Business Excellence, 17 (5), 623-631.Zeithaml, v. a. (1981). “How Consumer Evaluation Processes Differ Between Goods and
Services”, Marketing of Services, AMA, pp. 186-189.
Working papers 3.indd 21 31/03/2010 12:36:14

Working papers “neW trends in accounting and management” Wp 3/201022
___. (1988). “Consumer Perceptions of Price, Quality and Value: A Means-End Model and Syntheses of Evidence”, Journal of Marketing 52, July, pp. 2-22.
Zeithaml, v., berry, l. l. and parasuraman, a. (1996). “The Behavioural Consequences of Service Quality”, Journal of Marketing, vol. 60, pp. 31-46.
Zeithaml, v, parasuraman, a. and berry, l. (1985). “Problems and Strategies in Service Marketing”, Journal of Marketing, vol. 49, pp. 33-46.
___. (1993). Calidad Total en la Gestión de Servicios, ed. Díaz de Santos, Madrid.
Working papers 3.indd 22 31/03/2010 12:36:14
Working papers “neW trends in accounting and management” Wp 3/2010 23
norMas para la rEMisiÓn y prEsEntaCiÓn DE los traBaJos
normas para la remisión de los trabajos
1. Debe enviarse una copia del original, junto con un CD con el documento en Word, al Coordinador Editorial a la dirección postal o bien puede enviarse por correo electrónico:
Dirección postal para el envío de los trabajos:Working Papers “New trends in accounting and management”Ana Vendrell VilanovaCoordinador EditorialDepartamento de Administración de EmpresasFacultat de Dret i Economiac/ Jaime II, nº 7325001 Lleida (Campus Cappont)Tel: 973 70 32 22Fax: 973 70 33 43E-mail: [email protected]
En hoja a parte debe constar el nombre del autor/es junto a la institución a la cual perte-nece actualmente. Además, se debe facilitar la dirección de contacto postal, telefónica y electrónica del primer o, en su caso, único autor.Todos los trabajos recibidos serán evaluados por el comité o personas que éste nombre al efecto.
2. Por ser una publicación internacional se aceptan artículos en otros idiomas, preferente-mente en inglés, castellano o catalán.
3. El Comité Editorial podrá aceptar otro tipo de artículos como notas, comunicaciones, ponencias, resúmenes de contribuciones, reseñas bibliográficas, los cuales no deberán superar las 15 páginas.
4. Los trabajos remitidos tendrán revisión anónima.5. Se dará contestación por escrito sobre la evaluación del artículo para su aceptación, acep-
tación con sugerencias o rechazo. 6. Al enviar los trabajos para su evaluación, el(los) autor(es) acepta(n) igualmente que
transferirá(n) los derechos de autor a: Working Paper “New trends in accounting and management”, para su publicación en versión impresa i/o electrónica.
7. Se publicará un mínimo de un working paper anualmente.
Working papers 3.indd 23 31/03/2010 12:36:14
Working papers “neW trends in accounting and management” Wp 3/201024
normas de presentación y estilo de los trabajos
1. La extensión máxima de los trabajos será de 36 páginas, incluyendo en ellas los gráficos, las figuras, los cuadros, las tablas, las notas a pie de página, los apéndices o anexos y la bibliografía. En la primera página figurará el título, el nombre y afiliación del autor/es, un resumen de 200 palabras como máximo y varias palabras clave (de 4 a 6).
2. El resumen deberá estar en inglés y en el idioma original. Y deberá indicar la naturaleza del documento (si es un producto de investigación, una reflexión, o una revisión de un tema), el objetivo general del documento (lo que pretende el documento), la metodología(s) de investigación utilizada(s) y la principal conclusión o evidencia del documento. Asimismo, las palabras clave deben constar en inglés y en el idioma original.
3. Ha de utilizarse interlineado sencillo, letra Times New Roman de tamaño 12 y márgenes de 3 cm (superior, inferior, izquierda y derecha). Para las notas a pie de página: interlineado de 1 y letra Times New Roman de tamaño 9.
4. En la parte final del artículo se incluirá la bibliografía y demás fuentes utilizadas en orden alfabético por autor o, en su defecto, por título, respetando en lo demás las pautas para las referencias a pie de página.
5. Los epígrafes del artículo se estructurarán de la manera que se muestra a continuación, colocando los mismos a principio de la línea, sin sangrar en ningún caso el texto que vaya a continuación:1. EpÍgrafEs En lEtras MayÚsCulas1.1. subepígrafes en letras minúsculas negrita1.1.1. Apartados en letras cursivas o itálicas1.1.1.1. Subapartados en letras normales
6. Las tablas, cuadros, gráficos y figuras irán numeradas consecutivamente con caracteres arábigos, llevando un encabezamiento conciso, así como las notas al pie que expliquen los símbolos utilizados y las aclaraciones necesarias, haciendo referencia a ellas en el texto como tabla 1, cuadro 1, gráfico 1, figura 1.Las expresiones matemáticas se enumerarán en el margen derecho.
7. Las referencias de las citas se consignarán a pie de página y su enumeración será continua (no debe ser por capítulos).
8. Las citas bibliográficas incluidas en el texto del trabajo se presentarán de dos formas, dependiendo del contexto y de la redacción del párrafo en el que se incluyan:
a) Indicando entre paréntesis el nombre del autor/es, seguido del año y del número de página, por ejemplo: (Sala, 1946, p. 23) o (Stiglitz et al., 1986, pp. 25-35).
b) Indicando el nombre del autor y, entre paréntesis, el año, por ejemplo: Rodríguez (1956) o Ruíz y otros (1996) o Ruíz, Martín y Aldín (1976).
9. Las referencias bibliográficas se pondrán ordenadas alfabéticamente al final del trabajo, y cronológicamente en el caso de varios trabajos de un mismo autor. Se pondrán en cursiva el nombre de las revistas y el título de los libros. La puntuación y el orden se ajustarán a los siguientes modelos:
Working papers 3.indd 24 31/03/2010 12:36:14

Working papers “neW trends in accounting and management” Wp 3/2010 25
• Artículos en revistas:Berger, A. y Udell, G., (1992): “Some Evidence on the Empirical Significance of Credit Rationing”, Journal of Political Economy, vol. 100, (5), pp. 1047-1077.• Libros:Brealey, R. y Myers, S. (2003): Principios de Finanzas Corporativas, en McGraw-Hill (ed.), Madrid.• Capítulos de libros:Rymes, T.K. (1990): “On the Publicness of Fiat Money”, en A. Asimakopulos, R.D. Cains e C. Green [ed.]: Economic Theory, Welfare and the State, pp. 409-420. London: Macmillan.• Informes técnicos, comunicaciones y working papers:Ministerio de Industria y Energía (1992): Estadística minera de España, 1974-1991. Madrid: Ministerio de Industria y Energía.Aybar, C. et al., (2000): “Enfoques Emergentes en Torno a la Estructura de Capital: El Caso de la Pyme”, VIII Foro De Finanzas. Asociación Española de Finanzas (AEFIN). Madrid, pp. 1-29.Narula, R.; Hagedoorn, J. (1997): Globalization, Organisational Modes and the Growth of International Strategic Alliances. (Working Paper 97-017). Maastricht: Maastricht Economics Research Institute on Innovation and Technology (MERIT).
Working papers 3.indd 25 31/03/2010 12:36:14

http://www.aegern.udl.cat/ca/recerca/papers.htmlWorking papersNew trends in accounting and management
ISSN 2013-4916Número 3/2010
Measuring Service Quality in Sport ManagementAn Application of the SERVQUAL Scale
Eduard Cristóbal FransiUniversity of Lleida
María Jesús Gómez AdillónUniversity of Lleida
Ann ThorssonRovira i Virgili University
Natalia Daries Ramon Open University of Catalunya