Embed Size (px)
Citation preview

Correspondence to: Noor Houqe
Email: [email protected]
Centre for Accounting, Governance and Taxation Research
School of Accounting and Commercial Law
Victoria University of Wellington
PO Box 600, Wellington, NEW ZEALAND
Tel: + 64 4 463 5078
Fax: + 64 4 463 5076
Website: http://www.victoria.ac.nz/sacl/cagtr/
WHAT IS THE ECONOMIC VALUE OF THE EXTRACTIVE INDUSTRIES TRANSPARENCY INITIATIVE (EITI)
INFORMATION DISCLOSURE?
WORKING PAPER SERIES Working Paper No. 110
December 2016
Olayinka Moses, Noor Houqe, Tony van Zijl

1
What is the Economic Value of the Extractive Industries
Transparency Initiative (EITI) Information Disclosure?
1Olayinka Moses
School of Accounting and Commercial Law,
Victoria Business School, PO Box 600
Victoria University of Wellington, New Zealand
Noor Houqe
School of Accounting and Commercial Law,
Victoria Business School, PO Box 600
Victoria University of Wellington, New Zealand
Tony van Zijl
School of Accounting and Commercial Law,
Victoria Business School, PO Box 600
Victoria University of Wellington, New Zealand
1 Corresponding author: Victoria Business School, Victoria University of Wellington, PO Box 600, Wellington
6140. Email: [email protected]. Phone +64 22 379 5565

2
What is the Economic Value of the Extractive Industries
Transparency Initiative (EITI) Information Disclosure?
Abstract
Notwithstanding contributions of the Extractive Industries Transparency Initiative (EITI) to
development strides in natural resource-rich countries, the question of how disclosure
requirements of EITI on natural resources exploration payments impact the valuation of
extractive companies in EITI implementing countries has remained unanswered. We thus
examine for the first time, the stock market reaction to the unilateral release of natural resources
revenue payments information by the United States Department of the Interior (DOI) in
pursuance of the United States Extractive Industries Transparency Initiative (USEITI)
candidacy implementation process, as an illustration of the economic value of EITI
information. This first-time disclosure relates to extractive companies’ payments received by
the Office of Natural Resources Revenue (ONRR) for the 2013 calendar year. Standard event
study methodology, using a two-factor model incorporating an oil and gas industry index, is
used to measure average cumulative abnormal return around the event date of the release of
this information. We find average positive cumulative abnormal returns during the event period
associated with the release of this financial information. The results thus show that, on average,
the market reacts positively to the release of this information. The findings indicate that
investors consider EITI information be relevant for the valuation of extractive companies, and
thus, important for national resource allocation.
Keywords
Extractive Industries Transparency Initiative; U.S. extraction issuers; Natural resources;
Event study; Dodd-Frank Act

3
What is the Economic Value of the Extractive Industries
Transparency Initiative (EITI) Information Disclosure?
Introduction
This study examines the economic impact of Extractive Industries Transparency Initiative
(EITI) disclosure requirements on extractive companies’ shareholders wealth. We use the
United States Extractive Industries Transparency Initiative (USEITI) information release on
non-tax payments of extractive companies to the United States government as an illustration
of the economic value of EITI information. The Extractive Industries Transparency Initiative
(EITI) is one of the international Transparency and Accountability Initiatives (TAIs) 1 focussed
on making natural resources revenue payments and receipts more transparent and accountable.
The EITI issues and promotes global standards for transparent and accountable management
of natural resources in resource-rich countries. It achieves this objective using standards that
require participating companies to publish their payments to governments and governments, in
turn to publish what they receive from companies, and the two sets of information are then
reconciled by an Independent Administrator (IA) 2.
This study focuses on the information content of non-tax payments by extractive companies to
the United States government for the 2013 calendar year. We test whether this information
disclosure is priced by investors, and (if so) the incremental extent to which such information
disclosure is used in valuing extractive companies. We measure market reaction by the average
abnormal return over the event period. Despite the growing flow of data from EITI in recent
times (Short, 2014), the U.S. payment data provides the first opportunity to determine the
association between EITI information disclosures and extractive companies’ shareholders’

4
wealth. While significant studies have been conducted in understanding proclivities for natural
resource curse and opacity (Corrigan, 2014; Gamu, Le Billion & Spiegel 2015; Kolstad &
Wiig, 2009; Williams, 2011) empirical evidence is lacking on how EITI required disclosures
impact extractive companies in implementing countries. This lack of focus on extractive
companies in the literature results from failure of extractive companies to provide
disaggregated data on non-tax natural resource payments in their financial statements. In the
United States, this current inadequacy in disclosure by extractive companies is likely to
improve with enforcement of the re-proposed requirements of Section 1504 of Dodd-Frank
Wall Street Reform and Consumer Protection Act (Pub.L.111-203, H.R. 4173) (U.S. Congress
2010); in Europe, with the implementation of Chapter 10, of the European Union Accounting
Directive (2013/34/EU) (The European Parliament, 2013); and in Canada, with the enactment
of Extractive Sector Transparency Measures Act (2014) (Department of Justice, 2014).
Our study is novel in two ways. Firstly, it considers the impact of EITI’s disclosure
requirements for the first time on extractive companies’ valuation. Secondly, it determines the
impact of the release of individual company data gathered by EITI implementing government
(intermediary) but not fully disclosed by the extractive companies themselves to the market
(i.e. unilateral disclosure3). The results indicate that investors consider EITI information
disclosure be relevant for the valuation of extractive companies. Extending the findings further
to EITI theorization show consistency that EITI information disclosure requirement is capable
of easing capital access for companies operating in implementing countries due to such
countries’ improved sovereign credit ratings.
The next section of the paper provides background information on EITI. This is followed by
discussion on the United States Extractive Industries Transparency Initiative and related
announcements leading to the eventual unilateral release of the information under study. Next,

5
we review prior literature and develop our hypotheses, followed by development of the test for
the market reaction. Finally, we present and discuss our results, and draw our conclusions.
Background
The EITI is a voluntary development initiative that operates an international platform for
openness in the management and reduction of information asymmetry of revenues from natural
resources. It strengthens accountability and transparency and aids public trust in the governance
of extractive resources through disclosure and reconciliation of payments by extractive
companies to governments. This is done at the national EITI level of each member country via
the tripartite Multi-Stakeholder Group4 validation process involving government, companies,
and civil society. Countries that follow the EITI standards publish reports in which companies
and government publicly disclose payments and revenue respectively, related to extractive
activities within their country.
Establishment of the EITI in September 2002, is traceable to the call by Civil Society
Organizations (CSOs), such as Publish What You Pay, Global Witness, Oxfam America and
Transparency International (Short, 2014; Williams, 2011), for stronger efforts to stem growing
poverty and corruption in poor but resource-rich countries. This pressure was reinforced by
research indicating the presence of low or negative growth in most developing countries with
an abundance of natural resources (e.g. Auty, 2001; Ross, 1999; Sachs & Warner, 2001). The
announcement by the former British Prime Minister Tony Blair, at the World Summit on
Sustainable Development in Johannesburg, of the establishment of the EITI as a policy
intervention mechanism was praised by developed countries, donors, and international

6
organizations as the key to resurrecting the stagnating economies of poor resource-rich
countries (Hilson & Maconachie, 2008).
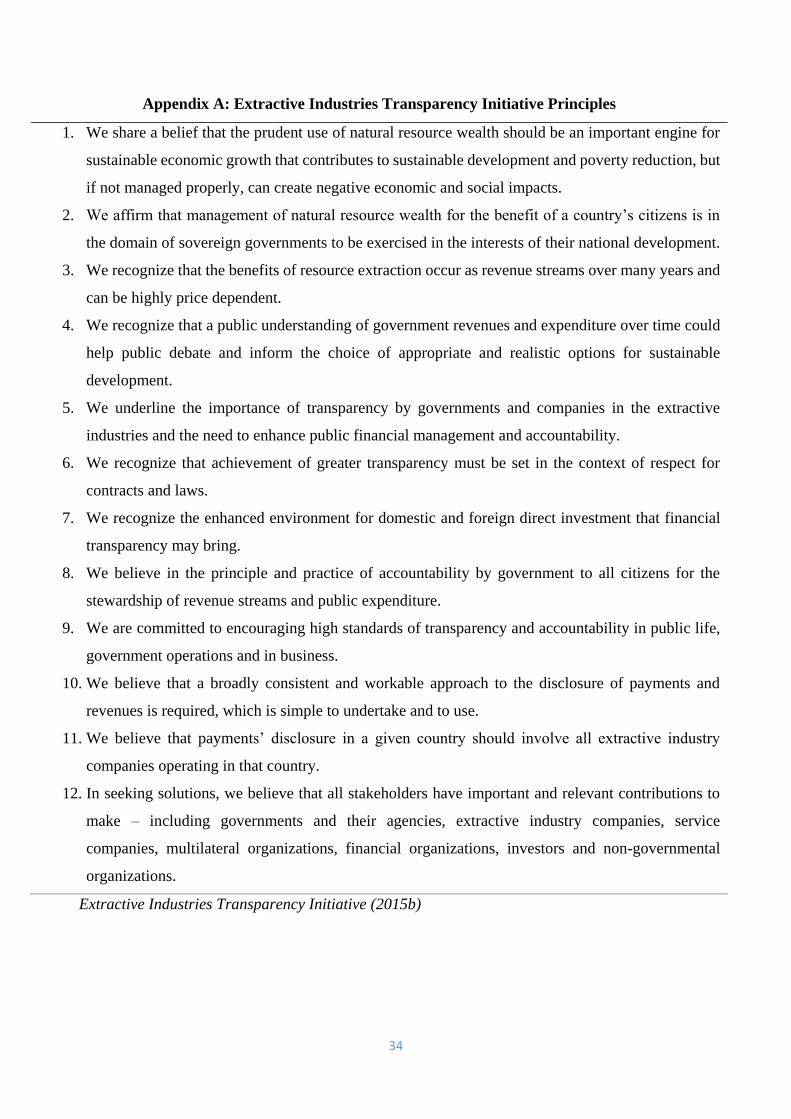
The EITI’s 12 Principles (Appendix A) are the cornerstone on which it operates and consenting
to them signifies a country’s desire to become an implementing member. Broadly put, EITI
implementing country status describes both candidate and compliant countries. The former is
a temporary status which is intended to lead, in a timely fashion, to compliance with the EITI
Standard. Countries wishing to become an EITI compliant country are required to undertake a
number of steps to first attain candidacy. In all, a country must meet EITI defined
“Requirements 1-8” to attain compliant status (Appendix B). However, fulfillment of major
aspects of Requirement 1 grants a country candidate status. A country may hold EITI candidate
status for no more than five years from the date the country was admitted as an EITI candidate
(Extractive Industries Transparency Initiative, 2015b).
Country membership of the EITI is voluntary and primarily involves the government of the
country undertaking to disclose revenue received from extractive companies operating in the
country. However, once a country signs up to the membership of the EITI, it becomes
mandatory for companies operating in such a country to report payments made to the host
government for extraction of minerals, hydrocarbon or other commodities covered by the EITI
process (Extractive Industries Transparency Initiative, 2013). The membership drive in earlier
years targeted developing resource-rich countries with weak natural resource governance,
rather than developed economies with strong natural resource governance. As time progressed,
however, it became important for the credibility of EITI that developed resource-rich countries
considered transparent also join the global initiative and thus offer opaque developing countries

7
opportunity to learn from transparent natural resource-rich countries best practices in natural
resources revenue management.5
Although EITI membership is not compulsory, a significant number of countries have been
persuaded to join through peer pressure and incentivized lobbying. Membership of the initiative
has grown steadily with 51 implementing countries as at June 2016 and of whom 31 are fully
compliant (Appendix C). The EITI reports that the countries’ aggregate resource revenue
reported to date totaled over US$1.9 trillion from oil, gas, and mining (Extractive Industries
Transparency Initiative, 2016a). Countries joining the EITI confirm globally their commitment
to transparency in extractive revenue business and in the reform process to become reputable
in global extractive business dealings. Dreher, Mikosch, & Voigt (2015) confirm that
“membership in an international organization can make promises of investor-friendly policies
more credible if deviation from the international organization’s requirements leads to
sanctions or harms the reputation of the non-complying government”.
United States Extractive Industries Transparency Initiative
The United States is currently a candidate member undergoing processes for becoming an EITI
compliant country. U.S. is an important player in global energy production, ranked as number
one producer of total petroleum and other liquids production in 2014 (U.S. Energy Information
Administration, 2014). The United States’ joining the EITI signaled the growing influence of
EITI in widening the extractive governance net to include rich and developed natural resource-
rich countries.

8
The first official statement regarding the U.S. joining the EITI was made on September 20,
2011, by President Barack Obama during his opening remarks at the Open Government
Partnership launch in New York. This was the start of multi-year steps towards attaining EITI
compliant status. Obama’s speech officially committed the United States to develop plans and
a roadmap necessary to achieve the goals for compliance. On March 19, 2014, the EITI Board
approved the United States application as an EITI candidate country.
On December 11, 2014, in line with the decision reached in the USEITI-MSG meetings, the
U.S. Department of the Interior (DOI) launched an On-line Data Portal which contains Office
of Natural Resources Revenue (ONRR) company level data. Legality for disclosing this
category of information had been discussed in meetings where it was accepted that for all in-
scope commodities, the DOI would disclose company-level data to the extent that is permitted
by law (approximately 100% of DOI revenue is in-scope). The ONRR source, for the first time,
provides valuable information about the extractive industry in the United States (United States
Extractive Industries Transparency Initiative, 2014).
Literature and Hypotheses Development
Event studies have a long and well-established position in literature. They have provided
evidence in finance tests used to assess the magnitude of the impact of an event on the wealth
of firms’ shareholders (Kothari & Warner, 2007). Studies on events and announcements from
firms’ and/or regulatory institutions seek to provide empirical evidence on corporate policy
acceptance by market participants. Wells (2004) affirms that information is often of interest to
market players in terms of which companies are winners and losers following the introduction
of new regulatory initiatives. Of importance is how an entire industry adopting a new regulation

9
is perceived by players in the market. The seminal paper on event studies by Fama, et al.,
(1969) established a link between new information and unusual behavior in rates of return on
securities in the period surrounding the introduction of the new information to the market.
Markets adjust to new information even when some of the information may have been
anticipated ahead of the event or announcement day. A common thread running through all
market reaction research is the fact that markets are interested and responsive to new
information affecting stocks traded in the market. Ball & Brown (1968), one of the pioneering
studies on information relevance to investors contend that given the efficient and unbiased
nature of markets in using information, usefulness can be assessed by the impact on securities
prices.
Pranther-Kinsey & Tanyi (2014) provide an example of a recent study on the impact of
regulatory announcements. The study investigates the market reaction to the Securities and
Exchange Commission’s (SEC) IFRS-related press releases between 2007 and 2011, regarding
the adoption of IFRS in the United States. They use American Depository Receipts data and
found a significant positive reaction to the SEC’s announcements related to the potential
announcement of IFRS in industries where IFRS is globally predominant.
The demand for greater disclosure by firms is particularly strong for extractive companies
whose exploration activities are perceived to have a significant effect on the environment and
society. Within the bounds of legislation and scope of discretionary reporting, much emphasis
is put on extractive companies’ information disclosures. Griffin, Lont, & Sun (2014) recount
that “advocates of sustainability accounting seek to encourage or require companies to
disclose information on a wide range of issues beyond those within the traditional confines of
financial reporting, particularly issues as they relate to companies’ involvement in social
10
justice”. These additional disclosures are considered to be of several benefits to diverse
stakeholders, chiefly investors in making financial decision about firms. Grewal, Riedl &
Serafeim (2015) in a study of market reaction to mandatory nonfinancial disclosure document
such benefits to include increased information relevant to assessing performance and
management practice which can increase accuracy in prediction of firm’s future performance,
positive stock price reaction and expectations regarding inherent risks. Their study is consistent
with previous literature on voluntary disclosure (e.g. Cheng, Ioannou & Serafeim, 2014;
Eccles, Krzus & Serafeim, 2011).
Dhaliwal, et al., (2012) provide evidence that stock price incorporates more information on
future earnings among firms with greater corporate social responsibility disclosures. They use
the issuance of stand-alone corporate social responsibility (CSR) reports to proxy for disclosure
of nonfinancial information and found that the issuance of CSR reports significantly reduces
earning forecast errors. This suggests that the non-financial information disclosed by
companies compliment financial disclosures by mitigating financial opacity on forecast
accuracy. Thus it can be expected that securities of firms with additional disclosure (financial
and nonfinancial) will receive more acceptance in the market, particularly, if the information
conveys useful and above average disclosure. Equally, Elbannan & Elbannan (2015) in a
related study of bank risk disclosures affirm that market participants prefer, and price firms
with increased disclosures higher than those disclosing less information. Suggesting that
increased disclosure help market participants make value-based decision about firms. The
implication being that higher information disclosing firms are associated with higher investor
confidence and growth expectations. However, additional disclosure is constrained by
preparation costs and proprietary costs (Griffin, et al., 2014).
11
Extractive companies operating in EITI implementing countries have played down the
feasibility of reporting disaggregated extractive financial information in annual reports, citing
proprietary costs (among others) as the core limitation (Seitzinger & Ruane, 2015). Rajan &
Sarath (1996) suggest alternative specifications to increase full disclosure given a prevalence
of partial disclosure, especially where information content is dictated by firms’ preferences.
One possibility is using line-item reporting to provide disaggregated details in financial reports.
Although, the information released by DOI is included in companies’ reported profit but it is
not separately disclosed as a line item in the financial statements of the extractive companies.
Thus, eliminating the line-item reporting option in this case. Another possibility according to
Rajan & Sarath (1996) is to introduce a risk-neutral third party (i.e. the intermediary). Hence,
the independent role of the DOI in releasing this information, not fully disclosed in companies’
financial report suffice here.
An event study of the impact on share prices of the release of this information thus provides an
indicator of the perceived usefulness of the information to assessing the value of the companies.
If the information is value relevant, it indicates not only that it is relevant to the assessment of
the value of individual companies, but also that it is important for national resource allocation.
Hence, consistent with prior studies stock prices incorporate information about firms useful for
economic valuation, assessment and financial judgment (Ball & Brown, 1968; Dhaliwal, et al.,
2012; Fama, et al., 1969; Griffin, et al., 2014; Prather-Kinsey & Tanyi, 2014). Based on the
discussion, we set up the following null hypothesis to test for the economic value of EITI
information:
H1: There is no significant market reaction to the release of information on the non-tax
payments made by the United States extractive industry companies to the United States
government.
12
Extractive companies’ disclosure and the Proprietary Cost Theory
The proprietary cost theory suggests that firms’ decisions to disclose information are
constrained by concern that such disclosures can damage their competitive position in markets
(Healy & Palepu, 2001; Son & Crabtree, 2011; Verrecchia, 1983; Wagenhofer, 1990). This
cost reduces the likelihood of companies disclosing information to the market, particularly, if
non-disclosure will not directly harm companies’ performance (Ellis, Fee & Thomas, 2012).
Consistent with this theory, the market may react in a negative manner to additional disclosure.
The counter expectation regarding the DOI disclosure is that since there are uniform timing
and equal disclosure for all firms in the industry we would not expect any harm to result for
the companies. In other words, if an investor’s basis for withdrawing investments from say
company X for Y is based on its proprietary disclosure, then such investor would have no
incentive for withdrawing when companies X and Y make equal disclosure at the same time.
The EITI posits that companies supporting extractive revenue disclosure will enjoy positive
reputation effects and better access to capital. Implying that rather than damage
competitiveness, EITI disclosures would improve the financial reputation of both companies
and implementing countries. When a country’s sovereign credit ratings and governance
indicators improve, it improves access to finance, attracts investors and strengthens the image
of companies operating there (Extractive Industries Transparency Initiative, 2013). This
theorization by the EITI is consistent with the findings of Dreher & Voigt (2011) who found
membership of international organizations to be associated better country risk ratings.
While companies in an EITI implementing country can be expected to benefit from the credit
rating of the country, however, extractive companies with more demand for financing would

13
be expected to benefit most from disclosure. Hence, we hypothesize that the market reaction
would be more positive for companies with higher leverage. Leverage here is used as an
indicator for firms need for external finance. The literature indicates that Book-to-market ratio,
the book value of equity over market value, is sensitive to market announcements (Prather-
Kinsey & Tanyi, 2014; Zhang, 2007). Similarly, the literature on event studies shows evidence
of market reactions being related to the size of firms (Hitz & Müller-Bloch, 2015; Rai &
Tartaroglu, 2015). We measure the size of firms, by the natural logarithm of total assets. The
choice of natural logarithms is to normalize the size of data. We thus propose the following
hypothesis:
H2: Ceteris Paribus, extractive companies with higher leverage, lower book-to-market, and
larger size will have stronger positive cumulative abnormal returns following information
release by the U.S. government on their non-tax extractive payments.
Method and Data
Model for measuring abnormal performance
We use the event study approach as outlined by Mackinlay (1997) to assess the impact on
returns of the disclosure of non-tax payments to the U.S. government. The impact is assessed
by cumulative average abnormal return over the event period. Abnormal returns are defined as
actual return less expected returns based on a two-factor market model estimated from data on
the period preceding the event period- the estimation window. The two-factor market model
includes a market factor and an industry factor and is specified as follows:
𝑅𝑖𝑡 = ∝𝑖 + 𝛽1𝑖𝑅𝑚𝑡 + 𝛽2𝑖𝐼𝑛𝑑𝑡 + 𝜀𝑖𝑡 ……………………. (1)
where:
𝑅𝑖𝑡 = Period return for security i

14
∝𝑖 = Constant (intercept) estimate for security i
𝛽1𝑖 = Estimated Beta for return on Standard & Poor's Composite Index
𝑅𝑚𝑡 = Return on the Standard & Poor's Composite Index in period t
𝛽2𝑖 = Estimated Beta for return on US Oil and Gas Index
𝐼𝑛𝑑𝑡 = Return on the US Oil and Gas Index in period t
𝜀𝑖𝑡 = Disturbance term (residual)
The parameters of the model are estimated from data on the estimation window using
ordinary least squares regression and then used to calculate the abnormal return during the
event period or segments thereof:
𝐴𝑅𝑖�� = 𝑅𝑖𝑡 − 𝑅𝑖�� …………………………………. (2)
where
𝑅𝑖𝑡 = actual return
𝑅𝑖�� = ∝�� + 𝛽1��𝑅𝑚𝑡 + 𝛽2��𝐼𝑛𝑑𝑡 = expected return ………………………………….
(3)
∝; ��= estimates of the parameters from (1)
𝐴𝑅𝑖�� = the component of the actual return which is “abnormal”
The timeline and event period is as follows:
= 0: the event day, 11 December 2014

15
𝑇0+ 1 to 𝑇1: represents the estimation window, the 120 days (from day -123 to -4,
18th June 2014 to 5th December, 2014) before the event period
𝑇1+1 to 𝑇2 : represents the event window -3 trading days before the event day (τ)
and 13 days after
𝜏+ 1 to 𝑇2: represents the post-event window (1-13 trading days after event day)6
[INSERT FIGURE 1 HERE]
Cumulative abnormal return (CAR) is calculated as the aggregate over the event period of the
daily mean abnormal returns across the companies.
𝐶𝐴𝑅(𝑡1−𝑡𝑛) = ∑ 𝐴𝑅𝑡
𝑇𝑛𝑡=𝑇1 …………………………………. (4)
where
𝐴𝑅𝑡 =
1
𝑁 ∑ 𝐴𝑅𝑖𝑡
𝑁𝑖=1 ………………………………….. (5)
𝐴𝑅𝑖𝑡 = abnormal return for company i on day t.
𝐶𝐴𝑅(𝑡1−𝑡𝑛) = mean cumulative abnormal return for sampled companies for the event
window or one-period partitioned interval.
The test for statistical significance for the individual 𝐴𝑅𝑡 are calculated using the below
equation
𝑡𝐴𝑅𝑡=
𝐴𝑅𝑡
𝑆(𝐴𝑅 𝑡−123−𝑡−4) ….……………………………. (6)
Where

16
𝑡𝐴𝑅𝑡= t-statistics for abnormal return on day t
𝐴𝑅𝑡 = mean abnormal return for sampled companies on day t
𝑆(𝐴𝑅 𝑡−123−𝑡−4
) = Standard deviation of average abnormal returns over the estimation window
(-123 to -4).
Consistent with Brown & Warner (1985) and Lee & Park (2016), we use standard deviation
over the estimation period to moderate the possibility of cross-sectional dependence across
returns during the event period. Following recommendation by Kothari & Warner (2007) and
Kryzanowski & Jenkins (1993) with modification, we calculate the t-statistic for CAR over
various intervals using equation (7) below:
𝑡𝐶𝐴𝑅(𝑡1,𝑡𝑛)=
𝐶𝐴𝑅(𝑡1,𝑡𝑛)
[𝜎2(𝑡1,𝑡𝑛)]1
2⁄ ….……………………………. (7)
where
𝑡𝐶𝐴𝑅(𝑡1,𝑡𝑛) = t-statistics of CAR for event period (𝑡1, 𝑡𝑛)
𝜎2(𝑡1, 𝑡𝑛) = 𝐿𝜎2 (𝐴𝑅𝑡) ….……………………………. (8)
𝐿𝜎2 (𝐴𝑅𝑡) = variance of the one-period mean abnormal return.
𝐶𝐴𝑅(𝑡1, 𝑡𝑛) = one-event period cumulative abnormal return
Data
Data was accessed from the United States Extractive Industries Transparency Initiative online
data portal tracked and managed by the Department of the Interior’s Office of Natural Resource
Revenues. The online portal contains non-tax revenue categorized by company, commodity
and revenue type for each calendar year. These open datasets are revenues for United States

17
Federal lands and offshore areas. The revenue types are royalty, rent, bonus and other payment
(i.e. penalties etc.). The USEITI portal reports disaggregated royalties, rent, bonuses, penalties
and other payments by the companies. In terms of commodity, the portal presents the payments
under the headings of oil, gas, coal, geothermal and other commodities. The payments are for
companies paying US$100,000 and above for different extractive activities in the 2013
calendar year.
The sample initially comprised the 563 companies that made payments for the 2013 calendar
year to the United States government. We separated listed and unlisted companies to enable us
to identify firms with daily trading data. Table 1 gives the breakdown of listed companies by
payment category. As observed from the table, listed companies’ payments across the different
revenue types were $7,560,507,737.80 signifying 61.2% of total payments made for the 2013
calendar year, which shows that a significant threshold of payments was made by extractive
issuers listed in US stock markets.
[INSERT TABLE 1 HERE]
We dropped companies with dual unique permanent security identification number
(PERMNO) from the sample (i.e. companies for which the parent and one or more subsidiaries
made payments) in order to avoid double counting. Companies listed outside of the United
States and those traded on OTC were also dropped from the sample. Table 2 shows the selection
process for the final sample used in the study. As shown, we obtained a final sample of 95
extractive companies that made payments to the U.S. government for the 2013 calendar year
(detail in Appendix D). Daily trading data for individual securities and the indexes was
obtained from CRSP/Stock/Security Files/Daily Stock Files database.

18
[INSERT TABLE 2 HERE]
Empirical Results
Table 3 present summary results of the abnormal returns and statistical significance. The model
indicates significant abnormal positive returns around the event day, beginning from day two
before the event day to the fourth day after the event. The negative abnormal return on day -3
suggests that introduction of this information caused a revision of behavior in the market in
opposite direction as noticed on the second day before the event. Consistent with Kothari &
Warner (2007) suggestion that if the event is partially anticipated (due to red flags
announcements, as in this case), some of the abnormal return behavior related to the event
should show up prior to the event. Noticeably days -3 and -2 shows this behavior with abnormal
returns of -0.04 and 0.06 percent respectively, both statistically significant.
The results show evidence that the information release caused a positive revaluation of the
sampled extractive firms with the release being partly anticipated. The third and fourth day
after the release of the information were the days on which the response peaked with abnormal
returns at 0.07 percent and statistically significant at 1% level for both days.
[INSERT TABLE 3 HERE]
Cumulative abnormal returns results for different partitioned intervals of the event period
reported in Table 4, provide clearer evidence of the impact of the information release. All the
intervals during the event period show positive cumulative abnormal returns with significance
19
at one and five percent levels, except (-3, 1). The entire event period (-3, 13) shows a
cumulative abnormal return of 0.23 percent, significant at 1% level. Partition (-3, 3) produced
a positive cumulative abnormal return of 0.08 percent and significant at 5% level, while the (-
3, 5) and (-2, 4) partitions show cumulative abnormal returns of 0.14 and 0.20 percent
respectively, all statistically significant at 1% level.
The results provide a clear basis for rejecting the null hypothesis of no market reaction
following the release of the extractive companies’ information and inviting the inference that
the unilateral release of extractive companies’ non-tax payment in the United States by the
Department of the Interior, in pursuance of the United States of America EITI candidacy was
associated with a positive incremental valuation for the affected firms.
[INSERT TABLE 4 HERE]
Figure 2 illustrates the path of cumulative abnormal returns during the event period. The
diagram confirms that the finer information provided by the USEITI release evokes a market
reaction for the sample extractive companies, that is, the release has valuation relevance for
these extractive companies. Furthermore, on average the reaction is positive thus indicating a
positive reassessment of company prospects given the finer data set available to investors. The
market begins to process the information from before the event date with gradual positive
reaction until the fourth day when a daily peak was reached.

20
Cross-sectional variation model
Following the finding of positive overall shareholders’ wealth impact of the release of
payments made to United States Department of the Interior, by extractive companies for 2013,
we further test the influence of firms’ specific characteristics on the market reaction to the
release of the payments information. We employ a multivariate regression model to test our
third hypothesis across firm’s specific characteristics, consistent with Prather-Kinsey & Tanyi,
(2014); Akyol, Lim, & Verwijmeren, (2012); Marden, (2000) we introduce additional firm
attributes in our model to test the CAR. The regression model is stated below in as equation
(9).
𝐶𝐴𝑅(𝑡1−𝑡𝑛) = ∝𝑖 + 𝛽1𝑆𝑡𝑑𝑅𝑇𝑁𝑖 + 𝛽2𝐵𝑇𝑀𝑖 + 𝛽3𝐿𝑁𝐴𝑇𝑖 + 𝛽4𝐿𝐸𝑉𝑖 + 𝛽5𝐹𝑖𝑟𝑚𝐶𝐴𝑅𝑖
+𝛽6𝐼𝑁𝐷𝑖 + 𝜀𝑖 ………………………………………………….
(9)
where:
𝐶𝐴𝑅(𝑡1−𝑡𝑛) = One-period cumulative abnormal return across firms’ estimated using
the two-factor market model;
𝑆𝑡𝑑𝑅𝑇𝑁 = Standard deviation of the of firm’s daily stock return during the
estimation window (120 days before the event period)
𝐵𝑇𝑀 = Book-to-Market ratio (Book value per share scaled by market price per
share)
𝐿𝑁𝐴𝑇 = Natural logarithm of firms’ total assets
𝐿𝐸𝑉 = Leverage (total debt scaled by total assets)
FirmCAR = 1 if firm has positive cumulative abnormal return during the event
window, 0 otherwise;

21
IND = 1 if firm is an oil & gas and 0 for mining and non-oil and gas
companies
𝜀𝑖 = Error term
In line with previous studies, the explanatory variables for firm characteristics include the
standard deviation of the of firm’s daily stock return (StdRET) to check for the impact of
volatility of firms’ stock returns. We include leverage to test our second hypothesis. Using this
proxy allows us to infer the extent to which firms rely on external finance and a way of
assessing if such firms would be likely to benefit from EITI disclosure. Leverage is also a good
measure of the risk of firms. FirmCAR is the cumulative abnormal return for individual firms.
It is a dummy variable with value 1 for firms with the positive market reaction and 0 otherwise.
Since the information release affects all firms at the same time, the single date event may be
influenced by cross-sectional correlation. To mitigate for this, we partitioned the event period
into several intervals to test for consistency across the event period.
Descriptive statistics
Tables 4A and 4B show descriptive statistics for the variables used in our study and pairwise
correlations of the variables respectively. The data show that the mean and the median book-
to-market ratio of firms is 0.38 and 0.69 respectively, signifying that on average, shares of the
companies are worth more than book value. Leverage of the companies is mean 0.36 median
of 0.34. Of the sample companies, 84% have positive cumulative abnormal returns.
Approximately 78% of the companies in the sample belong to oil and gas industry. This aptly

22
explains the inclusion of the US Oil and Gas industry index in estimating the abnormal return
to control for specific industry effects that could be driven by the oil and gas companies.
[INSERT TABLE 4A & 4B HERE]
Multivariate cross-sectional regression results
We present the result of the multivariate analysis in table 5. The result shows evidence that
average, book-to-market ratio, and size influence the reaction with all being significant at 1%
level. Our results are thus consistent with regular EITI Reports on payments and revenues being
likely to improve the creditworthiness of countries and by extension ease of access to capital
for companies. The impact of book-to-market is significant, but contrary to expectation, it has
a greater impact the higher is the ratio. The results suggest that the market reacted more strongly
to companies with larger size, as measured by the natural logarithm of total assets. This is
observed from the coefficient of the LNAT at 0.013 and significant at the 5% level. This may
be part of initial concerns that led the American Petroleum Institute (API), the U.S. Chamber
of Commerce, the Independent Petroleum Association of America, and the National Foreign
Trade Council to file a suit against the SEC in October, 2012 on the final rule for Section 1504
of Dodd-Frank Act, 2010.7 The API and other Plaintiffs’ argument is that the SEC acted
arbitrarily and capriciously in promulgating the rules by not carry out sufficient cost-benefit
analysis challenge of the disclosure. And that the rule violated the First Amendment guarantee
of freedom of speech since disclosing such information would allow companies’ competitors
access to sensitive proprietary information. However, if the argument on violation of First
Amendment is valid then we should expect to see a negative reaction from the companies-
which is not the case, but perhaps a lead for further research.8

23
Alternative intervals
Our main study is focused on the impact of the information release over a period of (-3, 13).
However, to reduce the possibility of cross-sectional correlation we test for consistencies over
the event window, by partitioning the event period into alternatives intervals to test if the
market response remains constant. We split the event window into four hypothetical event
windows (-3, 5); (-3, 3); (-2, 4) and (-3, 1). Table 6 shows that overall the results were consistent
across the different windows.
Additional Tests
We conducted additional tests by splitting our sample to reflect firms that voluntarily
participated in the 2015 reconciliation reported on December 15, 2015. The 2015 report is
based on the same 2013 calendar year revenue first released on December 11, 2014. In this
report, however, only companies that paid at least US$50 million revenue to the DOI bureaus
were invited to participate in the voluntary reconciliation. Although only 44 companies met the
materiality threshold, due to a calculation error, 45 companies (Appendix E) were invited to
participate in the reconciliation. However, only 31 of the companies invited to participate
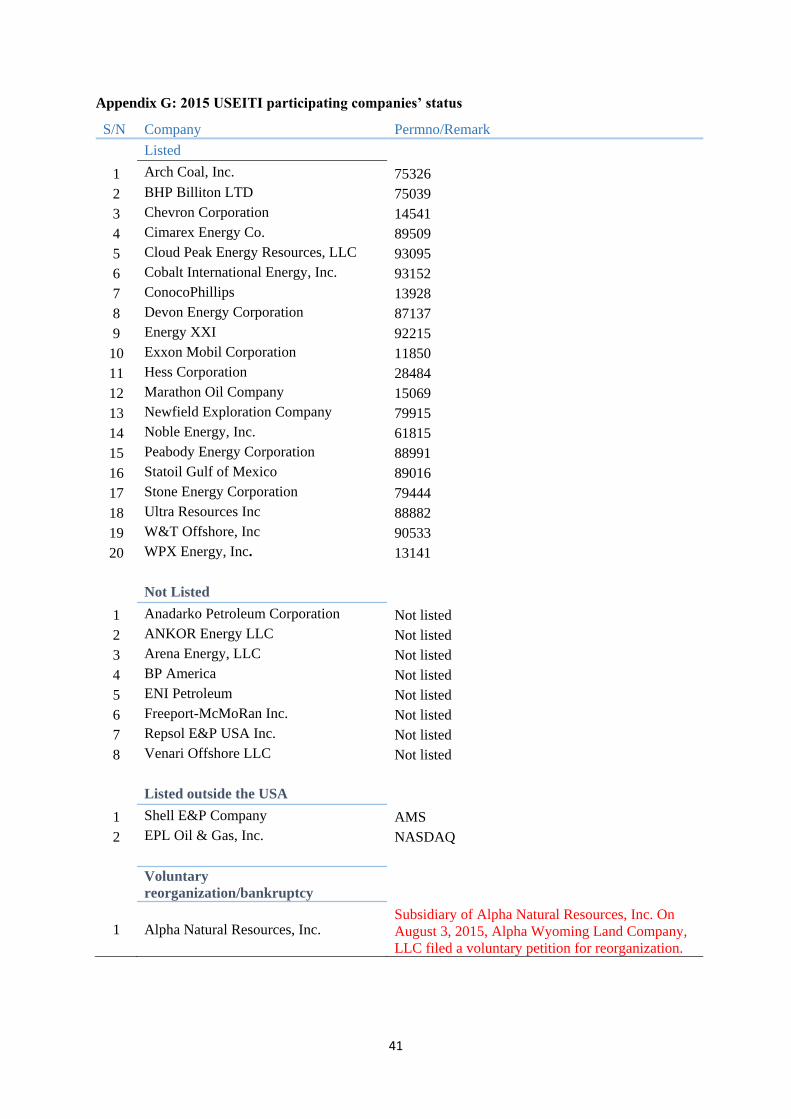
actually did (Appendix F). In all, 20 out of the 45 companies invited to participate were listed
on the NYSE with daily stock price data. The eight unlisted companies, two listed outside of
the U.S. and one company that filed for voluntary reorganization in August 2015, were dropped
(Appendix G).
The cumulative abnormal return results for the 20 companies that voluntarily participated in
the 2015 USEITI reconciliation (not reported) were qualitatively consistent with the result of
the disclosure for all 95 companies reported above. For the fourteen companies that were
invited to participate in the reconciliation but declined the invitation (Appendix H), there was
24
also a market reaction but the pattern of the CAR was negative. This requires further
investigation.
Conclusion
We examine the economic value of Extractive Industries Transparency Initiative (EITI)
information disclosure on the wealth of shareholders using as an example, the United States
Extractive Industries Transparency Initiative (USEITI) disclosure. Our results show that
USEITI disclosure of the non-tax data for individual extractive companies produced a market
reaction indicating that the finer disclosure had information content relevant to price setting.
The reaction was positive, indicating that investors had on average underestimated prospects
for the companies on the basis of financial statement information only. Furthermore, the results
are consistent with the EITI position that companies accessing capital from the market would
benefit from the additional disclosure.

25
Declaration of Conflicting Interests
The author(s) declared no potential conflicts of interest with respect to the research,
authorship, and/or publication of this article.
Funding
The author(s) received no financial support for the research, authorship, and/or publication of
this article
Notes
1. These are citizen-led, demand-side influenced accountability and access to information
as ways of combating developmental and democratic failures. The growth of TAI
activities has stimulated researchers to understand their modus operandi (Gaventa &
McGee, 2013).
2. The Independent Administrator (IA) also referred to as the Reconciler, is an
independent entity (usually an audit firm) that is appointed by the MSG to reconcile the
revenue received by the government and payments made by the extractive companies.
Although required to apply international auditing standards in the reconciliation
process, the Reconciler’s task is not to carry out audit in the traditional accounting
manner, but rather (i) to compile and analyse the information received from government
and companies, and (ii) to investigate and explain any discrepancies as set out in the
terms of reference agreed upon with the Multi-Stakeholder Group. This task is to
provide a credible assurance to every information reported in national EITI reports.

26
3. Whereas studies have looked at mandatory and voluntary disclosures, there seems to be
no evidence of unilateral disclosure explaining how information held by regulatory
agencies impact firms when released to third parties or the market.
4. MSG (also known as national EITI Council) is the committee that develops a country’s
work plan, to oversee implementation of and management of the EITI program. Its core
functions include (i) overall strategic decision-making (ii) defining the scope of EITI
process (iii) identifying, assessing and removing barriers to implementation (iv)
preparing the work plan and monitoring implementation (v) select and oversee the work
of the Independent Administration (vi) contribute to an approve reporting templates
(vii) communicate about the EITI and engage stakeholders (viii) ensure that EITI
reports are comprehensible and publicly accessible so as to contribute to open, public
debate (ix) appoint the Validator and approve validation reports and (x) take steps to
act on lessons learnt, address discrepancies and ensure the sustainability of the EITI
process.
5. EITI former Chair, Clare Short, puts it in perspective in her foreword to the 2015 EITI
Standards when she affirmed that,
… one of the key challenges ahead is to recognize and learn from countries that exceed
the minimum requirements and create incentives for more innovative use of EITI to the
benefit of the countries that implement the EITI (Extractive Industries Transparency
Initiative, 2015a p.7).
6. Some studies suggest three days after event day as being sufficient to measure abnormal
performance. However, given the nature of the information release we use 13 days post

27
event to give a longer range picture of the behavior of the firms’ returns conditional on
to the release.
7. Section 1504 (2) (A) stipulates that Not later than 270 days after the date of enactment
of the Dodd-Frank Wall Street Reform and Consumer Protection Act, the Commission
shall issue final rules that require each resource extraction issuer to include in an annual
report of the resource extraction issuer information relating to any payment made by
the resource extraction issuer, a subsidiary of the resource extraction issuer, or an entity
under the control of the resource extraction issuer to a foreign government or the
Federal Government for the purpose of the commercial development of oil, natural gas,
or minerals, including ‘‘(i) the type and total amount of such payments made for each
project of the resource extraction issuer relating to the commercial development of oil,
natural gas, or minerals; and ‘‘(ii) the type and total amount of such payments made to
each government.
8. On June 27, 2016, the SEC adopted the re-proposed Rule 13q-1 and an amendment to
Form SD to implement Section 1504. With the Final Rule now issued, resource
extraction issuer must comply with the final rule and form for fiscal years ending on or
after September 30, 2018.

28
References
Akyol, A. C., Lim, W. F., & Verwijmeren, P. (2012). Shareholders in the boardroom: Wealth
effects of the SEC’s proposal to facilitate director nominations. Journal of Financial
and Quantitative Analysis, 47(05), 1029-1057.
Auty, R. M. (2001). The political economy of resource-driven growth. European Economic
Review, 45(4), 839-846.
Ball, R., & Brown , P. (1968). An empirical evaluation of accounting income numbers.
Journal of Accounting Research, 6(2), 159-178.
Brown, S. J., & Warner, J. B. (1985). Using daily stock returns: The case of event
studies. Journal of Financial Economics, 14(1), 3-31.
Cheng, B., Ioannou, I., & Serafeim, G. (2014). Corporate social responsibility and access to
finance. Strategic Management Journal, 35(1), 1-23.
Corrigan, C. C. (2014). Breaking the resource curse: Transparency in the natural resource
sector and the extractive industries transparency initiative. Resources Policy 40, 17-
30.
Department of Justice. (2014). Extractive Sector Transparency Measures Act. The Minister
of Justice. http://laws-lois.justice.gc.ca.
Dhaliwal, D. S., Radhakrishnan, S., Tsang, A., & Yang, Y. G. (2012). Nonfinancial
disclosure and analyst forecast accuracy: International evidence on corporate social
responsibility disclosure. The Accounting Review, 87(3), 723-759.
Dreher, A., Mikosch, H., & Voigt, S. (2015). Membership has its privileges–The effect of
membership in international organizations on FDI. World Development, 66, 346-358.
Dreher, A., & Voigt, S. (2011). Does membership in international organizations increase

29
governments’ credibility? Testing the effects of delegating powers. Journal of
Comparative Economics, 39(3), 326-348.
Eccles, R. G., Serafeim, G., & Krzus, M. P. (2011). Market interest in nonfinancial
information. Journal of Applied Corporate Finance, 23(4), 113-127.
Elbannan, M. A., & Elbannan, M. A. (2015). Economic consequences of bank disclosure in
the financial statements before and during the financial crisis evidence from Egypt.
Journal of Accounting, Auditing & Finance, 30(2), 181-217.
Ellis, J. A., Fee, C. E., & Thomas, S. E. (2012). Proprietary costs and the disclosure of
information about customers. Journal of Accounting Research, 50(3), 685-727.
Extractive Industries Transparency Initiative. (2013). Business Guide: How companies can
support EITI implementation . Oslo: EITI International.
Extractive Industries Transparency Initiative. (2015a, November). https://eiti.org/eiti/history.
Retrieved from https://eiti.org
Extractive Industries Transparency Initiative. (2015b). The EITI standard. Oslo: EITI
International.
Extractive Industries Transparency Initiative. (2016a). https://beta.eiti.org. Retrieved from
https://eiti.org
Extractive Industries Transparency Initiative. (2016b). The EITI Standard 2016. Oslo: EITI
International.
Fama, E. F., Fisher, L., Jensen, C. M., & Roll, R. (1969). The adjustment of stock prices to
new information. International Economic Review, 10(1), 1-21.

30
Gamu, J., Le Billon , P., & Spiegel, S. (2015). Extractive industries and poverty: A review of
recent findings and linkage mechanisms. The Extractive Industries and Society, 2(1),
162-176.
Gaventa, J., & McGee, R. (2013). The impact of transparency and accountability initiative.
Development Policy Review, 31(S1), S3-S28.
Grewal, J., Riedl, E. J., & Serafeim, G. (2015). Market reaction to mandatory nonfinancial
disclosure. Harvard Business School Working Paper, No. 16-025, September 2015.
Griffin, P. A., Lont, D. H., & Sun, Y. (2014). Supply chain sustainability: evidence on
conflict minerals. Pacific Accounting Review, 26(1/2), 28-53.
Healy, P. M., & Palepu, K. G. (2001). Information asymmetry, corporate disclosure, and the
capital markets: A review of the empirical disclosure literature. Journal of Accounting
and Economics, 31(1), 405-440.
Hilson, G., & Maconachie, R. (2008). “Good governance” and the extractive industries in
Sub-Saharan Africa. Mineral Processing and Extractive Metallurgy Review, 30(1),
52-100
Hitz, M. J., & Müller-Bloch, S. (2015). Market reactions to the regulation of executive
compensation. European Accounting Review, 24(4), 659-684.
Kolstad, I., & Wiig, A. (2009). Is transparency the key to reducing corruption in resource-rich
countries? World Development, 37(3), 521-532.
Kothari, S. P., & Warner, J. B. (2007). Econometrics of event studies. In B. E. Eckbo (Eds.),
Handbook of corporate finance: empirical corporate finance volume 1 (pp. 3-36).
Amsterdam: Elsevier.

31
Kryzanowski, L., & Jenkins, C. (1993). The market's reaction to the release of drill-core
assay results by junior mining firms. Journal of Accounting, Auditing & Finance,
8(3), 289-308.
Lee, H., & Park, K. I. (2016). Market valuation effect of foreign asset divestitures in an
emerging economy: Korean Evidence. Emerging Markets Finance and Trade, 52(1),
136-153.
MacKinlay, C. A. (1997). Event studies in economics and finance. Journal of Economic
Literature, XXXV, 13-39.
Marsden, A. (2000). Shareholder wealth effects of rights issues: Evidence from the New
Zealand capital market. Pacific-Basin Finance Journal, 8(3), 419-442.
Prather-Kinsey, J. J., & Tanyi, P. N. (2014). The market reaction to SEC IFRS-related
announcements: The case of American Depository Receipt (ADR) firms in the US.
Accounting Horizons, 28(3), 579-603.
Rai, A., & Tartaroglu, S. (2015). The relative option to stock volume and market response to
earnings surprises. Journal of Accounting, Auditing & Finance, (30)4, 431-460.
Rajan, M. V., & Sarath, B. (1996). Limits to voluntary disclosure in efficient markets.
Journal of Accounting, Auditing & Finance, 11(3), 361-387.
Ross, M. L. (1999). The political economy of the resource curse. World politics, 51(02), 297-
322.
Sachs, D. J., & Warner, M. A. (2001). The curse of natural resources. European Economic
Review, 45(4), 827-838.

32
Seitzinger, M. V., & Ruane, K. A. (2015). Conflict minerals and resource extraction: Dodd-
Frank, SEC regulations, and legal challenges. Congressional Research Service.
www.crs.gov.
Short, C. (2014). The development of the Extractive Industries Transparency Initiative. The
Journal of World Energy Law & Business, 7(1), 8-15
Son, M., & Crabtree, A. D. (2011). Earnings announcement timing and analyst following.
Journal of Accounting, Auditing & Finance, 26(2), 443-468.
The European Parliament. (2013). European Union Accounting Directive [2013/34/EU].
U.S. Congress. (2010 ). Dodd-Frank Wall Street Reform and Consumer Protection Act. Pub.
L. No. 111-203, 124 Stat. 1376 (2010).
U.S. Energy Information Administration. (2014). U.S. crude oil and natural gas proved
reserves, 2014. Retrieved from www.eia.gov:
http://www.eia.gov/beta/international/rankings/#?prodact=53-1&cy=2014
United States Extractive Industries Transparency Initiative. (2014). United States EITI
Annual Activity Report 2014. Retrieved from doi.gov/eiti:
https://www.doi.gov/sites/doi.opengov.ibmcloud.com/files/uploads/Annual%20Activi
ty%20Report%202014%207_17_15%20Final.%20%281%29%20%281%29.pdf
Verrecchia, R. E. (1983). Discretionary disclosure. Journal of accounting and economics, 5,
179-194.
Wagenhofer, A. (1990). Voluntary disclosure with a strategic opponent. Journal of
Accounting and Economics, 12(4), 341-363.
Wells, W. H. (2004). A beginner's guide to event studies. Journal of Insurance Regulation,
22(4), 61-70.

33
Williams, A. (2011). Shining a light on the resource curse: An empirical analysis of the
relationship between natural resources, transparency, and economic growth. World
Development, 39(4), 490-505.
Zhang, X. I. (2007). Economic consequences of the Sarbanes–Oxley Act of 2002. Journal of
Accounting and Economics, 44(1), 74-115.
34
Appendix A: Extractive Industries Transparency Initiative Principles
1. We share a belief that the prudent use of natural resource wealth should be an important engine for
sustainable economic growth that contributes to sustainable development and poverty reduction, but
if not managed properly, can create negative economic and social impacts.
2. We affirm that management of natural resource wealth for the benefit of a country’s citizens is in
the domain of sovereign governments to be exercised in the interests of their national development.
3. We recognize that the benefits of resource extraction occur as revenue streams over many years and
can be highly price dependent.
4. We recognize that a public understanding of government revenues and expenditure over time could
help public debate and inform the choice of appropriate and realistic options for sustainable
development.
5. We underline the importance of transparency by governments and companies in the extractive
industries and the need to enhance public financial management and accountability.
6. We recognize that achievement of greater transparency must be set in the context of respect for
contracts and laws.
7. We recognize the enhanced environment for domestic and foreign direct investment that financial
transparency may bring.
8. We believe in the principle and practice of accountability by government to all citizens for the
stewardship of revenue streams and public expenditure.
9. We are committed to encouraging high standards of transparency and accountability in public life,
government operations and in business.
10. We believe that a broadly consistent and workable approach to the disclosure of payments and
revenues is required, which is simple to undertake and to use.
11. We believe that payments’ disclosure in a given country should involve all extractive industry
companies operating in that country.
12. In seeking solutions, we believe that all stakeholders have important and relevant contributions to
make – including governments and their agencies, extractive industry companies, service
companies, multilateral organizations, financial organizations, investors and non-governmental
organizations.
Extractive Industries Transparency Initiative (2015b)

35
Appendix B: The Extractive Industries Transparency Initiative Requirements
1. Oversight by the multi-stakeholder group.
2. Legal and institutional framework, including allocation of
contracts and licenses
3. Exploration and production.
4. Revenue collection.
5. Revenue allocations.
6. Social and economic spending.
7. Outcomes and impact
8. Compliance and deadlines for implementing countries
Extractive Industries Transparency Initiative (2016b)

36
Appendix C: Extractive Industries Transparency Initiative Countries
Country Country Status Country Country Status
Albania Complaint Afghanistan Candidate
Burkina Faso Complaint Azerbaijan Candidate
Cameroon Complaint Colombia Candidate
Chad Complaint Dominican Republic Candidate
Cote d’Ivoire Complaint Ethiopia Candidate
Democratic Republic of Congo Complaint Germany Candidate
Ghana Complaint Honduras Candidate
Guatemala Complaint Madagascar Candidate
Guinea Complaint Malawi Candidate
Indonesia Complaint Myanmar Candidate
Iraq Complaint Papua New Guinea Candidate
Kazakhstan Complaint Peru Candidate
Kyrgyz Republic Complaint Senegal Candidate
Liberia Complaint Seychelles Candidate
Mali Complaint Tajikistan Candidate
Mauritania Complaint Ukraine Candidate
Mongolia Complaint United Kingdom Candidate
Mozambique Complaint United States of America Candidate
Niger Complaint Zambia Candidate
Nigeria Complaint
Norway Complaint Central African Republic Complaint but Suspended
Philippines Complaint Yemen Complaint but Suspended
Republic of the Congo Complaint
Sao Tome and Principe Complaint
Sierra Lone Complaint
Solomon Islands Complaint
Tanzania Complaint
Timor-Leste Complaint
Togo Complaint
Trinidad and Tobago Complaint
EITI (2016)
Globally 51 implementing countries have signed up with the EITI, with 31 fully compliant as at June 30, 2016. However, two complaint countries Central
African Republic and Yemen are suspended due to political instability and conflicts.

37
Appendix D: USEITI Listed sample companies for 2013
PERMNO
Ticker
Symbol Company Name
PERMNO
Ticker
Symbol Company Name S/N S/N
1 11850 XOM EXXON MOBIL CORP 26 34833 OXY OCCIDENTAL PETROLEUM CORP
2 12291 RNO RHINO RESOURCE PARTNERS L P 27 37234 FST FOREST OIL CORP
3 12786 VOC V O C ENERGY TRUST 28 47723 HNRG HALLADOR ENERGY CO
4 12903 SARA SARATOGA RESOURCES INC 29 50017 RRC RANGE RESOURCES CORP
5 13116 BCEI BONANZA CREEK ENERGY INC 30 59467 WLB WESTMORELAND COAL CO
6 13124 LPI LAREDO PETROLEUM INC 31 61487 AE ADAMS RESOURCES & ENERGY INC
7 13141 WPX W P X ENERGY INC 32 61815 NBL NOBLE ENERGY INC
8 13163 MEMP MEMORIAL PRODUCTION PARTNERS L P 33 61946 BKH BLACK HILLS CORP
9 13244 MTDR MATADOR RESOURCES CO 34 62341 PDCE P D C ENERGY INC
10 13356 PSX PHILLIPS 66 35 63765 SWN SOUTHWESTERN ENERGY CO
11 13928 COP CONOCOPHILLIPS 36 63781 UNT UNIT CORP
12 14026 JONE JONES ENERGY INC 37 64936 D DOMINION RESOURCES INC VA NEW
13 14134 OCIR O C I RESOURCES LP 38 75039 BHP B H P BILLITON LTD
14 14179 AR ANTERO RESOURCES CORP 39 75241 PXD PIONEER NATURAL RESOURCES CO
15 14541 CVX CHEVRON CORP NEW 40 75326 ACI ARCH COAL INC
16 15069 MRO MARATHON OIL CORP 41 75825 EOG EOG RESOURCES INC
17 19166 FMC F M C CORP 42 76082 COG CABOT OIL & GAS CORP
18 23835 MDU M D U RESOURCES GROUP INC 43 76127 TTI TETRA TECHNOLOGIES INC
19 25590 NFG NATIONAL FUEL GAS CO N J 44 76888 AXAS ABRAXAS PETROLEUM CORP
20 26470 EGN ENERGEN CORP 45 78186 PQ PETROQUEST ENERGY INC
21 27756 STR QUESTAR CORP 46 78877 CHK CHESAPEAKE ENERGY CORP
22 28118 NC NACCO INDUSTRIES INC 47 79159 CWEI CLAYTON WILLIAMS ENERGY INC
23 28345 MUR MURPHY OIL CORP 48 79444 SGY STONE ENERGY CORP
24 28484 HES HESS CORP 49 79915 NFX NEWFIELD EXPLORATION CO
25 32803 HFC HOLLYFRONTIER CORP 50 80926 CPE CALLON PETROLEUM CO DEL

38
Appendix D: USEITI Listed sample companies for 2013
PERMNO
Ticker
Symbol Company Name
PERMNO
Ticker
Symbol Company Name S/N S/N
51 81598 AGU AGRIUM INC 74 90494 BBG BILL BARRETT CORP
52 82196 DNR DENBURY RESOURCES INC 75 90533 WTI W & T OFFSHORE INC
53 84167 GEL GENESIS ENERGY L P 76 91081 LINE LINN ENERGY LLC
54 86223 EPD ENTERPRISE PRODUCTS PARTNERS LP 77 91100 ROSE ROSETTA RESOURCES INC
55 86759 KWK QUICKSILVER RESOURCES INC 78 91111 ETE ENERGY TRANSFER EQUITY L P
56 86799 CNX CONSOL ENERGY INC 79 91135 BTE BAYTEX ENERGY CORP
57 87137 DVN DEVON ENERGY CORP NEW 80 91283 HK HALCON RESOURCES CORP
58 87471 TGC TENGASCO INC 81 91376 ATLS ATLAS ENERGY L P
59 88818 ERF ENERPLUS CORP 82 91494 BBEP BREITBURN ENERGY PARTNERS L P
60 88871 MCF CONTANGO OIL AND GAS COMPANY 83 91739 LGCY LEGACY RESERVES L P
61 88882 UPL ULTRA PETROLEUM CORP 84 91983 CLR CONTINENTAL RESOURCES INC
62 88991 BTU PEABODY ENERGY CORP 85 91985 DEJ DEJOUR ENERGY INC
63 89016 STO STATOIL A S A 86 92215 EXXI ENERGY XXI LTD
64 89134 ECA ENCANA CORP 87 92239 CXO CONCHO RESOURCES INC
65 89509 XEC CIMAREX ENERGY CO 88 92375 VNR VANGUARD NATURAL RESOURCES LLC
66 89547 NRP NATURAL RESOURCE PARTNERS L P 89 92421 SD SANDRIDGE ENERGY INC
67 89858 PAA PLAINS ALL AMERN PIPELINE L P 90 92478 FOR FORESTAR GROUP INC
68 89901 WLL WHITING PETROLEUM CORP NEW 91 92530 CPN CALPINE CORP
69 90071 NRG N R G ENERGY INC 92 92621 IPI INTREPID POTASH INC
70 90386 MOS MOSAIC COMPANY NEW 93 93095 CLD CLOUD PEAK ENERGY INC
71 90444 ORA ORMAT TECHNOLOGIES INC 94 93152 CIE COBALT INTERNATIONAL ENERGY INC
72 90458 NEW NORTHWESTERN CORP 95 93420 OAS OASIS PETROLEUM INC
73 90492 WRES WARREN RESOURCES INC

39
Appendix E: List of companies invited to participate in 2015 USEITI report
S/N Company S/N Company
1 Alpha Natural Resources, Inc. 24 Fieldwood Energy LLC
2 Anadarko Petroleum Corporation 25 Freeport-McMoRan Inc.
3 ANKOR Energy LLC 26 Hess Corporation
4 Apache Corporation 27 Linn Energy, LLC
5 Arch Coal, Inc. 28 LLOG Exploration Company LLC
6 Arena Energy, LLC 29 Marathon Oil Company
7 BHP Billiton LTD 30 Newfield Exploration Company
8 BOPCO, LP 31 Noble Energy, Inc.
9 BP America 32 Oxy USA, Inc.
10 Chevron Corporation 33 Peabody Energy Corporation
11 Cimarex Energy Co. 34 QEP Resources, Inc.
12 Cloud Peak Energy Resources,
LLC 35 Repsol E&P USA Inc.
13 Cobalt International Energy, Inc. 36 SandRidge Energy, Inc.
14 Concho Resources, Inc. 37 Shell E&P Company
15 ConocoPhillips 38 Statoil Gulf of Mexico
16 Continental Resources, Inc. 39 Stone Energy Corporation
17 Devon Energy Corporation 40 Talos Energy LLC
18 Encana Corporation 41 Ultra Resources Inc.
19 Energy XXI 42 Venari Offshore LLC
20 EPL Oil & Gas, Inc. 43 W&T Offshore, Inc.
21 ENI Petroleum 44 Walter Oil & Gas Corporation
22 EOG Resources, Inc. 45 WPX Energy, Inc.
23 Exxon Mobil Corporation

40
Appendix F: Companies that participate in 2015 USEITI report
S/N Company
1 Alpha Natural Resources, Inc.
2 Anadarko Petroleum Corporation
3 ANKOR Energy LLC
4 Arch Coal, Inc.
5 Arena Energy, LLC
6 BHP Billiton LTD
7 BP America
8 Chevron Corporation
9 Cimarex Energy Co.
10 Cloud Peak Energy Resources, LLC
11 Cobalt International Energy, Inc.
12 ConocoPhillips
13 Devon Energy Corporation
14 Energy XXI
15 ENI Petroleum
16 EPL Oil & Gas, Inc.
17 Exxon Mobil Corporation
18 Freeport-McMoRan Inc.
19 Hess Corporation
20 Marathon Oil Company
21 Newfield Exploration Company
22 Noble Energy, Inc.
23 Peabody Energy Corporation
24 Repsol E&P USA Inc.
25 Shell E&P Company
26 Statoil Gulf of Mexico
27 Stone Energy Corporation
28 Ultra Resources Inc
29 Venari Offshore LLC
30 W&T Offshore, Inc
31 WPX Energy, Inc.
41
Appendix G: 2015 USEITI participating companies’ status
S/N Company Permno/Remark
Listed
1 Arch Coal, Inc. 75326
2 BHP Billiton LTD 75039
3 Chevron Corporation 14541
4 Cimarex Energy Co. 89509
5 Cloud Peak Energy Resources, LLC 93095
6 Cobalt International Energy, Inc. 93152
7 ConocoPhillips 13928
8 Devon Energy Corporation 87137
9 Energy XXI 92215
10 Exxon Mobil Corporation 11850
11 Hess Corporation 28484
12 Marathon Oil Company 15069
13 Newfield Exploration Company 79915
14 Noble Energy, Inc. 61815
15 Peabody Energy Corporation 88991
16 Statoil Gulf of Mexico 89016
17 Stone Energy Corporation 79444
18 Ultra Resources Inc 88882
19 W&T Offshore, Inc 90533
20 WPX Energy, Inc. 13141
Not Listed
1 Anadarko Petroleum Corporation Not listed
2 ANKOR Energy LLC Not listed
3 Arena Energy, LLC Not listed
4 BP America Not listed
5 ENI Petroleum Not listed
6 Freeport-McMoRan Inc. Not listed
7 Repsol E&P USA Inc. Not listed
8 Venari Offshore LLC Not listed
Listed outside the USA
1 Shell E&P Company AMS
2 EPL Oil & Gas, Inc. NASDAQ
Voluntary
reorganization/bankruptcy
1 Alpha Natural Resources, Inc. Subsidiary of Alpha Natural Resources, Inc. On
August 3, 2015, Alpha Wyoming Land Company,
LLC filed a voluntary petition for reorganization.

42
Appendix H: List of companies that did not Participate in 2015 USEITI report reconciliation
S/N Company Permno/ Remark
Listed
1 Oxy USA, Inc. 34833
2 EOG Resources, Inc. 75825
3 Encana Corporation 89134
4 Linn Energy, LLC 91081
5 Continental Resources, Inc. 91983
6 Concho Resources, Inc. 92239
7 SandRidge Energy, Inc 92421
Unlisted
1 Apache Corporation Not listed
2 BOPCO, LP Not listed
3 Fieldwood Energy LLC Not listed
4 LLOG Exploration Company LLC Not listed
5 QEP Resources, Inc Not listed
6 Talos Energy LLC Not listed
7 Walter Oil & Gas Corporation Not listed


![[Patrick W. Corrigan, David L. Penn] Social Cognit](https://img.pdfslide.us/doc/110x75/552be7155503468c0f8b45d5/patrick-w-corrigan-david-l-penn-social-cognit.jpg)