Embed Size (px)
Citation preview

#2013-020
Optimal patent length and patent breadth in an R&D driven market with evolving consumer preferences:
An evolutionary multi‐agent based modelling approach Salih Çevikarslan
Maastricht Economic and social Research institute on Innovation and Technology (UNU‐MERIT) email: [email protected] | website: http://www.merit.unu.edu Maastricht Graduate School of Governance (MGSoG) email: info‐[email protected] | website: http://mgsog.merit.unu.edu Keizer Karelplein 19, 6211 TC Maastricht, The Netherlands Tel: (31) (43) 388 4400, Fax: (31) (43) 388 4499
Working Paper Series
UNU-MERIT Working Papers
ISSN 1871-9872
Maastricht Economic and social Research Institute on Innovation and Technology, UNU-MERIT
Maastricht Graduate School of Governance
MGSoG
UNU-MERIT Working Papers intend to disseminate preliminary results of research
carried out at UNU-MERIT and MGSoG to stimulate discussion on the issues raised.
1
OPTIMAL PATENT LENGTH AND PATENT BREADTH IN AN R&D DRIVEN MARKET WITH EVOLVING CONSUMER PREFERENCES1:
AN EVOLUTIONARY MULTI-AGENT BASED MODELLING APPROACH
Salih Çevikarslan
UNU-MERIT, Maastricht
Department of Economics, School of Business and Economics, Maastricht University
March 2013
Abstract The aims of this paper are twofold. The first is to analyse the interaction between research and development (R&D) activities of firms and heterogeneous consumer preferences in structuring the evolution of an industry. The second is to explore the effects of patent life and patent breadth on market outcomes. To answer these research questions, an evolutionary, multi-agent based, sector-level cumulative innovation model is designed. The model addresses supply and demand sides of the market simultaneously with the co-evolution of heterogeneous consumer preferences, heterogeneous firm knowledge bases and technology levels at the micro level. In line with the evolutionary modelling tradition, we have a search algorithm-innovation and imitation of products by firms – a selection of algorithm-revealed preferences of the consumers – and a population of objects in which variation is expressed and on which selection operates: namely, firms (Windrum, 2004). Firms compete on quality and price of their products in an oligopolistic market whereas consumers, constrained by their computational limits, act to maximize their utility with their product choices in a boundedly rational way. There is continuous firm entry and exit depending on the competitive performance of the firms. Keywords: Patent; industrial dynamics; evolutionary economics; agent-based modelling JEL Classification: B52, L11, O34 E-mail contact: [email protected] [email protected]
1Acknowledgements: This study is based on the results of my ongoing PhD project. I gratefully acknowledge the eminent supervision by Bart Verspagen and the endless support on Laboratory for Simulation Development by Marco Valente. Usual caveats apply.
2
1. Introduction Use of patents for the sake of technological progress and wealth creation is a long lasting debate in economics. As a policy tool to intervene in a subject as complex as technology development, it is easy to understand why patents cause such controversy. It is a very compelling if not an impossible endeavour to isolate the effects of patents from those of other factors on policy targets due to severe interaction. Even if that is achieved, one should discriminate between short and long run effects and effects on different agents in a market. A patent is a form of intellectual property and it gives the patent holder the exclusive rights over an invention for a limited period. Until the patent expires, others are prevented from using this invention which gives the original inventor a temporary monopoly power to collect the returns to their investment in R&D. Thereby inventors are provided with the required financial incentives to continue with their technology development activities in exchange for the disclosure of the knowledge embodied in the patent. However, the use of patents as an incentive to engage in R&D is not costless to society. Granting exclusive rights to the patent holder creates a monopoly which introduces inefficiencies to market. Besides patents can be a serious impediment to further technological developments. Once the policy makers decide to set a patent system, the obvious following question will be how strong a patent system this will be. For how long will a firm be given monopoly power over its new invention? What is the range of products the competitors are prevented from using due to patent enforcement? Hence, what are the optimum patent length and patent breadth, respectively in order to realize the fastest technological and economical progress possible? These are the questions a patent authority should answer in designing a patent system. This study is an agent-based modelling (ABM) exercise to simulate the dynamics of an R&D driven sector and to observe the effects of patent length and patent breadth on market outcomes. Firms engage in innovation or imitation activities to compete in product markets. Heterogeneous consumers make the best possible purchases that fit best with their preferences. These preferences co-evolve with technology production by firms. Demand is differentiated and new products create new sub-markets loosely competing with the existing ones. ABM is the most frequently utilized technique in evolutionary settings (Grebel & Pyka, 2003). In case of innovation at industry level, we are exploring a highly decentralized dynamic search process under strong substantive and procedural uncertainty, where numerous heterogeneous agents search in parallel for new products/processes, but are interlinked through market and non-market interactions (Dawid, 2006). Several evolutionary modelling exercises in the literature repeatedly showed that ABM is capable of simulating such a platform where these peculiarities are successfully mapped into model designs. Furthermore, ABM is offering a platform for inter
3
and trans-disciplinary research, which is again congruent with the requirements of innovation studies. With agent-based modelling, we hope to stretch the trade-off between simplicity in modelling and the complexity of the socio-economic reality. There are a few advantages of this evolutionary model over the ones in the relevant literature. To begin with, it is one of the few models studying two patent dimensions (patent length and breadth) simultaneously from an agent-based perspective. Secondly, whereas most evolutionary models focus on process innovation, this one exclusively models product innovation, i.e. technical progress is embodied in products. The third is that firms compete both in the R&D process and goods market rather than in any one of them. Lastly, rather than single-product firms, the market is populated with multi-product firms which can serve to different niches of consumers concurrently. With the continuous introduction of new innovations, products transform from undiscovered to discovered and then from cutting edge product to obsolete. As the product space steadily shifts, the consumers are compelled to redefine their product choices within the given product range. The rest of the paper is organized as follows: Section 2 is a literature review on patents where the pros and cons of having a patent system, the concept of sequential innovation, the role of patents when innovation is sequential, and the effect of patent scope from an empirical and theoretical perspective are discussed. In section 3, the research topic is explained. Section 4 details the simulation model. In section 5, the results of the simulation analyses are discussed. Section 6 concludes. 2. Literature Review 2.1. Why do (should) we have patents? A strong rationale for patents is protecting innovators from imitators. By preventing imitators from selling goods embodying patented technologies, patent holders are given the exclusive rights to enjoy profits on their inventions either by commercialization or licensing their technologies. These temporary monopoly rents enhance the incentive for the innovators to engage in R&D activities. Patents also create incentives to disclose and trade technology so that others can use and build upon research results (Encaoua, Dominique, and Catalina, 2006; Gallini, 1992). Patent protection is justified by specific particularities of technical knowledge: non-rivalry and non-excludability. Knowledge has a non-rival character, which means that once an invention is known, everyone can use it with no additional cost. Non-excludability means once knowledge is created by an agent, others cannot be excluded from using it. Hence, technical knowledge is a source of externalities in R&D and traditional economic theory claims that patent protection is a possible remedy for this free-rider problem (Encaoua et al., 2006; Vallée & Yildizoglu, 2006).
4
2.2. Why shouldn’t we have patents? Creating monopoly rents for the patent holder is a costly endeavour for society. The monopolist’s profit maximizing price will be higher than welfare maximizing price for the society and this will create a deadweight loss. We can add to this loss the costs of bureaucracy (strongly increased during the recent patent surge), court personnel and lawyers. This means a large amount of financial resources diverted from the innovation process itself (Encaoua et al., 2006). Patent rights advocates argue that this static deadweight loss is more than compensated in the long run with faster technological progress due to stronger incentives to do R&D. Hence, one should discriminate between short-run and long-run effects of patents on market outcomes (Bessen & Maskin 2009). A specific patent policy constitutes a trade-off between encouragement of prior innovation and reduction of incentives for subsequent research. Before the patent is granted, there is every incentive to compete in the patent race as the reward is still there waiting for the winner. But once the race is over and one of the competitors is granted the patent, others are discouraged to continue R&D, since the next innovation may infringe the previous patent. Some studies (e.g. Heller & Eisenberg, 1998) emphasize the negative effects of patenting initial inventions on subsequent innovations (building patent fences around discrete innovations constituting patent thickets), while others endorse stronger protection of early innovators who opened new fields of research (see, for example, Kitch (1997) and the critiques in Merges and Nelson (1990)) (Koo & Wright 2003; Vallée & Yildizoglu, 2006). That a firm is exploiting intellectual property rights (IPR) invariably raises the costs that other firms incur when trying to access and utilize existing knowledge (Dosi, Marengoa, and Pasquali, 2006). Alongside, patent races create some duplication of resources and they are much more oriented to creating substitutes than complementary goods, which poses a coordination problem (Eswaran & Gallini, 1996). Teece (1986) states that profits from innovation depend upon the interaction of three families of factors, namely: appropriability regimes, complementary assets, and the presence or absence of a dominant paradigm. Appropriability conditions, in addition to patent and copyright protection, include secrecy, lead times, costs and time required for duplication, learning, sales and service assets. Apart from profiting from innovation, according to Dosi et al. (2006), evidence suggests that, first, appropriability conditions are just one among many (possibly a second order one) determining the propensity to innovate. The relative importance of the various factors and their interaction is highly sector and technology specific. The rates of innovation, they suggest, fundamentally depend on paradigm-specific opportunities rather than on mere appropriability conditions (at least above some threshold) and even less so on the specific subset of appropriability devices represented by legal IPR protection. They also add that the differential ability of individual firms to economically benefit from innovation stem from idiosyncratic organizational capabilities.
5
Levin, Klevorick, Nelson, and Winter (1987) reports that patents are by and large viewed as less important than learning curve advantages and lead time in order to protect product innovation and the least effective among appropriability means as far as process innovations are concerned. As a follow-up study, Cohen et al. (2000) found that firms protect profits due to invention with a range of mechanisms, including patents, secrecy, lead time advantages and the use of complementary marketing and manufacturing capabilities. Patents are generally the least emphasized among these mechanisms by firms in the majority of manufacturing industries, and secrecy and lead time tend to be emphasized most heavily. For the protection of product innovations, secrecy now appears to be much more heavily employed across most industries than previously. When secrecy is a feasible means of protection and the cost of imitation is high, first mover advantages and network externalities are emphasized (Encaoua et al., 2006). Pharmaceuticals and other fine chemical products are exceptions to this general trend, but the above is true for firms in the computer, semiconductor, and aircraft industries. A number of industries with relatively slow technological progress also reported that patents were not particularly effective for them (Mazzoleni & Nelson, 1998). However, there are two important points any empirical study should take into account in that regard. The first is that the case can be completely different for large firms with an established presence in their product markets and thus having access to the complementary assets needed to commercialize the end-product of their innovative efforts than it is for a small firm which cannot benefit from a head start or timely establishment of an effective production and sales program, or rapid movement down the learning curve, unless there is some way of holding off the large competitors like patenting. For such firms patents can be used either as a means to appropriate returns through licensing or as a means to maintain control of the technology while a production and sales capability is established. The second point is whether the prospect of patents motivates firms and other organizations outside of a particular industry to undertake inventions which would be used inside that industry (Mazzoleni & Nelson, 1998). Some studies (e.g. Jewkes, Sawers and Stillerman, 1969) have reported the importance of such outsiders to technical advance in a number of industries. For these industry outsiders without the complementary assets needed to appropriate the returns from innovation by being first to market or by rapidly moving down the learning curve, a patent may be essential to create incentives to invest in R&D. Once a strong patent is gained, such a firm can bargain a joint venture or a license deal with a firm that has production and market capabilities (Teece, 1986). In many areas of technology the role of patents has fundamentally changed recently. Kash and Kingston (2001) links the recent explosion in patent applications to their growing use as bargaining chips for cross-licensing issues rather than as providers of the limited monopoly control. Patenting is also used for other strategic reasons like constructing patent fences around discrete inventions and the prevention of suits. Cohen, Nelson, and Walsh (2000) finds that in "discrete" product industries, such as chemicals firms appear to use their patents commonly to
6
block the development of substitutes by rivals whereas in "complex" product industries, such as telecommunications equipment or semiconductors, firms are much more likely to use patents to force rivals into negotiations. 2.3. Sequential Innovation When innovation and imitation is sequential, each successive invention builds on its predecessors. In such a situation, innovation may be very valuable because it has spillover benefits for future innovators. Patent protection which is a necessity in a static world, since the prospect of being imitated inhibits inventors otherwise, becomes less important in a dynamic world with sequential innovation and imitation where imitation can provide benefit to both the original inventor and to society more generally. For industries like software and computers theory suggests that imitation may promote innovation and that strong patents (long-lived patents of broad scope) might actually inhibit it. Imitators may exploit the original innovation to develop valuable ideas not readily available to the first inventor. Then, the first inventor may come up with a new innovation based on these new ideas. If this cumulativeness is impeded by the presence of patents, the pace of innovation may slow down (Bessen & Maskin, 2009). If the first generation invention falls into the category of “essential facilities” in the sense that there is no possibility to invent around them to proceed with further research (e.g. basic discoveries, genetic material and research tools), patenting may even block new lines of research (Encaoua et al., 2006). Nordhaus’s (1969) patent protection model with a single, isolated invention predicts that stronger patents will induce more investment in R&D. This model falls short of explaining innovation processes particularly in high technology sectors experiencing rapid technological change. Modern models of innovation expand upon this framework by recognizing that innovation is a cumulative process that builds upon previous discoveries. While stronger patents provide the patent holder with the means to “hold up” future innovations by threatening to litigate infringers, they also increase the possibility of the patent holder being held up by previous innovators. In this setting, the link between patent strength and innovation incentives is ambiguous. When innovation is cumulative, they acknowledge that follow-on researchers (as well as pioneers) respond to changes in patent policy. Extending the single-invention model to incorporate these features can overturn fundamental predictions of the basic model (Gallini, 2002). When innovation is sequential and complementary, imitation becomes a spur to innovation, while strong patents become an impediment. Bessen & Maskin (2009) conclude that even if the initial rents earned by an innovator in the absence of patents may be lower than with patents, the benefits that accrue to him when he is allowed in his turn to build around the next innovation made by a competitor may outweigh the current loss.
7
2.4. Patent Scope Within the context of this paper, patent scope refers to patent length and patent breadth. Patent length is the time period between a patent is granted and it terminates when its statutory life is over and patent breadth is the degree to which a product or process must differ from a patented one to avoid infringement of the patent. (Hunt, 2004). Patent offices grant patents to inventions complying with the patentability criteria of industrial application, novelty, and inventive step (Encaoua et al., 2006). The scope of the claims of a patent determines the ‘monopoly power’ of the patent holder (Merges & Nelson, 1994). Dosi et al.(2006) claims that a positive and uniform relation between patent scope holds only for a specific (and highly disputable) representation of markets, their functioning and their “failures”, on the one hand, and of knowledge and its nature on the other. Merges and Nelson (1990) shows that a stronger patent system can have very different effects on different industries distinguishing four classes of technologies in which the role of patents can be strongly contrasted: discrete inventions (new pharmaceuticals), cumulative technologies (aircraft), chemical technologies and science-based technologies (biotechnology). Whereas several studies have analysed the role of patent scope in the design of an optimal patent system (Green & Scotchmer, 1995; Chang, 1995; O’Donoghue, 1998), the implications of patent length itself in the context of a competitive dynamic research sequence have been relatively neglected (see Gallini (1992) for an exception). Patent with finite life has been insufficiently appreciated in the current literature (see Nordhaus, 1969 for an exception, Koo & Wright, 2003). This paper exactly targets this gap by concentrating on the implications of patent length and patent breadth for several market outcomes within the context of a dynamic R&D driven market with sequential innovation, heterogeneous firms and ever-changing consumer preferences (O’Donoghue, Scotchmer, and Thisse 1998). Dosi et al. (2006) suggests that appropriability is likely to display a threshold effect; a minimum degree of appropriability is necessary to motivate innovative effort, but above such a threshold further strengthening of appropriability conditions will not bring further increases of R&D investments and rates of innovation. Rather, social inefficiencies such as “anti-commons” effects- in which people underuse scarce resources because too many owners can block each other (Heller & Eisenberg, 1998)-, rent seeking behaviours, dissipation of quasi-rents into litigation etc. are much more likely to emerge. There seems to be no clear evidence of a positive relation between the tightening of IPR regimes and the rates of innovation. The software industry in the United States presented itself as a natural experiment in the 1980s and 1990s. Patent protection for computer programs was significantly strengthened by several court decisions. Evidence suggests that the firms that acquired most of these patents actually reduced their R&D spending relative to sales (Bessen & Hunt, 2004).
8
In an international analysis of the relationship between patent strength and innovation, Lerner (2001) examines 177 policy shifts in 60 countries over 150 years. Patent strength is measured by four features: a) whether protection existed in whole or in part for important technologies; b) the duration of the patent; c) the patent fee; and d) the existence of various limitations on patent awards (for example, compulsory licensing). The dependent variable is the growth of patent applications by residents in the country and the independent variables include a dummy variable on whether the policy change is protection enhancing or reducing and the strength of protection prior to the change, among other controls. Lerner finds some support for an “inverted-U” relationship between patent strength and innovation. That is, strengthening patents has a positive effect on innovation if protection is initially low and a negative impact if patent protection is initially high (Gallini, 2002). In their essay on the effects of the scope of a patent, Merges and Nelson (1994) argues that this depends on the topography of technical advance in a field, in particular on how inventions are linked to each other, and in the extent to which rapid technical advance requires a diversity of actors and minds, as contrasted with being facilitated by express coordination of inventive activity. They examined technical advance in several different fields, with a focus on how patents influenced the pace and quality of development. They conclude that allowing and enforcing broad patent claims tends to hinder technical progress. From a theoretical point of view, the standard analysis of optimal patent life is based on the Nordhaus (1969) model of an independent, stand-alone innovation that reduces the production cost of a consumer good. A finite optimal patent life balances the gain in size of the cost-reducing innovation from an increased period of monopoly granted by the patent against the associated deadweight loss from higher cost to consumers due to an extension of the period in which royalties must be paid. However, this model assumes no competition in the innovation process (Koo & Wright, 2003). Gallini’s (1992) model with positive imitation costs predict that an increase in patent life over some range may have no effect on or paradoxically may reduce both R&D activity and the incentive to patent. The explanation is that increasing the length of patent protection gives rivals a greater incentive to imitate (invent around) a patented product: the longer the patent life, the longer rivals must wait to use the technology. Increasing patent life increases the number of competing products, thus reducing any added incentives to research and to disclose the innovation that typically result from longer patent protection. These effects have implications for optimal patent policy. When the length of patent protection is the only tool of patent authorities, she shows that optimal patent life is generally short to discourage imitation. When the patent policy is extended to include both patent life and patent breadth, social surplus is maximized when patents are broad (no imitation) and patent life is adjusted to achieve the desired patent reward. She adds that her results contrast sharply with those of Tandon (1982), Gilbert and Shapiro (1990), and, to some extent, Klemperer (1990), in which narrow, infinitely long patents are optimal and explains
9
this with the increasing costly imitation that displaces the patentee's output as patent life increases. The previous literature noted here considers market situations in which imitation, while constraining the innovator's profits, never occurs in equilibrium for any patent life. Winter (1993) uses a simple evolutionary model of innovation and imitation to compare the properties of the dynamics of a simulated industry with and without patent protection. They show that the total surplus is lower under the patent regime than under the non-patent one and the non-patent regime yields significantly higher total investment in R&D and produces higher best practice productivity. In their 1998 study, O’Donoghue et al. observe that the profitability of R&D depends on the effective patent life, and that effective patent life is determined not only by statutory patent life but also by patent breadth. They ask the question whether patents should be long-lived but narrow, so that they effectively expire at an endogenous time when a better product is made or they should be relatively broad but short-lived, so that the effective patent life coincides with the statutory patent life. They find that the two policies are not equivalent, even if both lead to the same rate of innovation. To sustain a given rate of innovation, the effective patent life in the first policy must be longer than the effective (statutory) patent life in the second policy, which exacerbates the inefficiencies due to market power (O’Donoghue et al., 1998). Vallée and Yildizoglu (2006) claim that the main results are generally too strongly sensitive to the rational expectations (or perfect foresight) assumption and to the assumed homogeneity of the firms for the patent race models. Alternatively, they develop an evolutionary model of industry dynamics in order to carry out a richer theoretical analysis of the consequences of a stronger patent system. Their results do not favour the case for a stronger patent system: higher social welfare and technical progress are observed in their model in industries with milder patent systems (lower patent height and patent life). Marengo, Pasquali, Valente, and Dosi (2009) develops a model of product innovation and industry evolution in complex product industries and shows that strong patent regimes are likely to hinder rather than foster innovation. Their results are driven by two major properties of technologies and markets for complex products. First, both innovative and imitative search are costly and difficult, with complementarities and interdependencies among components putting heavy constraints on possible search paths. If many of these possible paths are blocked by patents, very few opportunities for further innovation might be left open. Second, competition in these complex product spaces typically proceeds through the creation of sub-markets: demand is heterogeneous and firms can diversify products by offering different combinations of components and characteristics. Competition is not a winner-takes-all process, but is mainly a never ending creation of new sub-markets. They conclude that that product complexity is a key factor determining the long run efficiency or inefficiency of the patent system.
10
3. Research Topic The patent literature concludes that a patent system entails several trade-offs. A strong patent regime provides the necessary incentives to do more R&D, because firms know that they can capitalize on their innovations. On the other hand this protection may lead to overly concentrated markets or even monopolies which create static inefficiencies. Monopoly pricing which is made possible by strong patents means higher costs and hence decreased utility for the consumers. This literature also suggests that if innovation is sequential the results achieved by models of single, isolated innovations overturn. Strong patents turn into an impediment rather than a spur to innovation. Patent authorities determine the patent scope to strike a balance between the benefits and costs of having a patent system. This paper analyses how market outcomes are conditioned by patent scope. One will observe how patent scope determines the extent of monopoly power of the market leader, hence concentration rate and market sharing between innovators vs. imitators, the pace of technological progress and wealth creation in the market. With this aim, firstly the model will show how firms and consumers interact in the market environment and how this interaction leads to technological progress. Firms compete on price and quality of their products and they engage in innovation and imitation activities to increase their quality. Consumers shift their preferences towards higher quality products as technology progresses. Firms reaching higher quality levels on the quality ladder earlier than their competitors gain a competitive edge in the market. Buyers are heterogeneous and markets are segmented. . 4. The Model This is an agent-based model, agents being firms and consumers. The agents follow pre-specified heuristics (e.g. innovation routines, marketing expenses, product purchases) and react to competitors and environmental conditions (e.g. pricing) and the interactions between these agents at the micro level determine macro outcomes. The model will show how these outcomes are conditioned by the parameters of interest. Firms pick a price for their goods and put them on the market for consumers’ purchase. To make their products visible to potential buyers they make some marketing expenses. Consumers sample a few products and compare them with their previous experiences to buy one that fits best with their preferences. A part of the revenue raised with product sales finances firms’ R&D activities. In accordance with its strategy a firm makes either an innovation or imitation to add a new product to its portfolio. An innovation is granted a patent if it meets the criteria imposed by the patent authority. Depending upon their competitive performances goods and incumbent firms leave the market leaving their places to new generation of goods and newcomer firms, respectively.
11
4.1. Technology Space Each product and technology (knowledge) embodied by this product is labelled by an integer number. The words “product”, “quality” and “technology” will be used interchangeably in the following. A bigger number corresponds to a higher quality product and a better technology. The units digit of this number shows the version of the product while the rest of the number shows the class the product belongs to. As an example, the number 23 refers to the third version of the second class of products. Hence, each class consists of ten versions. A class is significantly different from any other in terms of its technological level whereas there are only incremental differences between versions in this regard. Products high on the quality ladder (Grossman & Helpman, 1991a; 1991b) -products belonging to higher classes or higher versions within a given class- are intrinsically better than the lower ones. The distance between the highest version in a given class and lowest version in a consecutive higher class is a parameter of the model and there are no defined products in between. Hence the technology space resembles an infinite series of quality ladders on top of each other, each ladder stands for a technology class and each step for a version, and a move from one class to the next requires a jump between the ladders which is only possible with a radical innovation. 4.2. Demand and Supply Structure Firms compete on quality and price of their differentiated products in an oligopolistic market. There are no production quantity constraints on the firms and all demand is satisfied in every period, there is no stock accumulation or unsatisfied demand. The production cost of a product is linearly related with its quality. Price is initialized as a mark-up over cost and this is the minimum price allowed, which means that sales of a product always bring positive profits and ceteris paribus higher quality products mean higher profits. Pricing strategy is a dynamic mark-up heuristic through which firms decide price of each good every period as a function of quality of and profits from that product. Specifically, the proportional change in price is a linear function of the proportional change in the profits on that product in the last two periods. The responsiveness of price to a change in profit is smoothed by a parameter s . A product with no sales in the last but one period is priced at its initial price.
( ) ( )C n mq n ( 4.1)
( ) (1 ) ( )p n C n (4.2)
( , 1) ( ) ( ( )(( ( , ) ( , 1)) / ( , 1)))p n t p t s p t n t n t n t (4.3)
where ( ) :C n cost of product n
:m cost multiplier ( ) :q n quality of product n
( ) :ip n initial price of product n
12
: mark-up rate
( , ) :p n t price of product n at time t
s : smoothing parameter ( , )n t :profit on product n at time t If a product’s average market share over a specific number of periods is below a threshold level, it is deleted from the market. A firm with no products to sell goes bankrupt. Every period a single firm enters the market as an exact copy of an already existing firm, except for its innovation strategy that is randomly determined. The firms that are copied by the new entrants are selected among the firms below a certain market share. This seems a reasonable approximation of reality because in practice most firms start small (de Wit, 2005; Dunne, Roberts, and Samuelson, 1988). Consumers have what we call a memory set which consists of a number of goods selected among all the products the consumer considered to buy in the previous periods. This selection is based on the utility level the product would bring to the consumer in case of a purchase. At every period, the consumer checks whether the products in the memory set are still provided by the market. If any of them is removed from the market, it is replaced by a new randomly selected product. Again at every period, consumers randomly sample a number of products from randomly selected firms. The probability that a product is selected is proportional to the marketing expenses by the firm on that product. A constant share of the last period’s revenue, which is equal for each firm, is spent on marketing activities to make goods visible to the consumers and this marketing budget is shared among products according to their quality level. Specifically, the visibility of a good is the average of the marketing expenses on that good for the last five periods. Price is initialized as a mark-up over cost, which is a linear function of quality, and this is the minimum price allowed. Hence higher quality products bring higher profits and this is why goods consume a share of marketing budget in proportion to their quality. The newly selected product is compared with the current minimum utility promising product in the memory set and replaces this if it corresponds to a higher utility level for the consumer. Out of this dynamically structured memory set, the good that brings the highest utility is chosen to buy in every period. There are no income constraints faced by the consumers. This product selection heuristic is a decent representation of the basic evolutionary processes of reproduction-keeping the highest utility promising products from the previous periods-, selection-choosing among products to maximize utility-, and variation-a continuous and random selection of new products-. The existence of a memory set and the peculiar way products become visible to the consumers enable us to model brand loyalty and advertising effects, respectively (Malerba, Nelson, Orsenigo, and Winter, 1999).
13
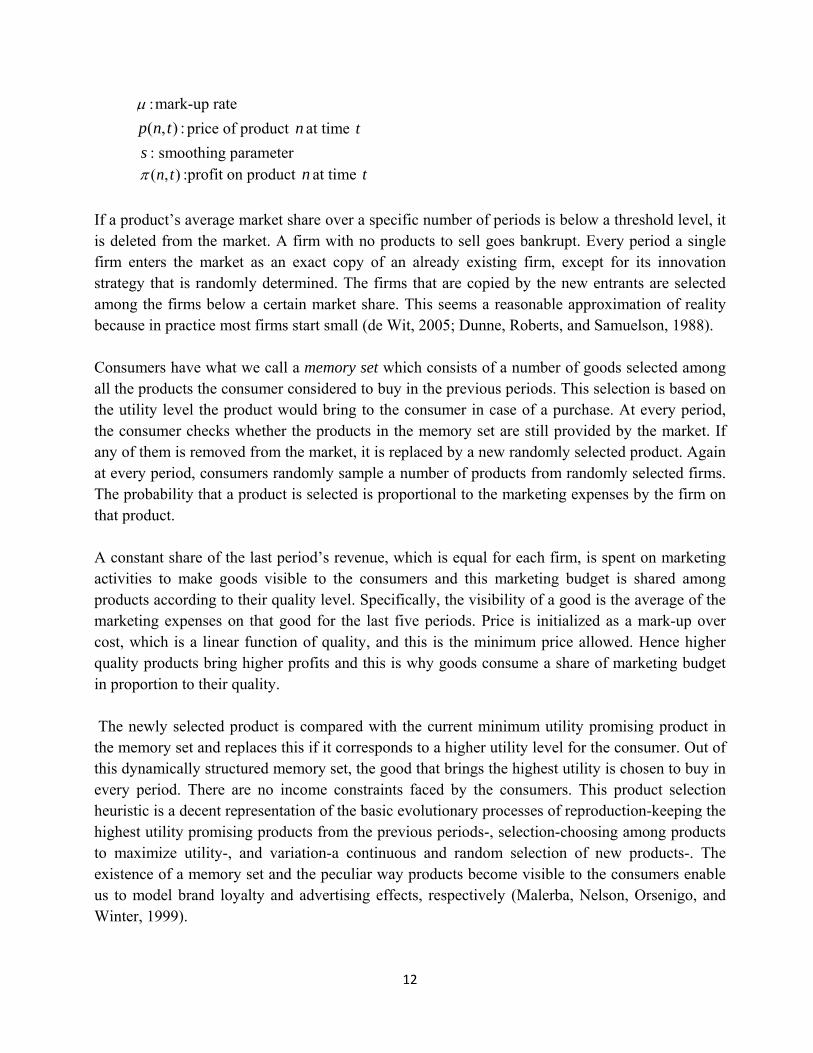
Utility is a positive function of the quality and a negative function of the price, and the distance between product’s profile and idiosyncratic ideal good specific to each customer profile (Marengo & Valente, 2010). At the outset, the consumers position themselves within the available technology space into consumer profiles or let us say, submarkets. The number of submarkets is constant and each submarket corresponds to a point in the technology space between current minimum and maximum quality levels. The total number of consumers is uniformly distributed
Figure 1. A histogram showing the uniform distribution of the customers’ ideal product profiles within the available technology space
into these submarkets and this relative positioning somewhere between the minimum and maximum available technology level in the market is constant through the simulation run. Figure 1 exemplifies this distribution. This formulation allows one to model heterogeneity in consumer preferences; consumers consist of early adopters with a strong preference for high-tech goods, low-price lovers who are content with low quality goods and the ones seeking a balance between price and quality. As technology develops-the level of minimum and maximum available technology improves-, preferences shift towards higher quality products increasing the quality of the ideal type good for each consumer. The fact that homogeneous consumers are populating submarkets can be interpreted either as there are as many consumers as the number of submarkets and each of these consumers is making a group buying every period or the submarkets consist of a number of homogenous consumers buying the very same product.
( , , ) [ { ( ) mod( ( ),10)} mod( ( ),10)] ( , ) | ( ( ) ( , ) |iU n k t r q n q n q n p n t q n q k t (4.4)
min max max( , ) ( ) ( )( ( ) ( ))iq k t q t u k q t q t (4.5)
14
where ( , , ) :U n k t utility of good n for customer k at time t r :radical innovation constant mod( ( ),10)q n : ( )q n mod 10
( , ) :iq k t ideal good profile for consumer k at time t
min ( ) :q t minimum quality level at time t
max ( )q t :maximum quality level at time t
( ) :u k a random pick from a uniform distribution between 0 and 1 for each customer at the
outset
The first part of the utility function in the square brackets gives the positive utility derived from the quality of the product. This part is separated into two dimensions: the class that the product belongs to, as given by the part in the curly brackets, and the version of the product within that class which is represented by the unit digit of the product quality number. This separation between class and version of a product in utility terms requires us to use modular operation. Modular operation finds the remainder of division of one number by another. To give an example, A mod B can be thought of as the remainder, on division of A by B. The divisor (B in our example) in our case is 10, because there are exactly 10 versions within each class. A distinction is made between the class and version of a product since consumers attach different levels of values to these dimensions. Consumers care more about the class of a product rather than its version within a given class. This distinction is operationalized by the parameter r . The parameter r is defined as the radical innovation constant and determines, ceteris paribus, by how much two consecutive versions in different classes differ from each other compared to two consecutive versions in the same class in utility terms. To put it another way, r indicates by how much the first version in a class is evaluated better than the last version in a lower class in comparison to one version is evaluated higher than a one degree lower version in the same class holding all else constant. The higher r the higher is the possibility that higher class products will be preferred over lower class products. r 1 presents a special case where there is no more a distinction between the class and the version of a product. Under such a circumstance it will take longer for the inferior products to be eliminated, product range will increase and technological change and hence wealth creation will slow down, since consumers no more put a premium on radical innovations. The price of a product appears in the utility function with a negative term. The last part of the utility function in the absolute terms gives the negative utility due to consuming a non-ideal product. This form of the utility function allows one to model heterogeneity in consumer tastes with the inclusion of the distance of the candidate product from the ideal one and to model the process whereby products transform from non-invented to invented and from cutting-edge to obsolete in time with a continuous shift of preferences towards higher quality products as
15
explained in the preceding paragraph. This process is especially accelerated with an r value higher than 1. 4.3. Innovation and Imitation Innovation is defined as the emergence of a new product. The firm chooses a product to invest in from its portfolio and does R&D. The quality level of this product also shows the knowledge base of the firm in that specific project. Innovation size is modelled as a random pick from a Poisson distribution with an arrival rate which is a function of the quality of the product invested in and the R&D budget devoted to that project (Minniti, Parello, and Segerstrom, 2008). The arrival rate is a negative function of the quality of the product to invest in: complexity of the product decreases the likelihood of the research success. And there are diminishing returns to R&D; additional investments increase the arrival rate in a decreasing manner. Hence, a lower level for the complexity of the knowledge base and more R&D investment increases the size of an innovation. A share of the last period’s revenue is allocated to R&D every period. This share, which is limited between a maximum and minimum level is a function of the patent policy and market share of the individual firm. The longer an invention is protected by a patent (the higher the patent length) and the wider the range of products the competitors are prevented from using (the wider the patent breadth) the higher the maximum R&D share a firm is ready to spend. If a firm knows that its competitors will be prevented from using a wider range of products once it is granted a patent and that patent rights will be protected for a long period, it will increase its R&D expenses out of its revenues. The actual R&D intensity within these limits is inversely related with the market share of a firm. If a firm controls a significant share of the market, it will feel less threat from its competitors and cut down its R&D budget. Smaller firms are more aggressive in doing R&D. A negative relationship between firm size and R&D intensity is confirmed by many empirical studies in the literature (Ortega-Argilés & Brandsma, 2010; Akcigit, 2009; Stančík & Biagi, 2012).
When innovation occurs, the resulting difference (the size of the innovation) is added to the chosen product’s technology level. A new product embodying a new technology and a higher technology base emerges. If the newly innovated product is in a higher class, then we have a radical innovation. Otherwise we have an incremental innovation. Depending on the radical innovation constant ( r ) parameter value, radical innovations may render old technologies in the market obsolete whereas incremental ones do not have such an impact. Hence a radical innovation may disturb the profit stream from the lower-class products which means that a firm can cannibalize its own products. This feature is introduced to the model with the specification of the utility function whereby higher-class products will have a market stealing effect on the lower-class products. In the case of a radical innovation, the size of the innovative step is large enough to cover the sum of the distances between the knowledge base and cutting edge technology in the respective class
16
and the distance between two consecutive classes where no products are defined. The size of an innovative step is limited to a maximum of one radical innovation at a time. When there is a radical innovation, the newly innovated product will be allowed at most to be the lowest version in the new class and nothing higher. This constraint negates the possibility that the knowledge base achieved in the previous class helps explore the technology space of the new class of products. If the resulting innovation appears to be in the interval between two classes where no products are defined, then the innovation project is assumed to fail.
( , , )( , , )
( )
R n i tn i t
q n
(4.6)
( , , ) ( )n i t Pois (4.7)
(4.8)
where ( , , ) :n i t innovation arrival rate for product n of firm i at time t
( , , ) :R n i t R&D investment of firm i in product n at time t
: innovation productivity parameter : innovation size, a random pick from a Poisson distribution with arrival rate ( ) :q n quality level of the innovated product
Imitation is defined as creating an exact copy of another firm’s product. Once the product to invest in is chosen within a firm’s own portfolio, the firm determines the expected size of the imitative step given its R&D budget and base technology. Then, it searches through the product sets of other firms to find this prospective target product. If this product is not innovated yet or not extant anymore, the firm seeks for a one step lower technology. If needs be, the firm repeats this search cycle with the next base product. After this search process is over, if no viable imitation projects can be determined, idle R&D budget is transferred to the R&D budget of the next period. The size of the imitative step is modelled with the same function given for innovation projects except for the fact that R&D investment is more productive in imitation than in innovation. If imitation succeeds, –the imitative step is at least as large as the distance between the base product and the target product- the end result of the project can only be the target product itself and nothing else. Even if the imitative step is bigger than the difference in the technology levels, the firm will be assumed to achieve the target quality, but no higher.
( , , )( , , )
( )
R n i tn i t
q n
(4.9)
( , , ) ( )n i t Pois (4.10)
( ) ( )q n q n (4.11)
where ( , , ) :n i t imitation arrival rate for product n of firm i at time t
( , , ) :R n i t R&D investment of firm i in product n at time t
( ) ( )q n q n
17
: imitation productivity parameter
: imitation size, a random pick from a Poisson distribution with arrival rate ( ) :q n quality level of the imitated product
A firm is either an innovator or imitator from the beginning and stays as such throughout the simulation. Every firm engages in one R&D project at a time and in picking R&D projects, they pursue a technology-push strategy. They select R&D projects starting from the highest technology base they possess to come up with cutting edge technology possible. The financial resources required to imitate a product are lower than to innovate one and the chance of success is higher. However, the profits especially from a new-to-the-market innovation are higher compared to an imitated product for which the market is already satisfied at least to some degree. 4.4. Patenting If a newly innovated technology is not patented before, it is eligible for being granted a patent. The technologies within the range defined by the patent breadth are also patented by the innovator if these technologies are not patented in advance. Patent breadth is symmetrical around the innovated technology. To exemplify, if patent breadth is 1, the two technologies (one step higher and one step lower than the innovated one on the quality ladder) around are also patented by the innovator together with the innovated product itself if these products are not patented before. From the time a patent is granted until it expires (patent length), competitors are not allowed to use these technologies either for selling or using in their R&D projects. The competitors are allowed to own a patented technology by innovation, imitation or new entrants can inherit this technology as exact copies of the patent holder. But a patent prevents the competitors from using these technologies. 4.5. The Pseudo-Code of the Model At the initialization period market is populated with N firms each either as an innovator or imitator with a random product portfolio. The maximum R&D intensity which is constant for all firms is determined as a function of the patent policy. The minimum R&D intensity is also constant for all firms. The routine for the rest of the simulation is implemented as follows: 1. Firms set a price for their each product as a function of profits from that product in the previous
periods 2. Firms make marketing expenses for their each product as a function of the quality 3. Patents with an age over the patent life die 4. Each consumer determines her ideal product 5. Consumers sample a few random products, structure their memory sets and purchase the best product within this set
18
6. Products with an average market share below a threshold level are deleted from the market. Firms with no products to sell leave the market. New firms enter
7. Firms compute their R&D intensity as a function of their market share 8. Each firm either innovates or imitates. 9. Both innovators and imitators check with the patent office to see whether their inventions are
protected by an active patent. Innovators check with the patent office to see whether they can get a patent on their invention
5. Simulation Results 5.1. Model Dynamics The results of the simulation analysis will be presented within this section2. The data for the analysis is produced as an average over 100 simulation runs of 1000 steps with a patent length of 30 and a patent breadth of 1. The only thing that changes from one simulation to the other is the seed value which is a number used to initialize the pseudorandom generation process. This seed value governs all the stochastic processes within the model and two simulations with the same seed value always give the very same results. We start with introducing the evolution of the main variables of interest in the model to answer our very first research question: how R&D activities of firms and heterogeneous consumer preferences interact in structuring the evolution of an industry.
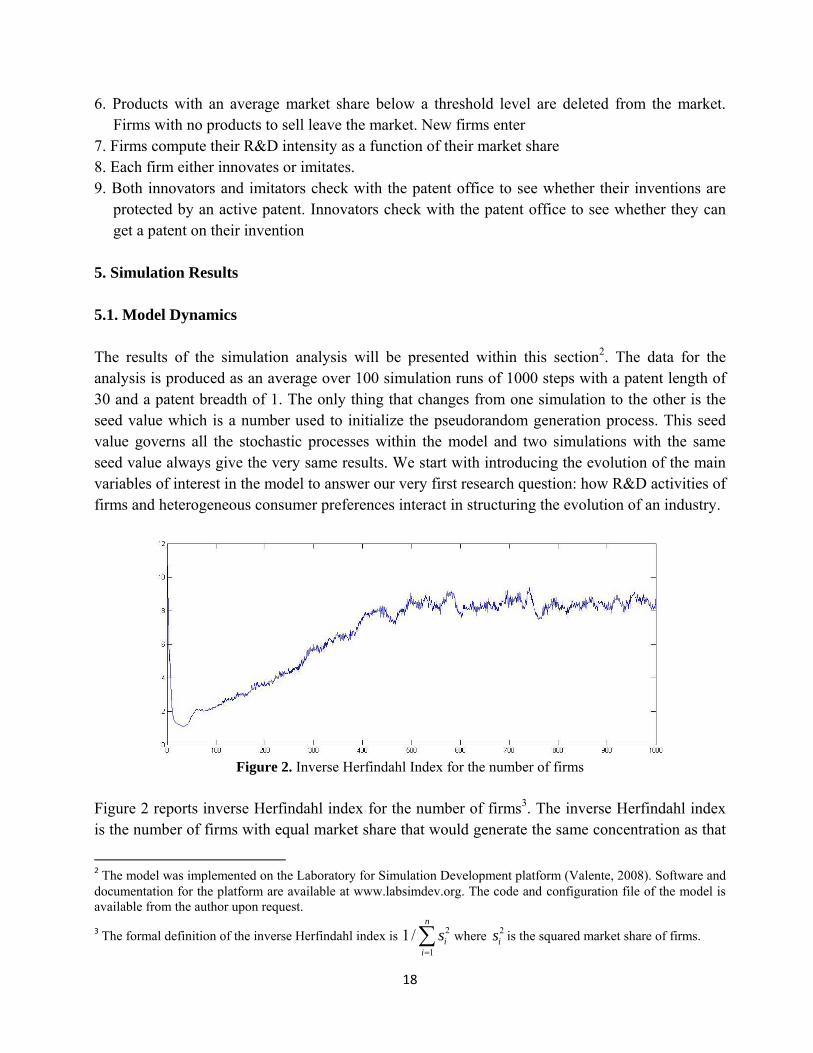
Figure 2. Inverse Herfindahl Index for the number of firms
Figure 2 reports inverse Herfindahl index for the number of firms3. The inverse Herfindahl index is the number of firms with equal market share that would generate the same concentration as that
2 The model was implemented on the Laboratory for Simulation Development platform (Valente, 2008). Software and documentation for the platform are available at www.labsimdev.org. The code and configuration file of the model is available from the author upon request.
3 The formal definition of the inverse Herfindahl index is 2
1
1/n
ii
s where 2
is is the squared market share of firms.
19
measured in the actual market, consequently measuring the dispersion (or inverse of concentration) of the market (Marengo & Valente, 2010). Figure 2 signifies a severe shake-out of firms from the beginning of the simulation run until the figure reaches its lowest value when the market concentration is at its maximum. This is followed by dispersion where a higher number of firms share the market creating a more competitive environment and stabilization for the following
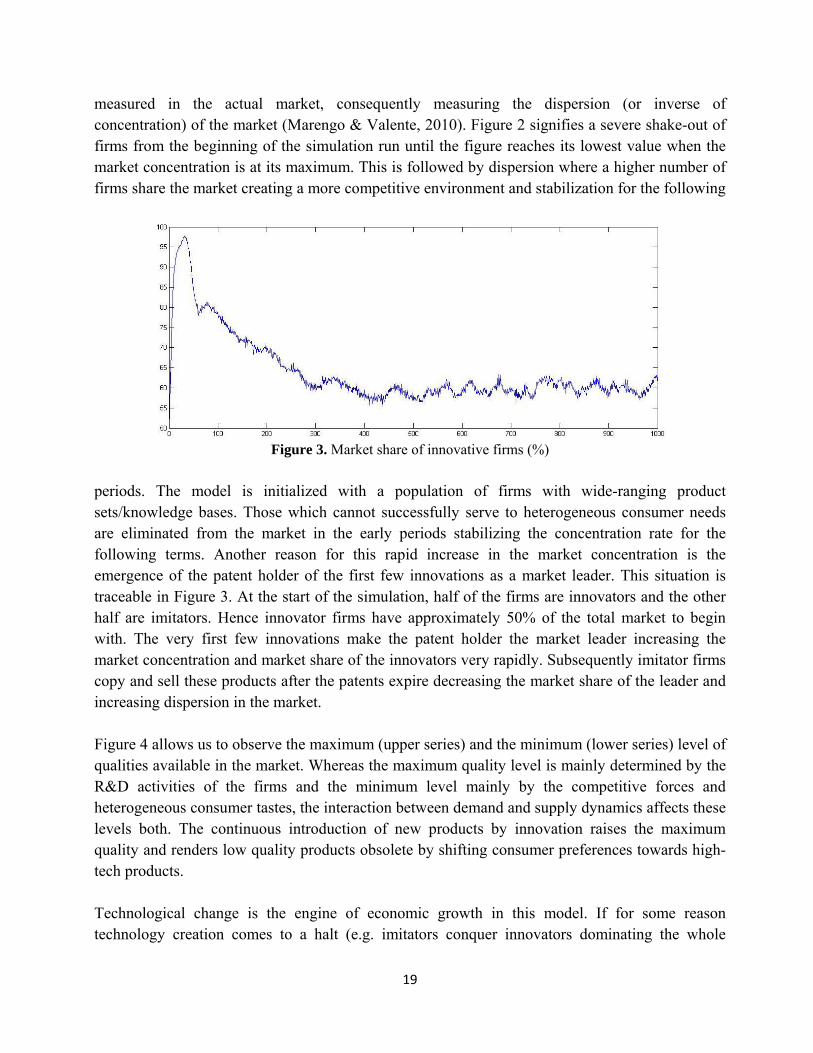
Figure 3. Market share of innovative firms (%)
periods. The model is initialized with a population of firms with wide-ranging product sets/knowledge bases. Those which cannot successfully serve to heterogeneous consumer needs are eliminated from the market in the early periods stabilizing the concentration rate for the following terms. Another reason for this rapid increase in the market concentration is the emergence of the patent holder of the first few innovations as a market leader. This situation is traceable in Figure 3. At the start of the simulation, half of the firms are innovators and the other half are imitators. Hence innovator firms have approximately 50% of the total market to begin with. The very first few innovations make the patent holder the market leader increasing the market concentration and market share of the innovators very rapidly. Subsequently imitator firms copy and sell these products after the patents expire decreasing the market share of the leader and increasing dispersion in the market. Figure 4 allows us to observe the maximum (upper series) and the minimum (lower series) level of qualities available in the market. Whereas the maximum quality level is mainly determined by the R&D activities of the firms and the minimum level mainly by the competitive forces and heterogeneous consumer tastes, the interaction between demand and supply dynamics affects these levels both. The continuous introduction of new products by innovation raises the maximum quality and renders low quality products obsolete by shifting consumer preferences towards high-tech products. Technological change is the engine of economic growth in this model. If for some reason technology creation comes to a halt (e.g. imitators conquer innovators dominating the whole
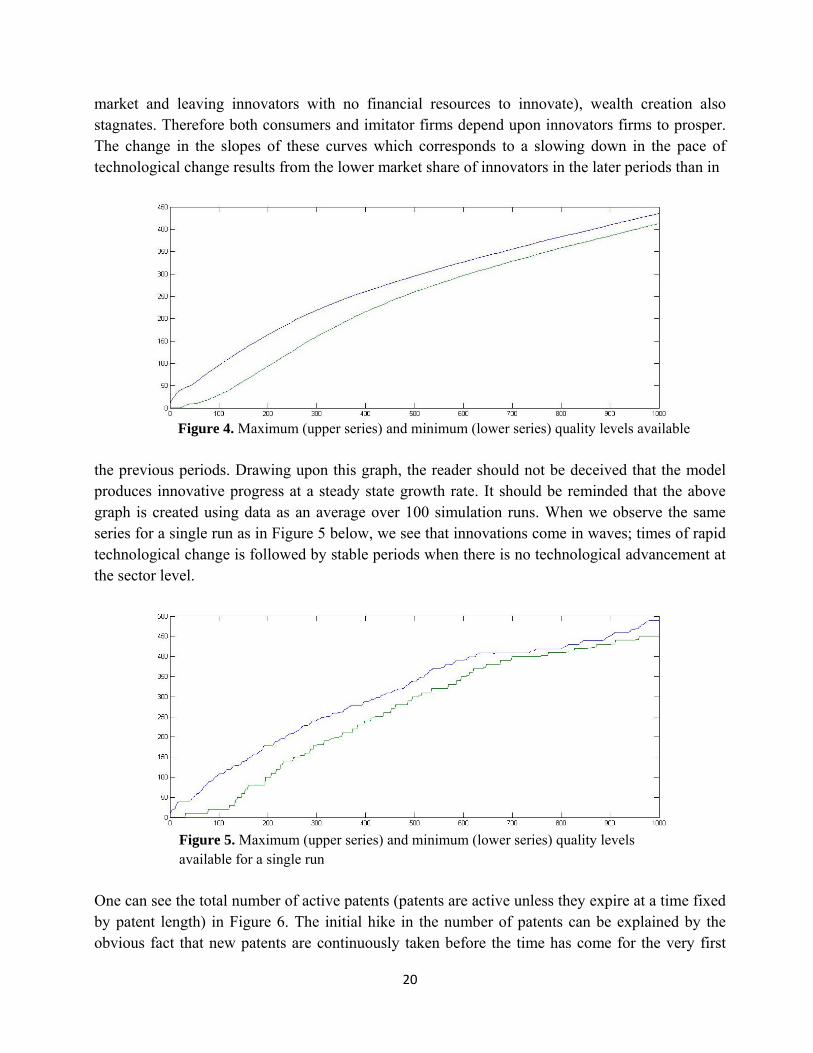
20
market and leaving innovators with no financial resources to innovate), wealth creation also stagnates. Therefore both consumers and imitator firms depend upon innovators firms to prosper. The change in the slopes of these curves which corresponds to a slowing down in the pace of technological change results from the lower market share of innovators in the later periods than in
Figure 4. Maximum (upper series) and minimum (lower series) quality levels available
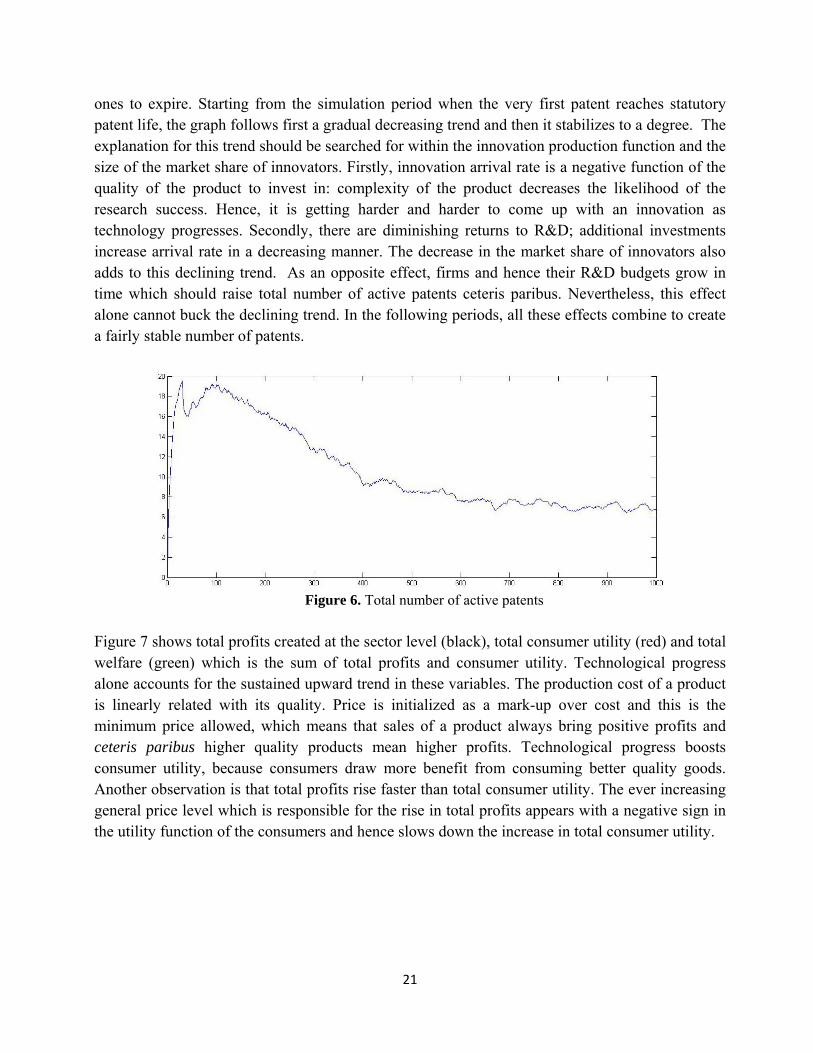
the previous periods. Drawing upon this graph, the reader should not be deceived that the model produces innovative progress at a steady state growth rate. It should be reminded that the above graph is created using data as an average over 100 simulation runs. When we observe the same series for a single run as in Figure 5 below, we see that innovations come in waves; times of rapid technological change is followed by stable periods when there is no technological advancement at the sector level.
Figure 5. Maximum (upper series) and minimum (lower series) quality levels available for a single run
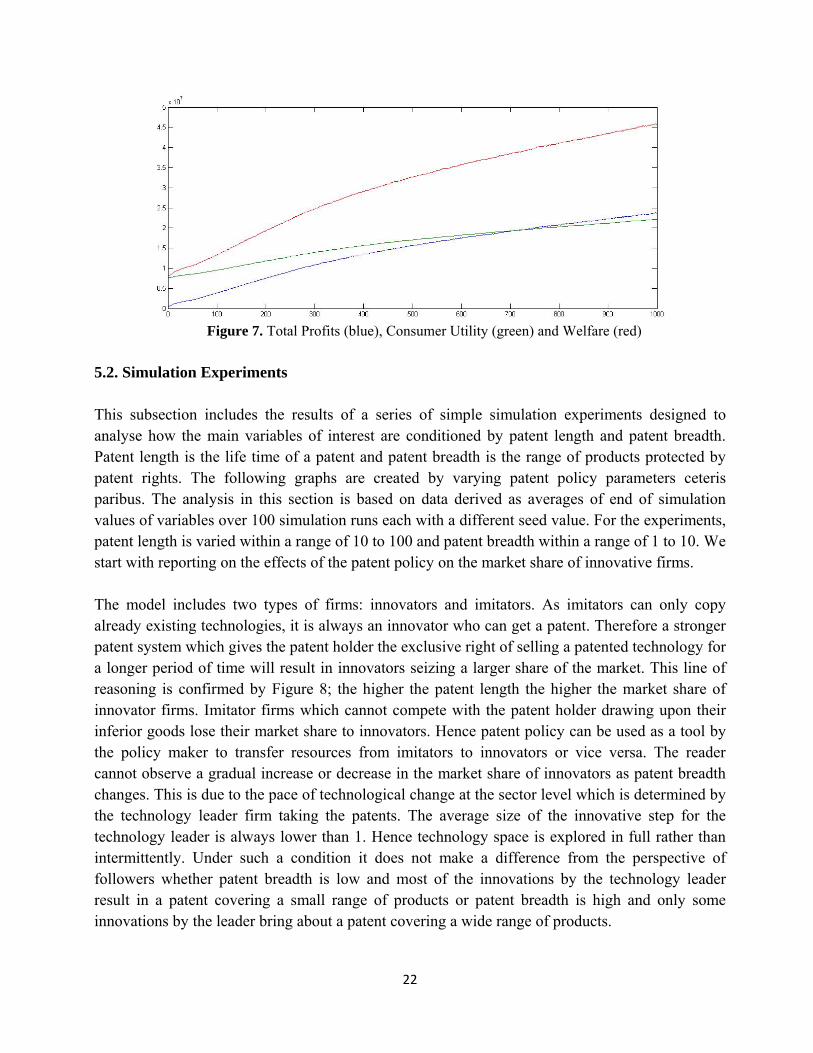
One can see the total number of active patents (patents are active unless they expire at a time fixed by patent length) in Figure 6. The initial hike in the number of patents can be explained by the obvious fact that new patents are continuously taken before the time has come for the very first
21
ones to expire. Starting from the simulation period when the very first patent reaches statutory patent life, the graph follows first a gradual decreasing trend and then it stabilizes to a degree. The explanation for this trend should be searched for within the innovation production function and the size of the market share of innovators. Firstly, innovation arrival rate is a negative function of the quality of the product to invest in: complexity of the product decreases the likelihood of the research success. Hence, it is getting harder and harder to come up with an innovation as technology progresses. Secondly, there are diminishing returns to R&D; additional investments increase arrival rate in a decreasing manner. The decrease in the market share of innovators also adds to this declining trend. As an opposite effect, firms and hence their R&D budgets grow in time which should raise total number of active patents ceteris paribus. Nevertheless, this effect alone cannot buck the declining trend. In the following periods, all these effects combine to create a fairly stable number of patents.
Figure 6. Total number of active patents
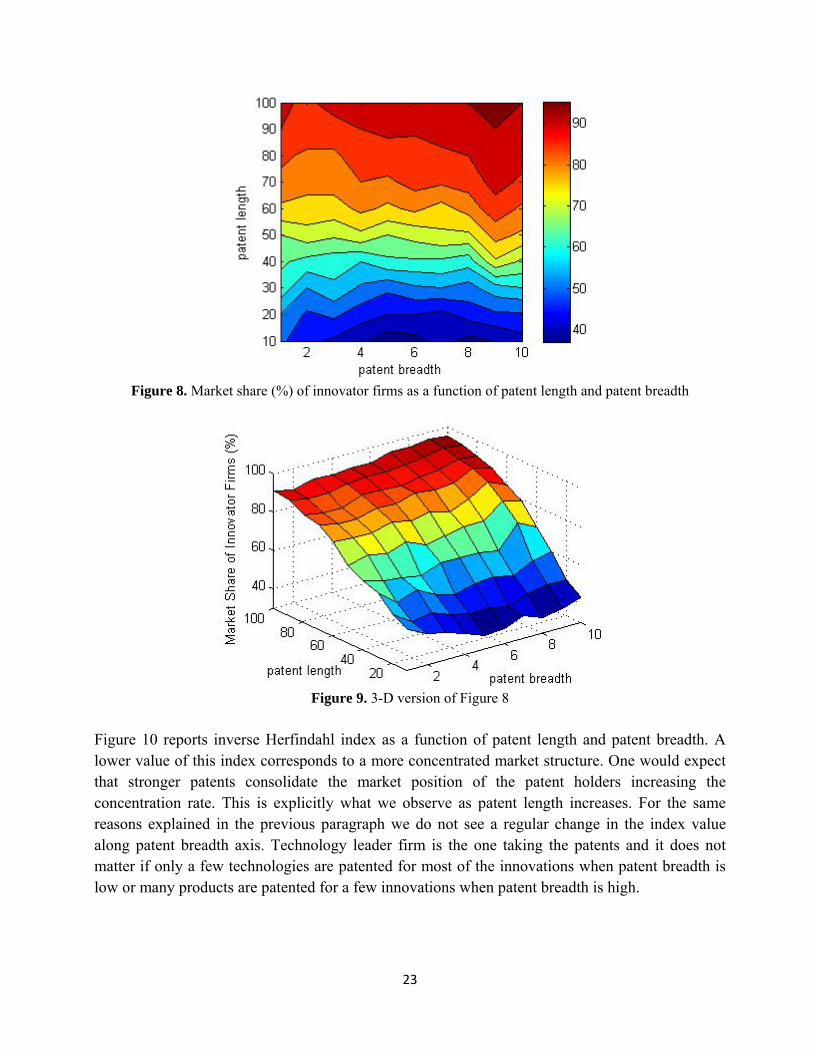
Figure 7 shows total profits created at the sector level (black), total consumer utility (red) and total welfare (green) which is the sum of total profits and consumer utility. Technological progress alone accounts for the sustained upward trend in these variables. The production cost of a product is linearly related with its quality. Price is initialized as a mark-up over cost and this is the minimum price allowed, which means that sales of a product always bring positive profits and ceteris paribus higher quality products mean higher profits. Technological progress boosts consumer utility, because consumers draw more benefit from consuming better quality goods. Another observation is that total profits rise faster than total consumer utility. The ever increasing general price level which is responsible for the rise in total profits appears with a negative sign in the utility function of the consumers and hence slows down the increase in total consumer utility.
22
Figure 7. Total Profits (blue), Consumer Utility (green) and Welfare (red)
5.2. Simulation Experiments This subsection includes the results of a series of simple simulation experiments designed to analyse how the main variables of interest are conditioned by patent length and patent breadth. Patent length is the life time of a patent and patent breadth is the range of products protected by patent rights. The following graphs are created by varying patent policy parameters ceteris paribus. The analysis in this section is based on data derived as averages of end of simulation values of variables over 100 simulation runs each with a different seed value. For the experiments, patent length is varied within a range of 10 to 100 and patent breadth within a range of 1 to 10. We start with reporting on the effects of the patent policy on the market share of innovative firms. The model includes two types of firms: innovators and imitators. As imitators can only copy already existing technologies, it is always an innovator who can get a patent. Therefore a stronger patent system which gives the patent holder the exclusive right of selling a patented technology for a longer period of time will result in innovators seizing a larger share of the market. This line of reasoning is confirmed by Figure 8; the higher the patent length the higher the market share of innovator firms. Imitator firms which cannot compete with the patent holder drawing upon their inferior goods lose their market share to innovators. Hence patent policy can be used as a tool by the policy maker to transfer resources from imitators to innovators or vice versa. The reader cannot observe a gradual increase or decrease in the market share of innovators as patent breadth changes. This is due to the pace of technological change at the sector level which is determined by the technology leader firm taking the patents. The average size of the innovative step for the technology leader is always lower than 1. Hence technology space is explored in full rather than intermittently. Under such a condition it does not make a difference from the perspective of followers whether patent breadth is low and most of the innovations by the technology leader result in a patent covering a small range of products or patent breadth is high and only some innovations by the leader bring about a patent covering a wide range of products.
23
Figure 8. Market share (%) of innovator firms as a function of patent length and patent breadth
Figure 9. 3-D version of Figure 8
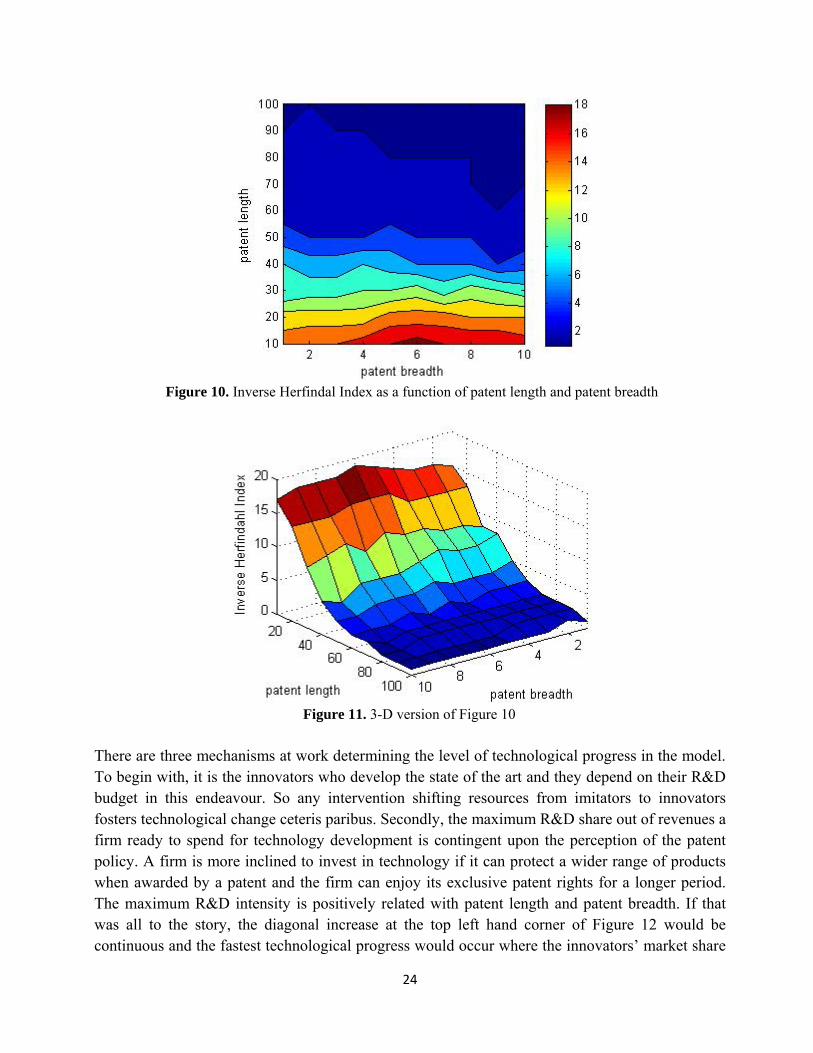
Figure 10 reports inverse Herfindahl index as a function of patent length and patent breadth. A lower value of this index corresponds to a more concentrated market structure. One would expect that stronger patents consolidate the market position of the patent holders increasing the concentration rate. This is explicitly what we observe as patent length increases. For the same reasons explained in the previous paragraph we do not see a regular change in the index value along patent breadth axis. Technology leader firm is the one taking the patents and it does not matter if only a few technologies are patented for most of the innovations when patent breadth is low or many products are patented for a few innovations when patent breadth is high.
24
Figure 10. Inverse Herfindal Index as a function of patent length and patent breadth
Figure 11. 3-D version of Figure 10
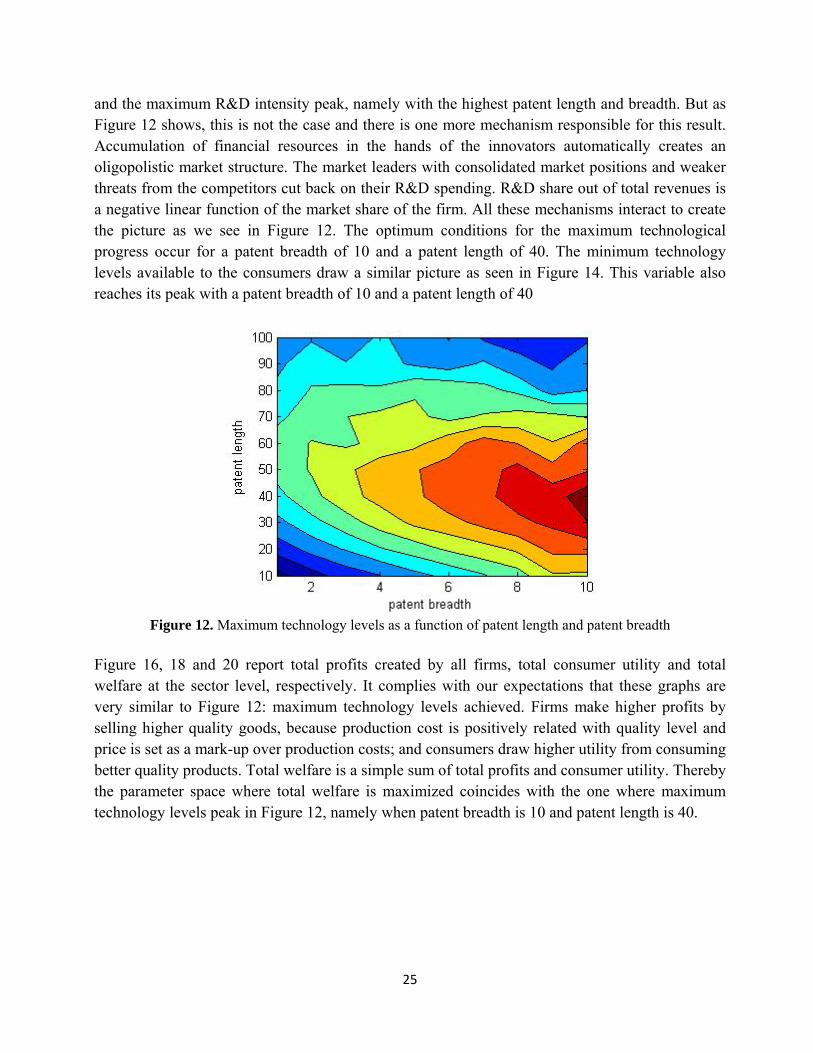
There are three mechanisms at work determining the level of technological progress in the model. To begin with, it is the innovators who develop the state of the art and they depend on their R&D budget in this endeavour. So any intervention shifting resources from imitators to innovators fosters technological change ceteris paribus. Secondly, the maximum R&D share out of revenues a firm ready to spend for technology development is contingent upon the perception of the patent policy. A firm is more inclined to invest in technology if it can protect a wider range of products when awarded by a patent and the firm can enjoy its exclusive patent rights for a longer period. The maximum R&D intensity is positively related with patent length and patent breadth. If that was all to the story, the diagonal increase at the top left hand corner of Figure 12 would be continuous and the fastest technological progress would occur where the innovators’ market share
25
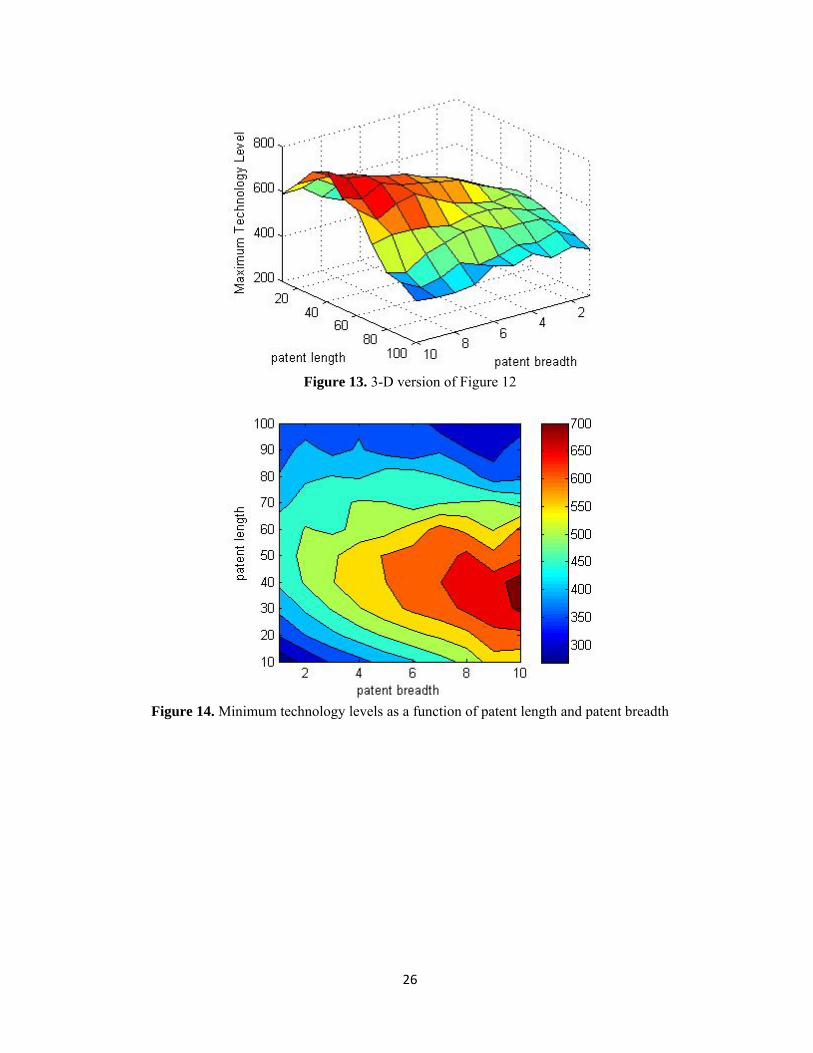
and the maximum R&D intensity peak, namely with the highest patent length and breadth. But as Figure 12 shows, this is not the case and there is one more mechanism responsible for this result. Accumulation of financial resources in the hands of the innovators automatically creates an oligopolistic market structure. The market leaders with consolidated market positions and weaker threats from the competitors cut back on their R&D spending. R&D share out of total revenues is a negative linear function of the market share of the firm. All these mechanisms interact to create the picture as we see in Figure 12. The optimum conditions for the maximum technological progress occur for a patent breadth of 10 and a patent length of 40. The minimum technology levels available to the consumers draw a similar picture as seen in Figure 14. This variable also reaches its peak with a patent breadth of 10 and a patent length of 40
Figure 12. Maximum technology levels as a function of patent length and patent breadth
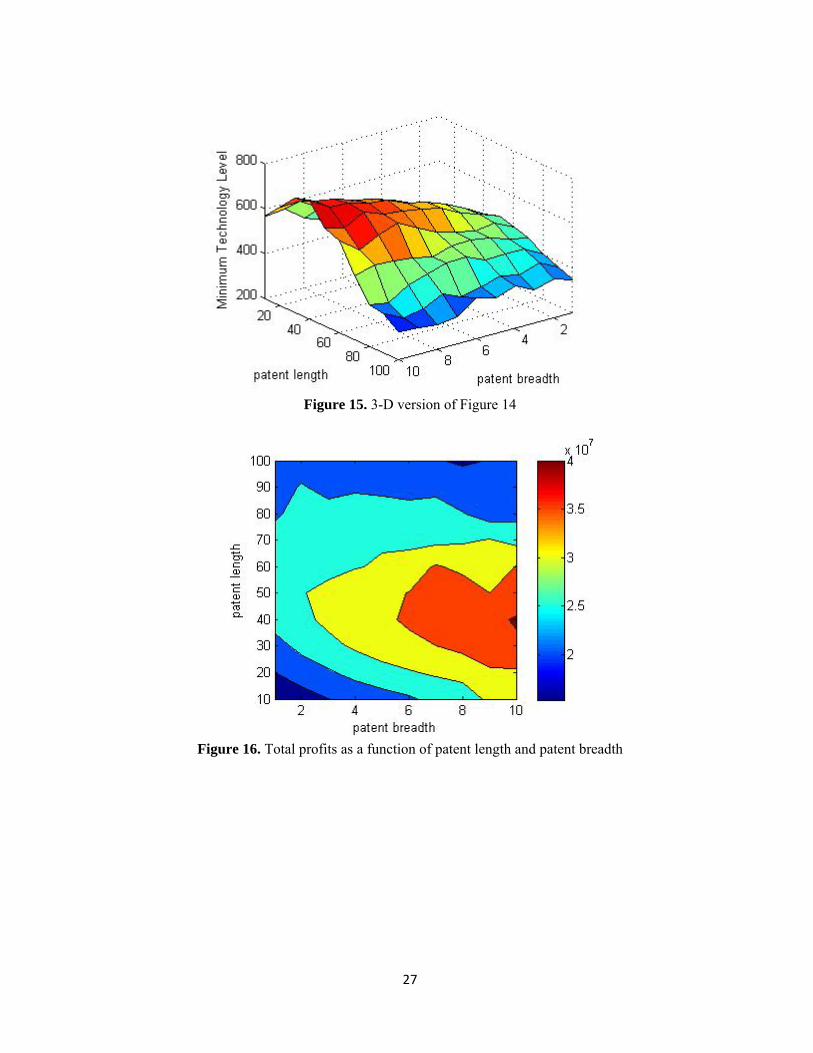
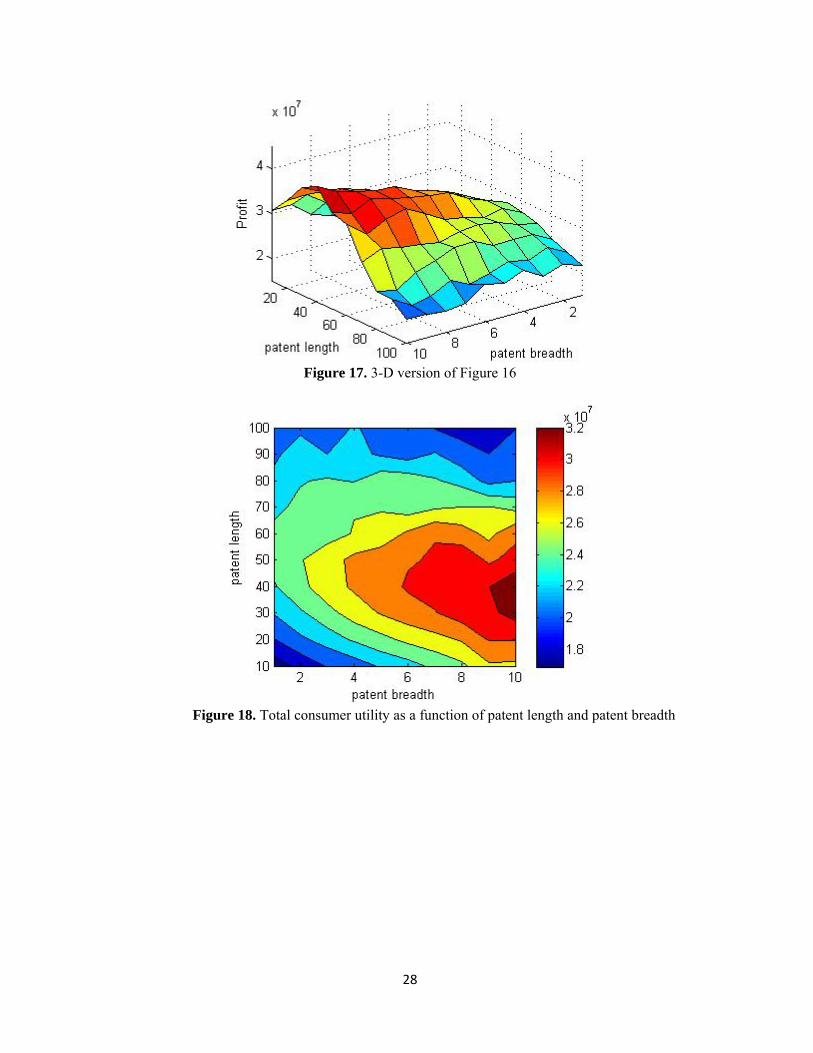
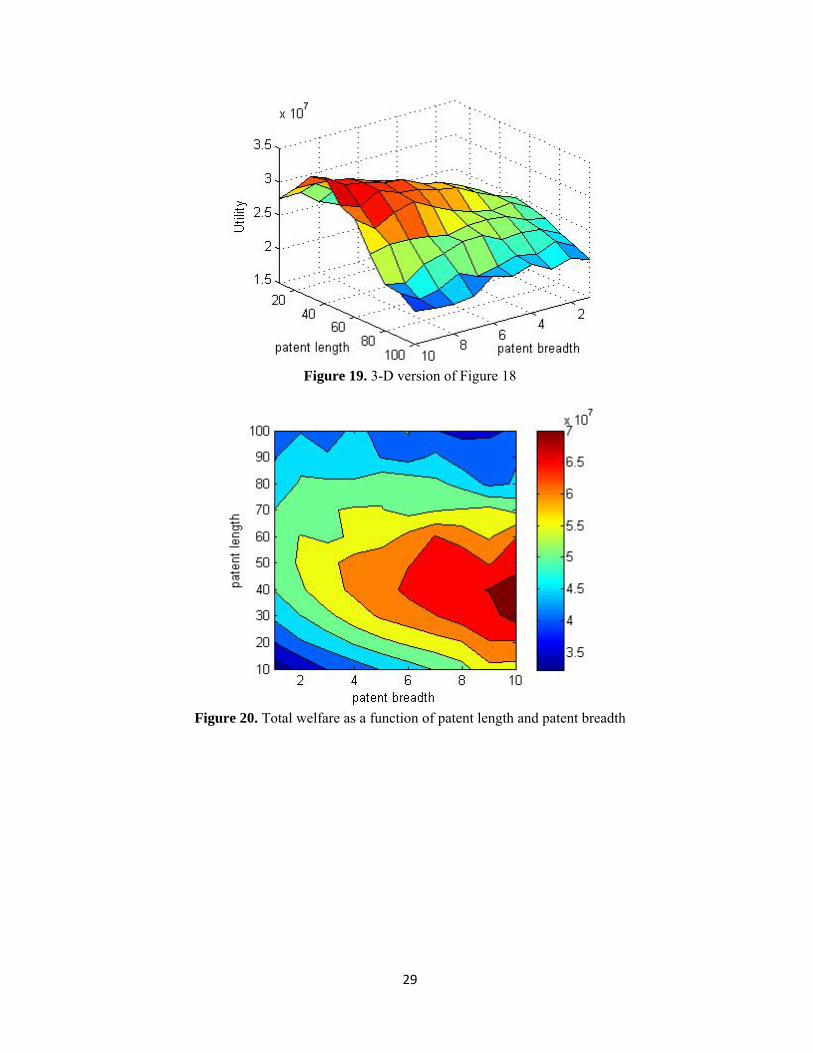
Figure 16, 18 and 20 report total profits created by all firms, total consumer utility and total welfare at the sector level, respectively. It complies with our expectations that these graphs are very similar to Figure 12: maximum technology levels achieved. Firms make higher profits by selling higher quality goods, because production cost is positively related with quality level and price is set as a mark-up over production costs; and consumers draw higher utility from consuming better quality products. Total welfare is a simple sum of total profits and consumer utility. Thereby the parameter space where total welfare is maximized coincides with the one where maximum technology levels peak in Figure 12, namely when patent breadth is 10 and patent length is 40.
26
Figure 13. 3-D version of Figure 12
Figure 14. Minimum technology levels as a function of patent length and patent breadth
27
Figure 15. 3-D version of Figure 14
Figure 16. Total profits as a function of patent length and patent breadth
28
Figure 17. 3-D version of Figure 16
Figure 18. Total consumer utility as a function of patent length and patent breadth
29
Figure 19. 3-D version of Figure 18
Figure 20. Total welfare as a function of patent length and patent breadth
30
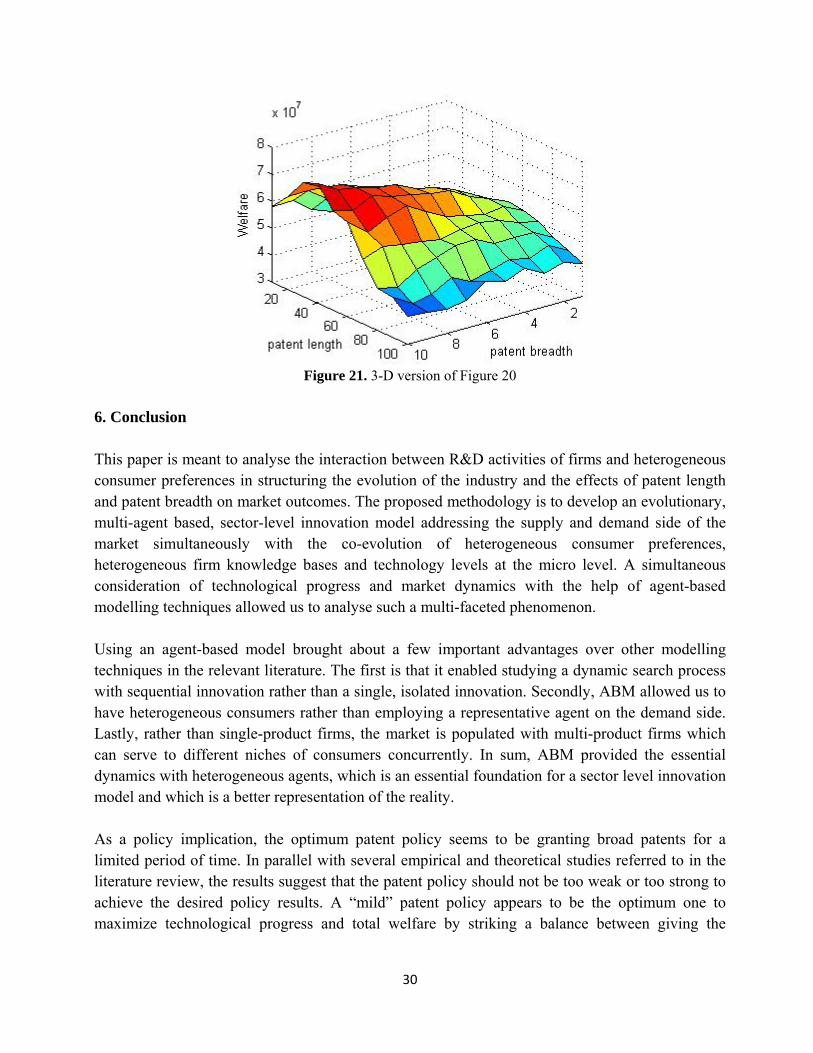
Figure 21. 3-D version of Figure 20
6. Conclusion This paper is meant to analyse the interaction between R&D activities of firms and heterogeneous consumer preferences in structuring the evolution of the industry and the effects of patent length and patent breadth on market outcomes. The proposed methodology is to develop an evolutionary, multi-agent based, sector-level innovation model addressing the supply and demand side of the market simultaneously with the co-evolution of heterogeneous consumer preferences, heterogeneous firm knowledge bases and technology levels at the micro level. A simultaneous consideration of technological progress and market dynamics with the help of agent-based modelling techniques allowed us to analyse such a multi-faceted phenomenon. Using an agent-based model brought about a few important advantages over other modelling techniques in the relevant literature. The first is that it enabled studying a dynamic search process with sequential innovation rather than a single, isolated innovation. Secondly, ABM allowed us to have heterogeneous consumers rather than employing a representative agent on the demand side. Lastly, rather than single-product firms, the market is populated with multi-product firms which can serve to different niches of consumers concurrently. In sum, ABM provided the essential dynamics with heterogeneous agents, which is an essential foundation for a sector level innovation model and which is a better representation of the reality. As a policy implication, the optimum patent policy seems to be granting broad patents for a limited period of time. In parallel with several empirical and theoretical studies referred to in the literature review, the results suggest that the patent policy should not be too weak or too strong to achieve the desired policy results. A “mild” patent policy appears to be the optimum one to maximize technological progress and total welfare by striking a balance between giving the
31
adequate incentives to do R&D and avoiding an overly oligopolistic market structure when innovation is sequential. A possible extension to this study would be repeating this simulation exercise for a complex product in a multi-dimensional technology space rather than in a one-dimensional one as in this study. A complex product space may have implications for the model results and hence for policy advice. It also remains to see what happens when a structural market characteristic (e.g. market size) or a behavioural rule (e.g. R&D intensity, utility function) is changed. Another possible extension will be letting firms switching between being an innovator or imitator in time due to varying market and technological conditions rather than an exogenous imposition of strategies right from the beginning. Such a formulation would be a much more realistic representation of firms and let us study firm specific and aggregate factors leading to adoption of and shift from/to different strategies.
32
Appendix 1. Initialization of the main parameters of the model FirmuNum=50: the initial number of firms marketsize=50000: the number of consumers SubmarketNum=500: the number of submarkets MinTech=1: the minimum initial technology level Maxtech=10: the maximum initial technology level betainn=0.5: the productivity of innovation betaimit=0.8: the productivity of imitation ris=3: the size of the gap between two consecutive goods in different classes where no products
are defined pricespeed=0.1: the speed with which price of a product responds to a change in its profit pm=30%: profit margin cm=1: the parameter that links the initial price of a product to its quality MaxNumProd=5: the minimum initial number of products of a firm MinNumProd=10: the maximum initial number of products of a firm marketingshare=10%: the share of marketing expenses in total revenue r&dintensity_max=10%: the maximum share of R&D budget in total revenue r&dintensity_min=0%: the minimum share of R&D budget in total revenue ric=2: radical innovation constant in utility function techidealcosnt~Uniform(0,1): the parameter picked from a uniform distribution that defines the
ideal product for a consumer between minimum and maximum technology level available MemorySize=5: the number of goods in the memory of a consumer GoodNum=5: the number of new goods consumers evaluate for a purchase every period patent length=[10,100]: the time period between a patent is granted and it terminates when its
statutory life is over patent breadth=[1,10]: the degree to which a product must differ from a patented one to be
granted a patent 2. Main variables of the model Welfare: total welfare created by all firms ProfitSector: total profits of the firms UtilityConsumerTot: total utility of the consumers TechMax: the maximum technology level TechMin: the minimum technology level Ms_Inn: market share of the innovators InvHerf: the inverse of the Herfindahl index
33
PatentNumber: total number of active patents Marketing: marketing expenses of a firm r&dint: R&D share of a firm out of its total revenue Price: price of a product Profit: profit from a product TechIdeal: the ideal product for a consumer between minimum and maximum technology level
available Utility: the utility level derived from a good by a consumer References Akcigit, U. (2009). Firm size, innovation dynamics and growth. Retrieved August 14, 2012, from
http://www.richmondfed.org/conferences_and_events/research/2009/pdf/akcigit_paper.pdf Bessen, J., & Hunt, R. (2004). An empirical look at software patents. (Federal Reserve Bank of
Philadelphia Working Paper no.03-17). Retrieved January 18, 2012, from http://www.researchoninnovation.org/swpat.pdf
Bessen, J., & Maskin, E., 2002. Sequential innovation, patents and imitation, MIT Working Paper Department of Economics, revised version.
Bessen, J., & Maskin, E. (2009). Sequential innovation, patents and imitation. RAND Journal of
Economics, 40(4), 611–635. Chang, H. (1995). Patent scope, antitrust policy, and cumulative innovation. RAND Journal of
Economics. 26, 34–57. Cohen, W. M., Nelson, R. R., & Walsh, J. P. (2000). Protecting their intellectual assets:
Appropriability conditions and why U.S .manufacturing firms patent (or not). (NBER Working Paper Series Working Paper 7552). Retrieved December 20, 2011, from Intertional Journal of Industrial organizationhttp://www.nber.org/papers/w7552
Dawid, H. (2006). Agent-based models of innovation and technological change. In L. Tesfatsion and K. L. Judd (Ed.), Handbook of Computational Economics, Volume 2: Agent-Based Computational Economics (pp. 1235–1272). North-Holland: Elsevier B.V.
de Wit, G. (2005). Firm size distributions An overview of steady-state distributions resulting from
firm dynamics models. International Journal of Industrial Organization. 23, 423–450.
34
Dosi, G., Marengoa, L., & Pasquali, C. (2006). How much should society fuel the greed of innovators? On the relations between appropriability, opportunities and rates of innovation. Research Policy, 35, 1110–1121.
Dunne, T., Roberts, M. J., & Samuelson, L. (1988). Patterns of Firm Entry and Exit in U.S.
Manufacturing Industries. Rand Journal of Economics, 19(4), 495–515. Encaoua, D., Dominique, G., & Catalina, M. (2006). Patent systems for encouraging innovation:
Lessons from economic analysis. Research Policy, 35, 1423–1440. Eswaran, M., & Gallini, N. (1996). Patent policy and the direction of technical change. RAND
Journal of Economics, 27(4), 722–746. Gallini, N. T. (1992). Patent policy and costly imitation. RAND Journal of Economics, 23, 52–63. Gallini, N. T. (2002). The economics of patents: Lessons from recent U.S. patent reform. Journal
of Economic Perspectives, 16, 131–154. Gilbert R., & Shapiro, C. (1990). Optimal patent length and breadth. RAND Journal of Economics,
21(1), 106–112. Grebel, T., & Pyka, A. (2003). Agent-based modelling – A methodology for the analysis of
qualitative development processes. (Universitaet Augsburg Institute for Economics Discussion Paper Series no: 251). Retreived March 15, 2009, from http://www.wiwi.uniaugsburg.de/vwl/institut/paper/251.pdf
Green, J., & Scotchmer, S. (1995). On the division of profit in sequential innovation. RAND
Journal of Economics, 26, 20–33. Grossman, G. M., & Helpman, E. (1991a). Quality ladders in the theory of growth. Review of
Economic Studies, 58, 43–61. Grossman, G. M., & Helpman, E. (1991b). Quality ladders and product cycles. Quarterly Journal
of Economics, 106, 557–586. Heller, M. A., & Eisenberg, R. S. (1998). Can patents deter innovation? The anticommons in
biomedical research. Science, 280(5364), 698–701.
Hunt, R. M. (2004). Patentability, industry structure, and innovation. (Federal Reserve Bank of Philadelphia Working Paper No. 01-13/R), Retrieved January 18, 2012, from
35
http://www.philadelphiafed.org/research-and-data/publications/working-papers/2001/wp01-13r.pdf
Jewkes, J., Sawers, D. & Stillerman, R. (1969). The sources of invention. London: MacMillan. Kash. D. E., & Kingston, W. (2001). Patents in a world of complex technologies. Science and
Public Policy, 28(1), 11–22. Klemperer, P. (1990). How broad should the scope of patent protection be?. RANDJournal of
Economics, 21(1), 113–130. Kitch, E. W. (1997). The nature and function of the patent system. Journal of Law and Economics,
20, 265–290. Koo, B., & Wright, B. D. (2003). Economics of patenting an input essential to further research. In
O. Granstrand (Ed.), Economics, law and intellectual property-seeking strategies for research and teaching in a developing field (pp. 331–346). Dordrecht, The Netherlands: Kluwer Academic Publishers
Lerner, J. (2001). 150 years of patent protection. (Harvard Business School Working Paper 00-
039) Levin, R. C., Klevorick, A. K., Nelson, R. R., & Winter, S. G. (1987). Appropriating the returns
from industrial research and development. (Cowles Foundation Paper 714 Reprinted from Brookings Papers on Economic Activity, 3, 1)
Malerba, F., Nelson, R., Orsenigo, L., & Winter, S. (1999). ‘History-friendly’ models of industry
evolution: The computer industry. Industrial and Corporate Change, 8(1), 3–40. Marengo, L., & Valente, M. (2010). Industry dynamics in complex product spaces: An
evolutionary model. Structural Change and Economic Dynamics, 21, 5–16. Marengo, L., Pasquali, P. C., Valente, M., & Dosi, G. (2009). Appropriability, patents, and rates
of innovation in complex products industries. (LEM Working Paper Series, 2009/5). Retrieved November 13, 2011, from http://www.lem.sssup.it/WPLem/files/2009-05.pdf
Mazzoleni, R., & Nelson, R. R. (1998). The benefits and costs of strong patent protection: A
contribution to the current debate. Research Policy, 27, 273–284. Merges R., & Nelson, R. R. (1990). On the complex economics of patent scope. Columbia Law
Review, 90, 839–916.
36
Merges, R., & Nelson, R. R. (1994). On limiting or encouraging rivalry in technical progress: The
effects of patent scope decisions. Journal of Economic Behavior and Organization, 25, 1–24. Minniti, A., Parello, C., & Segerstrom P. S. (2008): “A Schumpeterian growth model with
heterogeneous firms. (MPRA Paper No. 13674, posted 27 February 2009) Retrieved October 12, 2011, from http://mpra.ub.uni-muenchen.de/13674/
Nordhaus, W. (1969). Innovation, Growth, and Welfare. Cambridge, Mass.: MIT Press. O’Donoghue, T. A. (1998). Patentability requirement for sequential innovations. RAND Journal of
Economics. 29, 654–679. O’Donoghue, T. A., Scotchmer, S., & Thisse, J. F. (1998). Patent breadth, patent life, and the pace
of technological progress. Journal of Economics & Management Strategy, 7(1), 1–32. Ortega-Argilés, R. & Brandsma, A. (2010). EU–US differences in the size of R&D intensive
firms: Do they explain the overall R&D intensity gap? Science and Public Policy, 37(6), 429–441.
Stančík, J., & Biagi, F. (2012). Characterizing the evolution of the EU R&D intensity gap using
data from top R&D performers. Retrieved August 14, 2012, from http://xivrem.ujaen.es/wp‐content/uploads/2011/11/89‐R‐127M709.pdf
Tandon, P. (1982). Optimal patents with compulsory licensing. Journal of Political Economy , 90,
470–86. Teece, D. (1986). Profiting from technological innovation: Implications for integration,
collaboration, licensing and public policy. Research Policy, 15, 285–305. Vallée, T. and Yildizoglu, M. (2006). Social and technological efficiency of patent systems.
Journal of Evolutionary Economics, 16, 189–206. Windrum, P. (2004). Neo-Schumpeterian simulation models (MERIT-Infonomics Research
Memorandum Series no: 2004-002). Retrieved March 13, 2009, from http://edocs.ub.unimaas.nl/loader/file.asp?id=856
Winter, S. (1993). Patents and welfare in an evolutionary model. Industrial and Corporate
Change, 2, 211–231.

The UNU‐MERIT WORKING Paper Series 2013-01 Effects of innovation on employment in Latin America by Gustavo Crespi and
Ezequiel Tacsir 2013-02 Revisiting the porter hypothesis: An empirical analysis of green innovation for the
Netherlands George van Leeuwen and Pierre Mohnen 2013-03 Impact of external knowledge acquisition strategies on innovation ‐ A comparative
study based on Dutch and Swiss panel data by Spyros Arvanitis, Boris Lokshin, Pierre Mohnen and Martin Wörter
2013-04 Interactive knowledge exchanges under complex social relations: A simulation modelRobin by Cowan and Anant Kamath
2013-05 Innovation systems framework: still useful in the new global context? by Michiko Iizuka
2013-06 The importance of intrinsic and extrinsic motivation for measuring IQ by Lex Borghans, Huub Meijers and Bas ter Weel
2013-07 Firms' innovation capability‐building paths and the nature of changes in learning mechanisms: Multiple case‐study evidence from an emerging economy by Paulo N. Figueiredo , Marcela Cohen and Saulo Gomes
2013-08 A set of time series data labour market stocks and flows for the Netherlands 1980 to 2010 by Manuel Müllers, Joan Muysken and Erik de Regt
2013-09 Designing an optimal 'tech fix' path to global climate stability: R&D in a multi‐phase climate policy framework by Adriaan van Zon and Paul A. David
2013-10 Complementarity between internal knowledge creation and external knowledge sourcing in developing countries by Jun Hou and Pierre Mohnen
2013-11 Summarizing large spatial datasets: Spatial principal components and spatial canonical correlation by Samyukta Bhupathiraju, Bart Verspagen and Thomas Ziesemer
2013-12 Regional systems of innovation in the Arab region by Samia Satti Osman Mohamed Nour
2013-13 Development and social justice: Education, training and health in Sudan by Samia Satti Osman Mohamed Nour
2013-14 The economic importance and impacts of intellectual property rights (IPRs) in Sudan by Samia Satti Osman Mohamed Nour
2013-15 Overview of knowledge economy in the Arab region by Samia Satti Osman Mohamed Nour
2013-16 The importance (impacts) of knowledge at the macro‐micro levels in the Arab Gulf countries by Samia Satti Osman Mohamed Nour
2013-17 Political determinants and impact analysis of using a cable system as a complement to an urban transport system by Diego Escobar‐García, Francisco García‐Orozco and Carlos Cadena‐Gaitán
2013-18 Women entrepreneurs in the informal economy: Is formalization the only solution for business sustainability? By Shyama V. Ramani, Ajay Thutupalli, Tamas Medovarszki, Sutapa Chattopadhyay, Veena Ravichandran
2013-19 Heterogeneity in innovation strategies, evolving consumer preferences and market structure: An evolutionary multi‐agent based modelling approach by Salih Çevikarslan

2013-20 Optimal patent length and patent breadth in an R&D driven market with evolving consumer preferences: An evolutionary multi‐agent based modelling approach by Salih Çevikarslan


![[PSS] Power and Sample Size - merit.unu.edu](https://img.pdfslide.us/doc/110x75/621b7a3e6247c7513c34b1ec/pss-power-and-sample-size-meritunuedu.jpg)