Embed Size (px)
Citation preview
Working Paper No. 2013-13
The Distributional Impacts of an Energy Boom in Western Canada
Joseph Marchand University of Alberta
Revised
October, 2014
Copyright to papers in this working paper series rests with the authors and their assignees. Papers may be downloaded for personal use. Downloading of papers for any other activity may not be done without the written consent of the authors. Short excerpts of these working papers may be quoted without explicit permission provided that full credit is given to the source. The Department of Economics, The Institute for Public Economics, and the University of Alberta accept no responsibility for the accuracy or point of view represented in this work in progress.
The Distributional Impacts of an Energy Boom
in Western Canada
Joseph Marchand ∗
Department of Economics
University of Alberta
revised October 2014
Abstract
In the energy-rich provinces of Western Canada, inequality rose over the past
two decades while poverty declined, begging the question of whether the recent
energy boom was a contributing factor. This study uses local labor market
variation in energy extraction intensity to identify these distributional impacts.
The growth in local outcomes attributable to the boom is found to be U-shaped
and significant across all distributional segments, leading to somewhat increased
local inequality aggregates and reduced local poverty. This pattern is preserved
but varies across sectors, driving a large local inequality increase in energy
extraction, with smaller rises and reductions in other industries.
JEL Codes: J31, Q33, R23.
∗Associate Professor, Department of Economics, University of Alberta, 7-29 HM Tory, Edmon-ton, AB, Canada, T6G 2H4. Phone: 780-492-9425. E-mail: [email protected]: The author appreciates all of the feedback received on earlier versions of this work fromDavid Green as the editor of this special issue, two anonymous referees, the organizers and participants ofthe 2014 IRPP-CLSRN conference, and Tim Smeeding and the participants of the Institute for Researchon Poverty seminar at the University of Wisconsin - Madison, as well as the assistance from Gordon Yi inthe map construction and Irene Wong in the University of Alberta RDC for data guidance and disclosure.Disclaimer: The research and analysis are based on data from Statistics Canada and the opinions expresseddo not represent the views of Statistics Canada.
1
1 Introduction
Within a local labor market, the gains generated from the positive labor demand shock
induced by an energy boom may be distributed either uniformly or unevenly across the
earnings distribution. In the case where all individuals proportionately benefit from the
gains of an energy boom, overall inequality is expected to remain unchanged while poverty
is expected to decline. If, however, these benefits only accrue to certain individuals at
either the top or the bottom of the distribution, overall inequality would either rise or
fall respectively, with poverty only being reduced if the bottom benefits. While there
is a general consensus in the literature that energy-driven labor demand shocks do have
significant effects on wages and employment, the distributional impacts remain unclear due
to differences in data sets and identification approaches.
In the earlier literature, several cross-national studies concluded that income inequality
was positively correlated with a country’s natural resource dependence (Bourguignon and
Morrison, 1990; Leamer et al., 1999; Gylfason and Zoega, 2003; Breisinger and Thurlow,
2008; Buccellato and Alessandrini, 2009). However, in a more recent cross-national study,
Goderis and Malone (2011) offer a theoretical framework where a resource boom immedi-
ately reduces inequality in the short-run, but returns it to its original steady state over time.
According to their evidence across developing countries, only a third of the initial inequality
reduction remained after five years. Rather than continuing the cross-national approach,
much of the present literature instead utilizes the geographic variation within countries.
These studies can be divided into those involving developed or developing countries.
Papers studying the changes within developing countries provide mixed evidence re-
garding the impact of an energy boom on inequality, but agree that poverty tends to be
reduced. Using a general equilibrium model on Bolivia, Lay et al. (2006) found offsetting
effects of an energy boom that left inequality unaltered but reduced poverty. For Mexico,
López-Feldman et al. (2007) documented increased resource income somewhat lowering in-
equality and poverty, but resource income was itself unequally distributed. For Russia,
Buccellato and Mickiewicz (2009) showed that oil and gas abundance led to local level in-
equality. Caselli and Michaels (2009) found that oil may have reduced poverty in Brazil,
2
but the results were not robust. In Peru, Loayza et al. (2013) showed that consumption
inequality increased and poverty decreased across districts of a mining province during a
boom, while Aragon and Rud (2013) found a significant poverty reduction due to gold
mining. Most recently, Howie and Atakhanova (2014) showed that a resource boom in
Kazakhstan lowered inequality.
The studies using changes within developed countries mostly focus on the United States,
with general agreement that an energy boom reduces poverty, but there is not much evidence
regarding its impact on inequality. Black et al. (2005) used local labor markets within four
mid-western coal states to find that the boom in the 1970s was associated with a decrease in
poverty, but the subsequent bust undid much of that reduction. On the other hand, Weber
(2012) examined the recent shale gas boom in three western states and found no statistically
significant effect in the poverty rate, although the coefficients were negative. In Deaton
and Niman (2012), a relative increase in the mining sector in Appalachia had an immediate
effect of poverty reduction, while a lag effect then increased it. Partridge et al. (2012) also
examined Appalachia to show that the historic positive relationship between coal mining
and poverty has recently changed to a negative effect, resulting in less poverty. Michaels
(2010) found that oil development was not significantly associated with increased local
income inequality in the southern states during a fifty year period. And, Bhattacharyya and
Williamson (2013) showed that the impact of a resource price shock in Australia increased
inequality over the long run.
The current paper investigates the relationship between inequality, poverty, and energy
booms in the developed country of Canada, specifically focusing on the region of Western
Canada containing the majority of its energy resources. In recent decades coinciding with
an energy boom, inequality trended upward while poverty trended downward, with the
magnitude of the trends seemingly corresponding to the relative amounts of their available
resources. Using a local labor market approach that exploits variation in energy extraction
intensity, this study asks and answers several questions regarding the distributional impacts
of an energy boom: Where are the gains from an energy boom concentrated across the
distribution? Do those gains result in more or less inequality? Does an energy boom help
to alleviate poverty? Where are the gains from an energy boom concentrated across the
3

distributions of different sectors? How do those gains impact within sector inequality?
The evidence shows that all individuals benefited from the gains of the recent energy
boom in Western Canada, albeit unevenly across the distribution, with significant growth
across all segments but relative magnitudes that are decidedly U-shaped. Due to this
growth pattern, the boom somewhat increased local inequality and significantly reduced
low income poverty when using the aggregate measures, although relative poverty slightly
increased. When further disaggregated by sector, the U-shape pattern of growth across the
distribution was preserved, but the shape and magnitudes of this growth differed. These
pattern differences led to an increase in local inequality that was large in the directly-
impacted energy extraction industry and smaller in the indirectly-impacted industries of
construction and retail trade. At the same time, local inequality was slightly reduced by
the boom in the industry of all services.
2 Latest Boom and Recent Trends in Western Canada
Energy prices increased rapidly in Canada over the 1990s and 2000s, highlighting its latest
energy boom. The annual real price trends of the two most important energy resources
produced in Western Canada, crude oil and natural gas, are displayed from 1990 to 2010 in
Figure 1. Over the early to mid-1990s, the price movements of these products were relatively
flat, with repeated but relatively small fluctuations in natural gas and a small increase
followed by a moderate decrease in crude oil. From the mid-1990s to early 2000s, both
products experienced steep price increases in tandem, until the relatively small declines for
oil in 2001 and for natural gas in 2002. Over the 2000s, the price for crude oil continued along
its upward path until 2008, while the natural gas price had small but repeated fluctuations.
Both real energy prices experienced declines from 2008 to 2009, attributable to the recession.
Over these same two decades that energy prices were rising, inequality in Canada also
steadily rose (Fortin et al., 2012; Osberg, 2008), while poverty rates initially rose and then
repeatedly fell (Murphy et al., 2012; Osberg, 2000), begging the question of whether the
energy boom was at least partly responsible. Western Canada offers an interesting economic
environment to examine the distributional issues induced by this energy boom, as it is the
4
region most associated with the extraction of energy resources and the exposure to these
cyclical price shocks. The trends in the annual provincial aggregates of inequality and
poverty are respectively displayed in Figures 2 and 3 for the four Western provinces of
Alberta, British Columbia, Manitoba, and Saskatchewan, as well as for the rest of Canada
as a comparison. These provincial trends seem to mimic the greater trends in inequality
and poverty happening across Canada, but with important inter-provincial differences.
Inequality across the Western provinces, as measured by the Gini coefficient, has ex-
hibited an overall increasing trend over the 1990s and 2000s. While provincial inequality
rose and then fell in tandem around 1992, the early 1990s was a time of relatively little
dispersion both within and between the four Western provinces. During the late 1990s,
however, inequality began to repeatedly rise within these provinces, with larger increases
for Alberta and British Columbia than for Manitoba and Saskatchewan. In the early 2000s,
Saskatchewan also experienced a rapid increase in inequality. What is most notable about
these trends is that Alberta contains the greatest amount of energy resources, with British
Columbia and Saskatchewan containing moderate amounts, and with no significant energy
resources appearing in Manitoba. The mid-2000s once again led to tandem increases in
inequality for all provinces except British Columbia, while the years following the 2008
recession saw much more dispersion between the provinces, with inequality falling in Mani-
toba, both Alberta and Saskatchewan leveling off, and British Columbia once again rising.
When energy prices and provincial inequality were increasing inWestern Canada, provin-
cial poverty rates based on the low-income cut off were on the decline. In the early
1990s, poverty climbed in all four Western provinces, before stabilizing and remaining
very similar, both within and between the provinces, over the mid-1990s. During the late
1990s, dispersion in these poverty rates began to appear, with rapid declines in Alberta
and Saskatchewan, a slight decline in Manitoba somewhat later, and poverty in British
Columbia remaining constant. During the early 2000s, the poverty rate in Alberta contin-
ued its rapid decline, joined by British Columbia a few years later, while Manitoba followed
a steady descent, and Saskatchewan stabilized. By the late 2000s, Alberta’s poverty rate
was markedly lower than the other provinces, which then equated with Saskatchewan’s
rate towards the end of the period. The highest poverty rates during this time were found
5
in British Columbia and Manitoba. Again, given the relative concentration of energy re-
sources in Alberta, and then in British Columbia and Saskatchewan, and not in Manitoba,
the implication is that these trends in energy prices and poverty rates may be correlated.
3 Identification through Local Labor Markets
The provinces of Canada have previously been used to identify particular changes in poverty
and inequality, which are potentially driven by the differences in their traits. For exam-
ple, Osberg and Xu (1999) compared the poverty intensity across Canadian provinces to
highlight the impact of their differential social assistance, which then relates to changes in
poverty over time, with a general reduction in intensity over the 1980s that was partially
undone in the 1990s. In a very recent study, Fortin and Lemieux (2014) use provincial vari-
ation within Canada to better understand wage movements and how differing minimum
wage policies and the energy boom might play a role. For the potential boom effects, they
compare the wage movements of the resource-based provinces of Alberta, Newfoundland,
and Saskatchewan to the benchmark province of Ontario. Using this strategy, they conclude
that, while the overall wage growth and the growth in energy extraction employment were
much greater in the resource provinces, this resulted in an overall decrease in inequality
attributable to the boom.1
The current study uses identification through local labor markets to investigate the
mechanisms of the distributional effects of an energy boom in the region of Western Canada,
where the majority of the country’s energy resources are located. Rather than focusing on
the potential correlation of the provincial trends in energy prices, inequality, and poverty
that were presented in the previous section, these trends are instead used as motivation
for a more local identification strategy. This approach is very much in the spirit of Bartik
(1996), who examined similar questions regarding the distributional effects stemming from
overall changes in local labor demand for the United States. Across Western Canada, some
local areas contain little to no resources of crude oil, natural gas, or coal reserves, while
other areas have large amounts of these energy resources. The local differences in energy1Fortin and Lemieux (2014) use data from the 1997 to 2012 Canadian Labour Force Survey.
6

extraction intensity due to the location of these resources allow for the identification of the
energy boom effect, with energy areas serving as the treatment set receiving the energy
price shock and non-energy areas serving as the comparison set and counter-factual for
what would have happened to the energy areas had the boom not occurred.
In order to construct the average local measures of inequality and poverty and have
proper representation for each of these independent observations, a sufficient number of
individuals is required within each local labor market. The current paper relies on data
from the Canadian Census of Population, as it contains the most individual variation avail-
able among the nationally-representative surveys. In particular, the Research Data Centre
(RDC) version of the Census data is used for its detailed variables of geography and indus-
try. The 1996 and 2006 Census waves are closest to capturing most of the upward trend
during the recent energy boom from the mid-1990s to the mid-2000s, as shown in Figure
1, with each Census wave reflecting the labor market responses for the previous year. The
local labor markets for this study are defined at the Census division level, based upon the
location of an individual’s current residence, with a total of eighty-eight Census divisions
across the four western provinces.
The labor market outcomes of total income, total earnings, and wages & salaries gener-
ate the distributions that are used to construct the inequality and poverty measures across
Census divisions. Total income includes all money income received during the year, includ-
ing total wages and salaries, net self-employment income, total money transfers from the
government, total investment income, and all other money income. Because this outcome
includes transfers from the government, it is expected to reflect a lower level of inequality
than if it contained only income from market sources (i.e. work or investment). Total
earnings includes total wages and salaries and net self-employment income, with the latter
component originating from farms, unincorporated non-farm businesses, and professional
practices. Wages & salaries represents total wages and salaries, which excludes deductions
for income tax, pensions, and employment insurance.2 Both of the earnings outcomes are
expected to reflect higher levels of inequality and greater impacts from an energy boom, as2With the exception of the net self-employment income component, all other values are provided before
taxes, due to the availability of information in both the 1996 and 2006 Census waves. The after-tax valuesare additionally available in only the 2006 Census wave.
7

they are more narrowly focused on the returns from labor. All outcomes are restricted to
real, positive values.3
The treatment and comparison sets of local labor markets used for this study expand
upon the work of Marchand (2012), as they are similarly based on the intensity of energy
extraction through the percentage that industry generates in total wages & salaries within
a Census division.4 The energy extraction sector is defined as oil and gas extraction, coal
mining, and support to oil, gas, and mining, based on the three-digit Standard Industry
Classification equivalent of the detailed RDC industry code.5 The full treatment set is
formed of seventeen Census divisions which derive ten percent or more of their total wages
& salaries from this energy extraction sector. A top treatment set of seven Census divisions
is also formed as a subset of the full treatment, with the prediction that the more intense the
energy extraction activity, the larger effect of the boom.6 The comparison set is constructed
of fifty-seven Census divisions that do not exceed five percent of their total wages & salaries
from the energy extraction sector in the pre-boom period of 1995, nor exceed ten percent
of their total wages & salaries from this sector in the post-boom period of 2005. Fourteen
Census divisions are also dropped from the analysis altogether, for either falling between
the definitions of the treatment and comparison sets or for being a large city exceeding
500,000 inhabitants.7 These treatment areas are spread out across the northern half and
eastern border of Alberta, the northeast and southeast corners of British Columbia, and
the mid-western portion and southeast corner of Saskatchewan, with no significant energy
resource deposits found in Manitoba, as seen in Figure 4.
The differential changes in the measures of inequality and poverty, before and after the
boom and between treatment and comparison areas, are used to identify the distributional
impacts of the recent energy boom through the local labor market variation in the equation:3While only the positive values are used to construct the inequality measures and poverty cutoffs, all of
the values are included in the poverty headcounts.4Marchand (2012) provides a detailed discussion of the local employment and earnings effects that hap-
pened over the entire boom-bust-boom cycle of the last four decades in Western Canada.5The other local industries used in the paper are based on the two-digit SIC equivalent of this RDC
industry code.6All of the treatment Census divisions are listed in descending order of energy extraction intensity in
Appendix Table A1.7These large cities are Calgary, AB, Edmonton, AB, Vancouver, BC, and Winnipeg, MN. No Census
division grows into this definition of a large city from the pre-boom to the post-boom period.
8
∆ln(Outcomec) = β · Treatmentc + εc (1)
where ln(Outcomect)−ln(Outcomect−1) is the change in the natural log of the labor market
outcome over time and Treatmentc is a binary indicator for whether the Census division,
c, is in either the treatment or comparison group. Huber-White standard errors are used
for these estimates. Unless otherwise stated, these differential regressions are the assumed
specification. Where specified, however, direct change regressions are also run for the sector-
specific analysis of the energy extraction industry, which is done for the full treatment areas
only, with two annual observations per Census division following the equation:
ln(Outcomect) = α+ δ ·Afterct + ηct (2)
where ln(Outcomect) is simply the natural log of the labor market outcome and Afterct
is a binary indicator for whether the area-year, ct, observation is in the post-boom year of
2005 or the pre-boom year of 1995. Clustered standard errors by Census division are used
for this specification.
The large number of individuals within each locality allows for the precise estimation
of the local distributional impacts of the energy boom in this study. These local outcomes
overcome the criticism of Tarozzi and Deaton (2009) regarding the small local sample
sizes that tend to plague the studies on developing countries. However, given that the
identification of this paper is based upon cross-sectional data to construct the local labor
market averages, migration into or out of these labor markets over time remains an issue
that affects the estimation. As a partial defense to this criticism, Marchand (2012) shows
that, while local populations were growing within Census divisions during this time period,
they did not grow differentially between the treatment and comparison areas. But this
issue can only be completely overcome by using longitudinal data, which follows the same
individuals over time, and there does not currently exist a longitudinal data set rich enough
in its number of individuals to represent the local level used in this study. As discussed by
Bartik (1991, 1996), migration will reduce the wage and employment effects of a local labor
demand shock through potential adjustments in local labor supply. Therefore, any estimates
9
based on cross-sectional data can be considered as the lower bound of the true impacts of
an energy boom, as the possibility of migration is expected to lead to an underestimation
of the coefficients.
4 Distributional Evidence of an Energy Boom
4.1 Local Sums within Deciles of the Distribution
Where are the gains from an energy boom concentrated across the distribution? In order
to answer this question, a sufficient number of distributional segments must be used for
the analysis while maintaining the representativeness of individuals within each segment.
Deciles were chosen as the best solution to balance this tradeoff.8 Rather than examine the
changes in the cutoffs between these segments using techniques such as quantile regression,
the local summation of the outcome within each decile is used to measure the changes
across the distribution. The differential changes in these local sums between the treatment
and comparison areas are estimated for each decile using equation (1).
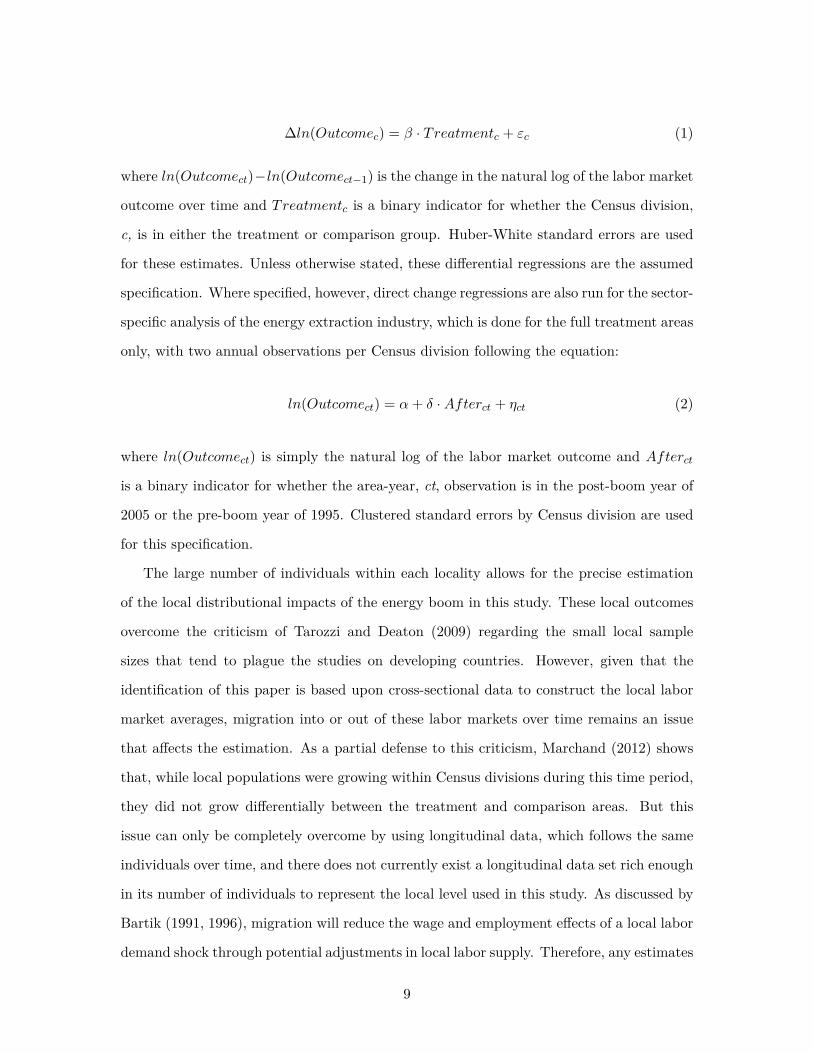
The columns of Table 1 contain the log change estimates from the bottom to the top
decile of the outcome distribution, with the rows representing each of the labor market
outcomes of total income, total earnings, and wages & salaries using the full and top
treatments. All deciles of the distribution experience significant differential growth due to
the boom, with all of the estimates being statistically significant at the one percent level,
regardless of the outcome definition or treatment set. This implies that all individuals
gain from the local labor demand shock of the energy boom. The relative magnitudes of
these within decile estimates provide even more insight when compared across deciles and
between treatment sets and outcome definitions.
The relative magnitudes of the estimates across deciles exhibit a distinct U-shaped pat-
tern, with a high differential change toward the bottom of the distribution, a low differential
around the middle of the distribution, and a return to a high differential at the top. This8The numeric boundaries of these deciles were determined separately for each outcome distribution by
local labor market and year. If these deciles boundaries were instead held constant across geography or time,this would introduce asymmetries to the distributions, hindering the accuracy of their results and makingthem incomparable to one another over time.
10
differential growth pattern implies that individuals at the lower end of the distribution are
catching up with individuals in the middle, while at the same time, individuals towards the
top of the distribution are pulling away from those in the middle. Using the full treatment
for total income, the 0.616 coefficient for the first decile is equivalent to a 61.6 differential
percentage change between treatment and comparison areas, which declines to a 29.6 per-
cent difference at the seventh decile and rises back up to a 43.2 percent difference by the
tenth decile. This U-shape pattern is consistent across outcomes definitions and treatment
sets, but the top treatment unambiguously produces larger differential growth than the full
treatment across all deciles and outcomes, with few exceptions. Therefore, the intensity of
the treatment does lead to a greater impact of the shock.
While the U-shape originates at the first decile for total income, it only begins at the
second to the fourth deciles for total earnings and wages & salaries, implying increasing
differential growth prior to a narrower U-shaped pattern for those outcomes. The largest
differential growth across all outcomes is found for total income in the lower half of the dis-
tribution, with a 63.8 differential percentage change using the top treatment. The smallest
differential change of 28.5 percent is found at the seventh decile for total earnings, which
is similar to the other outcomes using the full treatment, but it is in the ninth decile for
the top treatment, implying that the two sides of the U-shaped differential growth are not
symmetric. There is also a sharp rise in the magnitude of the differential change between
the ninth and tenth deciles regardless of outcome definition or treatment, with the largest
change being 60.5 percent for wages & salaries using the top treatment at the tenth decile.
4.2 Local Inequality Aggregates
Does an energy boom result in more or less inequality? To investigate this question, in-
equality is summarized locally using three different aggregate measures, each with its own
sensitivity to changes in a particular segment of the distribution. The Atkinson index is
more sensitive to changes in the lower end of the distribution, especially as the value of its
aversion parameter grows.9 The Gini coefficient is more sensitive to changes in the middle9This aversion parameter is set to a value of two in this study, which has been previously used to imply
a lot of weight on the lower tail of the distribution. The results for the Atkinson index with an aversionparameter set to one are available upon request for the author, and in almost all cases, were of smaller
11
of the distribution than either of its tails, as compared with other measures of inequality.
Lastly, the Theil entropy index is more sensitive to changes in the upper portion of the
distribution.10 Using equation (1), the differential changes are estimated for each of these
local inequality aggregates between the treatment and comparison areas.
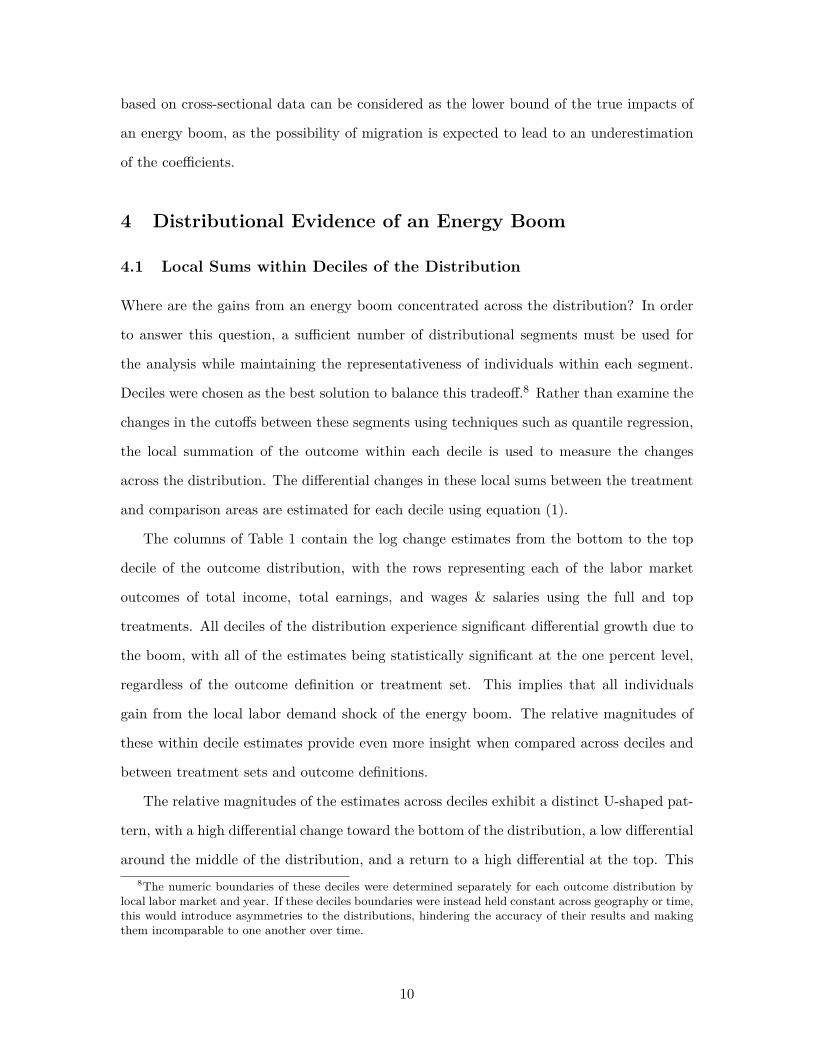
Table 2 presents the results in terms of the numeric and logarithmic changes for each
inequality measure, where the sensitivity from the bottom to the top of the distribution
matches the movement from the leftmost to the rightmost column. The rows represent the
outcome definitions of total income, total earnings, and wages & salaries, using both the full
and top treatments. The differential changes of the local inequality aggregates range from
statistically insignificant to significant at the ten, five, and one percent levels. This varying
significance may reflect the ambiguity of how the U-shaped differential growth found across
the distribution translates into differential changes in the local inequality aggregates.
Due to the boom, local inequality slightly decreased or remained unchanged for the
bottom-sensitive measure, slightly increased for the middle-sensitive measure, and moder-
ately increased for the top-sensitive measure. The changes to the Atkinson index were only
statistically significant for the outcome of total income at the five percent level, attributing
a slightly equalizing effect to the recent energy boom, with a differential reduction in local
inequality of 1.8 to 3.5 percent across treatments. The changes in the Gini coefficient show
that the energy boom led to a 1.7 to 3.1 differential percentage rise in local inequality across
total income, total earnings, and wages & salaries using the full treatment. Using the top
treatment, however, this result is only statistically significant for total income. A larger
increase in inequality is shown using the Theil entropy index, with a 12.8 to 19.8 differen-
tial percentage increase attributable to the boom, from the full to the top treatment. The
top treatment effects are all significant and larger in magnitude than the full treatment
effects, implying that those areas with more exposure to an energy boom experience larger
increases in inequality. But, the boom effect remained relatively constant in magnitude
across labor market outcomes using the top treatment.
magnitude than those presented.10The half of the square of the coefficient of variation was also used as a measure even more sensitive to
changes at the top of the distribution as compared to the Theil index. In almost all cases, the results wereof greater magnitude in both numeric and logarithmic changes than those of the Theil index. These resultsare available upon request from the author.
12

The local aggregate findings are consistent with the U-shape pattern in the growth
of the local sums within deciles. The bottom-sensitive measure, placing more weight on
the differential increase in growth at the bottom of the distribution, predicts a differential
reduction in inequality due to energy boom, while the top-sensitive measure, placing more
weight on the differential increase towards the top of the distribution, predicts a differential
increase in inequality. This highlights the importance of understanding the impacts across
the distribution rather than relying on a single inequality aggregate, and it potentially
explains some of the conflicting findings in the literature. Overall inequality is also greater
when using total earnings and wages & salaries than when using total income, in accordance
with the previous inequality results for the entire nation of Canada (Fortin et al., 2012).
4.3 Local Poverty Aggregates
Does an energy boom help to alleviate poverty? The answer begins with the local aggrega-
tion of poverty based on the headcount of individuals living below two different thresholds,
which are divided by the local population size to form poverty rates.11 The low income cut-
off (LICO) has been continually produced by Statistics Canada since 1968, as an unofficial
but widely-used quantification of poverty. It is a partly-absolute, partly-relative threshold
that is based on the percentage of income an average family spends on the necessities of
food, clothing, and shelter, plus an additional twenty percentage points.12 This cut-off in
total income is also differentiated by family size and urbanization, as well as adjusted over
time by a consumer price index.13 The half of the median value is a purely relative thresh-
old, which is calculated for all of the respective outcomes of total income, total earnings,
and wages & salaries. This relative measure may better account for more local price differ-
ences and reflects changes in inequality as well as poverty. Table 3 displays the effects from
the energy boom across the various poverty measures, which are estimated through the11The raw headcounts of the number of individuals living in poverty were also used as measures, with
similar results, albeit at smaller magnitudes in their percentage changes. These results are available uponrequest from the author.
12The market basket measure of poverty, recently developed by Human Resources and Skills DevelopmentCanada, is the closest to an absolute poverty measure for the nation. Murphy et al. (2012) compare thelevels and trends of these different poverty measures over time.
13The before-tax version of the LICO measure comes pre-defined within the Canadian Census dating backto the 1991 wave, while the after-tax version is additionally available in the 2006 wave.
13
differential change specification in equation (1). Each effect is calculated as a percentage
point and percentage change. All of the poverty estimates are statistically significant at
the one percent level.
Altogether, the hybrid measure of absolute and relative poverty decreases substantially,
while the purely relative measure slightly increases. The most recent energy boom is as-
sociated with a 4.8 to 4.9 differential percentage point decline in individuals living below
the low income cut off. This drastic differential reduction of 45.2 to 47.6 percent, an al-
most halving of the initial poverty rate, is even more notable considering that both energy
and non-energy areas were experiencing overall poverty reductions, as partly shown by the
provincial aggregates in Figure 3. This differential change was similar in magnitude using
either the full or the top treatment set. The results for the purely relative measure show
that individuals living below half of the median differentially increased due to the boom,
albeit at small magnitudes, ranging from a 0.7 to 1.5 differential percentage point increase
and a 4.5 to 7.5 differential percentage increase across all outcomes and treatments. Sur-
prisingly, the top treatment estimates are lower in magnitude for the two earnings outcomes
than for total income.
According to the weakly relative poverty arguments of Ravallion and Chen (2011), a
proportional increase across the income or earnings distribution will automatically lower
absolute poverty, while leaving relative poverty unchanged. In the current study, individ-
uals are being lifted out of poverty according to the low income cut-off, but they are not
necessarily catching up with the individuals further up the distribution in a relative sense.
If all individuals across the distribution share in the gains from the energy boom, then
this helps explain why it also led to a substantial decrease in the absolute-relative poverty
hybrid. On the other hand, the slight increase in the purely relative poverty measure is
still in line with the U-shape behavior across most segments of the distribution. Although
this growth pattern implies that the bottom of the distribution is growing by more than
the middle, it must not be growing by enough for individuals at the bottom to pass the
relative threshold of one half of the median outcome.
14

4.4 Local Sums within Deciles by Sector
Where are the gains from an energy boom concentrated across the distributions of different
sectors? The energy boom is expected to directly impact the energy extraction industry, as
it is the sector where the initial local labor demand shock is concentrated. Therefore, any
distributional boom effects should be greatest in this sector. In the presence of industry
spillovers, however, other local industries might also indirectly experience a labor demand
shock. Given that local goods cannot be traded, industries such as construction, retail trade,
and all services can be used to provide a representation of the other localized impacts taking
place outside of energy extraction due to the boom.14 Therefore, the indirect distributional
effects are likely to be experienced in these particular industries.
The local summations within distributional segments are calculated separately for the
energy extraction industry and each of the other local sectors. The direct changes within
deciles of the energy extraction sector are estimated using equation (2), before and after the
latest boom, but only within the full treatment areas, as the energy extraction industry is
not well represented in the comparison areas by definition. The indirect differential changes
within deciles of the local goods industries of construction, retail trade, and all services are
each estimated between the treatment and comparison areas, before and after the latest
boom, using the specification from equation (1). The outcome variable is now limited to
wages & salaries, as it best reflects the local labor market impacts of an energy boom,
and only the full treatment set is used. This allows the rows of Table 4 to represent the
different local sectors, with energy extraction followed by each of the other local industries.
All deciles of the distribution experience significant direct or indirect growth due to the
boom, with statistical significance at the one percent level across all of the estimates.
The distinct U-shaped pattern in the magnitudes of the differential growth is preserved
across all sectors, and the magnitudes of these within decile changes are much higher for
the energy extraction and construction sectors than for the general findings. The 55.714There are likely other local industries that could additionally experience spillovers, but the use of these
particular local sectors follows the work of Black et al. (2005) and Marchand (2012), which both identifiedsignificant employment and earnings spillovers from the energy extraction sector into these industries. Thetheoretical work of Cordon and Neary (1982) also defines its non-traded goods sector as “services” in itsmodel of the labor market effects of an energy boom.
15
percentage increase in the first decile of the energy extraction distribution declines to a
45.9 percentage increase in the fourth decile and then goes up to a 95.4 percent increase in
the tenth decile. The differential growth in the construction industry exhibits almost the
same pattern, as well as similar magnitudes in its upper deciles, as the direct changes in
energy extraction, but with much larger growth taking place its lower and middle deciles.
Although the U-shape originates at the first and second deciles across all sectors, implying
a wide U-shaped pattern, its inflection point lies at the fourth and fifth deciles for the
construction and energy extraction industries, while it is further up the distribution for
retail trade and all services.
For the retail trade industry, the pattern of growth across deciles was similar to that
of construction and energy extraction, but at much smaller magnitudes, ranging from a
39.5 differential percentage increase in the first decile to a similar 40.9 percent differential
change in the tenth decile. The smallest differential growth of 18.6 percent is found at the
eighth decile for the retail trade industry, an inflection point that is shared for all services.
However, the most notable deviation for all services is that its differential decile growth is
decreasing when moving from the bottom to the top of the distribution, with the exception
of a small increasing trend at the very top. The largest differential for all services is found
at the bottom decile with a 69.4 percent increase, which is at the opposite end of the
distribution of the largest differential for all of the other sectors.
4.5 Local Inequality Aggregates by Sector
How does an energy boom impact inequality within different sectors? The aggregate mea-
sures of the Atkinson index, Gini coefficient, and Theil entropy index are now used to
quantify inequality within each of the local sectors. Table 5 presents the estimates of the
boom effect on the inequality measures by sector as both numeric and logarithmic changes,
using equation (2) for the direct estimation in energy extraction in the local treatment areas
only, and using equation (1) for the indirect differential estimation in all of the other local
industries between the treatment and comparison areas. The outcome is again limited to
wages & salaries and only the full treatment set is used. The statistical significance of these
estimates varies across measures and sectors, from the bottom-sensitive measure only being
16
significant for services, to the middle-sensitive measure being significant for all sectors, to
the top-sensitive measure being significant for all sectors but services.
The aggregates for energy extraction display large and significant increases in local
inequality due to the boom, with a direct increase of 18.8 percent in the Gini coefficient
and a larger direct increase of 43.3 percent in the Theil index. The changes were not
significant, however, for the bottom-sensitive measure of the Atkinson index.15 These
results are consistent with the increasing magnitude of growth across the middle and top
segments of the distribution in this sector, while the decreasing magnitudes in the lower
end of the distribution were not substantial enough to generate changes in the aggregate.
These inequality increases for energy extraction are much greater than that of the general
differential increases, supporting the view that an energy boom is associated with more
inequality in the directly impacted sector than in the overall locality.
The same pattern of the boom increasing inequality was also found for the indirect
differential changes in the aggregates for the construction and retail trade industries, albeit
at much lesser magnitudes. For the construction industry, there was a 6.2 differential
percentage increase in the Gini coefficient and a 24.8 differential percentage increase in the
Theil index. For the retail trade industry, the recent boom lead to a smaller increase in
inequality, with differential growth of 4.3 percent in the Gini coefficient and of 16.7 percent
in the Theil index. Neither of these local industries displayed significant changes in their
Atkinson indices, similar to the energy extraction industry, which also match their patterns
of within segment growth across their distributions.
Most interestingly, whereas the boom led to a differential increase in inequality for
the local industries of construction and retail trade, it appears to have reduced inequality
in all services, with a 2.7 percent differential decrease in the Gini coefficient and a 4.4
percent differential decrease in the Atkinson index. Inequality changes with respect to the
top-sensitive Theil index were also negative but insignificant. Because Marchand (2012)
documented that the largest employment spillovers of the recent boom in Western Canada
were found from the energy extraction sector to all services, this may explain why inequality15There is a statistically significant differential increase in the Atkinson index for energy extraction when
the aversion parameter is set to a lower value of one, but with a similar change in magnitude as the Gini.
17
in this particular sector is lowered in this study. This equalizing effect of the energy boom
in this sector is also interesting given that overall employment in Canada, as well as for
most developed countries, is heavily concentrated in services. This implies that, if the
spillovers from energy extraction to services are sufficiently large, they might offset some
of the inequality increases attributable to the energy boom in the other local industries
5 Conclusion
In Western Canada, a region known for its energy resources, much of the recent rise in
inequality and decline in poverty took place during the energy boom from the mid-1990s to
the mid-2000s. These trends are ostensibly more pronounced in the provinces containing
greater energy resources than in those with lesser amounts of these resources. This study
attempts to answer several questions regarding the extent to which the recent energy boom
affected the distribution, through its positive shock to labor demand, using an empirical
approach based on local labor markets. Various measures of inequality and poverty are
aggregated at the local level to identify these impacts, utilizing local variation in energy
extraction intensity. This research is a unique contribution to the literature in its offering
of a complete investigation of the local distributional effects of an energy boom within a
developed country.
The gains from an energy boom are shown to be widely distributed across all segments
of the distribution, forming a significant U-shaped pattern in the relative magnitudes of
its growth in earnings and income. The decreasing relative magnitudes from the bottom
to the middle of the distribution led to a slight equalizing effect of the boom in one local
inequality aggregate, while the increasing relative growth from the middle to top tended
to modestly increase inequality in the other local aggregates. The boom effects were larger
for total earnings and wages & salaries than for total income, as well as larger for localities
with a greater dependence on energy extraction earnings. Low income poverty drastically
decreased due to the boom-induced gains in the bottom of distribution, while relative
poverty slightly increased, as the bottom of the distribution did not grow fast enough to
catch up with those further up the distribution.
18
When the results were further disaggregated by sector, the U-shaped pattern and its
significance across all segments of the distribution were preserved. The energy boom is
attributed to a large local inequality increase in the directly-impacted energy extraction
industry, driven by its significant increases in the relative magnitude of growth while mov-
ing up the distribution, and moderate indirect local inequality increases in the industries
of construction and retail trade. There was also a slight reduction in inequality for the
services sector, due to the decreasing relative magnitudes of growth across its distribution.
Altogether, this evidence suggests that a rising tide may have the ability to lift all boats,
although not proportionately.
Despite the differences in data sets and identification approaches, the results of this
local labor market study are in agreement with the provincial-level work of Fortin and
Lemieux (2014), with regards to the impacts of an energy boom in Canada being found
across the entire distribution and its contribution to a small reduction in inequality in the
lower half of the distribution. However, there is disagreement as to whether the boom also
led to a modest increase in inequality overall, as shown in this study as being caused by
the increasing relative magnitude growth from the middle to the top of the distribution
and the large inequality increases in the energy extraction sector. That said, the level of
employment in the energy extraction industry is quite small and there was further evidence
in the current study regarding a reduction in local inequality for the services sector, which
employs the majority of the work force. This might then translate into less provincial
inequality when taken together. Given the data and identification differences, more work
would need to be done in order to link the local results of the boom to the provincial and
national aggregates.
19
References
Aragon, F., and J. Rud (2013) “Natural resources and local communities: Evidence from aPeruvian gold mine.” American Economic Journal: Economic Policy 5(2), 1-25
Bartik, T. (1991) Who Benefits from State and Local Economic Development Policies?(Kalamazoo, MI: W.E. Upjohn Institute for Employment Research)
Bartik, T. (1996) “The distributional effects of local labor demand and industrial mix:Estimates using individual panel data.” Journal of Urban Economics 40, 150-78
Bhattacharyya, S., and J. Williamson (2013) “Distributional impact of commodity priceshocks: Australia over a century.” OxCarre Research Paper 117
Black, D., T. McKinnish and S. Sanders (2005) “The economic impact of the coal boomand bust.” Economic Journal 115(502), 444-71
Bourguignon, F., and C. Morrison (1990) “Income distribution, development and foreigntrade: A cross-sectional analysis.” European Economic Review 34, 1113-32
Breisinger, C., and J. Thurlow (2008) “Asian-driven resource booms in Africa: Rethinkingthe impacts on development.” IFPRI Discussion Paper 00747
Buccellato, T., and M. Alessandrini (2009) “Natural resources: A blessing or a curse? Therole of inequality.” Centre for Financial & Management Studies Discussion Paper 98
Buccellato, T., and T. Mickiewicz (2009) “Oil and gas: A blessing for few. Hydrocarbonsand inequality within regions in Russia.” Europe-Asia Studies 61(3), 385-407
Caselli, F., and G. Michaels (2009) “Do oil windfalls improve living standards? Evidencefrom Brazil.” NBER Working Paper 15550
Cordon, W., and J. Neary (1982) “Booming sector and de-industrialisation in a small openeconomy.” Economic Journal 92(368), 825-48
Deaton, J., and E. Niman (2012) “An empirical examination of the relationship betweenmining employment and poverty in the Appalachian region.” Applied Economics 44, 303-12
Fortin, N., D. Green, T. Lemieux, K. Milligan and W. Riddell (2012) “Canadian inequality:Recent developments and policy options.” Canadian Public Policy 38(2), 121-45
Fortin, N., and T. Lemieux (2014) “Changes in wage inequality in Canada: An interprovin-cial perspective.” Canadian Journal of Economics, accepted subject to minor revisions
Goderis, B., and S. Malone (2011) “Natural resource booms and inequality: Theory andevidence.” Scandinavian Journal of Economics 113(2), 388-417
Gylfason, T., and G. Zoega (2003) “Inequality and economic growth: Do natural resourcesmatter?,” in Inequality and Growth: Theory and Policy Implications, eds. T. Eicher andS. Turnovsky (MIT Press)
20
Howie, P., and Z. Atakhanova (2014) “Resource boom and inequality: Kazakhstan as acase study.” Resources Policy 39, 71-79
Lay, J., R. Thiele and M. Wiebelt (2006) “Resource booms, inequality, and poverty: Thecase of gas in Bolivia.” Kiel Institute for the World Economy Working Paper No. 1287
Leamer, E., H. Maul, S. Rodriguez and P. Schott (1999) “Does natural resource abundanceincrease Latin American income inequality?” Journal of Development Economics 59(1),3-42
Loayza, N., N. Teran and J. Rigolini (2013) “Poverty, inequality, and the local naturalresource curse.” IZA Working Paper 7226
López-Feldman, A., J. Mora and J. Taylor (2007) “Does natural resource extraction mit-igate poverty and inequality? Evidence from rural Mexico and a Lacandona rainforestcommunity.” Environment and Development Economics 12(2), 251-69
Marchand, J. (2012) “Local labor market impacts of energy boom-bust-boom in WesternCanada.” Journal of Urban Economics 71(1), 165-74
Michaels, G. (2010) “The long term consequences of resource-based specialisation.” Eco-nomic Journal 121(551), 31-57
Murphy, B., X. Zhang and C. Dionne (2012) “Low income in Canada: A multi-line andmulti-index perspective.” Statistics Canada Income Research Paper Series No. 75F0002M
Osberg, L. (2000) “Poverty in Canada and the United States: Measurement, trends, andimplications.” Canadian Journal of Economics 33(4), 847-77
Osberg, L. (2008) “A quarter century of economic inequality in Canada: 1981-2006.” Cana-dian Centre for Policy Alternatives, April
Osberg, L., and K. Xu (1999) “Poverty intensity: How well do Canadian provinces com-pare?” Canadian Public Policy 25(2), 179-95
Partridge, M., M. Betz and L. Lobao (2012) “Natural resource curse and poverty in Ap-palachian America.” American Journal of Agricultural Economics 95(2), 449-56
Ravallion, M., and S. Chen (2011) “Weakly relative poverty.” Review of Economics andStatistics 93(4), 1251-61
Tarozzi, A., and A. Deaton (2009) “Using census and survey data to estimate poverty andinequality for small areas.” Review of Economics and Statistics 91(4), 773-92
Weber, J. (2012) “The effects of a natural gas boom on employment and income in Colorado,Texas, and Wyoming.” Energy Economics 34(5), 1580-88
21

Figure 1: Real Price Trends of Crude Oil and Natural Gas
Notes: Author’s calculations based on 1990 to 2010 public-use data from the Canadian Association ofPetroleum Producers. The log real prices of crude oil and natural gas are based on the average wellhead/plantgate prices in dollars per cubic meter and per thousand cubic meters, respectively.
Figure 2: Provincial Inequality Trends for Western Canada
Notes: Author’s calculations based on CANSIM Table 202-0705 of Statistics Canada, representing the 1990to 2010 public-use data of the Survey of Consumer Finances and Survey of Labour and Income Dynamics.The inequality measure is the Gini coefficient using the after-tax total income of all family units. The restof Canada is the average of Ontario, Quebec, and the Atlantic provinces.
22

Figure 3: Provincial Poverty Trends for Western Canada
Notes: Author’s calculations based on CANSIM Table 202-0802 of Statistics Canada, representing the 1990to 2010 public-use data of the Survey of Consumer Finances and Survey of Labour and Income Dynamics.The poverty rate is defined using the after-tax low income cut-off of all persons. The rest of Canada is theaverage of Ontario, Quebec, and the Atlantic provinces.
Figure 4: Local Treatment and Comparison Areas in Western Canada
Notes: Author’s calculations based on wages & salaries in the 1996 Census data using the 2006 Censusdivision boundaries. The Census divisions within the full and top treatment sets are listed in descendingorder of energy extraction intensity in Appendix Table A1.
23

Table1:
Differentia
lCha
nges
inLo
calS
umswith
inDecile
sover
theBoo
m
Din
Logs
ofLo
calS
ums
wit
hin
Dec
iles
Tota
lInc
ome
1st
2nd
3rd
4th
5th
6th
7th
8th
9th
10th
Full
Trea
tmen
t0.6
16**
*0.4
74**
*0.3
79**
*0.3
43**
*0.3
41**
*0.3
29**
*0.2
96**
*0.2
98**
*0.2
98**
*0.4
32**
*(0.05
8)(0.05
2)(0.04
9)(0.05
1)(0.04
9)(0.04
9)(0.04
9)(0.05
0)(0.04
8)(0.05
8)To
pTr
eatm
ent
0.638
***
0.493
***
0.417
***
0.381
***
0.365
***
0.346
***
0.307
***
0.316
***
0.302
***
0.494
***
(0.08
0)(0.09
7)(0.09
4)(0.10
0)(0.09
2)(0.09
5)(0.09
1)(0.08
8)(0.07
8)(0.09
5)To
talE
arni
ngs
Full
Trea
tmen
t0.3
68**
*0.3
96**
*0.4
03**
*0.3
70**
*0.3
34**
*0.3
41**
*0.2
85**
*0.3
43**
*0.3
24**
*0.4
83**
*(0.08
4)(0.06
7)(0.06
5)(0.06
5)(0.05
6)(0.05
9)(0.05
0)(0.05
7)(0.05
1)(0.05
9)To
pTr
eatm
ent
0.446
***
0.474
***
0.466
***
0.402
***
0.386
***
0.328
***
0.336
***
0.328
***
0.312
***
0.541
***
(0.14
3)(0.10
2)(0.11
9)(0.10
6)(0.10
3)(0.10
6)(0.08
8)(0.09
0)(0.08
0)(0.10
4)W
ages
&Sa
lary
Full
Trea
tmen
t0.2
98**
*0.4
64**
*0.4
63**
*0.4
71**
*0.3
71**
*0.3
79**
*0.3
71**
*0.3
80**
*0.3
71**
*0.5
62**
*(0.09
8)(0.06
2)(0.06
1)(0.05
5)(0.05
5)(0.05
6)(0.04
7)(0.05
3)(0.05
0)(0.05
3)To
pTr
eatm
ent
0.361
**0.5
25**
*0.4
98**
*0.5
15**
*0.3
95**
*0.3
57**
*0.3
80**
*0.3
71**
*0.3
31**
*0.6
05**
*(0.15
8)(0.11
1)(0.11
5)(0.09
1)(0.10
3)(0.10
1)(0.08
7)(0.08
9)(0.07
7)(0.09
8)
Not
es:Autho
r’scalculations
of1996
and2006
Can
adianCen
susda
ta.T
hese
diffe
rentialg
rowth
regression
sfollo
wequa
tion(1)usingseventy-four
andsixty-fiv
elocala
reaob
servations
forthefullan
dtoptreatm
entsets
respectiv
ely,
with
Hub
er-W
hite
stan
dard
errors
inpa
renthe
ses.D
Logde
notesthechan
gein
thena
tural
logarit
hm.S
tars
deno
tethestatistic
alsign
ificance(*
for10%,*
*for5%
,and
***for1%
).
24

Table 2: Differential Changes in Local Inequality Aggregates over the Boom
Atkinson Index (e=2) Gini Coefficient Theil Entropy Index
Total Income D D Log D D Log D D Log
Full Treatment -0.016** -0.018** 0.008* 0.017* 0.064*** 0.128***(0.008) (0.009) (0.004) (0.008) (0.023) (0.037)
Top Treatment -0.032** -0.035** 0.014 0.029* 0.104** 0.198***(0.015) (0.016) (0.008) (0.017) (0.048) (0.072)
Total Earnings
Full Treatment -0.004 -0.005 0.015*** 0.029*** 0.077*** 0.150***(0.007) (0.007) (0.004) (0.009) (0.025) (0.039)
Top Treatment -0.015 -0.016 0.016 0.032 0.110* 0.198**(0.011) (0.012) (0.010) (0.020) (0.058) (0.085)
Wages & Salaries
Full Treatment -0.004 -0.004 0.015*** 0.031*** 0.076*** 0.150***(0.008) (0.009) (0.004) (0.009) (0.025) (0.039)
Top Treatment -0.011 -0.012 0.017 0.033 0.106* 0.191**(0.016) (0.017) (0.010) (0.020) (0.058) (0.087)
Notes: Author’s calculations of 1996 and 2006 Canadian Census data. These differential growth regressionsfollow equation (1) using seventy-four and sixty-five local area observations for the full and top treatmentsets respectively, with Huber-White standard errors in parentheses. D and D Log denote the numeric andlogarithmic changes. Stars denote the statistical significance (* for 10%, ** for 5%, and *** for 1%).
25
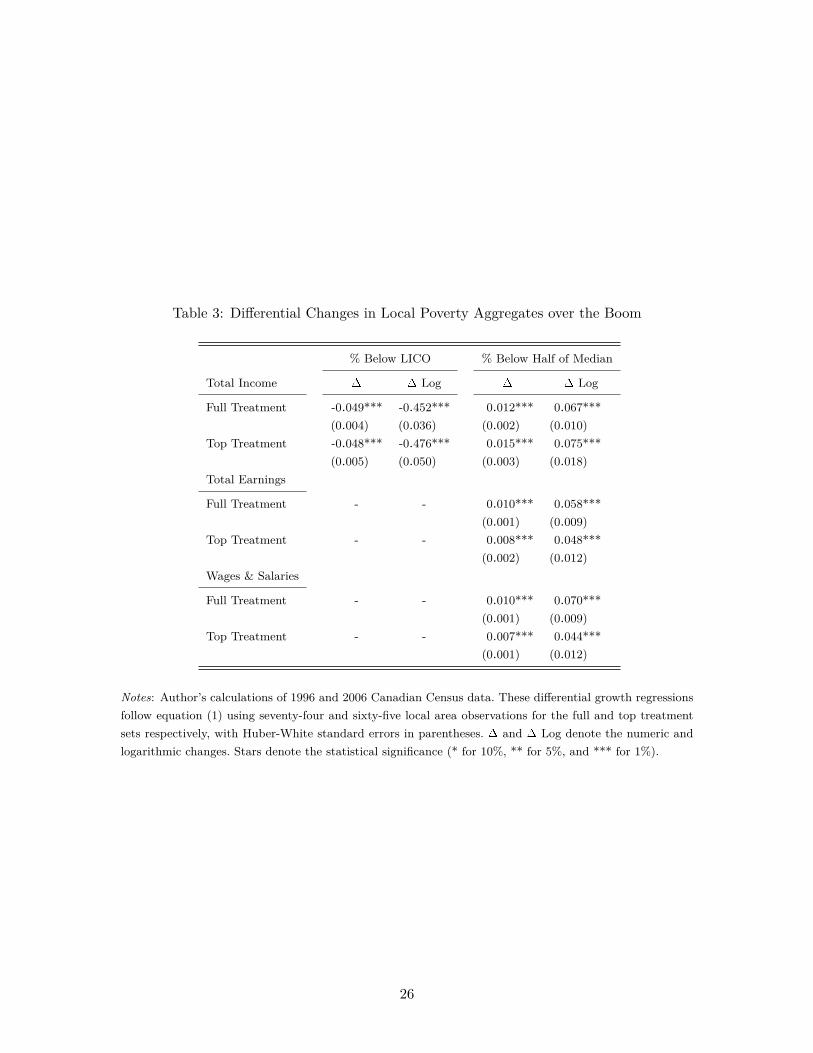
Table 3: Differential Changes in Local Poverty Aggregates over the Boom
% Below LICO % Below Half of Median
Total Income D D Log D D Log
Full Treatment -0.049*** -0.452*** 0.012*** 0.067***(0.004) (0.036) (0.002) (0.010)
Top Treatment -0.048*** -0.476*** 0.015*** 0.075***(0.005) (0.050) (0.003) (0.018)
Total Earnings
Full Treatment - - 0.010*** 0.058***(0.001) (0.009)
Top Treatment - - 0.008*** 0.048***(0.002) (0.012)
Wages & Salaries
Full Treatment - - 0.010*** 0.070***(0.001) (0.009)
Top Treatment - - 0.007*** 0.044***(0.001) (0.012)
Notes: Author’s calculations of 1996 and 2006 Canadian Census data. These differential growth regressionsfollow equation (1) using seventy-four and sixty-five local area observations for the full and top treatmentsets respectively, with Huber-White standard errors in parentheses. D and D Log denote the numeric andlogarithmic changes. Stars denote the statistical significance (* for 10%, ** for 5%, and *** for 1%).
26
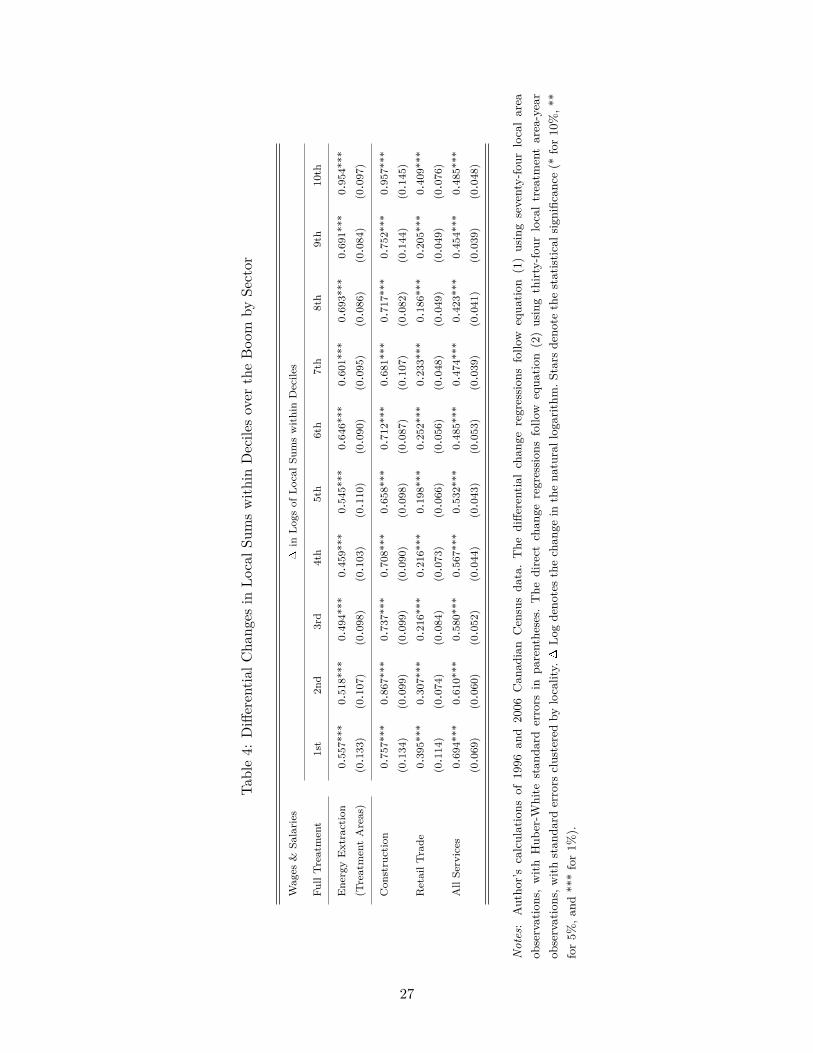
Table4:
Differentia
lCha
nges
inLo
calS
umswith
inDecile
sover
theBoo
mby
Sector
Wag
es&
Sala
ries
Din
Logs
ofLo
calS
ums
wit
hin
Dec
iles
Full
Trea
tmen
t1s
t2n
d3r
d4t
h5t
h6t
h7t
h8t
h9t
h10
th
Ene
rgy
Ext
ract
ion
0.557
***
0.518
***
0.494
***
0.459
***
0.545
***
0.646
***
0.601
***
0.693
***
0.691
***
0.954
***
(Tre
atm
ent
Are
as)
(0.13
3)(0.10
7)(0.09
8)(0.10
3)(0.11
0)(0.09
0)(0.09
5)(0.08
6)(0.08
4)(0.09
7)
Con
stru
ctio
n0.7
57**
*0.8
67**
*0.7
37**
*0.7
08**
*0.6
58**
*0.7
12**
*0.6
81**
*0.7
17**
*0.7
52**
*0.9
57**
*(0.13
4)(0.09
9)(0.09
9)(0.09
0)(0.09
8)(0.08
7)(0.10
7)(0.08
2)(0.14
4)(0.14
5)R
etai
lTra
de0.3
95**
*0.3
07**
*0.2
16**
*0.2
16**
*0.1
98**
*0.2
52**
*0.2
33**
*0.1
86**
*0.2
05**
*0.4
09**
*(0.11
4)(0.07
4)(0.08
4)(0.07
3)(0.06
6)(0.05
6)(0.04
8)(0.04
9)(0.04
9)(0.07
6)A
llSe
rvic
es0.6
94**
*0.6
10**
*0.5
80**
*0.5
67**
*0.5
32**
*0.4
85**
*0.4
74**
*0.4
23**
*0.4
54**
*0.4
85**
*(0.06
9)(0.06
0)(0.05
2)(0.04
4)(0.04
3)(0.05
3)(0.03
9)(0.04
1)(0.03
9)(0.04
8)
Not
es:
Autho
r’scalculations
of1996
and
2006
Can
adian
Cen
susda
ta.The
diffe
rentialchan
geregression
sfollo
wequa
tion
(1)usingseventy-four
localarea
observations,with
Hub
er-W
hite
stan
dard
errors
inpa
renthe
ses.
The
direct
chan
geregression
sfollo
wequa
tion(2)usingthirt
y-four
localtreatm
entarea-year
observations,w
ithstan
dard
errors
clusteredby
locality.D
Logdeno
testhechan
gein
thena
turallogarith
m.S
tars
deno
tethestatistic
alsign
ificance(*
for10%,*
*for5%
,and
***for1%
).
27
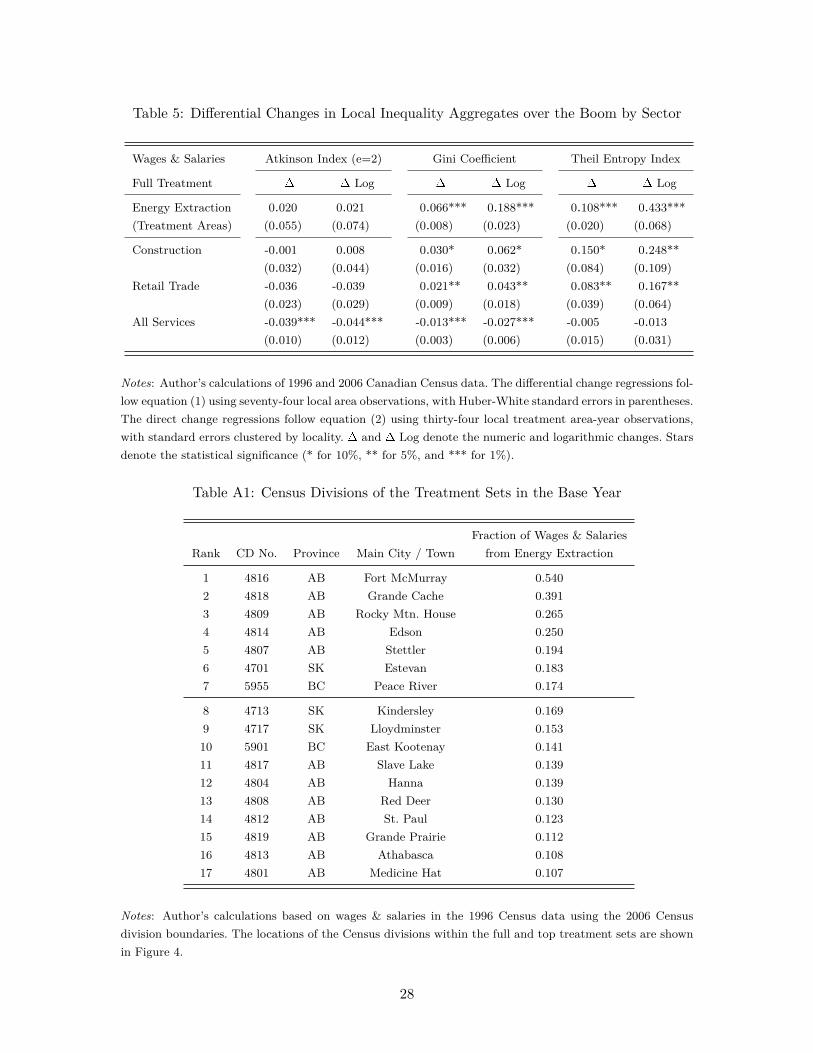
Table 5: Differential Changes in Local Inequality Aggregates over the Boom by Sector
Wages & Salaries Atkinson Index (e=2) Gini Coefficient Theil Entropy Index
Full Treatment D D Log D D Log D D Log
Energy Extraction 0.020 0.021 0.066*** 0.188*** 0.108*** 0.433***(Treatment Areas) (0.055) (0.074) (0.008) (0.023) (0.020) (0.068)Construction -0.001 0.008 0.030* 0.062* 0.150* 0.248**
(0.032) (0.044) (0.016) (0.032) (0.084) (0.109)Retail Trade -0.036 -0.039 0.021** 0.043** 0.083** 0.167**
(0.023) (0.029) (0.009) (0.018) (0.039) (0.064)All Services -0.039*** -0.044*** -0.013*** -0.027*** -0.005 -0.013
(0.010) (0.012) (0.003) (0.006) (0.015) (0.031)
Notes: Author’s calculations of 1996 and 2006 Canadian Census data. The differential change regressions fol-low equation (1) using seventy-four local area observations, with Huber-White standard errors in parentheses.The direct change regressions follow equation (2) using thirty-four local treatment area-year observations,with standard errors clustered by locality. D and D Log denote the numeric and logarithmic changes. Starsdenote the statistical significance (* for 10%, ** for 5%, and *** for 1%).
Table A1: Census Divisions of the Treatment Sets in the Base Year
Fraction of Wages & SalariesRank CD No. Province Main City / Town from Energy Extraction
1 4816 AB Fort McMurray 0.5402 4818 AB Grande Cache 0.3913 4809 AB Rocky Mtn. House 0.2654 4814 AB Edson 0.2505 4807 AB Stettler 0.1946 4701 SK Estevan 0.1837 5955 BC Peace River 0.174
8 4713 SK Kindersley 0.1699 4717 SK Lloydminster 0.15310 5901 BC East Kootenay 0.14111 4817 AB Slave Lake 0.13912 4804 AB Hanna 0.13913 4808 AB Red Deer 0.13014 4812 AB St. Paul 0.12315 4819 AB Grande Prairie 0.11216 4813 AB Athabasca 0.10817 4801 AB Medicine Hat 0.107
Notes: Author’s calculations based on wages & salaries in the 1996 Census data using the 2006 Censusdivision boundaries. The locations of the Census divisions within the full and top treatment sets are shownin Figure 4.
28

Department of Economics, University of Alberta Working Paper Series
2013-12: Privatization in China: Technology and Gender in the Manufacturing Sector – Dammert, Ana C., Ural-Marchand, B. 2013-11: Market Structure, Imperfect Tariff Pass-Through, and Household Welfare in Urban China – Han, J., Runjuan L., Ural-Marchand, B., Zhang, J. 2013-10: Shotgun Mechanisms for Common-Value Partnerships: The Unassigned-Offeror Problem – Landeo, C., Spier, K. 2013-09: Irreconcilable Differences: Judicial Resoluton of Business Deadlock – Landeo, C., Spier, K. 2013-08: The Effects of Exchange Rates on Employment in Canada – Huang, H., Pang, K., Tang, Y. 2013-07: How Did Exchange Rates Affect Employment in US Cities? – Huang, H., Tang, Y. 2013-06: The Impact of Resale on Entry in Second Price Auctions – Che, X., Lee, P., Yang, Y. 2013-05: Shotguns and Deadlocks – Landeo, C., Spier, K. 2013-04: Sports Facilities, Agglomeration, and Urban Redevelopment – Humphreys, B., Zhou, L. 2013-03: Forecasting U.S. Recessions with Macro Factors – Fossati, S. 2013-02: Strategic Investments under Open Access: Theory and Evidence – Klumpp, T., Su, X. 2013-01: Gender Wage-Productivity Differentials and Global Integration in China – Dammert, Ural-Marchand, B., Wan 2012-25: College Expansion and Curriculum Choice – Su, X., Kaganovich, Schiopu 2012-24: Exclusionary Vertical Restraints and Antitrust: Experimental Law and Economics Contributions – Landeo, C. 2012-23: Competition Between Sports Leagues: Theory and Evidence on Rival League Formation in North America – Che, X., Humphreys, B. 2012-22: Earnings and Performance in Women’s Professional Alpine Skiing – Che, X., Humphreys, B. 2012-21: The Effect of Electricity Retail Competition on Retail Prices – Su, X. 2012-20: Matching Funds in Public Campaign Finance – Klumpp, T. Mialon, H. Williams, M. 2012-19: File Sharing, Network Architecture, and Copyright Enforcement: An Overview – Klumpp, T. 2012-18: Money Talks: The Impact of Citizens United on State Elections – Klumpp, T., Mialon, H., Williams, M. 2012-17: Food for Fuel: The Effect of U.S. Energy Policy on Indian Poverty – Chakravorty, U., Hubert, M., Ural-Marchand, B. 2012-16: New Casinos and Local Labor Markets: Evidence from Canada – Humphreys, B., Marchand, J. 2012-15: Playing against an Apparent Opponent: Incentives for Care, Litigation, and Damage Caps under Self-Serving Bias – Landeo, C., Nikitin, M., Izmalkov, S. 2012-14: It Takes Three to Tango: An Experimental Study of Contracts with Stipulated Damages – Landeo, C., Spier, K. 2012-13: Contest Incentives in European Football – Humphreys, B., Soebbing, B.


![Metallic Electromigration Phenomena - Digchipapplication-notes.digchip.com/166/166-47937.pdfgrowth. (From [8].) When a filament finally bridges the gap between conductors, a sudden](https://img.pdfslide.us/doc/110x75/5ea91ad7bf50921a6b222985/metallic-electromigration-phenomena-digchipapplication-notes-growth-from-8.jpg)