Embed Size (px)
Citation preview

WORKING PAPER No 15 1 June 2005 ENGLISH ONLY
STATISTICAL COMMISSION and ECONOMIC COMMISSION FOR EUROPE CONFERENCE OF EUROPEAN STATISTICIANS Joint UNECE/EUROSTAT/FAO/OECD Meeting on Food and Agricultural Statistics in Europe (Rome, 29 June-1 July 2005)
STATISTICAL OFFICE OF THE EUROPEAN COMMUNITIES (EUROSTAT) FOOD AND AGRICULTURAL ORGANISATION (FAO) ORGANISATION FOR ECONOMIC CO-OPERATION AND DEVELOPMENT (OECD)
THE WINE SECTOR IN GREECE: NATIONAL TRENDS AND REGIONAL DISTRIBUTION
Supporting paper submitted by the National Statistical Service of Greece*
* Prepared by Mr. Kostas Rontos, Ms. Lemonia Dionysopoulou and Ms. Christine Pierrakou, National Statistical Service of Greece. Paper posted on Internet as received from the authors.

Working paper No 15 Page 2
1. INTRODUCTION
The recent years it has been observed a downward trend to agricultural holdings
and agricultural cultivated area in general. The continuing movement of farmers toward urban areas to find better working conditions in manufacturing and services is a considerable factor of this trend. Additionally, modern farming tends to substitute outdoor open field plantings with more profitable intensive plantings.
In this framework, wine sector following the introduction of a ban on new plantings and abandonment premia, European wine producing areas have gradually decreased since 1975/76. This reduction has accelerated annually since the 90’s. From 1976 to 1996, the areas under vines in the EU decreased from 4,5 to 3,4 million ha, which represents an annual decrease rate of 1,4%, i.e. almost 56.000 ha/year. In last few years however, the rate of reduction has clearly slowed down. In addition, the vineyards within the Community have, in general, aged, as they have not been replanted at a sufficient rate, although there are exceptions in certain regions. (CAP 2000).
In the same line with EU is the Greek wine sector. Research in this field is very limited (Messini Ch., 1997) especially for the cultivated area under vines and wine production. The present study was designed to explore the national trends and regional distribution of the wine sector in Greece, applying a time series analysis of the area under vines, holdings and their production in total country and by regions (NUTS II) from 1989 to 2003. More specific, the study aims to examine the trend movement of the holdings with area under vines, the area under vines and the wine production from 1989 to 2003 in total country and by region in Greece.
The selection of this certain sector has to do with its importance to the European Agricultural Economy. Even if the wine sector is reduced in terms of cultivated areas, as mentioned above, it remains a dynamic activity in Greece and Europe. Wine makes a considerable contribution to the value of final agricultural output.
In fact, wine never has been just a product for Greeks. The numerous archeological discoveries have revealed that wine has been an important part of the Greek culture for over 4000 years. Ancient Greeks knew well the nutritional value of wine as well as its important role to the growth of the local economy. Dionyssus, one of the most worshiped Greek Gods, represents the culture of wine for the ancient Greeks. Every March a wine celebration known as “Dionyssia” took place in Athens. The ancient theater of Dionyssus, located below the Parthenon, is a clear testament to the strong influence of this God in the every day life of the Greeks. Wine was always diluted with water before drinking in a vase called “kratiras,” derived from the Greek word krasis, meaning the mixture of wine and water. The word Krasi is now currently used in the Greek language as the term for wine. (http://www.allaboutgreekwine.com)
The most popular for their wines areas of Greece were the islands of Chios, Lemnos, Lesvos, Rhodes and Crete as well as Thrace and Macedonia to the mainland. Evidence from numerous shipwrecks has shown that Greek wine was traded throughout the known ancient world. The trade of Greek wine was organized in a way to become one of the methods Greeks used to spread their culture to the ancient world. The islands of the Aegean Sea were so famous for the quality of their wine that Homer referred to the Aegean as the “Wine-dark Sea”.
In recent years, Greek wine industry has made great progress due to serious investments in modern wine making technology. The Greek wines receive the highest awards in international competitions and international recognition. What make the Greek wine so unique is the indigenous grape varieties (more than 300) grown in

Working paper No 15 Page 3
3
Greece. The distinct flavors of the native grape varieties are a strong advantage for the marketing of the Greek wine industry. Another advantage of the Greek wine is the Greek climate. The plentiful sunshine combined to the low average rainfall and soils of moderate fertility provide an excellent environment for the production of high quality wines.
• The map of Greek Quality Wines
To facilitate the following analysis and to make the paper more informative, we present the map of Greek Quality Wines in this introductory section. According to article 2, paragraph 2 of Regulation Council Regulation (EEC) No 357/79 of 5 February 1979 on statistical surveys of areas under vines, the area under wine grape varieties, further broken down into quality wines produced in specific regions (psr) and other wines.
The EU legislation for vine varieties are the Council Regulations (EEC) No 3800/81 determining the classification of vine varieties and No 3801/81 laying down transitional provisions for the classification of authorized wine varieties for cultivation in Greece.
The main Greek quality wines produced in specified regions are presented bellow, sorted by regions (NUTS II).
Kentriki Makedonia
One of the oldest and finest wine-making regions in Greece is Kentriki
Macedonia. ‘Naoussa’ is one of the delicious quality wines (psr) made from the native grape, Xinomavro. Another full-bodied quality wine (prs) produced in Kentriki Makedonia is ‘Goumenissa’, made from grapes Xinomavro and Negkoska.
In Epanomi, only few miles away from Thessaloniki, the mild local climate in combination to sandy clay soils bring out the best qualities in the grapes, which produce a range of world class wines. One of the largest and most picturesque vineyards in Europe is located on the western coast of Halkidiki, at the slopes of Mount Meliton. Two of the most delicious quality wines (psr) are the ‘Plages Melitona’ (white) (Côtes de Meliton) made from a combination of indigenous white grapes Athiri, Asirtiko and Roditis and ‘Plages Melitona’(red) (Côtes de Meliton) made from the distinctive grapes Limnio, Kamberne Fran (Black) and Kamberne Sovinion (Black).
Dytiki Makedonia In Dytiki Macedonia, in the remote region of Amyntaio, a delicious quality wines
(psr) “Amyntaio” has been produced from the native grape, Xinomavro. Ipeiros In Ipeiros there are some of the most mountainous vineyards in Greece, hidden
between the slopes of Mt. Pindos. In this region, despite the difficult growing conditions, some excellent wines are being produced. The quality wines (psr) ‘Zitsa’ has been produced from Dembina grapes.

Working paper No 15 Page 4
4
Thessalia In Rapsani the peaks of Mount Olympus and the neighboring Aegean sea form a
unique microclimate that provide a positive effect on the production of the distinct Rapsani red wines made from a combination of indigenous Xinomavro, Krassato and Stavroto grapes. The soil, rich in iron schist, the vineyards’ close proximity to the sea and the ideal adaptation of the 3 native grapes to the environment have created perfect conditions for the production of the outstanding quality wines (psr) ‘Rapsani’. Another two quality wines (psr) are ‘Messenikola’ made from Messenikola (Black), Carignan & Syrah and ‘Aghialos’ made from a combination of Roditis and Savvatiano grapes.
Ionian islands The beautifully green and mountainous island of Cephalonia is recognized as the
most important of the Ionian islands for the production of new style Greek wines. The native Rombola grapes are the local viticultural treasure together with Mavrodaphne and Moschato (white). ‘Rombola of Cephalonia’ is one of the three quality wines (psr) produced here from Rombola grapes. The other two quality wines (psr) are ‘Moschatos of Cephalonia’ made from Moschato (white) grapes and ‘Mavrodaphne of Cephalonia’ made from a combination of Mavrodaphne and Black Korinthiaki grapes.
Dytiki Ellada The vineyards, located south of Patras on the slopes of the Achaia mountains,
consist of unique indigenous varieties which produce wines that continue to receive the international recognition and acclaim they deserve. There are produced four quality wines (psr): the popular ‘Mavrodaphne Patron’, a fortified red wine made from the Mavrodaphne and Korinthiaki grapes, two delicious aromatic white dessert wines, ‘Moschato Patron’ and ‘Moschato Rio of Patras’ made from the Moscato (white) grape and a savory dry white named ‘Patra’, made from the Roditis grape.
Peloponnisos One of the most historic wine regions of Greece is Peloponnisos. The vineyards of
the Peloponnisos are known for their diversity and complexity, spread throughout hillsides, plains and plateaus. One of the most important regions in southern Greece for the production of red wines is Nemea. It is used the Agiorgitiko grape which produces the quality wine (psr) ‘Nemea’ famous for their deep red color, complex aroma and long, velvety palate. Another important region is Mantineia where the noble Moschofilero grape is cultivated producing the quality wine psr ‘Mantineia’.
Voreio Aigaio The Aegean islands have an important winemaking tradition that dates back to the
Neolithic age. Having developed a strong shipping network, our Aegean ancestors traded their wines throughout the known ancient world. The moderate Mediterranean climate of the Aegean combined with the rocky, volcanic soil, plentiful sunshine and constant sea breezes provide excellent conditions for the cultivation of grapes.

Working paper No 15 Page 5
5
The island of Samos, whose history of wine culture dates back to the third millennium B.C., gained an unparalleled and long-lasting international reputation for its sweet Moscato (white) grapes that began in the 1600's. Now entering its fifth millennium of wine production, the island's quality wine (psr) ‘Samos’ is as outstanding and fabulously delicious today as it was in the time of the Renaissance.
The island of Limnos is known for two quality wines (psr): the ‘Moschatos Limnou’ and ‘Limnos’ made both from Moschato grape.
Notio Aigaio Rhodes, legendary island of the knights, was one of the first areas in ancient
Greece known for the production of wine. Rhodes enjoys the longest periods of sunshine and the shortest periods of rainfall in all of Greece, favorable factors in the production of the high quality Rhodos wines. The dominant grapes are the white Athiri and the red Mantilaria, cultivated on the northwesterly slopes of Mount Attaviros, produce the two elegant quality wines (psr) ‘Rhodos’ white and red respectively. Another quality wine (psr) ‘Moschatos Rhodou’ from Moschato grapes is also made in Rhodes.
On the breathtaking island of Santorini, the production of wine dates back to the time of the Bronze Age. After the devastating volcanic explosion, circa 1650 BC, the island was covered with volcanic ash, lava and pumice stone. This catastrophe created the foundation for perfect soil conditions, which now produce very distinctive wines. The vines are cultivated in low basket shaped crowns, close to the ground for protection from the strong winds. Coming off the sea, the nocturnal fog brings needed water to the vines during the hot summer nights and together with the refreshing northerly winds provide excellent growing conditions for the creation of the superb Santorinis’ quality wines (psr).
The ancient civilization of Santorini was completely destroyed by a catastrophic volcanic explosion that occurred somewhere between 1620-1640, BC. With every trace of life gone, all that remained was covered with volcanic ash; lava and pumice stone, which eventually lead to the creation of a compact soil, called aspa. It was in Santorini that Archeologists discovered the ancient village of Acrotiri, the oldest and best-preserved bronze-age village in Europe. The archeologists unearthed a great deal of evidence here that indicated the existance of viniculture and winemaking as far back as the Bronze Age. They found carbonized grape seeds, drawings that included evidence of vine cultivation and winemaking as well as numerous amphoras that were used to store the wine. Ironincally, it was the aspa created from the volcanic lava that preserved this ancient era in Greek Civilization for future generations to study Maragou, A. (1990), Kopaka, K. (1997).
The porous volcanic soil of Santorini allows the earth to retain water, giving the vineyards the ability to stay nourished during the high summer temperatures. During the hot Greek summer, rains are extremely rare and the only source of water for the vineyards is the nocturnal fogs. After the evening sun sets the island becomes enveloped in a fog that comes in from the sea. The vines are able to retain the water they need from this evening fog and use it during the warm daylight hours when it is needed most. Santorini was also one of the rare wine making areas in the world not attacked by phylloxera, because of the high content of sand found in volcanic soil. Because of their resistance to phylloxera, most of the picturesque vineyards that cover the island are more than 100 years old and retain their original root stocks.

Working paper No 15 Page 6
6
Every trace of life on this enchanting island is found on the top of an impressive rock. The winds saturate the island throughout the year. The only way for the grapes to survive from the direct exposure of sun and strong winds is to be protected inside low-basket-shaped vines, the ampelies, as they are called locally. The refreshing northerly winds that blow from July to September; known as the meltemia, also help keep the vines from developing the numerous fungi that can result from the combination of summer heat and humidity.
The different wines of Santorini owe their special qualities to the unique geology of Santorini. The soil is rich in inorganic ingredients, but very poor in organic ingredients.
Asirtiko is probably Greece’s finest multi-purpose white grape variety. It was first cultivated on the island of Santorini, where it has developed a unique character. It has the ability to preserve its acidity while keeping a high alcoholic content. Asirtiko gives a bone-dry wine that has citrus aromas mixed with the characteristic earthy flavors that the volcanic soil of Santorini provides It ends with a pleasantly mineral aftertaste. The last 25 years Asirtiko was replanted at an area near Thessaloniki and from there many other winemaking regions of Greece have begun to plant the grape. Away from Santorini, Asirtiko expresses a milder and more fruity character with less earth and mineral hints.
In Santorini, Asirtiko can also be used together with the aromatic Aidani and Athiri grapes for the production of the quality wine (psr) ‘Santorini’.
Athiri is one of the most ancient of Greek grape varieties. The name of the grape gets its name from Thira, which is the other name for Santorini. In ancient times Athiri was known for the production of sweet wines. The grapes mature early, have a thin skin and give sweet and juicy fruit that are qualities especially in demand for the production of sweet wines. It produces wines slightly aromatic, having medium alcoholic content with low acidity. Athiri has been replanted in several other regions of Greece, with the variety being especially popular in the Rhodes, Macedonia and the Islands of the Cyclades.
Aidani is another ancient Greek grape variety. We find it only in the Islands of the Cyclades, especially on the island of Santorini, Naxos and Paros. It produces wines pleasantly aromatic with medium alcoholic content and acidity. It can be successfully mixed with grapes having high alcoholic content and acidity such as Asirtiko.
The island of Paros are known for two quality wines (psr): the ‘Paros’ made from a combination of Monemvasia and Mantilaria grapes and ‘Paros’ (white) made from Mantilaria grape.
Kriti The winemaking tradition of Crete dates back almost 4000 years ago to the
celebrated Minoan Civilization. In fact it was on Crete near the village of Archanes that the oldest wine press in the world was discovered. The vineyards of Crete are planted on the northern part of the island, protected from the warm African winds by the mountains that crisscross the island from east to west. The unique Cretan ecosystem provides the ideal environment for the production of six quality wines (psr). The first two quality wines (psr) are ‘Sitia’ (red) made from a combination of Liatiko and Mantilaria and ‘Sitia’ (white) made from Vilana and Thrapsathiri grapes. The other two quality wines (psr) are ‘Peza’ (red) and ‘Archanes’, made from a combination of Kotsifali and Mantilaria grapes. The last two ones are ‘Dafnes’ and ‘Peza’ (white) made from Liatiko and Vilana grapes respectivelly.

Working paper No 15 Page 7
7
2. DATA AND METHODS
The source of data comes from basic surveys of area under vines of years 1989
and 1999 and the intermediate statistical surveys of area under vines for the rest years. These surveys carried out by National Statistics Service of Greece, according to Council Regulation (EEC) No 357/79 of 5 February 1979 on statistical surveys of areas under vines, as amended by Council Regulation (EEC) No 3719/81.
According to the above legislation (article 1, paragraph 1 of the Council Regulation (EEC) No 357/79), Member States shall carry out: a) Every 10 years basic survey on the area under vines; b) Annually from the second year after the basic surveys, intermediate surveys on the changes taking place in the areas under vines.
Because of this procedure missing data should have been for the first year after the basic survey (1990 and 2000). However the data for the year 1990 exists, because the intermediate survey was carried out for national purposes.
Missing observations can be problematic in analysis, and some time series measures cannot be computed if there are missing values in the series. Sometimes the value for a particular observation is simply not known. Missing data at the beginning or end of a series pose no particular problem; they simply shorten the useful length of the series. Gaps in the middle of a series (embedded missing data) can be a much more serious problem. The extent of the problem depends on the analytical procedure you are using. For this reason, the missing values for the year 2000 are replaced with their predicted values of their linear trend for that point as suggested by SPSS v. 13.
Exponential smoothing method is used to remove unexpected and not regularly repeated facts that influence the annual data Gardner (1985), Makridakis, Wheelwright, and McGee (1983), Makridakis and Wheelwright (1989) and Montgomery, Johnson, & Gardiner (1990), Rontos J. and Rondos K. (1996).
Exponential Smoothing has become very popular as a forecasting method for a
wide variety of time series data. A simple and pragmatic model for a time series would be to consider each observation as consisting of a constant b and an error component ε (epsilon), that is:
Xt = b + ε t. The constant b is relatively stable in each segment of the series, but may change
slowly over time. If appropriate, then one way to isolate the true value of b, and thus the systematic or predictable part of the series, is to compute a kind of moving average, where the current and immediately preceding (“younger”) observations are assigned greater weight than the respective older observations. Simple exponential smoothing accomplishes exactly such weighting, where exponential smaller weights are assigned to older observations. The specific formula for simple exponential smoothing is:
St = α * Χt +(1- α) * St-1 Each smoothed value is the weighted average of the previous observation,
where the weights decrease exponentially depending on the value of parameter α (alpha). If α is equal to 1, then the previous observation are ignored entirely; if α is equal to 0, then the current observation is ignored entirely. Values of α in-between will produce intermediate results.
Gardner (1985) discusses various theoretical and empirical arguments for selecting an appropriate smoothing parameter. Obviously, looking at the formula presented above, α should fall into the interval between zero (0) and one (1). He
Working paper No 15 Page 8
8
reports that among practitioners, the exponential smoothing parameter α smaller than 0,30 is usually recommended. In this study, Simple Exponential Smoothing Method was used to smooth the data series.
Trend Analysis was afterwards implemented on those data in order to make intermediate forecasting projections. It was fitted the most appropriate trend model (linear or quadratic) in data, according to the value of coefficient 2R . This coefficient measures the proportion of variation in Y that is explained by the independent variable Lavine, D., Krehbiel T., Berenson M.(2000)
Data processing was carried out with MS Excel and Statistical packages SPSS, Minitab.
Finally, in order to compute the indicator of production by area, we divide the production (total, quality wines, other wines) by cultivated area (total, quality wines, other wines) for the same growing year. This indicator describes the production capacity by cultivated area for each year.
3. ANALYSIS OF BASIC RESULTS
3.1. Holdings, total area under vines and wine production in National level
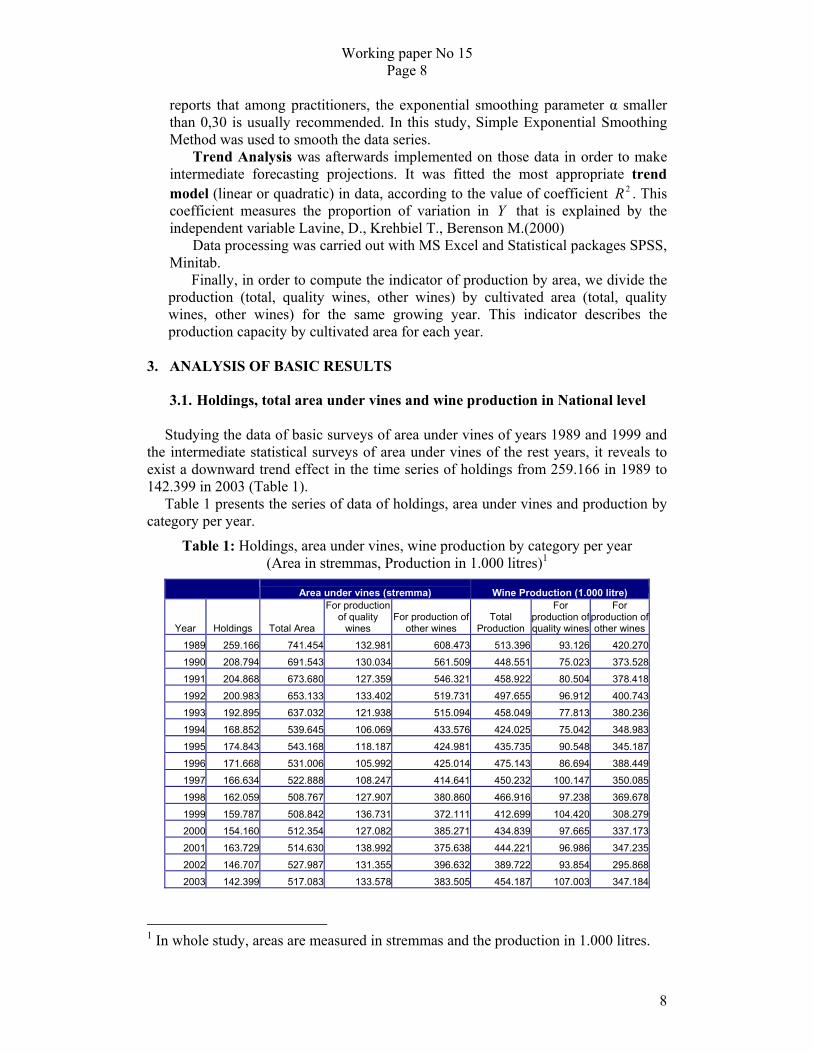
Studying the data of basic surveys of area under vines of years 1989 and 1999 and the intermediate statistical surveys of area under vines of the rest years, it reveals to exist a downward trend effect in the time series of holdings from 259.166 in 1989 to 142.399 in 2003 (Table 1). Table 1 presents the series of data of holdings, area under vines and production by category per year.
Table 1: Holdings, area under vines, wine production by category per year (Area in stremmas, Production in 1.000 litres)1
Area under vines (stremma) Wine Production (1.000 litre)
Year Holdings Total Area
For production of quality
wines For production of
other wines Total
Production
For production of quality wines
For production of other wines
1989 259.166 741.454 132.981 608.473 513.396 93.126 420.270
1990 208.794 691.543 130.034 561.509 448.551 75.023 373.528
1991 204.868 673.680 127.359 546.321 458.922 80.504 378.418
1992 200.983 653.133 133.402 519.731 497.655 96.912 400.743
1993 192.895 637.032 121.938 515.094 458.049 77.813 380.236
1994 168.852 539.645 106.069 433.576 424.025 75.042 348.983
1995 174.843 543.168 118.187 424.981 435.735 90.548 345.187
1996 171.668 531.006 105.992 425.014 475.143 86.694 388.449
1997 166.634 522.888 108.247 414.641 450.232 100.147 350.085
1998 162.059 508.767 127.907 380.860 466.916 97.238 369.678
1999 159.787 508.842 136.731 372.111 412.699 104.420 308.279
2000 154.160 512.354 127.082 385.271 434.839 97.665 337.173
2001 163.729 514.630 138.992 375.638 444.221 96.986 347.235
2002 146.707 527.987 131.355 396.632 389.722 93.854 295.868
2003 142.399 517.083 133.578 383.505 454.187 107.003 347.184
1 In whole study, areas are measured in stremmas and the production in 1.000 litres.

Working paper No 15 Page 9
9
A decrease also exists in the series of total area under vines from 741.454 in 1989 to 517.083 in 2003 as well as in wine production from 513.396 in 1989 to 454.187 in 2003 (Table 1).
These decreases in total area and wine production may have occurred for many reasons. One of them is the change in the socio-economic structure of the Greek agricultural holdings. The development of the much more profitable tourist industry is such a reason. In the last fifteen years, many regions such as Notio Aigaio, Kriti, Peloponnisos have highly developed the tourist industry. This development has urged the farmers to abandon their agricultural employment and become involved with tourism.
Figure 1: Holdings of area under vines by year
0
50.000
100.000
150.000
200.000
250.000
300.000
Hol
ding
s
1989 1990 1991 1992 1993 1994 1995 1996 1997 1998 1999 2000 2001 2002 2003
Year
According to article 2, paragraph 2 of the Council Regulation (EEC) No 357/79,
the area under wine grape varieties, further broken down into quality wines psr and other wines.
In Figure 2 there is a presentation of total area under vines broken down into quality wines psr and other wines. There is a downward trend effect in the time series of total area from 741.454 in 1989 to 517.083 in 2003 (Table 1). This reduction is due to the decrease of area for production of other wines from 608.473 in 1989 to 383.505 in 2003, when the area for the production of quality wines shows a small increase during the period from 132.981 in 1989 to 133.578 in 2003 (Table 1).

Working paper No 15 Page 10
10
Figure 2: Area under vines from 1989 to 2003
0
100.000
200.000300.000
400.000
500.000
600.000700.000
800.000
Are
a (in
stre
mm
as)
1989 1991 1993 1995 1997 1999 2001 2003Year
Forproductionof qualitywines
Forproductionof otherwines
The same result come from the comparison of the two basic surveys (1989 and 1999) for the area of quality wines and other wines (Figure 3).
Figure 3: Area under vines per wine category for the basic surveys (1989, 1999).
82,06%
73,13%
17,94%26,87%
0,00%
10,00%
20,00%
30,00%
40,00%
50,00%
60,00%
70,00%
80,00%
90,00%
For production of otherwines
For production of qualitywines
19891999
Figure 4 presents the wine production break down into quality wines psr and other wines. There is a downward trend effect in the time series of total production from 513.396 in 1989 to 454.187. in 2003 (Table 1). This reduction is due to the decrease of production of other wines from 420.270 in 1989 to 347.184 in 2003, while there is an increase in production of quality wines from 93.126 in 1989 to 107.003 in 2003 (Table 1).

Working paper No 15 Page 11
11
Figure 4: Wine production from 1989 to 2003
0
100.000
200.000
300.000
400.000
500.000
600.000
Pro
duct
ion
(in 1
000
l.)
1989 1991 1993 1995 1997 1999 2001 2003
Year
Forproductionof qualitywines
Forproductionof otherwines
Same results come from the comparison of the two basic surveys (1989 and 1999) for the area of quality wines and other wines (Figure 5).
Figure 5: Wine production per wine category for the basic surveys (1989, 1999)
81,86%
74,70%
18,14%
25,30%
0,00%
10,00%
20,00%
30,00%
40,00%
50,00%
60,00%
70,00%
80,00%
90,00%
For production of other wines For production of quality wines
19891999
Working paper No 15 Page 12
12
Indicators of production by area under vines
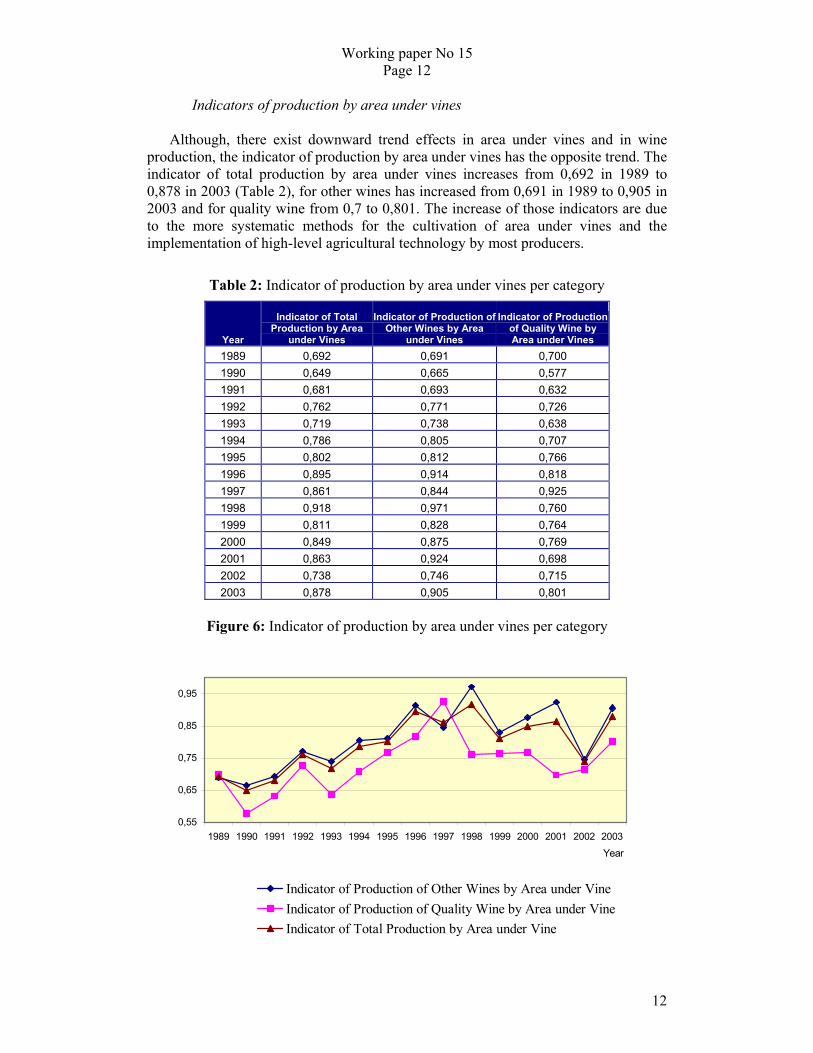
Although, there exist downward trend effects in area under vines and in wine production, the indicator of production by area under vines has the opposite trend. The indicator of total production by area under vines increases from 0,692 in 1989 to 0,878 in 2003 (Table 2), for other wines has increased from 0,691 in 1989 to 0,905 in 2003 and for quality wine from 0,7 to 0,801. The increase of those indicators are due to the more systematic methods for the cultivation of area under vines and the implementation of high-level agricultural technology by most producers.
Table 2: Indicator of production by area under vines per category
Year
Indicator of Total Production by Area
under Vines
Indicator of Production of Other Wines by Area
under Vines
Indicator of Production of Quality Wine by Area under Vines
1989 0,692 0,691 0,700 1990 0,649 0,665 0,577 1991 0,681 0,693 0,632 1992 0,762 0,771 0,726 1993 0,719 0,738 0,638 1994 0,786 0,805 0,707 1995 0,802 0,812 0,766 1996 0,895 0,914 0,818 1997 0,861 0,844 0,925 1998 0,918 0,971 0,760 1999 0,811 0,828 0,764 2000 0,849 0,875 0,769 2001 0,863 0,924 0,698 2002 0,738 0,746 0,715 2003 0,878 0,905 0,801
Figure 6: Indicator of production by area under vines per category
0,55
0,65
0,75
0,85
0,95
1989 1990 1991 1992 1993 1994 1995 1996 1997 1998 1999 2000 2001 2002 2003
Year
Indicator of Production of Other Wines by Area under VineIndicator of Production of Quality Wine by Area under Vine Indicator of Total Production by Area under Vine

Working paper No 15 Page 13
13
3.2. Regional analysis of area under vines Total area under vines Table 3 presents the data of total area under vines by region from 1989 to 2003.
Table 3: Total area under vines by region (Area in stremmas)
Years
Anatoliki Makedonia & Thraki
Kentriki Makedonia
Dytiki MakedoniaThessaliaIpeiros
Ionia Nisia
Dytiki Ellada
Sterea Ellada Pelop/sos Attiki
Voreio Aigaio
Notio Aigaio Kriti
1989 6.130 23.352 16.466 31.545 6.995 41.686131.966 78.953 105.744 109.583 26.211 58.474104.349
1990 5.794 31.788 16.001 38.367 7.256 39.714106.334 69.389 96.327 102.152 24.215 60.941 93.265
1991 5.383 29.918 15.529 36.317 7.198 39.193104.106 67.975 92.108 100.939 24.200 60.479 90.335
1992 6.210 23.506 16.082 36.185 7.355 37.628 94.999 66.782 90.919 96.916 23.841 60.725 91.984
1993 6.017 22.062 15.664 35.279 6.586 35.724 97.353 66.857 86.055 96.068 24.226 59.828 85.313
1994 7.701 21.291 17.011 27.891 5.117 26.300 77.393 67.254 75.995 82.701 20.798 44.390 65.803
1995 7.225 20.172 17.628 25.717 5.064 27.116 80.500 66.738 77.491 82.698 21.020 43.902 67.898
1996 6.649 19.359 17.632 26.525 4.797 25.790 76.160 63.698 79.270 82.728 20.014 42.402 65.983
1997 6.706 19.687 16.539 29.327 5.124 25.421 77.861 65.567 75.049 81.981 18.652 39.906 61.068
1998 3.301 26.155 17.245 26.116 7.067 29.778 72.621 61.794 76.575 68.964 22.408 39.871 56.872
1999 3.844 24.945 16.900 30.437 6.324 27.081 80.312 59.919 81.600 61.138 21.965 41.243 53.134
2000 6.462 28.279 16.822 27.228 5.840 27.565 74.879 60.871 78.282 66.956 21.228 37.873 60.067
2001 7.129 29.998 15.757 24.917 7.034 31.358 68.332 61.182 77.441 71.230 21.990 44.059 54.203
2002 8.367 37.390 14.677 27.981 4.802 31.483 83.631 51.156 77.200 57.020 21.354 34.397 78.529
2003 6.881 34.441 18.897 27.301 6.192 24.880 77.208 66.481 86.826 60.670 22.069 29.347 55.890
2003/1989 (%) 12,25 47,49 14,76 -13,45 -11,48 -40,32 -41,49 -15,80 -17,89 -44,64 -15,80 -49,81 -46,44
In many regions there is a decrease in total area under vines from 1989 to 2003 (Table 3, Figures 7 and 8). This trend is more obvious to Notio Aigaio (from 58.474 in 1989 to 29.347 in 2003, decrease 49,81%), Kriti (from 104.349 in 1989 to 55.890 in 2003, decrease 46,44%), Attiki (from 109.583 in 1989 to 60.670 in 2003, decrease 44,64%) and Dytiki Ellada (from 131.966 in 1989 to 77.208 in 2003, decrease of 41,49 %). This decrease in total area under vines may have occurred for many reasons such as the development of tourist industry and the change in the socio-economic structure of Greek agricultural holdings.
However, an upward trend exists in total area under vines in some regions such as Kentriki Makedonia (from 23.352 in 1989 to 34.441 in 2003, increase 47,49%), Dytiki Makedonia (from 16.466 in 1989 to 18.897 in 2003, increase 14,76%) and Anatoliki Makedonia & Thraki (from 6.130 in 1989 to 6.881 in 2003, increase 12,25%). The increase of total cultivate area under vines is merely explain by the development of large export companies which are well-organized and use the most advanced production methods and equipment (TSANTALI, PORTO CARRA).

Working paper No 15 Page 14
14
Figure 7: Change (%) 2003/1989 of total area under vines by region
-55 -35 -15 5 25 45 65
Anatoliki Makedonia & ThrakiKentriki Makedonia
Dytiki MakedoniaThessalia
IpeirosIonia Nisia
Dytiki ElladaSterea ElladaPeloponnisos
AttikiVoreio AigaioNotio Aigaio
Kriti
Figure 8: Total area under vine by region from 1989 to 2003
0
100.000
200.000
300.000
400.000
500.000
600.000
700.000
800.000
Are
a (in
stre
mm
as)
1989 1991 1993 1995 1997 1999 2001 2003
Year
Kriti
Notio Aigaio
Voreio Aigaio
Attiki
Peloponnisos
Sterea Ellada
Dytiki Ellada
Ionia Nisia
Ipeiros
Thessalia
Dytiki Makedonia
Kentriki Makedonia
Anatoliki Makedonia &Thraki

Working paper No 15 Page 15
15
Figure 9: Distribution of total area under vines by region for year 1989
Dytiki Ellada17%
Sterea Ellada11%
Peloponnisos14%
Attiki15%
Voreio Aigaio4%
Notio Aigaio8%
Kriti14%
Ipeiros1%
Thessalia4%
Dytiki Makedonia2%
Ionia Nisia6%
Anatoliki Makedonia & Thraki
1%
Kentriki Makedonia3%
Figure 10: Distribution of total area under vines by region for year 1999
Dytiki Ellada17%
Sterea Ellada12%
Peloponnisos16%
Attiki12%
Voreio Aigaio4%
Notio Aigaio8%
Dytiki Makedonia3%
Ipeiros1% Ionia Nisia
5%Thessalia
6%
Kriti10%
Anatoliki Makedonia & Thraki
1%
Kentriki Makedonia5%
As observed on Figures 9 and 10 the regions share for years 1989 and 1999 are
similar, with only slight differences as for Kriti where a decrease from 14% in 1989 to 10% in 1999 is noticed.

Working paper No 15 Page 16
16
Area under vines for production of quality wine
Table 5 presents the data of area under vines for production of quality wine by region from 1989 to 2003.
Table 4: Area under vines for production of quality wine by region. (in stremmas)
Years Kentriki Makedonia
Dytiki Makedonia Thessalia Ipeiros
Ionia Nisia
Dytiki Ellada PeloponnisosAttiki
Voreio Aigaio
Notio Aigaio Kriti
1989 8.093 4.409 4.153 1.242 5.618 27.000 15.318 742 20.786 27.140 18.430
1990 9.882 4.065 3.025 1.104 5.495 17.426 19.950 893 17.365 34.894 15.934
1991 9.783 4.038 2.463 1.104 5.490 16.962 19.803 890 17.350 34.454 15.022
1992 9.403 3.766 3.240 1.190 5.206 16.387 18.557 803 16.668 43.818 14.364
1993 9.446 3.240 2.513 991 5.612 16.073 18.416 763 17.627 32.347 14.910
1994 9.093 5.314 1.096 1.392 2.658 13.618 20.205 24 15.882 25.972 10.815
1995 9.147 5.054 2.325 1.421 2.641 21.578 22.105 24 13.294 27.782 12.816
1996 8.908 5.426 1.348 1.348 3.341 11.704 22.310 0 14.509 25.769 11.329
1997 8.470 6.523 1.768 1.444 2.544 15.336 23.124 0 13.421 23.772 11.266
1998 12.121 5.589 1.401 1.126 5.721 11.347 26.849 0 18.861 29.921 14.971
1999 6.541 5.740 2.952 1.038 3.852 26.521 20.436 0 18.580 30.826 20.245
2000 10.116 5.878 1.764 1.262 3.992 17.441 26.142 0 17.056 26.256 17.124
2001 12.039 5.419 1.581 1.738 5.302 10.952 24.074 0 18.377 34.674 24.836
2002 10.996 5.931 1.156 1.091 4.593 22.240 27.304 110 16.897 22.043 18.994
2003 10.439 6.666 2.490 1.065 3.391 20.990 34.248 0 19.041 18.547 16.701
2003/1989 (%) 28,99 51,19 -40,04 -14,25 -39,64 -22,26 123,58 -100 -8,40 -31,66 -9,38
In many regions there is a decrease in area for production of quality wine from
1989 to 2003 (Table 4, Figures 11 and 12). Decrease of 100% for Attiki is due to a change in regulation. More specific, the quality wine psr specie Savvatiano for Attiki was classified until 1993 and afterwards to other wines.
The downward trend in the area of production of quality wine is more obvious to some regions such as Thessalia (from 4.409 in 1989 to 2.490 in 2003, decrease 40,04%), Ionia Nisia (from 5.618 in 1989 to 3.391 in 2003, decrease 39,64%), Notio Aigaio (from 27.140 in 1989 to 18.547 in 2003, decrease 31,66%). The decrease trend in area for quality vines is in line to the general decrease trend in total area under vines.
It is worthwhile mentioning that in Peloponnisos the area for production of quality wine was doubled (from 15.318 in 1989 to 34.248 in 2003, increase 123,58%). An upward trend also appears in Kentriki Makedonia (from 8.093 in 1989 to 10.439 in 2003, increase 47,49%), Dytiki Makedonia (from 4.409 in 1989 to 6.666 in 2003, increase 51,15 %), as part of the increase of total cultivated area under vines in these regions.

Working paper No 15 Page 17
17
Figure 11: Change (%) 2003/1989 of area for production of quality wines by region
-105 -85 -65 -45 -25 -5 15 35 55 75 95
PeloponnisosDytiki Makedonia
Kentriki MakedoniaVoreio Aigaio
KritiIpeiros
Dytiki ElladaNotio Aigaio
Ionia NisiaThessalia
Attiki
Figure 12: Area for production of quality wines by region
0
20.000
40.000
60.000
80.000
100.000
120.000
140.000
Are
a (in
Stre
mm
as)
1989 1991 1993 1995 1997 1999 2001 2003Year
KritiNotio AigaioVoreio AigaioAttikiPeloponnisosDytiki ElladaIonia NisiaIpeirosThessaliaDytiki MakedoniaKentriki Makedonia

Working paper No 15 Page 18
18
Area under vines for production of other wine
Table 5 presents the data of area under vines for production of other wine by region from 1989 to 2003.
Table 5: Area under vines for production of other wines by region. (in stremmas)
Years
Anatoliki Makedonia & Thraki
Kentriki Makedonia
Dytiki MakedoniaThessaliaIpeiros
Ionia Nisia
Dytiki Ellada
Sterea Ellada Peloponnisos Attiki
Voreio Aigaio
Notio Aigaio Kriti
1989 6.128 15.259 12.057 27.392 5.753 36.068104.966 78.906 90.426 108.841 5.424 31.334 85.919
1990 5.794 21.906 11.936 35.342 6.150 34.219 88.908 69.390 76.377 101.259 6.850 26.047 77.331
1991 5.382 20.134 11.490 33.854 6.092 33.702 87.144 67.976 72.307 100.049 6.850 26.027 75.314
1992 6.210 14.102 12.316 32.945 6.165 32.423 78.611 66.782 72.364 96.112 7.174 16.907 77.620
1993 6.016 12.616 12.425 32.764 5.594 30.114 81.280 66.857 67.639 95.304 6.599 27.483 70.403
1994 7.702 12.201 11.701 26.793 3.728 23.637 63.772 67.247 55.791 82.674 4.916 18.419 54.995
1995 7.229 11.030 12.573 23.395 3.643 24.483 58.903 66.735 55.407 82.674 7.731 16.117 55.061
1996 6.644 10.447 12.215 25.178 3.450 22.436 64.452 63.689 56.953 82.716 5.497 16.660 54.677
1997 6.126 11.229 10.013 27.555 3.678 22.878 62.533 65.576 51.918 81.969 5.229 16.138 49.799
1998 3.301 14.036 11.656 24.715 5.941 24.059 61.271 61.795 49.723 68.961 3.552 9.948 41.902
1999 3.844 18.404 11.160 27.485 5.286 23.229 53.791 59.919 61.164 61.138 3.385 10.417 32.889
2000 6.408 18.165 10.945 25.464 4.577 23.573 57.437 60.873 52.139 66.955 4.172 11.619 42.944
2001 7.129 17.959 10.338 23.336 5.296 26.056 57.380 61.182 53.367 71.230 3.613 9.385 29.367
2002 8.367 26.394 8.746 26.825 3.711 26.890 61.391 51.156 49.896 56.910 4.457 12.354 59.535
2003 6.881 24.002 12.231 24.811 5.127 21.489 56.218 66.481 52.578 60.670 3.028 10.800 39.189
2003/1989 (%) 12,29 57,30 1,44 -9,42 -10,88 -40,42 -46,44 -15,75 -41,86 -44,26 -44,17 -65,53 -54,39
A decrease exists in cultivated area for production of other wines in most regions from 1989 to 2003 (Table 5, Figures 13 and 14). The downward trend is more obvious to regions such as Notio Aigaio (from 31.334 in 1989 to 10.800 in 2003, decrease 65,53%), Kriti (from 85.919 in 1989 to 39.189 in 2003, decrease 54,39%), Dytiki Ellada (from 104.966 in 1989 to 56.218 in 2003, decrease 46,44%) Attiki (from 108.841 in 1989 to 60.670 in 2003, decrease 44.26%) and Peloponnisos (from 90.426 in 1989 to 52.578 in 2003, decrease 41,86%). This decrease in area for other wines is in line with the decrease in total area under vines.
It is noteworthy stating that an upward trend appears in Kentriki Makedonia (from 15.259 in 1989 to 24.002 in 2003, increase 57,30%) and Anatoliki Makedonia & Thraki (from 6.128 in 1989 to 6.881 in 2003, increase 12,29 %), as part of the increase of total cultivated area under vines in these regions.

Working paper No 15 Page 19
19
Figure 13: Changes (%) 2003/1989 of area under vines for production of other wines by region
-70 -60 -50 -40 -30 -20 -10 0 10 20 30 40 50 60
Kentriki Makedonia
Anatoliki Makedonia & Thraki
Dytiki Makedonia
Thessalia
Ipeiros
Sterea Ellada
Ionia Nisia
Peloponnisos
Voreio Aigaio
Attiki
Dytiki Ellada
Kriti
Notio Aigaio
Figure 14: Area under vines for productions of other wines by region
0
100.000
200.000
300.000
400.000
500.000
600.000
700.000
Area
(in
stre
mm
as)
1989 1991 1993 1995 1997 1999 2001 2003
Year
Kriti
Notio Aigaio
Voreio Aigaio
Attiki
Peloponnisos
Sterea Ellada
Dytiki Ellada
Ionia Nisia
Ipeiros
Thessalia
Dytiki Makedonia
Kentriki Makedonia
Anatoliki Makedonia& Thraki

Working paper No 15 Page 20
20
3.3. Regional analysis of wine production Total wine production
Table 6 presents the data for total wine (quality and other) production by region from 1989 to 2003.
Table 6: Total wine production by region (in 1.000 litres)
Years
Anatoliki Makedonia & Thraki
Kentriki Makedonia
Dytiki Makedonia Thessalia Ipeiros
Ionia Nisia
Dytiki Ellada
Sterea Ellada
Peloponnisos Attiki
Voreio Aigaio
Notio Aigaio Kriti
1989 2.298 13.588 6.867 19.079 4.943 19.864 104.146 71.582 80.788 84.678 15.789 27.910 61.864
1990 2.097 22.828 7.932 28.914 5.592 22.927 90.634 56.959 55.363 63.371 15.775 19.206 56.953
1991 2.650 25.626 7.754 26.905 5.490 20.685 95.359 63.732 62.720 64.597 15.405 15.441 52.558
1992 2.699 17.162 9.551 43.891 4.515 25.673 96.088 69.849 68.192 70.187 14.466 25.372 50.010
1993 2.544 15.615 6.339 31.483 3.209 24.375 100.282 62.691 63.590 58.243 14.114 22.260 53.304
1994 3.478 14.555 9.505 26.410 3.327 20.487 92.485 77.138 58.832 45.301 10.239 22.913 39.355
1995 4.775 16.098 4.878 21.000 2.935 19.980 96.125 80.278 68.460 45.301 10.728 20.079 45.098
1996 7.652 15.387 7.352 35.254 3.355 19.767 88.913 74.836 82.562 67.015 10.575 20.442 42.033
1997 9.262 14.119 7.482 28.652 3.118 19.342 99.123 68.104 73.715 57.151 13.371 21.693 35.100
1998 4.226 19.445 6.137 31.877 4.015 24.368 90.603 82.292 85.334 55.335 14.101 12.668 36.515
1999 2.282 21.086 8.399 34.989 3.476 18.532 87.960 48.208 76.422 46.167 14.661 16.578 33.939
2000 4.883 23.265 6.723 26.638 3.512 21.125 100.455 67.039 73.087 44.080 12.566 14.197 37.267
2001 4.148 28.587 6.882 25.936 4.593 26.590 99.078 71.764 80.891 41.848 8.788 11.593 33.523
2002 4.685 35.368 3.988 11.213 3.217 15.014 118.505 48.949 42.557 34.500 13.622 9.923 48.181
2003 4.439 22.766 7.738 27.318 3.667 23.166 107.127 73.342 86.817 38.094 14.757 11.154 33.8022003/19
89 (%) 93,17 67,54 12,68 43,18 -25,81 16,62 2,86 2,46 7,46 -55,01 -6,54 -60,04 -45,36
As expected the downward trend in area under vines was followed by a reduction in total wine production in some regions (Table 6, Figures 15 and 16). In Notio Aigaio there is a decrease of 60,04% of the production that means from 27.910 in 1989 to 11.154 in 2003, Attiki (from 84.678 in 1989 to 38.094 in 2003, decrease 55,01%), Kriti (from 61.864 in 1989 to 33.802 in 2003, decrease 45,36%). These decreases are due to the reduction in cultivated area under vines.
As it was also expected, there is an increase in total wine production in regions such as Anatoliki Makedonia & Thraki (from 2.298 in 1989 to 4.439 in 2003 increase 93.17%), Kentriki Makedonia (from 13.588 in 1989 to 22.766 in 2003 increase 67,54%) and Dytiki Makedonia (from 6.867 in 1989 to 7.738 in 2003 increase 12,68%).
However, there is an increase in total wine production in regions where there was decrease in cultivated area under vines. These regions are: Thessalia (from 19.079 in 1989 to 27.318 in 2003, increase 43,18%), Ionia Nisia (from 19.864 in 1989 to 23.166 in 2003, increase 16,62%), Peloponnisos (from 80.788 in 1989 to 86.817 in 2003, increase 7,46%) Dytiki Ellada (from 104.146 in 1989 to 107.127 in 2003, increase 2,86%) and Sterea Ellada (that means from 71.582 tl in 1989 to 73.342 in 2003, increase 2,46%). The increase in total wine production, despite the decrease in cultivated area, is due to the implementation of high-level agricultural technology and the systematic methods used for the cultivation.

Working paper No 15 Page 21
21
Figure 15: Change (%) 2003/1989 of total wine production (quality and others) by region
-65 -55 -45 -35 -25 -15 -5 5 15 25 35 45 55 65 75 85 95
Anatoliki Makedonia & Thraki
Kentriki Makedonia
Thessalia
Ionia Nisia
Dytiki Makedonia
Peloponnisos
Dytiki Ellada
Sterea Ellada
Voreio Aigaio
Ipeiros
Kriti
Attiki
Notio Aigaio
Figure 16: Total wine production (quality and others) by region
0
100.000
200.000
300.000
400.000
500.000
600.000
Prod
uctio
n (1
.000
l.)
1989 1991 1993 1995 1997 1999 2001 2003
Year
Kriti
Notio Aigaio
Voreio Aigaio
Attiki
Peloponnisos
Sterea Ellada
Dytiki Ellada
Ionia Nisia
Ipeiros
Thessalia
Dytiki Makedonia
Kentriki Makedonia
Anatoliki Makedonia &Thraki

Working paper No 15 Page 22
22
Wine production of quality wines
Table 7 presents the data for wine production of quality wines by region from 1989 to 2003.
Table 7: Wine production of quality wines by region (in 1000 litres)
Years Kentriki Makedonia
Dytiki Makedonia Thessalia Ipeiros
Ionia Nisia
Dytiki Ellada PeloponnisosAttiki
Voreio Aigaio
Notio Aigaio Kriti
1989 4.835 3.188 3.596 1.140 2.770 20.860 16.539 513 13.122 13.728 12.794
1990 5.365 2.560 2.931 1.019 3.836 13.018 12.998 482 12.440 11.776 8.598
1991 7.067 2.401 1.860 1.096 3.130 15.392 19.159 551 11.737 10.004 8.107
1992 6.751 3.654 4.430 1.140 2.486 16.441 20.405 472 12.172 20.262 8.699
1993 4.612 2.232 1.007 732 4.815 15.431 16.728 432 12.215 11.552 8.057
1994 4.743 5.865 499 1.062 1.903 14.654 16.859 9 8.950 13.051 7.447
1995 5.805 2.110 2.339 1.047 1.347 25.743 22.094 9 8.677 11.367 10.010
1996 4.670 3.999 1.360 1.242 2.289 11.263 27.846 0 9.007 15.332 9.686
1997 4.462 4.721 1.709 1.148 1.147 21.817 27.221 0 11.185 16.657 9.704
1998 7.874 4.227 551 799 3.490 15.596 33.061 0 11.982 9.815 9.843
1999 4.791 5.069 3.357 764 2.391 29.644 19.636 0 12.775 13.665 12.328
2000 6.082 4.115 1.918 899 2.020 25.049 24.023 0 10.813 10.637 12.082
2001 7.368 3.715 1.620 1.202 2.575 18.547 29.179 0 7.277 9.301 16.202
2002 7.090 2.464 1.303 828 1.468 43.817 5.207 48 11.601 6.697 13.331
2003 5.534 5.131 3.516 594 1.498 24.279 32.187 0 13.101 8.294 12.869
2003/1989 (%) 14,46 60,95 -2,22 -47,89 -45,92 16,39 94,61 -100 -0,16 -39,58 0,59
The results of Table 7 are in line with the results presented in Table 4. More
specific in Peloponnisos there is a gradual increase to the production of quality wine during the examined period (from 16.539 in 1989 to 32.187 in 2003, increase 94,61%). This increase is a consequence of the increase in cultivated area. Note that the low production of this region for the year 2002 is due to intense bad weather conditions, which cause the distraction of the wine production.
Other regions with the same trend are Dytiki Makedonia (from 3.188 in 1989 to 5.131 in 2003, increase 60,95%) and Kentriki Makedonia (from 4.835 in 1989 to 5.534 in 2003, increase 14,46%).
An increase appears to Dytiki Ellada (from 20.860 in 1989 to 24.279 in 2003, increase 16,39%), although there is a decrease in area for production of quality wines.
No change in production of quality wines appears to the regions of Kriti and Vorio Aigaio, although some decrease to the cultivated area.
The downward trend in production of quality wine appears in Table 7 to regions Ipeiros (from 1.140 in 1989 to 594 in 2003, decrease 47,89%), Ionia Nisia (from 2.770 in 1989 to 1.498 in 2003, decrease 45,92%), Notio Aigaio (from 13.728 in 1989 to 8.294 in 2003, decrease 39,58%), Thessalia (from 3.596 in 1989 to 3.516 in 2003, decrease 2,22%). This decrease in quality wine production is in line with the decrease in cultivated area for production of quality wines (Table 4).
As mentioned in paragraph 4.2.1 A. 100% the decrease to Attiki is due to the change of regulation.

Working paper No 15 Page 23
23
Figure 17: Change (%) 2003/1989 of production of quality wines
-110 -90 -70 -50 -30 -10 10 30 50 70 90 110
Peloponnisos
Dytiki Makedonia
Dytiki Ellada
Kentriki Makedonia
Kriti
Voreio Aigaio
Thessalia
Notio Aigaio
Ionia Nisia
Ipeiros
Attiki
Figure 18: Production of quality wine by region per year

Working paper No 15 Page 24
24
0
20.000
40.000
60.000
80.000
100.000
120.000P
rodu
ctio
n (in
1.0
00 l.
)
1989 1990 1991 1992 1993 1994 1995 1996 1997 1998 1999 2000 2001 2002 2003Year
Kriti
Notio Aigaio
Voreio Aigaio
Attiki
Peloponnisos
Dytiki Ellada
Ionia Nisia
Ipeiros
Thessalia
Dytiki Makedonia
Kentriki Makedonia

Working paper No 15 Page 25
25
Wine production of other wines
Table 8 presents the data for wine production of other wines by region from 1989 to 2003.
Table 8: Wine production of other wines by region (in 1000 litres)
Years
Anatoliki Makedonia & Thraki
Kentriki Makedonia
Dytiki MakedoniaThessaliaIpeiros
Ionia Nisia
Dytiki Ellada
Sterea Ellada Peloponnisos Attiki
Voreio Aigaio
Notio Aigaio Kriti
1989 2.398 8.753 3.679 15.483 3.803 17.094 83.285 71.540 64.250 84.165 2.667 14.083 49.070
1990 2.096 17.462 5.371 25.982 4.571 19.091 77.618 56.959 42.368 62.888 3.335 7.430 48.357
1991 2.649 18.558 5.351 25.045 4.393 17.554 79.969 63.733 43.564 64.045 5.438 5.438 44.452
1992 2.698 10.410 5.895 39.462 3.374 23.187 79.648 69.849 47.789 69.715 2.294 5.110 41.312
1993 2.543 11.002 4.106 30.476 2.476 19.559 84.852 62.691 46.864 57.812 1.900 10.707 45.248
1994 3.478 9.812 3.640 25.911 2.265 18.584 77.831 77.138 41.973 45.292 1.289 9.862 31.908
1995 4.775 10.293 2.768 18.661 1.888 18.633 70.382 80.278 46.366 45.292 2.051 8.712 35.088
1996 7.652 10.717 3.353 33.894 2.113 17.478 77.650 74.836 54.716 67.015 1.568 5.110 32.347
1997 8.886 9.657 2.761 26.943 1.970 18.195 77.306 68.104 46.494 57.151 2.186 5.036 25.396
1998 4.226 11.571 1.910 31.326 3.216 20.878 75.007 82.292 52.273 55.335 2.119 2.853 26.672
1999 2.282 16.295 3.330 31.632 2.712 16.141 58.316 48.208 56.786 46.167 1.886 2.913 21.611
2000 4.845 17.183 2.608 24.720 2.613 19.105 75.406 67.041 49.064 44.087 1.744 3.564 25.185
2001 4.148 21.219 3.167 24.316 3.391 24.015 80.531 71.764 51.712 41.848 1.511 2.292 17.321
2002 4.685 28.278 1.524 9.910 2.389 13.546 74.688 48.949 37.350 34.452 2.021 3.226 34.850
2003 4.439 17.232 2.607 23.802 3.073 21.668 82.848 73.342 54.630 38.094 1.656 2.860 20.9332003/1989
(%) 85,11 96,87 -29,14 53,73 -19,20 26,76 -0,52 2,52 -14,97 -54,74 -37,91 -79,69 -57,34
The results from Table 8 are in accordance with the results of Table 5. In Notio Aigaio there is a decrease of 79,69% of the production (from 14.083 in 1989 to 2.860 in 2003). It follows the region of Kriti (from 49.070 in 1989 to 20.933 in 2003, decrease 57,34%). Another decrease also appears to Attiki (from 84.678 in 1989 to 38.094 in 2003, decrease 54,74%), Vorio Aigaio (from 2.667 in 1989 to 1.656 in 2003, decrease of 37,91%), Ipeiros (from 3.803 in 1989 to 3.073 in 2003, decrease 19,20%), Peloponnisos (from 64.250 in 1989 to 54.630 in 2003, decrease 14,97%). These decreases are due to the reduction in cultivated area under vines for production of other wines.
In region of Dytiki Makedonia there is a decrease of production 29,14% (from 3.679 in 1989 to 2.607 in 2003), while in Table 5 appears an increase of 1,44% in cultivated area of other wines.
An upward trend apears in wine production of other wines in regions Kentriki Makedonia (from 8.753 in 1989 to 17.232 in 2003, increase 96,87%) and Anatoliki Makedonia & Thraki (from 2.398 in 1989 to 4.432 in 2003, increase 85,11%).
However, there is an increase in production in some regions, while there was a decrease in cultivated area for other wines. These regions are: Thessalia (from 15.483 in 1989 to 23.802 in 2003, increase 53,73%), Ionia Nisia (from 17.094 in 1989 to 21.668 in 2003, increase 26,76%), Sterea Ellada (from 71.540 in 1989 to 73.342 in 2003, increase 2,52%). These increases in wine production despite the decrease in cultivated area are due to the high-level agricultural technology from producers and more systematic methods for the cultivation.

Working paper No 15 Page 26
26
Figure 19: Change (%) 2003/1989 of production of other wines
-90,00 -70,00 -50,00 -30,00 -10,00 10,00 30,00 50,00 70,00 90,00 110,00
Kentriki MakedoniaAnatoliki Makedonia & Thraki
ThessaliaIonia Nisia
Sterea ElladaDytiki Ellada
PeloponnisosIpeiros
Dytiki MakedoniaVoreio Aigaio
AttikiKriti
Notio Aigaio
Figure 20: Production of other wine by region per year
0
50.000
100.000
150.000
200.000
250.000
300.000
350.000
400.000
450.000
Prod
uctio
n (in
1.0
00 l.
)
19891990
19911992
19931994
19951996
19971998
19992000
20012002
2003
Year
Kriti
Notio Aigaio
Voreio Aigaio
Attiki
Peloponnisos
Sterea Ellada
Dytiki Ellada
Ionia Nisia
Ipeiros
Thessalia
Dytiki Makedonia
Kentriki Makedonia
Anatoliki Makedonia &Thraki

Working paper No 15 Page 27
27
3.4. Area and Production of Quality Wines (psr) produced in specified regions, year 1999
Table 9 presents the data for area and production of quality wines (psr) produced in
specified regions for the year 1999.
Table 9: Area and production of quality wines (psr) in 1999
Quality Wines produced in specified regions (psr) Grapes Area Production % Area % Production Roditis 23.437 26.247 17,14 25,14Agiorgitiko 18.790 18.319 13,74 17,54Moschato 16.676 11.490 12,20 11,00Athiri 12.274 7.904 8,98 7,57Xinomavro 11.740 9.522 8,59 9,12Liatiko 11.483 6.277 8,40 6,01Asirtiko 9.175 2.360 6,71 2,26Mandilari 6.768 3.173 4,95 3,04Kotsifali 5.253 3.570 3,84 3,42Monemvasia 4.181 1.063 3,06 1,02Moschato (white) or Moschoudi 3.695 3.323 2,70 3,18Rombola 3.511 2.164 2,57 2,07Mavrodafni 3.291 3.877 2,41 3,71Vilana 1.861 1.629 1,36 1,56Moschofilero 1.619 1.300 1,18 1,24Dembina 1.038 764 0,76 0,73Negkoska 962 695 0,70 0,67Other varieties 977 743 0,71 0,71Total 136.731 104.420 100,00 100,00
Table 9 shows that varieties Roditis, Agiorgitiko and Moschato are the most popular quality wines produced in specific regions for the year 1999 which cover almost the half production and cultivated area.
Figures 21 and 22 present the area and production of quality wines produced in specific regions for the year 1999.

Working paper No 15 Page 28
28
Figure 21: Area quality wines produced in specified regions (psr)
Roditis17%
Agiorgitiko14%
Moschato 12%
Athiri9%
Xinomavro9%
Liatiko8%
Asirtiko7%
Mavrodafni2%
Rombola3%
Dembina1%
Mandilari5%
Moschato (white) or Moschoudi
3%
Monemvasia3%
Kotsifali4%
Others5%
Other varieties1%
Vilana1%
Negkoska1%
Moschofilero1%
Figure 22: Production of quality wines produced in specified regions (psr)
Roditis25%
Agiorgitiko18%
Moschato 11%
Athiri8%
Xinomavro9%
Liatiko6%
Asirtiko2%
Mandilari3%
Kotsifali3%
Monemvasia1%Vilana
2%
Negkoska1%
Other varieties1%Others
6%
Moschato (white) or Moschoudi
3%
Rombola2%
Moschofilero1%
Mavrodafni4%
Dembina1%
Working paper No 15 Page 29
29
3.5. Forecast of area under vines and wine production
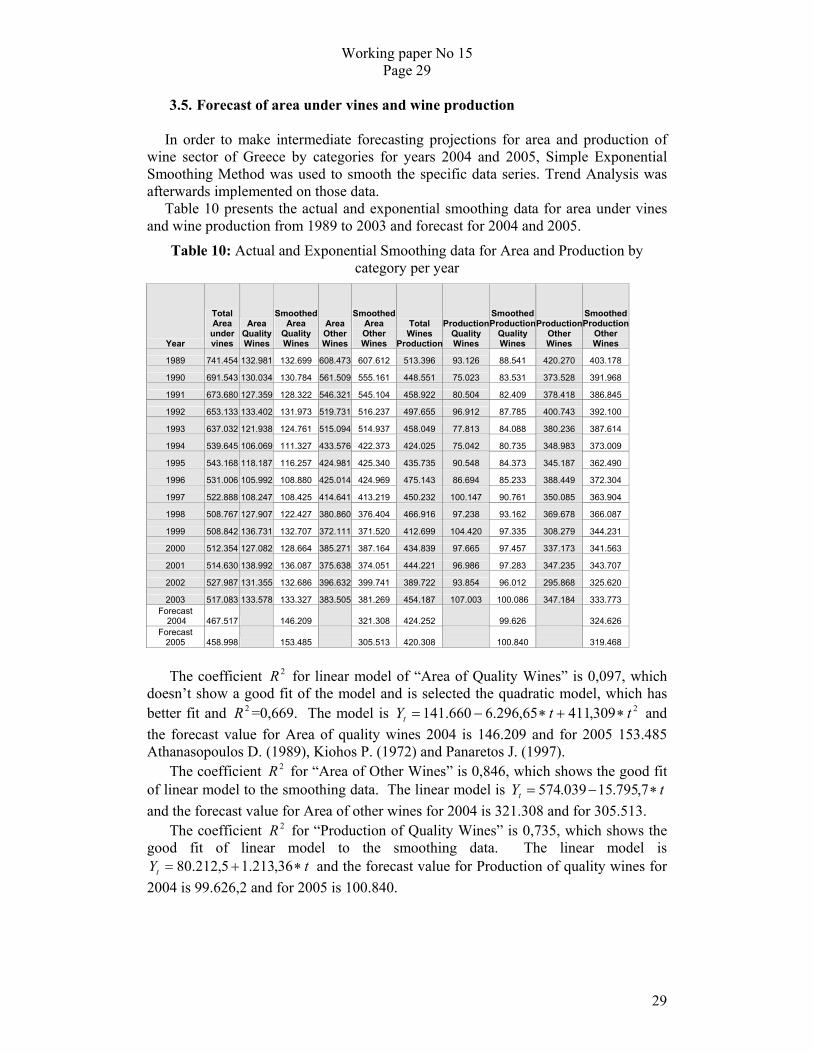
In order to make intermediate forecasting projections for area and production of wine sector of Greece by categories for years 2004 and 2005, Simple Exponential Smoothing Method was used to smooth the specific data series. Trend Analysis was afterwards implemented on those data.
Table 10 presents the actual and exponential smoothing data for area under vines and wine production from 1989 to 2003 and forecast for 2004 and 2005.
Table 10: Actual and Exponential Smoothing data for Area and Production by category per year
Year
Total Area
under vines
Area Quality Wines
Smoothed Area
Quality Wines
Area Other Wines
Smoothed Area Other Wines
Total Wines
Production
Production Quality Wines
Smoothed Production
Quality Wines
Production Other Wines
Smoothed Production
Other Wines
1989 741.454 132.981 132.699 608.473 607.612 513.396 93.126 88.541 420.270 403.178
1990 691.543 130.034 130.784 561.509 555.161 448.551 75.023 83.531 373.528 391.968
1991 673.680 127.359 128.322 546.321 545.104 458.922 80.504 82.409 378.418 386.845
1992 653.133 133.402 131.973 519.731 516.237 497.655 96.912 87.785 400.743 392.100
1993 637.032 121.938 124.761 515.094 514.937 458.049 77.813 84.088 380.236 387.614
1994 539.645 106.069 111.327 433.576 422.373 424.025 75.042 80.735 348.983 373.009
1995 543.168 118.187 116.257 424.981 425.340 435.735 90.548 84.373 345.187 362.490
1996 531.006 105.992 108.880 425.014 424.969 475.143 86.694 85.233 388.449 372.304
1997 522.888 108.247 108.425 414.641 413.219 450.232 100.147 90.761 350.085 363.904
1998 508.767 127.907 122.427 380.860 376.404 466.916 97.238 93.162 369.678 366.087
1999 508.842 136.731 132.707 372.111 371.520 412.699 104.420 97.335 308.279 344.231
2000 512.354 127.082 128.664 385.271 387.164 434.839 97.665 97.457 337.173 341.563
2001 514.630 138.992 136.087 375.638 374.051 444.221 96.986 97.283 347.235 343.707
2002 527.987 131.355 132.686 396.632 399.741 389.722 93.854 96.012 295.868 325.620
2003 517.083 133.578 133.327 383.505 381.269 454.187 107.003 100.086 347.184 333.773 Forecast
2004 467.517 146.209 321.308 424.252 99.626 324.626 Forecast
2005 458.998 153.485 305.513 420.308 100.840 319.468
The coefficient 2R for linear model of “Area of Quality Wines” is 0,097, which
doesn’t show a good fit of the model and is selected the quadratic model, which has better fit and 2R =0,669. The model is 2309,41165,296.6660.141 ttYt ∗+∗−= and the forecast value for Area of quality wines 2004 is 146.209 and for 2005 153.485
Athanasopoulos D. (1989), Kiohos P. (1972) and Panaretos J. (1997). The coefficient 2R for “Area of Other Wines” is 0,846, which shows the good fit
of linear model to the smoothing data. The linear model is tYt ∗−= 7,795.15039.574 and the forecast value for Area of other wines for 2004 is 321.308 and for 305.513.
The coefficient 2R for “Production of Quality Wines” is 0,735, which shows the good fit of linear model to the smoothing data. The linear model is
tYt ∗+= 36,213.15,212.80 and the forecast value for Production of quality wines for 2004 is 99.626,2 and for 2005 is 100.840.

Working paper No 15 Page 30
30
The coefficient 2R for “Production Other Wines” is 0,945, which shows the good fit of linear model to the smoothing data. The linear model is
tYt ∗−= 35,158.5160.407 and the forecast value for Production of other wines for 2004 is 324.626 and for 2005 is 319.468.
Table 11 presents the forecasting models for area under vines and wine production by category.
Table 11: Trend Analysis Models
Model Forecast 2004
Forecast 2005
Area Quality Wines
Quadratic 309,41165,296.6660.141 tYt ∗+∗−=
146.209 153.485
Area Other Wines
Linear tYt ∗−= 7,795.15039.574 321.308 305.513
Production Quality Wines
Linear tYt ∗+= 36,213.15,212.80 99.626,2 100.840
Production Other Wines
Linear tYt ∗−= 35,158.5160.407 324.626 319.468
4. Conclusion
This study reveals that a downward trend effect exists in holdings with area under vines in total country from 1989 to 2003. Decreases, also, appear to the area under vines and the wine production for the same period. The downward trend of total area is more obvious in region Notio Aigaio, Kriti, Attiki, Dytiki Ellada, Ionia Nisia and follows Peloponnisos, Voreio Aigaio, Sterea Ellada, Thessalia and Ipeiros.
These reductions may have occurred for many reasons. One of them is the change in the socio-economic structure of the Greek agricultural holdings. The development of the much more profitable tourist industry is such a reason. In the last fifteen years, many regions such as Notio Aigaio, Kriti, Peloponnisos have highly developed the tourist industry. This development has urged the farmers to abandon their agricultural employment and become involved with tourism.
Despite the downward trend of area under vines and wine production, the indicator of production by area under vines has an upward trend. This increase is mainly due to the more systematic methods for the cultivation of area under vines and the implementation of high-level agricultural technology by most producers.
Upward trend effect of area under vines exists in region Kentriki Makedonia, Dytiki Makedonia and Anatoliki Makedonia & Thraki.
Trends of area under vines for production of quality wines and other wines are in the same line with the trend of total area under vines. Exception constitutes Peloponnisos where the cultivated area for quality wine was doubled from 1989 to 2003.

Working paper No 15 Page 31
31
Moreover, the trend of total wine production is in accordance with the trend of total area under vines. However, there is an increase in total wine production in regions where there was a decrease in total cultivated area under vines. Such regions are Thessalia, Ionia Nisia, Peloponnisos, Dytiki Ellada and Sterea Ellada. This increase is due to the high-level agricultural technology implemented by the producers and the systematic methods used for the cultivation.
The trend of wine production of quality wines is in reference to the trend of area for quality wines except Dytiki Ellada where an increase appears in production of quality wine although there is a decrease in cultivated area under vines for production of quality wines.
The trend of production of other wine is general in the same line with the trend of cultivate area under vines for production of other wine and the total wine production. However, there is an increase in some regions, while there was a decrease in cultivated area for other wines. These regions are Thessalia, Ionia Nisia and Sterea Ellada. In conclusion, in the last five years, it appears an improvement to the cultivated area under vines and to their wine production. This is due to implementation of high-level agricultural technology and systematic methods used by most producers. References
• Athanasopoulos D. (1989), Descriptive Statistics. Part III, Time Series Analysis, Indicators. Pireaus, Stamoulis. (in greek)
• CAP 2000, Situation and Outlook: Wine Sector, http://europa.eu.int/comm/agriculture
• Kiohos P. (1972), Statistics, vol.2, NSSG Publ. (in greek) • Gardner, E. S., Jr. (1985). Exponential smoothing: The state of the art. Journal
of Forecasting, 4, 1-28. • Kopaka, K. (1997) The Vines and Wine in prehistoric Aegian, Symposium of
Wine 1-2 February 1997 • Lavine, D., Krehbiel T., Berenson M. (2000) Business Statistics. A first
course. (2nd ed.), New Jersey, Prentice-Hall • Makridakis, S. G., Wheelwright, S. C., & McGee, V. E. (1983). Forecasting:
Methods and applications (2nd ed.). New York: Wiley. • Makridakis, S. G., & Wheelwright, S. C. (1989). Forecasting methods for
management (5th ed.). New York: Wiley. • Manual of SPSS v. 13. • Maragou, A. (1990) Trade of Wine in Antiquity, History of Greek Wine,
Santorini 7-9 September 1990 • Messini, Ch. (1997) The Greek Wine Industry, (No 142), IOBE,
(http://www.iobe.gr/wine.htm) • Montgomery, D. C., Johnson, L. A., & Gardiner, J. S. (1990). Forecasting and
time series analysis (2nd ed.) New York: McGraw-Hill. • Panaretos J. (1997), Linear Models, Athens, AUEB Publ. (in greek)

Working paper No 15 Page 32
32
• Rondos J., Rondos K. (1996), Alchohol consumption in Greece 1961-2000: A Statistical Analysis, Tedradia of Psychiatrics, (N0 54), Scientific Association of Athens Psychiatric Hospital
• http://www.statsoftinc.com/textbook/stathome.html • http://www.allaboutgreekwine.com
-----

![ACR [CP] 002:2005 Guidance Note for Safe Working … · Composite Draft Holden / Leavett Page 1 5/24 ... [CP] 002:2005 Guidance Note for Safe Working on Fragile Roofs ... Working](https://img.pdfslide.us/doc/110x75/5b88241a7f8b9a46538d4296/acr-cp-0022005-guidance-note-for-safe-working-composite-draft-holden-leavett.jpg)