Embed Size (px)
Citation preview
Department of Economics and Finance
Working Paper No. 09-14
http://www.brunel.ac.uk/about/acad/sss/depts/economics
Econ
omic
s an
d Fi
nanc
e W
orki
ng P
aper
Ser
ies
Jan Fidrmuc and Jarko Fidrmuc
Foreign Languages and Trade
February 2009
1
Foreign Languages and Trade*
Jan Fidrmuc†
Jarko Fidrmuc‡
February 2009
Abstract
Cultural factors and especially common languages are well-known determinants of trade.
By contrast, the knowledge of foreign languages was not explored in the literature so far.
We combine traditional gravity models with data on fluency in the main languages used in
EU and candidate countries. We show that widespread knowledge of languages is an
important determinant for foreign trade, with English playing an especially important role.
Other languages (French, German, and Russian) play an important role mainly in particular
regions. Furthermore, we document non-linear effects of foreign languages on trade. The
robustness of the results is confirmed in quantile regressions.
Keywords: Gravity models, foreign trade, language effects, median regression, quantile regression.
JEL Classification: C23, F15, F40, Z10.
* We appreciate the research assistance by Mareike Heimeshoff. We benefited from comments by Fritz Breuss, Michael Landesmann, Javier Ortega, Nicolas Sauter, and seminar participants at Brunel University, City University London, WIIW, and FIW-Research Conference “International Economics” in Vienna, December 2008. † Department of Economics and Finance, and Centre for Economic Development and Institutions (CEDI), Brunel University; CEPR, London; and WDI, University of Michigan. Contact information: Department of Economics and Finance, Brunel University, Uxbridge, UB8 3PH, United Kingdom. Email: [email protected] or [email protected]. Phone: +44-1895-266-528, Fax: +44-1895-203-384. Web: http://www.fidrmuc.net/. ‡ University of Munich, Department of Economics; CESifo Institute Munich; and Comenius University Bratislava, Slovakia Institute of Applied Mathematics and Statistics, e-mail: [email protected]. Contact information: Department of Economics, University of Munich, Geschwister-Scholl-Platz 1, 80539 Munich, Germany.
2
1 Introduction
Languages facilitate communication and ease transactions. Two individuals who speak
the same language can communicate and trade with each other directly whereas those
without a sufficient knowledge of a common language must often rely on an
intermediary or hire an interpreter. The additional complexity inherent in such a
mediated relationship, the potential for costly errors1 and their increased cost may be
large enough to prevent otherwise mutually beneficial transactions from occurring.
Consequently, ability to speak foreign languages should have a positive economic
payoff embodied in better employment opportunities and higher wages2, in addition to
other, non-pecuniary benefits such as ability to travel, study and live abroad, meet new
people, read foreign books or newspapers, and the like.
In this paper, we are interested in the economic returns to proficiency in foreign
languages at the aggregate level rather than at the individual level. If enough people in
both country A and country B speak the same language, they will be able to
communicate with each other more readily. Consequently, trade between these two
countries will be easier and cheaper. Hence, we should expect languages to foster
bilateral trade. This observation, of course, is not new. Indeed, most studies using the
gravity model to analyze trade account for common official languages between
countries (for example, French is the official language of France, Belgium,
Luxembourg, Switzerland, Canada, and dozens of former French and Belgian colonies).
Such studies invariably find that sharing language translates into greater trade intensity.
However, languages need not be formally recognized as official languages in both
1 A well-known, while tongue-in-cheek, example is a commercial by Berlitz, a language school, in which
a German coastguard receives a distress call ‘We are sinking!’, to which he responds ‘What are you
sinking about?’ See http://www.youtube.com/watch?v=8vBn2_ia8zM. 2 Most empirical studies focus on immigrants (e.g. Chiswick and Miller, 2002 and 2007) where positive
returns to the ability to speak the host-country language is not surprising. Ginsburgh and Prieto-
Rodriguez (2006) estimate the returns to using a foreign language at work for native Europeans and find
positive returns which depend on the relative scarcity of the foreign langauge (for instance, English has a
much lower return in Denmark than in Spain).
3
countries in order to foster trade: international commerce is increasingly conducted in
English, even if neither party to the transaction is from an English speaking country.
We utilize a new and previously little used survey data set on language use in the
member and candidate countries of the European Union. Importantly, the data contain
detailed information not only on the respondents’ native languages but also on up to
three foreign languages that they can speak. These surveys are nationally representative
and therefore they allow us to estimate probabilities that two randomly chosen
individuals from two different countries will be able to communicate. We investigate
the effect of such communicative probabilities on bilateral trade flows in Europe.
While most gravity-model types of analyses considered only official languages, Mélitz
(2008) went a step further by considering all (indigenous) languages spoken in a
country and accounting for the fraction of the population speaking them. English, for
example, is spoken in dozens of former British colonies but often only a small fraction
of the population speak it, and Chinese is spoken in a number of South Asian countries
even while it does not enjoy an official-language status in all of them. Nevertheless, by
focusing on languages that are indigenous, Mélitz fails to take account of foreign
languages: a Chinese tradesman in French-speaking Africa may be more inclined to
communicate with his business partners in English than in either French or Chinese.
We find that greater density of linguistic skills indeed translates into greater trade
intensity. In the ‘old’ 15 EU countries, the average probability that two randomly
chosen individuals from two different countries will be able to communicate in English
with each other is 22% (this probability makes no distinction between native speakers of
English and those who speak it as a foreign language except that we require that the
self-assessed proficiency for the latter is at least good or very good). This raises intra-
EU15 trade, on average, by approximately 30%. German and French, in contrast,
produce only weak and mixed results. It appears, indeed, that English is the main driver
of international trade, at least in Western Europe.
However, the effect of foreign languages is not uniform across countries. When we
expand our analysis to include all 29 EU member and candidate countries3, the effect of
3 At present, Croatia and Turkey are the only countries with the candidate status.
4
English appears weaker or outright insignificant (nevertheless, English appears
significant in a sample including only the new members and candidates for membership,
without including the old members). This could be due to the two groups’ different
historical legacies and relatively short and limited history of integration between them.
Another potential explanation is that the effect of languages is in fact non-linear: on
average, fewer people speak English in the new member and candidate countries than in
the old members. The results of our analysis indeed are consistent with the hypothesis
of non-linear effect languages on trade.
In the following section, we discuss briefly the available literature on the effect of
languages on international trade. In section 3, we introduce our data. Section 4 contains
the empirical analysis, and section 5 presents sensitivity analysis using median and
quantile regressions. The final section summarizes and discusses our findings.
2 Languages and Trade
The gravity model (see Linder, 1961, Linnemann, 1966, Anderson and van Wincoop,
2003), relates bilateral trade to the aggregate supply and aggregate demand of,
respectively, the exporting and importing country, to transport and transaction costs,
and to specific bilateral factors (e.g. free trade agreements). It has proved an extremely
popular tool for applied trade analysis. In particular, models based on the gravity
relation have been used to assess the impact of trade liberalization and economic
integration, to discuss the so-called ‘home bias’ (McCallum, 1995) and to estimate the
effects of currency unions on trade (Rose, 2000). Further research applied gravity
models also to trade in services (Kimura and Lee, 2006) and FDI (Egger and
Pfaffermayr, 2004).
Accounting for common official languages has become a standard feature of gravity
models. The gravity equation is thus augmented to include a common-language dummy,
alongside other potential determinants of bilateral trade such as common border,
landlocked dummy and indicators of shared colonial heritage.4 Most studies, however,
4 More recent studies often include these factors as fixed effects.
5
pay little attention to the effect of languages that they estimate. Rather, they account for
common language primarily to help disentangle its effect from the effect of preferential
trade liberalization. For instance, several languages have the status of the official
language in two or more European countries: German (Austria, Germany and
Luxembourg), French (France and Belgium), Dutch (Belgium and Netherlands),
Swedish (Sweden and Finland), and Greek (Greece and Cyprus). It is natural to expect
that having the same official language fosters bilateral trade. Therefore, failure to
account for the common-language effect would likely result in an upward-biased
estimate of the effect of economic integration in the EU.
Some studies, such as Rauch and Trindade (2002), find that immigrants help foster trade
links between their country of origin and the ancestral country. To the best of our
knowledge, however, the only study that focuses specifically on the relationship
between bilateral trade and languages is Mélitz (2008). He goes beyond focusing on
official languages and instead considers all indigenous languages spoken by at least 4%
of the population, in addition to official languages.5 He finds that both categories of
languages that he defines, ‘open-circuit’ and ‘direct communication’6 languages,
increase bilateral trade. Nevertheless, as he only considers indigenous languages, he
fails to measure the effect of foreign languages.
3 Data
We base our analysis on data set of bilateral trade flows among 29 countries that are at
present member states or candidates for membership of the European Union. The trade
flows are observed between 2001 and 2007 and were compiled from the IMF Direction
5 His analysis, is based on the Ethnologue database (see http://www.ethnologue.com/), complemented
using the CIA World Factbook. 6 Open-circuit languages are those that either have official status or are spoken by at least 20% of the
population in both countries. Direct-communication languages are those that are spoken by at least 4% in
each country. The former are measured using dummy variables, the latter as the probability that two
randomly chosen individuals from either country can communicate directly in any direct-communication
language.
6
of Trade Statistics. Trade flows are expressed in US dollars; nominal GDP data, based
on the IMF International Financial Statistics, are converted to US dollars as well. The
distance between countries is measured in terms of great circle distances between the
capitals of country i and country j.
An important strength of our analysis is that we are able augment the trade and output
data with survey data on European’s ability to speak various languages. The data draw
upon a Eurobarometer survey7 that was carried out in the late 2005 in all member states
and candidates countries of the European Union. The respondents, who had to be EU
citizens (although not necessarily nationals of the country in which they were
interviewed), were asked to list their mother’s tongue (allowing for multiple entries
when applicable) and up to three other languages that they ‘speak well enough in order
to be able to have a conversation’. Additionally, the respondents were asked to rate their
skill in each of these languages as basic, good or very good. These surveys are
nationally representative (with the limitation that they do not account for linguistic
skills of non-EU nationals) and therefore we can use them to estimate the share of each
country’s population that speaks each language.8
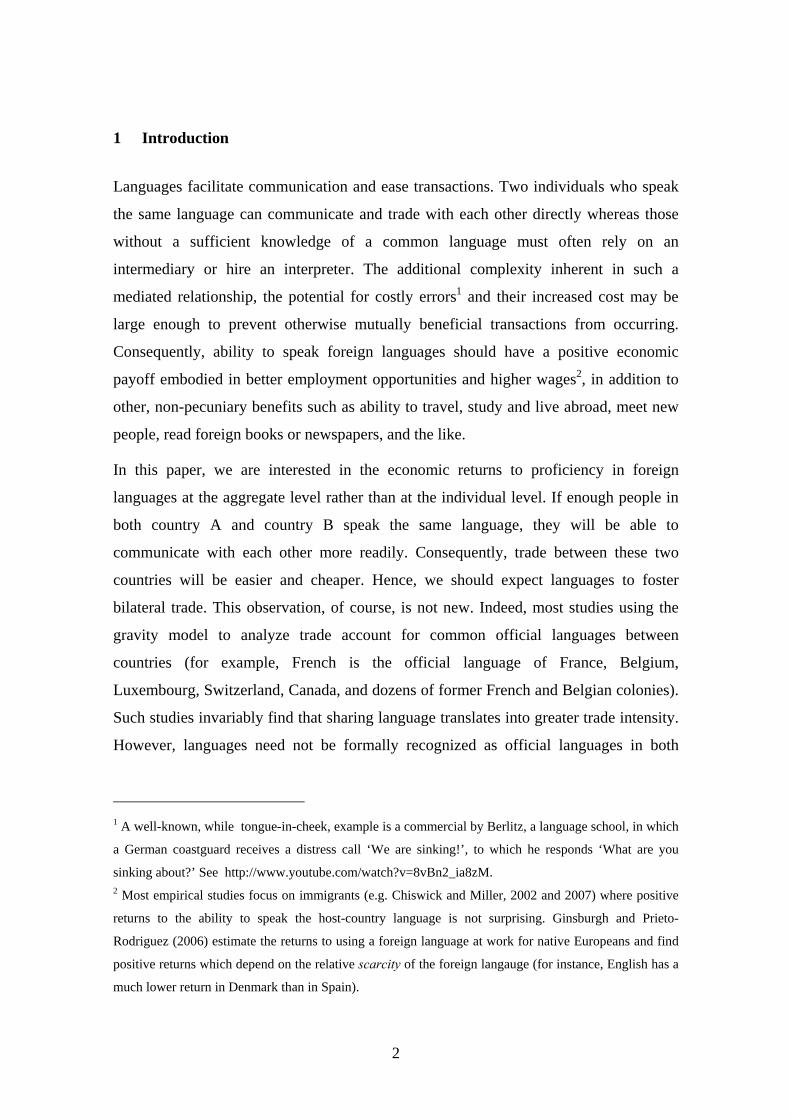
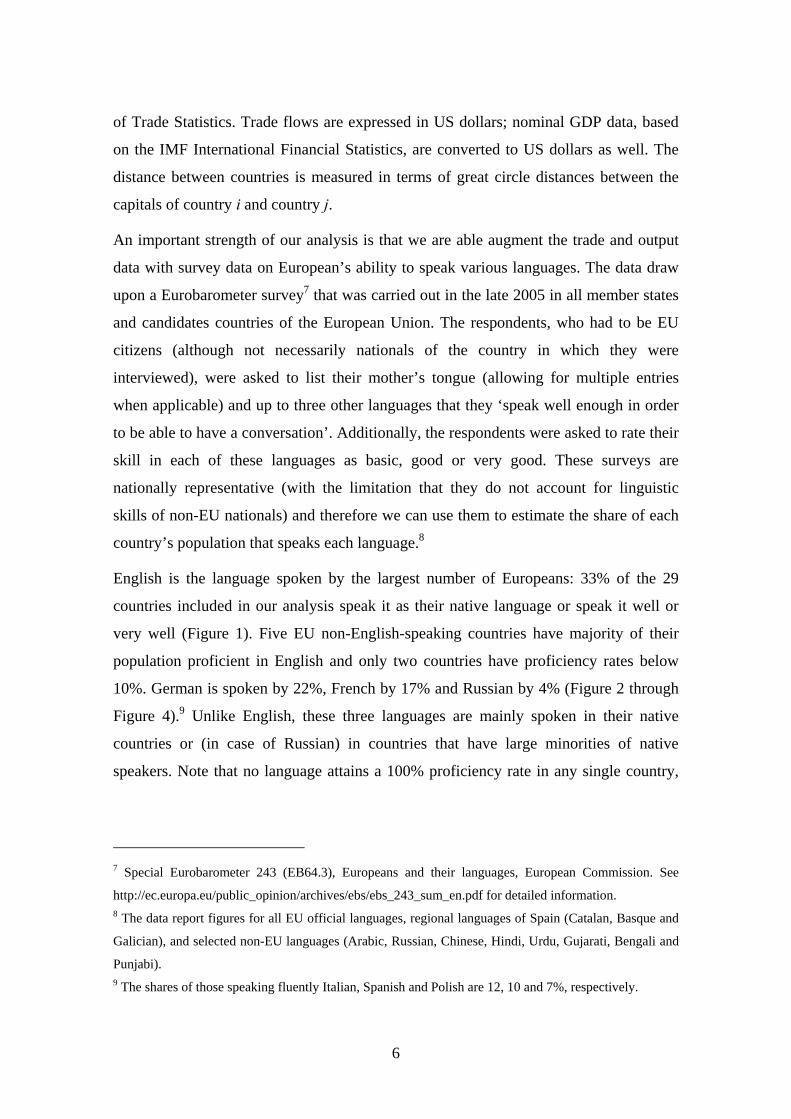
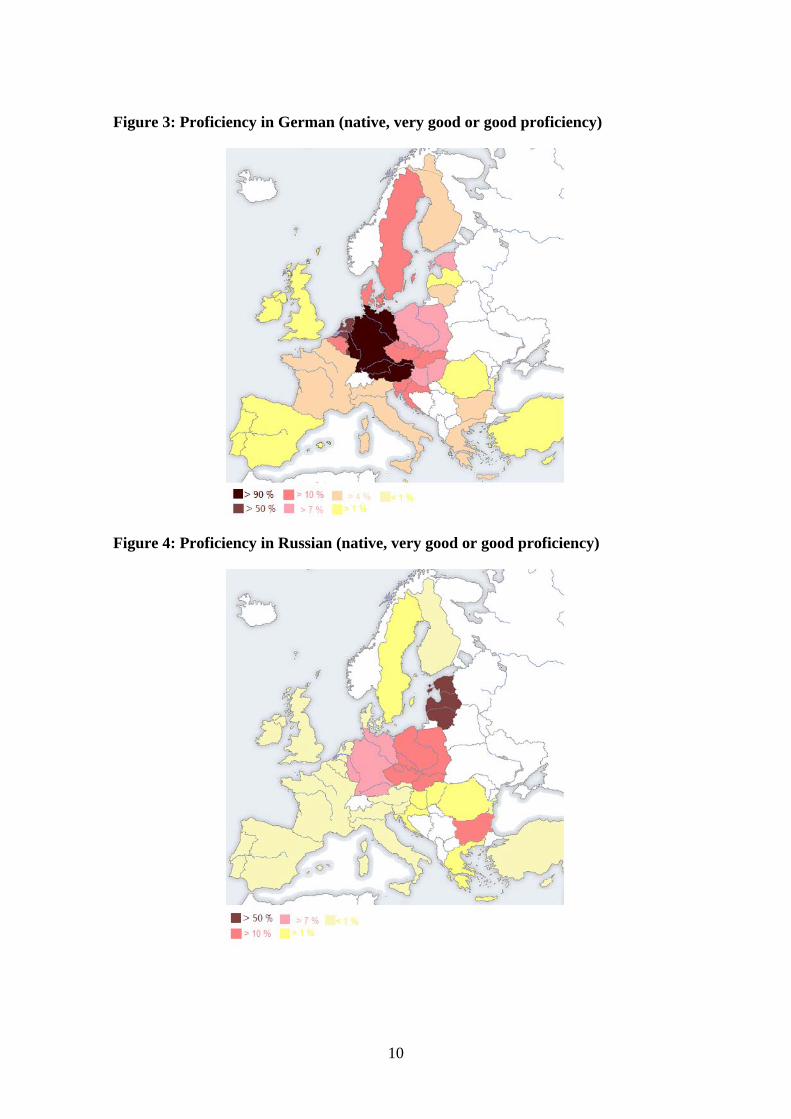
English is the language spoken by the largest number of Europeans: 33% of the 29
countries included in our analysis speak it as their native language or speak it well or
very well (Figure 1). Five EU non-English-speaking countries have majority of their
population proficient in English and only two countries have proficiency rates below
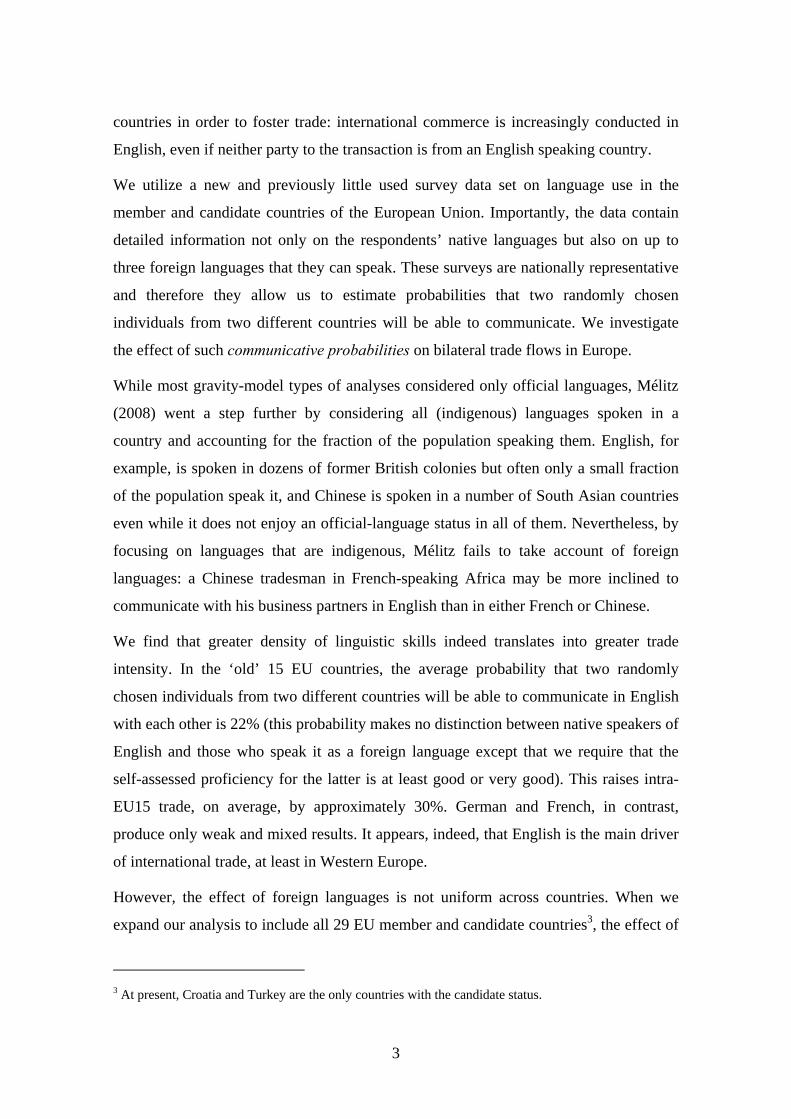
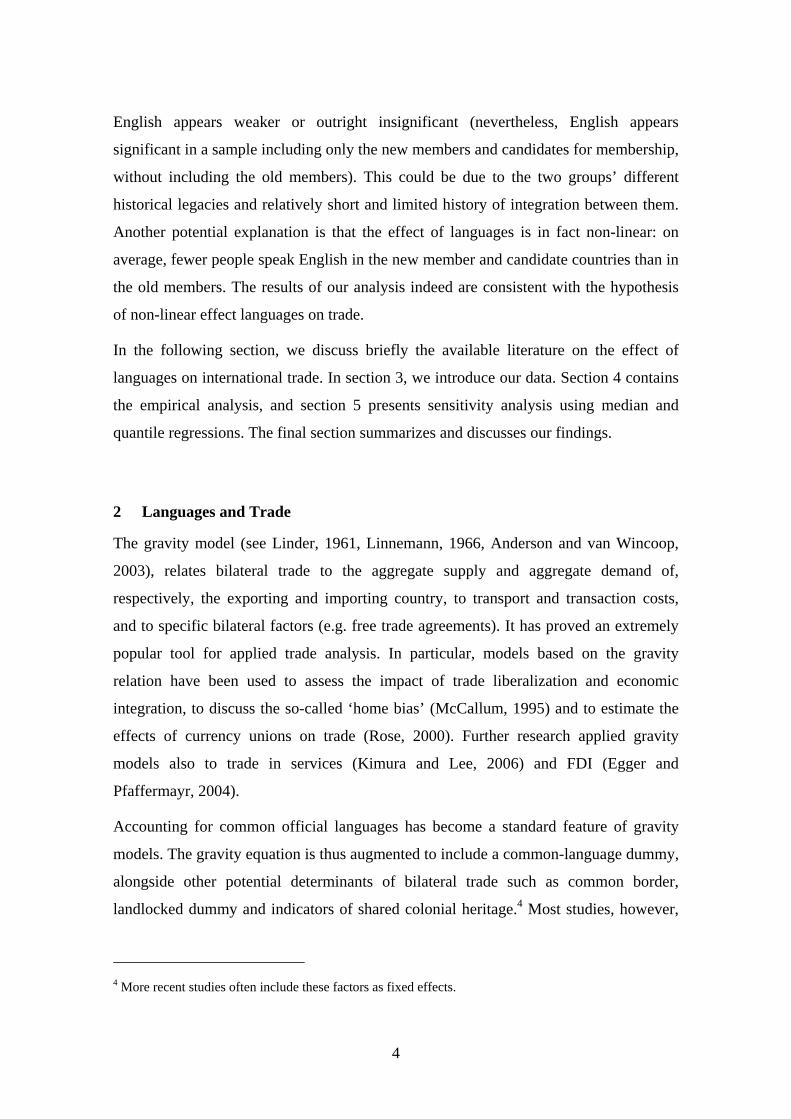
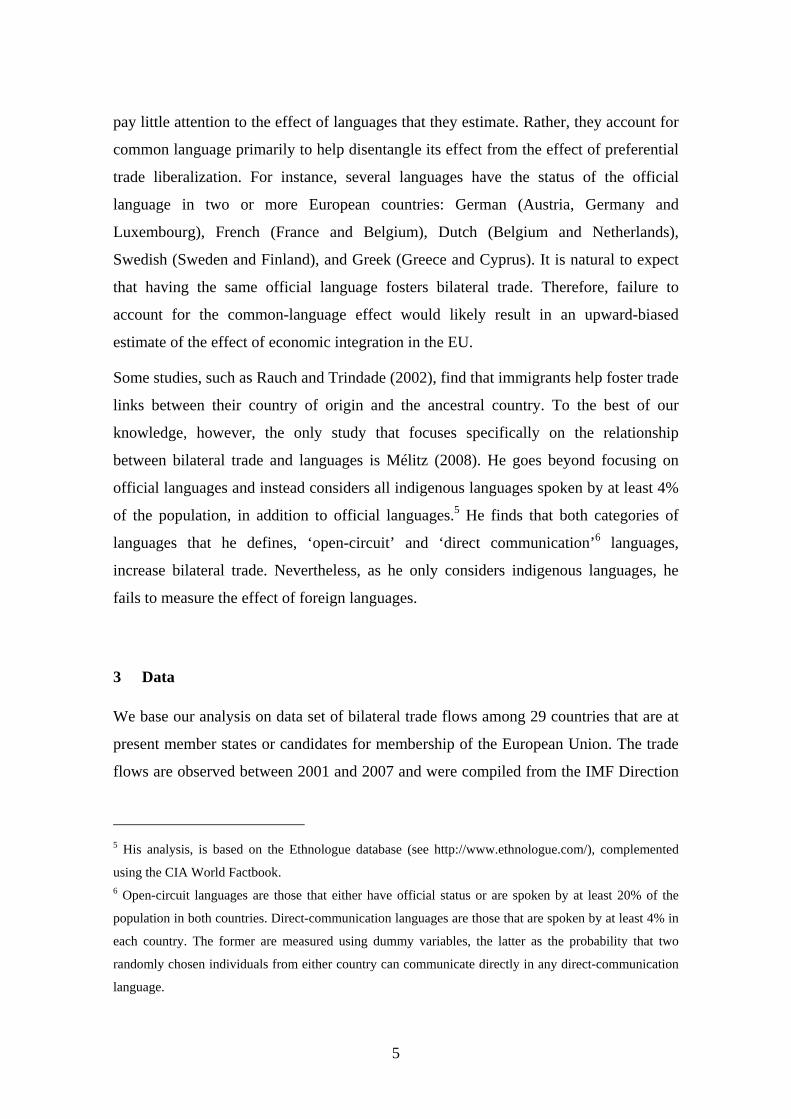
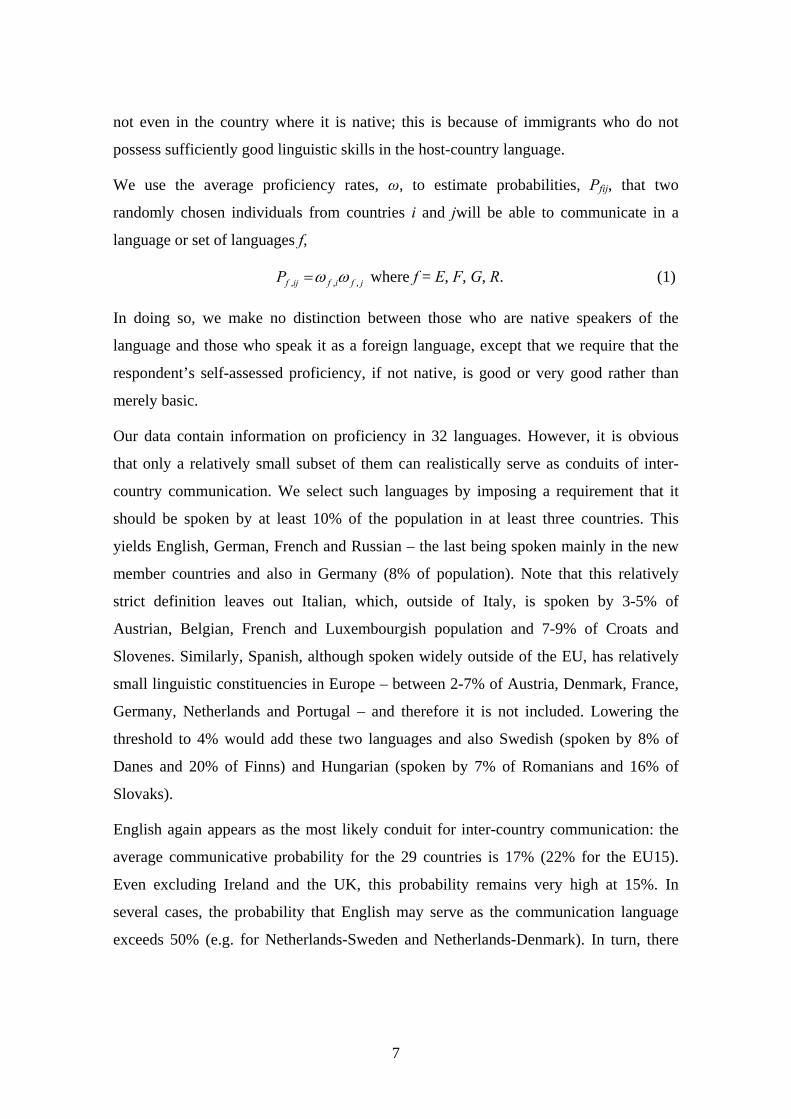
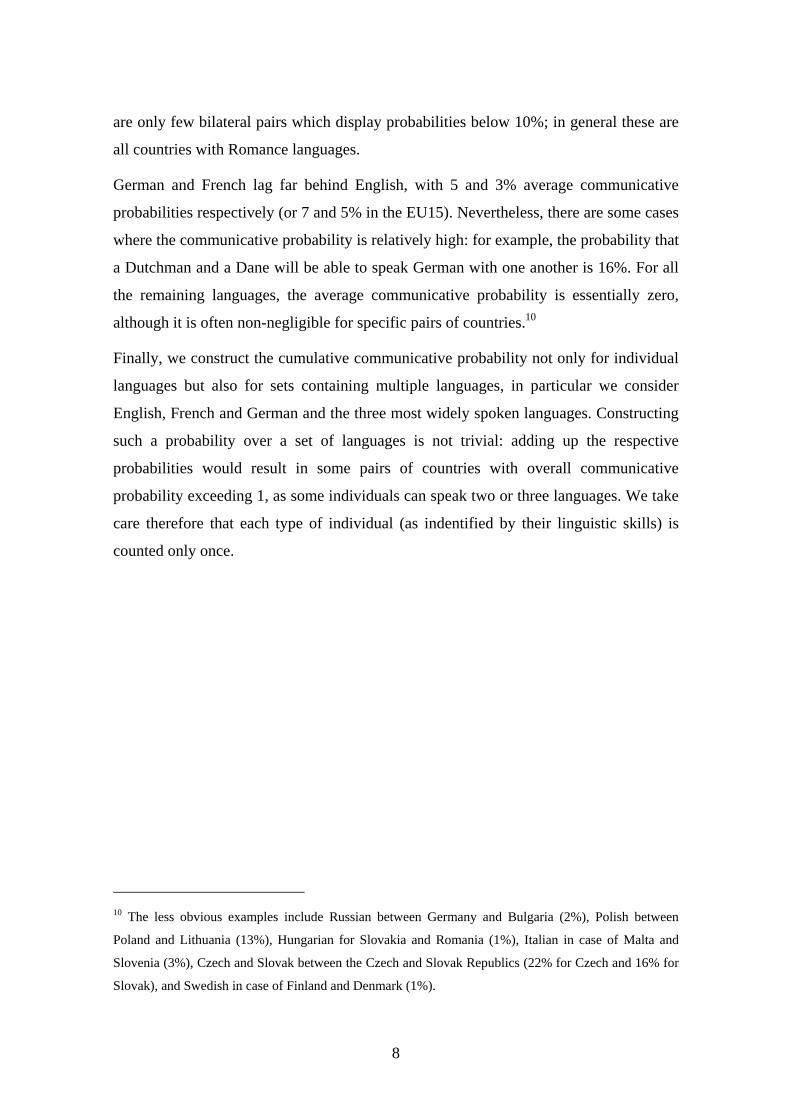
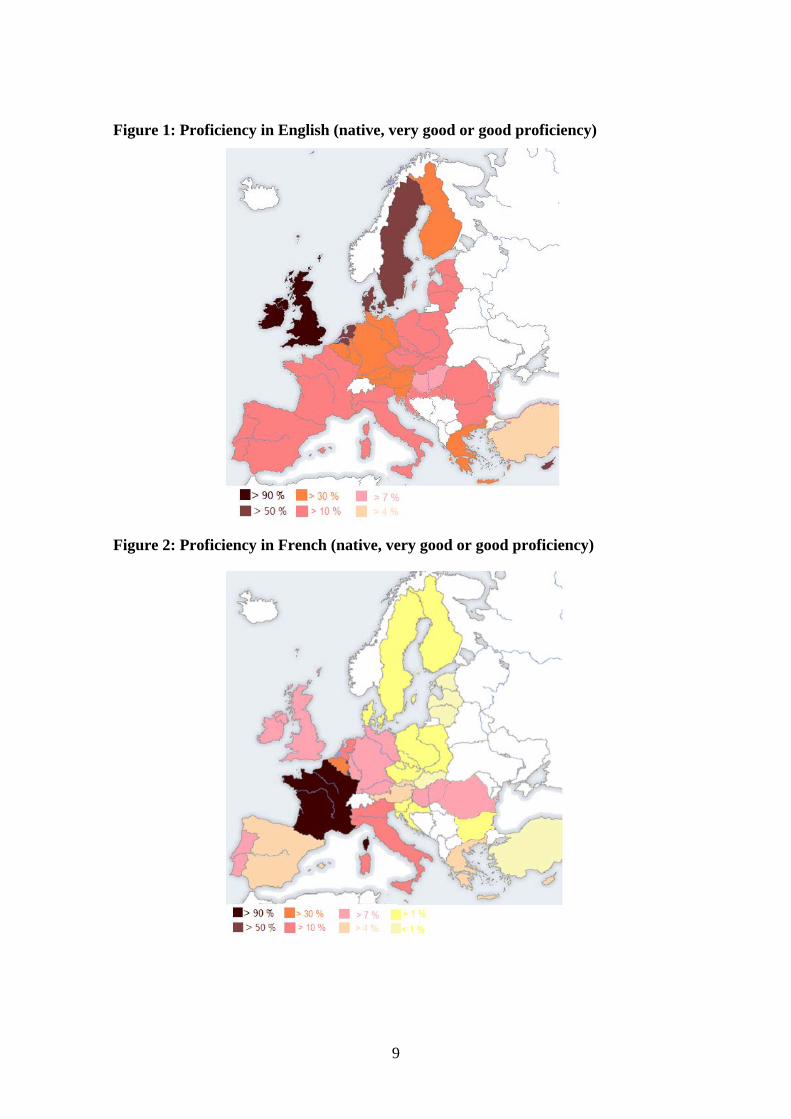
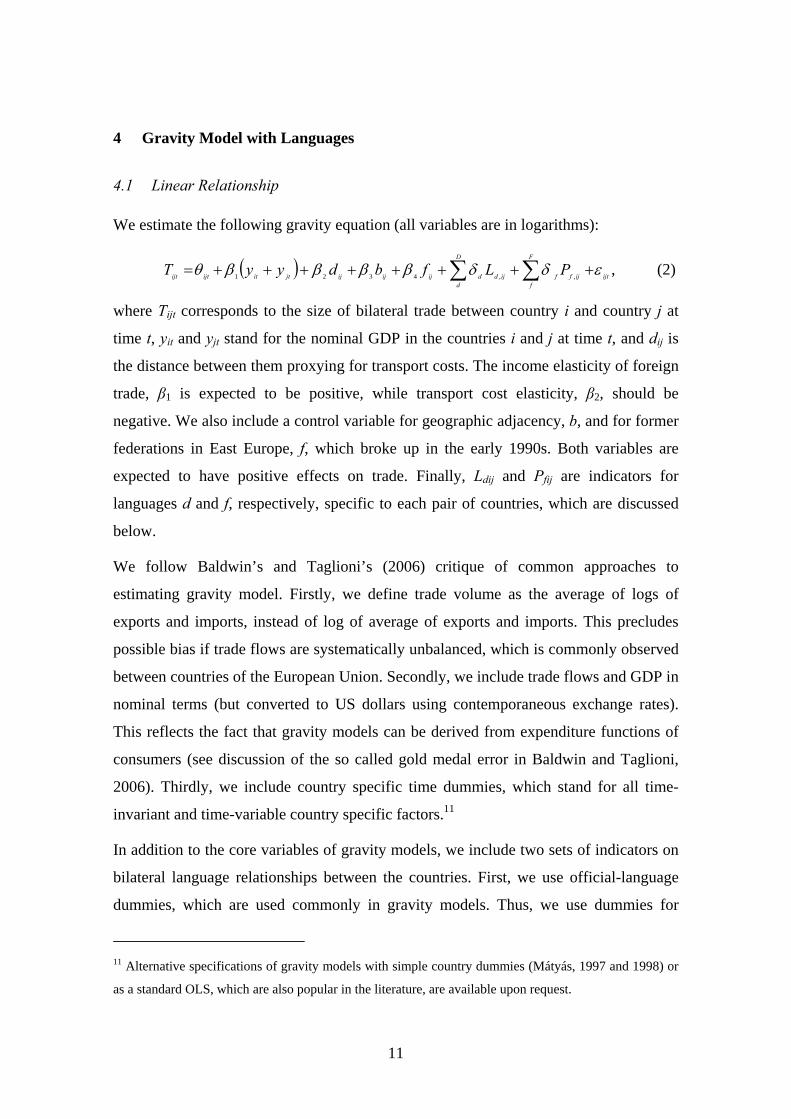
10%. German is spoken by 22%, French by 17% and Russian by 4% (Figure 2 through
Figure 4).9 Unlike English, these three languages are mainly spoken in their native
countries or (in case of Russian) in countries that have large minorities of native
speakers. Note that no language attains a 100% proficiency rate in any single country,
7 Special Eurobarometer 243 (EB64.3), Europeans and their languages, European Commission. See
http://ec.europa.eu/public_opinion/archives/ebs/ebs_243_sum_en.pdf for detailed information. 8 The data report figures for all EU official languages, regional languages of Spain (Catalan, Basque and
Galician), and selected non-EU languages (Arabic, Russian, Chinese, Hindi, Urdu, Gujarati, Bengali and
Punjabi). 9 The shares of those speaking fluently Italian, Spanish and Polish are 12, 10 and 7%, respectively.
7
not even in the country where it is native; this is because of immigrants who do not
possess sufficiently good linguistic skills in the host-country language.
We use the average proficiency rates, ω, to estimate probabilities, Pfij, that two
randomly chosen individuals from countries i and jwill be able to communicate in a
language or set of languages f,
jfifijfP ,,, ωω= where f = E, F, G, R. (1)
In doing so, we make no distinction between those who are native speakers of the
language and those who speak it as a foreign language, except that we require that the
respondent’s self-assessed proficiency, if not native, is good or very good rather than
merely basic.
Our data contain information on proficiency in 32 languages. However, it is obvious
that only a relatively small subset of them can realistically serve as conduits of inter-
country communication. We select such languages by imposing a requirement that it
should be spoken by at least 10% of the population in at least three countries. This
yields English, German, French and Russian – the last being spoken mainly in the new
member countries and also in Germany (8% of population). Note that this relatively
strict definition leaves out Italian, which, outside of Italy, is spoken by 3-5% of
Austrian, Belgian, French and Luxembourgish population and 7-9% of Croats and
Slovenes. Similarly, Spanish, although spoken widely outside of the EU, has relatively
small linguistic constituencies in Europe – between 2-7% of Austria, Denmark, France,
Germany, Netherlands and Portugal – and therefore it is not included. Lowering the
threshold to 4% would add these two languages and also Swedish (spoken by 8% of
Danes and 20% of Finns) and Hungarian (spoken by 7% of Romanians and 16% of
Slovaks).
English again appears as the most likely conduit for inter-country communication: the
average communicative probability for the 29 countries is 17% (22% for the EU15).
Even excluding Ireland and the UK, this probability remains very high at 15%. In
several cases, the probability that English may serve as the communication language
exceeds 50% (e.g. for Netherlands-Sweden and Netherlands-Denmark). In turn, there
8
are only few bilateral pairs which display probabilities below 10%; in general these are
all countries with Romance languages.
German and French lag far behind English, with 5 and 3% average communicative
probabilities respectively (or 7 and 5% in the EU15). Nevertheless, there are some cases
where the communicative probability is relatively high: for example, the probability that
a Dutchman and a Dane will be able to speak German with one another is 16%. For all
the remaining languages, the average communicative probability is essentially zero,
although it is often non-negligible for specific pairs of countries.10
Finally, we construct the cumulative communicative probability not only for individual
languages but also for sets containing multiple languages, in particular we consider
English, French and German and the three most widely spoken languages. Constructing
such a probability over a set of languages is not trivial: adding up the respective
probabilities would result in some pairs of countries with overall communicative
probability exceeding 1, as some individuals can speak two or three languages. We take
care therefore that each type of individual (as indentified by their linguistic skills) is
counted only once.
10 The less obvious examples include Russian between Germany and Bulgaria (2%), Polish between
Poland and Lithuania (13%), Hungarian for Slovakia and Romania (1%), Italian in case of Malta and
Slovenia (3%), Czech and Slovak between the Czech and Slovak Republics (22% for Czech and 16% for
Slovak), and Swedish in case of Finland and Denmark (1%).
9
Figure 1: Proficiency in English (native, very good or good proficiency)
Figure 2: Proficiency in French (native, very good or good proficiency)
10
Figure 3: Proficiency in German (native, very good or good proficiency)
Figure 4: Proficiency in Russian (native, very good or good proficiency)
11
4 Gravity Model with Languages
4.1 Linear Relationship
We estimate the following gravity equation (all variables are in logarithms):
( ) ijt
F
fijff
D
dijddijijijjtitijtijt PLfbdyyT εδδββββθ ++++++++= ∑∑ ,,4321 , (2)
where Tijt corresponds to the size of bilateral trade between country i and country j at
time t, yit and yjt stand for the nominal GDP in the countries i and j at time t, and dij is
the distance between them proxying for transport costs. The income elasticity of foreign
trade, β1 is expected to be positive, while transport cost elasticity, β2, should be
negative. We also include a control variable for geographic adjacency, b, and for former
federations in East Europe, f, which broke up in the early 1990s. Both variables are
expected to have positive effects on trade. Finally, Ldij and Pfij are indicators for
languages d and f, respectively, specific to each pair of countries, which are discussed
below.
We follow Baldwin’s and Taglioni’s (2006) critique of common approaches to
estimating gravity model. Firstly, we define trade volume as the average of logs of
exports and imports, instead of log of average of exports and imports. This precludes
possible bias if trade flows are systematically unbalanced, which is commonly observed
between countries of the European Union. Secondly, we include trade flows and GDP in
nominal terms (but converted to US dollars using contemporaneous exchange rates).
This reflects the fact that gravity models can be derived from expenditure functions of
consumers (see discussion of the so called gold medal error in Baldwin and Taglioni,
2006). Thirdly, we include country specific time dummies, which stand for all time-
invariant and time-variable country specific factors.11
In addition to the core variables of gravity models, we include two sets of indicators on
bilateral language relationships between the countries. First, we use official-language
dummies, which are used commonly in gravity models. Thus, we use dummies for
11 Alternative specifications of gravity models with simple country dummies (Mátyás, 1997 and 1998) or
as a standard OLS, which are also popular in the literature, are available upon request.
12
English (Ireland, Malta and the UK), French (France, Belgium and Luxembourg),
German (Germany, Austria and Luxembourg), Swedish (Sweden and Finland), Dutch
(Belgium and the Netherlands), and Greek (Greece and Cyprus). Second, we include
communicative probabilities for English, French, German, and Russian (constructed as
explained in section 3).12 These indicators measure the probability that two randomly
chosen inhabitants of country i and j can communicate in the specific language.
Importantly, in computing the probabilities, we make no distinction whether the
individuals are native speakers of the language or whether one or both of them speaks it
as a foreign language. Clearly, language can facilitate trade also when one or both
parties to the transaction speak an acquired rather than native language.
A potential problem is presented by the fact that the bilateral trade intensity and the
knowledge of foreign languages are likely to be endogenous. On the one hand, people
have more incentives to learn languages which they can use subsequently in their job or
business. For example, only a negligible fraction of European population speaks
fluently Latin despite many cultural, academic and historical reasons to learn Latin. On
the other hand, knowledge of languages which are not used frequently is likely to
diminish after some time. For example, the share of population with a good or very
good proficiency in Russian in the new member states has declined to between 10% and
20% (and to 1.4% in Hungary), despite a long tradition of obligatory and rather
extensive teaching of Russian in the formerly communist countries.
Therefore, we use two stage least squares as an alternative to OLS. The communicative
probabilities are likely to be correlated with the language groups. Trade between two
countries with e.g. Germanic languages is more likely to be done in English or German,
because of linguistic similarities. Similarly, two countries with native Romance
languages are more likely to use French in their communication. In addition we add a
dummy variable for the countries participating in the Marshal plan.13 Finally, we
12 Further results for Spanish, Italian, Swedish and Hungarian are available upon request from authors. 13 The following countries participated in the Marshal plan: Germany, France, the Netherlands, Sweden,
Denmark, Italy, the UK, Ireland, Austria, Belgium, Portugal, Greece, and Turkey. Norway also
participated in the Marshal plan, but we do not include it in the study because of lack of language data.
13
include also dummies for Baltic countries and for Eastern Europe. All instrumental
variables have the expected signs and are significant in the first stage equation.
We start with an analysis of trade flows among the EU15 countries because they
constitute a relatively homogenous group of countries with regard to many economic,
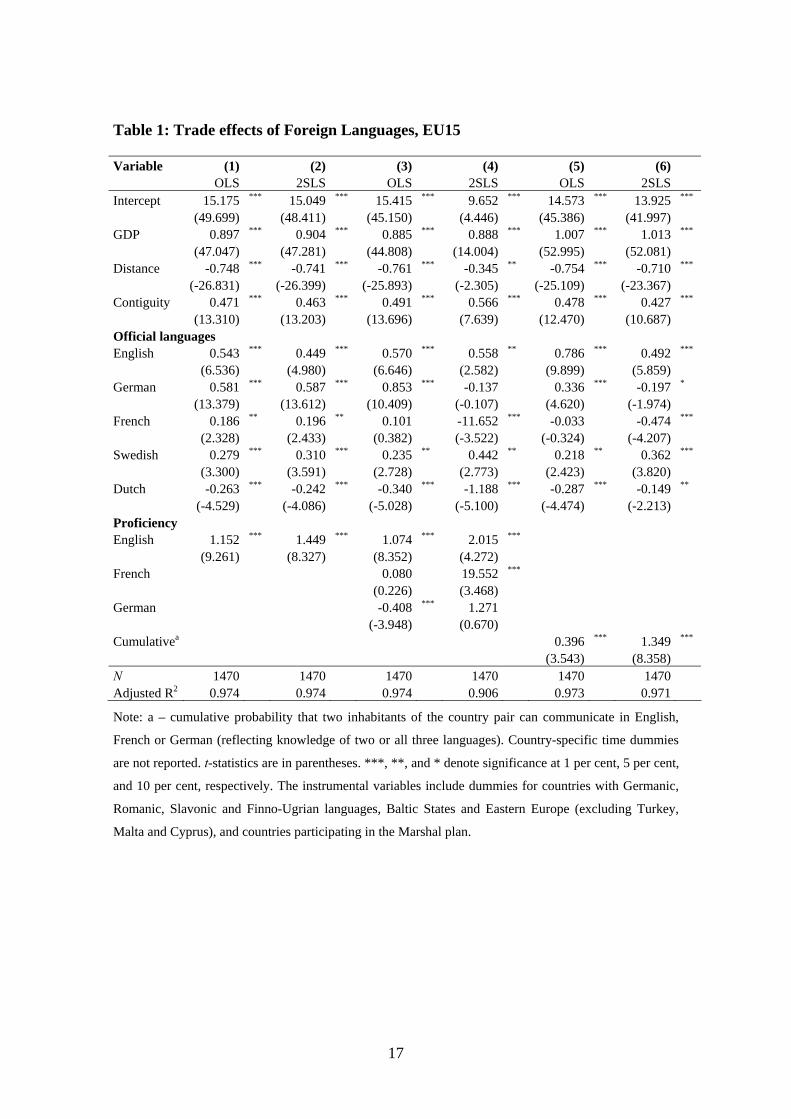
historical and cultural characteristics. Table 1 compares the results obtained with the
various alternative ways of controlling for bilateral language relations between
countries. OLS results are in columns (1), (3) and (5) while the remaining columns
present the 2SLS estimates. All regressions feature the official-language dummies for
English, French, German, and Swedish: common official languages raises bilateral trade
between 1.2 (French) and 1.8 times (German). Dutch, in contrast, appears to lower trade
slightly. This may be due to the fact that although Dutch is only one of two official
languages of Belgium (in addition to French).
In column (1), we include also the communicative probability for English. Ability to
communicate in English has a positive impact on trade and is strongly significant. As an
example, the communicative probability for the UK and Ireland is 0.97 which translates
into 3.1-fold increase in trade. Overall, trade between UK and Ireland is therefore more
than 5 times higher than what can be ascribed only to economic factors and geography
(this combines the effects of the official-language dummy and communicative
probability, both of which are significant and increase trade). The proficiency in English
is an important for trade between other countries too. For example, the trade between
the Netherlands and Sweden is increased by three quarters and Dutch trade with the UK
is more than doubled. With English communicative probability 22% in the EU15 on
average, the ability to communicate in English increases trade by approximately one
fifth.
In column (3), we add communicative probabilities for French and German.
Communicative probability in French appears to raise trade but its effect is
insignificant. German appears even to have a negative impact. While this appears
somewhat counter-intuitive, it merely shows that countries whose nationals could easily
communicate in German (mainly the Netherlands and Denmark) fail to capitalize on this
potential (possibly because of historical animosities between these countries and
Germany), or use English instead; having German as an official language does fosters
14
trade, however. Importantly, adding further languages affects the regression estimates
for English little. Finally, in column (5) we introduce the cumulative probability for all
three languages, which has also a positive and significant effect on foreign trade.
The instrumental regressions confirm the positive effect of English on trade. Moreover,
the 2SLS estimates tend to be higher than the OLS ones, suggesting that endogeneity of
communicative probabilities tends to translate into a downward bias. According to the
2SLS results, French also appears to have a positive impact on trade while the negative
effect of German disappears. The coefficient for cumulative probability similarly turns
out larger when estimated with 2SLS.
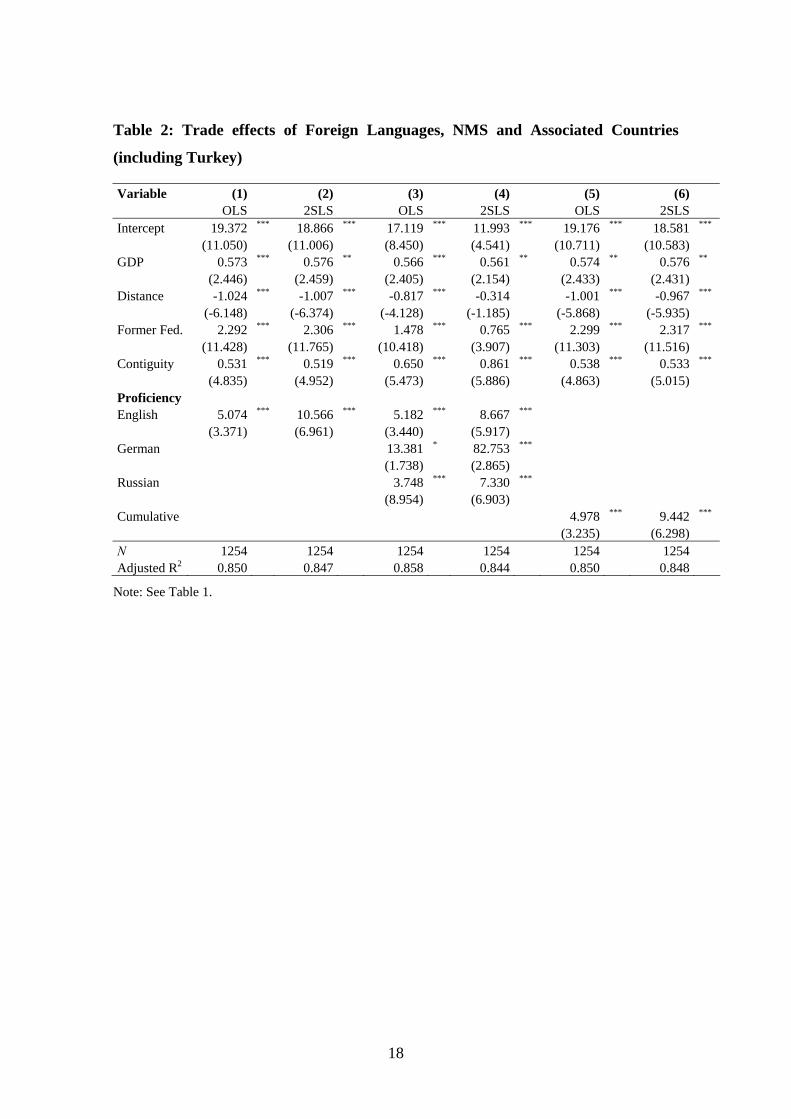
Table 2 presents similar results for the new member states and candidate countries
(NMSC). Because French plays only a marginal role in this group of countries, we are
not including this language here. Instead, columns (3) and (4) feature Russian. No
official-language dummies are included because there are no two or more countries with
the same official language. The communicative probabilities for all languages
(including German) again have a strong positive impact on trade, which is also
confirmed by the 2SLS results. The cumulative communicative probability, likewise,
raises trade. As before, the 2SLS results suggest a stronger relationship than the one
stipulated by OLS.
When comparing the regression results estimates for the EU15 and the MNSC, it is
striking that the coefficients appear much larger for the latter group of countries. In
interpreting the regression results, however, one one must bear in mind the generally
lower levels of foreign language proficiency in the new members and candidates (for
example the average communicative probability in English is 11% in NMSC).14
Nevertheless, the effect is sizeable: on average, the ability to communicate in English
raises trade by 74% in these countries.
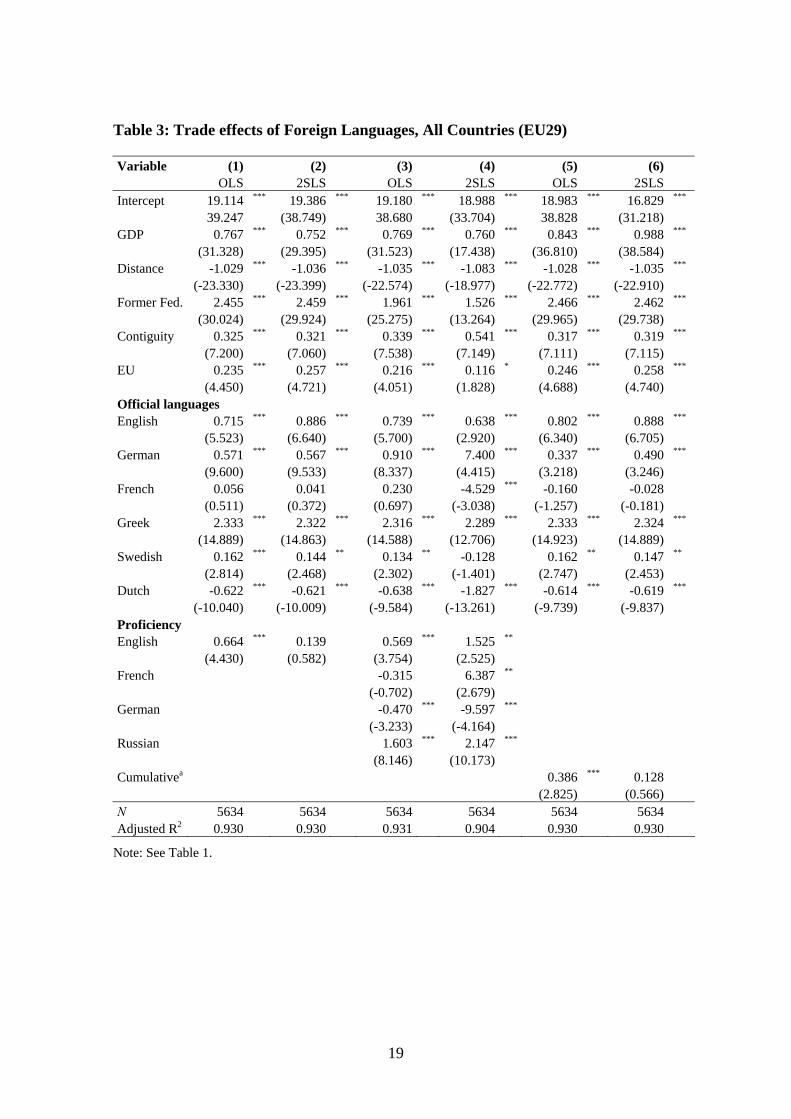
Finally, Table 3 merges the two groups of countries – although we are aware that the
previous results show that both regions are very different with respect to proficiency in
foreign languages and their effects. We now add one more common official language,
14 The same caveat applies to interpreting the relatively large effect of French in column (4) of Table 1. Furthermore, when we include additional, more marginally used, languages such as Italian and Spanish, we get similarly large or even larger coefficient estimates for their effects (results available upon request).
15
Greek, along with the communicative probabilities in all of the above-listed languages.
English is again significant in all OLS specifications and also in the 2SLS regression
with all included languages (column 4). French and Russian communicative
probabilities are positive and significant but German again appears to lower trade. The
cumulative probability is significant only with OLS.
The mixed and generally disappointing results in Table 3, and also the large differences
between the EU and NMSC results, can be due to two factors. First, while the EU15
countries share a long legacy of economic integration, the NMSC – and in turn also the
EU29 – constitute much more heterogenous groups. Second, the impact of language
proficiency on trade can be non-linear. In particular, communicative probability can
have diminishing returns so that trade is increased more for low to moderate levels than
for relatively high levels. The latter especially would explain why we find significant
results for both groups of countries in separate regressions but relatively weak results
when we merge them, and why the language effects estimated for the NMSC appear
stronger (the NMSC have lower communicative probabilities and therefore the
estimates are clustered closer to the origin, where the non-linear regression line would
be expected to be steeper).
We can use our estimates to assess the potential (hypothetical) effects of improvements
in English proficiency. An increase in English proficiency in all EU15 countries by 10
percentage points (keeping UK and Irish proficiency levels constant) would increase the
intra-EU15 trade by 15% on average. This increase would not be shared uniformly by
all countries: while Portuguese trade would go up by some 9%, Dutch trade could
increase by as much as 24% (UK and Ireland would be close behind with 21% trade
increases). An even greater increase, one that would bring all countries to the level of
English proficiency attained by the Netherlands (again, assuming that the UK and
Ireland’s proficiency levels would remain unchanged), would bring about an average
increase in EU15 trade by 70%.
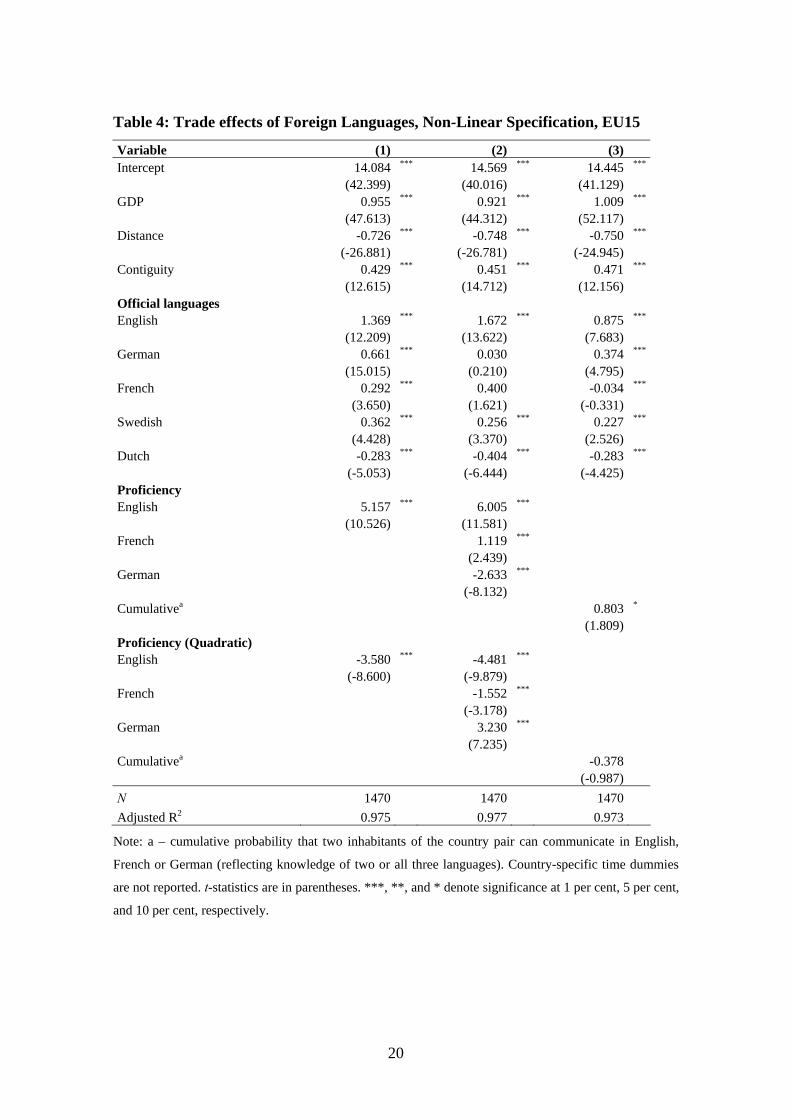
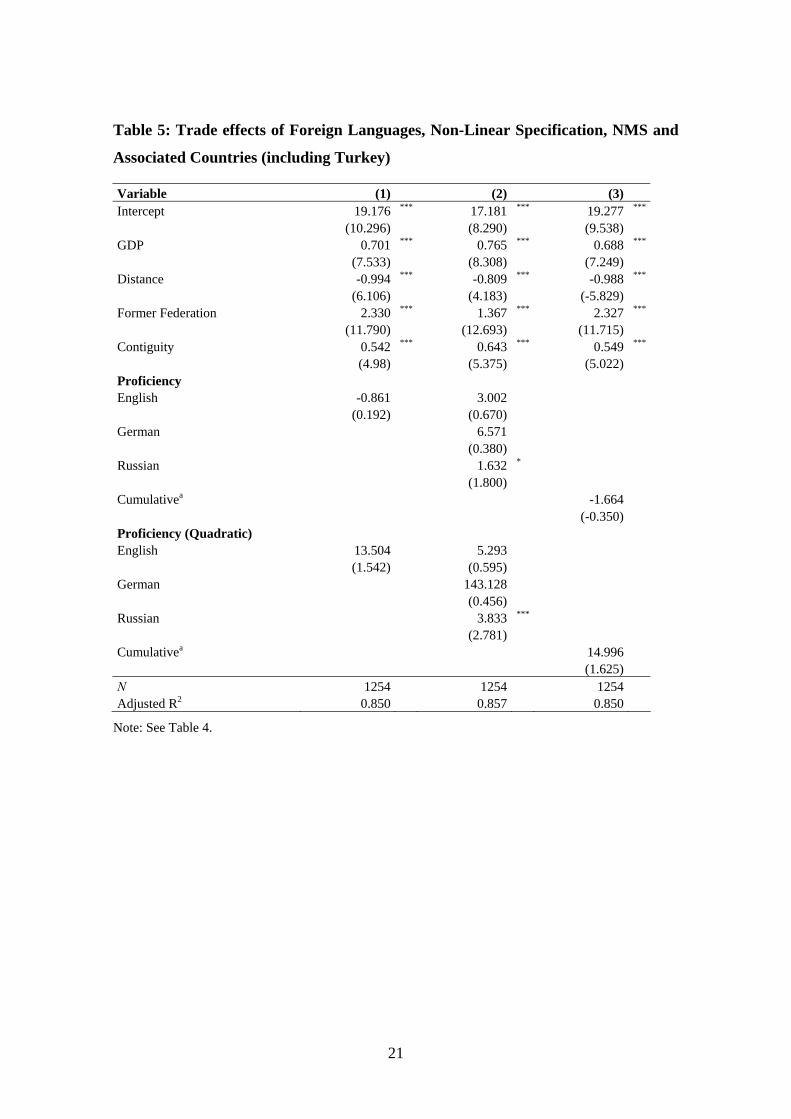
4.2 Non-linear Relationship
To explore the possibility of non-linear relationship between communicative probability
and trade, we add the square of the communicative probability to our regressions. Table
4 presents again first the results for the EU15 countries. Focusing on the impact of
16
English communicative probability, all regressions suggest that it indeed has a hump-
shaped effect on trade flows. The effect peaks when the communicative probability is
approximately 70%. Note, however, that although this seems to suggest that English-
speaking countries could do better by lowering their English proficiency, they also
receive the positive impact of having English as their official language (captured by the
common-language dummy) – and this effect rises when we control for the English
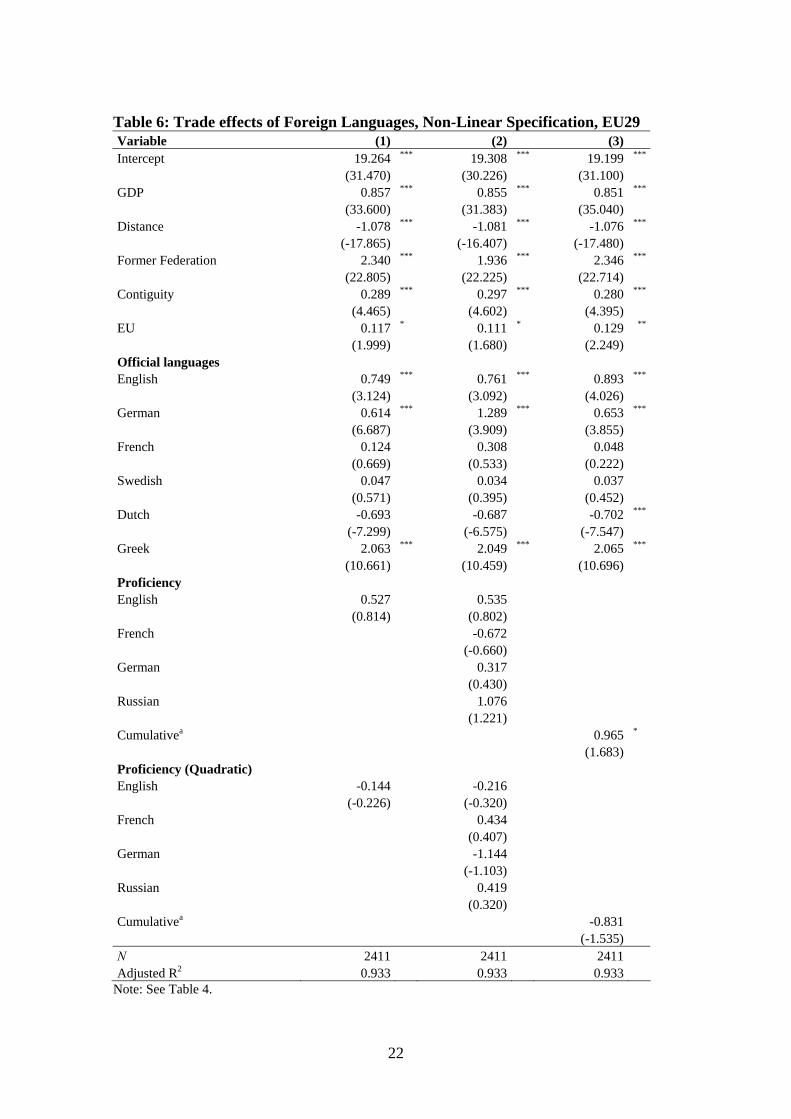
communicative probability. Table 5 and Table 6 present similar results for the new
members and candidates and for all countries together. The results are again generally
weak – the only language that now appears to have a significant effect on trade is
Russian in the NMS sample. Therefore, while there is some evidence that that the
returns to English proficiency may be non-linear, the EU15 and the new members and
candidates again appear very heterogenous.
17
Table 1: Trade effects of Foreign Languages, EU15
Variable (1) (2) (3) (4) (5) (6)
OLS 2SLS OLS 2SLS OLS 2SLS
Intercept 15.175 *** 15.049 *** 15.415 *** 9.652 *** 14.573 *** 13.925 ***
(49.699) (48.411) (45.150) (4.446) (45.386) (41.997)
GDP 0.897 *** 0.904 *** 0.885 *** 0.888 *** 1.007 *** 1.013 ***
(47.047) (47.281) (44.808) (14.004) (52.995) (52.081)
Distance -0.748 *** -0.741 *** -0.761 *** -0.345 ** -0.754 *** -0.710 ***
(-26.831) (-26.399) (-25.893) (-2.305) (-25.109) (-23.367)
Contiguity 0.471 *** 0.463 *** 0.491 *** 0.566 *** 0.478 *** 0.427 ***
(13.310) (13.203) (13.696) (7.639) (12.470) (10.687)
Official languages
English 0.543 *** 0.449 *** 0.570 *** 0.558 ** 0.786 *** 0.492 ***
(6.536) (4.980) (6.646) (2.582) (9.899) (5.859)
German 0.581 *** 0.587 *** 0.853 *** -0.137 0.336 *** -0.197 *
(13.379) (13.612) (10.409) (-0.107) (4.620) (-1.974)
French 0.186 ** 0.196 ** 0.101 -11.652 *** -0.033 -0.474 ***
(2.328) (2.433) (0.382) (-3.522) (-0.324) (-4.207)
Swedish 0.279 *** 0.310 *** 0.235 ** 0.442 ** 0.218 ** 0.362 ***
(3.300) (3.591) (2.728) (2.773) (2.423) (3.820)
Dutch -0.263 *** -0.242 *** -0.340 *** -1.188 *** -0.287 *** -0.149 **
(-4.529) (-4.086) (-5.028) (-5.100) (-4.474) (-2.213)
Proficiency
English 1.152 *** 1.449 *** 1.074 *** 2.015 ***
(9.261) (8.327) (8.352) (4.272)
French 0.080 19.552 ***
(0.226) (3.468)
German -0.408 *** 1.271
(-3.948) (0.670)
Cumulativea 0.396 *** 1.349 ***
(3.543) (8.358)
N 1470 1470 1470 1470 1470 1470
Adjusted R2 0.974 0.974 0.974 0.906 0.973 0.971
Note: a – cumulative probability that two inhabitants of the country pair can communicate in English,
French or German (reflecting knowledge of two or all three languages). Country-specific time dummies
are not reported. t-statistics are in parentheses. ***, **, and * denote significance at 1 per cent, 5 per cent,
and 10 per cent, respectively. The instrumental variables include dummies for countries with Germanic,
Romanic, Slavonic and Finno-Ugrian languages, Baltic States and Eastern Europe (excluding Turkey,
Malta and Cyprus), and countries participating in the Marshal plan.
18
Table 2: Trade effects of Foreign Languages, NMS and Associated Countries
(including Turkey)
Variable (1) (2) (3) (4) (5) (6)
OLS 2SLS OLS 2SLS OLS 2SLS
Intercept 19.372 *** 18.866 *** 17.119 *** 11.993 *** 19.176 *** 18.581 ***
(11.050) (11.006) (8.450) (4.541) (10.711) (10.583)
GDP 0.573 *** 0.576 ** 0.566 *** 0.561 ** 0.574 ** 0.576 **
(2.446) (2.459) (2.405) (2.154) (2.433) (2.431)
Distance -1.024 *** -1.007 *** -0.817 *** -0.314 -1.001 *** -0.967 ***
(-6.148) (-6.374) (-4.128) (-1.185) (-5.868) (-5.935)
Former Fed. 2.292 *** 2.306 *** 1.478 *** 0.765 *** 2.299 *** 2.317 ***
(11.428) (11.765) (10.418) (3.907) (11.303) (11.516)
Contiguity 0.531 *** 0.519 *** 0.650 *** 0.861 *** 0.538 *** 0.533 ***
(4.835) (4.952) (5.473) (5.886) (4.863) (5.015)
Proficiency
English 5.074 *** 10.566 *** 5.182 *** 8.667 ***
(3.371) (6.961) (3.440) (5.917)
German 13.381 * 82.753 ***
(1.738) (2.865)
Russian 3.748 *** 7.330 ***
(8.954) (6.903)
Cumulative 4.978 *** 9.442 ***
(3.235) (6.298)
N 1254 1254 1254 1254 1254 1254
Adjusted R2 0.850 0.847 0.858 0.844 0.850 0.848
Note: See Table 1.
19
Table 3: Trade effects of Foreign Languages, All Countries (EU29)
Variable (1) (2) (3) (4) (5) (6)
OLS 2SLS OLS 2SLS OLS 2SLS
Intercept 19.114 *** 19.386 *** 19.180 *** 18.988 *** 18.983 *** 16.829 ***
39.247 (38.749) 38.680 (33.704) 38.828 (31.218)
GDP 0.767 *** 0.752 *** 0.769 *** 0.760 *** 0.843 *** 0.988 ***
(31.328) (29.395) (31.523) (17.438) (36.810) (38.584)
Distance -1.029 *** -1.036 *** -1.035 *** -1.083 *** -1.028 *** -1.035 ***
(-23.330) (-23.399) (-22.574) (-18.977) (-22.772) (-22.910)
Former Fed. 2.455 *** 2.459 *** 1.961 *** 1.526 *** 2.466 *** 2.462 ***
(30.024) (29.924) (25.275) (13.264) (29.965) (29.738)
Contiguity 0.325 *** 0.321 *** 0.339 *** 0.541 *** 0.317 *** 0.319 ***
(7.200) (7.060) (7.538) (7.149) (7.111) (7.115)
EU 0.235 *** 0.257 *** 0.216 *** 0.116 * 0.246 *** 0.258 ***
(4.450) (4.721) (4.051) (1.828) (4.688) (4.740)
Official languages
English 0.715 *** 0.886 *** 0.739 *** 0.638 *** 0.802 *** 0.888 ***
(5.523) (6.640) (5.700) (2.920) (6.340) (6.705)
German 0.571 *** 0.567 *** 0.910 *** 7.400 *** 0.337 *** 0.490 ***
(9.600) (9.533) (8.337) (4.415) (3.218) (3.246)
French 0.056 0.041 0.230 -4.529 *** -0.160 -0.028
(0.511) (0.372) (0.697) (-3.038) (-1.257) (-0.181)
Greek 2.333 *** 2.322 *** 2.316 *** 2.289 *** 2.333 *** 2.324 ***
(14.889) (14.863) (14.588) (12.706) (14.923) (14.889)
Swedish 0.162 *** 0.144 ** 0.134 ** -0.128 0.162 ** 0.147 **
(2.814) (2.468) (2.302) (-1.401) (2.747) (2.453)
Dutch -0.622 *** -0.621 *** -0.638 *** -1.827 *** -0.614 *** -0.619 ***
(-10.040) (-10.009) (-9.584) (-13.261) (-9.739) (-9.837)
Proficiency
English 0.664 *** 0.139 0.569 *** 1.525 **
(4.430) (0.582) (3.754) (2.525)
French -0.315 6.387 **
(-0.702) (2.679)
German -0.470 *** -9.597 ***
(-3.233) (-4.164)
Russian 1.603 *** 2.147 ***
(8.146) (10.173)
Cumulativea 0.386 *** 0.128
(2.825) (0.566)
N 5634 5634 5634 5634 5634 5634
Adjusted R2 0.930 0.930 0.931 0.904 0.930 0.930
Note: See Table 1.
20
Table 4: Trade effects of Foreign Languages, Non-Linear Specification, EU15
Variable (1) (2) (3)
Intercept 14.084 *** 14.569 *** 14.445 ***
(42.399) (40.016) (41.129)
GDP 0.955 *** 0.921 *** 1.009 ***
(47.613) (44.312) (52.117)
Distance -0.726 *** -0.748 *** -0.750 ***
(-26.881) (-26.781) (-24.945)
Contiguity 0.429 *** 0.451 *** 0.471 ***
(12.615) (14.712) (12.156)
Official languages
English 1.369 *** 1.672 *** 0.875 ***
(12.209) (13.622) (7.683)
German 0.661 *** 0.030 0.374 ***
(15.015) (0.210) (4.795)
French 0.292 *** 0.400 -0.034 ***
(3.650) (1.621) (-0.331)
Swedish 0.362 *** 0.256 *** 0.227 ***
(4.428) (3.370) (2.526)
Dutch -0.283 *** -0.404 *** -0.283 ***
(-5.053) (-6.444) (-4.425)
Proficiency
English 5.157 *** 6.005 ***
(10.526) (11.581)
French 1.119 ***
(2.439)
German -2.633 ***
(-8.132)
Cumulativea 0.803 *
(1.809)
Proficiency (Quadratic)
English -3.580 *** -4.481 ***
(-8.600) (-9.879)
French -1.552 ***
(-3.178)
German 3.230 ***
(7.235)
Cumulativea -0.378
(-0.987)
N 1470 1470 1470
Adjusted R2 0.975 0.977 0.973
Note: a – cumulative probability that two inhabitants of the country pair can communicate in English,
French or German (reflecting knowledge of two or all three languages). Country-specific time dummies
are not reported. t-statistics are in parentheses. ***, **, and * denote significance at 1 per cent, 5 per cent,
and 10 per cent, respectively.
21
Table 5: Trade effects of Foreign Languages, Non-Linear Specification, NMS and
Associated Countries (including Turkey)
Variable (1) (2) (3)
Intercept 19.176 *** 17.181 *** 19.277 ***
(10.296) (8.290) (9.538)
GDP 0.701 *** 0.765 *** 0.688 ***
(7.533) (8.308) (7.249)
Distance -0.994 *** -0.809 *** -0.988 ***
(6.106) (4.183) (-5.829)
Former Federation 2.330 *** 1.367 *** 2.327 ***
(11.790) (12.693) (11.715)
Contiguity 0.542 *** 0.643 *** 0.549 ***
(4.98) (5.375) (5.022)
Proficiency
English -0.861 3.002
(0.192) (0.670)
German 6.571
(0.380)
Russian 1.632 *
(1.800)
Cumulativea -1.664
(-0.350)
Proficiency (Quadratic)
English 13.504 5.293
(1.542) (0.595)
German 143.128
(0.456)
Russian 3.833 ***
(2.781)
Cumulativea 14.996
(1.625)
N 1254 1254 1254
Adjusted R2 0.850 0.857 0.850
Note: See Table 4.
22
Table 6: Trade effects of Foreign Languages, Non-Linear Specification, EU29 Variable (1) (2) (3)
Intercept 19.264 *** 19.308 *** 19.199 ***
(31.470) (30.226) (31.100)
GDP 0.857 *** 0.855 *** 0.851 ***
(33.600) (31.383) (35.040)
Distance -1.078 *** -1.081 *** -1.076 ***
(-17.865) (-16.407) (-17.480)
Former Federation 2.340 *** 1.936 *** 2.346 ***
(22.805) (22.225) (22.714)
Contiguity 0.289 *** 0.297 *** 0.280 ***
(4.465) (4.602) (4.395)
EU 0.117 * 0.111 * 0.129 **
(1.999) (1.680) (2.249)
Official languages
English 0.749 *** 0.761 *** 0.893 ***
(3.124) (3.092) (4.026)
German 0.614 *** 1.289 *** 0.653 ***
(6.687) (3.909) (3.855)
French 0.124 0.308 0.048
(0.669) (0.533) (0.222)
Swedish 0.047 0.034 0.037
(0.571) (0.395) (0.452)
Dutch -0.693 -0.687 -0.702 ***
(-7.299) (-6.575) (-7.547)
Greek 2.063 *** 2.049 *** 2.065 ***
(10.661) (10.459) (10.696)
Proficiency
English 0.527 0.535
(0.814) (0.802)
French -0.672
(-0.660)
German 0.317
(0.430)
Russian 1.076
(1.221)
Cumulativea 0.965 *
(1.683)
Proficiency (Quadratic)
English -0.144 -0.216
(-0.226) (-0.320)
French 0.434
(0.407)
German -1.144
(-1.103)
Russian 0.419
(0.320)
Cumulativea -0.831
(-1.535)
N 2411 2411 2411
Adjusted R2 0.933 0.933 0.933
Note: See Table 4.
23
5 Sensitivity Analysis – Quantile Regression
The previous results may be sensitive to outliers. For example, there may be pairs of
countries that have particularly high bilateral trade and relatively high communicative
probability in English or another language so that the estimated gain from foreign
languages is overestimated. Or, on the contrary, we may have pairs of countries with
relatively low bilateral trade despite high communicative probability, resulting in
underestimated effect of languages. We analyze these factors in this section by means of
median and quantile regression. The median regression is frequently used when
standard OLS regression may be biased by outliers. While the least squares regression
estimates the sum of the squared residuals, which gives much weight to outliers, the
median regression finds the regression line that equates the number of positive and
negative residuals. This property makes the median regression more robust to influential
observations. Koenker and Bassett (1978) generalized this concept to quantile
regression, in which selected quantiles of the conditional distribution of the dependent
variable are expressed as functions of observed explanatory variables. Koenker and
Hallock (2000) argue that inference in quantile regression is more robust than in
ordinary regression. While this concept is now frequently used in economics, especially
in labor and family economics (see literature survey by Koenkeer and Hallock, 2001), it
has found little application in trade analysis so far (see Wagner, 2006).
For simplicity, we use a parsimonious version of our gravity model specified only with
linear communicative probability in English as well as a dummy for English official
language. We thus estimate the following linear model for the τth conditional quantile,
Q, of bilateral trade volume, T,
( ) ( ) ijtijengijengijijjtittijt FLDLbdyyTQ εδδβββθα ττττττττ ++++++++= ,,321 . (3)
Table 7 reports the results for the 10th, 25th, 75th and 90th percentiles in addition to the
median regression. The standard errors are simulated in a bootstrap procedure with 1000
repetitions. We can see that the effects of all gravity variables differ significantly
between the individual percentiles. The income elasticity declines as bilateral trade
increases. In turn, the transport (distance) elasticity increases slightly in absolute terms
with trade volume, while the effect of contiguity tends rather to decrease with trade
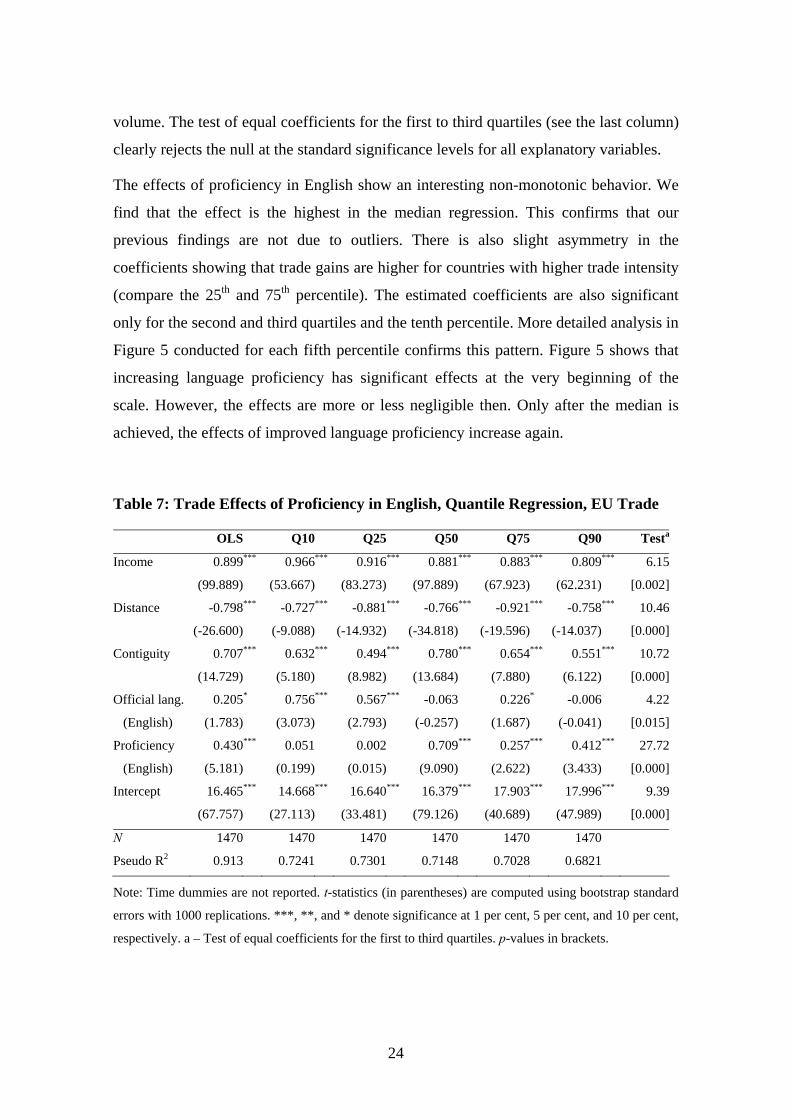
24
volume. The test of equal coefficients for the first to third quartiles (see the last column)
clearly rejects the null at the standard significance levels for all explanatory variables.
The effects of proficiency in English show an interesting non-monotonic behavior. We
find that the effect is the highest in the median regression. This confirms that our
previous findings are not due to outliers. There is also slight asymmetry in the
coefficients showing that trade gains are higher for countries with higher trade intensity
(compare the 25th and 75th percentile). The estimated coefficients are also significant
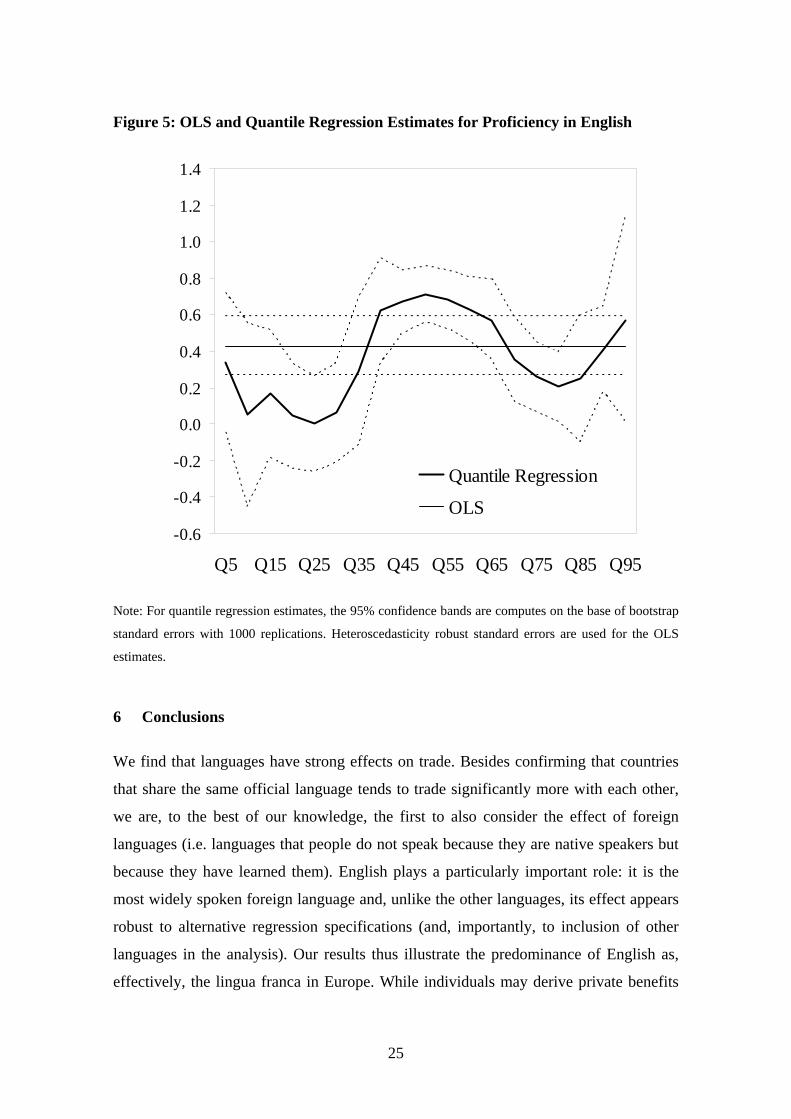
only for the second and third quartiles and the tenth percentile. More detailed analysis in
Figure 5 conducted for each fifth percentile confirms this pattern. Figure 5 shows that
increasing language proficiency has significant effects at the very beginning of the
scale. However, the effects are more or less negligible then. Only after the median is
achieved, the effects of improved language proficiency increase again.
Table 7: Trade Effects of Proficiency in English, Quantile Regression, EU Trade
OLS Q10 Q25 Q50 Q75 Q90 Testa
Income 0.899*** 0.966*** 0.916*** 0.881*** 0.883*** 0.809*** 6.15
(99.889) (53.667) (83.273) (97.889) (67.923) (62.231) [0.002]
Distance -0.798*** -0.727*** -0.881*** -0.766*** -0.921*** -0.758*** 10.46
(-26.600) (-9.088) (-14.932) (-34.818) (-19.596) (-14.037) [0.000]
Contiguity 0.707*** 0.632*** 0.494*** 0.780*** 0.654*** 0.551*** 10.72
(14.729) (5.180) (8.982) (13.684) (7.880) (6.122) [0.000]
Official lang. 0.205* 0.756*** 0.567*** -0.063 0.226* -0.006 4.22
(English) (1.783) (3.073) (2.793) (-0.257) (1.687) (-0.041) [0.015]
Proficiency 0.430*** 0.051 0.002 0.709*** 0.257*** 0.412*** 27.72
(English) (5.181) (0.199) (0.015) (9.090) (2.622) (3.433) [0.000]
Intercept 16.465*** 14.668*** 16.640*** 16.379*** 17.903*** 17.996*** 9.39
(67.757) (27.113) (33.481) (79.126) (40.689) (47.989) [0.000]
N 1470 1470 1470 1470 1470 1470
Pseudo R2 0.913 0.7241 0.7301 0.7148 0.7028 0.6821
Note: Time dummies are not reported. t-statistics (in parentheses) are computed using bootstrap standard
errors with 1000 replications. ***, **, and * denote significance at 1 per cent, 5 per cent, and 10 per cent,
respectively. a – Test of equal coefficients for the first to third quartiles. p-values in brackets.
25
Figure 5: OLS and Quantile Regression Estimates for Proficiency in English
-0.6
-0.4
-0.2
0.0
0.2
0.4
0.6
0.8
1.0
1.2
1.4
Q5 Q15 Q25 Q35 Q45 Q55 Q65 Q75 Q85 Q95
Quantile Regression
OLS
Note: For quantile regression estimates, the 95% confidence bands are computes on the base of bootstrap
standard errors with 1000 replications. Heteroscedasticity robust standard errors are used for the OLS
estimates.
6 Conclusions
We find that languages have strong effects on trade. Besides confirming that countries
that share the same official language tends to trade significantly more with each other,
we are, to the best of our knowledge, the first to also consider the effect of foreign
languages (i.e. languages that people do not speak because they are native speakers but
because they have learned them). English plays a particularly important role: it is the
most widely spoken foreign language and, unlike the other languages, its effect appears
robust to alternative regression specifications (and, importantly, to inclusion of other
languages in the analysis). Our results thus illustrate the predominance of English as,
effectively, the lingua franca in Europe. While individuals may derive private benefits
26
from learning marginal languages, countries only benefit inasmuch as the same
language is learned also by other individuals in other countries. English, at present, is
the only language spoken by enough people to have an economically significant effect
on trade flows. Nevertheless, our findings also suggest that the effect of English and
other languages on trade flows may be non-linear, displaying diminishing returns: the
return is particularly high for countries with relatively low level of proficiency in
English (and other languages).
Nevertheless, the gains from foreign languages are not uniform across countries: our
analysis suggests that the effect is different in the EU15 compared to the new member
states and candidate countries. This heterogeneity is likely due to the different history of
integration and different economic, political and linguistic legacies in the two sets of
countries. Further research will show to what extent we can find evidence of
convergence or divergence in the effect of languages.
In the past decade or two, trade has become a powerful argument in favor of deepening
European integration, including introducing the common currency, the euro. Our
findings suggest that gains of similar magnitude could be realized by improving
linguistic skills, especially in English. Crucially, while adopting a common currency is
costly because a country must give up its national currency and autonomy over
monetary policy, improving linguistic skills in English does not require abandoning
national languages. Substantial gains are available at relatively little cost: encouraging
the learning of English could well, metaphorically, allow countries to pick up $100 bills
lying on the sidewalk.
27
References
Anderson JE, van Wincoop E (2003) Gravity with gravitas: A solution to the border
puzzle. American Economic Review 93: 170-192.
Baldwin, R, Taglioni, D (2006) Gravity for dummies and dummies for gravity
equations. Working Paper No. 12516, NBER, Cambridge, MA.
Baltagi, BH (2005) Econometric Analysis of Panel Data, Wiley and Sons, Chichester,
3rd edition.
Bussière M, Fidrmuc J, Schnatz B (2005) Trade Integration of Central and South
Eastern European Countries: Lessons from a Gravity Model. Working Paper No.
545, European Central Bank, Frankfurt.
Bussière, M., Fidrmuc, J., Schnatz, B. (2008) EU Enlargement and Trade Integration:
Lessons from a Gravity Model. Review of Development Economics, 12, 3, 501-515.
Chiswick, B.R., Miller, P.W. (2002), Immigrant Earnings: Langauge Skills, Linguistic
Concentrations and the Business Cycle,” Journal of Population Economics 15, 31-57.
Chiswick, B.R., Miller, P.W. (2007), “Modelling Immigrants’ Language Skills,” IZA
DP 2974, Institute for the Study of Labor (IZA), Bonn.
Egger P (2003) An econometric view on the estimation of gravity models and the
calculation of trade potentials. World Economy 25: 297-312.
Egger P, Pfaffermayr M (2004) Distance, trade and FDI: A Hausman-Taylor SUR
approach. Journal of Applied Econometrics 19: 227-246.
Feenstra RC (2002) Border effect and the gravity equation: Consistent method for
estimation. Scottish Journal of Political Economy 49: 491-506.
Ginsburgh, V., Prieto-Rodriguez, J. (2006), Returns to Foreign Languages of Native
Workers in the EU, mimeo.
Glick, R, Rose AK (2002) Does a Currency Union Affect Trade? The Time-Series
Evidence. European Economic Review 46: 1125–1151.
Kimura F, Lee H-H (2006) The gravity equation in international trade in services.
Review of World Economics 142: 92-121.
Koenker, Roger and Bassett, Gilbert (1978) Regression Quantiles. Econometrica. 46(1),
33–50.
Koenker, Roger and Hallock, Kevin F. (2006) Quantile Regression. Journal of
Economic Perspectives 15 (4), 143–156.
28
Linder S (1961) An essay on trade and transformation, Uppsala: Almqvist and Wiksells.
Linnemann H (1966) An econometric study of international trade flows, Amsterdam:
North Holland.
McCallum J (1995) National borders matter: Canada-U.S. regional trade patterns,
American Economic Review 85: 615-623.
Mátyás L (1997) Proper econometric specification of the gravity model, World
Economy 20: 363-368.
Mátyás L (1998) The gravity model: Some econometric considerations, World
Economy 21: 397-401.
Mélitz, J. (2008), “Language and Foreign Trade,” European Economic Review 52 (4),
667-699.
Rauch, J.E., Trindade, V. (2002), “Ethnic Chinese Networks in International Trade,”
Review of Economics and Statistics 84 (1), 116–130.
Wagner, Joachim (2006) Export Intensity and Plant Characteristics: What Can We
Learn from Quantile Regression?, Review of World Economics
(Weltwirtschaftliches Archiv), 142(1), 195-203.