Embed Size (px)
Citation preview
2011-WP-15
July 2011
The Effects of Perceived and Actual Financial Knowledge on Credit Card Behavior
Sam Allgood and William B. Walstad
Abstract: This study uses a combined measure of financial literacy or financial knowledge that includes both a test score of actual financial knowledge and a self-assessment of overall financial knowledge. The combined measure provides greater understanding about how financial knowledge affects financial behavior. The study uses a large national survey of U.S. adults and households (n=28,146) to investigate how financial knowledge affects typical behaviors related to credit card use. The five behaviors include paying credit card balances on time, carrying over a balance and paying interest on it, making only a minimum payment on a credit card, being charged a late fee, and going over a credit card limit. The results from the probit analysis show that actual financial knowledge and perceived financial knowledge both significantly influence credit card behavior. About the Authors: Sam Allgood is Professor of Economics at the University of Nebraska-Lincoln. He is an associate editor of the Journal of Economic Education. His research focuses include financial literacy and the long-term effects of studying economics at the college-level. He also has numerous publications in the areas of public finance and labor economics. William Walstad is Professor of Economics at the University of Nebraska-Lincoln. He is the editor of the Journal of Economic Education. His research focuses on the teaching and learning of economics and personal finance, testing of economic and financial literacy, and entrepreneurship
Keywords: financial knowledge, financial literacy, credit card behavior.
JEL codes: D12, D14.
The views expressed are those of the individual authors and do not necessarily reflect official positions of Networks
Financial Institute. Any errors or omissions are the responsibility of the authors. Please address questions regarding
content to William Walstad at [email protected]. NFI working papers and other publications are available on NFI’s
website (www.networksfinancialinstitute.org). Click “Thought Leadership” and then “Publications/Papers.”
Working Paper

2
The Effects of Perceived and Actual Financial Knowledgeon Credit Card Behavior
Over the past fifteen years, interest in financial literacy has grown significantly. The
reasons are attributable to substantial changes in the workplace that have placed more
responsibility on workers for financial decisions over such matters as retirement savings and
investments. In addition, the growing complexity of the economy over the past few decades has
required households to make more integrated personal financial decisions regarding credit card
purchases and use, saving for a child’s college education, planning for retirement, paying federal
and state taxes, and managing household budgets. Questions have arisen about whether the
American public is sufficiently knowledgeable and prepared to handle the difficult and complex
financial choices they face on a regular basis. This interest in financial literacy has spawned
extensive research on how to improve the financial capability of the public.
One of the challenges facing this line of research is how to define financial literacy
because there is no standard definition of the concept in the research literature (Remund 2010).
This lack of consensus or agreement on the concept also makes it difficult to develop or
construct measures of financial literacy. As a result, there have been significant differences in the
methods used to assess financial literacy in research and evaluation studies. Most of the
measurement of financial literacy has focused on the cognitive aspects of the concept and what
people know or understand about financial matters because to “be financially literate, individuals
must demonstrate knowledge and skills needed to make choices within a financial marketplace”
(Huston 2010, 309–10). This measurement of financial literacy or financial knowledge is most

3
often conducted using a set of multiple-choice test questions and/or true–false test questions that
are included in a larger survey instrument that asks about general or specific financial matters
and behaviors (e.g., Hilgert, Hogarth, and Beverly 2003; Lusardi and Mitchell 2007; Lusardi,
Mitchell, and Curto 2010).
For this study, we adopt an alternative approach to the measurement of financial literacy
or financial knowledge. To the typical cognitive test measure of multiple-choice and true–false
items, we add an affective dimension that captures individuals’ self-rating of what they think
they know about financial matters. This combination of actual financial knowledge as measured
by correct responses to test questions and perceived financial knowledge as measured by
respondents’ self-assessments provides more robust and nuanced insights about how financial
knowledge affects financial behavior. To demonstrate the value of this measure we use a large
national survey of U.S. adults and households (n=28,146) and investigate how financial
knowledge affects typical behaviors related to credit card use. The five credit card behaviors we
study include paying credit card balances on time, carrying over a balance and paying interest on
it, making only a minimum payment on a credit card, being charged a late fee, and going over a
credit card limit. The results suggest that financial knowledge as measured by correct responses
to test questions are more useful in influencing credit card behaviors when combined with
information about how individuals self-assess their financial knowledge. For example, those
individuals with a high level of actual financial knowledge and a high level of perceived
financial knowledge report better credit card practices than those individuals with a high level of
actual financial knowledge, but a low level of perceived financial knowledge.
4
Data
The data for this study came from a National Financial Capability Study that was commissioned
by the Financial Industry Regulatory Authority (FINRA) Investor Education Foundation and
conducted in consultation with the U.S. Treasury Department and the President’s Advisory
Council on Financial Literacy. The main purpose of the study was to “assess and establish a
baseline measure of the financial capability of U.S. adults.” This goal was achieved through the
administration of surveys to three different samples: (1) a national sample of 1,500 U.S. adults;
(2) a state-by-state analysis of more than 28,000 respondents; and, (3) a survey of 800 military
personnel and spouses. The questionnaire links the three studies because most of the basic
questions are the same for each sample. The FINRA Foundation website provides a copy of each
questionnaire, a brief reporting of the basic survey findings and methods, and a preliminary
SPSS data file for each sample that can be used by researchers for further analysis.1
Each dataset and related information was publically released at different times: December
2009 for the national sample; October 2010 for the military sample; and December 2010 for the
state-by-state sample. The FINRA dataset used for this research was the most recently released
one from the state-by-state survey. The data for this sample were collected through an online
survey of 28,146 respondents, with approximately 500 to 550 adults, 18 years of age or older,
interviewed in each of the 50 states and also 500 to 550 adults interviewed in the District of
Columbia. The state-by-state survey was conducted from June through October 2009.
1www.finrafoundation.org/programs/capability/index.htm and www.usfinancialcapability.org.

5
This study used the state-by-state dataset but applied weights provided with the dataset to
create a large national sample of 28,146 U.S. adults for the analysis. This work was
accomplished by weighting the state-by-state data to match U.S. Census distributions using the
2008 American Community Survey data and several demographic variables at different
aggregation levels—state, regional, national. Within each state and the District of Columbia, data
were weighted to match U.S. Census distributions by age and gender categories, race and
ethnicity categories, and education level. For each U.S. Census region, data were weighted based
on U.S. Census distributions to match variables on age by gender, race and ethnicity, education,
and state. At the national level, the data were weighted to match national Census distributions
based on age by gender, race and ethnicity, education, and census region.
Survey Contents
An extensive set of survey questions was administered to each adult. The survey began with a
number of demographic questions to obtain information about the respondents. The set included
questions about age, gender, race and ethnicity, preferred language (English or Spanish), highest
education achieved, marital status, living arrangements, income, employment; spouse’s
employment status, number of children, who in the household is most knowledgeable about
saving, investing, and debt, and who in the household handles the chore of bill paying.
The bulk of the survey questions focused on eight financial topics. The first section
covered financial orientation such as satisfaction with one’s current personal financial condition,
willingness to take risks, household spending relative to income, availability of a “rainy day”
fund, saving for children’s college education, saving for retirement, whether a large drop in
income was experienced in the past year, and accessing and knowing credit scores. The second

6
section turned to the use of financial professionals related to debt counseling, saving and
investment, taking out a loan or mortgage, insurance purchases, and tax planning. The third
section was devoted primarily to banking and financial matters such as checking and savings
accounts, use of debit cards, certificate of deposit purchases, bill paying, and the amount of
investments in financial securities (e.g., stocks, bond, and mutual funds). The fourth section
focused on retirement accounts and pensions. One part of this section was devoted to
respondents currently employed and it asked about such topics as the number and amount of the
accounts, account source (respondent or spouse/partner), characteristics of the investments in the
accounts, and knowledge of Social Security benefits. The other part of this section was devoted
to those respondents who had already retired and asked about the sources and uses of financial
resources for retirement. The fifth section primarily asked questions about home ownership such
as the amount of a mortgage, monthly mortgage payments, and any experiences with foreclosure.
The sixth section moved to credit cards and included questions asking about the number of cards,
annual percentage rate for the cards, typical payment pattern, and amount owned. The seventh
section addressed subjects related to consumer loans such as auto loans, payday lending, pawn
shop use, rent-to-own agreements, and personal bankruptcy. The eighth section concluded the
interview on financial topics with questions about the insurance coverage pertaining to health,
life, and property, and autos.
One of the unique aspects of the survey was the final group of questions that was
designed to probe the financial knowledge of the respondents. One question on the survey asked
“On a scale from 1 to 7, where 1 means very low and 7 means very high, how would you assess
your overall financial knowledge?” The purpose of this question was to capture the self-rating or

7
perception of each respondent about their financial knowledge. Those respondents with higher
self-ratings of their financial knowledge would likely give themselves higher scores whereas
those respondents with lower self-rating of their financial knowledge would give themselves
lower scores on the perception scale.
In addition, the survey included five knowledge questions that tested understanding of
five financial concepts—compound interest, inflation effects on money, the relationship between
bond prices and the interest rate, interest payments differences on shorter and longer mortgages,
and stock diversification and risk. Three of the five questions were multiple-choice questions and
the other two items were true-or-false questions. In addition to selecting one of the stated
answers, the respondent could reply “don’t know” or refuse to answer a question. The five
multiple-choice and/or true/false items questions are listed below with the correct answers noted
by an asterisk.
Question 1: Suppose you had $100 in a savings account and the interest rate was 2% per
year. After 5 years how much do you think you would have in the account if you left the
money to grow: (a) more than $102*; (b) Exactly $102; (c) less than $102.
Question 2: Imagine that the interest rate on your savings account was 1% per year and
inflation was 2% per year. After 1 year, how much would you be able to buy with the
money in the account? (a) more than today; (b) exactly the same; (c) less than today*.
Question 3: If interest rates rise, what will typically happen to bond prices? (a) they will
rise; (b) they will fall*; (c) they will remain the same; (d) there is no relationship
between bond prices and the interest rate..
8
Question 4: A 15-year mortgage typically requires higher monthly payments than a 30-
year mortgage, but the total interest paid over the life of the loan will be less. (a) true*;
(b) false.
Question 5: Buying a single company’s stock usually provides a safer return than a stock
mutual fund. (a) true; (b) false*.
There has been extensive reporting on the results from responses to these questions based
on work with several national surveys. Questions 1, 2, and 5 were used in a 2004 Health and
Retirement Survey and in Wave 11 of a 2007–8 National Longitudinal Survey of Youth (Lusardi
and Mitchell 2008; Lusardi, Mitchell, and Curto 2010). Questions 1, 2, 4, and 5 have been used
in an American Life Panel survey (see Lusardi and Mitchell 2009). A version of question 5 has
been used in a national Survey of Consumers conducted by the University of Michigan in 2001
(Hilgert, Hogarth, and Beverly 2003). Although the questions are relatively simple, they have
been found to be challenging for many adults, and such items have served as valuable indictors
of financial literacy or financial knowledge in the above cited studies
Descriptive Statistics
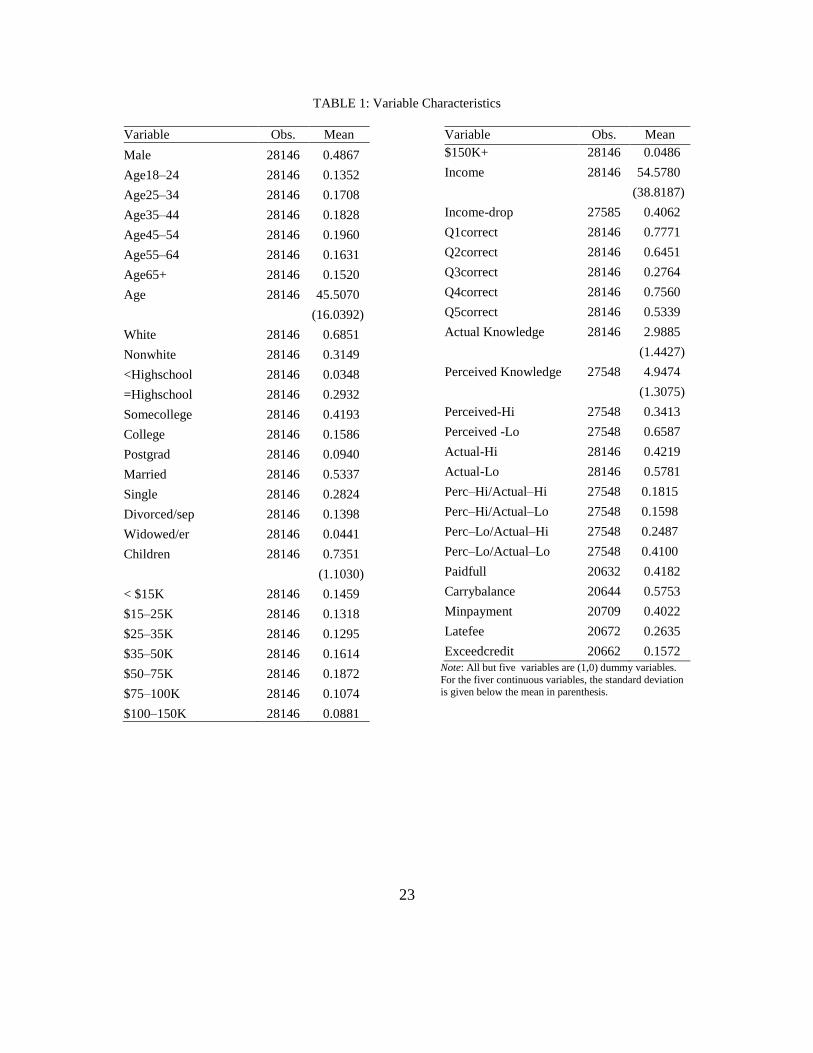
Table 1 reports the number of observations and means for the variables used from the
state-by-state data set for this study. All but five of the variables are dummy variables, and they
are coded as 1 for the listed characteristic or otherwise it is coded as 0. For the five continuous
variables the standard deviation is given, in parenthesis, below the mean. The dummy variable
list includes the basic demographic variables such as gender, age within six categories (18–24,
25–34, 35–44, 45–54, 55–64, and 65+), race (white, nonwhite), highest education level attained
(less than high school, high school graduate only, some college, college graduate, postgraduate),
9
marital status (married, single, divorced or separated, widowed or widower), and income within
six categories (<$15K, $15–25K, $25–35K, $35–50K, $50–75K, $75–100K, $100–150K, and
>$150K).
Several of the demographic variables were transformed for the analysis. The categorical
variables for age were transformed into a continuous variable by setting age at the mid-point of
each range and at 70 for those respondents indicating their age was over 65. Income was
transformed into a continuous variable using similar procedures. For those individuals indicating
that income was $15,000 or less, income was set at $15,000. The other categorical variables were
set to the mid-point of the income range (in thousands), and income of $150,000 or more was set
at $150,000. In addition, a dummy variable for a “large income drop” was created based on the
yes response the question: “In the past 12 months, have you or your household experienced a
large drop in income which you did not expect?” The average person in our sample has 1 child,
is female, middle-aged, attended some college, married, and with income of around $50,000.
Table 1 also shows both the average proportion of correct responses to each financial
knowledge question and the average number of correct answers for all five questions (Actual
Knowledge). For all five questions, the average was about 3 correct answers (59.8 percent
correct), but it ranged from a high of 77.7 percent correct for question 1 to a low of 27.6 percent
correct for question 3. The table also shows the average perception of financial knowledge
(Perceived Knowledge), where respondents rated their overall financial knowledge on a seven-
point scale, with a seven being the highest rating. The average self-assessment was about a five.
We investigated the predictive power of differences in perceived knowledge across
individuals with approximately the same actual knowledge. To this end, we categorized
10
individuals as having high (or low) actual knowledge and high (or low) perceived knowledge.
Respondents had high actual knowledge (Actual-Hi) if their overall score on the five questions
was above the mean; otherwise they were classified as low actual knowledge (Actual-Lo).
Slightly over 40 percent of the respondents were in the high knowledge group. Perceived
knowledge also was transformed into two categorical variables. If respondents gave themselves
an overall rating for their financial knowledge that was above the mean (a six or a seven), they
were placed in the high perceived knowledge category (Perceived-Hi); otherwise, they were
included in the low perceived knowledge category (Perceived-Lo). About a third of the
respondents fell into the high perceived knowledge group.
A third set of categorical variables was constructed by forming all possible knowledge
combinations with the percentage in each group given in parentheses: (1) high perceived
financial knowledge and high actual financial knowledge (18.2%); (2) low perceived financial
knowledge and high actual financial knowledge (24.9%); (3) high perceived financial knowledge
and low actual financial knowledge (16%); and, (4) low perceived financial knowledge and low
financial actual knowledge (41%).2 With these four variables, we can now compare the behavior
of the respondents based on the different combination of their perceived and actual knowledge.
As previously stated, the survey contained detailed information on self-reported financial
behaviors in eight areas. For this preliminary analysis, and for the sake of parsimony, we limited
the investigation to the effect of financial knowledge on only one of the financial topics included
2 It is possible that our measures of actual and perceived financial knowledge are simply measuring the same
characteristic, but the pair-wise correlation is only 0.24. While those respondents with high test scores often have
higher perceived knowledge, there is substantial variation. For example, about 3.5 percent of the respondents rated
themselves as a six or seven for perceived knowledge although they had a score of only 0 or 1 for actual knowledge.
11
in the survey. We selected credit card behavior as the prime topic to investigate because there is
widespread use of credit cards by consumers and their use provides key insights into behavior
related to regular consumer spending. The other financial matters in the survey involved
financial decisions that tend to be more focused on particular products (insurance), involved
lumpy or discrete purchases (homes or autos), or were more diverse in characteristics (banking
and investments), so they were considered to be less suitable for this preliminary study.
The credit card variables were constructed as dummy variables (1=yes) from a survey
question that asked about five credit card situations. What follows are the survey items with the
percentage of respondents replying yes for each in parentheses: “In the past 12 months, which of
the following describes your experience with credit cards?”: (1) I always paid my credit cards in
full (41.8%); (2) In some months, I carried over a balance and was charged interest (57.5%); (3)
In some months, I paid the minimum payment only (40.2%); (4) In some months, I was charged
a late fee for late payment (26.4%); and, (5) In some months, I was charged an over the limit fee
for exceeding my credit line (15.7%).
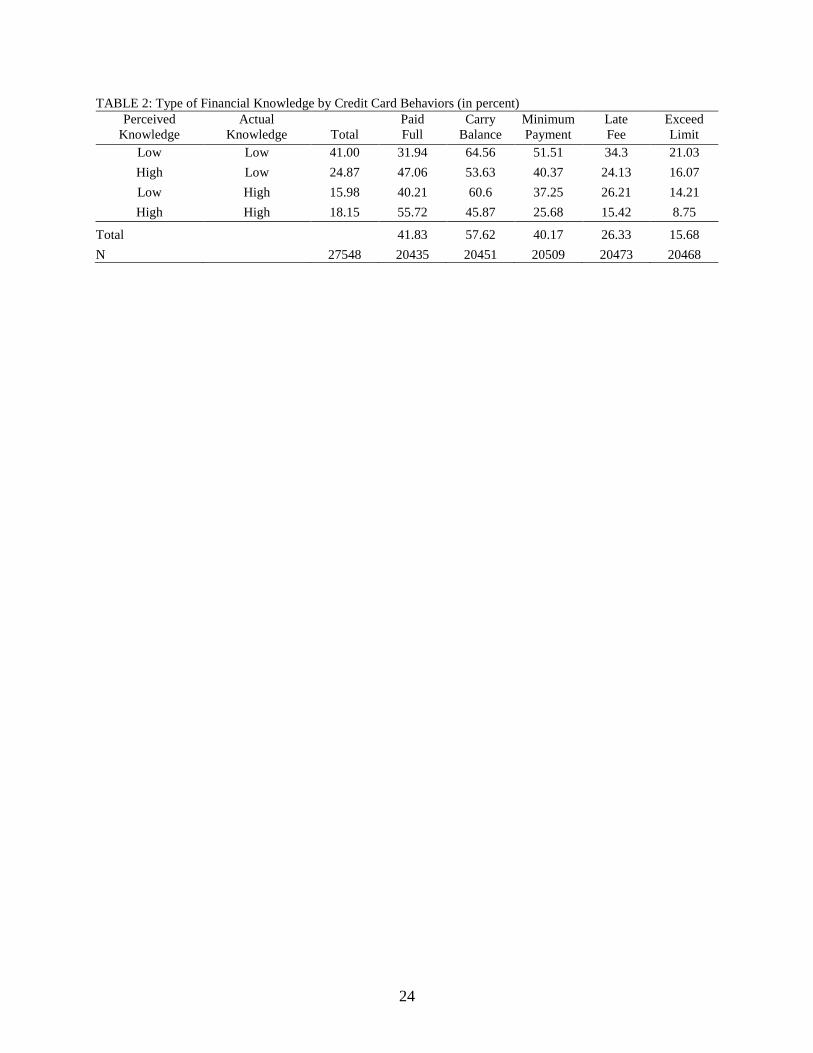
Table 2 reports the total percentage of respondents in each of the four knowledge
categories and states the average percentage responses for each of the five credit card behaviors
as described in previous paragraphs. In addition, it provides a cross-tabulation of the four
knowledge types by the five credit card behaviors. The percentage for one knowledge group for
a credit card behavior can be compared against the average percentage. For example, 41.8
percent of all respondents stated that they paid their credit card in full, but for the high-high
group, the percentage is 55.7 percent, 13.9 percent above the mean. Also, one knowledge group
percentage can be compared against another. The most telling contrast occurs if we can compare

12
the low–low group with the high–high group because the high–high group reports credit card
behaviors associated with better money management in all five situations. The high–high group
compared with the low–low group reported more payment of the credit card bills in full (by 23.8
percentage points), less carrying of a credit card balance (by 18.7 percentage points), less use of
a minimum payment (by 25.8 percentage points), less payment of late fees (by 18.9 percentage
points), and less exceeding of the credit card limit (12.3 percentage points).
A more insightful comparison is found by comparing high perceived and high actual
knowledge group with the low perceived and high actual knowledge group. In this case, we are
holding actual knowledge constant,3 and allowing for variation in perceived knowledge. The
high perceived and high actual knowledge respondents are 15.5 percentage points more likely to
pay their credit card bills in full relative to those with low perceived and high actual knowledge.
The high perceived and high actual knowledge group is less likely to carry a balance on their
credit card by almost 15 percentage points than the low perceived and high actual knowledge
groups. We find similar results for the comparisons of these two groups on the other three credit
card behaviors. In addition, we draw similar conclusions from comparing the high perceived and
low actual knowledge respondents with the low perceived and low actual knowledge
respondents. The pattern and magnitude of the percentage point differences are almost identical
to our previous two-group comparisons. In all cases, respondents with high perceived knowledge
3 To support our assertion that these comparisons hold actual knowledge constant, we computed the mean of actual
knowledge for each of the four categories. The mean of actual knowledge for those in the low–low category is 1.92
versus 2.14 for those in the high–low category, a difference of only 0.22. The mean of actual knowledge for those in
the high–high category is 4.45 versus 4.30 for those in the low–high category, a difference of only 0.25.

13
have “better” credit card behavior than those with low perceived knowledge when holding actual
knowledge fixed.
Our results are not intended to suggest that actual knowledge does not matter. If we hold
perceived knowledge at either the low or high level and allow actual knowledge to change from
low to high, we find that those with high actual knowledge also have credit card behaviors that
are less costly and more consistent with prudent financial management. For example, high
perceived and high actual respondents are 8.7 percentage points more likely than high perceived
and low actual respondents to pay their credit cards in full. What the data in Table 2 indicate is
that actual knowledge and perceived knowledge both have roles in explaining credit card
behavior.
Probit Model and Findings
Table 2 is only suggestive of how perceived knowledge is related to credit card behavior,
but the cross-tabulations do not control for other important predictors. Accordingly, a probit
model was specified and estimated to investigate the five credit card behaviors. The set of
control variables in the model included the four types of financial knowledge variables with the
low perceived financial knowledge and low actual financial knowledge being the omitted
variable. The other variables included in the model were a set of demographic variables to
control for such factors as gender (1=male); age and age-squared, race (1=white); education level
(< high school, high school graduate only, some college, college graduate only, and
postgraduate, with college graduate only as the omitted term), marital status (single, married,
divorced or separated, widowed or widower, with married as the omitted term), number of

14
dependent children, annual income and income-squared, and whether a respondent experienced a
large drop in income (1=yes).
Probit models are nonlinear regressions where coefficients are fitted with maximum
likelihood. Coefficients are fitted to the likelihood function
( ) ( )
where is the standard normal distribution, is a vector of explanatory variables, and is
vector coefficients to be estimated. The model is nonlinear in meaning that the probit
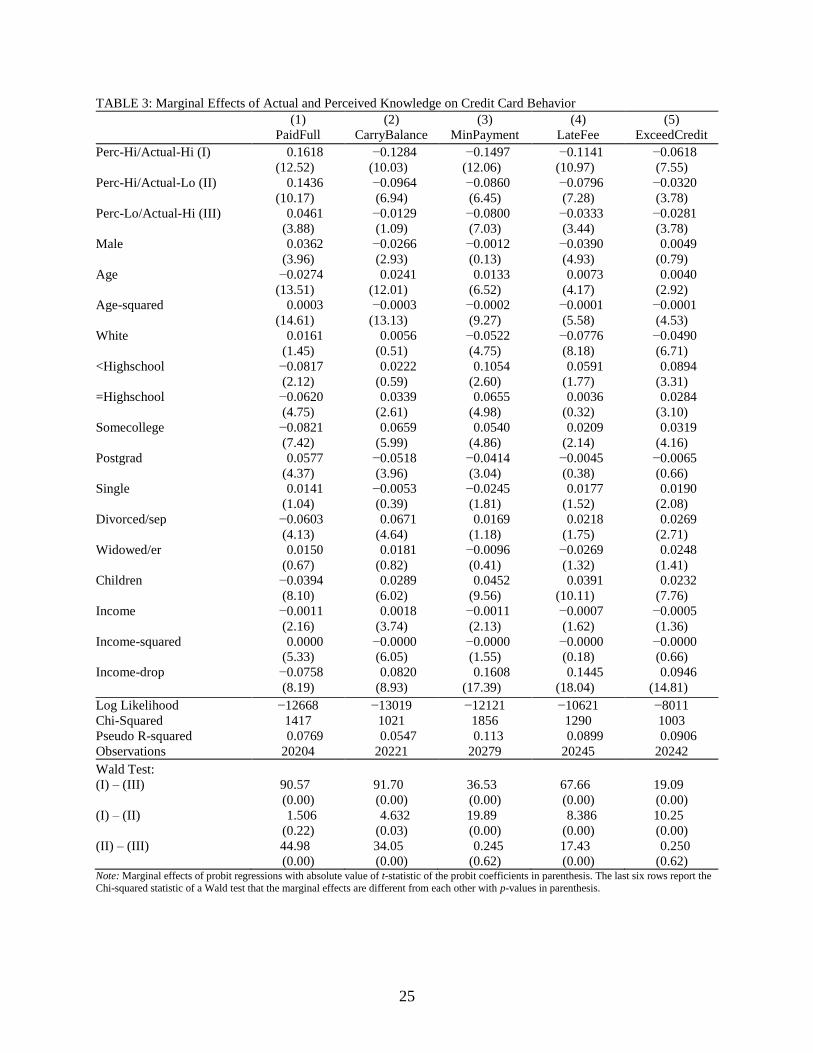
coefficients are difficult to interpret so the marginal effects are often reported instead. Table 3
shows the marginal effects of variables on the dependent variables for the five credit card
behaviors. The marginal effect for each dummy regressor is the change in the likelihood of the
dependent variable equaling one computed for a discrete change in the dummy variable from
zero to one when evaluating all other variables at their mean. For continuous variables, the
marginal effect is obtained by taking the partial derivative of the likelihood function with respect
to a given variable and evaluating it at the mean. The t-values for the probit coefficients are
reported, in parentheses, below the marginal effects. Given our sample of over 20,000
respondents, it is not surprising that most of our key variables are statistically different from
zero.4 Therefore, we focus our discussion of the results on the magnitude of the marginal effects
because it gives more relevant information about the influence of a regressor on a behavioral
response.
4 That said, we ran our regression repeatedly using a randomly selected 20 percent of the sample and the sign and
significance of the probit coefficients were largely unaffected.

15
Aside from the marginal effect of income-drop (and perhaps age), the variables for
perceived and actual knowledge have the largest marginal effect on the probability that a person
engages in each behavior.5 Respondents with high perceived and high actual financial knowledge
are 16 percent more likely to have always paid their credit card balance in full each month than
were respondents in the omitted category, low perceived knowledge and low actual financial
knowledge. The high–high group also was 13 percent less likely to carry a credit balance in some
months, 15 percent less likely to make only a minimum payment in some months, 11 percent less
likely to be charged a late fee for a late payment, and 6 percent less likely to be charged an over
the limit fee for exceeding their credit limit in some months. Although the marginal effect in the
ExceedCredit regression is smaller, the averages for each of the dependent variables should be
remembered: over four in ten (42 percent) of respondents reported that they paid their credit card
5 We also investigate the issue of reverse causality as a possible explanation of the findings. Reverse
causality would imply that self-perceptions of financial knowledge arise from financial outcomes or
behaviors, and not vice versa. That is, those individuals with “good” financial outcomes or behaviors
would self-assess their overall financial knowledge as being high while those individuals with “poor”
financial outcomes or behaviors would self-assess their overall financial knowledge as being low. We
offer three reasons why reverse causality is not a problem. First, several studies of self-assessment of
financial literacy and financial outcomes using alternative methods find that there is no support for
reverse causality (e.g., Courchane, Gailey, and Zorn, 2008; van Rooij, Lusardi, and Alessie, 2011).
Second, in our data set, we find no consistent statistical relationship across multiple financial outcomes.
For example, those individuals who have poor credit card outcomes may have good investment outcomes
regardless of their perceptions of financial knowledge. Such inconsistencies across multiple financial
outcomes undermine the case that financial outcomes create high or low perceptions of financial
knowledge. Third, the reverse causality argument requires making a normative judgment about financial
outcomes or behaviors. Whether a particular financial outcome or behavior is good or poor ultimately
depends on the individual circumstances, even if there is general consensus about what is a good financial
outcome or practice. If the classification of financial outcomes as good or poor is not reliable across
individuals, then it is not clear how they produce high or low self-ratings of financial knowledge.

16
balance in full each month (see Table 2), but only 15 percent of the respondents stated that they
exceeded their credit card limit. The sample size for those exceeding the credit card limit is
relatively small, so the marginal effects are likely to be smaller.
Of course, the marginal effect of high perceived and high actual knowledge allows both
perceived and actual knowledge to vary because the omitted group is low–low. Conversely, the
coefficient on Perceived-Hi–Actual-Lo holds actual knowledge at low while allowing perceived
knowledge to change from low to high. Those in the high perceived and low actual knowledge
group are 14 percent more likely to pay their credit card in full relative to those in the low
perceived and low actual knowledge group, and they are almost 10 percent less likely to carry a
balance. The results are similar for the other three regressions. We can also see the effects of
perceived knowledge while holding actual knowledge constant by comparing the marginal
effects of Perceived-Hi–Actual-Hi with Perceived-Lo–Actual-Hi. The marginal effect of high
perceived and high actual knowledge is about 11.5 percentage points larger than for the low
perceived and high actual knowledge group on the paid in full variable and 11.5 percentage
points smaller on the carry-a-balance variable. The pattern of differences is similar for the
remaining three regressions. The bottom of the table shows the results of a Wald test that the
coefficients are equal. For High–High and Lo–High [the row labeled (I)–(III)], they are
statistically different for each regressions.
The effects of the demographic variables across the equations are less consistent than the
effects of financial knowledge, at least relative to the first two groups (high perceived and high
actual knowledge; high perceived and low actual knowledge). For example, males relative to
females are 4 percent more likely to pay their credit card bills in full, 3 percent less likely to
17
carry credit card balances, and 4 percent less likely to pay a late fee. In the other two situations
(minimum balance and exceeding credit), the male–female differences are insignificant.
Inconsistency across equations also is found when comparing whites with nonwhites. The
marginal effects are only statistically significant in three of the credit card situations (minimum
payment, late fee, and exceeding credit limit).
Age is interpreted differently than the variables discussed until this point because it is
continuous and it is entered as a quadratic. A person one year older than the average of the
sample (45.5) is 2.71 percent (−.00274 + 0.0003) less likely to have paid her or his balance in
full. Of course, a person 5 years older than the mean age is almost 13 percent [(−.00274*5) +
(0.0003)*(52)] less likely to pay in full. Thus, the age effects are substantial for paid-in-full and
carry-a-balance, but less so for the other three outcomes.
Education level appears to influence credit card behavior in some predictable ways, but
not always. The omitted group for this variable is a college graduate. Relative to this group,
those respondents with less education (less than high school; high school graduate only; and
some college) were significantly less likely by 6 to 8 percent to have paid credit card bills in full,
whereas those respondents with some postgraduate education were significantly more likely by 6
percent to have paid bills in full. In addition, those respondents with less education relative to the
college graduate were significantly more likely by 5 to 10 percent to sometimes make only a
minimum payment on their credit card bills, but those respondents with some postgraduate
education were significantly less likely by 5 percent to have only made minimum payments. The
other three credit card situations were less consistent. For example, there was no difference
between those with only a college education and those with postgraduate education related to late

18
fee or exceeding credit limits. There also was no statistically significant difference between those
who are college graduates and those with less than a high school education related to carrying a
credit card balance.
The marital status of the respondents (single, divorced or separated, and widowed(er),
compared with the omitted married group) appears to be relatively inconsequential in marginal
effects for the most part. The difference between single and married respondents is 2 percent or
less across the equations and the differences are barely statistically significant in one case
(exceed credit limit). There is no statistically significant difference between the married and
widowed(er) groups. As might be expected, those who are divorced or separated tend to have
more financial problems with credit cards relative to the married group, most likely because of
loss of income or changing circumstances. The divorced or separated group was 6 percent less
likely to pay credit card bills in full, 7 percent more likely to carry a credit card balance in some
months, and 3 percent more likely to exceed their credit limits. Nevertheless, the pattern is not
consistent because there are no significant differences between the two groups related to
minimum payments or late fees.
One of the more interesting and most relevant demographic findings related to credit card
behavior concerns having children who are financially dependent on the adult respondent.
Raising children is costly and it can have adverse effects on credit card behavior, even after
controlling for all other demographics and knowledge variables. Adults with one dependent child
were 4 percent less likely to have always paid credit card balances in full; 3 percent more likely
to carry a credit card balance in some months; 4.5 percent more likely to only pay the minimum
balance on credit cards in some months; 4 percent more likely to pay a late fee on a credit card in
19
some months; and 2 percent more likely to pay a fee for exceeding the credit card limit in some
months. Of course, the marginal effect for a person with two children is twice those just listed.
The other major demographic influence comes from income, but not in the traditional
way it is considered, which is based on the approximate annual income. The results for the
income or income-squared variables were statistically significant in only two or three of the five
credit card situations and there is no clear pattern in the effect of annual income on credit card
behavior. The questionnaire, however, also asked whether “you or your household experienced a
large drop in income which you did not expect?” The response to this question is quite relevant
for evaluating credit card behavior because the interviewing was conducted from June to October
2009, during the recent deep recession. Over four in ten respondents (41 percent) did report such
a drop in their income and this factor had a statistically significant and meaningful effect on
credit card behavior. As might be expected, those reporting a large income drop were less likely
to pay their credit card balances in full (by 7 percent), were more likely to carry a credit card
balance (8 percent), were more likely to only make the minimum payment (16 percent), were
more likely to pay a late fee (15 percent), and were more likely to pay a fee for exceeding their
credit limit (9 percent).
Normalized Knowledge
Instead of using dummy variables to control for financial knowledge in the probit estimation, the
continuous variables from which the dummy variables were created also could be used as the
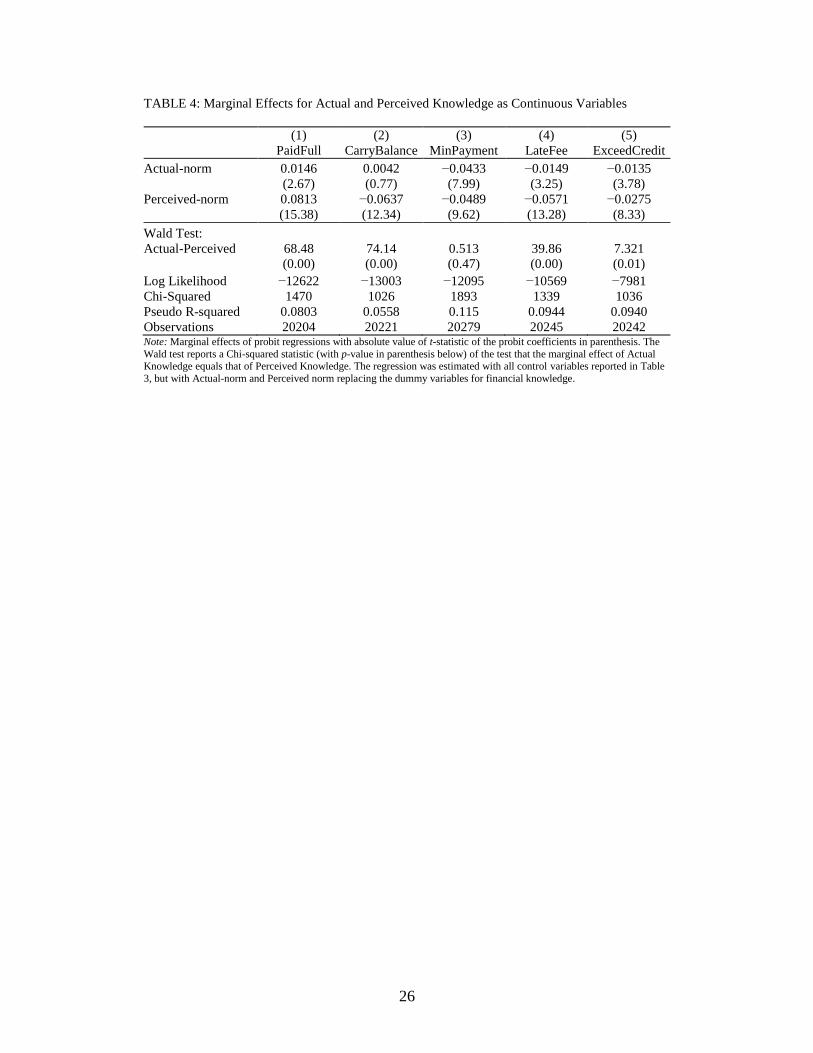
explanatory knowledge variables. Table 4 reports the estimated marginal effects of the probit
regressions using continuous variables for perceived financial knowledge and actual financial
knowledge. The regressions include all of the other explanatory variables reported in Table 3, but
20
these variables are not reported in Table 4 because the marginal effects have not changed. The
marginal effect of the variable perceived financial knowledge would be difficult to interpret
because it is not obvious how to interpret a one-unit change in this variable. To provide a better
context for interpreting this variable we normalize perceived financial knowledge to have a mean
of zero and a standard deviation of one. A person with a value of 0 for perceived knowledge-
norm gave a response equal to the mean, and a person with a value of 1 gave a response that is 1
standard deviation above the mean. While actual financial knowledge is not as difficult to
interpret, we also normalize it to ease the discussion of the regression results.6
The results of Table 4 show that both actual and perceived financial knowledge are
statistically significant predictors of credit card behavior, except that actual financial knowledge
is not statistically significant in the regression for carrying a balance. Perceived financial
knowledge, however, is a stronger predictor of credit card behavior. A person whose actual
financial knowledge is one standard deviation above the mean of the sample is 1.5 percent more
likely to have paid their credit card in full, but a person whose perceived financial knowledge is
one deviation above the mean is 8 percent more likely to have paid their credit cards in full. We
performed a Wald test that the marginal effects were equal. The difference between actual and
perceived financial knowledge is statistically different in all regressions except that for minimum
payment. In addition, the magnitude of the marginal effects and their differences are small in the
regression for exceed-credit-limit. For the other three regressions, however, the difference
between the marginal effects is sizeable and in each case perceived financial knowledge has a
6 Normalizing the variables does not alter their sign or statistical significance.

21
stronger relationship with credit card behaviors that are associated with better credit card use and
more careful money management.7
Conclusion
We began this study with the expectation that a person’s self-assessed perception of financial
knowledge may be as important for predicting personal financial behavior as is their actual
knowledge. We find ample evidence of this for credit card behavior. In fact, we find evidence
that perceived financial knowledge is a stronger predictor of good practices in credit card
management than is actual financial knowledge. For example, a person with high perceived
financial knowledge and high actual financial knowledge is almost 12 percentage points more
likely to fully pay their credit card balance than a person with low perceived financial knowledge
and high actual financial knowledge.
We recognize that credit card behavior is only one area of a person’s financial decision-
making. To validate the knowledge effects we report in this study, we need to show that
perceived financial knowledge is a predictor of other financial behaviors. In fact, we have
already begun to explore how actual and perceived financial knowledge relate to, for example,
investment behavior, retirement planning, and decisions regarding mortgages. Preliminary results
suggest that the predictive value of perceived financial knowledge carries over to other personal
financial behavior.
7 We also explored the interaction between normalized actual and perceived financial knowledge by including an
interaction term in each of the Table 4 probit regressions. The interaction effects were mixed and minimal. They
were not statistically significant in the paid-in-full and exceed-credit regressions. Although they were statistically
significant and in the expected negative direction in the carrying-a-balance, minimum-payment, and late-fee
regressions, the interaction effects were minor (1 to 2 percent) and the main effects of perceived and actual financial
knowledge changed little from those reported in Table 4.
22
REFERENCES
Courchane, Marsha, Adam Gailey, and Peter Zorn. 2008. Consumer credit literacy: What price
perception? Journal of Economics and Business 60: 125-138.
Hilgert, Marianne A., Jeanne M. Hogarth, and Sondra G. Beverly. 2003. Household financial
management: The connection between knowledge and behavior. Federal Reserve Bulletin
(July), 309–22. Washington, DC: Federal Reserve Board of Governors.
Huston, Sandra J. 2010. Measuring financial literacy. Journal of Consumer Affairs 44(2): 296–
316.
Lusardi, Annamaria, and Olivia S. Mitchell. 2007. Baby Boomer retirement security: The roles
of planning, financial literacy, and housing wealth. Journal of Monetary Economics 54: 205–
24.
———. 2008. Planning and financial literacy: How do women fare? American Economic
Review: Papers and Proceedings 98(2): 413–17.
———. 2009. How ordinary consumers make complex economic decisions: Financial literacy
and retirement readiness. National Bureau of Economic Research (NBER) working paper no.
15350. Cambridge, MA: NBER. http://www.nber.org/papers/w15350.
Lusardi, Annamaria, Olivia S. Mitchell, and Vilsa Curto. 2010. Financial literacy among the
young. Journal of Consumer Affairs 44(2): 358–80.
Remund, David L. 2010. Financial literacy explicated: The case for a clearer definition in an
increasingly complex economy. Journal of Consumer Affairs 44(2): 276–95.
van Rooij, Maarten, Annamaria Lusardi, and Rob Alessie. 2011. Financial literacy and stock
market participation. Journal of Financial Economics 101: 449-472.
23
TABLE 1: Variable Characteristics
Variable Obs. Mean
Male 28146 0.4867
Age18–24 28146 0.1352
Age25–34 28146 0.1708
Age35–44 28146 0.1828
Age45–54 28146 0.1960
Age55–64 28146 0.1631
Age65+ 28146 0.1520
Age 28146 45.5070
(16.0392)
White 28146 0.6851
Nonwhite 28146 0.3149
<Highschool 28146 0.0348
=Highschool 28146 0.2932
Somecollege 28146 0.4193
College 28146 0.1586
Postgrad 28146 0.0940
Married 28146 0.5337
Single 28146 0.2824
Divorced/sep 28146 0.1398
Widowed/er 28146 0.0441
Children 28146 0.7351
(1.1030)
< $15K 28146 0.1459
$15–25K 28146 0.1318
$25–35K 28146 0.1295
$35–50K 28146 0.1614
$50–75K 28146 0.1872
$75–100K 28146 0.1074
$100–150K 28146 0.0881
Variable Obs. Mean
$150K+ 28146 0.0486
Income 28146 54.5780
(38.8187)
Income-drop 27585 0.4062
Q1correct 28146 0.7771
Q2correct 28146 0.6451
Q3correct 28146 0.2764
Q4correct 28146 0.7560
Q5correct 28146 0.5339
Actual Knowledge 28146 2.9885
(1.4427)
Perceived Knowledge 27548 4.9474
(1.3075)
Perceived-Hi 27548 0.3413
Perceived -Lo 27548 0.6587
Actual-Hi 28146 0.4219
Actual-Lo 28146 0.5781
Perc–Hi/Actual–Hi 27548 0.1815
Perc–Hi/Actual–Lo 27548 0.1598
Perc–Lo/Actual–Hi 27548 0.2487
Perc–Lo/Actual–Lo 27548 0.4100
Paidfull 20632 0.4182
Carrybalance 20644 0.5753
Minpayment 20709 0.4022
Latefee 20672 0.2635
Exceedcredit 20662 0.1572
Note: All but five variables are (1,0) dummy variables.
For the fiver continuous variables, the standard deviation is given below the mean in parenthesis.
24
TABLE 2: Type of Financial Knowledge by Credit Card Behaviors (in percent)
Perceived
Knowledge
Actual
Knowledge Total
Paid
Full
Carry
Balance
Minimum
Payment
Late
Fee
Exceed
Limit
Low Low 41.00 31.94 64.56 51.51 34.3 21.03
High Low 24.87 47.06 53.63 40.37 24.13 16.07
Low High 15.98 40.21 60.6 37.25 26.21 14.21
High High 18.15 55.72 45.87 25.68 15.42 8.75
Total
41.83 57.62 40.17 26.33 15.68
N
27548 20435 20451 20509 20473 20468
25
TABLE 3: Marginal Effects of Actual and Perceived Knowledge on Credit Card Behavior
(1)
PaidFull
(2)
CarryBalance
(3)
MinPayment
(4)
LateFee
(5)
ExceedCredit
Perc-Hi/Actual-Hi (I) 0.1618 −0.1284 −0.1497 −0.1141 −0.0618
(12.52) (10.03) (12.06) (10.97) (7.55)
Perc-Hi/Actual-Lo (II) 0.1436 −0.0964 −0.0860 −0.0796 −0.0320
(10.17) (6.94) (6.45) (7.28) (3.78)
Perc-Lo/Actual-Hi (III) 0.0461 −0.0129 −0.0800 −0.0333 −0.0281
(3.88) (1.09) (7.03) (3.44) (3.78)
Male 0.0362 −0.0266 −0.0012 −0.0390 0.0049
(3.96) (2.93) (0.13) (4.93) (0.79)
Age −0.0274 0.0241 0.0133 0.0073 0.0040
(13.51) (12.01) (6.52) (4.17) (2.92)
Age-squared 0.0003 −0.0003 −0.0002 −0.0001 −0.0001
(14.61) (13.13) (9.27) (5.58) (4.53)
White 0.0161 0.0056 −0.0522 −0.0776 −0.0490
(1.45) (0.51) (4.75) (8.18) (6.71)
<Highschool −0.0817 0.0222 0.1054 0.0591 0.0894
(2.12) (0.59) (2.60) (1.77) (3.31)
=Highschool −0.0620 0.0339 0.0655 0.0036 0.0284
(4.75) (2.61) (4.98) (0.32) (3.10)
Somecollege −0.0821 0.0659 0.0540 0.0209 0.0319
(7.42) (5.99) (4.86) (2.14) (4.16)
Postgrad 0.0577 −0.0518 −0.0414 −0.0045 −0.0065
(4.37) (3.96) (3.04) (0.38) (0.66)
Single 0.0141 −0.0053 −0.0245 0.0177 0.0190
(1.04) (0.39) (1.81) (1.52) (2.08)
Divorced/sep −0.0603 0.0671 0.0169 0.0218 0.0269
(4.13) (4.64) (1.18) (1.75) (2.71)
Widowed/er 0.0150 0.0181 −0.0096 −0.0269 0.0248
(0.67) (0.82) (0.41) (1.32) (1.41)
Children −0.0394 0.0289 0.0452 0.0391 0.0232
(8.10) (6.02) (9.56) (10.11) (7.76)
Income −0.0011 0.0018 −0.0011 −0.0007 −0.0005
(2.16) (3.74) (2.13) (1.62) (1.36)
Income-squared 0.0000 −0.0000 −0.0000 −0.0000 −0.0000
(5.33) (6.05) (1.55) (0.18) (0.66)
Income-drop −0.0758 0.0820 0.1608 0.1445 0.0946
(8.19) (8.93) (17.39) (18.04) (14.81)
Log Likelihood −12668 −13019 −12121 −10621 −8011
Chi-Squared 1417 1021 1856 1290 1003
Pseudo R-squared 0.0769 0.0547 0.113 0.0899 0.0906
Observations 20204 20221 20279 20245 20242
Wald Test:
(I) – (III) 90.57 91.70 36.53 67.66 19.09
(0.00) (0.00) (0.00) (0.00) (0.00)
(I) – (II) 1.506 4.632 19.89 8.386 10.25
(0.22) (0.03) (0.00) (0.00) (0.00)
(II) – (III) 44.98 34.05 0.245 17.43 0.250
(0.00) (0.00) (0.62) (0.00) (0.62) Note: Marginal effects of probit regressions with absolute value of t-statistic of the probit coefficients in parenthesis. The last six rows report the
Chi-squared statistic of a Wald test that the marginal effects are different from each other with p-values in parenthesis.
26
TABLE 4: Marginal Effects for Actual and Perceived Knowledge as Continuous Variables
(1) (2) (3) (4) (5)
PaidFull CarryBalance MinPayment LateFee ExceedCredit
Actual-norm 0.0146 0.0042 −0.0433 −0.0149 −0.0135
(2.67) (0.77) (7.99) (3.25) (3.78)
Perceived-norm 0.0813 −0.0637 −0.0489 −0.0571 −0.0275
(15.38) (12.34) (9.62) (13.28) (8.33)
Wald Test:
Actual-Perceived 68.48 74.14 0.513 39.86 7.321
(0.00) (0.00) (0.47) (0.00) (0.01)
Log Likelihood −12622 −13003 −12095 −10569 −7981
Chi-Squared 1470 1026 1893 1339 1036
Pseudo R-squared 0.0803 0.0558 0.115 0.0944 0.0940
Observations 20204 20221 20279 20245 20242 Note: Marginal effects of probit regressions with absolute value of t-statistic of the probit coefficients in parenthesis. The
Wald test reports a Chi-squared statistic (with p-value in parenthesis below) of the test that the marginal effect of Actual Knowledge equals that of Perceived Knowledge. The regression was estimated with all control variables reported in Table
3, but with Actual-norm and Perceived norm replacing the dummy variables for financial knowledge.