Embed Size (px)
Citation preview
working paperFiscal Evasion in statE BudgEting By Eileen Norcross
no. 10-39July 2010
The ideas presented in this research are the author’s and do not represent official positions of the Mercatus Center at George Mason University.
1
Fiscal Evasion in State Budgeting
By
Eileen Norcross
States are entering their third fiscal year of a sustained economic and revenue contraction. Tax revenues
have been declining since the first quarter of 2009 and are likely to continue their slide through 2012.
Between FY 2009 and FY 2012 state budget deficits will total $300 billion in the states over the next
three years.1 In FY 2011, states face a cumulative budget gap of $89 billion.2 Federal stimulus funds will
be largely exhausted in the coming fiscal year with state source revenues unlikely to return to their pre-
recession levels.3
While this recession delivered a severe shock to state economies and revenues, the fiscal crisis in the
states developed over decades. States have struggled to recover from economic downturns since the
early 1980s. Institutions meant to constrain spending such as Tax and Expenditure Limits (TELs), adopted
in the 1970s and 1980s, and constitutional limits on debt have also given rise to evasive practices meant
to circumvent these constraints and grow spending beyond a legal or constitutionally established limit.
The response to budgetary shortfalls in the states since the 1990s has been to resort to fiscal
gamesmanship.
With the most recent recession, the choices made by legislatures and governors to balance the books
have come under greater scrutiny. Tax increases, spending cuts, and federal bailout funds have each
been critiqued through different economic lenses as either supportive of or detrimental to recovery.
There is also concern that many of the tactics used to present balanced budgets amount to gimmickry.4
And more fundamentally, the long-running use of gimmicks is part of the reason most state budgets are
1 National Association of State Budget Officers (NASBO), “The Fiscal Survey of States,” Spring 2010.
2 National Conference of State Legislatures (NCSL), “FY 2011 Budget Status”, June 1, 2010.
(http://www.ncsl.org/default.aspx?TabId=19999) 3 “The Fiscal Survey of the States-June 2010” The National Association of State Budget Officers (NASBO), 15.
(http://www.nga.org/Files/pdf/FSS1006.PDF). 4 See for example, “State Fiscal Gimmicks: a Budgetary Balancing Act” by Katherine Barrett and Richard Greene,
The American Prospect, February 15, 2010; “Grab Bag of Gimmickry Hides State Deficit” by Nicholas Confessore, The New York Times, April 6, 2010; “The States’ Stupid Budget Tricks” by Katherine Barrett and Richard Greene, Governing, November 2009 (http://www.governing.com/columns/smart-mgmt/The-States-Stupid-Budget.html) and “Don’t Fall for State Budget Gimmicks” The Daily Herald Editorial Board, May 25, 2010. (http://www.dailyherald.com/story/?id=383160).
2
in crisis today.5 In this discussion, the word “gimmick” has been loosely applied to describe a range of
choices including school aid cuts, sales tax holidays, increased borrowing, delayed tax refunds, delayed
payments to vendors, and pension deferrals. Yet some of the practices labeled “gimmicks” do not
violate any accounting standard or budget rule.
To a great extent, a budget gimmick is in the eye of the beholder. Many of the tactics currently criticized
as gimmicks have also been described as “budget shortfall strategies,” 6 and “expedients.”7 This
inconsistent characterization may reflect the inadequacy of government budgeting practice and
standards, as well as a general ambivalence over the long-term implications of the accounting choices
made in public budgeting. It may also reflect the inadequacy of the word “gimmick” itself. Some of the
practices singled out as budget “gimmicks” are a result of a half-century of structural change to state
budgets, and the subnational governments’ growing reliance on debt and intergovernmental aid.
The inconsistent identification of poor fiscal practice indicates the lack of a common framework against
which to assess the fiscal choices of states. This paper establishes a basic definitional framework that
can be used to assess long-running fiscal practices in the states against a standard of fiscal prudence.
The aim is to further refine this framework to capture the drivers of the states’ long-running fiscal
problems and to offer recommendations for reform.
5 It is worth noting that states have faced significant shortfalls in the past, with similar criticisms leveled at state
budgeting practices. During the recession of 1991-1992, revenue shortfalls, increased unemployment and welfare applications, put pressure on state budgets, leading to a similar diagnosis, “To some degree, the state’s fiscal problems are of their own making. Some states have been good managers and have saved for a rainy day; others have been unwilling to restrain revenues or to restrain demands for more spending.” See, Susan B. Hansen,“State Fiscal Strategies for the 1990s: Balancing Budgets in a Recession,” Publius, Vol. 21, No. 3, The State of American Federalism, p. 155. 6 “Budget Shortfalls: Strategies for Closing Spending and Revenue Gaps,” National Association of Budget Officers,
3rd
Ed. December 2002. http://www.nasbo.org/LinkClick.aspx?fileticket=2KMuBWgfJdw%3D&tabid=83. NASBO noted in 2002 that, “Anemic revenue growth coupled with severe spending pressure is forcing states to replace short-term budget solutions with more creative, innovative and long-term adjustments. Aside from the usual budget balancing tools, states have a wide variety of other tools at their disposal.” These include: spending cuts, tobacco settlement funds, fund transfers, privatization, tax and fee increases, delayed tax cuts, debt finance, delaying payments to vendors, delaying tax refunds, among other measures. 7 The National Conference of State Legislatures notes, “Fiscal stress, however, can induce governors and legislators
to adopt expedients so they can observe the letter, if not the spirit, of balanced budget requirements. Among these are sales of state assets, postponing payments to vendors, reducing payments to pension funds, borrowing from one state fund to finance expenditures from another and “creative” accounting. Such expedients reflect the stress that can arise between legal demands for a balanced budget and political demands for the continuation of state programs without a tax increase. See, Ronald K. Snell, “State Balanced Budget Requirements,” National Conference of State Legislatures, updated April 1999 (http://www.ncsl.org/IssuesResearch/BudgetTax/StateBalancedBudgetRequirements/tabid/12660/Default.aspx)
3
Gimmickry, Fiscal Evasion and Fiscal Illusion
Gimmickry can be defined as a practice that intentionally violates an accounting or budgeting standard
or a legal requirement meant to ensure fiscal prudence. However, in some cases, the standards or
practices themselves may encourage a lack of prudence, or erode the hard budget constraint facing
state and local governments, necessary to ensuring a market-preserving federalist system.8 When the
rules or norms that guide budget choices contribute to structural instability or fiscal profligacy, the word
gimmickry loses its meaning and it becomes necessary to consider the extent to which the budgeting
framework promotes or discourages accuracy in accounting and fiscal prudence.
Budgeting choices identified as gimmickry arise from the fiscal framework. This framework includes
accounting standards, budget rules and their enforcement, and the fiscal relationships between the
federal, state, and local government.
Routine violation of accounting standards or budget rules can be minimized with better monitoring,
tighter controls, and penalties. But where accounting standards, legislative rules, or intergovernmental
interventions promote fiscal profligacy by obscuring the cost of spending, the remedies are less obvious.
To reconcile these two concepts—the violation of an accounting or legal standard, and the potential
weaknesses of the standards themselves—a new term, “fiscal evasion,” is employed. I define fiscal
evasion as any means—an accounting tactic, budgeting rule, or intergovernmental arrangement that
conceals the full cost of public spending.9 When these tactics are employed regularly, or weak rules and
8 See, Barry R. Weingast, “The Economic Role of Political Institutions: Market-Preserving Federalism and Economic
Development, “Journal of Law, Economics & Organization, Vol. 11, No. 1 (Apr., 1995), 4-5. Market-preserving federalism is a type of federalism that limits the degree to which a country’s government can encroach on its markets. It consists of five conditions, including the condition that the lower levels of government in a federalist arrangement face a hard budget constraint, “that is, they have neither the ability to print money nor access to unlimited credit. This condition is not met if the central government bails out the lower one whenever the latter faces fiscal problems.” 9 The concept of government creating mechanisms to evade limits and rules on spending is developed by James T.
Bennett and Thomas DiLorenzo in their seminal work on the rise of Off-Budget Enterprises (OBEs). They find that one outcome of the “tax revolts” of the late 1970s and early 1980s, and the resulting Tax and Expenditure Limits designed to constrain spending, was the increase in the number of OBEs on the local level with the authority to issue debt without voter approval. “Voter preferences for fiscal restraint are often evaded at the local level of government by conducting many public sector activities through off-budget enterprises which are largely beyond the control and scrutiny of citizen-taxpayers.” See, James T. Bennett and Thomas DiLorenzo, “Off-Budget Activities of Local Government: The Bane of the Tax Revolt” Public Choice, Vol. 39 No. 3 (1982) p 334.
4
arrangements dominate budgets, the effect is to institutionalize fiscal deception—convincing lawmakers
of a policy’s sustainability and dulling the response of voters by concealing the cost of policy choices.
Fiscal evasion is not meant to supplant the well-developed theory of fiscal illusion, which holds that the
methods used to finance government spending may cause taxpayers to perceive spending as less costly
than it actually is.10 An overly complex revenue system, debt finance, and income-tax withholding all
give rise to fiscal illusion.11 Instead, fiscal evasion describes how lawmakers intentionally foster fiscal
illusion to present a distorted picture of a government’s true fiscal condition.
Fiscal evasion is undertaken by circumventing statutory or constitutional budget rules, or through the
weak design of such rules, by practices that promote fiscal illusion, such as the use of debt and
intergovernmental aid to finance policies, and by accounting tactics that rely on data manipulation to
present a favorable budgetary picture.
There is a strong incentive in public budgeting at all levels of government to mask the full cost of
policies. The agents engaged in fiscal deception do not necessarily bear the consequences of those
choices. The costs are passed on to the taxpayer in the present or the future. Politicians reap immediate
political reward when they emphasize the benefits of a policy and diminish its costs. Taxpayers share the
“same budgetary pathology” of legislators, seeking an increase in spending, a decreased tax burden, and
a budgetary surplus.12
Why Does it Matter?
The misrepresentation of the cost of policies to taxpayers presents both lawmakers and voters with an
inaccurate picture of a government’s fiscal condition as well as the potential taxation necessary to
finance polices. Lawmakers budget in a fog which weakens their capacity to make well-informed policy
choices. New York State Comptroller Thomas DiNapoli notes, “The state’s real fiscal picture is impossible
to pin down.”13 He notes the long-running and widespread use of gimmickry is so woven into Albany’s
10
For a discussion of the development of the theory of fiscal illusion, see, Public Finance in Democratic Process: Fiscal Institutions and Individual Choice, by James M. Buchanan, 1967, in The Collected Works of James Buchanan vol. 4 Liberty Fund (1999). 11
Richard E. Wagner, “Revenue Structure, Fiscal Illusion, and Budgetary Choice,” Public Choice, Spring 1976. 12
Cheryl Block, “Budget Gimmicks,” in Fiscal Challenges: An Interdisciplinary Approach to Budget Policy, Edited by Elizabeth Garrett, Elizabeth A. Graddy and Howell E. Jackson, pp. 47 (Cambridge University Press, 2008) 13
“Grab Bag of Gimmickry Hides State Deficit” by Nicholas Confessore, The New York Times, April 6, 2010.
5
budget that it has “essentially rendered the state’s balance sheet immaterial.”14 This misrepresentation
creates a false picture of budgetary balance that obscure the reality of underlying deficits.
When the true cost of spending is obscured, voters may prefer an increase in the amount of resources
dedicated to a particular policy or support a policy they might not otherwise if the full cost were
obvious. Where budgets are constructed to hide the cost of spending the meaning of voter participation
is eroded.
A one-time tactic employed to balance a budget or conceal the cost of a policy choice may generate a
climate of fiscal gamesmanship. Short-term fixes may be codified as budget procedures, which in turn
help to conceal unsustainable spending policies. Reliance on intergovernmental aid may lead to the
expectation of bailouts leading states to budget less prudently or avoid structural budgetary reforms.15
How States Engage in Fiscal Evasion
In her assessment of budget gimmickry in the federal government, Cheryl Block identifies three types of
gimmicks: games with numbers, timing games, and procedural games. This is a useful framework for
identifying tactics that violate or manipulate established accounting or legal standards, and it can be
extended to the standards themselves. However, it does not capture the use of mechanisms such as
debt that mask the full cost of policies. Further, when considering state (and local) governments in a
federalist system, the potential for another kind of evasion emerges—one that exploits
intergovernmental transfers.
In order to identify how states avoid presenting the full cost of policies, the next section considers how
the state’s budgetary framework gives rise to fiscal evasion. This framework includes a) balanced budget
requirements, b) Tax and Expenditure Limits, c) limits on debt, d) accounting practices and definitions,
and e) intergovernmental transfers.
a. Balanced Budget Requirements
All states, except Vermont, operate under either constitutional or statutory balanced budget rules.
There are two general types of balanced budget rules. Prospective balanced budget rules require the
14
Ibid. 15
Alexander Fink and Thomas Stratmann, “Institutionalized Bailouts and Fiscal Policy: The Consequences of Soft Budget Constraints,” CESifo Working Paper Series No. 2827, October 28, 2009, Fink and Stratmann note that “States have soft budget constraints when they can expect a bailout by the federal government in the event of a financial crisis. This gives rise to incentives for unsound state fiscal policy.”
6
proposed or enacted budget be in balance. 16 If revenues are not sufficient to cover proposed spending,
a deficit results. One outcome of prospective rules is that it creates an incentive for legislatures to
overstate anticipated revenues to permit higher levels of spending. The penalty for this strategy is voter
anger associated with deficit spending or future tax increases.17 Forty-four states require the governor
to submit a balanced budget to the legislature, and 37 states require the legislature enact a balanced
budget.
A balanced budget rule may also be retrospective, stipulating how a deficit is treated at the end of the
fiscal year. Retrospective rules are stronger balanced-budget rules than prospective rules. Seven states
allow for deficit carry-over, provided the deficit is accounted for explicitly in the next budget. Thirty-six
states prohibit deficit carryover and require the shortfall is addressed in the current fiscal year, either
through reduced spending, increased taxation, debt, federal aid, or accounting gimmicks.18 Empirical
evidence suggests constitutional spending limits with no deficit carryover rules in states with elected
courts are more effective at controlling spending growth. Seventeen states meet these criteria.19
While balanced budget rules may be designed to keep deficit spending in check, they are limited in what
portion of the spending they constrain. The National Conference of States Legislatures (NCSL) finds that
in 48 states balanced budget rules apply only to operating budgets, or the general fund, which
comprises anywhere from 20 to 60 percent of a state’s budget. Some states also apply balanced budget
rules to other funds. Thirty-eight states extend balanced budget requirements to federal funds and 34
states apply a spending limit to special funds in which taxes are dedicated to specific spending.20
NCSL suggests that revenues and expenditures earmarked for federal grants and special funds, such as
highway trust funds have little impact on balanced budgets, since “expenditures are controlled by
available funds.”21
16
David Primo, Rules and Restraint: Government Spending and the Design of Institutions, University of Chicago Press, 2007, 87. 17
Ibid., p. 88 18
Robert Krol, “The Role of Fiscal and Political Institutions in Limiting the Size of State Government” Cato Journal, Vol 16, No. 3 19
David Primo, Rules and Restraint p. 89 20
Ronald K. Snell, “State Balanced Budget Requirements: Provisions and Practice,” December 2004 (http://www.ncsl.org/?TabId=12651) 21
Ibid.
7
While dedicated funds are meant to be spent on legally specified purposes, funds are fungible. States
have shown a willingness to “sweep” trust funds earmarked for specific purposes into the general fund,
a practice criticized by New York State’s comptroller as encouraging budgetary instability. In addition,
intergovernmental transfers of federal funds to states can stimulate greater state spending, including
encouraging states to issue debt in order to support federally-initiated projects.
More importantly, budgetary balance does not imply fiscal prudence, nor does it mean that spending
growth is constrained. Budgetary balance simply indicates that revenues are sufficient to cover a desired
level of spending. Even though a budget is balanced, it may still be too large relative to the state’s
economy. In fact, the definition of a “budget deficit” if often misleading.
For FY 2010, California reported a budget deficit of $19.1 billion. This estimate represents the difference
between current revenues and what the government would like to spend, based on projected budget
growth of 14 percent. The deficit represents the legislature’s desire to increase the FY 2009–2010
budget of $87.3 billion to a budget of $99.5 billion in FY 2010–2011. If instead, the legislature only
increased spending by inflation plus population growth, the budget deficit would fall from $19.1 billion
to $7 billion.22
b. Tax and Expenditure Limits
The growth in state taxation during from the 1950s and 1970s to fund increased state
government spending touched off a wave of tax revolts in the states during the 1970s and
1980s. The culmination of these tax revolts was the passage of Tax and Expenditure Limits (TELs)
in many states, meant to curtail taxation and/or spending. TELs vary in what they constrain and
in their stringency. The degree to which TELs have been successful in limiting the growth of
government is the subject of a vast literature. It is worth noting that there is evidence that
lawmakers have undermined the intent of TELs by developing mechanisms to evade imposed
spending limits. Wagner and Sobel find that some states adopted budget stabilization funds
(BSFs), or rainy day funds, “to circumvent existing expenditure and/or tax limit laws.”23 Many
states have “weakly structured” withdrawal and deposit rules governing their BSFs, allowing
lawmakers to access stabilization funds, while bypassing spending limits.24
22
Cal-Tax Reports, Vol. IV, No. 19, May 24, 2010. 23
Gary A. Wagner and Russell S. Sobel, “State budget stabilization fund adoption: Preparing for the next recession or circumventing fiscal constraints?”Public Choice, Vol. 126 (2006), p. 178 24
Ibid, Wagner and Sobel, “State budget stabilization fund adoption,” 182.
8
c. Debt Limits
Thirty-three states constrain spending in capital funds which are typically financed through debt.25
However, court decisions and voter referendums on borrowing have led to the exclusion of debt-
financed expenditures in calculating balanced budget requirements.26 There is evidence that debt per
capita spending is higher in states with weak budget rules.27
Until the 20th century, it was generally accepted that prudent fiscal conduct on the part of governments
included adopting the same set of financial principles as households. Spending should not exceed
income and debt should be kept to a minimum. Debt finance was generally limited to “extraordinary
events” such as war and natural disasters.28 This norm was occasionally violated with state governments
borrowing to build canals, turnpikes, and roads, leading to defaults by state and local government.29
These defaults lead states to pass constitutional restrictions on debt. However, state debt restrictions
have not been successful in limiting overall state debt. 30 The use of debt in to finance projects in state
and local governments has grown significantly in recent decades.
25
National Conference of State Legislatures, “State Balanced Budget Requirements: Provisions and Practice,” by Ronald K. Snell, updated 2004, p.5 (http://www.ncsl.org/?TabId=12651#t3). 26
Ibid, p. 5 27
Robert Krol, “The Role of Fiscal and Political Institutions in Limiting the Size of State Government,” Cato Journal, Vol. 16, No. 3. 28
Eileen Norcross and Frederic Sautet, “Institutions Matter: Can New Jersey Reverse Course?” Mercatus Center Working Paper No. 09-30, July 2009 p. 12. 29
James C. Clingermayer and B. Dan Wood, “Disentangling Patterns of State Debt Finance,” The American Political Science Review, Vol. 89, No. 1 (Mar, 1995) 108. 30
Clingermeyer and Wood, “Disentangling Patters of State Debt Finance,” 1995, 109.

9
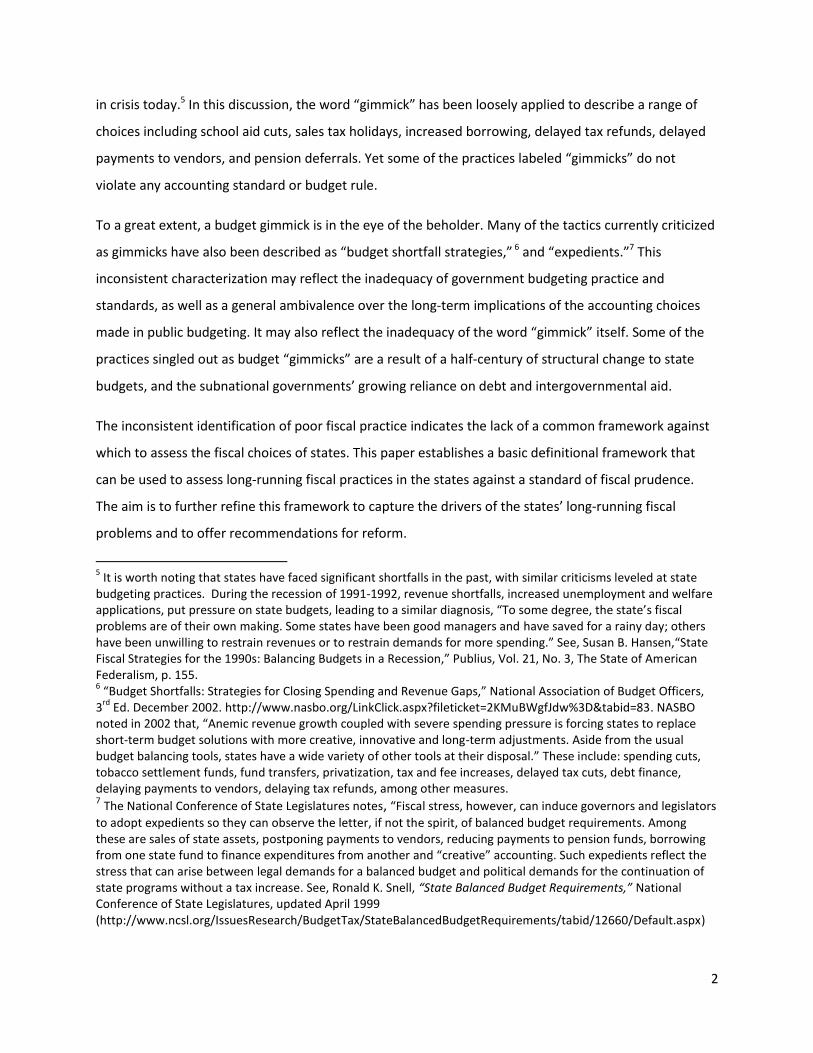
States governments issue General Obligation bonds backed by the taxing authority of the state.
These bonds come with the legal obligation that the state must pay bondholders. Debt limits
generally only cover such “guaranteed debt.” States have gotten around these debt limits by
creating off-budget entities (OBEs) such as special authorities with the ability to issue other
forms of “non-guaranteed debt”, in particular, revenue bonds.31 Revenue bonds are backed by
revenues generated by the authority, such as tolls or fees. Today, revenue bonds constitute the
majority of total state debt.
States are “morally” but not legally obligated to guarantee revenue debt in the event that the
issuing authority defaults. In fact, the concept of “moral obligation” debt originates with the off-
budget enterprise.32 As Bennett and DiLorenzo recount, in 1960, Governor Nelson Rockefeller of
New York created the Housing Finance Authority (HFA), one of dozens of debt-issuing OBEs
established during his tenure. Because HFA’s bonds were based on rental housing revenues,
Rockefeller worried that the authority would have difficulty marketing its bonds to investors. To
31
Beverly S. Bunch, “The Effect of Constitutional Debt Limits on State Government’s Use of Public Authorities,” Public Choice, Vol. 68 No. 1-3, January 1991.
32 James T. Bennett and Thomas J. DiLorenzo, “Underground Government” Cato Institute, 1983 p.64
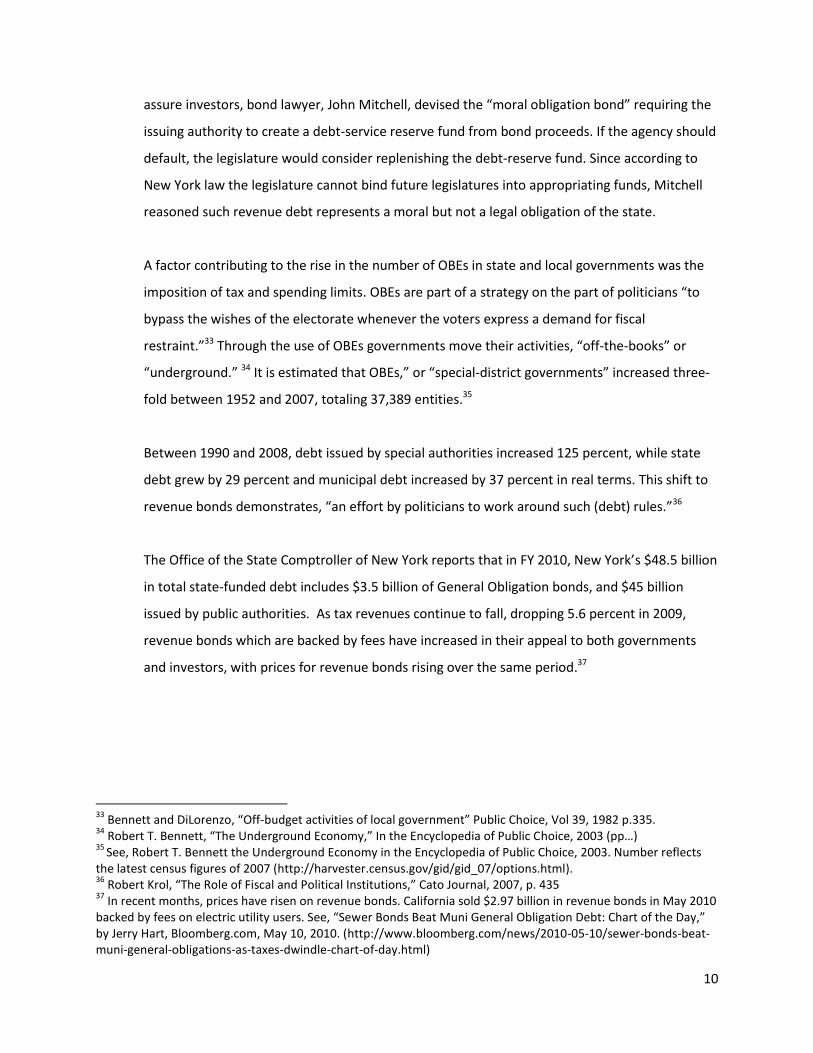
$-
$2.00
$4.00
$6.00
$8.00
$10.00
$12.00
$14.00
$16.00 $
Tri
llio
ns
U.S. Government Debt vs. GDP
Federal
State and Local
GDP
10
assure investors, bond lawyer, John Mitchell, devised the “moral obligation bond” requiring the
issuing authority to create a debt-service reserve fund from bond proceeds. If the agency should
default, the legislature would consider replenishing the debt-reserve fund. Since according to
New York law the legislature cannot bind future legislatures into appropriating funds, Mitchell
reasoned such revenue debt represents a moral but not a legal obligation of the state.
A factor contributing to the rise in the number of OBEs in state and local governments was the
imposition of tax and spending limits. OBEs are part of a strategy on the part of politicians “to
bypass the wishes of the electorate whenever the voters express a demand for fiscal
restraint.”33 Through the use of OBEs governments move their activities, “off-the-books” or
“underground.” 34 It is estimated that OBEs,” or “special-district governments” increased three-
fold between 1952 and 2007, totaling 37,389 entities.35
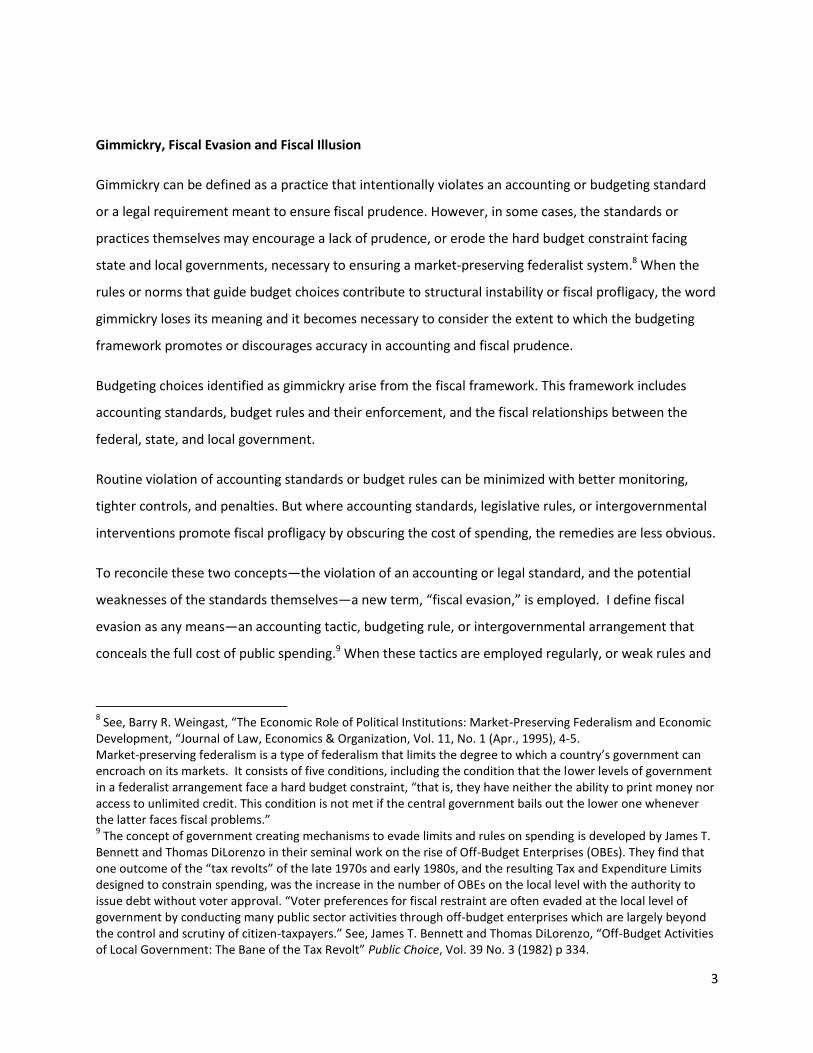
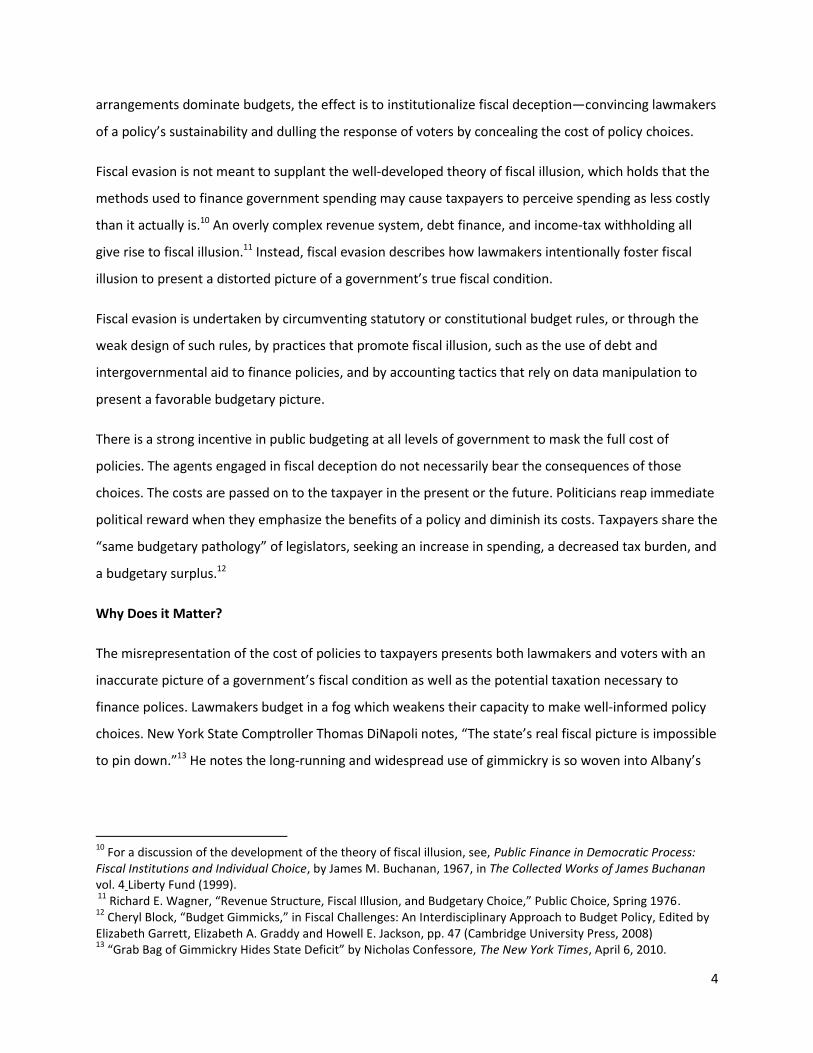
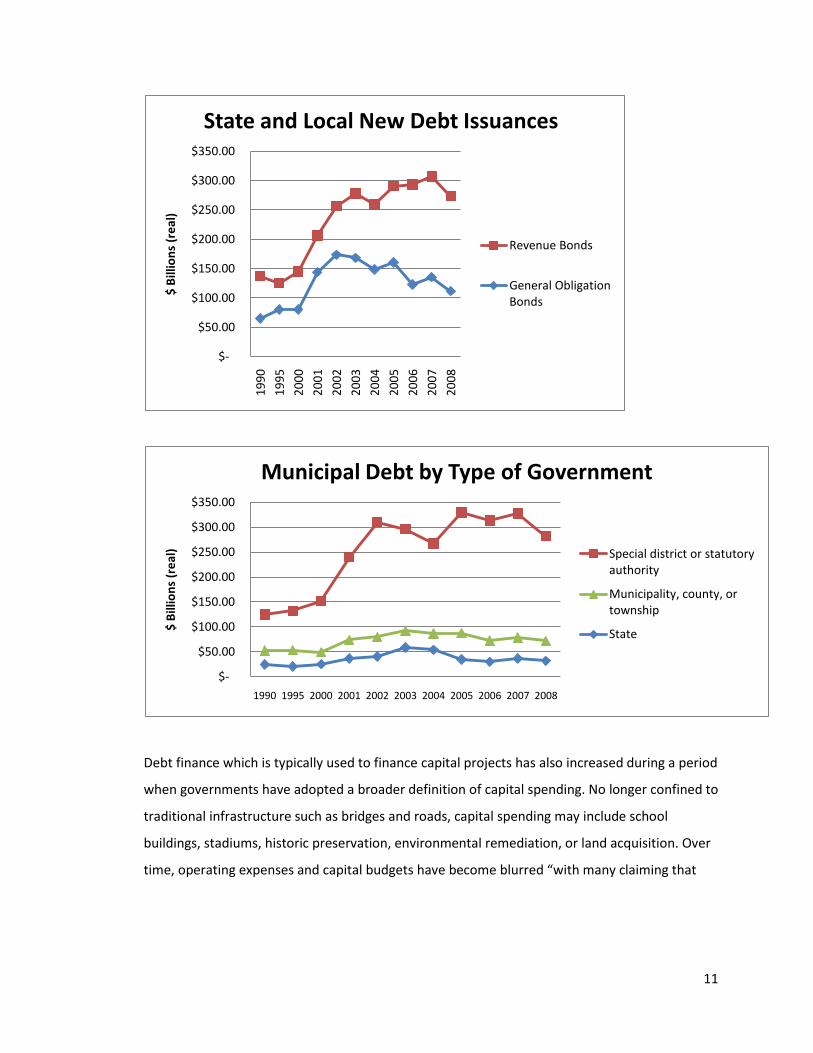
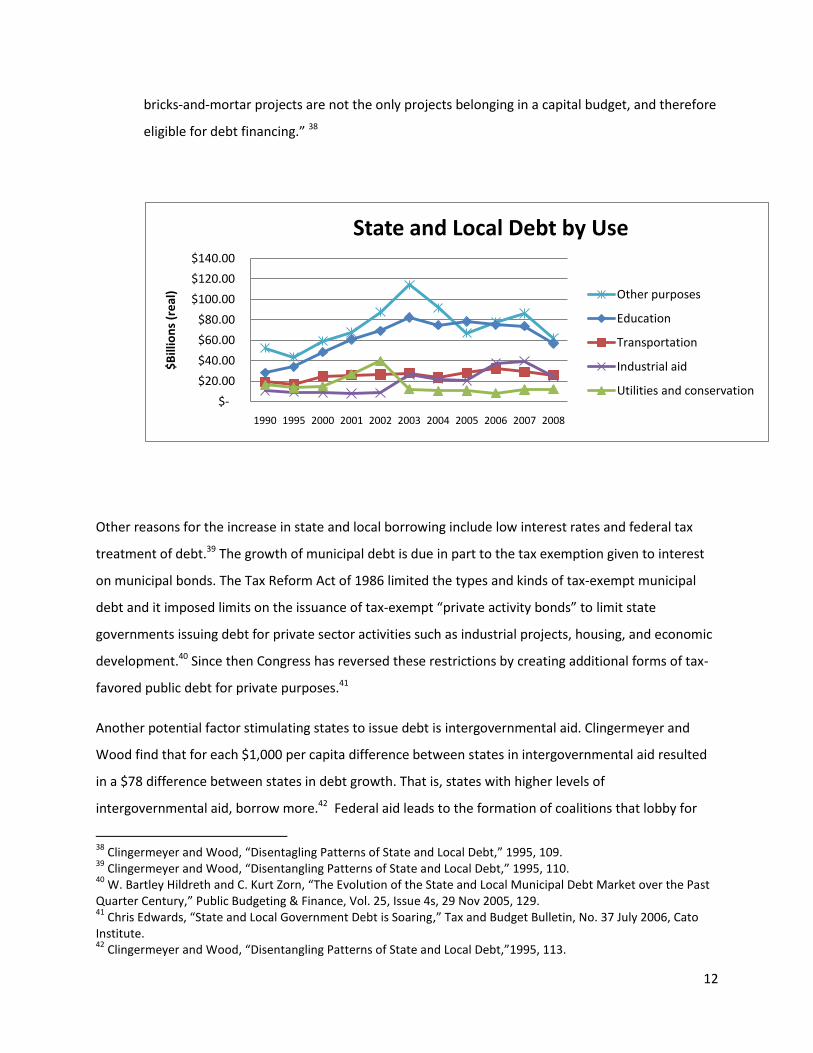
Between 1990 and 2008, debt issued by special authorities increased 125 percent, while state
debt grew by 29 percent and municipal debt increased by 37 percent in real terms. This shift to
revenue bonds demonstrates, “an effort by politicians to work around such (debt) rules.”36
The Office of the State Comptroller of New York reports that in FY 2010, New York’s $48.5 billion
in total state-funded debt includes $3.5 billion of General Obligation bonds, and $45 billion
issued by public authorities. As tax revenues continue to fall, dropping 5.6 percent in 2009,
revenue bonds which are backed by fees have increased in their appeal to both governments
and investors, with prices for revenue bonds rising over the same period.37
33
Bennett and DiLorenzo, “Off-budget activities of local government” Public Choice, Vol 39, 1982 p.335. 34
Robert T. Bennett, “The Underground Economy,” In the Encyclopedia of Public Choice, 2003 (pp…) 35
See, Robert T. Bennett the Underground Economy in the Encyclopedia of Public Choice, 2003. Number reflects the latest census figures of 2007 (http://harvester.census.gov/gid/gid_07/options.html). 36
Robert Krol, “The Role of Fiscal and Political Institutions,” Cato Journal, 2007, p. 435 37
In recent months, prices have risen on revenue bonds. California sold $2.97 billion in revenue bonds in May 2010 backed by fees on electric utility users. See, “Sewer Bonds Beat Muni General Obligation Debt: Chart of the Day,” by Jerry Hart, Bloomberg.com, May 10, 2010. (http://www.bloomberg.com/news/2010-05-10/sewer-bonds-beat-muni-general-obligations-as-taxes-dwindle-chart-of-day.html)
11
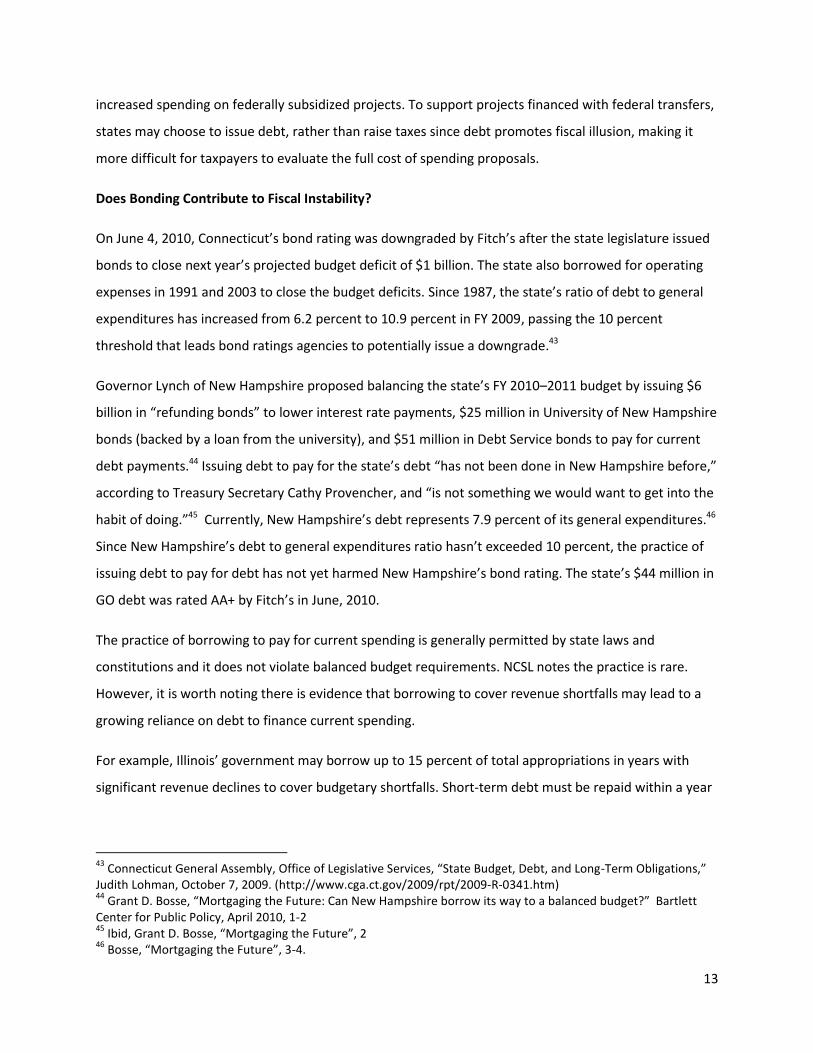
Debt finance which is typically used to finance capital projects has also increased during a period
when governments have adopted a broader definition of capital spending. No longer confined to
traditional infrastructure such as bridges and roads, capital spending may include school
buildings, stadiums, historic preservation, environmental remediation, or land acquisition. Over
time, operating expenses and capital budgets have become blurred “with many claiming that
$-
$50.00
$100.00
$150.00
$200.00
$250.00
$300.00
$350.00
19
90
19
95
20
00
20
01
20
02
20
03
20
04
20
05
20
06
20
07
20
08
$ B
illio
ns
(re
al)
State and Local New Debt Issuances
Revenue Bonds
General Obligation Bonds
$-
$50.00
$100.00
$150.00
$200.00
$250.00
$300.00
$350.00
1990 1995 2000 2001 2002 2003 2004 2005 2006 2007 2008
$ B
illio
ns
(re
al)
Municipal Debt by Type of Government
Special district or statutory authority
Municipality, county, or township
State
12
bricks-and-mortar projects are not the only projects belonging in a capital budget, and therefore
eligible for debt financing.” 38
Other reasons for the increase in state and local borrowing include low interest rates and federal tax
treatment of debt.39 The growth of municipal debt is due in part to the tax exemption given to interest
on municipal bonds. The Tax Reform Act of 1986 limited the types and kinds of tax-exempt municipal
debt and it imposed limits on the issuance of tax-exempt “private activity bonds” to limit state
governments issuing debt for private sector activities such as industrial projects, housing, and economic
development.40 Since then Congress has reversed these restrictions by creating additional forms of tax-
favored public debt for private purposes.41
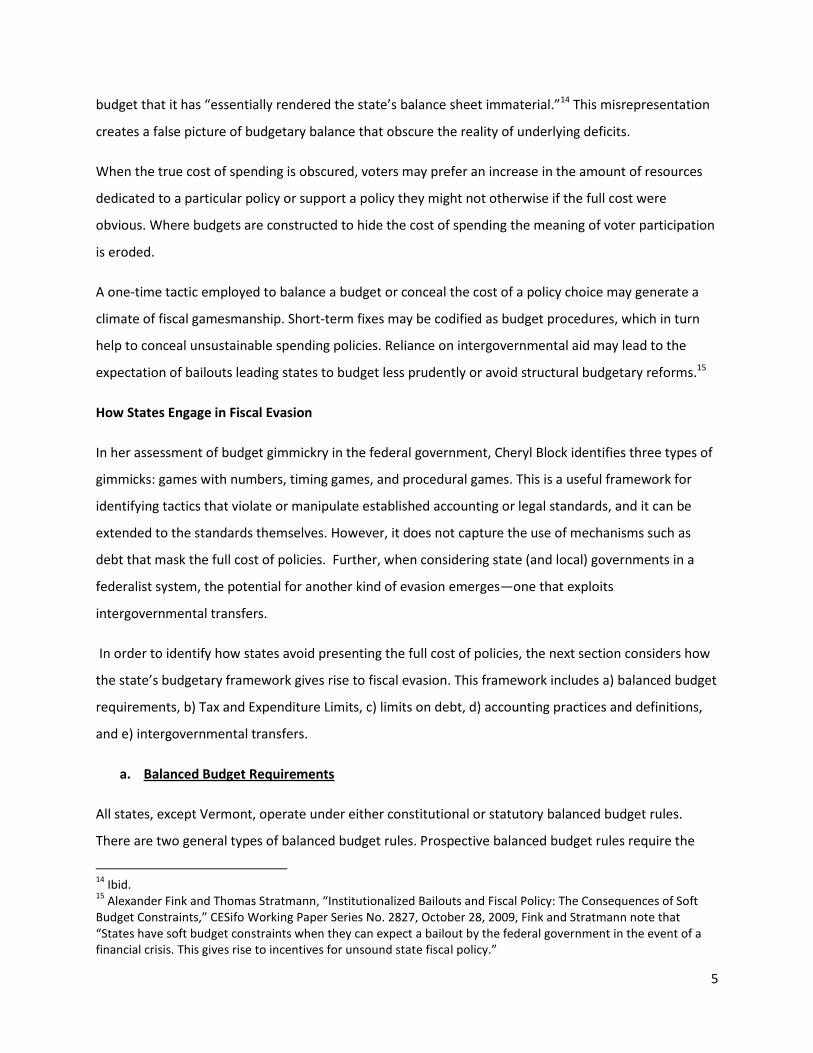
Another potential factor stimulating states to issue debt is intergovernmental aid. Clingermeyer and
Wood find that for each $1,000 per capita difference between states in intergovernmental aid resulted
in a $78 difference between states in debt growth. That is, states with higher levels of
intergovernmental aid, borrow more.42 Federal aid leads to the formation of coalitions that lobby for
38
Clingermeyer and Wood, “Disentagling Patterns of State and Local Debt,” 1995, 109. 39
Clingermeyer and Wood, “Disentangling Patterns of State and Local Debt,” 1995, 110. 40
W. Bartley Hildreth and C. Kurt Zorn, “The Evolution of the State and Local Municipal Debt Market over the Past Quarter Century,” Public Budgeting & Finance, Vol. 25, Issue 4s, 29 Nov 2005, 129. 41
Chris Edwards, “State and Local Government Debt is Soaring,” Tax and Budget Bulletin, No. 37 July 2006, Cato Institute. 42
Clingermeyer and Wood, “Disentangling Patterns of State and Local Debt,”1995, 113.
$-
$20.00
$40.00
$60.00
$80.00
$100.00
$120.00
$140.00
1990 1995 2000 2001 2002 2003 2004 2005 2006 2007 2008
$B
illio
ns
(re
al)
State and Local Debt by Use
Other purposes
Education
Transportation
Industrial aid
Utilities and conservation
13
increased spending on federally subsidized projects. To support projects financed with federal transfers,
states may choose to issue debt, rather than raise taxes since debt promotes fiscal illusion, making it
more difficult for taxpayers to evaluate the full cost of spending proposals.
Does Bonding Contribute to Fiscal Instability?
On June 4, 2010, Connecticut’s bond rating was downgraded by Fitch’s after the state legislature issued
bonds to close next year’s projected budget deficit of $1 billion. The state also borrowed for operating
expenses in 1991 and 2003 to close the budget deficits. Since 1987, the state’s ratio of debt to general
expenditures has increased from 6.2 percent to 10.9 percent in FY 2009, passing the 10 percent
threshold that leads bond ratings agencies to potentially issue a downgrade.43
Governor Lynch of New Hampshire proposed balancing the state’s FY 2010–2011 budget by issuing $6
billion in “refunding bonds” to lower interest rate payments, $25 million in University of New Hampshire
bonds (backed by a loan from the university), and $51 million in Debt Service bonds to pay for current
debt payments.44 Issuing debt to pay for the state’s debt “has not been done in New Hampshire before,”
according to Treasury Secretary Cathy Provencher, and “is not something we would want to get into the
habit of doing.”45 Currently, New Hampshire’s debt represents 7.9 percent of its general expenditures.46
Since New Hampshire’s debt to general expenditures ratio hasn’t exceeded 10 percent, the practice of
issuing debt to pay for debt has not yet harmed New Hampshire’s bond rating. The state’s $44 million in
GO debt was rated AA+ by Fitch’s in June, 2010.
The practice of borrowing to pay for current spending is generally permitted by state laws and
constitutions and it does not violate balanced budget requirements. NCSL notes the practice is rare.
However, it is worth noting there is evidence that borrowing to cover revenue shortfalls may lead to a
growing reliance on debt to finance current spending.
For example, Illinois’ government may borrow up to 15 percent of total appropriations in years with
significant revenue declines to cover budgetary shortfalls. Short-term debt must be repaid within a year
43
Connecticut General Assembly, Office of Legislative Services, “State Budget, Debt, and Long-Term Obligations,” Judith Lohman, October 7, 2009. (http://www.cga.ct.gov/2009/rpt/2009-R-0341.htm) 44
Grant D. Bosse, “Mortgaging the Future: Can New Hampshire borrow its way to a balanced budget?” Bartlett Center for Public Policy, April 2010, 1-2 45
Ibid, Grant D. Bosse, “Mortgaging the Future”, 2 46
Bosse, “Mortgaging the Future”, 3-4.
14
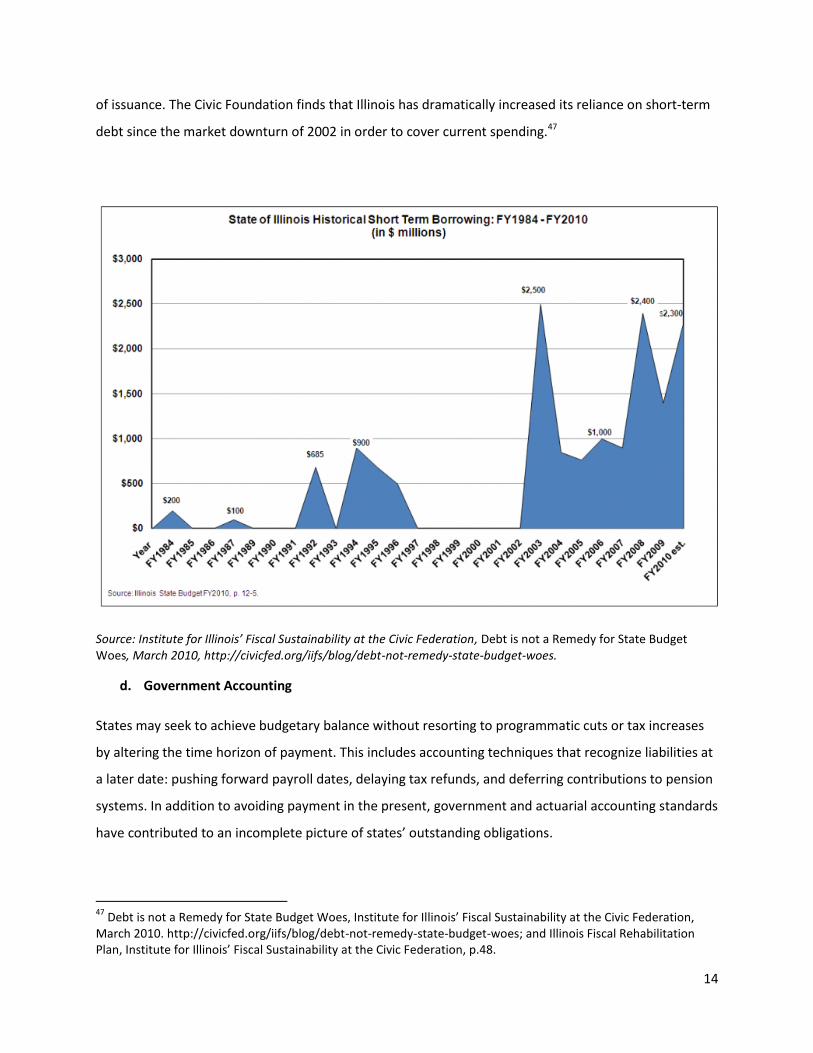
of issuance. The Civic Foundation finds that Illinois has dramatically increased its reliance on short-term
debt since the market downturn of 2002 in order to cover current spending.47
Source: Institute for Illinois’ Fiscal Sustainability at the Civic Federation, Debt is not a Remedy for State Budget Woes, March 2010, http://civicfed.org/iifs/blog/debt-not-remedy-state-budget-woes.
d. Government Accounting
States may seek to achieve budgetary balance without resorting to programmatic cuts or tax increases
by altering the time horizon of payment. This includes accounting techniques that recognize liabilities at
a later date: pushing forward payroll dates, delaying tax refunds, and deferring contributions to pension
systems. In addition to avoiding payment in the present, government and actuarial accounting standards
have contributed to an incomplete picture of states’ outstanding obligations.
47
Debt is not a Remedy for State Budget Woes, Institute for Illinois’ Fiscal Sustainability at the Civic Federation, March 2010. http://civicfed.org/iifs/blog/debt-not-remedy-state-budget-woes; and Illinois Fiscal Rehabilitation Plan, Institute for Illinois’ Fiscal Sustainability at the Civic Federation, p.48.
15
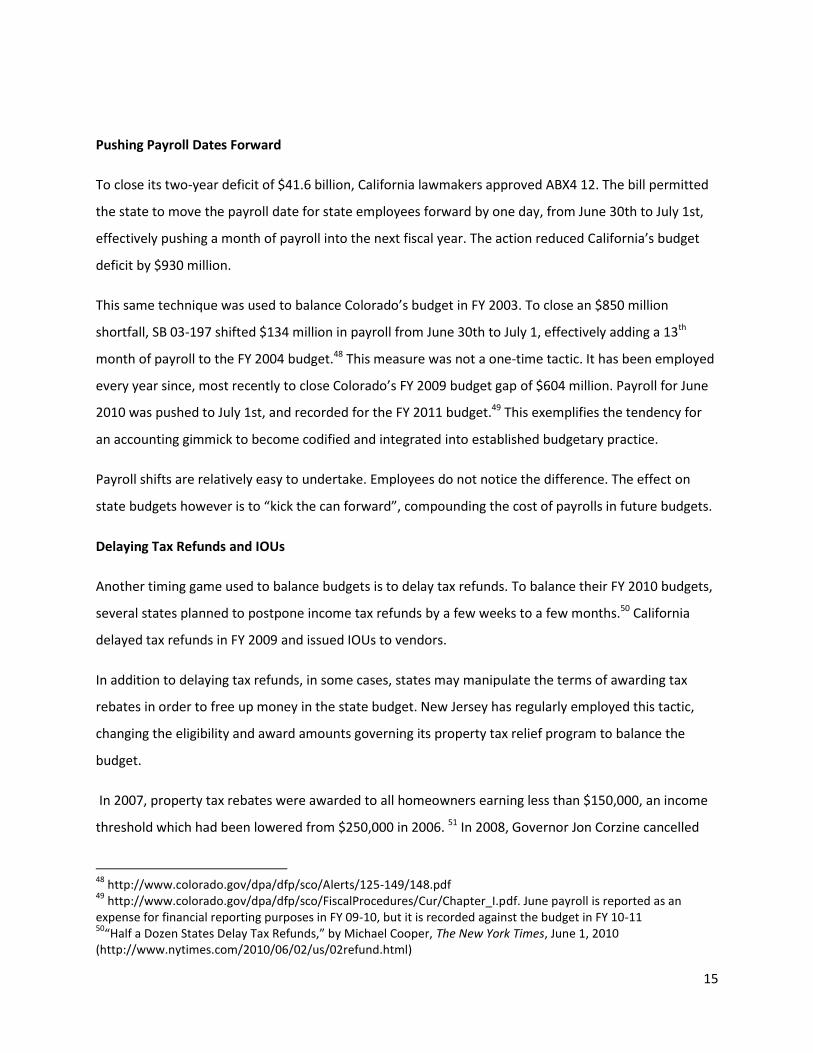
Pushing Payroll Dates Forward
To close its two-year deficit of $41.6 billion, California lawmakers approved ABX4 12. The bill permitted
the state to move the payroll date for state employees forward by one day, from June 30th to July 1st,
effectively pushing a month of payroll into the next fiscal year. The action reduced California’s budget
deficit by $930 million.
This same technique was used to balance Colorado’s budget in FY 2003. To close an $850 million
shortfall, SB 03-197 shifted $134 million in payroll from June 30th to July 1, effectively adding a 13th
month of payroll to the FY 2004 budget.48 This measure was not a one-time tactic. It has been employed
every year since, most recently to close Colorado’s FY 2009 budget gap of $604 million. Payroll for June
2010 was pushed to July 1st, and recorded for the FY 2011 budget.49 This exemplifies the tendency for
an accounting gimmick to become codified and integrated into established budgetary practice.
Payroll shifts are relatively easy to undertake. Employees do not notice the difference. The effect on
state budgets however is to “kick the can forward”, compounding the cost of payrolls in future budgets.
Delaying Tax Refunds and IOUs
Another timing game used to balance budgets is to delay tax refunds. To balance their FY 2010 budgets,
several states planned to postpone income tax refunds by a few weeks to a few months.50 California
delayed tax refunds in FY 2009 and issued IOUs to vendors.
In addition to delaying tax refunds, in some cases, states may manipulate the terms of awarding tax
rebates in order to free up money in the state budget. New Jersey has regularly employed this tactic,
changing the eligibility and award amounts governing its property tax relief program to balance the
budget.
In 2007, property tax rebates were awarded to all homeowners earning less than $150,000, an income
threshold which had been lowered from $250,000 in 2006. 51 In 2008, Governor Jon Corzine cancelled
48
http://www.colorado.gov/dpa/dfp/sco/Alerts/125-149/148.pdf 49
http://www.colorado.gov/dpa/dfp/sco/FiscalProcedures/Cur/Chapter_I.pdf. June payroll is reported as an expense for financial reporting purposes in FY 09-10, but it is recorded against the budget in FY 10-11 50
“Half a Dozen States Delay Tax Refunds,” by Michael Cooper, The New York Times, June 1, 2010 (http://www.nytimes.com/2010/06/02/us/02refund.html)
16
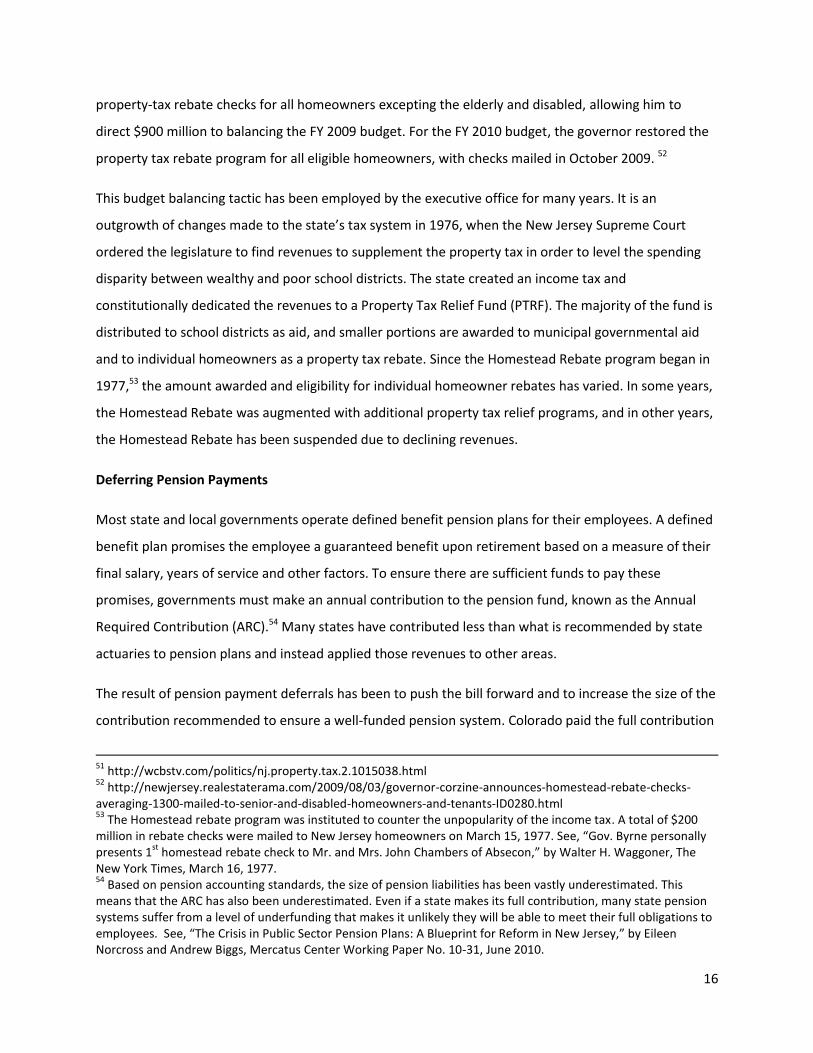
property-tax rebate checks for all homeowners excepting the elderly and disabled, allowing him to
direct $900 million to balancing the FY 2009 budget. For the FY 2010 budget, the governor restored the
property tax rebate program for all eligible homeowners, with checks mailed in October 2009. 52
This budget balancing tactic has been employed by the executive office for many years. It is an
outgrowth of changes made to the state’s tax system in 1976, when the New Jersey Supreme Court
ordered the legislature to find revenues to supplement the property tax in order to level the spending
disparity between wealthy and poor school districts. The state created an income tax and
constitutionally dedicated the revenues to a Property Tax Relief Fund (PTRF). The majority of the fund is
distributed to school districts as aid, and smaller portions are awarded to municipal governmental aid
and to individual homeowners as a property tax rebate. Since the Homestead Rebate program began in
1977,53 the amount awarded and eligibility for individual homeowner rebates has varied. In some years,
the Homestead Rebate was augmented with additional property tax relief programs, and in other years,
the Homestead Rebate has been suspended due to declining revenues.
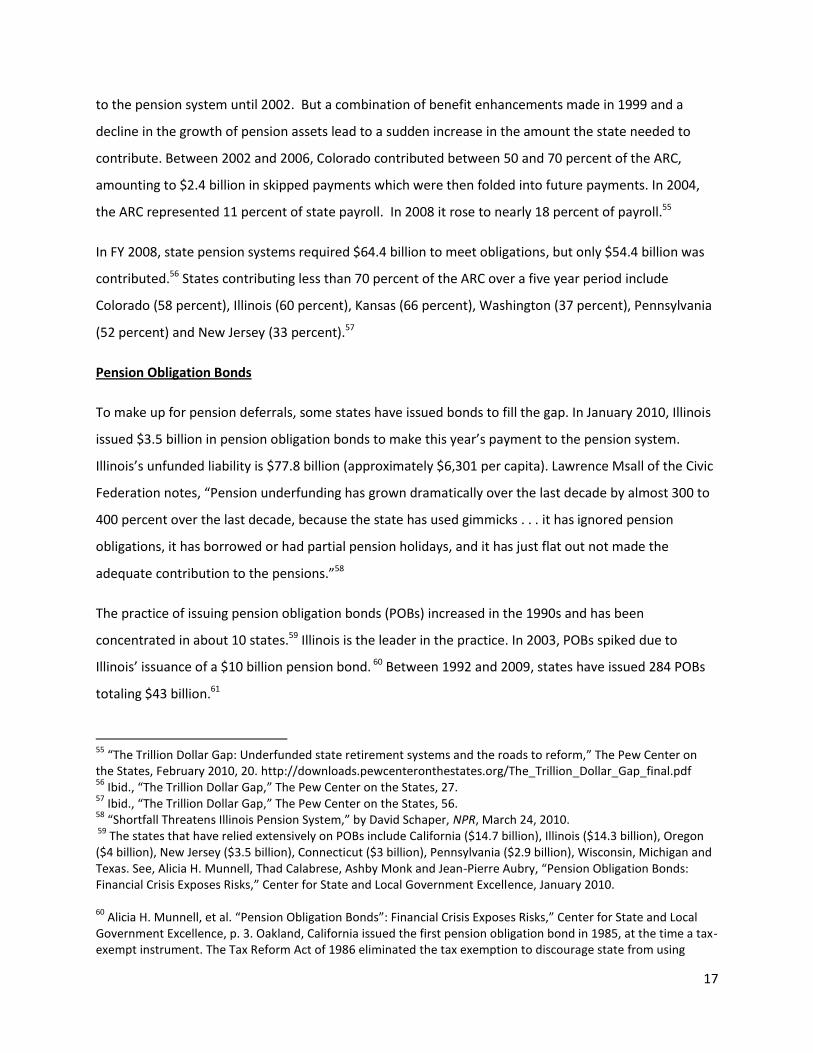
Deferring Pension Payments
Most state and local governments operate defined benefit pension plans for their employees. A defined
benefit plan promises the employee a guaranteed benefit upon retirement based on a measure of their
final salary, years of service and other factors. To ensure there are sufficient funds to pay these
promises, governments must make an annual contribution to the pension fund, known as the Annual
Required Contribution (ARC).54 Many states have contributed less than what is recommended by state
actuaries to pension plans and instead applied those revenues to other areas.
The result of pension payment deferrals has been to push the bill forward and to increase the size of the
contribution recommended to ensure a well-funded pension system. Colorado paid the full contribution
51
http://wcbstv.com/politics/nj.property.tax.2.1015038.html 52
http://newjersey.realestaterama.com/2009/08/03/governor-corzine-announces-homestead-rebate-checks-averaging-1300-mailed-to-senior-and-disabled-homeowners-and-tenants-ID0280.html 53
The Homestead rebate program was instituted to counter the unpopularity of the income tax. A total of $200 million in rebate checks were mailed to New Jersey homeowners on March 15, 1977. See, “Gov. Byrne personally presents 1
st homestead rebate check to Mr. and Mrs. John Chambers of Absecon,” by Walter H. Waggoner, The
New York Times, March 16, 1977. 54
Based on pension accounting standards, the size of pension liabilities has been vastly underestimated. This means that the ARC has also been underestimated. Even if a state makes its full contribution, many state pension systems suffer from a level of underfunding that makes it unlikely they will be able to meet their full obligations to employees. See, “The Crisis in Public Sector Pension Plans: A Blueprint for Reform in New Jersey,” by Eileen Norcross and Andrew Biggs, Mercatus Center Working Paper No. 10-31, June 2010.
17
to the pension system until 2002. But a combination of benefit enhancements made in 1999 and a
decline in the growth of pension assets lead to a sudden increase in the amount the state needed to
contribute. Between 2002 and 2006, Colorado contributed between 50 and 70 percent of the ARC,
amounting to $2.4 billion in skipped payments which were then folded into future payments. In 2004,
the ARC represented 11 percent of state payroll. In 2008 it rose to nearly 18 percent of payroll.55
In FY 2008, state pension systems required $64.4 billion to meet obligations, but only $54.4 billion was
contributed.56 States contributing less than 70 percent of the ARC over a five year period include
Colorado (58 percent), Illinois (60 percent), Kansas (66 percent), Washington (37 percent), Pennsylvania
(52 percent) and New Jersey (33 percent).57
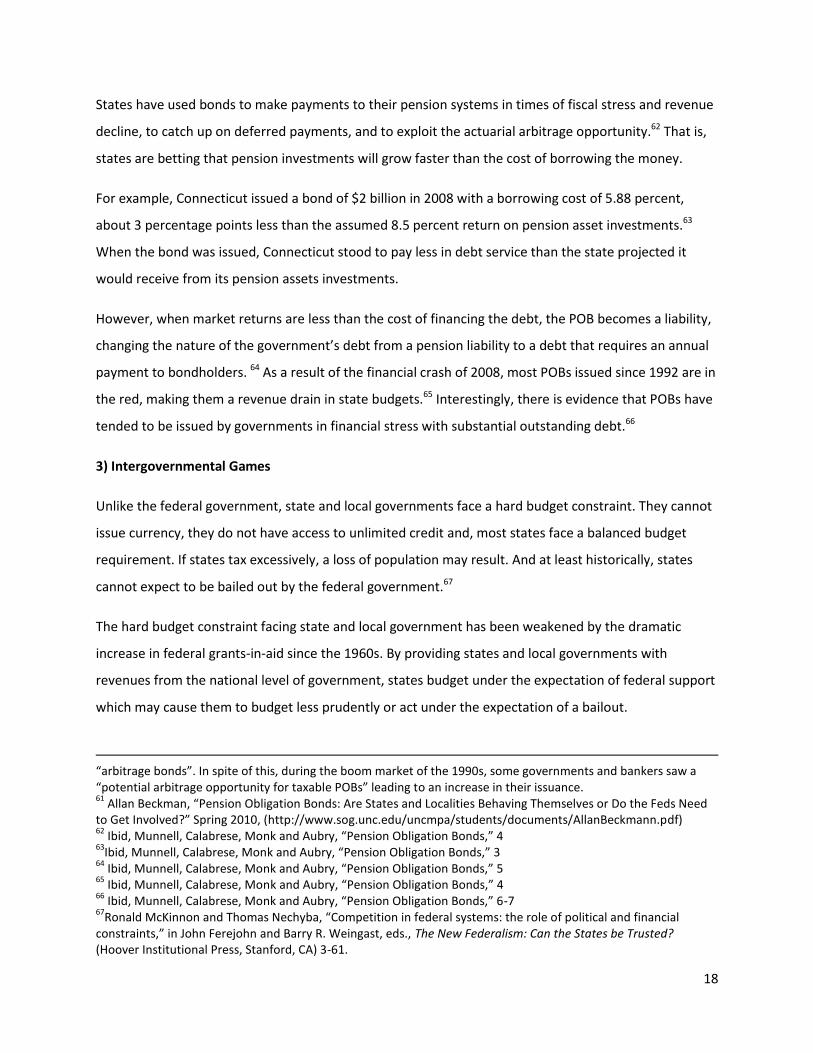
Pension Obligation Bonds
To make up for pension deferrals, some states have issued bonds to fill the gap. In January 2010, Illinois
issued $3.5 billion in pension obligation bonds to make this year’s payment to the pension system.
Illinois’s unfunded liability is $77.8 billion (approximately $6,301 per capita). Lawrence Msall of the Civic
Federation notes, “Pension underfunding has grown dramatically over the last decade by almost 300 to
400 percent over the last decade, because the state has used gimmicks . . . it has ignored pension
obligations, it has borrowed or had partial pension holidays, and it has just flat out not made the
adequate contribution to the pensions.”58
The practice of issuing pension obligation bonds (POBs) increased in the 1990s and has been
concentrated in about 10 states.59 Illinois is the leader in the practice. In 2003, POBs spiked due to
Illinois’ issuance of a $10 billion pension bond. 60 Between 1992 and 2009, states have issued 284 POBs
totaling $43 billion.61
55
“The Trillion Dollar Gap: Underfunded state retirement systems and the roads to reform,” The Pew Center on the States, February 2010, 20. http://downloads.pewcenteronthestates.org/The_Trillion_Dollar_Gap_final.pdf 56
Ibid., “The Trillion Dollar Gap,” The Pew Center on the States, 27. 57
Ibid., “The Trillion Dollar Gap,” The Pew Center on the States, 56. 58
“Shortfall Threatens Illinois Pension System,” by David Schaper, NPR, March 24, 2010. 59
The states that have relied extensively on POBs include California ($14.7 billion), Illinois ($14.3 billion), Oregon ($4 billion), New Jersey ($3.5 billion), Connecticut ($3 billion), Pennsylvania ($2.9 billion), Wisconsin, Michigan and Texas. See, Alicia H. Munnell, Thad Calabrese, Ashby Monk and Jean-Pierre Aubry, “Pension Obligation Bonds: Financial Crisis Exposes Risks,” Center for State and Local Government Excellence, January 2010. 60
Alicia H. Munnell, et al. “Pension Obligation Bonds”: Financial Crisis Exposes Risks,” Center for State and Local Government Excellence, p. 3. Oakland, California issued the first pension obligation bond in 1985, at the time a tax-exempt instrument. The Tax Reform Act of 1986 eliminated the tax exemption to discourage state from using
18
States have used bonds to make payments to their pension systems in times of fiscal stress and revenue
decline, to catch up on deferred payments, and to exploit the actuarial arbitrage opportunity.62 That is,
states are betting that pension investments will grow faster than the cost of borrowing the money.
For example, Connecticut issued a bond of $2 billion in 2008 with a borrowing cost of 5.88 percent,
about 3 percentage points less than the assumed 8.5 percent return on pension asset investments.63
When the bond was issued, Connecticut stood to pay less in debt service than the state projected it
would receive from its pension assets investments.
However, when market returns are less than the cost of financing the debt, the POB becomes a liability,
changing the nature of the government’s debt from a pension liability to a debt that requires an annual
payment to bondholders. 64 As a result of the financial crash of 2008, most POBs issued since 1992 are in
the red, making them a revenue drain in state budgets.65 Interestingly, there is evidence that POBs have
tended to be issued by governments in financial stress with substantial outstanding debt.66
3) Intergovernmental Games
Unlike the federal government, state and local governments face a hard budget constraint. They cannot
issue currency, they do not have access to unlimited credit and, most states face a balanced budget
requirement. If states tax excessively, a loss of population may result. And at least historically, states
cannot expect to be bailed out by the federal government.67
The hard budget constraint facing state and local government has been weakened by the dramatic
increase in federal grants-in-aid since the 1960s. By providing states and local governments with
revenues from the national level of government, states budget under the expectation of federal support
which may cause them to budget less prudently or act under the expectation of a bailout.
“arbitrage bonds”. In spite of this, during the boom market of the 1990s, some governments and bankers saw a “potential arbitrage opportunity for taxable POBs” leading to an increase in their issuance. 61
Allan Beckman, “Pension Obligation Bonds: Are States and Localities Behaving Themselves or Do the Feds Need to Get Involved?” Spring 2010, (http://www.sog.unc.edu/uncmpa/students/documents/AllanBeckmann.pdf) 62
Ibid, Munnell, Calabrese, Monk and Aubry, “Pension Obligation Bonds,” 4 63
Ibid, Munnell, Calabrese, Monk and Aubry, “Pension Obligation Bonds,” 3 64
Ibid, Munnell, Calabrese, Monk and Aubry, “Pension Obligation Bonds,” 5 65
Ibid, Munnell, Calabrese, Monk and Aubry, “Pension Obligation Bonds,” 4 66
Ibid, Munnell, Calabrese, Monk and Aubry, “Pension Obligation Bonds,” 6-7 67
Ronald McKinnon and Thomas Nechyba, “Competition in federal systems: the role of political and financial constraints,” in John Ferejohn and Barry R. Weingast, eds., The New Federalism: Can the States be Trusted? (Hoover Institutional Press, Stanford, CA) 3-61.
19
Intergovernmental grants are intended to provide states with access to federal funds to supplement or
(at least in theory) replace state revenue. However, intergovernmental grants change the budgeting
incentives of state governments causing them to spend more than they would absent the grant.
Intergovernmental grants also provide an opportunity for gamesmanship or outright fraud.68
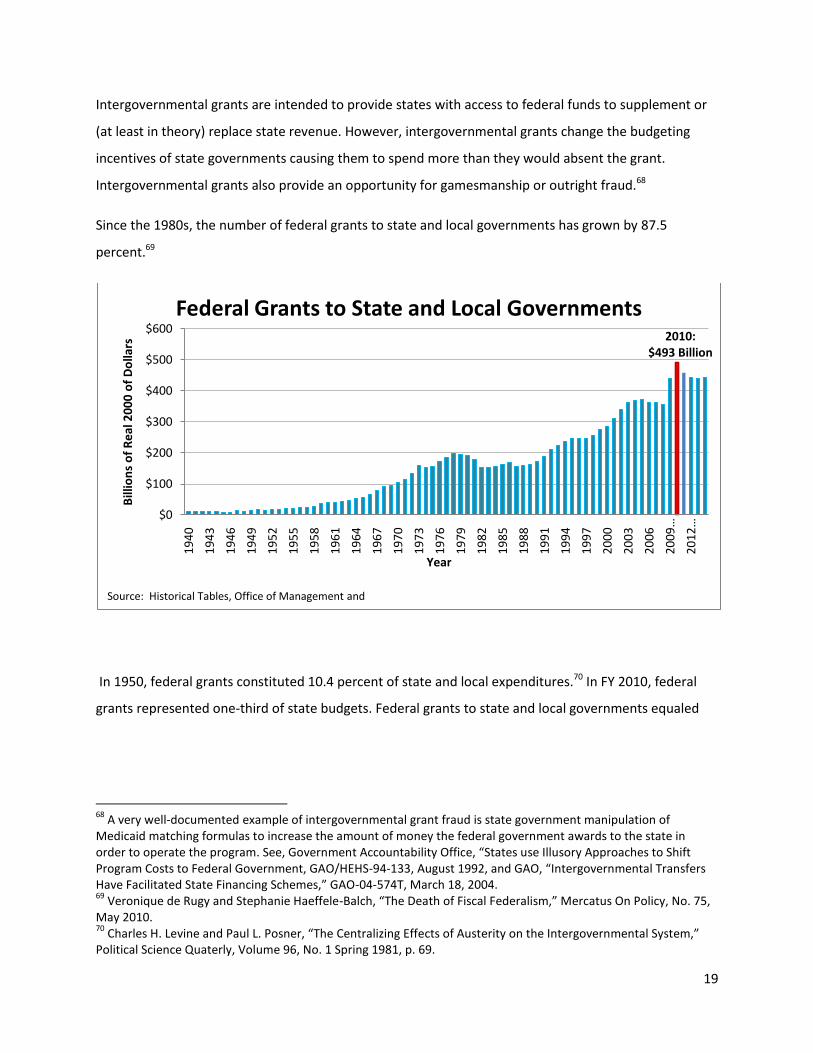
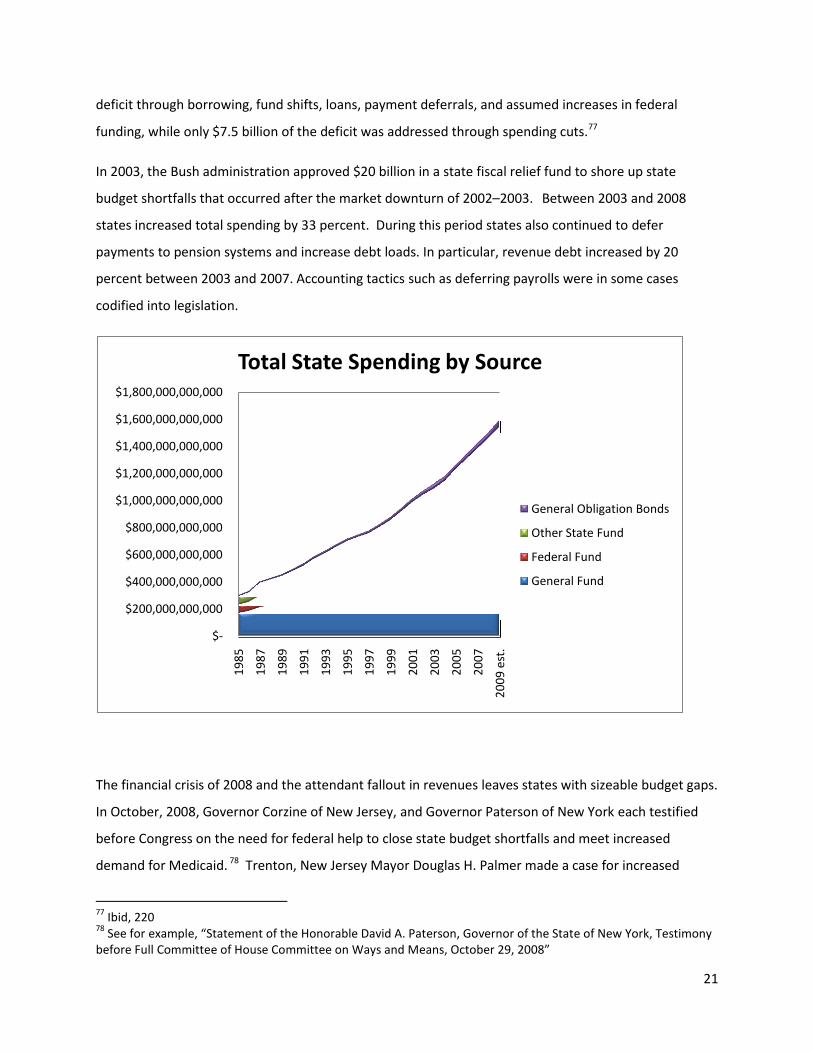
Since the 1980s, the number of federal grants to state and local governments has grown by 87.5
percent.69
In 1950, federal grants constituted 10.4 percent of state and local expenditures.70 In FY 2010, federal
grants represented one-third of state budgets. Federal grants to state and local governments equaled
68
A very well-documented example of intergovernmental grant fraud is state government manipulation of Medicaid matching formulas to increase the amount of money the federal government awards to the state in order to operate the program. See, Government Accountability Office, “States use Illusory Approaches to Shift Program Costs to Federal Government, GAO/HEHS-94-133, August 1992, and GAO, “Intergovernmental Transfers Have Facilitated State Financing Schemes,” GAO-04-574T, March 18, 2004. 69
Veronique de Rugy and Stephanie Haeffele-Balch, “The Death of Fiscal Federalism,” Mercatus On Policy, No. 75, May 2010. 70
Charles H. Levine and Paul L. Posner, “The Centralizing Effects of Austerity on the Intergovernmental System,” Political Science Quaterly, Volume 96, No. 1 Spring 1981, p. 69.
2010:$493 Billion
$0
$100
$200
$300
$400
$500
$600
19
40
19
43
19
46
19
49
19
52
19
55
19
58
19
61
19
64
19
67
19
70
19
73
19
76
19
79
19
82
19
85
19
88
19
91
19
94
19
97
20
00
20
03
20
06
20
09
…
20
12
…
Bill
ion
s o
f R
eal
20
00
of
Do
llars
Year
Federal Grants to State and Local Governments
Source: Historical Tables, Office of Management and
20
$439 billion in FY 2010, an increase of 73 percent since FY 2000,71 or 18 percent of federal spending in
2009.
In addition to altering the priorities of state and local governments,72 federal grants to the states
stimulate spending at all three levels of government, by “entice*ing+ state and local government
participation [in federal programs] and increase*ing+ their expenditures.” This is true of lump-sum
grants73 as well as matching grants, where costs are shared between the state and federal governments,
such Medicaid.74
The intermingling of federal, state, and local revenues adds complexity to the financing of public
spending, making it harder to taxpayers to evaluate the cost, promoting fiscal illusion. As noted, federal
grants may also stimulate the issuance of state or local debt to help finance projects undertaken with
federal dollars.
In addition to awarding grants to the states to operate a wide variety of programs, the federal
government has shown that it is willing to explicitly bail states out of fiscal distress twice in the last
decade. As noted, bailouts soften the hard budget constraint facing state and local governments and
lead to moral hazard, enabling states to avoid structural budgetary reform while increasing spending.
There is evidence that states have failed to undertake structural budgetary reforms or cut spending on
the expectation of future federal subsidies. States took more drastic action to close budget deficits
during the recession of 1990–1991 than they did during the 2002–2003 recession.75 In FY 1991–1992,
California closed 82 percent of its $14.3 billion shortfall largely through tax increase and spending cuts.
The remainder of the gap, $2.5 billion, was covered with trust fund sweeps, cost shifts and reductions in
reserves.76 By contrast, in FY 2002–2003, Governor Gray Davis closed half of California’s $23.6 billion
71
Veronique de Rugy and Stefanie Haeffele-Balch, “The Death of Fiscal Federalism” Mercatus On Policy No. 75, May 2010 72
Levine and Posner, “The Centralizing Effects of Austerity on the Intergovernmental System,” p. 68. 73
See, James R. Hines and Richard H. Thaler, “Anomalies: The Flypaper Effect” Journal of Economic Perspectives, Vol.9 No. 4 Fall 1995 pp. 217-226. 74 Medicaid is the fastest growing component of state budgets, growing from 12 percent to 21 percent of total
state spending between 1990 and 2007, constituting one of the “major elements of federal fiscal support the states.”
74 For every Medicaid dollar granted by the federal governments, depending on the matching rate, states
contribute between 0.50 cents and 0.24 cents towards the program.
75 Steven M. Sheffrin, “State Budget Deficit Dynamics and the California Debacle” The Journal of Economic
Perspectives, Vol. 18, No. 2 (Spring, 2004) 220. 76
Ibid, Steven M. Sheffrin, “State Budget Deficit Dynamics and the California Debacle”
21
deficit through borrowing, fund shifts, loans, payment deferrals, and assumed increases in federal
funding, while only $7.5 billion of the deficit was addressed through spending cuts.77
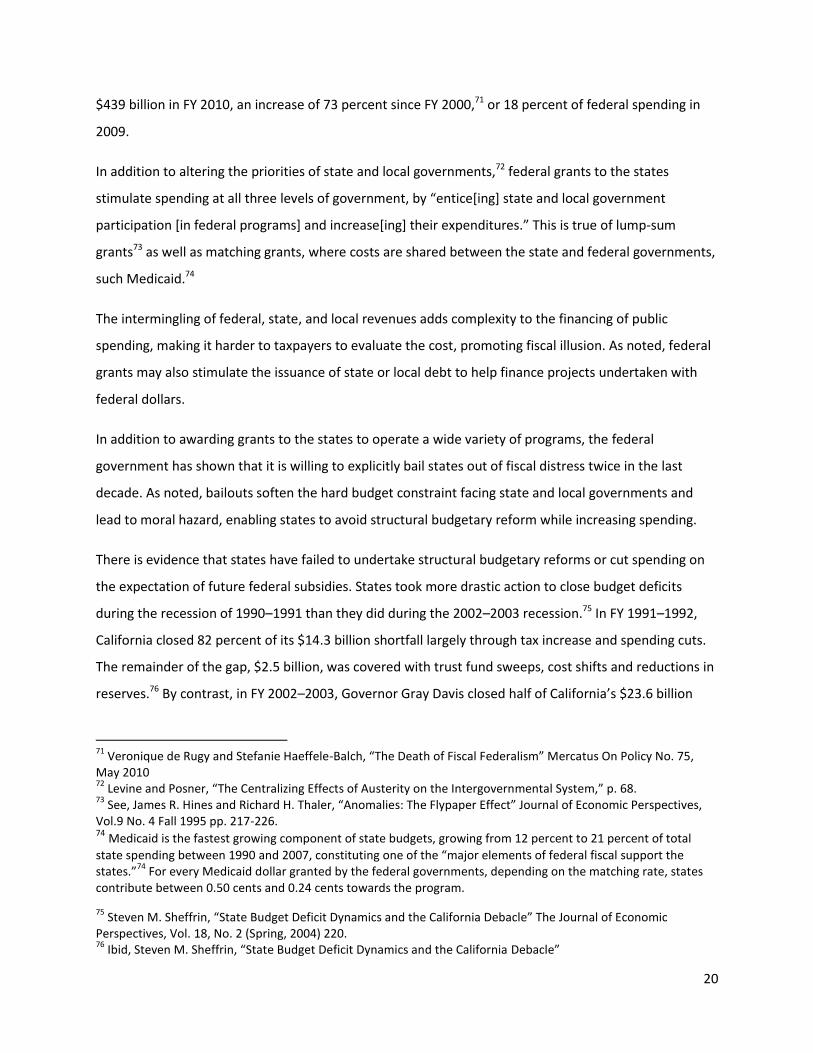
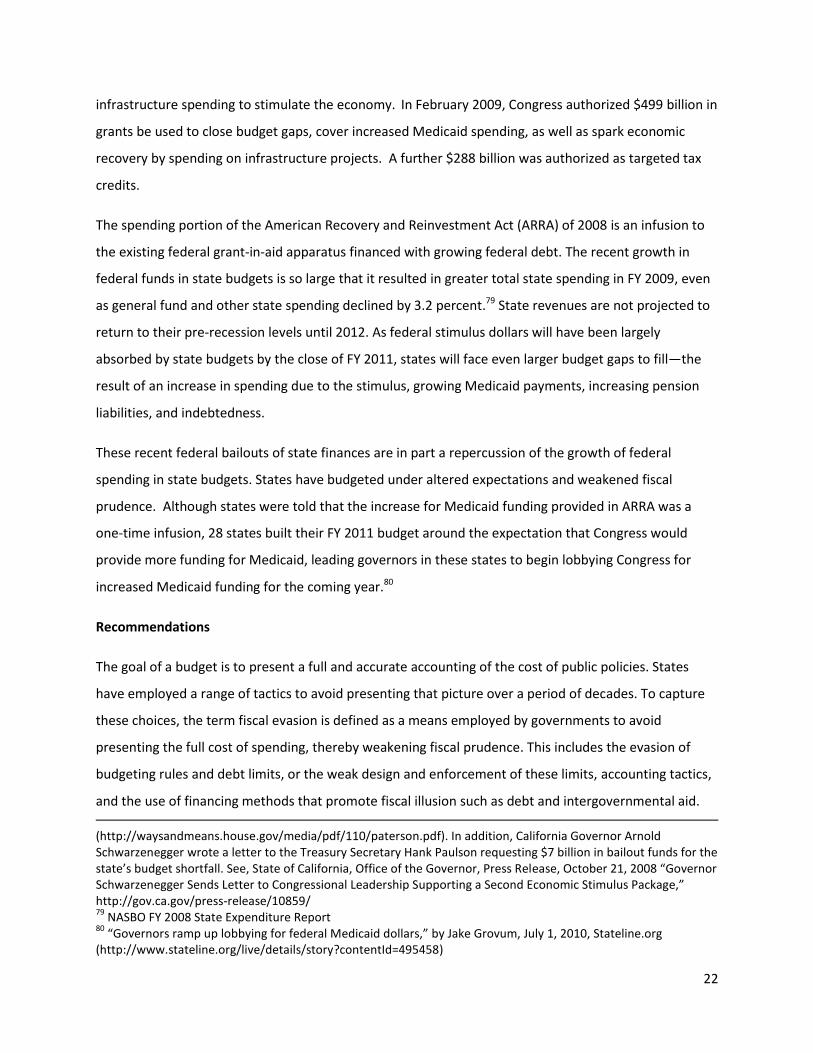
In 2003, the Bush administration approved $20 billion in a state fiscal relief fund to shore up state
budget shortfalls that occurred after the market downturn of 2002–2003. Between 2003 and 2008
states increased total spending by 33 percent. During this period states also continued to defer
payments to pension systems and increase debt loads. In particular, revenue debt increased by 20
percent between 2003 and 2007. Accounting tactics such as deferring payrolls were in some cases
codified into legislation.
The financial crisis of 2008 and the attendant fallout in revenues leaves states with sizeable budget gaps.
In October, 2008, Governor Corzine of New Jersey, and Governor Paterson of New York each testified
before Congress on the need for federal help to close state budget shortfalls and meet increased
demand for Medicaid. 78 Trenton, New Jersey Mayor Douglas H. Palmer made a case for increased
77
Ibid, 220 78
See for example, “Statement of the Honorable David A. Paterson, Governor of the State of New York, Testimony before Full Committee of House Committee on Ways and Means, October 29, 2008”
$-
$200,000,000,000
$400,000,000,000
$600,000,000,000
$800,000,000,000
$1,000,000,000,000
$1,200,000,000,000
$1,400,000,000,000
$1,600,000,000,000
$1,800,000,000,000
19
85
19
87
19
89
19
91
19
93
19
95
19
97
19
99
20
01
20
03
20
05
20
07
20
09
est
.
Total State Spending by Source
General Obligation Bonds
Other State Fund
Federal Fund
General Fund
22
infrastructure spending to stimulate the economy. In February 2009, Congress authorized $499 billion in
grants be used to close budget gaps, cover increased Medicaid spending, as well as spark economic
recovery by spending on infrastructure projects. A further $288 billion was authorized as targeted tax
credits.
The spending portion of the American Recovery and Reinvestment Act (ARRA) of 2008 is an infusion to
the existing federal grant-in-aid apparatus financed with growing federal debt. The recent growth in
federal funds in state budgets is so large that it resulted in greater total state spending in FY 2009, even
as general fund and other state spending declined by 3.2 percent.79 State revenues are not projected to
return to their pre-recession levels until 2012. As federal stimulus dollars will have been largely
absorbed by state budgets by the close of FY 2011, states will face even larger budget gaps to fill—the
result of an increase in spending due to the stimulus, growing Medicaid payments, increasing pension
liabilities, and indebtedness.
These recent federal bailouts of state finances are in part a repercussion of the growth of federal
spending in state budgets. States have budgeted under altered expectations and weakened fiscal
prudence. Although states were told that the increase for Medicaid funding provided in ARRA was a
one-time infusion, 28 states built their FY 2011 budget around the expectation that Congress would
provide more funding for Medicaid, leading governors in these states to begin lobbying Congress for
increased Medicaid funding for the coming year.80
Recommendations
The goal of a budget is to present a full and accurate accounting of the cost of public policies. States
have employed a range of tactics to avoid presenting that picture over a period of decades. To capture
these choices, the term fiscal evasion is defined as a means employed by governments to avoid
presenting the full cost of spending, thereby weakening fiscal prudence. This includes the evasion of
budgeting rules and debt limits, or the weak design and enforcement of these limits, accounting tactics,
and the use of financing methods that promote fiscal illusion such as debt and intergovernmental aid. (http://waysandmeans.house.gov/media/pdf/110/paterson.pdf). In addition, California Governor Arnold Schwarzenegger wrote a letter to the Treasury Secretary Hank Paulson requesting $7 billion in bailout funds for the state’s budget shortfall. See, State of California, Office of the Governor, Press Release, October 21, 2008 “Governor Schwarzenegger Sends Letter to Congressional Leadership Supporting a Second Economic Stimulus Package,” http://gov.ca.gov/press-release/10859/ 79
NASBO FY 2008 State Expenditure Report 80
“Governors ramp up lobbying for federal Medicaid dollars,” by Jake Grovum, July 1, 2010, Stateline.org (http://www.stateline.org/live/details/story?contentId=495458)
23
This paper is a first attempt at developing a framework for states to identify budgetary and fiscal choices
that have contributed to an incomplete accounting, lessening the ability of states to respond to revenue
shocks. This paper presents a brief survey of some of the budgetary choices of legislatures that fit the
definition of fiscal evasion; these include how states have applied balanced budget rules, defined
deficits, avoided debt restrictions, employed evasive accounting maneuvers, and used
intergovernmental aid. There are other practices that are certain to meet the criteria.
There will always be an incentive present in public budgeting to overemphasize the benefits, and de-
emphasize the costs of spending proposals. But there are things states can do to minimize the practices
discussed in this paper.
1) Defining the Deficit – Deficits should be measured as the difference between projected revenue
and the previous year’s spending plus inflation and population growth. Currently, states offer an
inflated deficit figure based on what the state would like to spend. When beginning with an
artificially inflated deficit figure, any reductions to this figure are inaccurately presented as
“cuts.”
2) Accounting for OBEs – Off-Budget Enterprises have proliferated over the past forty years,
growing to over 37,000 such entities in the United States. OBEs should be considered part of the
fiscal responsibilities of state and local governments, and as such they should be subject to the
same financial reporting requirements of state governments.
3) Restriction on Debt – States should require voter approval for debt issued by special authorities
and other Off-Budget Enterprises and include that debt under current debt limits.
4) Close loopholes and eliminate codified accounting tricks – Pushing forward payroll dates,
issuing IOUs, pension deferrals, all constitute accounting manipulations that hide the full cost of
current spending. Such practices can be minimized through tighter accounting standards.
5) Roll Back Intergovernmental Aid – The result of the long-running transfer of grants from the
federal to the state governments has been to alter the budgetary choices of state governments,
while stimulating greater spending, debt finance, and weakening fiscal prudence. While there is
little incentive for one state to turn down a federal grant if states are to regain control of their
finances and reduce their growing fiscal instability, the intergovernmental aid apparatus must
be rolled back. Reform of this apparatus must take place in conjunction with Congress.
Conclusion
24
Assessing budget gimmickry requires a framework to identify practices that either deliberately or
inadvertently obscure the cost of policy choices to both policy makers and voters. In this assessment,
the term “budget gimmickry” reveals it is insufficient to describe all of the factors that contribute to a
clouded fiscal picture.
Fiscal evasion is instead used to capture both the practices that depart from either an established rule or
problems inherent in the rules themselves, in order to systematically identify practices that create a
clouded budgetary picture. These practices may encourage fiscal illusion by relying on debt and
intergovernmental aid to finance increased spending, or they may employ accounting gimmickry and
inaccurate definitions in order to present a particular budgetary picture.
In decrying gimmickry, the implication on the part of budget watchdogs is that governments are
budgeting in a way that departs from a norm, a rule, or expectations. But interestingly, many of the
tactics labeled gimmicks do not necessarily violate an established rule but flow from the established
framework, a terrain that includes budget rules and the relationship among governments in a federalist
system. The manipulation of a tax rebate program qualifies as a budgetary sleight-of-hand, yet, it is also
a fiscal repercussion of a revenue-replacement scheme embedded in a state constitution, promoted as
policy. Issuing bonds to pay for current expenses can be classified as a one-shot revenue source, but the
practice is written into state rules, and more interestingly, has been used repeatedly to cover budget
shortfalls. The tactics used by states to present a balanced budget by concealing deficits prompts the
need for more research into how states have traded fiscal prudence for quick fixes over a period of
decades, by reliance on accounting maneuvers, fiscal illusion, and financial arbitrage.