Embed Size (px)
Citation preview
Working paper
Growth promotion through industrial strategies
Judith Fessehaie Reena das Nair Phumzile Ncube Simon Roberts
May 2015
International Growth Centre
Project code: 1-VCC-VZMB-VXXXX-41205
Growth promotion through industrial strategies
ZAMBIA
Final draft
May 2015
Authors:
Judith Fessehaie
Reena das Nair
Phumzile Ncube
Simon Roberts
Contents
Glossary ................................................................................................................. 4
1. Introduction ................................................................................................... 6
2. Industry trends .............................................................................................. 8
2.1 Trends at macro-level ................................................................................ 8
2.2 Manufacturing sub-sector performance ................................................... 10
2.3 Trade profile ............................................................................................. 13
3. Industrialisation opportunities in the agro-processing sector ....................... 22
3.1 Sugar ....................................................................................................... 28
3.2 Vegetables and milling products .............................................................. 32
3.3 Soybean to poultry value chain ................................................................ 37
4. Industrialisation opportunities in the engineering sector .............................. 45
4.1 Copper fabrication .................................................................................... 46
4.2 Iron and steel products ............................................................................ 50
4.3 Case study on manufacturing linkages to the mining sector .................... 53
5 Policy framework for industrial development .................................................. 62
6 Conclusions and further research ................................................................... 65
7 References ..................................................................................................... 72
List of Tables
Table 1: Zambia’s GDP, selected sectors and economic activities (ZMK million) ...... 8
Table 2: Zambia’s sector employment, by selected sub-sectors ................................ 9
Table 3: Zambia's selected NTEs (selected years, US$) ......................................... 18
Table 4: Zambia’s top 10 import products (US$) ...................................................... 21
Table 5: Share of final household consumption spent on food and beverages, by
income group (2010, %) ........................................................................................... 23
Table 6: Final household consumption spent on food and beverages, by income group
and areas (2010, US$ million) .................................................................................. 23
Table 7: Urban population growth (annual %) .......................................................... 24
Table 8: Trade balance, by product (2013, US$) ..................................................... 25
Table 9: Zambia's food imports (2013, US$) ............................................................ 26
Table 10: Zambia’s sugar exports – raw cane and molasses, by export destination
(2013, US$ million) ................................................................................................... 29
Table 11: Zambia’s exports of copper semi-fabricates, by destination (2013, US$
million) ...................................................................................................................... 47
Table 12: Categories of respondents, June - October 2014 ..................................... 53
Table 13: Estimated composition of Zambia's mining procurement expenditure, 2012
(US$ ‘000 and %) ..................................................................................................... 54
Table 14: Linkages between South Africa-based OEMs and Zambia ...................... 61
List of Figures
Figure 1: Zambia’s inward FDI stock (1990-2012, US$ millions) .............................. 10
Figure 2: Industrial index, manufacturing sub-sectors (2001 – 2013) ....................... 11
Figure 3: Zambia’s trade flows (US$ millions, 1995-2013) ....................................... 14
Figure 4: Zambia’s NTEs (1997-2012, US$ million) ................................................. 15
Figure 5: Zambia’s total export, by destination market (selected years, US$ billion) 16
Figure 6: Zambia’s exports to the region .................................................................. 16
Figure 7: Zambia’s trade balance for food products (US$ million) ............................ 25
Figure 8: Retail sugar prices in selected countries (2013) ........................................ 31
Figure 9: Zambia’s trade balance for fresh vegetables and milling industry, US$ million
................................................................................................................................. 32
Figure 10: Zambia’s exports of animal fodder (US$ million) ..................................... 38
Figure 11: Zambia’s exports of animal fodder, by export destination (2013, US$ million)
................................................................................................................................. 38
Figure 12: Production of broilers (commercial) ......................................................... 40
Figure 13: Production of poultry feed ....................................................................... 41
Figure 14: Zambia’s exports of steel and iron engineering products (1995-2013, US$
million) ...................................................................................................................... 52
Figure 15: South Africa’s capital equipment exports to the world and Zambia, 2005-
2012 ......................................................................................................................... 56
Figure 16: Comparative rating of supplier capabilities by buyers and by suppliers .. 57
Glossary
AMSA ArcelorMittal South Africa
BOZ Bank of Zambia
CAGR Compound Annual Growth Rate
CAPEX Capital expenditures
CCRED Centre for Competition, Regulation and Economic Development
CEEC Citizens Economic Empowerment Commission
CMZ Chamber of Mines of Zambia
COMESA Common Market for Eastern and Southern Africa
CSO Central Statistical Office
CTI Policy Commercial, Trade and Industrial Policy
DRC Democratic Republic of Congo
DRI Directly Reduced Iron
EU European Union
FDI Foreign Direct Investment
GDP Gross Domestic Product
HACCP Hazard Analysis & Critical Control Points
ICMM International Council on Mining and Metals
IGC International Growth Centre
JICA Japan International Cooperation Agency
MCTI Ministry of Commerce, Trade and Industry
MFEZ Multi-Facility Economic Zone
MSMEs Micro, Small, and Medium Enterprises
NTEs Non-traditional exports
OECD Organisation for Economic Co-operation and Development
OEM Original Equipment Manufacturer
PSDRP Private Sector Development Reform Programme
SADC Southern Africa Development Community
SNDP Sixth National Development Plan
TCO Total Cost of Ownership
TEVET Technical Education, Vocational and Entrepreneurship Training
UMCIL Universal Mining and Chemical Industries Limited
UN ISIC United National International Standard Industrial Classification
UNZA University of Zambia
ZABS Zambia Bureau of Standards
ZACCI Zambian Chamber of Commerce and Industry
ZAM Zambia Association of Manufacturers
ZAMEFA Metal Fabricators of Zambia Limited
ZAMTEL Zambia Tele
ZCCZ Chambishi Zambia-China Economic and Trade Cooperation Zone
ZDA Zambia Development Agency
ZDA Zambia Development Agency
ZEGA Zambia Export Growers Association
ZESCO Zambia Electricity Supply Corporation Limited
ZMLCI Zambia Mining Local Content Initiative
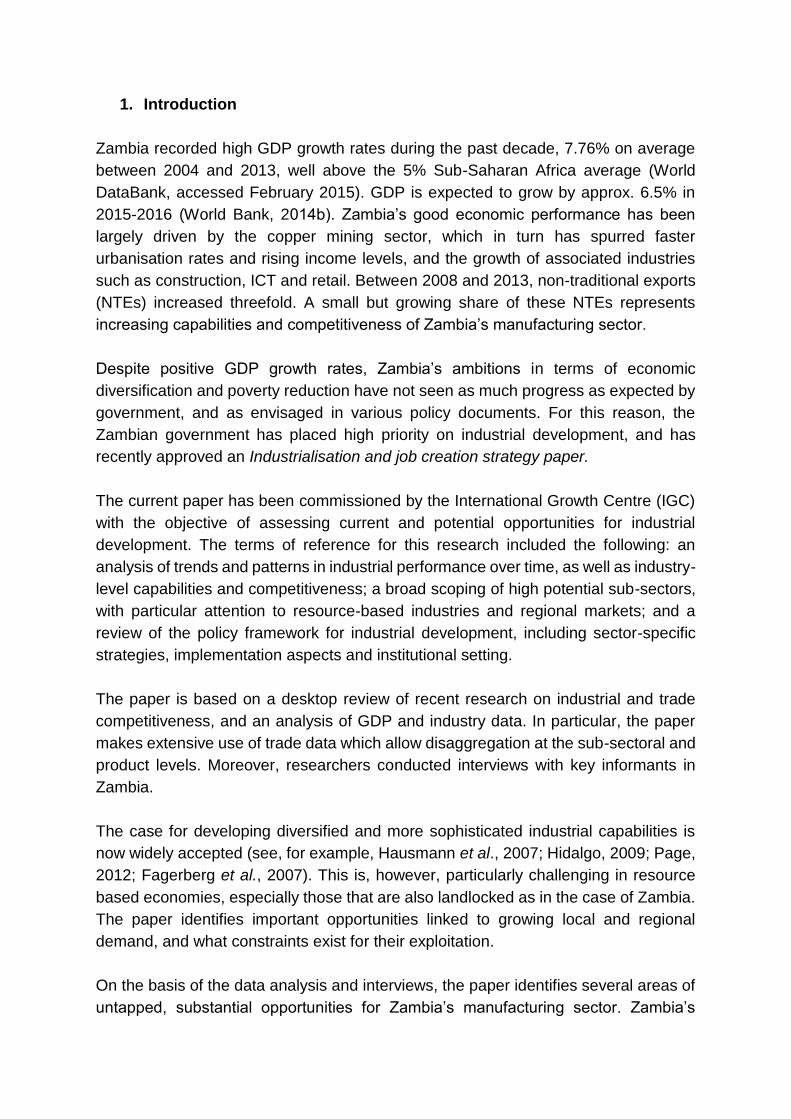
1. Introduction
Zambia recorded high GDP growth rates during the past decade, 7.76% on average
between 2004 and 2013, well above the 5% Sub-Saharan Africa average (World
DataBank, accessed February 2015). GDP is expected to grow by approx. 6.5% in
2015-2016 (World Bank, 2014b). Zambia’s good economic performance has been
largely driven by the copper mining sector, which in turn has spurred faster
urbanisation rates and rising income levels, and the growth of associated industries
such as construction, ICT and retail. Between 2008 and 2013, non-traditional exports
(NTEs) increased threefold. A small but growing share of these NTEs represents
increasing capabilities and competitiveness of Zambia’s manufacturing sector.
Despite positive GDP growth rates, Zambia’s ambitions in terms of economic
diversification and poverty reduction have not seen as much progress as expected by
government, and as envisaged in various policy documents. For this reason, the
Zambian government has placed high priority on industrial development, and has
recently approved an Industrialisation and job creation strategy paper.
The current paper has been commissioned by the International Growth Centre (IGC)
with the objective of assessing current and potential opportunities for industrial
development. The terms of reference for this research included the following: an
analysis of trends and patterns in industrial performance over time, as well as industry-
level capabilities and competitiveness; a broad scoping of high potential sub-sectors,
with particular attention to resource-based industries and regional markets; and a
review of the policy framework for industrial development, including sector-specific
strategies, implementation aspects and institutional setting.
The paper is based on a desktop review of recent research on industrial and trade
competitiveness, and an analysis of GDP and industry data. In particular, the paper
makes extensive use of trade data which allow disaggregation at the sub-sectoral and
product levels. Moreover, researchers conducted interviews with key informants in
Zambia.
The case for developing diversified and more sophisticated industrial capabilities is
now widely accepted (see, for example, Hausmann et al., 2007; Hidalgo, 2009; Page,
2012; Fagerberg et al., 2007). This is, however, particularly challenging in resource
based economies, especially those that are also landlocked as in the case of Zambia.
The paper identifies important opportunities linked to growing local and regional
demand, and what constraints exist for their exploitation.
On the basis of the data analysis and interviews, the paper identifies several areas of
untapped, substantial opportunities for Zambia’s manufacturing sector. Zambia’s
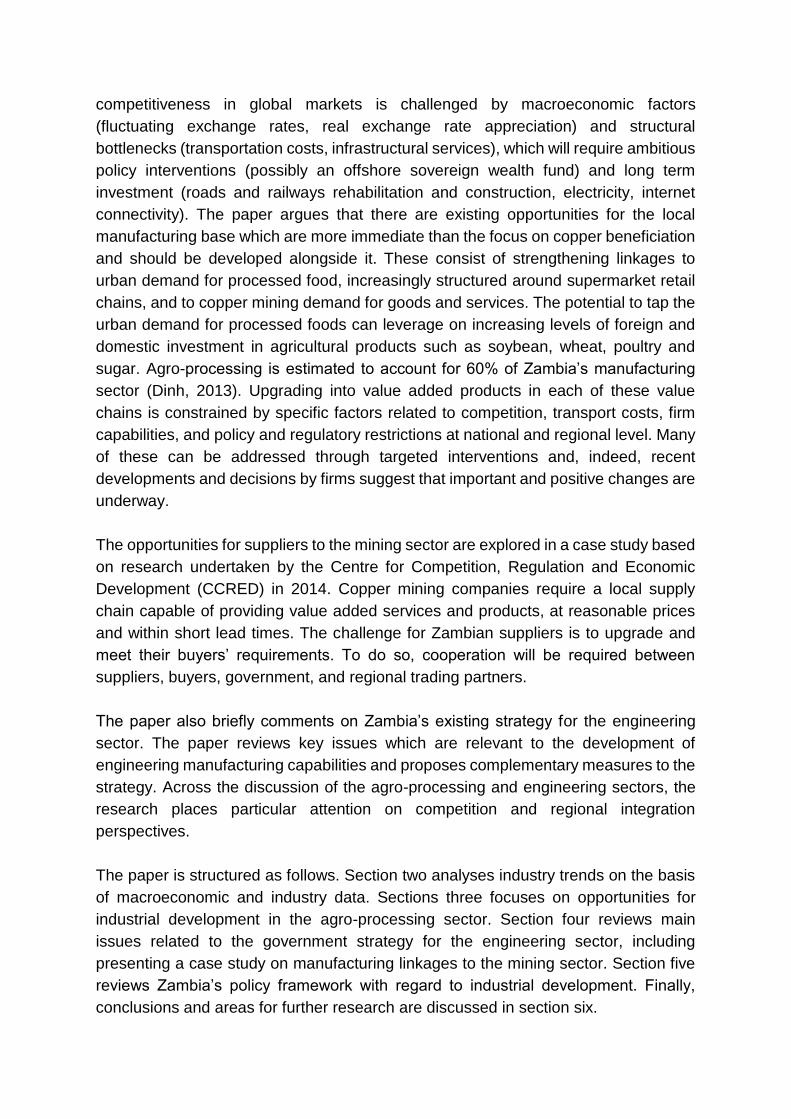
competitiveness in global markets is challenged by macroeconomic factors
(fluctuating exchange rates, real exchange rate appreciation) and structural
bottlenecks (transportation costs, infrastructural services), which will require ambitious
policy interventions (possibly an offshore sovereign wealth fund) and long term
investment (roads and railways rehabilitation and construction, electricity, internet
connectivity). The paper argues that there are existing opportunities for the local
manufacturing base which are more immediate than the focus on copper beneficiation
and should be developed alongside it. These consist of strengthening linkages to
urban demand for processed food, increasingly structured around supermarket retail
chains, and to copper mining demand for goods and services. The potential to tap the
urban demand for processed foods can leverage on increasing levels of foreign and
domestic investment in agricultural products such as soybean, wheat, poultry and
sugar. Agro-processing is estimated to account for 60% of Zambia’s manufacturing
sector (Dinh, 2013). Upgrading into value added products in each of these value
chains is constrained by specific factors related to competition, transport costs, firm
capabilities, and policy and regulatory restrictions at national and regional level. Many
of these can be addressed through targeted interventions and, indeed, recent
developments and decisions by firms suggest that important and positive changes are
underway.
The opportunities for suppliers to the mining sector are explored in a case study based
on research undertaken by the Centre for Competition, Regulation and Economic
Development (CCRED) in 2014. Copper mining companies require a local supply
chain capable of providing value added services and products, at reasonable prices
and within short lead times. The challenge for Zambian suppliers is to upgrade and
meet their buyers’ requirements. To do so, cooperation will be required between
suppliers, buyers, government, and regional trading partners.
The paper also briefly comments on Zambia’s existing strategy for the engineering
sector. The paper reviews key issues which are relevant to the development of
engineering manufacturing capabilities and proposes complementary measures to the
strategy. Across the discussion of the agro-processing and engineering sectors, the
research places particular attention on competition and regional integration
perspectives.
The paper is structured as follows. Section two analyses industry trends on the basis
of macroeconomic and industry data. Sections three focuses on opportunities for
industrial development in the agro-processing sector. Section four reviews main
issues related to the government strategy for the engineering sector, including
presenting a case study on manufacturing linkages to the mining sector. Section five
reviews Zambia’s policy framework with regard to industrial development. Finally,
conclusions and areas for further research are discussed in section six.
2. Industry trends
2.1 Trends at macro-level
According to Central Statistical Office (CSO) rebased GDP estimates, Zambia’s
economic growth during the last decade has been driven by the mining sector, and
commercial and government services (Table 1). Between 2000 and 2013, construction
slowed down in 2008-2010, but has picked up again since 2011, which is consistent
with the cyclical nature of the sector. Transport and communication grew unabated,
driven by stepped-up spending in infrastructure and rising urban incomes (World
Bank, 2014b). In absolute terms, in 2013, the largest contributors to GDP were
distribution (17.8%), government (15.7%), construction (12.4%), mining (10.4%), and
agriculture (8.7%). Agriculture has nevertheless shown the worst performance out of
all the sub-sectors.
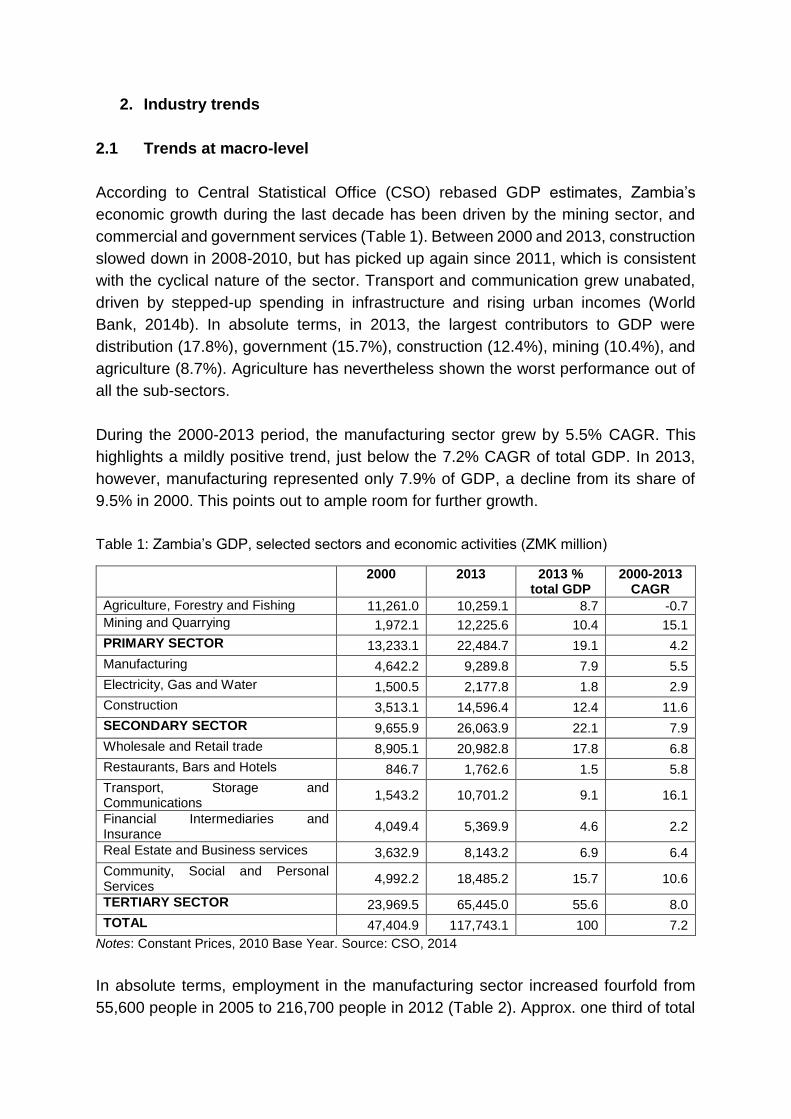
During the 2000-2013 period, the manufacturing sector grew by 5.5% CAGR. This
highlights a mildly positive trend, just below the 7.2% CAGR of total GDP. In 2013,
however, manufacturing represented only 7.9% of GDP, a decline from its share of
9.5% in 2000. This points out to ample room for further growth.
Table 1: Zambia’s GDP, selected sectors and economic activities (ZMK million)
2000 2013 2013 % total GDP
2000-2013 CAGR
Agriculture, Forestry and Fishing 11,261.0 10,259.1 8.7 -0.7
Mining and Quarrying 1,972.1 12,225.6 10.4 15.1
PRIMARY SECTOR 13,233.1 22,484.7 19.1 4.2
Manufacturing 4,642.2 9,289.8 7.9 5.5
Electricity, Gas and Water 1,500.5 2,177.8 1.8 2.9
Construction 3,513.1 14,596.4 12.4 11.6
SECONDARY SECTOR 9,655.9 26,063.9 22.1 7.9
Wholesale and Retail trade 8,905.1 20,982.8 17.8 6.8
Restaurants, Bars and Hotels 846.7 1,762.6 1.5 5.8
Transport, Storage and Communications
1,543.2 10,701.2 9.1 16.1
Financial Intermediaries and Insurance
4,049.4 5,369.9 4.6 2.2
Real Estate and Business services 3,632.9 8,143.2 6.9 6.4
Community, Social and Personal Services
4,992.2 18,485.2 15.7 10.6
TERTIARY SECTOR 23,969.5 65,445.0 55.6 8.0
TOTAL 47,404.9 117,743.1 100 7.2
Notes: Constant Prices, 2010 Base Year. Source: CSO, 2014
In absolute terms, employment in the manufacturing sector increased fourfold from
55,600 people in 2005 to 216,700 people in 2012 (Table 2). Approx. one third of total
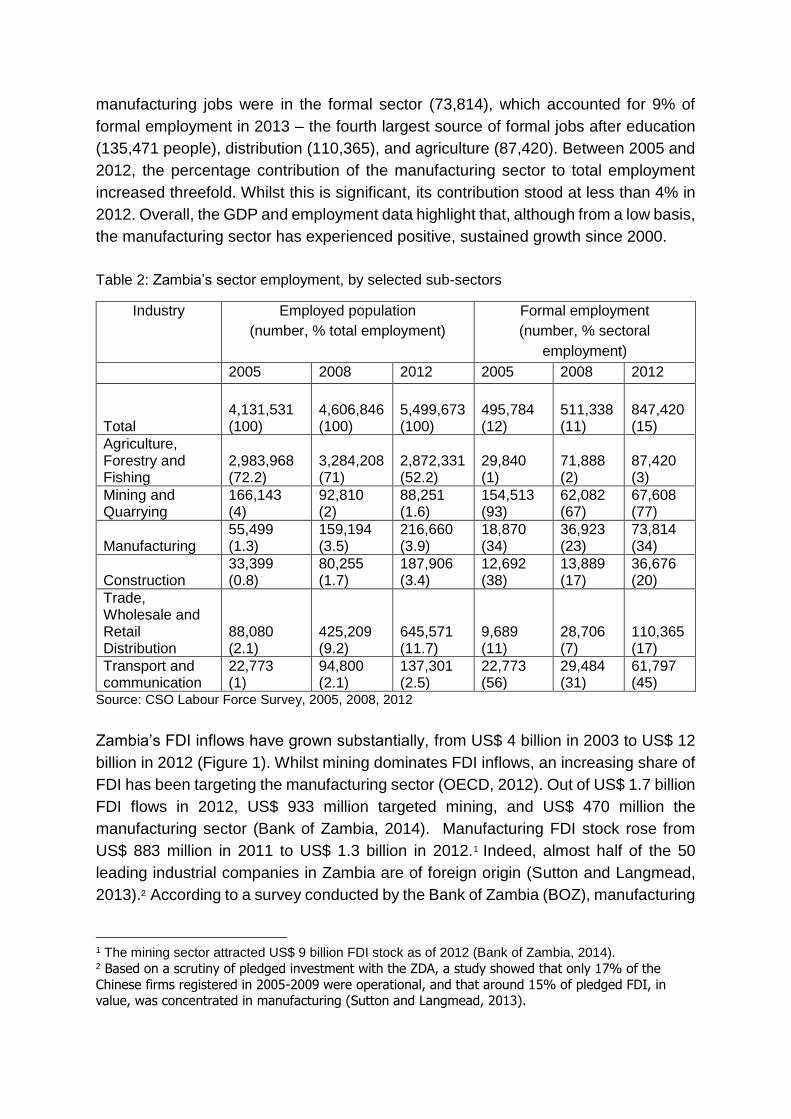
manufacturing jobs were in the formal sector (73,814), which accounted for 9% of
formal employment in 2013 – the fourth largest source of formal jobs after education
(135,471 people), distribution (110,365), and agriculture (87,420). Between 2005 and
2012, the percentage contribution of the manufacturing sector to total employment
increased threefold. Whilst this is significant, its contribution stood at less than 4% in
2012. Overall, the GDP and employment data highlight that, although from a low basis,
the manufacturing sector has experienced positive, sustained growth since 2000.
Table 2: Zambia’s sector employment, by selected sub-sectors
Industry Employed population
(number, % total employment)
Formal employment
(number, % sectoral
employment)
2005 2008 2012 2005 2008 2012
Total 4,131,531 (100)
4,606,846 (100)
5,499,673 (100)
495,784 (12)
511,338 (11)
847,420 (15)
Agriculture, Forestry and Fishing
2,983,968 (72.2)
3,284,208 (71)
2,872,331 (52.2)
29,840 (1)
71,888 (2)
87,420 (3)
Mining and Quarrying
166,143 (4)
92,810 (2)
88,251 (1.6)
154,513 (93)
62,082 (67)
67,608 (77)
Manufacturing 55,499 (1.3)
159,194 (3.5)
216,660 (3.9)
18,870 (34)
36,923 (23)
73,814 (34)
Construction 33,399 (0.8)
80,255 (1.7)
187,906 (3.4)
12,692 (38)
13,889 (17)
36,676 (20)
Trade, Wholesale and Retail Distribution
88,080 (2.1)
425,209 (9.2)
645,571 (11.7)
9,689 (11)
28,706 (7)
110,365 (17)
Transport and communication
22,773 (1)
94,800 (2.1)
137,301 (2.5)
22,773 (56)
29,484 (31)
61,797 (45)
Source: CSO Labour Force Survey, 2005, 2008, 2012
Zambia’s FDI inflows have grown substantially, from US$ 4 billion in 2003 to US$ 12
billion in 2012 (Figure 1). Whilst mining dominates FDI inflows, an increasing share of
FDI has been targeting the manufacturing sector (OECD, 2012). Out of US$ 1.7 billion
FDI flows in 2012, US$ 933 million targeted mining, and US$ 470 million the
manufacturing sector (Bank of Zambia, 2014). Manufacturing FDI stock rose from
US$ 883 million in 2011 to US$ 1.3 billion in 2012.1 Indeed, almost half of the 50
leading industrial companies in Zambia are of foreign origin (Sutton and Langmead,
2013).2 According to a survey conducted by the Bank of Zambia (BOZ), manufacturing
1 The mining sector attracted US$ 9 billion FDI stock as of 2012 (Bank of Zambia, 2014). 2 Based on a scrutiny of pledged investment with the ZDA, a study showed that only 17% of the
Chinese firms registered in 2005-2009 were operational, and that around 15% of pledged FDI, in value, was concentrated in manufacturing (Sutton and Langmead, 2013).
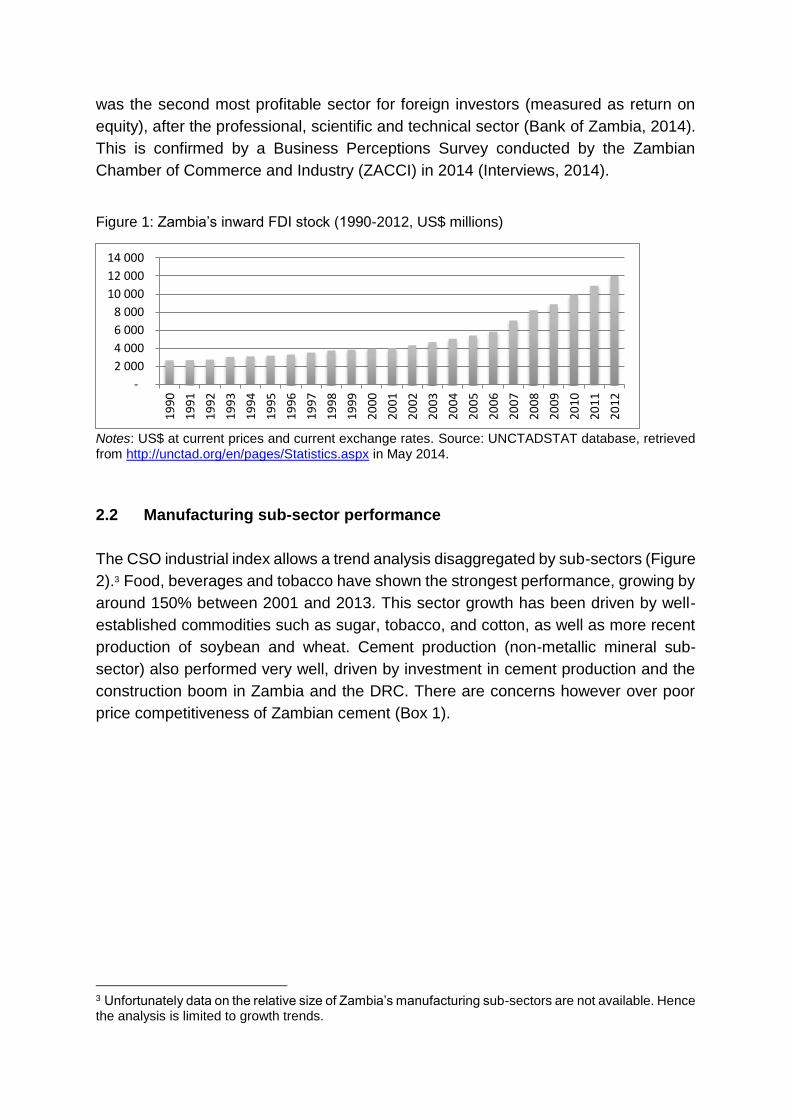
was the second most profitable sector for foreign investors (measured as return on
equity), after the professional, scientific and technical sector (Bank of Zambia, 2014).
This is confirmed by a Business Perceptions Survey conducted by the Zambian
Chamber of Commerce and Industry (ZACCI) in 2014 (Interviews, 2014).
Figure 1: Zambia’s inward FDI stock (1990-2012, US$ millions)
Notes: US$ at current prices and current exchange rates. Source: UNCTADSTAT database, retrieved from http://unctad.org/en/pages/Statistics.aspx in May 2014.
2.2 Manufacturing sub-sector performance
The CSO industrial index allows a trend analysis disaggregated by sub-sectors (Figure
2).3 Food, beverages and tobacco have shown the strongest performance, growing by
around 150% between 2001 and 2013. This sector growth has been driven by well-
established commodities such as sugar, tobacco, and cotton, as well as more recent
production of soybean and wheat. Cement production (non-metallic mineral sub-
sector) also performed very well, driven by investment in cement production and the
construction boom in Zambia and the DRC. There are concerns however over poor
price competitiveness of Zambian cement (Box 1).
3 Unfortunately data on the relative size of Zambia’s manufacturing sub-sectors are not available. Hence the analysis is limited to growth trends.
-
2 000
4 000
6 000
8 000
10 000
12 000
14 000
19
90
19
91
19
92
19
93
19
94
19
95
19
96
19
97
19
98
19
99
20
00
20
01
20
02
20
03
20
04
20
05
20
06
20
07
20
08
20
09
20
10
20
11
20
12
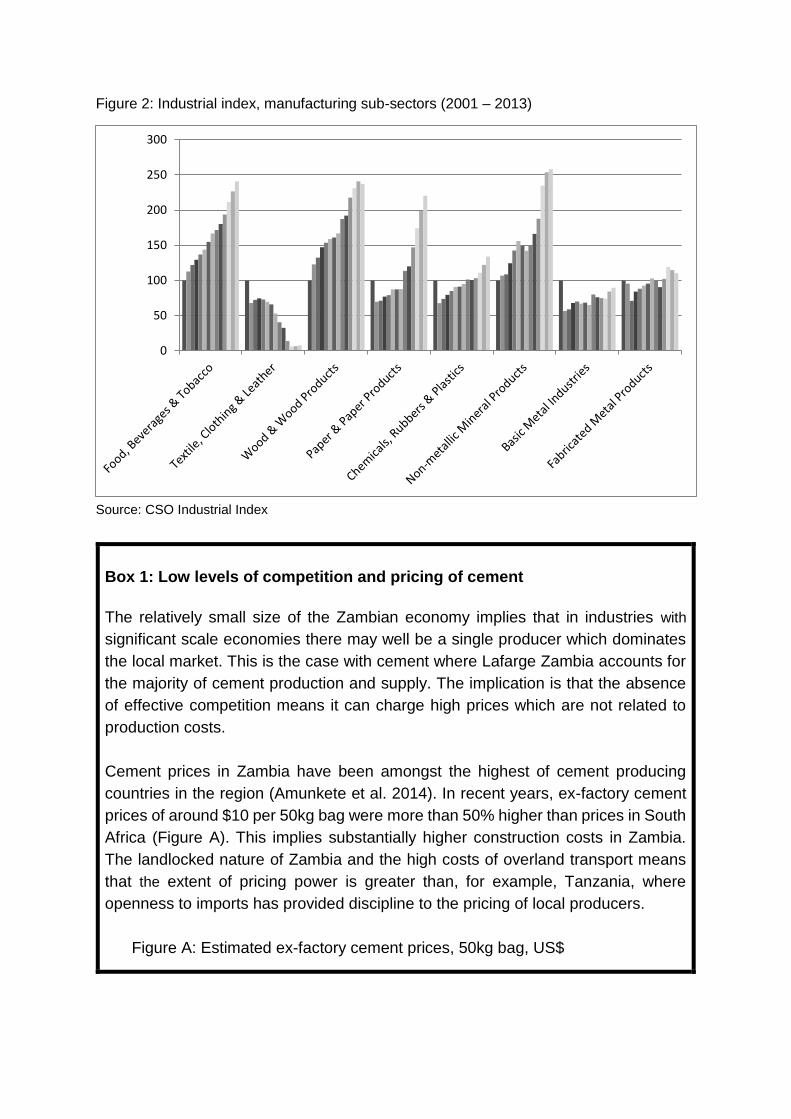
Figure 2: Industrial index, manufacturing sub-sectors (2001 – 2013)
Source: CSO Industrial Index
Box 1: Low levels of competition and pricing of cement
The relatively small size of the Zambian economy implies that in industries with
significant scale economies there may well be a single producer which dominates
the local market. This is the case with cement where Lafarge Zambia accounts for
the majority of cement production and supply. The implication is that the absence
of effective competition means it can charge high prices which are not related to
production costs.
Cement prices in Zambia have been amongst the highest of cement producing
countries in the region (Amunkete et al. 2014). In recent years, ex-factory cement
prices of around $10 per 50kg bag were more than 50% higher than prices in South
Africa (Figure A). This implies substantially higher construction costs in Zambia.
The landlocked nature of Zambia and the high costs of overland transport means
that the extent of pricing power is greater than, for example, Tanzania, where
openness to imports has provided discipline to the pricing of local producers.
Figure A: Estimated ex-factory cement prices, 50kg bag, US$
0
50
100
150
200
250
300
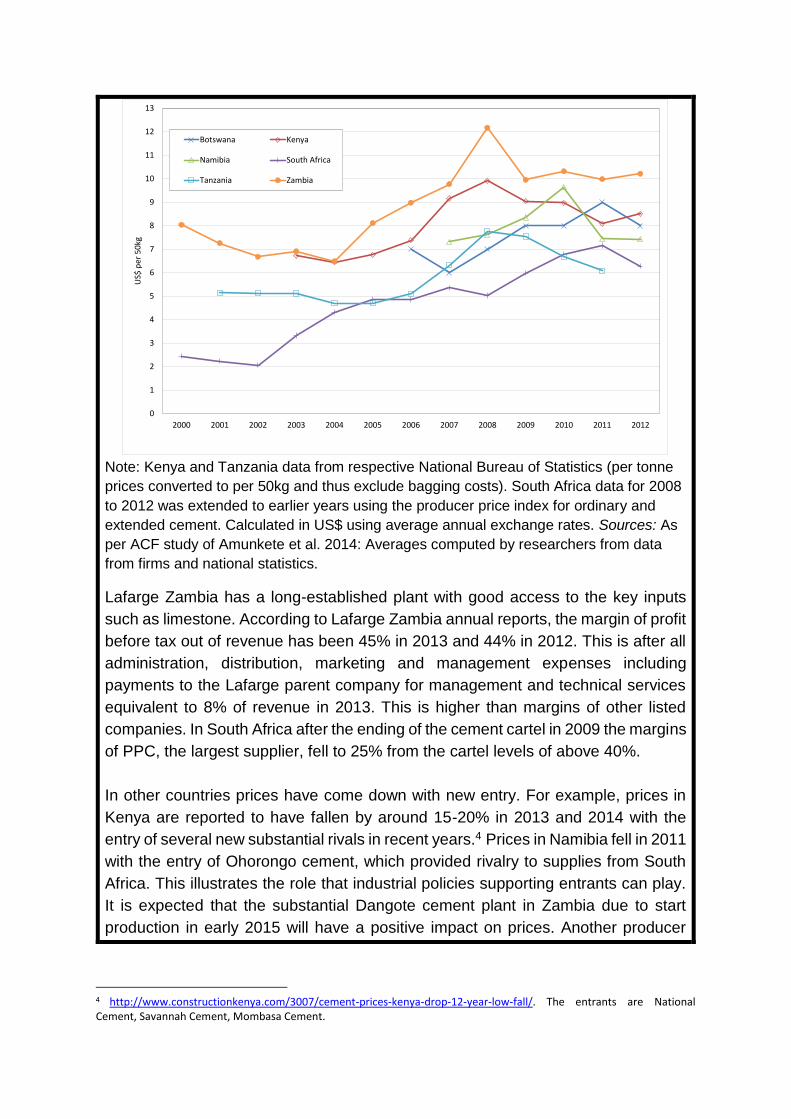
Note: Kenya and Tanzania data from respective National Bureau of Statistics (per tonne
prices converted to per 50kg and thus exclude bagging costs). South Africa data for 2008
to 2012 was extended to earlier years using the producer price index for ordinary and
extended cement. Calculated in US$ using average annual exchange rates. Sources: As
per ACF study of Amunkete et al. 2014: Averages computed by researchers from data
from firms and national statistics.
Lafarge Zambia has a long-established plant with good access to the key inputs
such as limestone. According to Lafarge Zambia annual reports, the margin of profit
before tax out of revenue has been 45% in 2013 and 44% in 2012. This is after all
administration, distribution, marketing and management expenses including
payments to the Lafarge parent company for management and technical services
equivalent to 8% of revenue in 2013. This is higher than margins of other listed
companies. In South Africa after the ending of the cement cartel in 2009 the margins
of PPC, the largest supplier, fell to 25% from the cartel levels of above 40%.
In other countries prices have come down with new entry. For example, prices in
Kenya are reported to have fallen by around 15-20% in 2013 and 2014 with the
entry of several new substantial rivals in recent years.4 Prices in Namibia fell in 2011
with the entry of Ohorongo cement, which provided rivalry to supplies from South
Africa. This illustrates the role that industrial policies supporting entrants can play.
It is expected that the substantial Dangote cement plant in Zambia due to start
production in early 2015 will have a positive impact on prices. Another producer
4 http://www.constructionkenya.com/3007/cement-prices-kenya-drop-12-year-low-fall/. The entrants are National Cement, Savannah Cement, Mombasa Cement.
0
1
2
3
4
5
6
7
8
9
10
11
12
13
2000 2001 2002 2003 2004 2005 2006 2007 2008 2009 2010 2011 2012
US$
per
50
kgBotswana Kenya
Namibia South Africa
Tanzania Zambia
(Amaka Cement) has also announced plans for construction of a new plant in
Lusaka to come on-stream in 2017.
The wood industry, in heavy decline since the 1990s, has performed better since the
mid-2000s. Its performance is largely driven by the construction boom in the domestic
market (70% of output, mainly sawnwood) and in the DRC (Dinh, 2013). With a labour
force of 47,000 people, the wood industry is a more important source of employment
than copper and steel fabrication put together. Despite this and the presence of a small
number of dynamic exporters of value added products, the perspective for the industry
is weak, given low labour productivity and capacity utilization constraints, high wood
price, low levels of investment, and a largely informal structure. The paper industry
has also been performing better since the late 2000s. This industry has been mainly
focused on the domestic market for tissue paper, paper serviettes, exercise books,
polythene products and PET packaging (Sutton and Langmead, 2013). It is however
import-intensive, relying on South Africa, China, Europe and India for raw materials
and intermediate products. In terms of value added, both wood and paper industries
are likely to be small.
The basic metal industry has performed relatively poorly, reflecting absence of a steel-
making industry. The fabricated metals sub-sector has shown some growth, although
from a low basis, thanks to a growing number of copper and steel fabricators, the latter
driven by the construction boom. The industry saw the entry of around 10 new firms
in recent years (Interviews, 2014). Already on a declining trajectory since the 1990s,
the textile and clothing has collapsed during the past decade.
From this analysis, two sub-sectors emerge as having particularly high potential: food,
beverages and tobacco, and metal fabrication. Cement had a very strong growth but
has limited potential for further downstream processing and industrial development.
Turning to Zambia’s export performance confirms that these two sub-sectors had, to
different degrees, shown considerable level of dynamism and international
competitiveness in recent years.
2.3 Trade profile
Exports
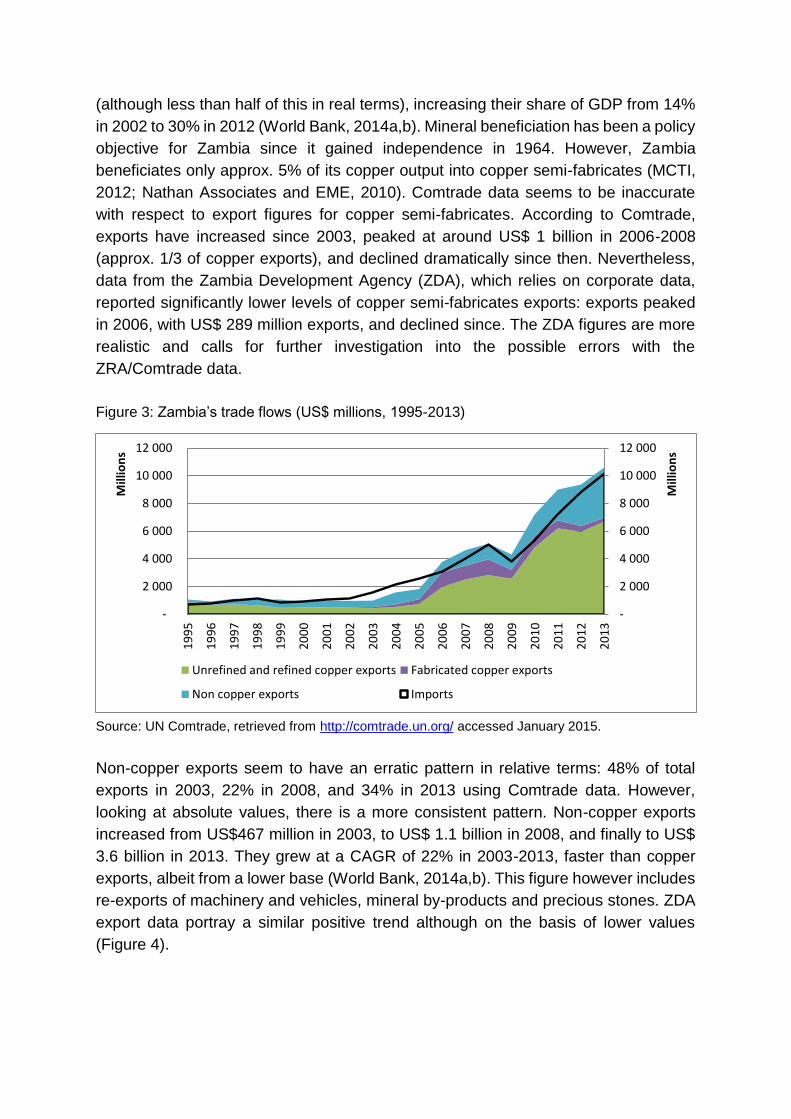
From the early 2000s, Zambia’s export performance improved significantly, driven by
copper exports. Indeed, from 2006 onwards, Zambia has achieved a significant net
trade surplus (Figure 3). Between 2003 and 2013, copper exports averaged 70% of
total exports. Copper exports grew by 29% on average per year in 2002-2012
(although less than half of this in real terms), increasing their share of GDP from 14%
in 2002 to 30% in 2012 (World Bank, 2014a,b). Mineral beneficiation has been a policy
objective for Zambia since it gained independence in 1964. However, Zambia
beneficiates only approx. 5% of its copper output into copper semi-fabricates (MCTI,
2012; Nathan Associates and EME, 2010). Comtrade data seems to be inaccurate
with respect to export figures for copper semi-fabricates. According to Comtrade,
exports have increased since 2003, peaked at around US$ 1 billion in 2006-2008
(approx. 1/3 of copper exports), and declined dramatically since then. Nevertheless,
data from the Zambia Development Agency (ZDA), which relies on corporate data,
reported significantly lower levels of copper semi-fabricates exports: exports peaked
in 2006, with US$ 289 million exports, and declined since. The ZDA figures are more
realistic and calls for further investigation into the possible errors with the
ZRA/Comtrade data.
Figure 3: Zambia’s trade flows (US$ millions, 1995-2013)
Source: UN Comtrade, retrieved from http://comtrade.un.org/ accessed January 2015.
Non-copper exports seem to have an erratic pattern in relative terms: 48% of total
exports in 2003, 22% in 2008, and 34% in 2013 using Comtrade data. However,
looking at absolute values, there is a more consistent pattern. Non-copper exports
increased from US$467 million in 2003, to US$ 1.1 billion in 2008, and finally to US$
3.6 billion in 2013. They grew at a CAGR of 22% in 2003-2013, faster than copper
exports, albeit from a lower base (World Bank, 2014a,b). This figure however includes
re-exports of machinery and vehicles, mineral by-products and precious stones. ZDA
export data portray a similar positive trend although on the basis of lower values
(Figure 4).
-
2 000
4 000
6 000
8 000
10 000
12 000
-
2 000
4 000
6 000
8 000
10 000
12 000
19
95
19
96
19
97
19
98
19
99
20
00
20
01
20
02
20
03
20
04
20
05
20
06
20
07
20
08
20
09
20
10
20
11
20
12
20
13
Mill
ion
s
Mill
ion
s
Unrefined and refined copper exports Fabricated copper exports
Non copper exports Imports
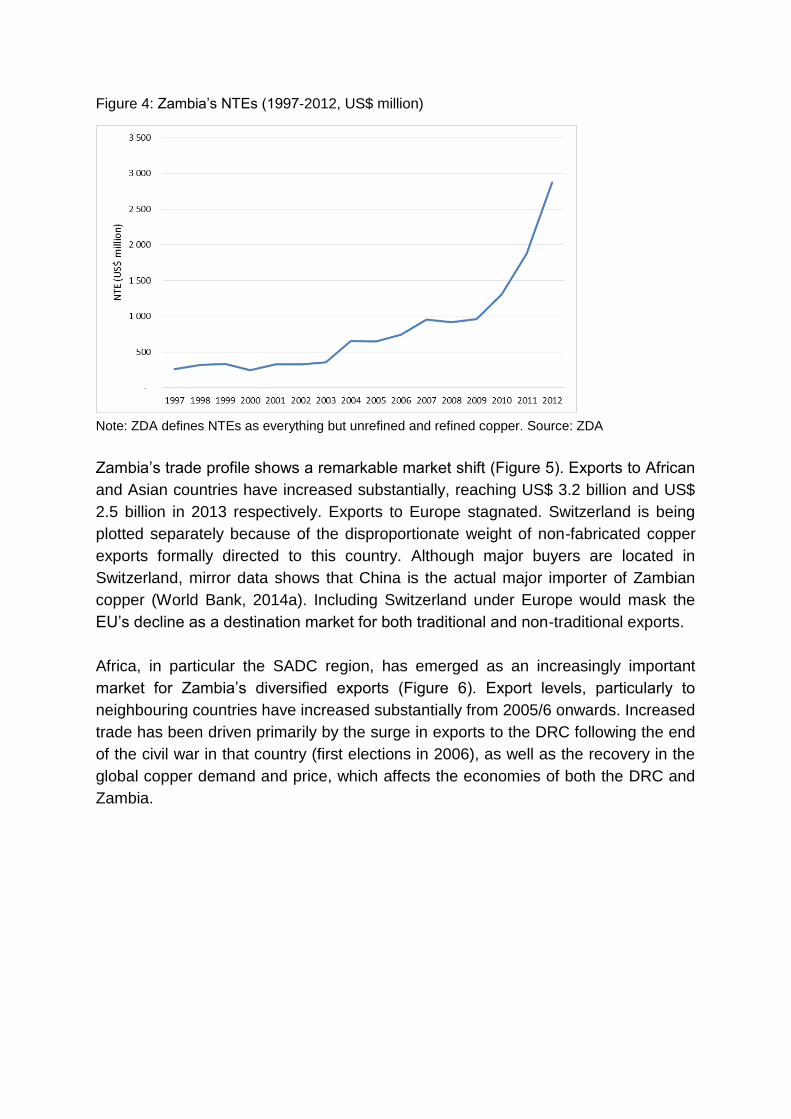
Figure 4: Zambia’s NTEs (1997-2012, US$ million)
Note: ZDA defines NTEs as everything but unrefined and refined copper. Source: ZDA
Zambia’s trade profile shows a remarkable market shift (Figure 5). Exports to African
and Asian countries have increased substantially, reaching US$ 3.2 billion and US$
2.5 billion in 2013 respectively. Exports to Europe stagnated. Switzerland is being
plotted separately because of the disproportionate weight of non-fabricated copper
exports formally directed to this country. Although major buyers are located in
Switzerland, mirror data shows that China is the actual major importer of Zambian
copper (World Bank, 2014a). Including Switzerland under Europe would mask the
EU’s decline as a destination market for both traditional and non-traditional exports.
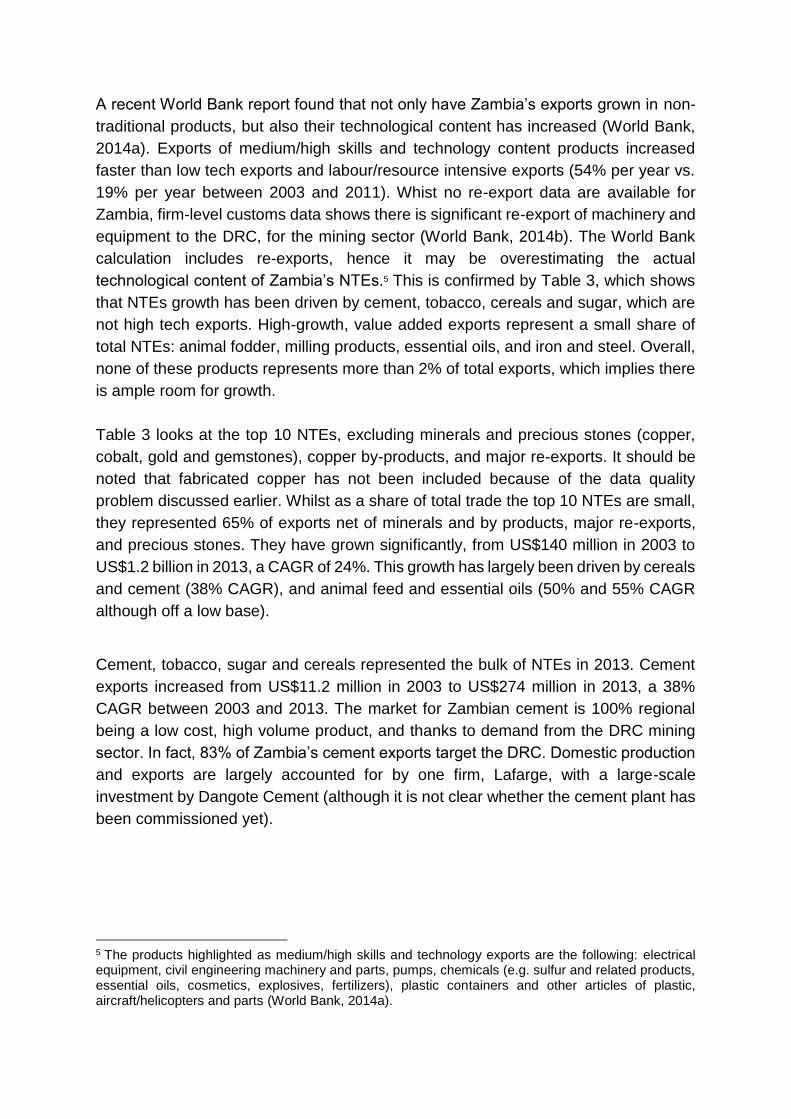
Africa, in particular the SADC region, has emerged as an increasingly important
market for Zambia’s diversified exports (Figure 6). Export levels, particularly to
neighbouring countries have increased substantially from 2005/6 onwards. Increased
trade has been driven primarily by the surge in exports to the DRC following the end
of the civil war in that country (first elections in 2006), as well as the recovery in the
global copper demand and price, which affects the economies of both the DRC and
Zambia.
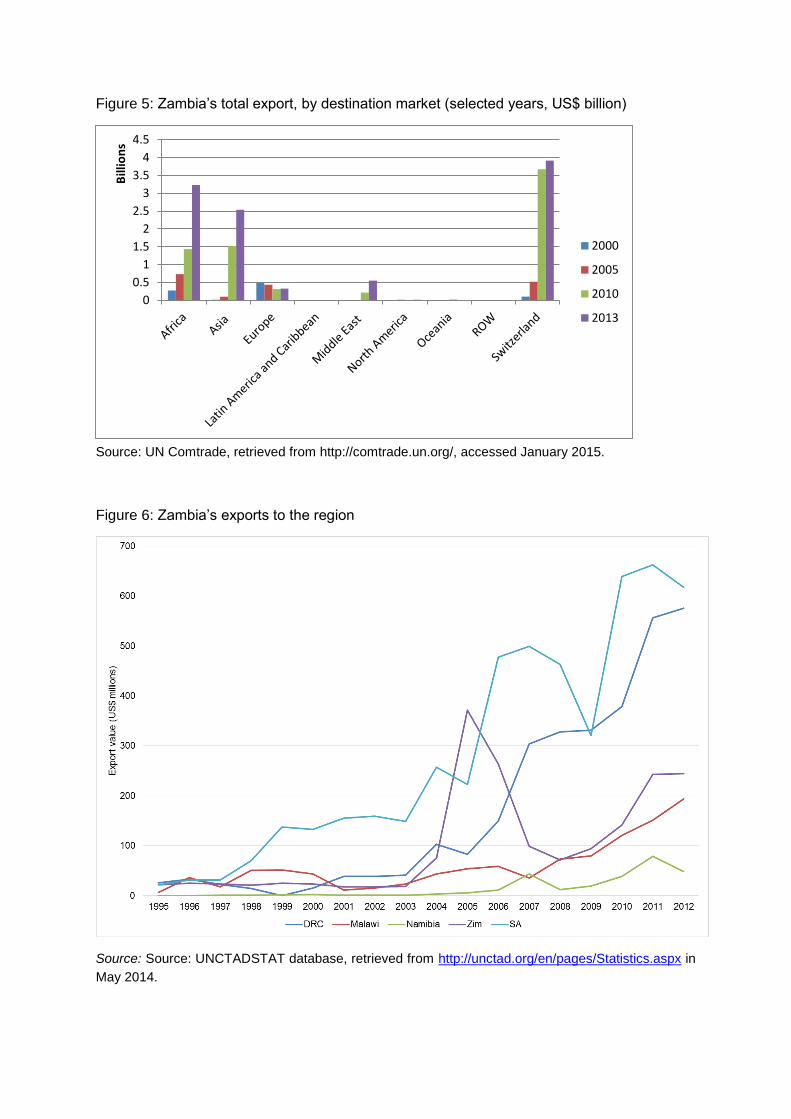
Figure 5: Zambia’s total export, by destination market (selected years, US$ billion)
Source: UN Comtrade, retrieved from http://comtrade.un.org/, accessed January 2015.
Figure 6: Zambia’s exports to the region
Source: Source: UNCTADSTAT database, retrieved from http://unctad.org/en/pages/Statistics.aspx in
May 2014.
0
0.5
1
1.5
2
2.5
3
3.5
4
4.5
Bill
ion
s
2000
2005
2010
2013
A recent World Bank report found that not only have Zambia’s exports grown in non-
traditional products, but also their technological content has increased (World Bank,
2014a). Exports of medium/high skills and technology content products increased
faster than low tech exports and labour/resource intensive exports (54% per year vs.
19% per year between 2003 and 2011). Whist no re-export data are available for
Zambia, firm-level customs data shows there is significant re-export of machinery and
equipment to the DRC, for the mining sector (World Bank, 2014b). The World Bank
calculation includes re-exports, hence it may be overestimating the actual
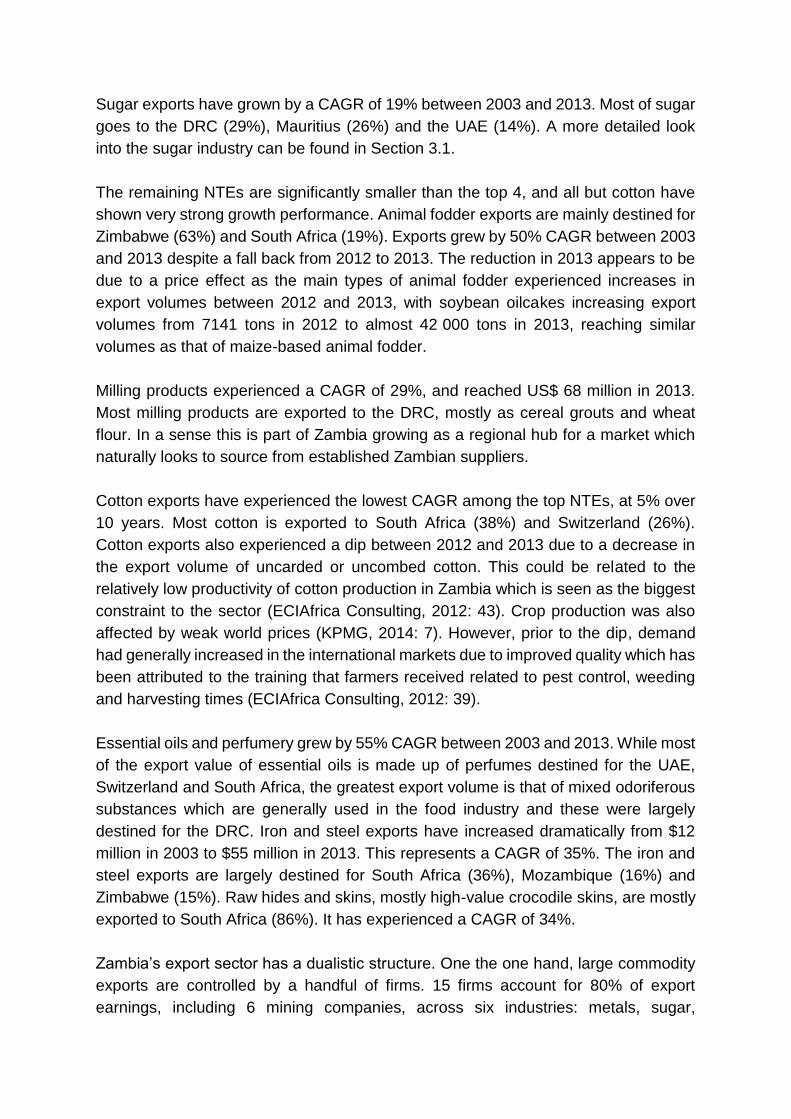
technological content of Zambia’s NTEs.5 This is confirmed by Table 3, which shows
that NTEs growth has been driven by cement, tobacco, cereals and sugar, which are
not high tech exports. High-growth, value added exports represent a small share of
total NTEs: animal fodder, milling products, essential oils, and iron and steel. Overall,
none of these products represents more than 2% of total exports, which implies there
is ample room for growth.
Table 3 looks at the top 10 NTEs, excluding minerals and precious stones (copper,
cobalt, gold and gemstones), copper by-products, and major re-exports. It should be
noted that fabricated copper has not been included because of the data quality
problem discussed earlier. Whilst as a share of total trade the top 10 NTEs are small,
they represented 65% of exports net of minerals and by products, major re-exports,
and precious stones. They have grown significantly, from US$140 million in 2003 to
US$1.2 billion in 2013, a CAGR of 24%. This growth has largely been driven by cereals
and cement (38% CAGR), and animal feed and essential oils (50% and 55% CAGR
although off a low base).
Cement, tobacco, sugar and cereals represented the bulk of NTEs in 2013. Cement
exports increased from US$11.2 million in 2003 to US$274 million in 2013, a 38%
CAGR between 2003 and 2013. The market for Zambian cement is 100% regional
being a low cost, high volume product, and thanks to demand from the DRC mining
sector. In fact, 83% of Zambia’s cement exports target the DRC. Domestic production
and exports are largely accounted for by one firm, Lafarge, with a large-scale
investment by Dangote Cement (although it is not clear whether the cement plant has
been commissioned yet).
5 The products highlighted as medium/high skills and technology exports are the following: electrical equipment, civil engineering machinery and parts, pumps, chemicals (e.g. sulfur and related products, essential oils, cosmetics, explosives, fertilizers), plastic containers and other articles of plastic, aircraft/helicopters and parts (World Bank, 2014a).
Table 3: Zambia's selected NTEs (selected years, US$ ‘000)
2003 2008 2012 2013
CAGR 2003-2013
Cement
11,239 33,738
120,979
274,232 38%
Tobacco and manufactured tobacco substitutes 22,318 71,893
156,797
216,948 26%
Sugars and sugar confectionery 33,289 64,276
143,576
188,910 19%
Cereals 6,678 51,411
419,761
161,686 38%
Cotton 53,830 39,081
132,488
85,598 5%
Animal fodder 1,365 4,962
131,737
80,732 50%
Milling products 5,261 33,268
36,122
68,217 29%
Essential oils; perfumery, cosmetic or toilet preparations 849 3,019
12,774
65,846 55%
Iron and steel 2,806 10,279
54,803
54,982 35%
Raw hides and skins (other than furskins) and leather 2,693 5,898
6,582
50,052 34%
Total 140,330 311,928 1,215,620 1,247,205
% total exports 14% 6% 13% 12%
% total exports minus copper and by products, gemstones and major re-exports 41% 37% 58% 65%
Note: Analysis at the HS2 level. Source: UN Comtrade, retrieved from http://comtrade.un.org/ accessed
January 2015.
Cereal exports have shown very good growth (38% between 2003 and 2013). They
are composed of wheat (31% of cereal exports in 2013), maize (24%) and rice (15%).
The bulk of exports are destined for Zimbabwe (46%), Malawi (30%) and Tanzania
(10%). Most wheat is exported to Zimbabwe. There has been a dip in export values
between 2012 and 2013 from $420 million to $160 million. This was largely due to a
massive drop in the export volumes of maize from over 725 000mt in 2012 to just
under 174 000mt in 2013. This was due to a regulatory intervention from the Food
Reserve Agency (FRA). From September 2012 to May 2014, the FRA assumed
complete control of maize exports by becoming the only legal Zambian exporter of
maize grain through government-to-government deals (World Bank, 2014b). Export
and price controls caused many commercial farmers to move away from maize
production, if not for on-farm consumption. Maize production has become increasingly
reliant on rain-fed production in smallholder farms.
Tobacco is a very well-established export industry, which has experienced positive
growth since the 1990s, but has not been exported with much local value addition. It
has a global market, for example in 2013, one third was exported to Malawi for
marketing, and the rest to China, UAE, Zimbabwe and Europe. Exports grew by a 26%
CAGR between 2003 and 2013.
Sugar exports have grown by a CAGR of 19% between 2003 and 2013. Most of sugar
goes to the DRC (29%), Mauritius (26%) and the UAE (14%). A more detailed look
into the sugar industry can be found in Section 3.1.
The remaining NTEs are significantly smaller than the top 4, and all but cotton have
shown very strong growth performance. Animal fodder exports are mainly destined for
Zimbabwe (63%) and South Africa (19%). Exports grew by 50% CAGR between 2003
and 2013 despite a fall back from 2012 to 2013. The reduction in 2013 appears to be
due to a price effect as the main types of animal fodder experienced increases in
export volumes between 2012 and 2013, with soybean oilcakes increasing export
volumes from 7141 tons in 2012 to almost 42 000 tons in 2013, reaching similar
volumes as that of maize-based animal fodder.
Milling products experienced a CAGR of 29%, and reached US$ 68 million in 2013.
Most milling products are exported to the DRC, mostly as cereal grouts and wheat
flour. In a sense this is part of Zambia growing as a regional hub for a market which
naturally looks to source from established Zambian suppliers.
Cotton exports have experienced the lowest CAGR among the top NTEs, at 5% over
10 years. Most cotton is exported to South Africa (38%) and Switzerland (26%).
Cotton exports also experienced a dip between 2012 and 2013 due to a decrease in
the export volume of uncarded or uncombed cotton. This could be related to the
relatively low productivity of cotton production in Zambia which is seen as the biggest
constraint to the sector (ECIAfrica Consulting, 2012: 43). Crop production was also
affected by weak world prices (KPMG, 2014: 7). However, prior to the dip, demand
had generally increased in the international markets due to improved quality which has
been attributed to the training that farmers received related to pest control, weeding
and harvesting times (ECIAfrica Consulting, 2012: 39).
Essential oils and perfumery grew by 55% CAGR between 2003 and 2013. While most
of the export value of essential oils is made up of perfumes destined for the UAE,
Switzerland and South Africa, the greatest export volume is that of mixed odoriferous
substances which are generally used in the food industry and these were largely
destined for the DRC. Iron and steel exports have increased dramatically from $12
million in 2003 to $55 million in 2013. This represents a CAGR of 35%. The iron and
steel exports are largely destined for South Africa (36%), Mozambique (16%) and
Zimbabwe (15%). Raw hides and skins, mostly high-value crocodile skins, are mostly
exported to South Africa (86%). It has experienced a CAGR of 34%.
Zambia’s export sector has a dualistic structure. One the one hand, large commodity
exports are controlled by a handful of firms. 15 firms account for 80% of export
earnings, including 6 mining companies, across six industries: metals, sugar,
chemicals, cement, wire and cables, flour (Sutton and Langmead, 2013). On the other
hand, there is a large number of small firms trying to access the export market. Firm-
level customs data for 1999-2011 sheds some light on this group of exporters (Banda
and Simumba, 2013; World Bank, 2014b). The number of firms, products and markets
has increased considerably in the period under analysis. The number of exporting
firms increased from 232 in 1999 to 1,754 in 2011; their products increased four-fold;
their markets two-fold. Excluding the large established exporters discussed earlier,
80% of transactions were relatively small sized (less than US$ 0.5 million) and directed
at SSA markets. Re-exports of machinery, presumably for the mining sector, was the
most active sector of activity, in terms of number of firms and products. There are very
high rates of entry into exporting, but also extremely low levels of survival by
international standards: around half of the exporters did not survive after the first year,
and survival in the same product and destination market was very hard. The two top
constraints underlying the low survival rate have been exchange rate fluctuation, and
costly import of inputs (World Bank, 2014b).
Imports
We turn now to take a brief look at the imports data. During recent years, imports have
surged due to higher infrastructure spending and FDI inflows, which led to imports of
iron and steel, petroleum products, and capital goods (World Bank, 2014b). A similar
shift towards trade with the region as seen in the exports data (Figure 5) is seen in the
imports data. Apart from copper ore imports from the DRC and petrol from the Middle
East, South Africa is the main source of imports. China is increasing its market
presence in heavy and light manufactured goods (machinery, electrical equipment,
motor vehicles, metal/plastic products and textile products).
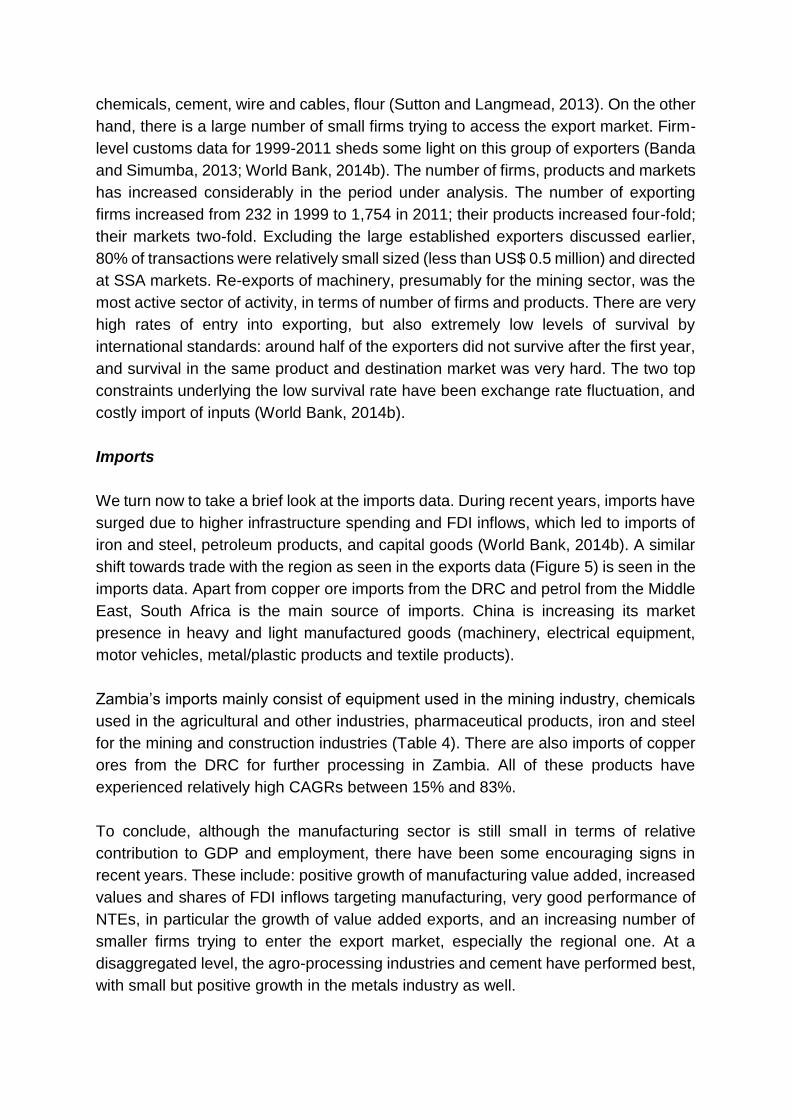
Zambia’s imports mainly consist of equipment used in the mining industry, chemicals
used in the agricultural and other industries, pharmaceutical products, iron and steel
for the mining and construction industries (Table 4). There are also imports of copper
ores from the DRC for further processing in Zambia. All of these products have
experienced relatively high CAGRs between 15% and 83%.
To conclude, although the manufacturing sector is still small in terms of relative
contribution to GDP and employment, there have been some encouraging signs in
recent years. These include: positive growth of manufacturing value added, increased
values and shares of FDI inflows targeting manufacturing, very good performance of
NTEs, in particular the growth of value added exports, and an increasing number of
smaller firms trying to enter the export market, especially the regional one. At a
disaggregated level, the agro-processing industries and cement have performed best,
with small but positive growth in the metals industry as well.
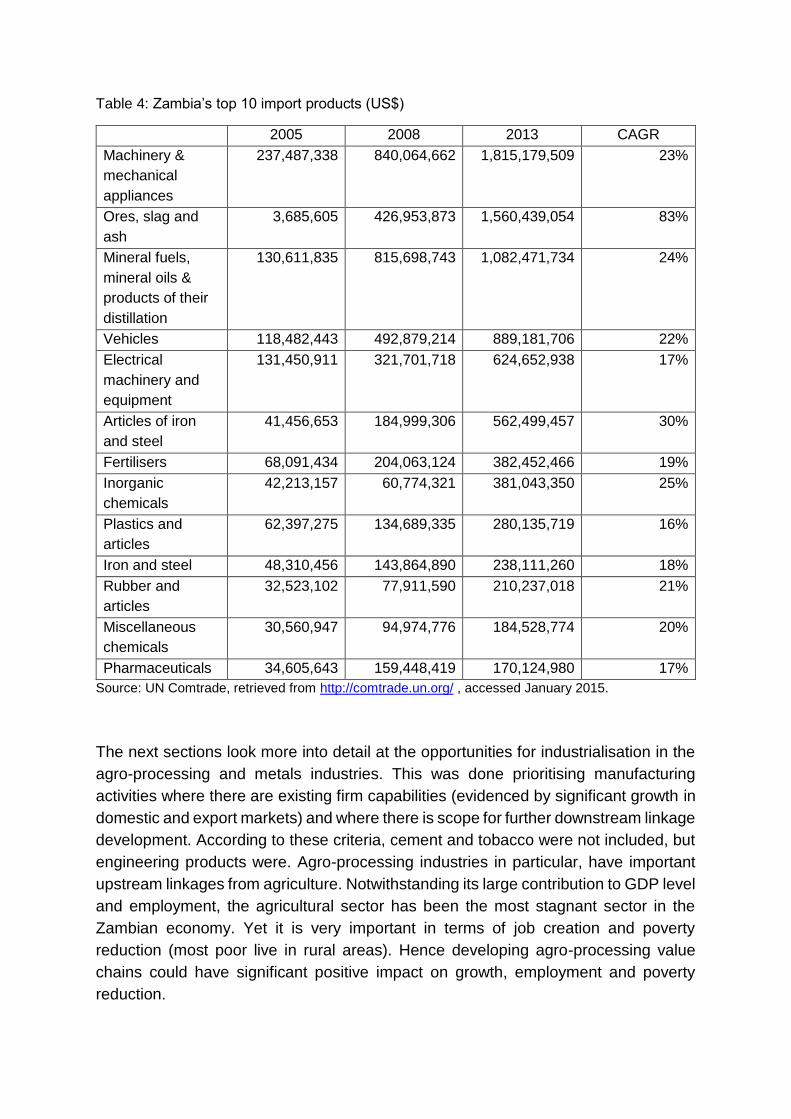
Table 4: Zambia’s top 10 import products (US$)
2005 2008 2013 CAGR
Machinery &
mechanical
appliances
237,487,338 840,064,662 1,815,179,509 23%
Ores, slag and
ash
3,685,605 426,953,873 1,560,439,054 83%
Mineral fuels,
mineral oils &
products of their
distillation
130,611,835 815,698,743 1,082,471,734 24%
Vehicles 118,482,443 492,879,214 889,181,706 22%
Electrical
machinery and
equipment
131,450,911 321,701,718 624,652,938 17%
Articles of iron
and steel
41,456,653 184,999,306 562,499,457 30%
Fertilisers 68,091,434 204,063,124 382,452,466 19%
Inorganic
chemicals
42,213,157 60,774,321 381,043,350 25%
Plastics and
articles
62,397,275 134,689,335 280,135,719 16%
Iron and steel 48,310,456 143,864,890 238,111,260 18%
Rubber and
articles
32,523,102 77,911,590 210,237,018 21%
Miscellaneous
chemicals
30,560,947 94,974,776 184,528,774 20%
Pharmaceuticals 34,605,643 159,448,419 170,124,980 17%
Source: UN Comtrade, retrieved from http://comtrade.un.org/ , accessed January 2015.
The next sections look more into detail at the opportunities for industrialisation in the
agro-processing and metals industries. This was done prioritising manufacturing
activities where there are existing firm capabilities (evidenced by significant growth in
domestic and export markets) and where there is scope for further downstream linkage
development. According to these criteria, cement and tobacco were not included, but
engineering products were. Agro-processing industries in particular, have important
upstream linkages from agriculture. Notwithstanding its large contribution to GDP level
and employment, the agricultural sector has been the most stagnant sector in the
Zambian economy. Yet it is very important in terms of job creation and poverty
reduction (most poor live in rural areas). Hence developing agro-processing value
chains could have significant positive impact on growth, employment and poverty
reduction.
3. Industrialisation opportunities in the agro-processing sector
The agro-processing sector includes all the activities related to processing of
resources from the agricultural, fishery and forestry sectors. It is a very broad industry
for several reasons (FAO, 1997). Firstly, the industry includes primary processing,
such as sorting, grading and packaging of agricultural products, rice and flour milling,
leather tanning, cotton ginning, oil pressing, and saw milling, as well as secondary
processing, such as production by modern, capital-intensive methods of textiles, pulp
and paper. Secondly, it includes both food and non-food industries. According to the
UN ISIC classification, agro-processing cuts across 3.1 Food, beverages and tobacco;
3.2 Textile, wearing apparel and leather industries; 3.3 Wood and wood products,
including furniture; 3.4 Paper and paper products; 3.5.5 Rubber products. Thirdly,
because of technological innovation processes, this industry extends to an increasing
number of agro-industry activities and inputs.
Agro-processing accounts for 60% of Zambia’s manufacturing sector (Dinh, 2013). We
focus on one major component of the agro-processing industry in the form of food and
beverages. Cut flowers and tobacco will not be discussed because they do not fit the
criteria highlighted earlier of existing production and export capabilities and potential
for significant further downstream processing. This section further restricts the
discussion to processing activities that go beyond sorting, grading and packaging,
hence maize exports, for example, are excluded. Textile, leather and wood are not
discussed in-depth within this report but would deserve further scrutiny. There has
been substantial growth in wood products, mainly sawn timber with demand driven by
construction (as with cement) as well as growing exports of hides (crocodile skins). In
both cases, the growth does not appear associated with increased sophistication of
local processing capabilities. Similarly most tobacco is exported in relatively
unprocessed form.
A key reason for the focus on food and beverages is the growing demand associated
with rising incomes and urbanisation. Linked to these trends is the spread of formal
retail chains, including regional supermarket groups such as Shoprite, Pick n Pay and
Choppies. These developments provide opportunities for rapid growth if challenges of
upgrading in processing, packaging and distribution can be met. Upgrading to meet
local demand can be a stepping stone to growing regional exports, especially given
the constraints in some regional countries including Namibia, Botswana and South
Africa in agricultural production. For example, South Africa has a large trade deficit in
wheat and soya production due to agricultural conditions, which will remain even given
some increases in production. As soya-cake is an important input into animal feed it
implies a potential for countries such as Zambia to be a major regional exporter of
animal feed, displacing the current soya cake imports largely from Argentina.
Ultimately a lower cost poultry industry in the region can move the region into a net
surplus from its current substantial deficit, which would create substantial job
opportunities.
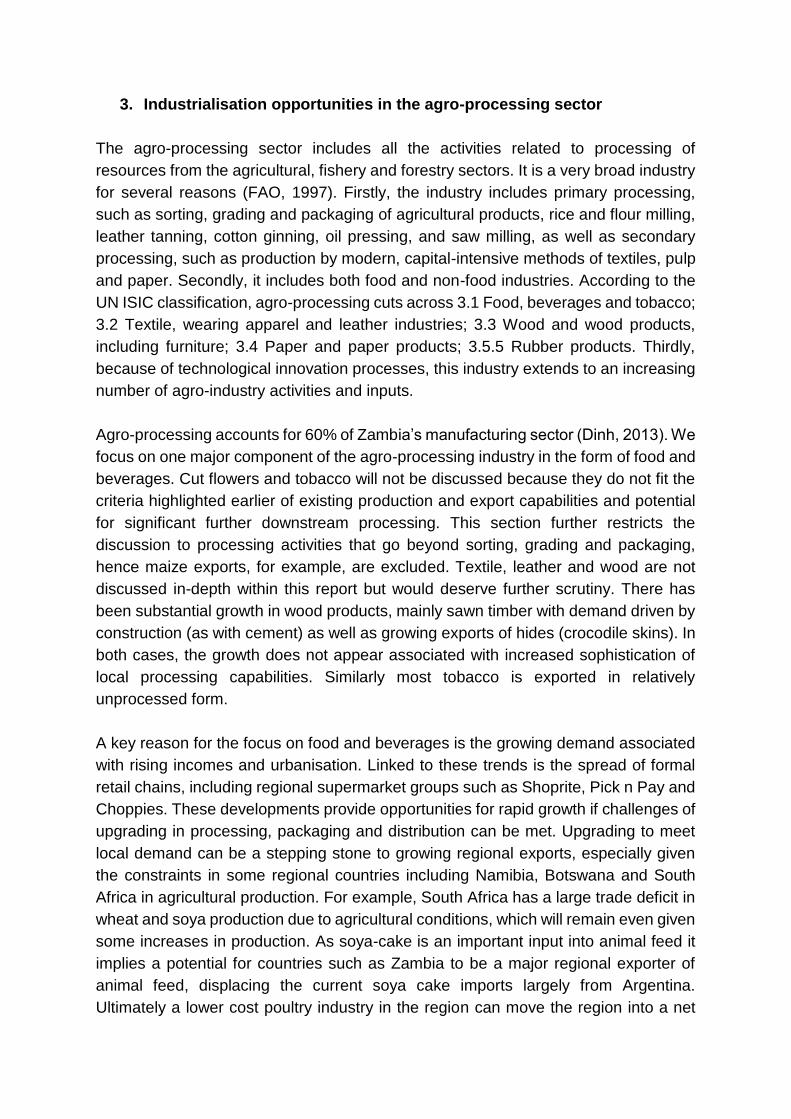
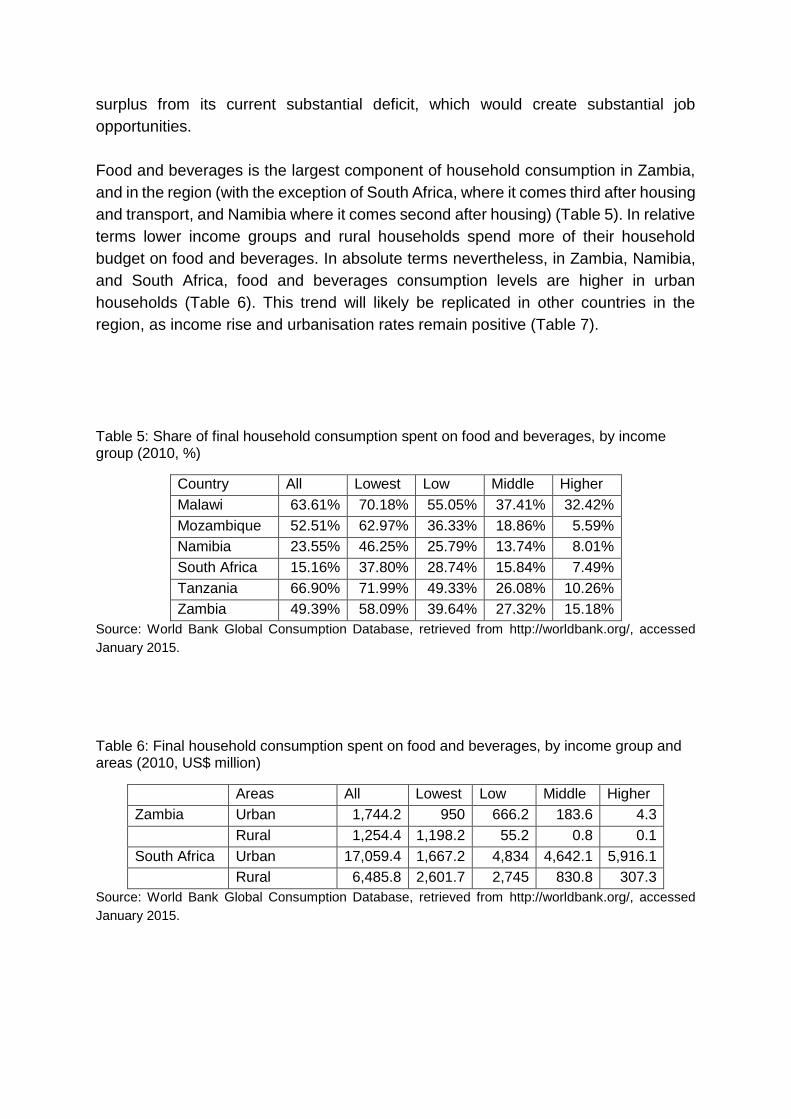
Food and beverages is the largest component of household consumption in Zambia,
and in the region (with the exception of South Africa, where it comes third after housing
and transport, and Namibia where it comes second after housing) (Table 5). In relative
terms lower income groups and rural households spend more of their household
budget on food and beverages. In absolute terms nevertheless, in Zambia, Namibia,
and South Africa, food and beverages consumption levels are higher in urban
households (Table 6). This trend will likely be replicated in other countries in the
region, as income rise and urbanisation rates remain positive (Table 7).
Table 5: Share of final household consumption spent on food and beverages, by income group (2010, %)
Country All Lowest Low Middle Higher
Malawi 63.61% 70.18% 55.05% 37.41% 32.42%
Mozambique 52.51% 62.97% 36.33% 18.86% 5.59%
Namibia 23.55% 46.25% 25.79% 13.74% 8.01%
South Africa 15.16% 37.80% 28.74% 15.84% 7.49%
Tanzania 66.90% 71.99% 49.33% 26.08% 10.26%
Zambia 49.39% 58.09% 39.64% 27.32% 15.18%
Source: World Bank Global Consumption Database, retrieved from http://worldbank.org/, accessed
January 2015.
Table 6: Final household consumption spent on food and beverages, by income group and areas (2010, US$ million)
Areas All Lowest Low Middle Higher
Zambia Urban 1,744.2 950 666.2 183.6 4.3
Rural 1,254.4 1,198.2 55.2 0.8 0.1
South Africa Urban 17,059.4 1,667.2 4,834 4,642.1 5,916.1
Rural 6,485.8 2,601.7 2,745 830.8 307.3
Source: World Bank Global Consumption Database, retrieved from http://worldbank.org/, accessed
January 2015.
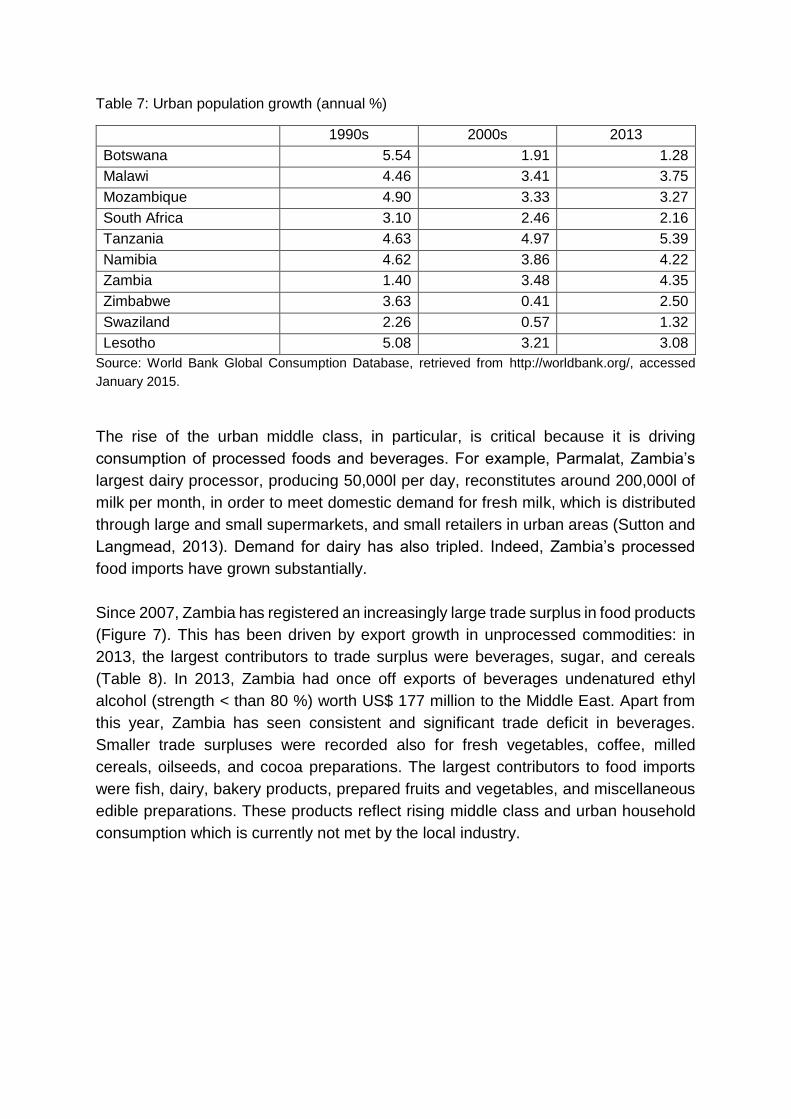
Table 7: Urban population growth (annual %)
1990s 2000s 2013
Botswana 5.54 1.91 1.28
Malawi 4.46 3.41 3.75
Mozambique 4.90 3.33 3.27
South Africa 3.10 2.46 2.16
Tanzania 4.63 4.97 5.39
Namibia 4.62 3.86 4.22
Zambia 1.40 3.48 4.35
Zimbabwe 3.63 0.41 2.50
Swaziland 2.26 0.57 1.32
Lesotho 5.08 3.21 3.08
Source: World Bank Global Consumption Database, retrieved from http://worldbank.org/, accessed
January 2015.
The rise of the urban middle class, in particular, is critical because it is driving
consumption of processed foods and beverages. For example, Parmalat, Zambia’s
largest dairy processor, producing 50,000l per day, reconstitutes around 200,000l of
milk per month, in order to meet domestic demand for fresh milk, which is distributed
through large and small supermarkets, and small retailers in urban areas (Sutton and
Langmead, 2013). Demand for dairy has also tripled. Indeed, Zambia’s processed
food imports have grown substantially.
Since 2007, Zambia has registered an increasingly large trade surplus in food products
(Figure 7). This has been driven by export growth in unprocessed commodities: in
2013, the largest contributors to trade surplus were beverages, sugar, and cereals
(Table 8). In 2013, Zambia had once off exports of beverages undenatured ethyl
alcohol (strength < than 80 %) worth US$ 177 million to the Middle East. Apart from
this year, Zambia has seen consistent and significant trade deficit in beverages.
Smaller trade surpluses were recorded also for fresh vegetables, coffee, milled
cereals, oilseeds, and cocoa preparations. The largest contributors to food imports
were fish, dairy, bakery products, prepared fruits and vegetables, and miscellaneous
edible preparations. These products reflect rising middle class and urban household
consumption which is currently not met by the local industry.
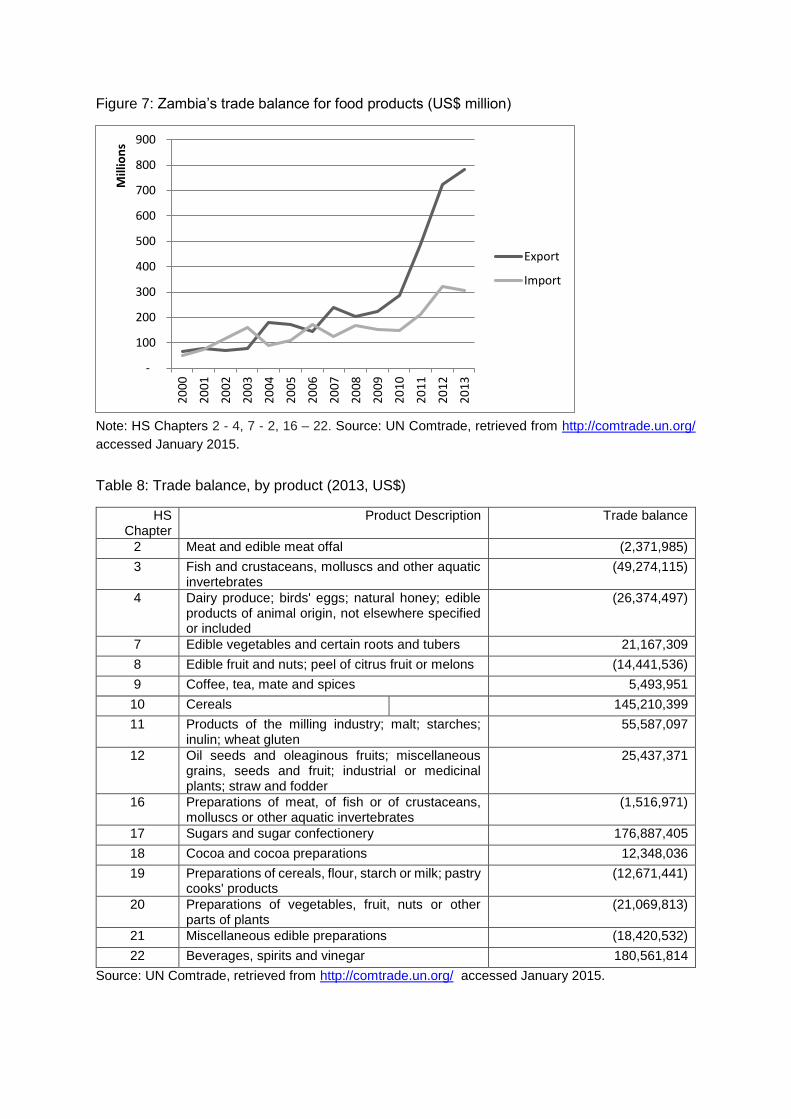
Figure 7: Zambia’s trade balance for food products (US$ million)
Note: HS Chapters 2 - 4, 7 - 2, 16 – 22. Source: UN Comtrade, retrieved from http://comtrade.un.org/
accessed January 2015.
Table 8: Trade balance, by product (2013, US$)
HS Chapter
Product Description Trade balance
2 Meat and edible meat offal (2,371,985)
3 Fish and crustaceans, molluscs and other aquatic invertebrates
(49,274,115)
4 Dairy produce; birds' eggs; natural honey; edible products of animal origin, not elsewhere specified or included
(26,374,497)
7 Edible vegetables and certain roots and tubers 21,167,309
8 Edible fruit and nuts; peel of citrus fruit or melons (14,441,536)
9 Coffee, tea, mate and spices 5,493,951
10 Cereals 145,210,399
11 Products of the milling industry; malt; starches; inulin; wheat gluten
55,587,097
12 Oil seeds and oleaginous fruits; miscellaneous grains, seeds and fruit; industrial or medicinal plants; straw and fodder
25,437,371
16 Preparations of meat, of fish or of crustaceans, molluscs or other aquatic invertebrates
(1,516,971)
17 Sugars and sugar confectionery 176,887,405
18 Cocoa and cocoa preparations 12,348,036
19 Preparations of cereals, flour, starch or milk; pastry cooks' products
(12,671,441)
20 Preparations of vegetables, fruit, nuts or other parts of plants
(21,069,813)
21 Miscellaneous edible preparations (18,420,532)
22 Beverages, spirits and vinegar 180,561,814
Source: UN Comtrade, retrieved from http://comtrade.un.org/ accessed January 2015.
-
100
200
300
400
500
600
700
800
900
20
00
20
01
20
02
20
03
20
04
20
05
20
06
20
07
20
08
20
09
20
10
20
11
20
12
20
13
Mill
ion
s
Export
Import
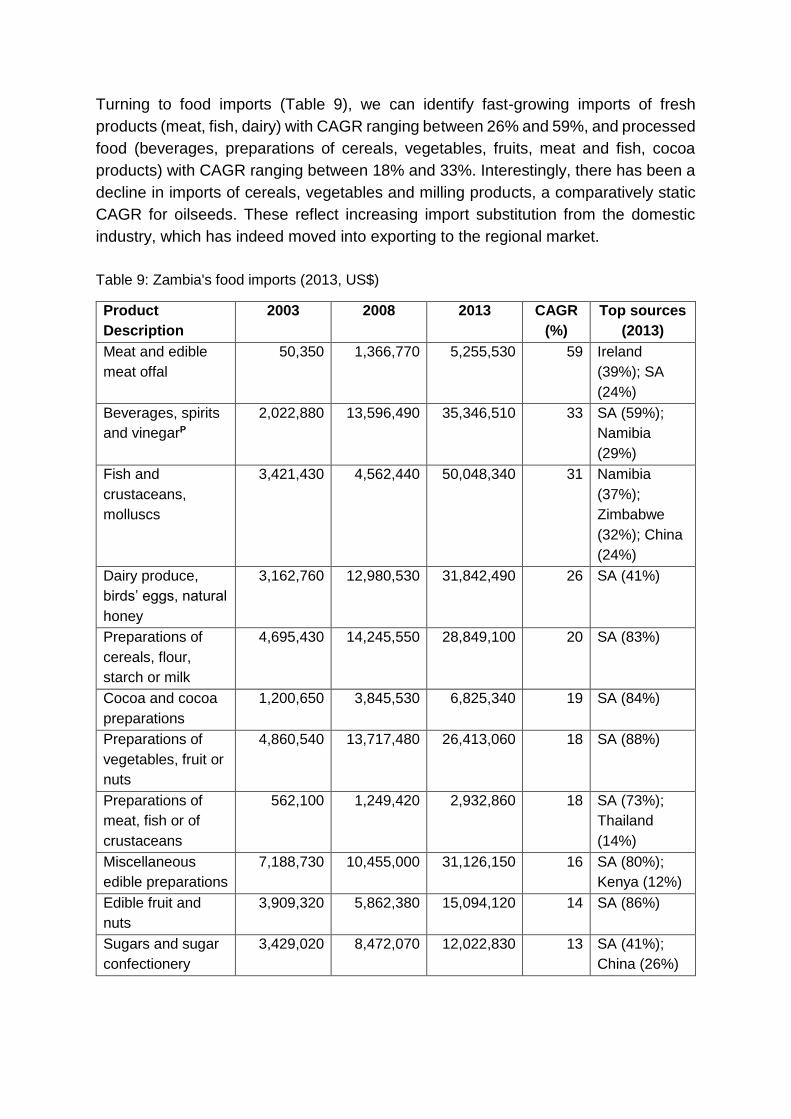
Turning to food imports (Table 9), we can identify fast-growing imports of fresh
products (meat, fish, dairy) with CAGR ranging between 26% and 59%, and processed
food (beverages, preparations of cereals, vegetables, fruits, meat and fish, cocoa
products) with CAGR ranging between 18% and 33%. Interestingly, there has been a
decline in imports of cereals, vegetables and milling products, a comparatively static
CAGR for oilseeds. These reflect increasing import substitution from the domestic
industry, which has indeed moved into exporting to the regional market.
Table 9: Zambia's food imports (2013, US$)
Product
Description
2003 2008 2013 CAGR
(%)
Top sources
(2013)
Meat and edible
meat offal
50,350 1,366,770 5,255,530 59 Ireland
(39%); SA
(24%)
Beverages, spirits
and vinegarP
2,022,880 13,596,490 35,346,510 33 SA (59%);
Namibia
(29%)
Fish and
crustaceans,
molluscs
3,421,430 4,562,440 50,048,340 31 Namibia
(37%);
Zimbabwe
(32%); China
(24%)
Dairy produce,
birds’ eggs, natural
honey
3,162,760 12,980,530 31,842,490 26 SA (41%)
Preparations of
cereals, flour,
starch or milk
4,695,430 14,245,550 28,849,100 20 SA (83%)
Cocoa and cocoa
preparations
1,200,650 3,845,530 6,825,340 19 SA (84%)
Preparations of
vegetables, fruit or
nuts
4,860,540 13,717,480 26,413,060 18 SA (88%)
Preparations of
meat, fish or of
crustaceans
562,100 1,249,420 2,932,860 18 SA (73%);
Thailand
(14%)
Miscellaneous
edible preparations
7,188,730 10,455,000 31,126,150 16 SA (80%);
Kenya (12%)
Edible fruit and
nuts
3,909,320 5,862,380 15,094,120 14 SA (86%)
Sugars and sugar
confectionery
3,429,020 8,472,070 12,022,830 13 SA (41%);
China (26%)
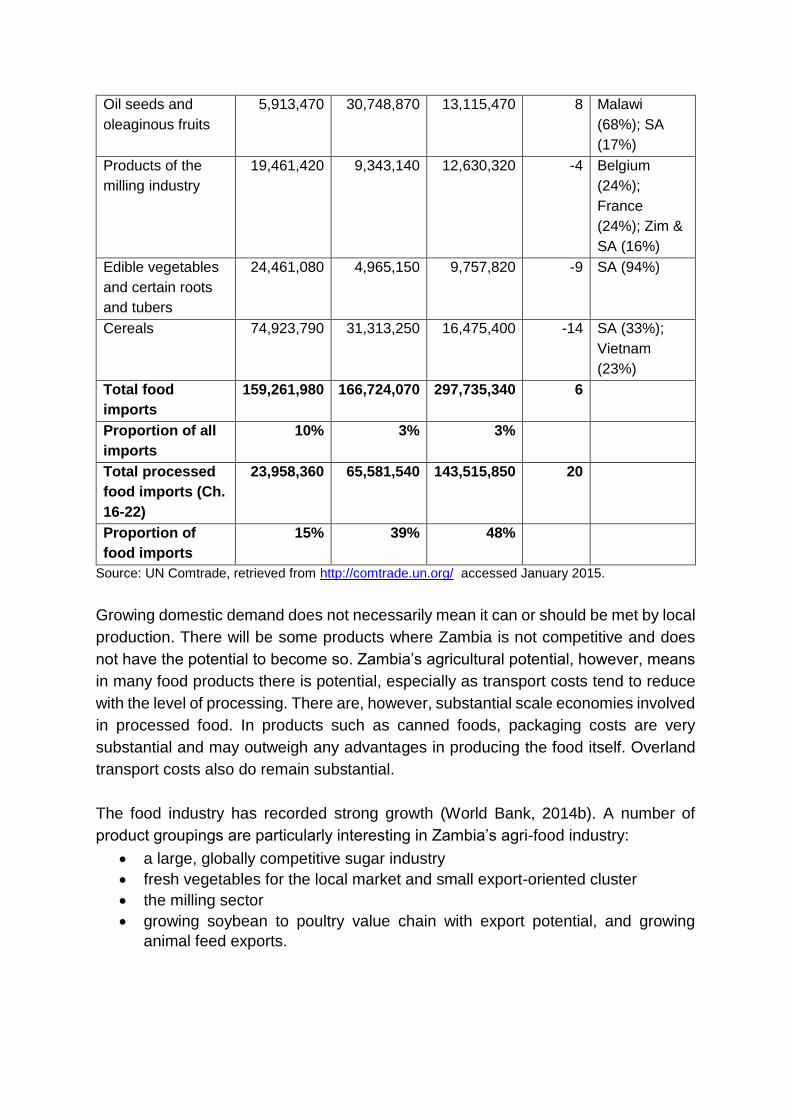
Oil seeds and
oleaginous fruits
5,913,470 30,748,870 13,115,470 8 Malawi
(68%); SA
(17%)
Products of the
milling industry
19,461,420 9,343,140 12,630,320 -4 Belgium
(24%);
France
(24%); Zim &
SA (16%)
Edible vegetables
and certain roots
and tubers
24,461,080 4,965,150 9,757,820 -9 SA (94%)
Cereals 74,923,790 31,313,250 16,475,400 -14 SA (33%);
Vietnam
(23%)
Total food
imports
159,261,980 166,724,070 297,735,340 6
Proportion of all
imports
10% 3% 3%
Total processed
food imports (Ch.
16-22)
23,958,360 65,581,540 143,515,850 20
Proportion of
food imports
15% 39% 48%
Source: UN Comtrade, retrieved from http://comtrade.un.org/ accessed January 2015.
Growing domestic demand does not necessarily mean it can or should be met by local
production. There will be some products where Zambia is not competitive and does
not have the potential to become so. Zambia’s agricultural potential, however, means
in many food products there is potential, especially as transport costs tend to reduce
with the level of processing. There are, however, substantial scale economies involved
in processed food. In products such as canned foods, packaging costs are very
substantial and may outweigh any advantages in producing the food itself. Overland
transport costs also do remain substantial.
The food industry has recorded strong growth (World Bank, 2014b). A number of
product groupings are particularly interesting in Zambia’s agri-food industry:
a large, globally competitive sugar industry
fresh vegetables for the local market and small export-oriented cluster
the milling sector
growing soybean to poultry value chain with export potential, and growing
animal feed exports.
3.1 Sugar
The sugar industry contributes 3-4% to Zambia’s GDP and is a significant employer,
with 11 000 workers (Sutton and Langmead, 2013; ECIAfrica Consulting, 2013).
Production and exports are largely controlled by one company, Zambia Sugar. Zambia
Sugar is controlled by South Africa’s Illovo Sugar group (with 82% held by the Illovo
group and the balance by institutional and private investors). 6 Zambia Sugar
produces around 380,000 tonnes of refined and unrefined sugar, as well as syrup,
caster sugar and speciality sugar in small quantities. Around 40% is sold to the
domestic market, of which 75% to households and 25% in bulk to beverage and food
manufacturers. Zambia Sugar controls 90-95% of the domestic market, around
150,000 mt.
Zambia exported US$ 188 million worth of sugar in 2013 (Table 10). Of this, US$121
million was exported to the DRC (28.6%), Mauritius (25.9%), South Africa (24.4%),
and the remainder to other regional markets. An additional US$ 50.1 million of
molasses were exported mostly to South Africa. It must be noted that the exports
recorded as going to Mauritius were switched from Europe when Illovo was acquired
by Associated British Foods and, as such, the exports are invoiced to Mauritius but
are likely destined for Europe.
Over time the share of exports to deep sea markets (mainly Europe) has declined. In
2005, out of US$72.8 million worth of exports, US$44.5 million targeted the EU, and
only US$28 million the region. The preferential access to the EU market had been
important in ensuring good prices from this market, however, the substantial transport
costs reduce the net price received for exports which results in prices that are
substantially below those being earned in the local market. In particular, the growth in
demand from the DRC has absorbed increased levels of production. In effect, exports
to the DRC are close to being local sales given the proximity and the link to the growing
consumer demand in the DRC Copperbelt.
There are very substantial opportunities in sugar confectionary products as the SADC
region imported US$283.8 million worth of sugar confectionery products in 2013. We
return to this below.
6 http://www.illovosugar.co.za/About-us/Zambia, accessed in February 2015
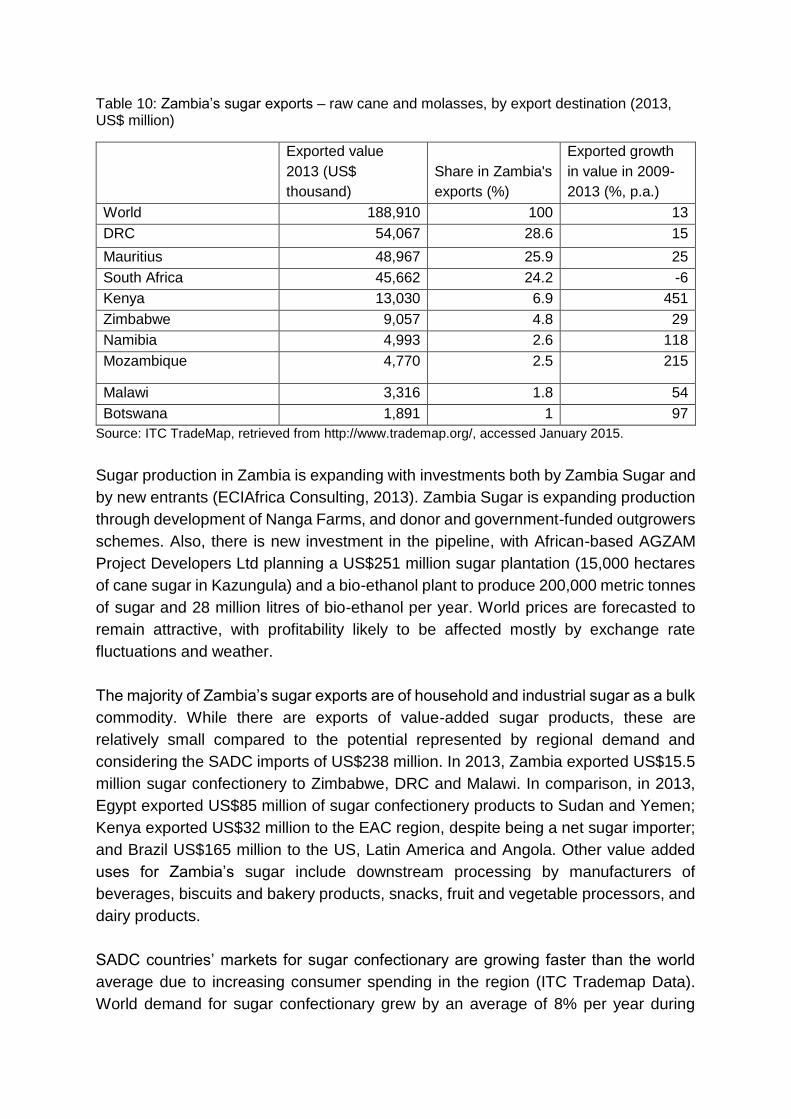
Table 10: Zambia’s sugar exports – raw cane and molasses, by export destination (2013, US$ million)
Exported value
2013 (US$
thousand)
Share in Zambia's
exports (%)
Exported growth
in value in 2009-
2013 (%, p.a.)
World 188,910 100 13
DRC 54,067 28.6 15
Mauritius 48,967 25.9 25
South Africa 45,662 24.2 -6
Kenya 13,030 6.9 451
Zimbabwe 9,057 4.8 29
Namibia 4,993 2.6 118
Mozambique 4,770 2.5 215
Malawi 3,316 1.8 54
Botswana 1,891 1 97
Source: ITC TradeMap, retrieved from http://www.trademap.org/, accessed January 2015.
Sugar production in Zambia is expanding with investments both by Zambia Sugar and
by new entrants (ECIAfrica Consulting, 2013). Zambia Sugar is expanding production
through development of Nanga Farms, and donor and government-funded outgrowers
schemes. Also, there is new investment in the pipeline, with African-based AGZAM
Project Developers Ltd planning a US$251 million sugar plantation (15,000 hectares
of cane sugar in Kazungula) and a bio-ethanol plant to produce 200,000 metric tonnes
of sugar and 28 million litres of bio-ethanol per year. World prices are forecasted to
remain attractive, with profitability likely to be affected mostly by exchange rate
fluctuations and weather.
The majority of Zambia’s sugar exports are of household and industrial sugar as a bulk
commodity. While there are exports of value-added sugar products, these are
relatively small compared to the potential represented by regional demand and
considering the SADC imports of US$238 million. In 2013, Zambia exported US$15.5
million sugar confectionery to Zimbabwe, DRC and Malawi. In comparison, in 2013,
Egypt exported US$85 million of sugar confectionery products to Sudan and Yemen;
Kenya exported US$32 million to the EAC region, despite being a net sugar importer;
and Brazil US$165 million to the US, Latin America and Angola. Other value added
uses for Zambia’s sugar include downstream processing by manufacturers of
beverages, biscuits and bakery products, snacks, fruit and vegetable processors, and
dairy products.
SADC countries’ markets for sugar confectionary are growing faster than the world
average due to increasing consumer spending in the region (ITC Trademap Data).
World demand for sugar confectionary grew by an average of 8% per year during
2009-2013, while demand in Mozambique grew 32% per year, Zimbabwe 28%, DRC
21%, Angola 15% and South Africa at 14%. The main source of imports in the region
is South Africa, with the exception of the Angolan market (dominated by China,
Colombia, Portugal) and the Tanzanian market (Kenya). South Africa’s main import
sources in 2013 were Swaziland, Botswana and China. Zambia is managing to
compete only in the DRC and Zimbabwe.
In growing regional exports Zambian manufacturers face stiff competition from South
Africa and need to address factors that make their final products more expensive. A
fundamental issue is competition related. Zambian sugar production (the main input
to sugar confectionary) is dominated by a single company which several studies have
found has market power and is exerting it to sustain relatively high prices to domestic
customers including those manufacturing sugar confectionary (Chisanga et al., 2014;
Ellis et al., 2010; World Bank, 2014a). In addition to the natural protection afforded by
transport costs, the Zambian market is protected from import competition through a
domestic regulation which restricts imports of household sugar to vitamin A-fortified
sugar.7 According to the Zambia Association of Manufacturers (ZAM), this requirement
is an entry barrier which serves no legitimate purpose. 8 Importing also requires
obtaining a licence, which has been observed to be burdensome and non-
transparent.9 In addition, the obvious sources of imports such as Zimbabwe, Malawi
and South Africa are markets where Illovo itself is a major producer, alongside
Tongaat-Hulett, and these firms have long-term close relationships through the role of
the sugar industry in regulation in South Africa.
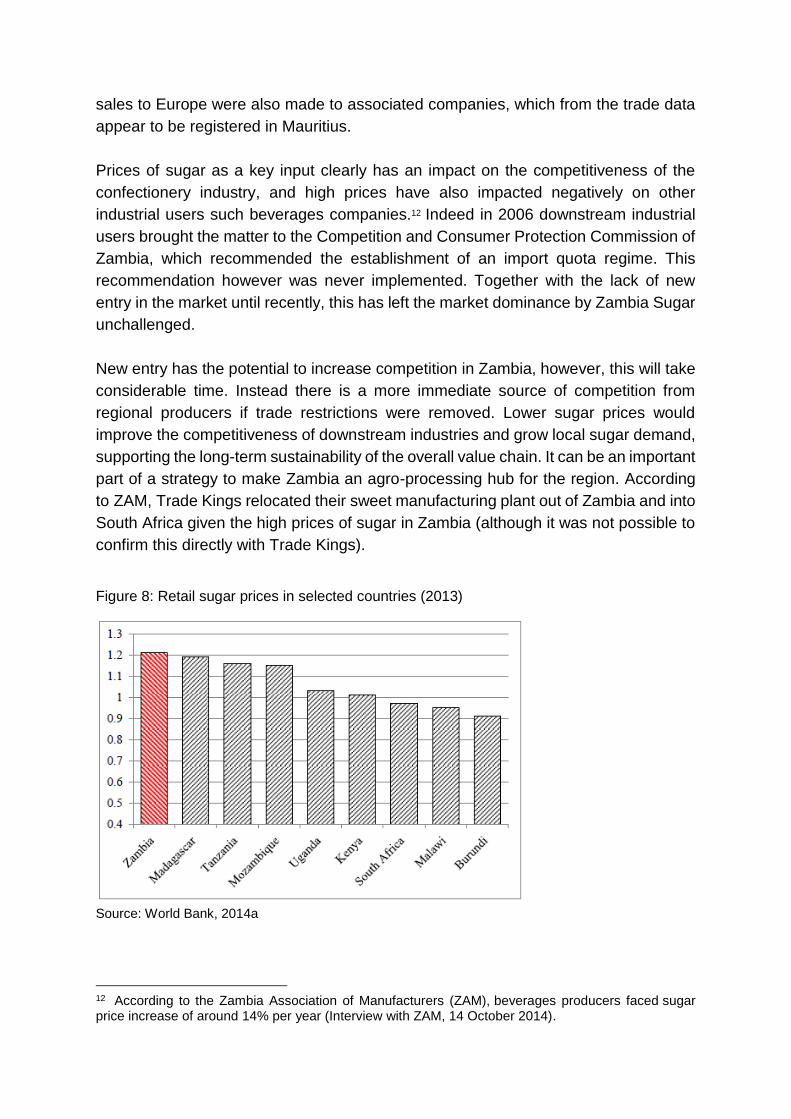
The upshot is that whilst Zambia is one of the world’s lowest cost production locations
(at US$169/t vs. global average of US$263), domestic prices remain high (World Bank,
2014a) (Figure 8). As a result, the margins of Zambia Sugar have been
substantially higher than those of the South African operations of Illovo (its immediate
parent).10 This is the case even although Zambia Sugar has a number of costs which
appear to be higher than would be expected of an efficient firm. For example, in the
2013 financial year distribution costs were equivalent to 18% of total
revenue, administration costs 13%, and finance charges 9%. These costs apparently
included management fees paid to Illovo Sugar Ireland, export commissions and
payments for marketing services paid to associated companies in the Associated
British Foods and Illovo group, finance charges for loans within the group, as well as
substantial sums for imports of goods and services from within the group.11 Export
7 Note, however, that fortifying sugar adds only 0,01% to the production costs, and the requirement does not apply to industrial sugar. 8 Interviews with Zambian firms and ZAM. 9 Interviews with Zambian firms and ZAM. 10 See segmental analysis, p56, Illovo Annua Finanncial Statements, 2013. 11 Zambia Sugar Annual Reports.
sales to Europe were also made to associated companies, which from the trade data
appear to be registered in Mauritius.
Prices of sugar as a key input clearly has an impact on the competitiveness of the
confectionery industry, and high prices have also impacted negatively on other
industrial users such beverages companies.12 Indeed in 2006 downstream industrial
users brought the matter to the Competition and Consumer Protection Commission of
Zambia, which recommended the establishment of an import quota regime. This
recommendation however was never implemented. Together with the lack of new
entry in the market until recently, this has left the market dominance by Zambia Sugar
unchallenged.
New entry has the potential to increase competition in Zambia, however, this will take
considerable time. Instead there is a more immediate source of competition from
regional producers if trade restrictions were removed. Lower sugar prices would
improve the competitiveness of downstream industries and grow local sugar demand,
supporting the long-term sustainability of the overall value chain. It can be an important
part of a strategy to make Zambia an agro-processing hub for the region. According
to ZAM, Trade Kings relocated their sweet manufacturing plant out of Zambia and into
South Africa given the high prices of sugar in Zambia (although it was not possible to
confirm this directly with Trade Kings).
Figure 8: Retail sugar prices in selected countries (2013)
Source: World Bank, 2014a
12 According to the Zambia Association of Manufacturers (ZAM), beverages producers faced sugar price increase of around 14% per year (Interview with ZAM, 14 October 2014).
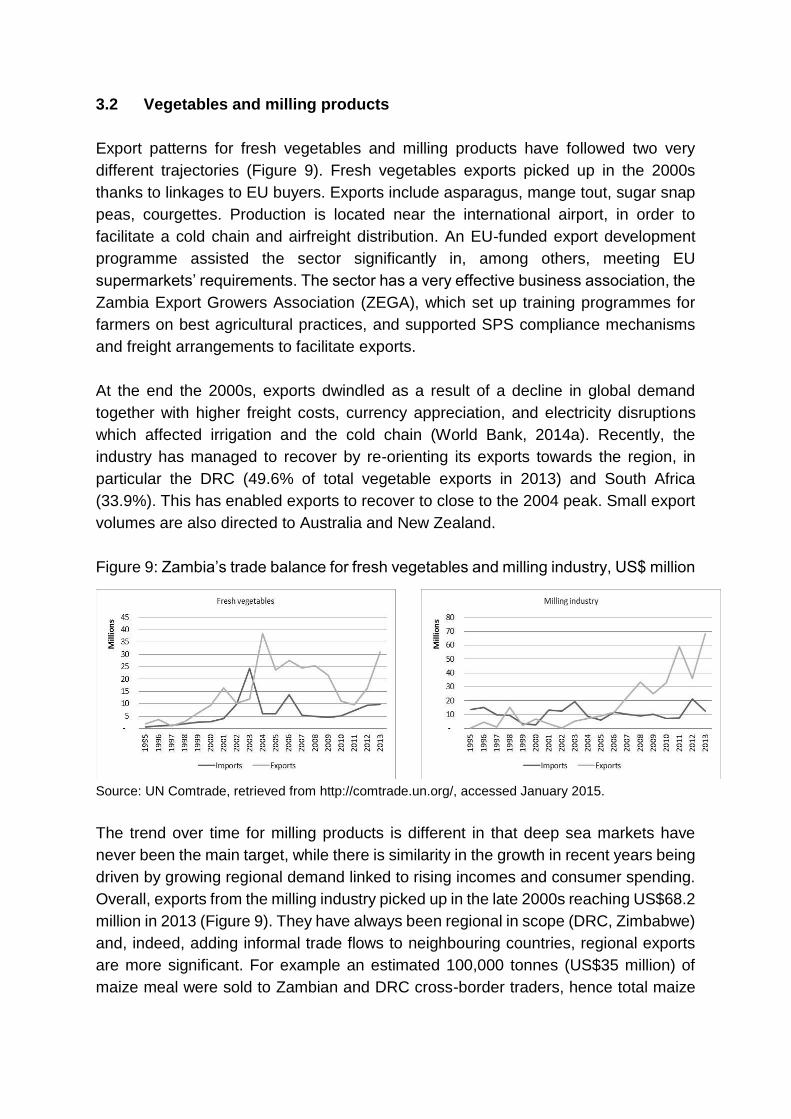
3.2 Vegetables and milling products
Export patterns for fresh vegetables and milling products have followed two very
different trajectories (Figure 9). Fresh vegetables exports picked up in the 2000s
thanks to linkages to EU buyers. Exports include asparagus, mange tout, sugar snap
peas, courgettes. Production is located near the international airport, in order to
facilitate a cold chain and airfreight distribution. An EU-funded export development
programme assisted the sector significantly in, among others, meeting EU
supermarkets’ requirements. The sector has a very effective business association, the
Zambia Export Growers Association (ZEGA), which set up training programmes for
farmers on best agricultural practices, and supported SPS compliance mechanisms
and freight arrangements to facilitate exports.
At the end the 2000s, exports dwindled as a result of a decline in global demand
together with higher freight costs, currency appreciation, and electricity disruptions
which affected irrigation and the cold chain (World Bank, 2014a). Recently, the
industry has managed to recover by re-orienting its exports towards the region, in
particular the DRC (49.6% of total vegetable exports in 2013) and South Africa
(33.9%). This has enabled exports to recover to close to the 2004 peak. Small export
volumes are also directed to Australia and New Zealand.
Figure 9: Zambia’s trade balance for fresh vegetables and milling industry, US$ million
Source: UN Comtrade, retrieved from http://comtrade.un.org/, accessed January 2015.
The trend over time for milling products is different in that deep sea markets have
never been the main target, while there is similarity in the growth in recent years being
driven by growing regional demand linked to rising incomes and consumer spending.
Overall, exports from the milling industry picked up in the late 2000s reaching US$68.2
million in 2013 (Figure 9). They have always been regional in scope (DRC, Zimbabwe)
and, indeed, adding informal trade flows to neighbouring countries, regional exports
are more significant. For example an estimated 100,000 tonnes (US$35 million) of
maize meal were sold to Zambian and DRC cross-border traders, hence total maize
exports are estimated to be 10-30% larger than suggested by official statistics (World
Bank, 2014a).
Of the total recorded exports of milling products, Zambia exported US$10.6 million of
value added cereal products such as breakfast cereals and biscuits into Malawi, DRC,
and Zimbabwe in 2013. Zambia also exported cereal preparations worth US$ 12.9
million in 2011, US$ 45.9 million in 2012, and US$ 16.2 million in 2013. One of the
leading firms in bakery products, Trade Kings, serves the SADC market and also has
a global supply chain from Europe and East Asia (Sutton and Langmead, 2013).
The milling industry is dominated by 8 large scale millers, which are largely
mechanised and efficient. However, more recently, competition from medium and
small new entrants has been having an impact on prices. US-owned National Milling
is the industry leader (Sutton and Langmead, 2013). It processes maize, wheat and
soya, claiming 25% and 30% of the flour and mealie meal market, respectively. It is
also the second largest animal feed producer (Namfeeds). Its main export market is
the DRC, and the company is considering vertical integration upstream into farming
and downstream into bakery.
Zambia has become increasingly self-reliant in wheat production, with a growing
surplus available for exports, as milled flour (World Bank, 2014b). Maize flour and bran
exports have also grown considerably, together with maize exports. Maize trade flows
have been erratic because they have been dependent on a range of domestic policies
(seasonal export bans, etc.). The wheat industry has grown more consistently,
however, this has been on the back of import protection which, according to the bakery
industry, has hurt their cost competitiveness in the domestic and regional market. In
2011 wheat flour cost around US$700/t at the factory gate, 50% more than Ethiopia
and Tanzania (Dinh, 2013). While import protection has been justified on infant
industry grounds, wheat is now the third most consumed staple foods and the industry
has been able to export (World Bank, 2014a). Wheat production has grown sufficiently
to meet local demand and create a surplus for exports to the region. However further
research is required to understand how price competitive Zambia’s bakery industry is
in the domestic and regional market.
Key issues for competitiveness
There are opportunities to expand Zambia’s presence in the regional market and to
upgrade into value-added manufacturing products. For example, most of Zambia’s
vegetable exports are in fresh form, rather than frozen or canned form. Only US$5
million worth of canned vegetables and fruit/vegetable juices were exported to the
region compared to US$30.1 million in fresh vegetables. Yet, SADC imported
US$716.4 million in prepared food in 2013, with a number of neighbouring markets
growing well above the world average (ITC Trademap Data). The regional demand in
this food category has been increasingly met by South Africa, China and Latin
America.
Assessing competitiveness and market opportunities requires considering market
demand patterns, locally and regionally, key input costs, issues of quality and
standards, linked investments such as in packaging, and branding and distribution
including through the growing footprint of supermarket chains.
Growing local consumer demand represents an important base for developing local
capabilities and increasing scale and efficiency. An important development is the
spread of supermarket chains, mainly from South Africa, in Zambia’s retail sector. For
example, Pick n Pay opened its first Zambian shop in 2010, and since then opened 8
stores, with plans to have 15 by 2015 employing 2000 people and investment worth
US$ 50 million (Pick n Pay, 2014). Shoprite entered the Zambian market in 1995 and
now has over 22 stores across Zambia, employing around 2500 people.13
Supermarkets cater for the rising middle class and urban consumers, but their spread
to rural areas is changing how low income consumers shop too. The challenge for
local food processors is two-fold: entering the supply chain of supermarkets, which
requires meeting stringent requirements in terms of consistent quality, cost, consistent
volumes, just-in-time supply, and meeting mandatory and private standards.
Marketing fresh food produce to supermarkets in particular has been difficult as often
the institutional, as well as public and private physical and financial infrastructure
support systems are weak (including packing houses 14 , cold chains, shipping
equipment, credit facilities, standards and certification processes etc.). Local
producers are usually responsible for all post-harvest activities up until the product is
delivered to a distribution centre or a supermarket. In 2013, South Africa supplied
87.6% of prepared fruits and vegetables imports into Zambia, most likely for the supply
to South African supermarkets. Further analysis is required to understand whether
these products compete with local production and what is driving Zambian
preferences.
The second challenge is for suppliers to upgrade into value added, differentiated
products, which enable them to move into a more profitable market segment. Pick n
Pay committed to 50% local content, which is already met for fruits and vegetables
and manufactured products (Pick n Pay, 2014). Only 25% is imported directly,
however this share accounts for 80% of the range of products. These figures suggest
that Zambian suppliers still have to move into the higher value added, more
differentiated segment of the market. Shoprite claims that 70% of their stock is sourced
and produced in Zambia (Company website), however, it is unclear whether this is in
13 http://www.shoprite.co.zm/ 14 With the ability to provide washing, packaging, labelling, bar-coding services.
terms of volume or value, and at what level of value addition these local Zambian
products are.
To effectively enter and compete within the supermarket supply chain, as well as
increase value added offerings, suppliers require significant investment in capital and
technology to upgrade capabilities. This appears not to happen at the pace required
to maintain competitiveness in countries in the SADC region (Emonger and Kirsten,
2006; Weatherspoon and Reardon, 2003) and is an area that government policies can
target.
There are some examples of local firms that are attempting to upgrade their
capabilities. According to ZDA, some local firms are making major inroads in supplying
products such as detergents and mineral bottled water to supermarkets and have now
displaced their South African competitors.15 Useful lessons can be drawn from their
experiences. Speciality Foods, a local food manufacturer, managed to enter the
supermarket supply chain (Sutton and Langmead, 2013). It produces food products
across the following categories: sweets, snacks, peanut products, baby foods
powders, liquids. It manufactures to order for Shoprite, Pick n Pay and Spar, plus
wholesalers across the country. The firm invested in meeting the supermarket
standards, with in-house laboratories and quality control processes across the entire
production chain, including relying on UNZA and ZABS testing facilities. It upgraded
its machinery and packaging and health standards. Access to supermarket supply
chains gave the firm a larger market for its products and underlined its upgrading
efforts. However, the firm struggles to find external finance to expand operations.
Access to capital has been found to be a critical constraint across sectors and firms of
different size (Box 2).
Moreover, in order to meet the buyers’ requirement, the firm had to internalise a
number of quality related activities, which smaller businesses and new entrants would
struggle to do. This has important implications in terms of how government and
supermarket chains can jointly support local food processors. Discussed in more detail
in Section 3.3, another example of a local firm managing to enter and remain
competitive in the supermarket value chain is that of Zambeef. Zambeef has a
strategic partnership with Shoprite to run and manage its own butcheries in Shoprite
stores. The capabilities required for it to enter into such arrangements would offer
valuable insights on what types of support suppliers typically need.
15 ZDA representative intervention at the validation seminar held on 4 May 2015 in Lusaka, Zambia.
Box 2: Capital constraints for Zambia’s business sector
Zambia’s private financial sector has been relatively stable, thanks to sound
regulatory reforms undertaken in the last few years (World Bank, 2014b). Whilst
private sector credit rose by 10% per year between 2011 and 2014, financial
intermediation with respect to private enterprises has remained weak, for a
combination of lack of bankable projects and risk aversion (Interviews, 2014).
Concerns remain that the financial services sector is underdeveloped and
dominated by a few commercial banks. These commercial banks do not cater for
long term lending, and their high short term lending rates are high (Interviews, 2014;
OECD, 2012). The high rates have fuelled suspicions of anti-
competitive collusive behaviour.
For various reasons, credit facilities from microfinance institutions, CEEC
Empowerment Fund, and the Development Bank of Zambia fail to address the
financing needs of small and medium manufacturers (for example, DBZ is oriented
towards agricultural firms) (Dinh, 2013). The ZDA Trade and Industrial Development
Fund has not been established yet, although ZDA is currently implementing Zambia
Insurance Export Development Fund to support export activities of MSMEs
(Interviews, 2014). Other forms of capital funding include Growfin, a venture capital
fund which nevertheless has a very small market, and the Lusaka Stock Exchange
which is now looking at creating a new exchange for the smaller companies
(Interviews, 2014). Even for Zambia’s 50 leading firms external sources of finance
are a constraint, and growth is funded through internal resources (Sutton and
Langmead, 2013).
Further analysis is required to identify which products could be processed
competitively in Zambia, taking into account cost of tin cans, access to high quality
raw materials, costs of meeting standards, etc., and where demand is likely to grow in
the region. This analysis should be expanded beyond vegetables, into for example,
fruits and nuts.
Encouraging suppliers to invest in upgrading capabilities is however only one side of
the coin. From the demand side, the procurement and sourcing strategies of key retail
chains like Shoprite and Pick n’ Pay have a significant impact on domestic producers
and food processing firms. Reardon, Timmer and Berdegue (2004) and Humphrey
(2007) highlight that the manner in which large supermarket chains procure have
drastically transformed food supply chains. In general, supermarkets have moved
away from spot purchases to adopt specialised procurement agents giving them direct
influence over quantities, terms of delivery and product quality. This has the adverse
effect of shrinking the supply base by using only preferred suppliers. Further,
supermarkets chains tend to use their own centralised distribution centres (such as
Shoprite’s Freshmark) supplying a broad range of stores, shifting away from the
traditional store-by-store procurement and supply practice. These centralised
strategies may result in more products being imported from South Africa rather than
procured locally. Therefore further research needs to be undertaken evaluating the
changing procurement strategies of supermarkets and the consequent impact on local
suppliers. From a competition perspective, this includes understanding the supply
agreements between large, multinational suppliers and supermarkets.
3.3 Soybean to poultry value chain
In the past decade, there have been dramatic changes in the value chain which runs
from soya and maize, to animal feed and poultry. Moreover it points to substantial
potential for ongoing growth given continued supportive policy measures. The most
important change has, however, been in agricultural production, with Zambia moving
towards a surplus in soya to complement the surplus in maize production which has
generally been the case. This holds out the promise for very competitive animal feed
production as maize and soya oilcake (a co-product with vegetable oil) are the two
main cost components. The change is already evident in the growth in animal feed
exports in recent years to neighbouring countries including South Africa.
The potential is reflected in strong demand growth for poultry in Zambia and regional
economies, as the main source of protein, and the fact that South Africa remains a
large net importer of soya oil-cake and of protein from deep sea sources, mainly
Argentina and Europe. Angola is also a very large net importer of poultry. Zambia
should be aiming to replace these imports. Large companies have already identified
this opportunity and are making related investments along the value chain. For
example, Zambeef, now in a joint venture with South Africa’s Rainbow chickens, is
aiming to reduce soybean costs so that soya products can be landed in South Africa
at competitive prices (estimated at around $500/t in 2014). 16 Improvements in
transport and logistics will aid this, as well as coordination around regional trade and
industrial policy to realise the collective benefits from a more competitive poultry
industry across countries as opposed to mutually destructive trade barriers being
raised, for example, between Zambia and Zimbabwe.
Soybean production in Zambia increased threefold, from about 60 – 70 000t in 2010
to over 200 000t in 2013, while investments in crushing capacity are running ahead of
production such that capacity stood at 400 000t per annum in 2014 (Takala-Greenish,
16 South Africa is currently importing at US$ 300/t. This implies that if Zambia can lower production costs at US$ 300/t and transport costs to Gauteng can be reduced to US$ 100/t, Zambian animal feed exporters would enjoy a significant profit margin.
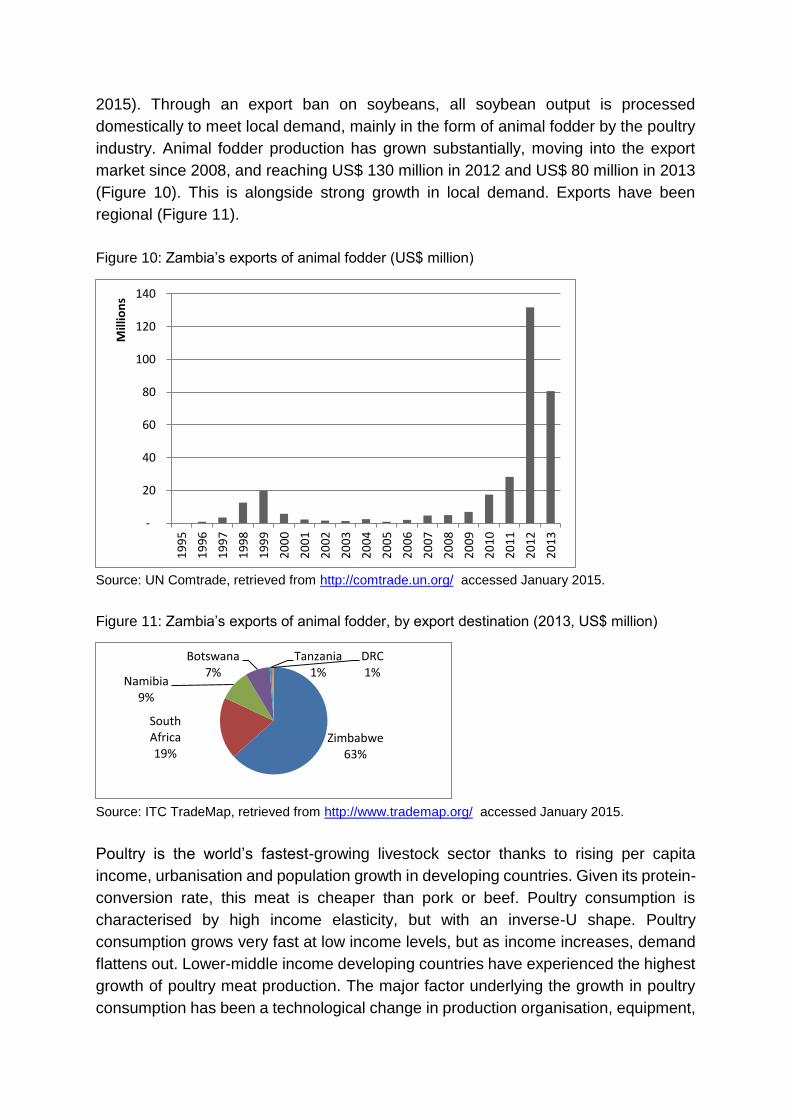
2015). Through an export ban on soybeans, all soybean output is processed
domestically to meet local demand, mainly in the form of animal fodder by the poultry
industry. Animal fodder production has grown substantially, moving into the export
market since 2008, and reaching US$ 130 million in 2012 and US$ 80 million in 2013
(Figure 10). This is alongside strong growth in local demand. Exports have been
regional (Figure 11).
Figure 10: Zambia’s exports of animal fodder (US$ million)
Source: UN Comtrade, retrieved from http://comtrade.un.org/ accessed January 2015.
Figure 11: Zambia’s exports of animal fodder, by export destination (2013, US$ million)
Source: ITC TradeMap, retrieved from http://www.trademap.org/ accessed January 2015.
Poultry is the world’s fastest-growing livestock sector thanks to rising per capita
income, urbanisation and population growth in developing countries. Given its protein-
conversion rate, this meat is cheaper than pork or beef. Poultry consumption is
characterised by high income elasticity, but with an inverse-U shape. Poultry
consumption grows very fast at low income levels, but as income increases, demand
flattens out. Lower-middle income developing countries have experienced the highest
growth of poultry meat production. The major factor underlying the growth in poultry
consumption has been a technological change in production organisation, equipment,
-
20
40
60
80
100
120
140
19
95
19
96
19
97
19
98
19
99
20
00
20
01
20
02
20
03
20
04
20
05
20
06
20
07
20
08
20
09
20
10
20
11
20
12
20
13
Mill
ion
s
Zimbabwe63%
South Africa19%
Namibia9%
Botswana7%
Tanzania1%
DRC1%
genetic material and inputs, which have made poultry products significantly cheaper
(Narrod et al., 2007).
The region’s poultry sector is characterised by a dual market structure: a market of
small producers selling live chicken or frozen whole chickens, and supermarkets and
other retailers supplied by modern abattoirs. The latter sell processed, frozen,
packaged and branded meat (Narrod et al., 2007). Moreover, food service outlets are
becoming increasingly important for poultry meat products (chicken nuggets, chicken
breast sandwiches, fried drumsticks).
South Africa is the region’s largest market in the poultry sector, both in terms of supply
and demand. Consumption has grown from 19.7kg/per capita in 2000 to a projected
35kg/per capita in 2013 (DAFF, 2011). However, South Africa continues to have a
poultry trade deficit of 15-20% of demand, met largely from Brazil and Europe. Other
regional markets are also fast growing, although from a lower basis, for example
Zambia and Mozambique have seen 20% CAGR in 2005-2012 (Technoserve, 2011;
Poultry Association of Zambia http://paoz.org). The fact that, for example, Zambia’s
consumption is still at approximately 12kg per capita shows the potential for further
growth. Other estimates suggest demand for poultry globally by those on median
incomes will more than double over the next three decades and it will shift from being
mainly purchased from the live market to being sourced in as processed fresh and
frozen chicken from supermarkets (Aho, 2013).
To give a sense of scale, South Africa is by far the largest producer with production of
one billion broilers in 2012, compared with 25 million in Zambia and Botswana (Figure
12). However, Zambian production almost trebled from 2009 to 2012 reflecting rapid
urbanisation and growth in disposable income of the population as well as improved
competitiveness of the local industry. Botswana’s infant industry protection has also
supported very strong growth from 2010. Note that Botswana imports raw materials
for its feed manufacturing mostly from South Africa, with a shift to Zambia in recent
years, as does Namibia since it started significant local poultry meat production in
2012.
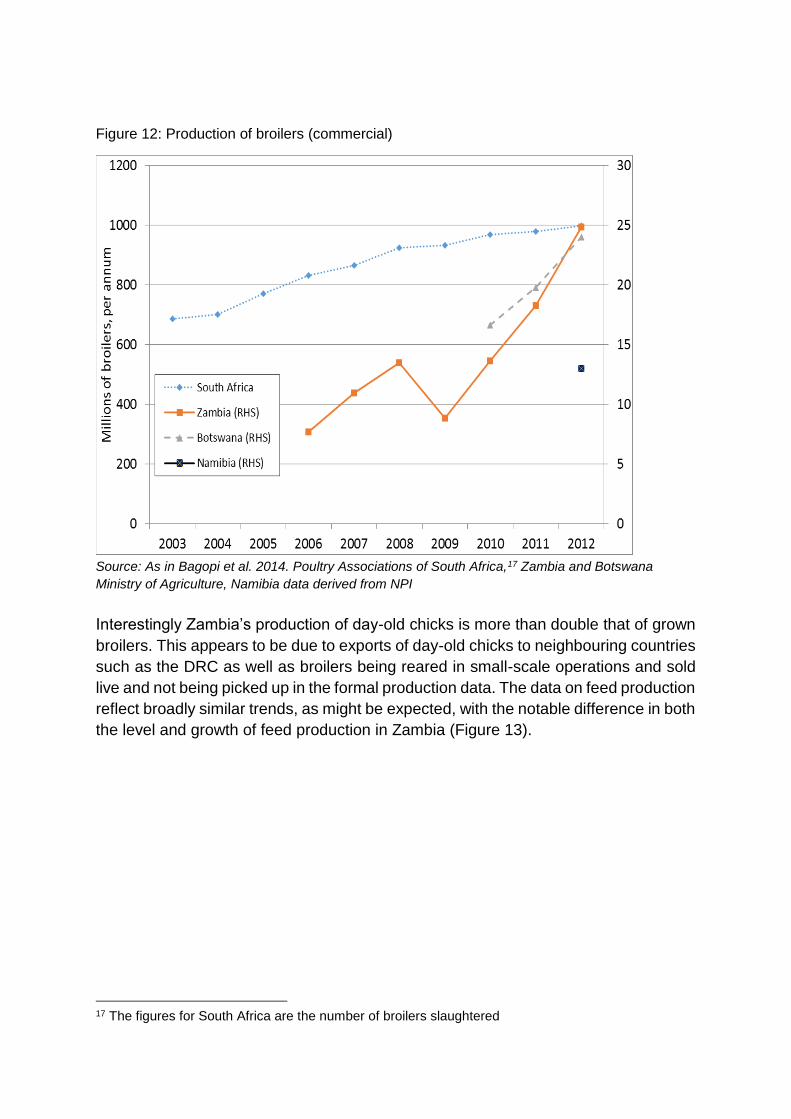
Figure 12: Production of broilers (commercial)
Source: As in Bagopi et al. 2014. Poultry Associations of South Africa,17 Zambia and Botswana
Ministry of Agriculture, Namibia data derived from NPI
Interestingly Zambia’s production of day-old chicks is more than double that of grown
broilers. This appears to be due to exports of day-old chicks to neighbouring countries
such as the DRC as well as broilers being reared in small-scale operations and sold
live and not being picked up in the formal production data. The data on feed production
reflect broadly similar trends, as might be expected, with the notable difference in both
the level and growth of feed production in Zambia (Figure 13).
17 The figures for South Africa are the number of broilers slaughtered
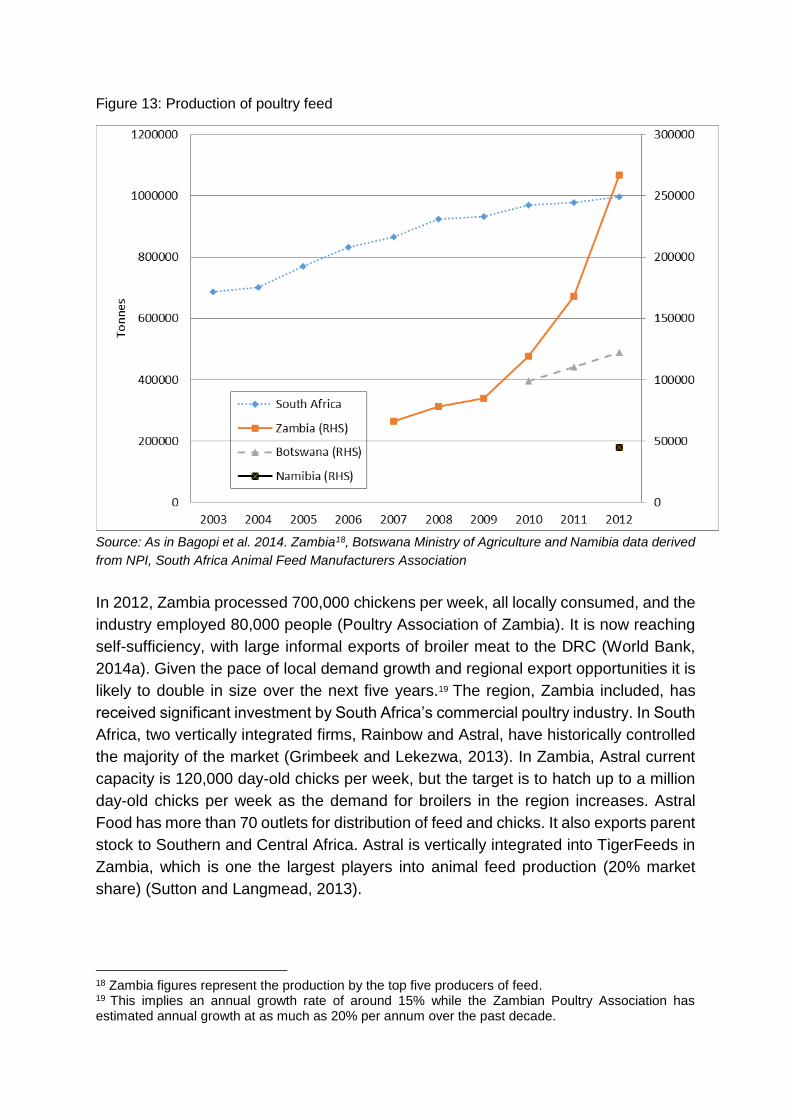
Figure 13: Production of poultry feed
Source: As in Bagopi et al. 2014. Zambia18, Botswana Ministry of Agriculture and Namibia data derived
from NPI, South Africa Animal Feed Manufacturers Association
In 2012, Zambia processed 700,000 chickens per week, all locally consumed, and the
industry employed 80,000 people (Poultry Association of Zambia). It is now reaching
self-sufficiency, with large informal exports of broiler meat to the DRC (World Bank,
2014a). Given the pace of local demand growth and regional export opportunities it is
likely to double in size over the next five years.19 The region, Zambia included, has
received significant investment by South Africa’s commercial poultry industry. In South
Africa, two vertically integrated firms, Rainbow and Astral, have historically controlled
the majority of the market (Grimbeek and Lekezwa, 2013). In Zambia, Astral current
capacity is 120,000 day-old chicks per week, but the target is to hatch up to a million
day-old chicks per week as the demand for broilers in the region increases. Astral
Food has more than 70 outlets for distribution of feed and chicks. It also exports parent
stock to Southern and Central Africa. Astral is vertically integrated into TigerFeeds in
Zambia, which is one the largest players into animal feed production (20% market
share) (Sutton and Langmead, 2013).
18 Zambia figures represent the production by the top five producers of feed. 19 This implies an annual growth rate of around 15% while the Zambian Poultry Association has estimated annual growth at as much as 20% per annum over the past decade.
Rainbow Chicken bought a 49% share of Zambeef’s poultry division, Zamchick, in
early 2013. Zamchick is a major producer of broiler meat and table eggs, processing
5 million chickens per annum and producing 40 million eggs in 2014. In 2013, Zambeef
and Rainbow launched a new broiler parent stock rearing, laying, and hatching
operation for the supply of day-old chicks (Zamhatch Ltd.). The group is also market
leader in animal feed production, through Novatek (30% market share) (Sutton and
Langmead, 2013). Zambeef processes half of the national soybean output, of which
40% is grown in the company farms.
The regional flows of FDI in the poultry value chain have resulted in increased
production capabilities in Zambia, but also in limited competition between very large
vertically integrated companies. Increased production capabilities are opening the
door for Zambia to become a regional hub for animal feed and, potentially, broiler
meat. South Africa imports 350 000t of soybeans per year from Argentina, however,
Zambia’s soybean has been too expensive to compete. In 2011 the cost of production
for commercial farmers in Zambia was US$ 451 and US$ 398 per ton for farming on
dry land and using irrigation respectively (Takala-Greenish, 2015) while delivered
prices were at import levels of around US$700/ton (Bagopi et al., 2014). Zambeef’s
costs of production have been falling with large-scale investments in production and
in 2014 were estimated to be approaching US$300/t, including local transport costs.
At these prices and with efficient transport costs Zambia will be competitive across the
southern African region. In particular, if processing costs were maintained at
competitive level, Zambia could meet the regional demand for animal feed and lower
poultry production costs, especially in neighbouring countries Botswana and Namibia.
Apart from efforts to reduce transportation costs and increase yields, this objective
would also require cooperation between countries with strong national lobbies from
feed mills and oil producers. The relationship between regional integration, transport
costs, trade policy and competition is often complex, and deserves in-depth analysis
at the industry and country specific levels (Box 3).
Box 3: Transport, competition and regional integration
Trade flows are linked to the production and location decisions of firms and the
trade policy environment in the region. While investment decisions to grow
productive capacity in Zambia can realise competitive businesses and efficient
scale in areas where Zambia has a potential comparative advantage, it is also
necessary to be able to be get products to market. Transport costs are critical to
being able to access markets such as South Africa.
In poultry, the available evidence suggests that it costs more to export maize (for
animal feed) from Zambia to South Africa than for South Africa to import from
Argentina. Similar concerns were raised by importers of sugar in South Africa
seeking to source from Zambia. This speaks, in part, to constraints in terms of
transport infrastructure, the harmonization of regulations in transportation, as well
as delays and costs of transit at border posts for instance.
Transport arrangements also impact on the ability to source key inputs such as
fertilizer. A 2014 study found that opening up road transport in Zambia, Zimbabwe
and South Africa had led to Zambia undermining the incumbent fertilizer traders
and had lowered prices in Zambia significantly compared to other countries such
as Malawi and Tanzania. This had involved improved levels of competition in the
freight sector (and stabilised prices) by improving domestic regulatory measures
and increasing efficiency to allow for increased competition in the sector including
from cross-border operators from South Africa and Zimbabwe in particular (Ncube
et al., 2014).
This example illustrates the significance of transportation as an enabler to greater
cross-border rivalry. Cross-border competition relies on customers across the
region being able to access substitutes in a timely and feasible manner such as to
constrain the exercise of market power in a narrow geographic market often
delimited by national borders. To take the example of cement, prices in Tanzania
are relatively lower than those in neighbouring markets and while the Mbeya
Cement (Lafarge) plant located in Mbeya is in Tanzania, it is situated just on the
border with Zambia while other plants in Zambia are located further away, nearer
to Lusaka. Other things equal, and absent colonial borders and restrictions, cement
produced in this area should serve as a competitive alternative to Zambian cement
in this area. However, prices remain vastly different between these areas which
may be due to the fact that Lafarge is also present in Zambia, as well as by trade
and transport constraints.
There is further evidence of the positive effects of new entry in the Zambian and
Tanzanian fertilizer industries. Fertilizer markets in the region are largely
oligopolistic and largely dominated by international giants such as Omnia and Yara
International. A recent study into competition in the road transportation of fertilizer
in Zambia, Malawi and Tanzania shows that new entry in the Zambian fertilizer
industry following the uncovering and prosecution of a fertilizer cartel which lasted
from 2007 to 2012, have led to greater price competition. Following the cessation
of the cartel, the Export Trading Group which has grown its share of fertilizer
markets in several African countries, and has brought greater price competition to
the erstwhile cartelists in Zambia (Nyiombo Investments and Omnia). The growth
of the firm in Tanzania has also seen it capture an estimated 20-40% market share,
in competition with the dominant incumbent, Yara. Interestingly, in South Africa the
same major producers of intermediate fertilizer products, Omnia and Kynoch (then
owned by multinational Yara) were found to have engaged in cartel conduct along
with Sasol.20
These examples illustrate the linkages between trade policy, transportation costs,
and the strategic location decisions of firms, and the need for further research in
this area. Regional integration cannot be achieved where conflicting trade policies
across countries, inefficiencies in transportation, and strategic behaviour of firms
undermine rivalry between firms across political borders.
The challenges in building competitive supply through the value chain is highlighted
by the fact that animal feed prices in Zambia until 2012 were in fact higher than in
South Africa, as were the prices of breeding stock (day old chicks) and of frozen
poultry meat (even after adjusting for brining) (Bagopi et al. 2014).21 This reflects the
importance of ensuring competition between suppliers so that upstream cost
advantages flow through to competitive downstream production.
Zambeef Products Group, one of Zambia’s largest agribusinesses, employing over
5,500 staff, is one of the most successful examples of value chain upgrading in Africa.
Zambeef is involved in the production, processing, distribution and retailing of meat
and dairy products, eggs, edible oils, stock feed, flour and bread (Company Reports).
It has vigorously pursued a strategy of vertical integration: the Zambeef group includes
5 farms (17,000 hectares of irrigated and rain-fed crops, mainly wheat, maize,
soybean, and oil plantation), 3 processing plants, 10 abattoirs, 20 Shoprite butcheries,
90 retail outlets, 3 wholesale depots, 8 Zamchick Inns. The distribution strategy was
particularly important in light of the fast-growing demand and profitability of
supermarket and food service outlets. In 1998, it reached a strategic partnership with
Shoprite, Africa’s largest retailer, which evolved in Zambeef running and managing its
own in-house butcheries in Shoprite branches. Moreover, the group operates its own
fast food chain, Zamchick Inn. Its subsidiary, Zamanita Ltd, acquired in 2008, is one
of the largest edible oil and soya cake producers in Zambia. In 2012, Zamanita
successfully commissioned a large upgrade and expansion of its soybean crushing
and Solvent Extraction Plant, which has doubled the crushing capacity from 50,000
20 Competition Commission Media Release (5 July 2010), ‘Sasol agrees to divestiture in the fertiliser case’, available: http://www.compcom.co.za/assets/Uploads/AttachedFiles/MyDocuments/Final-Sasol-media-release-050710.pdf 21 Day old chick prices in Zambia were estimated at more than double that of South Africa in 2012, while breeding was very concentrated (Bagopi et al. 2014).
tons per annum to 100,000 tons per annum. This division currently supplies all of
Zambeef internal requirements (33%) and the surplus stock feed (67%) is sold to third
parties in Zambia and the region. Its regional expansion strategy includes West Africa,
where it has piggy-backed on its partnership with Shoprite.
Zambeef’s vertical integration strategy highlights how critical supply chain and forward
linkages strategies are in the agro-food industry. Firstly, the main challenge for
processing firms in the region has been securing access to raw materials that meet
their requirements in terms of price, quality and consistency (Cramer, 1999). Whist
large companies have been able to control raw materials supply through vertical
integration and/or various outgrower contractor arrangements (sugar, cotton), this
poses a significant challenge for smaller processing firms. Secondly, by supplying
modern, fast-growing distribution outlets, firms can capture higher profit margins and
move into value-added activities. Section 3.2 has discussed how smaller firms and
new entrants may struggle to do this, hence the need for public and private initiatives
to support local supplier upgrading.
4. Industrialisation opportunities in the engineering sector
In April 2012, the Ministry of Commerce, Trade and Industry (MCTI) in collaboration
with Japan International Cooperation Agency (JICA) released a strategy document
entitled “Industry Strategy for Engineering Products in the Region - The Hub of
Manufacturing of Engineering Products in the Region”. This document sought to pilot
a 5 year strategy and action plan in the engineering products sector, one of the six
priority sectors identified by the MCTI (see Section 5). The intention by the ministry is
to extend the successful processes from this pilot to the other five sectors.
Within the engineering sector, two sub-sectors have been expressly identified by the
MCTI as presenting opportunities for accelerated growth, development and increased
regional exports - copper fabrication and iron and steel products. These sub-sectors
have been the biggest contributors towards the engineering sector (see Section 2.2).
The intention is for government to develop links between domestic producers,
exporting companies and regional purchasers.
In this phase of the research it was not possible to conduct a thorough assessment of
the MCTI strategy in terms of whether it is effectively designed or what the progress
has been in its implementation. A preliminary analysis however pinpoints to a few
issues. Firstly, the strategy will require more specificity in order to support
implementable action plans. The strategy’s action plans currently do not distinguish
between copper fabrication and iron and steel, require basic information gathering,
and are not sufficiently specific in terms of actions required from government and
private sector. Secondly, it may be necessary to adjust the timeframe for
implementation. The wide range of action plans (20 action plans over 8 strategy
components), which include the enactment of new laws, are to be implemented over
a very short space of time (5 years).
In the next sections we assess trends and developments in each of these sub-sectors.
In the third section, we present a separate case study on manufacturing linkages to
the mining sector in particular looking at the supply of capital equipment and other
inputs to mines. We believe greater opportunities exist in this space within the
engineering sector which could locate Zambia as the regional hub, particularly for
growing mining activities in the DRC.
4.1 Copper fabrication
The focus on exports of fabricated copper spurred from a view by the MCTI that, in
addition to the country’s abundance in copper ore, there has been a gradual
accumulation of technology and human resources through emerging copper
fabrication companies. In addition to a growing domestic market, the opportunities that
stem from a growing regional market have been identified for this sub-sector. The main
users of value-added copper products in Zambia are the power (40%), mining (10%)
and construction22 (50%) sectors (MCTI, 2012).
As mentioned in section 2, exports of copper semi-fabricates peaked in in 2006, with
US$ 289 million in exports, and since then declined. South Africa has been the most
important market for all copper semi-fabricates with the exception of flat products
(Table 11).
The regional market is key because copper fabricators operate on very low margins,
hence transport cost have a large impact on profitability. Whilst Zambia is
implementing reforms and investment to bring transport costs down, in the medium
term these are going to be serious constraints to low margin businesses (Box 4).
Zambia currently has no manufacturing facility for flat semi-fabricates and copper
alloy.
22 Construction includes ‘ Construction and other’
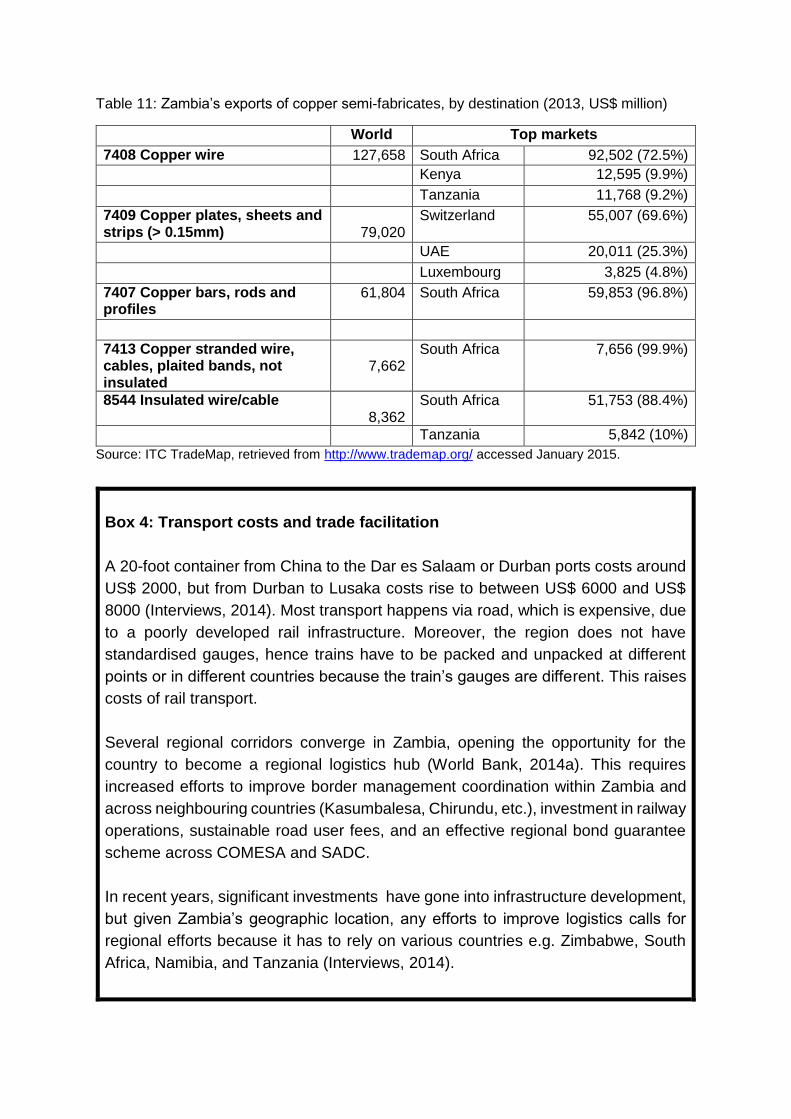
Table 11: Zambia’s exports of copper semi-fabricates, by destination (2013, US$ million)
World Top markets
7408 Copper wire 127,658 South Africa 92,502 (72.5%)
Kenya 12,595 (9.9%)
Tanzania 11,768 (9.2%)
7409 Copper plates, sheets and strips (> 0.15mm)
79,020
Switzerland 55,007 (69.6%)
UAE 20,011 (25.3%)
Luxembourg 3,825 (4.8%)
7407 Copper bars, rods and profiles
61,804 South Africa 59,853 (96.8%)
7413 Copper stranded wire, cables, plaited bands, not insulated
7,662
South Africa 7,656 (99.9%)
8544 Insulated wire/cable 8,362
South Africa 51,753 (88.4%)
Tanzania 5,842 (10%)
Source: ITC TradeMap, retrieved from http://www.trademap.org/ accessed January 2015.
Box 4: Transport costs and trade facilitation
A 20-foot container from China to the Dar es Salaam or Durban ports costs around
US$ 2000, but from Durban to Lusaka costs rise to between US$ 6000 and US$
8000 (Interviews, 2014). Most transport happens via road, which is expensive, due
to a poorly developed rail infrastructure. Moreover, the region does not have
standardised gauges, hence trains have to be packed and unpacked at different
points or in different countries because the train’s gauges are different. This raises
costs of rail transport.
Several regional corridors converge in Zambia, opening the opportunity for the
country to become a regional logistics hub (World Bank, 2014a). This requires
increased efforts to improve border management coordination within Zambia and
across neighbouring countries (Kasumbalesa, Chirundu, etc.), investment in railway
operations, sustainable road user fees, and an effective regional bond guarantee
scheme across COMESA and SADC.
In recent years, significant investments have gone into infrastructure development,
but given Zambia’s geographic location, any efforts to improve logistics calls for
regional efforts because it has to rely on various countries e.g. Zimbabwe, South
Africa, Namibia, and Tanzania (Interviews, 2014).
Zambia is already putting in place measures to reduce trading costs (World Bank,
2014b). These include: introduction of pre-arrival declarations, improved customs
data management and risk management systems, elimination of pre-shipment
inspection requirements, and One Stop Border Posts. Moreover, interviews
confirmed that in order to deal with border management and border co-ordination,
government is launching an initiative called “single window for trade”, which will be
a single window system which will have all the border agencies (16) under one
platform. Border agencies however need to improve publication and transparency
of documentation requirements for cross-border trade because traders struggle to
access information (World Bank, 2014b).
Moreover, Citi Bank has facilitated an e-payment system, which involves 5 other
banks. The system is centralised so that payments made in one office reflects
everywhere (firms can pay in Lusaka instead of at the borders). There are a couple
of bottlenecks: firstly, smaller players are not yet on board regarding the e-payment
system, and secondly, the system is internet-based but there isn’t sufficient
bandwidth.
The domestic market absorbs around 10,000 t of copper, 40% of which is sourced
locally (MCTI, 2012). The industry is small, employing less than 1,000 workers (Dinh,
2013). US-owned ZAMEFA (Metal Fabricators of Zambia Limited) has historically
been the largest industry player, producing copper rods, wires and cables. Around a
third of its output is sold domestically to electricity utility, ZESCO, and
telecommunications company ZAMTEL, the mines and other utilities. Non Ferrous
Metals, which sources scrap to produce copper alloys castings, has been in operation
for a long time and is a long established supplier to the mining sector. Other new
entrants include: Kavino, which sources copper rods from ZAMEFA, to produce,
among others, copper cables for the domestic market; ZALCO, which sources scrap
copper to produce copper rods; El Sewedy Transformers (a partnership between an
Egyptian company and ZESCO) which produces electrical transformers for the
regional market, but imports copper sheets. El Sewedy’s selection of Zambia as its
choice of country to set up manufacturing facilities to cater for exports to the region is
illustrative, in MCTI’s view, of the potential for growth of this subsector. The
construction of a copper sheet production facility is being considered by El Sewedy on
the back of growth of the regional market. The MCTI views such investment, whether
undertaken by ZAMEFA or El Sewedy, as a competitive advantage for Zambia over
regional countries (MCTI, 2012).
Whilst acknowledging constraints in terms of skills, high manufacturing costs, lack of
supporting industries and high import intensity, MCTI is of the view that the following
factors confer Zambia a potential advantage in copper fabrication: the recent entry of
new fabricators as highlighted above, natural protection of being a landlocked country
and a growing regional market in terms of GDP and population (MCTI, 2012).
It is not clear nevertheless how the strategy addresses cost-raising factors, such as
electricity, finance and skills, and whether the regional market can sustain the demand
for these products which are linked to demand from infrastructure and industrial users
rather than population and GDP.
Further, looking at the challenges facing ZAMEFA sheds light on issues that could
constrain other smaller firms and the new entrants listed above once they seek to
expand. ZAMEFA competes with Chinese companies importing cables and wires duty
free, while the company has to pay duties and taxes on imported aluminium and plastic
compounds (Sutton and Langmead, 2013). This problem with the national tariff
schedule cuts across several sectors (Box 6). The regulatory environment is
problematic because the Citizen Economic Empowerment Commission is enforcing
local procurement measures through SOE ZESCO which give preferential treatment
to Zambian-owned trading companies compared to US-owned ZAMEFA (ZAMEFA,
2013). Moreover, the firm has to compete with low quality products which do not meet
domestic standards.
In addition, contrary to the views of the MCTI, a 2012 study conducted for the Jobs,
Prosperity and Competitiveness Project on the feasibility of copper fabrication
concluded that Zambia was unlikely to develop a competitive industry (Nathan
Associates and EME, 2010). The authors argued that access to copper cathodes
would not confer sufficient cost advantages to Zambia, and proximity to markets was
more critical. Moreover any cost advantage would be offset by the transport costs to
global markets, cost of importing other metals to produce copper alloys, unreliable
power, cost of finance and skilled labour. The study argues that the regional market
was still too small to support significant investment in production capacity, and South
African fabricators would be more competitive than Zambian fabricators. Moreover
copper fabrication was a low margin business and was exposed to the same
fluctuations as refined copper. Despite these challenges, the Zambian government
has decided to prioritise copper fabrication through the MCTI policy, strategy and
action plan in this sub-sector in its industrial policy.
More recently China’s NFCA has invested in the Chambishi Zambia-China Economic
and Trade Cooperation Zone (ZCCZ), a US$ 800 million-worth investment, which will
include, among others, a copper semi-fabricates manufacturing plant. This investment
is likely to have a major impact on the industry, but a number of complementary
strategies need to be put in place by Zambia in order to maximise the impact on the
domestic economy. A crucial aspect in this respect is the maximisation of employment
and skills development linkages. Whilst technical training in Zambia has lagged behind
industry needs, major investment in a range of skills, especially technical and artisanal,
is required to meet the demand for skilled labour of new investors within a reasonably
short timeframe (Box 5).
Box 5: Skills for industrial development
Zambia’s nominal wages are lower than China’s, but this is offset by lower
productivity levels (Dinh, 2013). Higher inflation rates make Zambia labour costs
more expensive than other low income countries. Training for management and
technical staff and investment in modern equipment are critical to increase Zambia’s
competitiveness.
Zambia focused, and made progress, on primary education, but technical skills
have not received commensurate attention (OECD, 2012). Zambia’s suffers from
acute skills gaps, in terms of output and quality. Although there has been growth in
the workforce with post-secondary education driven by employment opportunities
in the service sector, the quality of education has dropped (Moono and Rankin,
2013). In the manufacturing sector, the premium paid to those with post-secondary
education does not differ as much across qualification, indicating that schools need
to strengthen industry-specific training. Technical schools’ curricula do not match
the need and technologies of industry. In particular, there is no cooperation between
technical institutions and industry in developing the curricula, and in teaching
students (Interviews, 2014). Teachers have limited practical experience and
schools use outdated equipment. The recent TEVET Development Programme
aims to coordinate initiatives by government, cooperating partners and private
sector to address this problem (OECD, 2012).
4.2 Iron and steel products
The iron and steel sub-sector was identified as crucial in providing cost-effective inputs
to cater for growing demand in other sectors, such as construction and manufacturing,
as well as growing demand in the region. It was also identified as a sub-sector that
could potentially contribute to employment creation and development of MSMEs.
Given the rich deposits of iron ore and coal in Zambia and possibility for significant
import substitution, this sub-sector was identified as a priority (MCTI, 2012).
The contribution of steel and iron metal fabrication to GDP has increased in recent
years, up to 20% in 2011 (Sutton and Langmead, 2013). There are around 40 formal
firms, employing an estimated 2,000 to 6,000 people (Dinh, 2013; MCTI, 2012). In
2011, production amounted to 100,000 t, 50% of total apparent consumption (MCTI,
2012).
Fabricators usually rely on imported steel from South Africa through local distributors
or South African traders/merchants such as Macsteel that have subsidiaries in Zambia
Steel is therefore expensive because of transportation costs and import duties (20%).
However steel foundries relying on scrap steel (instead of virgin steel) have recently
entered the market.
Local production, including those by steel foundries, is presently limited to long steel
products (round bars, sections, angle bars), while no facilities to produce flat steel
products like hot rolled sheets or tubes exist. As stated however, new investment in
metal fabrication has been driven partly by a boom in the construction industry, hence
there has been significant production of roofing sheets (manufactured from imported
flat steel coil/sheets). Flat steel (hot and cold rolled coil) imports from South Africa are
likely to be predominantly from ArcelorMittal South Africa (AMSA).23
Similar to copper fabricators, there has been growth in recent years of steel
companies. Even though Zambia has a trade deficit in steel and iron metal products,
there are encouraging signs of growth of exports. Indeed part of the MCTI’s rationale
in developing this subsector is to reduce the trade deficit. Imports of iron and steel
have grown significantly since 2000s (Table 4, Section 2.2). Imports increased from
US$ 41 million in 2005 to US$ 562 million in 2013, a 30% CAGR. As seen in Figure
14 below, iron and steel exports picked up since 2008, whilst iron and steel fabricated
products exports picked up between 2011 and 2012. This has coincided with the entry
into the domestic market of new investors in the mid-2000s. The most important
development has been the entry into the market of Universal Mining and Chemical
Industries Limited (UMCIL), half owned by Trade Kings (Sutton and Langmead, 2013).
The firm produces deformed bar, and in less quantities, other long sections, and
exports 40% of its output to the region. It is SABS certified, which allowed it to gain
market share quickly and reverse scepticism from local consumers over domestically
23 The pricing of AMSA’s flat steel products in South Africa has been a controversial issue for over a decade, with an excessive pricing case being brought to the competition authorities against AMSA (then Iscor) by South African gold mining company, Harmony Gold. The Competition Tribunal of South Africa found AMSA guilty of excessive pricing, an abuse of its dominant position in the flat steel market. However upon appeal, the Competition Appeal Court remitted the matter to the Tribunal for further analysis, and the parties subsequently settled out of court confidentially. AMSA’s pricing to the region, including to Zambia, was on the same basis as its pricing in South Africa, in effect treating the regional market as an extension of the South African market. In South Africa, the allegation was that the excessive prices for flat steel as a key input into many downstream manufacturing industries stifled their competitiveness and development.
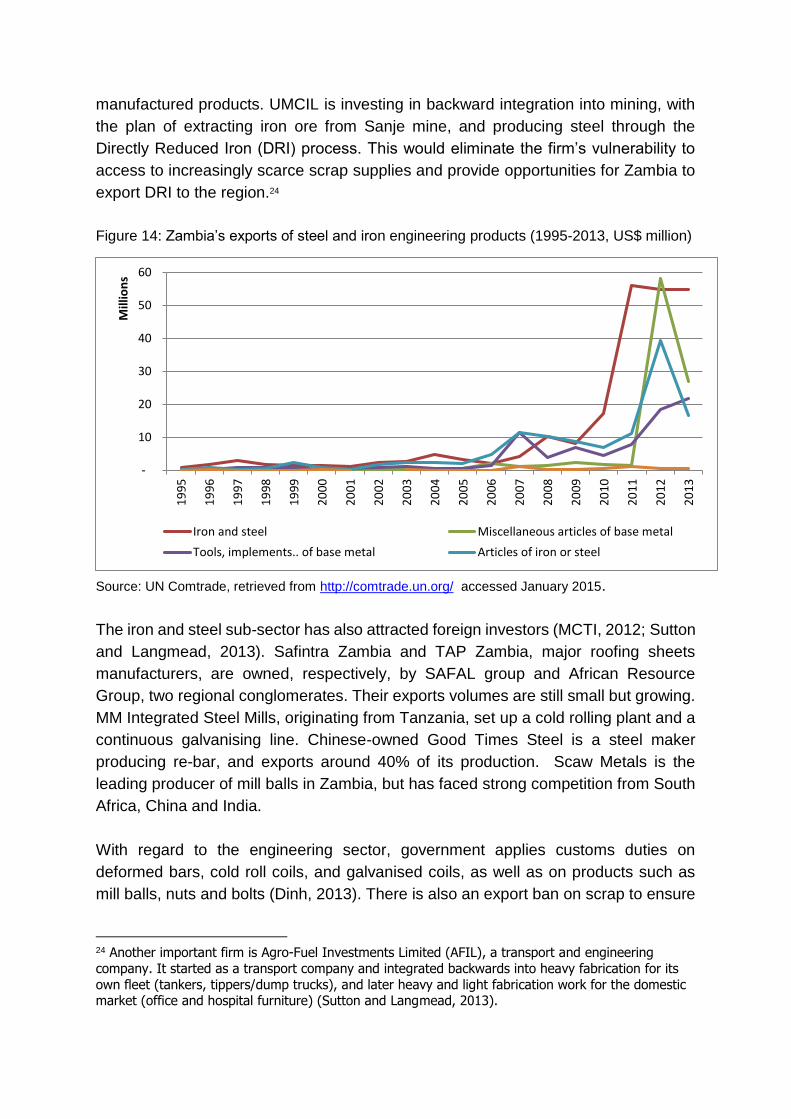
manufactured products. UMCIL is investing in backward integration into mining, with
the plan of extracting iron ore from Sanje mine, and producing steel through the
Directly Reduced Iron (DRI) process. This would eliminate the firm’s vulnerability to
access to increasingly scarce scrap supplies and provide opportunities for Zambia to
export DRI to the region.24
Figure 14: Zambia’s exports of steel and iron engineering products (1995-2013, US$ million)
Source: UN Comtrade, retrieved from http://comtrade.un.org/ accessed January 2015.
The iron and steel sub-sector has also attracted foreign investors (MCTI, 2012; Sutton
and Langmead, 2013). Safintra Zambia and TAP Zambia, major roofing sheets
manufacturers, are owned, respectively, by SAFAL group and African Resource
Group, two regional conglomerates. Their exports volumes are still small but growing.
MM Integrated Steel Mills, originating from Tanzania, set up a cold rolling plant and a
continuous galvanising line. Chinese-owned Good Times Steel is a steel maker
producing re-bar, and exports around 40% of its production. Scaw Metals is the
leading producer of mill balls in Zambia, but has faced strong competition from South
Africa, China and India.
With regard to the engineering sector, government applies customs duties on
deformed bars, cold roll coils, and galvanised coils, as well as on products such as
mill balls, nuts and bolts (Dinh, 2013). There is also an export ban on scrap to ensure
24 Another important firm is Agro-Fuel Investments Limited (AFIL), a transport and engineering
company. It started as a transport company and integrated backwards into heavy fabrication for its
own fleet (tankers, tippers/dump trucks), and later heavy and light fabrication work for the domestic market (office and hospital furniture) (Sutton and Langmead, 2013).
-
10
20
30
40
50
60
19
95
19
96
19
97
19
98
19
99
20
00
20
01
20
02
20
03
20
04
20
05
20
06
20
07
20
08
20
09
20
10
20
11
20
12
20
13
Mill
ion
s
Iron and steel Miscellaneous articles of base metal
Tools, implements.. of base metal Articles of iron or steel
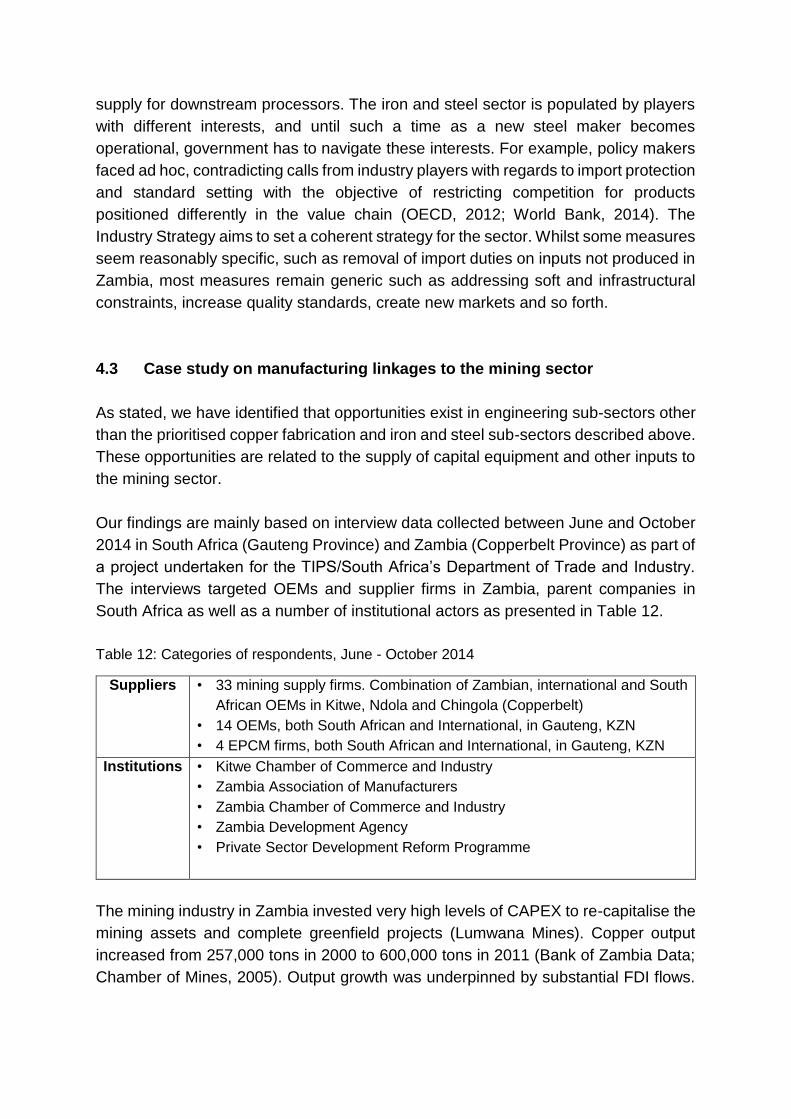
supply for downstream processors. The iron and steel sector is populated by players
with different interests, and until such a time as a new steel maker becomes
operational, government has to navigate these interests. For example, policy makers
faced ad hoc, contradicting calls from industry players with regards to import protection
and standard setting with the objective of restricting competition for products
positioned differently in the value chain (OECD, 2012; World Bank, 2014). The
Industry Strategy aims to set a coherent strategy for the sector. Whilst some measures
seem reasonably specific, such as removal of import duties on inputs not produced in
Zambia, most measures remain generic such as addressing soft and infrastructural
constraints, increase quality standards, create new markets and so forth.
4.3 Case study on manufacturing linkages to the mining sector
As stated, we have identified that opportunities exist in engineering sub-sectors other
than the prioritised copper fabrication and iron and steel sub-sectors described above.
These opportunities are related to the supply of capital equipment and other inputs to
the mining sector.
Our findings are mainly based on interview data collected between June and October
2014 in South Africa (Gauteng Province) and Zambia (Copperbelt Province) as part of
a project undertaken for the TIPS/South Africa’s Department of Trade and Industry.
The interviews targeted OEMs and supplier firms in Zambia, parent companies in
South Africa as well as a number of institutional actors as presented in Table 12.
Table 12: Categories of respondents, June - October 2014
Suppliers • 33 mining supply firms. Combination of Zambian, international and South
African OEMs in Kitwe, Ndola and Chingola (Copperbelt)
• 14 OEMs, both South African and International, in Gauteng, KZN
• 4 EPCM firms, both South African and International, in Gauteng, KZN
Institutions
• Kitwe Chamber of Commerce and Industry
• Zambia Association of Manufacturers
• Zambia Chamber of Commerce and Industry
• Zambia Development Agency
• Private Sector Development Reform Programme
The mining industry in Zambia invested very high levels of CAPEX to re-capitalise the
mining assets and complete greenfield projects (Lumwana Mines). Copper output
increased from 257,000 tons in 2000 to 600,000 tons in 2011 (Bank of Zambia Data;
Chamber of Mines, 2005). Output growth was underpinned by substantial FDI flows.
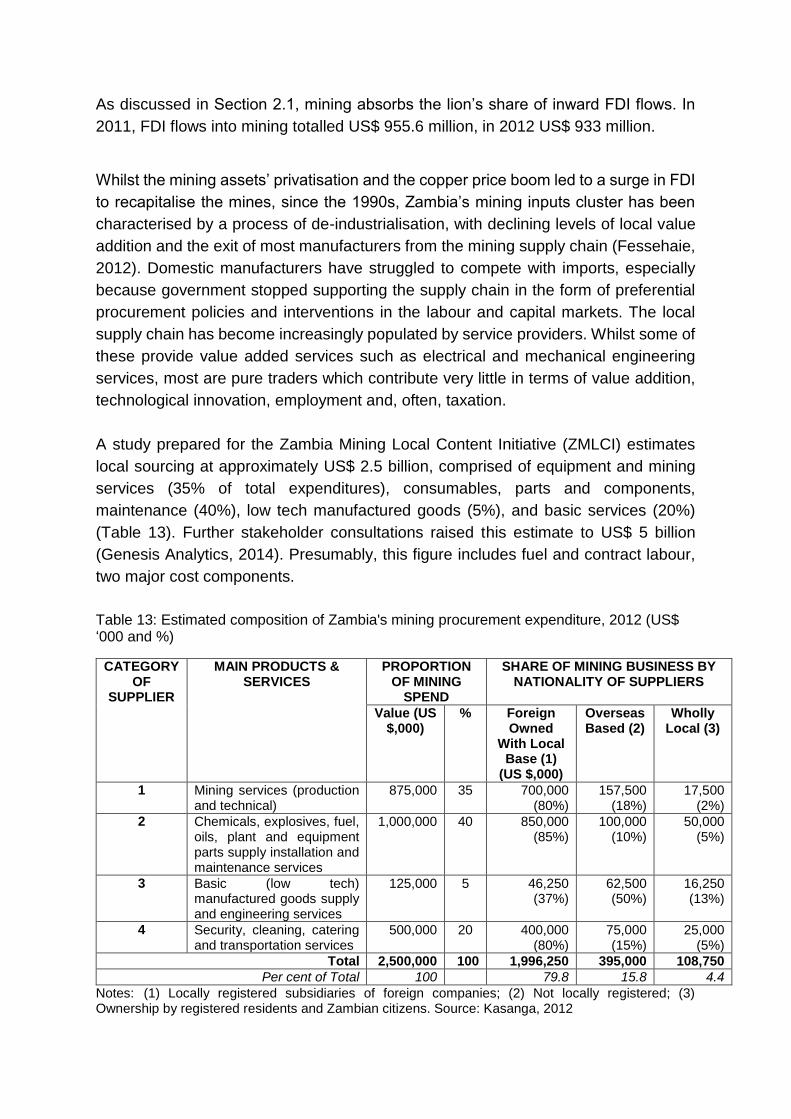
As discussed in Section 2.1, mining absorbs the lion’s share of inward FDI flows. In
2011, FDI flows into mining totalled US$ 955.6 million, in 2012 US$ 933 million.
Whilst the mining assets’ privatisation and the copper price boom led to a surge in FDI
to recapitalise the mines, since the 1990s, Zambia’s mining inputs cluster has been
characterised by a process of de-industrialisation, with declining levels of local value
addition and the exit of most manufacturers from the mining supply chain (Fessehaie,
2012). Domestic manufacturers have struggled to compete with imports, especially
because government stopped supporting the supply chain in the form of preferential
procurement policies and interventions in the labour and capital markets. The local
supply chain has become increasingly populated by service providers. Whilst some of
these provide value added services such as electrical and mechanical engineering
services, most are pure traders which contribute very little in terms of value addition,
technological innovation, employment and, often, taxation.
A study prepared for the Zambia Mining Local Content Initiative (ZMLCI) estimates
local sourcing at approximately US$ 2.5 billion, comprised of equipment and mining
services (35% of total expenditures), consumables, parts and components,
maintenance (40%), low tech manufactured goods (5%), and basic services (20%)
(Table 13). Further stakeholder consultations raised this estimate to US$ 5 billion
(Genesis Analytics, 2014). Presumably, this figure includes fuel and contract labour,
two major cost components.
Table 13: Estimated composition of Zambia's mining procurement expenditure, 2012 (US$ ‘000 and %)
CATEGORY OF
SUPPLIER
MAIN PRODUCTS & SERVICES
PROPORTION OF MINING
SPEND
SHARE OF MINING BUSINESS BY NATIONALITY OF SUPPLIERS
Value (US $,000)
% Foreign Owned
With Local Base (1)
(US $,000)
Overseas Based (2)
Wholly Local (3)
1 Mining services (production and technical)
875,000 35 700,000 (80%)
157,500 (18%)
17,500 (2%)
2 Chemicals, explosives, fuel, oils, plant and equipment parts supply installation and maintenance services
1,000,000 40 850,000 (85%)
100,000 (10%)
50,000 (5%)
3 Basic (low tech) manufactured goods supply and engineering services
125,000 5 46,250 (37%)
62,500 (50%)
16,250 (13%)
4 Security, cleaning, catering and transportation services
500,000 20 400,000 (80%)
75,000 (15%)
25,000 (5%)
Total 2,500,000 100 1,996,250 395,000 108,750
Per cent of Total 100 79.8 15.8 4.4
Notes: (1) Locally registered subsidiaries of foreign companies; (2) Not locally registered; (3) Ownership by registered residents and Zambian citizens. Source: Kasanga, 2012
Suppliers include locally-based international suppliers of goods and services (80% of
total value of procurement), overseas suppliers (16%), and locally-based Zambian
suppliers (4%). It is estimated that less than 5% of total goods is manufactured locally,
amounting to no more than US$ 87 million (Genesis Analytics, 2014; CMZ and ICMM,
2014). As discussed in Section 2.2, equipment imports were the largest import
component. Equipment imports increased from US$ 237.5 million in 2005 to US$ 1.8
billion in 2013, a 23% CAGR (Table 4). The bulk of this imports supplied the copper
mining sector, as reflected by discussion on CAPEX and inward FDI figures.
With the exception of one large steel foundry, domestic manufacturers supplying the
mining companies tend to be relatively small-sized. Some of these are family run
businesses owned by European and Indian migrants, which have been established
during the nationalisation era, others have been established post-1990s, have a more
formal management structure and are owned by South African and Asian investors.
Although limited in terms of volumes, local manufacturers supply a wide range of
inputs to mines, such as metallurgical, plastic and rubber products, engineering
products, and paints (Fessehaie, 2012). For example, Mopani mine sources the
following locally manufactured goods: cement, lime, concrete rail sleepers, roofing,
railway line accessories, explosives, rubber hoses, electrical cables, personal
protective equipment (Mopani, 2014).
The regional configuration of the supply chain is very important. While local sourcing
of equipment and other mining input supplies in Zambia is currently limited, the
growing demand in the Zambia and DRC mining sectors presents an opportunity for
Zambia to position itself as the regional hub for the supply of these products and linked
aftermarket services. Aftermarket services are important in terms of employment and
skills development, and can lay the basis for future assembly operations. The DRC
offers Zambian suppliers an opportunity to reach larger economies of scale for value
added activities. Already, re-exports of mining equipment to the DRC saw the largest
number of transactions and firms involved out of any other product in the 1999-2011
customs-transactions survey (Banda and Simumba, 2013; World Bank, 2014b).
According to ITC TradeMap Data, Zambia exported US$ 126.6 million worth of
equipment to the DRC, obviously these being re-exports.
The other key regional partner in the mining supply chain is South Africa. Zambia is
South Africa’s most important export market in the region.25 Indeed, the share of
mining capital equipment destined for Zambia increased from 8% in 2005 to 17% in
2012 (Figure 15).
25 According to data from South Africa Capital Equipment Exports Council (SACEEC)
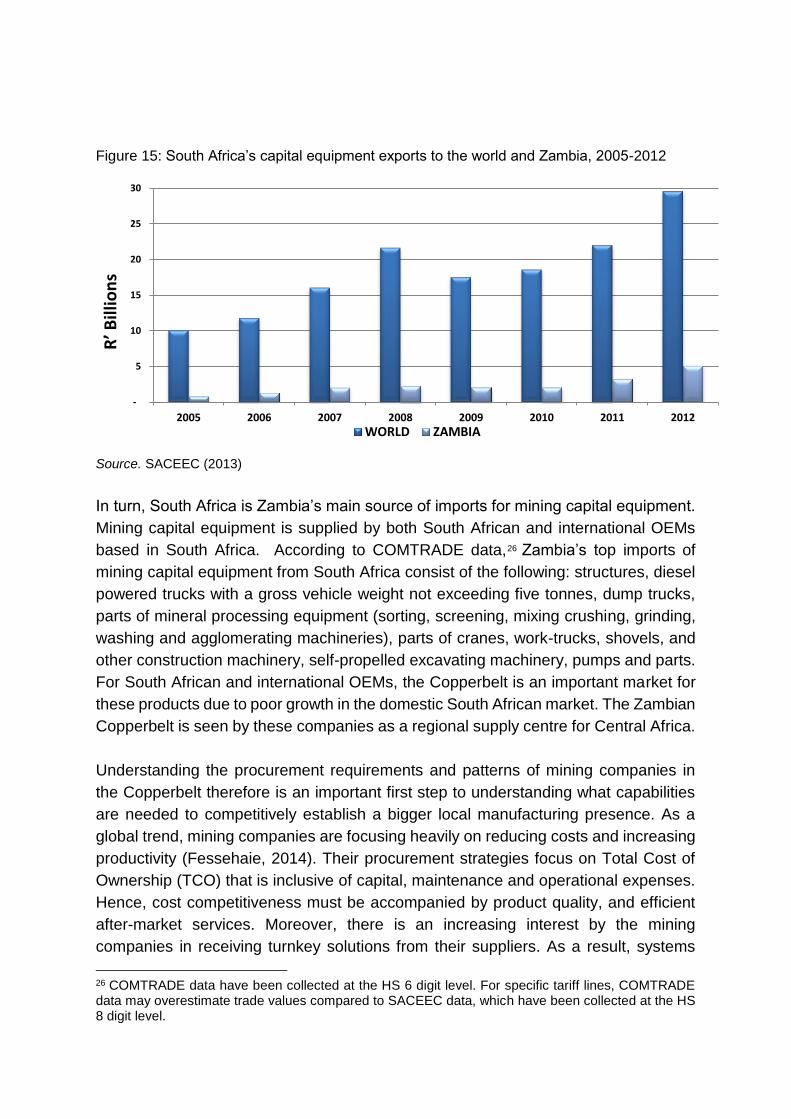
Figure 15: South Africa’s capital equipment exports to the world and Zambia, 2005-2012
Source. SACEEC (2013)
In turn, South Africa is Zambia’s main source of imports for mining capital equipment.
Mining capital equipment is supplied by both South African and international OEMs
based in South Africa. According to COMTRADE data,26 Zambia’s top imports of
mining capital equipment from South Africa consist of the following: structures, diesel
powered trucks with a gross vehicle weight not exceeding five tonnes, dump trucks,
parts of mineral processing equipment (sorting, screening, mixing crushing, grinding,
washing and agglomerating machineries), parts of cranes, work-trucks, shovels, and
other construction machinery, self-propelled excavating machinery, pumps and parts.
For South African and international OEMs, the Copperbelt is an important market for
these products due to poor growth in the domestic South African market. The Zambian
Copperbelt is seen by these companies as a regional supply centre for Central Africa.
Understanding the procurement requirements and patterns of mining companies in
the Copperbelt therefore is an important first step to understanding what capabilities
are needed to competitively establish a bigger local manufacturing presence. As a
global trend, mining companies are focusing heavily on reducing costs and increasing
productivity (Fessehaie, 2014). Their procurement strategies focus on Total Cost of
Ownership (TCO) that is inclusive of capital, maintenance and operational expenses.
Hence, cost competitiveness must be accompanied by product quality, and efficient
after-market services. Moreover, there is an increasing interest by the mining
companies in receiving turnkey solutions from their suppliers. As a result, systems
26 COMTRADE data have been collected at the HS 6 digit level. For specific tariff lines, COMTRADE data may overestimate trade values compared to SACEEC data, which have been collected at the HS 8 digit level.
-
5
10
15
20
25
30
2005 2006 2007 2008 2009 2010 2011 2012
R’ B
illio
ns
WORLD ZAMBIA
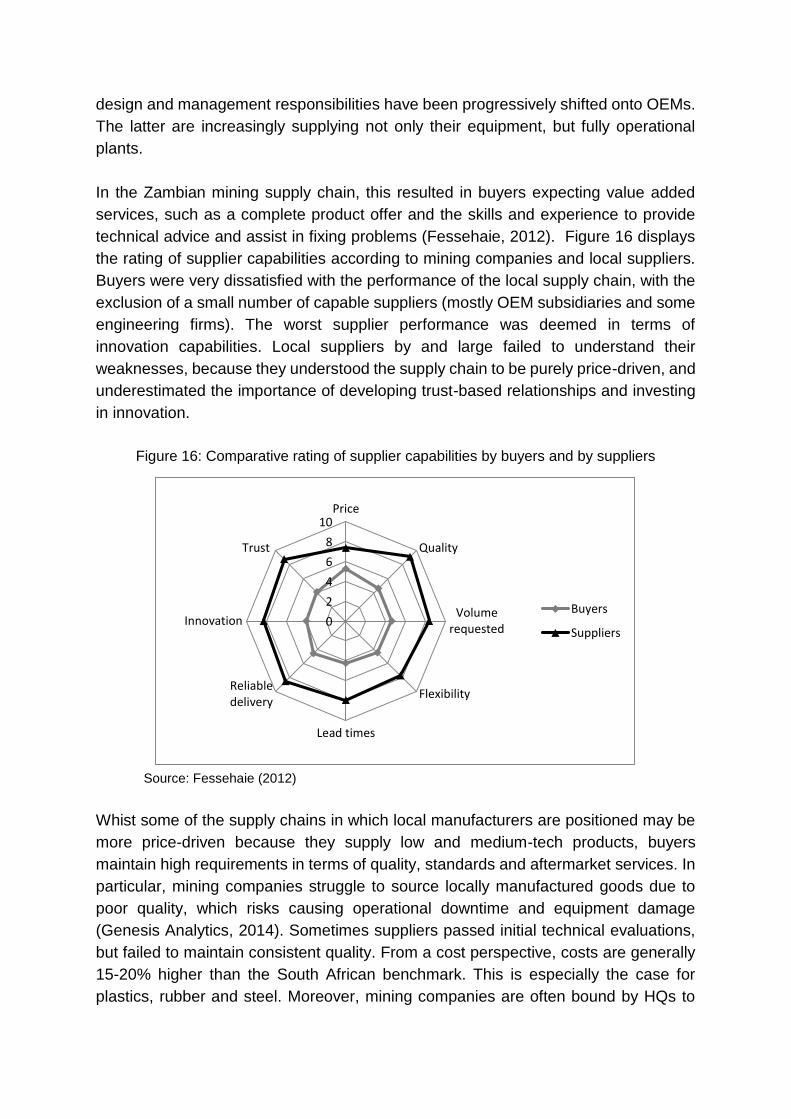
design and management responsibilities have been progressively shifted onto OEMs.
The latter are increasingly supplying not only their equipment, but fully operational
plants.
In the Zambian mining supply chain, this resulted in buyers expecting value added
services, such as a complete product offer and the skills and experience to provide
technical advice and assist in fixing problems (Fessehaie, 2012). Figure 16 displays
the rating of supplier capabilities according to mining companies and local suppliers.
Buyers were very dissatisfied with the performance of the local supply chain, with the
exclusion of a small number of capable suppliers (mostly OEM subsidiaries and some
engineering firms). The worst supplier performance was deemed in terms of
innovation capabilities. Local suppliers by and large failed to understand their
weaknesses, because they understood the supply chain to be purely price-driven, and
underestimated the importance of developing trust-based relationships and investing
in innovation.
Figure 16: Comparative rating of supplier capabilities by buyers and by suppliers
Source: Fessehaie (2012)
Whist some of the supply chains in which local manufacturers are positioned may be
more price-driven because they supply low and medium-tech products, buyers
maintain high requirements in terms of quality, standards and aftermarket services. In
particular, mining companies struggle to source locally manufactured goods due to
poor quality, which risks causing operational downtime and equipment damage
(Genesis Analytics, 2014). Sometimes suppliers passed initial technical evaluations,
but failed to maintain consistent quality. From a cost perspective, costs are generally
15-20% higher than the South African benchmark. This is especially the case for
plastics, rubber and steel. Moreover, mining companies are often bound by HQs to
0
2
4
6
8
10Price
Quality
Volumerequested
Flexibility
Lead times
Reliabledelivery
Innovation
Trust
Buyers
Suppliers
demand formal supplier accreditations, such as ISO or an inspection by an auditing
company. For instance, rollers and idlers require ISO 9001 whilst canteen food
requires HACCP for caterers to use. This drives up compliance costs and barriers to
entry for suppliers.
Local supplier competitiveness is hampered by the following factors (Fessehaie, 2012,
2014; Kasanga, 2012; CMZ and ICMM, 2014):
1) Manufacturing firms often operate outdated plants and machines, old technologies
and with weak quality assurance mechanisms. They lack R&D capabilities and
none of the firms interviewed had R&D budgets in Zambia.
2) Lack of access to long-term capital to refinance production infrastructure
rehabilitation and upgrade, and to maintain large stocks of inputs and spares in
order to supply mines with short lead times. The high cost of credit, of up to 30-
40% was raised as a major concern.
3) High production cost structure: Communication, transport and utilities are
problematic in terms of cost, reliability and access, raising the cost of doing
business. Import procedures are expensive and time-consuming. Corporate
income taxes are higher than the regional average.
4) Real exchange rate appreciation: Fluctuating foreign exchange rates make it
difficult for local firms to plan ahead.
5) Skills shortages in the areas of mechanical and electrical engineering, IT, and
hydraulics, as well as at vocational and artisanal levels.
6) Poor economies of scale: for example, Scaw Zambia Limited produces 20,000 mt
of grinding media balls and other steel products, the primary customer being the
mines (Sutton and Langmead, 2013). The company has recently invested in a plant
to manufacture semi-autogenous grinding (SAG) balls for SAG mills in the mines.
It supplied approx. 30% of total mill balls purchased by the mines. South African
competitors on the other hand produce around 1 million mt per year, and therefore
benefit from economies of scale. Moreover, South African firms do not pay duties
in Zambia when importing these final products from South Africa, but Scaw pays
duties on intermediate goods used in the production of the final product.
7) High import duties on non-South African originating spares: This is particularly
problematic because Zambia’s tariff structure discourages assembly operations
(intermediate inputs attracted 5-15% duties) in favour of imports of final products
(see Box 6).
8) Zambia’s policy inconsistency was highlighted often during the interviews as a
major impediment. For example, the hasty introduction and subsequent withdrawal
of a regulation that required firms to trade in the domestic economy in Kwacha and
not in US$ resulted in uncertainty and loss of value of stock held by firms.
Box 6: Does the structure of import duties discourage local assembly and
manufacturing?
Zambia’s industrial sector is characterised by a weak network of Tier 2 suppliers,
hence manufacturers rely on intermediate inputs and raw materials imports.
Examples of inputs source at firm level, 2012 (based on Sutton and Langmead,
2013)
Trade Kings (Agro-processing)
Palm oil and caustic soda are imported from South Africa, China and Southeast
Asia. Fragrances are sourced from Europe. In particular, the flavourings and
colour used in the manufacturing of confectionery are sourced from the
Netherlands.
AFIL Engineering (iron and steel)
Special steel that meets international specifications as well as axles (two
German brands) are sourced from South Africa. Truck axles are imported from
France; suspension and brakes from Turkey; tyres from China; lights from South
Africa; hydraulics for tipping trailers from Holland; aluminium rims from India;
and school desk pipes and boards from South Africa.
ZAMEFA Engineering (copper fabrication)
Aluminium from South Africa and China. Plastic compounds from Mauritius,
Malaysia, US, South Africa and Europe
Manufacturers struggle to compete with zero-rated imports of final products from
South Africa whilst they have to pay duties on inputs originating from non-SADC
and non-COMESA countries.
The example of protective shoes (for mining and other industries) is illustrative
(Interviews, 2014). Zambian manufacturers pay 15% duty on soles, inner soles, and
eyelets, plus duties on the industrial polish sourced from China. South African
manufacturers pay no duty for any of these components from China and export
finished shoes to Zambia duty free. Moreover, imports of components for mining
machinery is subject to duties, but the final product is duty exempt. This has
discouraged investment in local assembly operations which would be inherently
more expensive. The problem of import duties on intermediate goods was raised
also within the context of copper fabrication and steel.
How can Zambia build local firm capabilities?
In light of these constraining factors, backward and forward linkages are critical to
support supplier performance, especially for manufacturers (Fessehaie, 2012). In
terms of backward linkages, manufacturing firms owned by international or regional
corporations have access to finance and knowledge as well as reputational assets
through the parent companies. They can, for example, afford to hold large stocks, and
hence offer short lead times.
In terms of forward linkages, blue chip companies from Europe, South Africa, Canada
and Australia have procurement strategies more supportive of local suppliers
compared to Chinese and Indian firms. Buyer supplier relationships are more
supportive through information flows, longer term arrangements, forward purchase
agreements and sending technical personnel to inspect suppliers’ facilities and assist
them in developing quality assurance systems. For some firms, these linkages were
developed within the context of the IFC Suppliers’ Development Programme between
a group of manufacturers and some mining companies.27 Lumwana mine is about to
implement the most comprehensive supplier development programme to date (CMZ
and ICMM, 2014). It involves the procurement, sustainability and engineering
departments in identifying opportunities and build firm capabilities, and it also works
with a third party, to provide technical and financial assistance.
Manufacturing firms supported by backward linkages to parent companies or forward
linkages to buyers tend to upgrade by investing in capital equipment, upskilling their
workforce and introducing or improving their quality management systems (Fessehaie,
2012). Conversely, manufacturing firms which lacked relationships with foreign
conglomerates or operated at arm’s length with buyers, struggle to upgrade. These
firms tend to be excluded from supplying mining equipment spares and components,
which are effectively controlled by OEMs through their warranty system and their
aftermarket service offerings. Moreover, OEM spares and components are highly
standardized and sourced from low cost global suppliers, which remove the potential
advantage that local production could have presented in terms of in-country
adaptation.
The research on linkages between Zambian suppliers and South African OEMs sheds
further light on these dynamics and on local manufacturing opportunities (Fessehaie,
2014). First of all, South Africa-based OEMs move progressively into the Zambian
market. Due to high search costs: they try various arrangements with local suppliers
and only once they achieve sufficient turnover, do they establish subsidiaries. They
obviously face high search costs. Sometimes the mining companies prefer to procure
27 This programme impact was however limited due to low absorption capacity and poor access to capital in the context of high real interest rates.
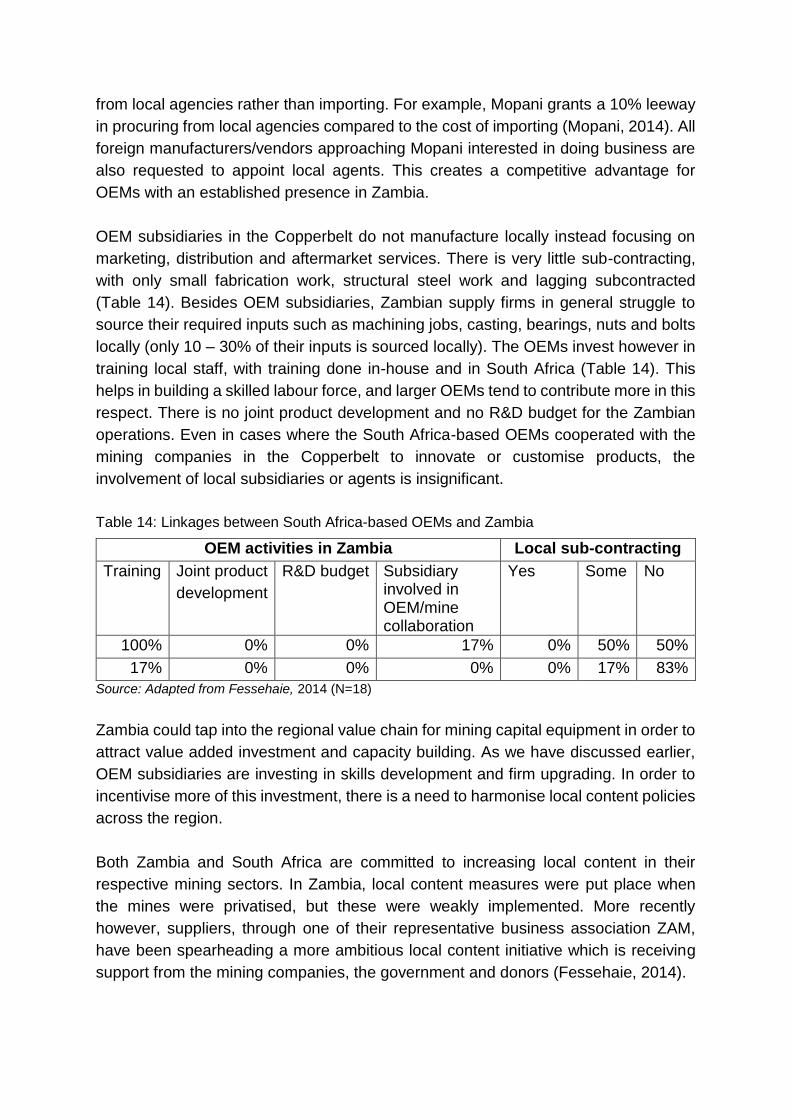
from local agencies rather than importing. For example, Mopani grants a 10% leeway
in procuring from local agencies compared to the cost of importing (Mopani, 2014). All
foreign manufacturers/vendors approaching Mopani interested in doing business are
also requested to appoint local agents. This creates a competitive advantage for
OEMs with an established presence in Zambia.
OEM subsidiaries in the Copperbelt do not manufacture locally instead focusing on
marketing, distribution and aftermarket services. There is very little sub-contracting,
with only small fabrication work, structural steel work and lagging subcontracted
(Table 14). Besides OEM subsidiaries, Zambian supply firms in general struggle to
source their required inputs such as machining jobs, casting, bearings, nuts and bolts
locally (only 10 – 30% of their inputs is sourced locally). The OEMs invest however in
training local staff, with training done in-house and in South Africa (Table 14). This
helps in building a skilled labour force, and larger OEMs tend to contribute more in this
respect. There is no joint product development and no R&D budget for the Zambian
operations. Even in cases where the South Africa-based OEMs cooperated with the
mining companies in the Copperbelt to innovate or customise products, the
involvement of local subsidiaries or agents is insignificant.
Table 14: Linkages between South Africa-based OEMs and Zambia
OEM activities in Zambia Local sub-contracting
Training Joint product
development
R&D budget Subsidiary involved in OEM/mine collaboration
Yes Some No
100% 0% 0% 17% 0% 50% 50%
17% 0% 0% 0% 0% 17% 83%
Source: Adapted from Fessehaie, 2014 (N=18)
Zambia could tap into the regional value chain for mining capital equipment in order to
attract value added investment and capacity building. As we have discussed earlier,
OEM subsidiaries are investing in skills development and firm upgrading. In order to
incentivise more of this investment, there is a need to harmonise local content policies
across the region.
Both Zambia and South Africa are committed to increasing local content in their
respective mining sectors. In Zambia, local content measures were put place when
the mines were privatised, but these were weakly implemented. More recently
however, suppliers, through one of their representative business association ZAM,
have been spearheading a more ambitious local content initiative which is receiving
support from the mining companies, the government and donors (Fessehaie, 2014).
South Africa’s export credit incentives set domestic (South African) local content
requirements on South African OEMs wishing to access export credit. These
incentives are clearly in conflict with Zambia’s drive towards increasing local
(Zambian) content in the Copperbelt. Reciprocal and harmonised incentives schemes
within SADC would provide a better framework to promote regional investment and
mutually beneficial outcomes. One area of cooperation should aim to increase sub-
contracting opportunities for local suppliers in Zambia. Genesis Analytics identified the
following opportunities in this regard: explosives, lime, mill balls and rod mills, electric
cables, hoses, liners, wire mesh HDPE piping, welding gases, nuts and bolts, rollers
and idlers (2014). Regional cooperation should also tap into South Africa’s more
developed skills base and industrial capabilities to devise skills development and firm
upgrading programmes to support linkages between private firms. South Africa’s
OEMs would benefit from such programme because it would increase their own
competitiveness in the Zambian Copperbelt and eventually in Central Africa.
Genesis Analytics estimates a best case scenario in which demand for goods and
services grows to US$ 4 billion per year (2014). This is a significant expansion of
demand for goods, and in some products, such as mill balls, it represents a doubling
of the market size. Additional economies of scale could be achieved by also supplying
the DRC mining supply chain. This however requires continued efforts to improve
access to this market, in order to reduce the costs of supplying from Zambia. It has
been estimated that tripling of the proportion of inputs manufactured locally in the
mines procurement, could add US$ 160 million to local suppliers’ turnover, of which
half would be value added and create 10,000 direct jobs (CMZ and ICMM, 2014).
Whilst Zambia is designing its local content policy, it should consider leveraging
cooperation with the region, and in particular, with South Africa, the regional hub for
mining equipment and services, and the DRC, which could turn Zambia into a sub-
regional hub for higher value added activities.
5 Policy framework for industrial development
This section provides an overview of Zambia’s industrial policy framework. Institutional
support for industry so far has been weak and uncoordinated (Dinh, 2013).
Zambia’s economic development agenda has been guided by the National Vision
2030, which sets the country’s aspiration to be a prosperous middle income country
by 2030. The economic development agenda has been operationalised by five year
National Development Plans. The Sixth National Development Plan (SNDP), 2011-
2015, includes a chapter of the manufacturing sector, defining objectives in terms of
expanding the industrial base and increasing value addition, promoting the growth of
MSMEs and rural-based industrial enterprises. Other six chapters include provisions
affecting industrial development namely: mining, trade and commerce, transport,
energy, education and skills, science, technology and innovation. The SNDP
leverages on the private sector to drive economic growth (Interviews, 2014). Hence
government set up a comprehensive consultation mechanism, where the private
sector is engaged through the Private Sector Development Reform Programme
(PSDRP), which rolls out a number of reforms and initiatives, 45% of which are
undertaken via PPP frameworks. The private sector formed the Private Sector Alliance
and the Zambia Business Council, which have issue-based working groups (tourism,
land, etc.).
The PSDRP was established in 2005 by the government as a framework to improve
the business environment. It receives financial and technical assistance from
cooperating partners. From an institutional point of view, the PSDRP has been
innovative because it involved the private sector and high level political commitment.
The programme is not manufacturing-focused but helped Zambia making
considerable progress in reducing regulatory barriers to entry, easing the procedures
to start a business (OECD, 2012). There are however many outstanding areas of work,
and sometimes implementation is patchy. For example, industry is concerned over the
implementation of a bill aimed at reducing the cost of licensing (Business Regulatory
law), which came into effect in 2014 (Interviews, 2014). This law requires regulatory
impact assessments before introducing any regulation. There have however already
been regulations that came into effect without going through this process.
The Zambia Development Agency Act (2007) includes, among others, the
establishment of the Zambia Development Agency, provisions on privatisation,
priorities for trade and industry development, investment promotion and protection,
Micro and Small Enterprise development, and the establishment of the Trade and
Industrial Development Fund. The key measures spearheaded by the ZDA are the
provisions of incentives for investors and the establishment of Multi-Facility Economic
Zones (MFEZs). Incentives are granted to investment larger than US$ 0.5 million in
priority sectors. ZDA also designed a package for Micro, Small and Medium
Enterprises (MSMEs) where the investment thresholds are lower. Corporate tax is
reduced to 3%, for 5 years, and capital goods can be imported duty-free (Interviews,
2014).
MFEZ are industrial parks with improved infrastructure and services which can sell to
export or domestic markets. Four MFEZ’s and two industrial parks have been gazetted
to date, three to be established by the private sector (Chambishi, Lumwana and
Lusaka East), and one public (Lusaka South). The Industrial parks (Roma park in
Lusaka and Sub-Sahara Park in Ndola - gemstones) are both private sector owned.
The Chambishi MFEZ, or Zambia-China Economic & Trade Cooperation Zone
(ZCCZ), has created more than 3500 jobs and there 14 Chinese firms in the zone, but
progress in other MFEZs has been very slow.
The list of priority sectors has grown considerably, losing the scope of a prioritisation
exercise (OECD, 2012). In the 2013 budget it was announced that the incentives
above would only apply for those firms which operate in a MFEZ, in priority sectors or
in rural areas. This restriction is being opposed by industry on the ground that sectors
have been earmarked as priority because they received FDI in the first place hence
the new measure unduly excludes sectors that could also become priority if they attract
FDI (Interviews, 2014). It is also unclear the extent to which tax incentives have been
effective in attracting investors (OECD, 2012).
The ZDA is tasked with a very broad mandate but lacks the funding, autonomy and,
in some cases, technical expertise to implement it (Interviews, 2014; OECD, 2012).
For example, the seven regional offices are staffed by one person each. ZDA struggles
to raise funds through marketable business development services. Government
funding has tended to meet the operational costs of the agency leaving little resources
for programmes. Hence ZDA has come to rely on donor funding for programmes,
which may not necessarily be aligned to government priorities and vary from year to
year. After-care services, which are essential to retain investment and attract new one,
are only at an embryonic stage. Moreover, the effectiveness of the ZDA has been
hampered by lack of a coherent investment legislation anchored to a national
investment policy.
Complementary export incentives have encountered implementation problems, such
as the duty drawback system, where refunds have been delayed and administration
procedures cumbersome (World Bank, 2014b). More recently, firms have complained
about the VAT Rule 18: if a company is zero-rated for VAT on exports, it can claim
back taxes on exports if certain conditions are met (Interviews, 2014). However,
government has not paid back money to the exporters and $600,000 is outstanding to
mining companies. The hurdle is that the regulation requires confirmation from export
customer that the goods were exported and received, which is difficult if exports are
done via traders.
The Commerce, Trade and Industrial Policy adopted in 2008 provides the overall
policy framework for industrial development. The CTI Policy identifies 6 priority
sectors, namely:
1. Processed foods;
2. Textile and garments;
3. Engineering products;
4. Gemstones;
5. Wood and wood products;
6. Leather and leather products
For each sector, the policy identified a set of recommendations, which have largely
not been implemented yet (Interviews, 2014). Government also established a
Technical Working Group on Manufacturing and Sub-groups for each cluster (OECD,
2012). However the effectiveness of these consultative mechanisms in informing
MCTI policies, implementing the Group planned programme, and reach constituencies
beyond Lusaka is weak.
Industrial policy received new impetus through the Strategy paper on Industrialisation
and Job Creation issued by Cabinet to be implemented by a coordination unit in the
Office of the President. The objective is to create 1,000,000 new formal sector jobs
over the next five years. Overall, the Strategy builds on the existing policy framework,
calling for some reforms such as reforming the ZDA mandate to focus on investment.
Four growth sectors have been identified as having the greatest growth potential:
agriculture, tourism, construction and manufacturing. The Strategy section on
manufacturing is based on the CTI policy priority sectors, with the addition of
pharmaceutical products. The proposed measures focus on improving the MFEZs,
specific measures for engineering and pharmaceutical firms, attracting targeted FDI
in motor vehicle assembly, copper fabrication, pharmaceutical, electrical and
electronics, and enforce preferential procurement for SMEs from government and
mining sector. The strategy also includes across the board interventions on
infrastructure, education and skills development, improved availability of long term
finance, transportation logistics and ICT as well as enhancing the business
environment. Whilst it has the merit of adopting a comprehensive view on the
manufacturing sector, the Strategy is still vague on the implementation aspect, and
seems to lack focus.
Other cross cutting legislation and programmes include the 2006 Citizens Economic
Empowerment Act (CEEA), which includes empowerment measures such as
restrictions of areas of trade, commerce and industry to targeted citizens, and
preferential procurement.
6 Conclusions and further research
Although from a low basis, Zambia’s manufacturing sector has shown encouraging
trends in terms of contribution to GDP growth, employment, FDI inflows, and export
performance. The following manufacturing sub-sectors have shown the best growth
performance: food, beverage and tobacco; cement; wood & wood products, paper
products; and to a less extent, fabricated metals. However, these are very different in
size, with the agro-processing sectors taken together estimated to amount to 60% of
manufacturing.
Growth has been driven by the domestic market (cement, wood, paper), as well as to
a much smaller extent by increased exports. Indeed, one of the biggest developments
of the past decade is the increased importance of international trade. On the export
side this is largely due to copper, but, from a low base, non-traditional exports have
also grown significantly. Apart from commodities such as sugar, tobacco and cotton,
there are small but rapidly growing exports of processed goods such as animal fodder,
milling products, essential oils, and fabricated copper and steel products. On the
import side, there has unsurprisingly been dramatic growth in mining equipment
imports, however, there has also been growing imports associated with growing
consumer incomes, including of processed food products.
This paper analysed the performance and challenges in two main industry groupings,
namely agro-processing and engineering products. These were selected as they are
large in their own right and have good potential given demand and cost factors. In the
case of agro-processing demand has been driven by urbanisation and consumer
income growth for food products while there is competitive potential in inputs in the
form of agricultural produce.
Engineering products and services (including fabricated metals, machinery and
engineering services) have grown on the back of mining activity in Zambia and the
DRC. There is a large a growing trade deficit representing potential for building a local
cluster in Zambia. Such a cluster cannot grow in isolation from centres of advanced
production such as South Africa and Europe, but should rather only in building value
added linkages with these centres in terms of repair, assembly and sub-contracting.
These can lower the costs to the mines through proximity of suppliers at competitive
pricing.
In both cases regional relationships are critical to understanding the development
patterns over the past decade as well as in identifying potential. Opportunities were
identified in sugar, processed vegetables, milling products, and animal feed. Zambia’s
low cost production basis for cane sugar and soybean could make downstream
processors competitive in the domestic and regional markets. Whilst this is being
realised in the case of the animal feed industry where trade deficits have turned into
surpluses with increasing levels of regional exports, high sugar prices have hampered
the competitiveness of a local sugar confectionary industry, in particular, and other
industrial users such as manufacturers of beverages, biscuits and bakery products in
general. The expansion potential of the milling industry has also been constrained by
high input prices, where access to competitively priced wheat is of critical importance.
This has also apparently undergone a major change in 2013 to 2014 with a surplus of
wheat production, which has stimulated investments through the value chain. In order
to increase the volumes and value added content of vegetables, further analysis is
required to identify which products could be processed competitively, taking into
requirements such as the access to high quality raw materials, packaging, and the
costs of meeting standards, as well as where demand is likely to grow in the region.
This analysis should be expanded beyond vegetables, into for example, fruits and
nuts.
Given the size of the sector, the implications of mining, and the Zambian government’s
strategy, the paper also discussed the engineering sector. In copper fabrication, in
particular, critical factors that need to be addressed are duties on inputs, and a local
procurement policy informed by the CEEC which favours indigenous ownership vs.
local value addition. Moreover, it was noted that the government strategy for the
engineering sector fails to address critical constraints. One of these is skills
development, which should be a top priority in order to maximise the impact of the
Chinese ZCCZ investment on the local economy. We focus on the very significant
opportunities to which insufficient attention has been paid in the inputs to mining,
where even meeting some of the demand currently being served by imports will be a
huge step forward in local value creation.
The paper identifies three major areas to bring the industrial development agenda
forward. These are linkage development strategies, regional economic integration and
cooperation, and competition.
Linkage development and capabilities
Linkage development has been looked at in the context of value chains into the mining
sector and supermarkets. Recent research estimates that the mining sector’s demand
for goods and services will increase to up to US$ 4 billion per year until 2030. Whilst
there are many local suppliers based in the Copperbelt, the challenge is to increase
local value addition in terms of the goods and services produced locally.
Food and beverages is the largest component of household consumption across most
of the region. In Zambia and South Africa, food and beverage expenditures are higher
among urban households than rural ones. Supermarkets retail chains are
revolutionising the way consumers in urban and semi-urban areas shop for groceries
and household items. The growth in supermarket outlets has been remarkable,
tapping into demand for processed foods and beverages driven by fast urbanisation
and rising middle class. There is anecdotal evidence that local firms have managed to
supply bulk commodities, but value added, branded products are largely imported from
South Africa and other deep sea sources.
In the supply chains to mining companies and supermarkets, local suppliers can find
an opportunity to upgrade and access larger, more demanding markets. Access to
larger markets enables firms to grow and operate on better economies of scale. This
has been the case for Zambeef for example, for which access to Shoprite’s distribution
outlets has played a critical role in the firm growth. Higher standards enforced by these
buyers force suppliers to upgrade their performance in terms of consistency of quality
and volumes, price, lead times and standards compliance. In order to do so, firms
invest in quality assurance processes, new equipment, and labour upskilling. Whilst
entry barriers are high, therefore, participation into these supply chains support
important upgrading processes.
Linkage development strategies to facilitate entry and competitiveness into the mining
and supermarkets value chains require a combination of government and firm
interventions. Government needs to tackle factors such as access to credit and a
national quality assurance system. The paper highlights the example of a large
supplier to a local supermarket that had to vertically integrate a number of quality
assurance activities because of weak public infrastructure. Buyers in the mining and
retail sectors have an important role to play in helping suppliers meeting their
requirements through supply chain development initiatives.
Regional economic integration
The region has become the largest destination market for Zambia’s non-traditional
exports such as sugar, animal fodder, cement, engineering products, milling products,
fresh vegetables, and so forth. In other words, the regional market is important for
Zambia’s value added industries, and for smaller sized, diversified exporting firms. In
particular, the regional market for sugar confectionery and prepared foods has grown
at above world average rates. Several regional markets for poultry are growing at
annual rates of 20% or more. In addition, the DRC market has absorbed fresh
vegetables exports that once were directed at EU countries.
Regional integration efforts have so far focused on establishing free trade agreements.
Lowering tariff barriers to the regional market is important for Zambia, especially
because regional trade agreements include provisions for the removal of less explicit
market access barriers such as NTBs and trade facilitation issues, and attempt to
harmonise technical standards and SPS measures. However, the growth of Zambian
exporting firms into the DRC market show that even in the absence of trade
arrangements, or any formal trade for that matter, the regional market can offer more
lucrative opportunities for Zambian firms than deep sea markets. The underlying
reasons may be several: lower transportation costs, Zambian firms being more familiar
with neighbouring countries distribution networks and consumer preferences, lower
standards and Sanitary and Phyto-Sanitary (SPS) measures, and a degree of natural
protection in markets such as DRC and Malawi due to distance from deep sea ports.
Our assessment reiterates that regional economic integration is strategically important
for Zambian manufacturers. However, the paper moves the argument one notch up,
and argues that regional cooperation on industrial development would also be
important. The case study on the mining capital equipment is illustrative. South Africa
is a regional hub for mining inputs, and provides a set of local content incentives for
its own firms moving into regional and overseas markets. Zambia’s mining inputs
cluster has significant linkages to South Africa, either through agency and sole
distributorship agreements with local firms, or through subsidiaries of international and
South African owned OEMs based mostly in Gauteng. Mining companies are
interested in aftermarket services and shorter lead times as well as meeting Zambia’s
own local content requirements, which implies that OEMs with a value added presence
in the Copperbelt are likely to have a competitive advantage over others.
Moving beyond their nationally-framed local content measures would enable Zambia
and South Africa to reach a win-win outcome. South Africa could support its OEMs in
investing into value added activities in the Copperbelt. This would increase their overall
competitiveness in the regional market, as well as contribute to Zambia’s local content
objectives. This could be done by increasing local sub-contracting and training to build
opportunities for local firms and workers. The Zambian mining inputs cluster would
have realistic opportunities to enter the supply chain for, for example, components and
spares, and, through OEM subsidiaries, to provide higher value added services which
would create further employment, build local expertise, and revenues. If this was
complemented by cooperation at government level in, for example, skills development
at technical and engineering level, Zambia could have sufficient incentives to look at
its local content measures within a regional framework.
At the same time, access and participation in the DRC mining supply chain is critical
for Zambia to become a sub-regional hub for mining inputs. This market can increase
the economies of scale for local suppliers to upgrade and increase the services
provided and the products manufactured locally. In this respect, Zambia is already
working on reducing transport costs to the DRC. Additionally, Zambia should
investigate the possibility of a more tailored, specific strategy to improve the access of
its suppliers to customers across the border.
Whilst there are established regional frameworks such as the SADC Industrial Policy
Development Framework and the COMESA-EAC-SADC Tripartite Industrial
Development Pillar, Zambia could consider a scaled down bilateral cooperation
programme, focused on specific, achievable objectives within a limited timeframe. This
could support the broader SADC and Tripartite frameworks by providing a pilot
programme and lessons for future multi-country programmes.
Competition, regional integration and competitiveness
Our assessment highlighted where low levels of competition meant that prices of key
products did not reflect the costs of production and undermined the competitiveness
of downstream activities. In the case of cement, high prices and profit margins
compared to other countries in the region have made construction more expensive.
Internationally this industry is well known for anti-competitive conduct, including a
cartel that operated across SACU until 2009. In Zambia, a single firm has substantial
market power, rather than it needing a collusive agreement with putative competitors
in order to raise prices.
The assessment of sugar prices and conduct reiterated what several other studies
have found, namely that while Zambia is one of the lowest cost producers in the world,
its prices are relatively high compared to its neighbours. In addition to the harm to
consumers this also undermines businesses manufacturing sugar confectionary
products, as well as the wider set of food products for which sugar is an input. Again
a single firm has substantial market power and is able to export large volumes while
keeping local prices in Zambia relatively high. In confectionary there are already firms
such as Trade Kings which have a regional foot print, have established manufacturing
capabilities, and can thus expand Zambian production to meet local and regional
demand if the local input costs are competitive.
In the case of poultry, it has been observed that the industry is very concentrated and
that day-old chicks, required by broiler producers, have been priced at double the level
in South Africa. This inhibits independent firms from capitalising on the more
competitive animal feed that has resulted from growth in agricultural production and
investment in feed production. Firms that are vertically integrated back into breeding
stock can self-supply, however, if they maintain uncompetitive prices to others then
the industry will not become broader-based.
These examples all point to the need for a progression from support for upstream
investment to ensuring that competitive upstream production flows through to
downstream and diversified activities. In the absence of competitive discipline,
entrenched dominant firms will likely focus their energies on protecting their position
and their ability to continue to earn supra-competitive rents including through lobbying
for protection and regulations that undermine smaller rivals and entrants. The
difference between competitive and monopoly or cartel pricing differ from industry to
industry and depend on market conditions, however, international studies typically find
mark-ups of at least 15-25% and it is likely that mark-ups in Zambia would be higher
given the substantial transport costs and history of protection.28
Integration of regional markets has the potential to increase competitive rivalry, as
where scale economies mean that there are unlikely to be many producers in industrial
products. The gains from integration where there is imperfect competition are much
greater than the static gains from specialisation and exchange, as increased trade
means more competitive outcomes (Baldwin and Venables, 1995). The distribution of
the gains obviously depends on where the industries and consumers are located and
there can be substantial first-mover advantages. This points to the need for a common
understanding of the collective gains, including in supporting businesses across
countries in the region while ensuring competition between them.
The case study of the opening up road transport across Zambia, Zimbabwe and South
Africa is illustrative of the possible gains (Ncube et al., 2014). Harmonisation of
licencing and regulations across the three countries substantially increased the ease
of operation of regional trucking companies and reduced cross-border transport costs.
28 See Connor (2014) for a review of international studies and Roberts et al. (2014) for a review of cartels in
southern Africa.
While this meant an increased representation of Zimbabwean and South African
registered trucking companies in Zambia it substantially lowered transport costs
meaning higher returns to exports of copper and other goods such as animal feed. It
was also found to have facilitated greater competition in fertilizer trading which
reduced fertilizer prices by around 15% or $100-$150/t on prices of around $800/t in
2013, when Zambian prices are compared to prices in Malawi and Tanzania. This also
came on the back of a cartel being uncovered in Zambia, which ran from 2007 to 2012
and the entry of the Export Trading Group which has grown its share of fertilizer
markets in several African countries, and has brought greater price.
These examples illustrate the linkages between trade policy, transportation costs, and
the strategic location decisions of firms, and the need for further research in this area.
Regional integration cannot be achieved where conflicting trade policies across
countries, inefficiencies in transportation, and strategic behaviour of firms undermine
competitive rivalry across borders.
Summary
To conclude, there are a number of cross-cutting factors hampering competitiveness:
inputs, finance and exchange rates volatility, transport costs, and skills. In the case of
transport costs, Zambia is already implementing a number of reforms and investment
in infrastructure and trade facilitation. Financial instruments have been rolled out but
they still haven’t been effective yet in relaxing firm capital constraints. Finally,
government policies still lag behind with regard to skills development and inputs
markets. In terms of the overall policy framework for industrial development, policies
rarely turn into specific strategies to support implementation, which overall remains
weak. Hence a number of policy instruments, such as the ZDA Act and the
Commercial, Trade and Industrial Policy, have had limited impact in fostering industrial
development. Focusing on policy implementation and on high potential sub-sectors
would help Zambia make significant progress in meeting its industrial development
goals.
The following have been identified as areas for further research:
Analysis of competition issues in specific industries and institutions affecting
industrial development (banking, transport)
Detailed analysis of food processing opportunities, by product and market
Further research to elaborate on regional value chains and regional
cooperation on industrial development
Further research on domestic linkages policies: supermarkets, mining local
content
Research to understand how Zambia can leverage public procurement to
support local engineering firms (given that public utilities are large customers
for the sector)
7 References
Aho, P. (August 2013). Chicken consumption to increase significantly for median world
income group. Watt Poultry US Digital News. Retrieved on August 2013 from
http://www.wattpoultryusa-digital.com/poultryusa/201308
Baldwin, R. E. and Venables, A. J. 1995. Regional Economic Integration. In Hand
Book of International Economics, vol 3. Gene Grossman and Ken Rog off, eds.
Amsterdam, North Holland
Banda, B., & Simumba, J. (2013). The Birth, Death and Survival of Exports in Zambia
1999 – 2011. (Working paper 12). Lusaka, Zambia: ZIPAR
Bank of Zambia. (2014). Foreign Private Investment and investor perceptions in
Zambia – 2014. Lusaka, Zambia. Retrieved in January 2014 from
http://www.boz.zm/
Central Statistical Office. (2005). Zambia labour force survey report 2005. Lusaka,
Zambia
Central Statistical Office. (2008). Zambia labour force survey report 2008. Lusaka,
Zambia
Central Statistical Office. (2012). Zambia labour force survey report 2012. Lusaka,
Zambia
Central Statistical Office. (2014). Gross Domestic Product 2010 benchmark estimates.
Summary report. Lusaka, Zambia
Chamber of Mines of Zambia, & International Council on Mining and Metals (2014).
Enhancing mining’s contribution to the Zambian economy and society
Chisanga, B., F. H. Meyer, A. Winter-Nelson, N. J. Sitko (2014) ‘Does the current
sugar market structure benefit consumers and sugarcane growers?’, IAPRI
Working paper 89, October 2014. Downloaded from:
http://www.iapri.org.zm/index.php/working-papers/doc_view/435-working-
paper-no-89?tmpl=component&format=raw
Connor, J. M. (2014). Price-Fixing Overcharges. Revised 3rd Edition
Cramer, C. (1999). Can Africa industrialize by processing primary commodities? The
case of Mozambican cashew nuts. World Development, 27(7), 1247-1266
Department of Agriculture, Forestry and Fisheries. (2011). A profile of the South
African broiler market value chain. Retrieved from www.daff.gov.za on January
2015
Dinh, T.D. (2013). Light manufacturing in Zambia. Job creation and prosperity in a
resource-based economy. Washington, DC: World Bank
ECIAfrica Consulting (2012). Potential of non-traditional exports in Zambia – growth,
employment and distribution of wealth and income. London, UK: IGC
Ellis, K., R. Singh & C. Musonda (2010). Assessing the Economic Impact of
Competition: Findings from Zambia. Overseas Development Institute, July
2010. http://www.odi.org/sites/odi.org.uk/files/odi-assets/publications-opinion-
files/6066.pdf
Emonger, R., & Kirsten, J. (2009). The impact of South African supermarkets on
agricultural development in the SADC: a case study in Zambia, Namibia and
Botswana. Agrekon, Vol 48, No 1
Fagerberg, J., M. Srholec, M. Knell (2007), ‘The competitiveness of nationa: why
some countries proper while others fall behind’, World Development, 35(10),
1595-1620.
FAO. (1997). The State of Food and Agriculture 1997, Rome, Italy retrieved from
http://www.fao.org/docrep/w5800e/W5800e00.htm in January 2015
Fessehaie, J. (2012). What determines the breadth and depth of Zambia’s backward
linkages to copper mining? The role of public policy and value chain dynamics.
Resources Policy 37 (4), p. 443 – 451.
Fessehaie, J. (2014). Case Study on the Mining Capital Equipment Value Chain in
South Africa and Zambia. Integrated Report for the Regional Industrialisation
Research Project. Johannesburg, South Africa: CCRED
Genesis Analytics. (2014). Design of a Zambia mining local content programme.
Report prepared for the World Bank.
Government of the Republic of Zambia. (2008). Commerce, Trade and Industrial
Policy. Lusaka, Zambia
Government of the Republic of Zambia. (2011). Sixth National Development Plan
2011-2015. Lusaka, Zambia
Government of the Republic of Zambia. (2013). Strategy paper on industrialisation and
job creation. Lusaka, Zambia
Grimbeek, S., & Lekezwa, B. (2013). The Emergence of More Vigorous Competition
and the Importance of Entry – Comparative Insights from Flour and Poultry.
CCRED Working Paper 1/2013.
Hausmann, R., Hwang, J. and Rodrik, D. (2007). What you export matters, Journal of
Economic Growth, 12 (1): 1–25.
Hidalgo, A. (2009). The dynamics of economic complexity and the product space over
a 42 year period; Centre for International Development (CID) at Harvard University,
Working Paper No. 189 (December 2009).
Humphrey, J. (2007). The supermarket revolution in developing countries: tidal wave
or tough competitive struggle? Journal of Economic Geography 7 (2007) pp.
433–450
Kasanga, J. (2012). Leveraging Zambia’s industrialization with growth of copper
mining investments: Strategy for expanding local manufacturing capacities to
supply the Zambian mining industry. Discussion Paper prepared for the Zambia
Mining Local Content Initiative. Lusaka, Zambia.
Koyi, G, (2006). The Textile and Clothing Industry in Zambia in Jauch, H. & Traub-
Merz, R. (Eds.) The future of the textile and clothing industry in Sub-Saharan
Africa. Bonn, Germany: Friedrich-Ebert-Stiftung
Ministry of Commerce, Trade and Industry. (2012). Industry strategy for engineering
products. Lusaka, Zambia
Moono, H., & Rankin, N. (2013). Education and employment in Zambia: Evidence from
a scoping exercise. London, UK: IGC
Mopani. (2014). Mopani Copper Mines Presentation, Zambia Annual Manufacturers
Week, Lusaka, Zambia, 16th October 2014
Narrod, C., Tiongco, M., & Costales, A. (2012). Global poultry sector trends and
external drivers of structural change. Presented at the In FAO Conference
Poultry in the 21st Century: Avian influenza and beyond. November 2007
Nathan Associates and EME. (2010). How can Zambia increase the fabrication of
copper products? Dispelling the myth that domestic production of copper is an
advantage. (Final report for the Jobs, Prosperity and Competitiveness Project
supported by the World Bank, ADB, DFID)
Ncube, P., Vilakazi, T and Roberts, S. (2014). Competition and regional integration:
The case of fertiliser transportation in Tanzania and Zambia. Study for SADC
Competition Committee.
OECD. (2012). OECD investment policy reviews: Zambia 2012. Paris, France: OECD
Page, J. (2012). Can Africa industrialise? Journal of African Economies, 21(2): ii86-
ii125.
Pick n Pay. (2014). Company Presentation, Zambia Annual Manufacturers Week,
Lusaka, Zambia, 16th October 2014
Poultry Association of Zambia. (2013). Background information. Retrieved from
http://paoz.org in October 2013
Reardon, T. P. Timmer and J. Berdegue (2004), “The Rapid Rise of Supermarkets in
Developing Countries: Induced Organizational, Institutional, and Technological
Change in Agrifood Systems, e-Journal of Agricultural and Development
Economics, Vol. 1, No. 2, 2004, pp. 168-183
Roberts, S., W. Simbanegavi, & T. Vilakazi. (2014). Understanding competition and
regional integration as part of an inclusive growth agenda for Africa: key issues,
insights and a research agenda. Presented at 8th Annual conference on
Competition Law, Economics and Policy, 4 & 5 September 2014,
Johannesburg.
Sutton, J. & Langmead, G. (2012). An enterprise map of Zambia. London, UK: IGC
Takala-Greenish, L. (2015). Regional value chain for soybean. Provisional draft.
January 2015. Johannesburg, South Africa: CSID
Technoserve. (2011). Southern Africa Regional Soybean Roadmap. Final Report.
Retrieved from http://www.technoserve.org/files/downloads/technoserve-bmgf-
regional-report.pdf in January 2015
Weatherspoon, D., & Reardon, T. (2003). The Rise of Supermarkets in Africa:
Implications for Agrifood Systems and the Rural Poor, Development Policy
Review, 2003, May, 21 (3)
World Bank. (2014a). Diagnostic Trade Integration Study. Washington, DC: World
Bank
World Bank. (2014b). Promoting trade and competitiveness. What can Zambia do?
Zambia Economic Brief. Washington, DC: World Bank
ZAMEFA. (2013). Minerals and Mineral Processing Value Chains: Experience,
Challenges and Opportunities Investing in the mining sector in Southern Africa.
Presentation for the Tripartite Industrial Development Pillar Regional
Consultative Workshop, Nairobi, 17-18 June 2013
LIST OF RESPONDENTS
Maybin Nsupila CEO Zambia Association of Manufacturers 14 October 2014 Innocent Melu Manager: Enterprise Development Zambia Development Agency 16 October 2014 Nsangwa Ngwira Private Sector Development Reform Programme Date: 17 October 2014 Prisca Chikwashi CEO Zambia Chamber of Commerce and Industry 17 October 2014
Designed by soapbox.
The International Growth Centre (IGC) aims to promote sustainable growth in developing countries by providing demand-led policy advice based on frontier research.
Find out more about our work on our website www.theigc.org
For media or communications enquiries, please contact [email protected]
Subscribe to our newsletter and topic updates www.theigc.org/newsletter
Follow us on Twitter @the_igc
Contact us International Growth Centre, London School of Economic and Political Science, Houghton Street, London WC2A 2AE