Embed Size (px)
Citation preview

1
Working Paper 275
India-Pakistan Trade: An Analysis of the
Pharmaceutical Sector
Manoj Pant
Devyani Pande
June 2014
INDIAN COUNCIL FOR RESEARCH ON INTERNATIONAL ECONOMIC RELATIONS
i
Contents
Abstract ........................................................................................................................................... i
1. Introduction ........................................................................................................................... 1
2. A Brief History of India and Pakistan’s pharmaceutical Industry................................... 3
3. Theoretical Framework ........................................................................................................ 7
3.1 Trade Possibility Approach ................................................................................................ 7
3.2 Intra-Industry Trade Index ................................................................................................. 7
3.3 Trade Complementarity Index ........................................................................................... 9
3.4 Data ..................................................................................................................................... 10
4. Empirical Results and Analysis .......................................................................................... 10
4.1 Indo-Pakistan Trade and RTAs ................................................................................... 10
4.2 Indo-Pakistan Trade in Pharmaceuticals: Potential and Trends ............................... 12
4.3 Intra-Industry Trade between India and Pakistan ...................................................... 13
4.4 Trade Complementarity .............................................................................................. 15
5. Pakistan-China Trade: The Bottleneck in India-Pak Trade? ......................................... 16
5.1 Are Indian pharmaceutical items substitutes for Chinese exports to Pakistan? ........ 17
5.2 Competitiveness of Chinese Pharmaceuticals ............................................................ 20
6. Industry Insights .................................................................................................................. 22
6.1 View from Pakistan ..................................................................................................... 22
6.2 View from India........................................................................................................... 23
7. FDI in Pharmaceutical Sector ............................................................................................ 24
8. Summary and Policy Recommendations ........................................................................... 27
References .................................................................................................................................... 31
ANNEXURE ................................................................................................................................ 35
Annexure 1 ............................................................................................................................ 35
Annexure 2 ............................................................................................................................ 36

ii
List of Figures, Graphs and Tables
Figure 1: Timeline of India's pharmaceutical industry .................................................................. 5
Figure 2: The timeline of Pakistan’s Pharmaceutical Industry ...................................................... 6
Graph1: Indian pharmaceutical exports to and imports from Pakistan (2003-12) ...................... 12
Table 1: Pharmaceutical exports and imports of India, simple Grubel Lloyd index, Adjusted
Grubel Lloyd index and group-wise adjusted GL indices (2009-12) ............................ 14
Table 2: Trade Complementarity Index between India and Pakistan .......................................... 15
Graph 2: Share (per cent) in pharmaceutical imports of Pakistan of top 12 suppliers ................ 17
Table 3: Tariff Reduction Modality of Pakistan under the CPFTA ............................................. 18
Graph 3: Pakistan's pharmaceutical imports from India and China ............................................ 19
Table 4: Unit Value Comparison – Top 13 Pakistan pharmaceutical imports from China, their
share and their respective unit values ( 2012) ................................................................ 21
Graph 4: FDI in drugs and pharmaceuticals in India (2009 to Oct 2013) ................................... 25
Graph 5: FDI in pharmaceuticals and OTC products in Pakistan (2002-2011) .......................... 26

i
Abstract
With the ongoing trade normalisation process between India and Pakistan, opportunities to
integrate have opened up between both countries. The pharmaceutical sector is crucial to health
issues in developing economies and would be an ideal segment to focus on in improving trade
relations between the two countries. Here, an empirical and theoretical analysis of India-Pakistan
trade using some statistical indicators reveals low levels of current trade but huge trade potential.
Since China has virtually dominated the trade scene in nearly all manufacturing sectors, this
study also looks at the tripartite dynamics of trade in pharmaceutical items among India, Pakistan
and China. An analysis of the China-Pakistan and the South Asia Free Trade Area Agreements
reveals that while Pakistan does not give any favourable treatment to China in items on
Pakistan’s negative/sensitive list for India, there is some indication that the favourable tariff
treatment to China in general may have affected India’s low trade in pharmaceutical products
with Pakistan. The study further argues that the opening up of the Pakistan pharmaceutical
market to India would lead to an increase in consumer surplus, given the advantages of
competition. Since many items are already imported from China, the argument that India’s
imports would stifle domestic producers seems misplaced. Hence, non-discriminatory access to
Indian products seems reasonable. A positive start could be the phasing out of Pakistan’s
negative list. The incorporation of trigger mechanisms would help appease the apprehensions of
the pharmaceutical industry in Pakistan about an influx of pharmaceutical items from India.
Discussions with some major Pakistan pharmaceutical producers indicated that normalising trade
would also provide external economies in areas like R&D and standards. In some areas, the
benefits could flow to Indian producers. In this context, it seems necessary to establish a process
for establishing mutual recognition agreements (MRAs), which would improve product quality
in both countries.
Finally, since FDI is just another way of doing trade, it seems necessary to explore the
possibilities here at least to boost future trade prospects. Some harmonisation of FDI policies
may be warranted.
_______________
JEL Classification: F10, F13, F14
Keywords: India-Pakistan, trade, pharmaceuticals, China, trade potential, trade
complementarity, FDI, policy recommendations
Authors Emails: [email protected], [email protected]
_________________
Disclaimer:
Opinions and recommendations in the paper are exclusively of the author(s) and not of any other
individual or institution including ICRIER
1
India Pakistan Trade: An Analysis of the Pharmaceutical Sector
Manoj Pant and Devyani Pande1
1. Introduction2
Trade and investment have been an integral link in improving the relations of South Asia’s two
heavy weights, India and Pakistan. However, the enormous trade potential that exists between
the two nations due to the commonalities in culture and the sharing of an 1800-km long border is
yet to be fully capitalised on. Since the delinking of political considerations and trade
negotiations in 2004, when talks began at the commerce secretary level, trade between India and
Pakistan has seen a rising trend. Efforts have been made to iron out the creases in India-Pakistan
trade relations by integrating major sectors in the two economies. This has occurred over the
years in phases, sometimes with interruptions and at other times with consensus over broadening
trade relations between both the countries.
A restrictive trading environment prevailed between both the countries till 2005 as there was no
road route, a positive list was maintained for imports from Pakistan and the maritime protocol
allowed only Indian and Pakistani flagged vessels to carry cargo between the two countries while
not permitting the same vessels to carry consignments to a third country (Taneja et al., 2013). As
part of confidence building measures, in October 2008, the two governments permitted trade and
travel across the Line of Control along Jammu and Kashmir. The fifth round of talks in April
2011 laid down the blueprint for normalising trade between India and Pakistan (Taneja et al.,
2013). In a joint statement signed in March 2012, Pakistan made a transition from the positive
list approach to a small negative list of 1,209 items. However, it continued to restrict road-based
trade by allowing only 137 items to be imported from India via road, while India took a number
of steps to address the issue of non-tariff barriers (NTBs). As part of the ongoing trade
normalisation process, India is expected to reduce the list of items on the sensitive items from the
present 614 items to 100 items as and when Pakistan accords India the MFN status3. Issues of
protectionism and providing market access have been at the heart of this normalisation process.
The asymmetry in giving mutual recognition in terms of regulatory regimes and grant of the
MFN status has been a major stumbling block in improving economic relations of the two
countries (John and Bhatnagar, 2013). Even after partial liberalisation of trade between both
1 Dr. Manoj Pant is Professor, Centre for International Trade and Development, School of International Studies
Jawaharlal Nehru University, New Delhi and Devyani Pande is Researcher at ICRIER. 2 This paper has been written as part of Research Studies conducted under the project “Strengthening Research and
Promoting Multi-level Dialogue for Trade normalization between India and Pakistan” led by Dr. Nisha Taneja. We
are thankful to Dr. B.N Goldar, Dr. Aparna Sawhney, Dr. Aradhna Agarwal and Dr. Vaqar Ahmed for comments. 3 In a meeting between Commerce ministers of India and Pakistan in January 2014, it was decided to change the
WTO acronym- MFN to NDMA (non-discriminatory market access). The change in terminology will help in
achieving the goal of increasing trade and investment between the countries. (BS Reporter, Its official now: No
MFN between India, Pakistan. Business Standard. January 18, 2014)
2
countries, protection of vulnerable sectors is what hinders further expansion of India-Pakistan
trade.
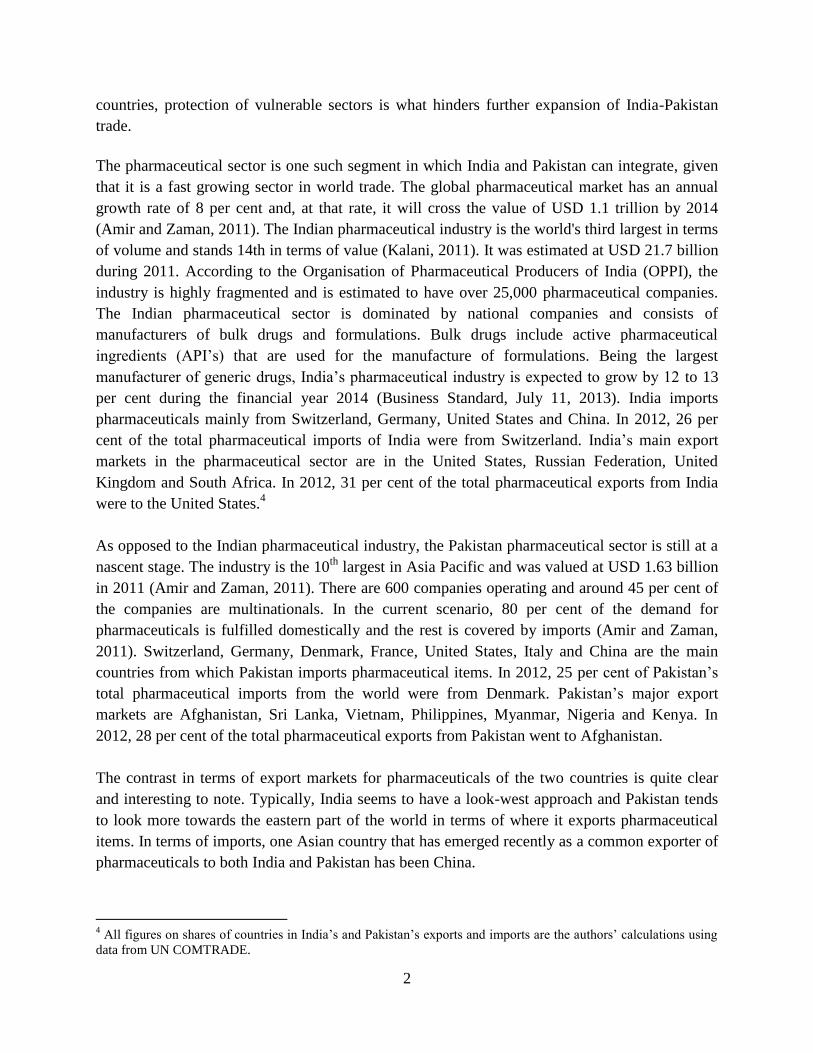
The pharmaceutical sector is one such segment in which India and Pakistan can integrate, given
that it is a fast growing sector in world trade. The global pharmaceutical market has an annual
growth rate of 8 per cent and, at that rate, it will cross the value of USD 1.1 trillion by 2014
(Amir and Zaman, 2011). The Indian pharmaceutical industry is the world's third largest in terms
of volume and stands 14th in terms of value (Kalani, 2011). It was estimated at USD 21.7 billion
during 2011. According to the Organisation of Pharmaceutical Producers of India (OPPI), the
industry is highly fragmented and is estimated to have over 25,000 pharmaceutical companies.
The Indian pharmaceutical sector is dominated by national companies and consists of
manufacturers of bulk drugs and formulations. Bulk drugs include active pharmaceutical
ingredients (API’s) that are used for the manufacture of formulations. Being the largest
manufacturer of generic drugs, India’s pharmaceutical industry is expected to grow by 12 to 13
per cent during the financial year 2014 (Business Standard, July 11, 2013). India imports
pharmaceuticals mainly from Switzerland, Germany, United States and China. In 2012, 26 per
cent of the total pharmaceutical imports of India were from Switzerland. India’s main export
markets in the pharmaceutical sector are in the United States, Russian Federation, United
Kingdom and South Africa. In 2012, 31 per cent of the total pharmaceutical exports from India
were to the United States.4
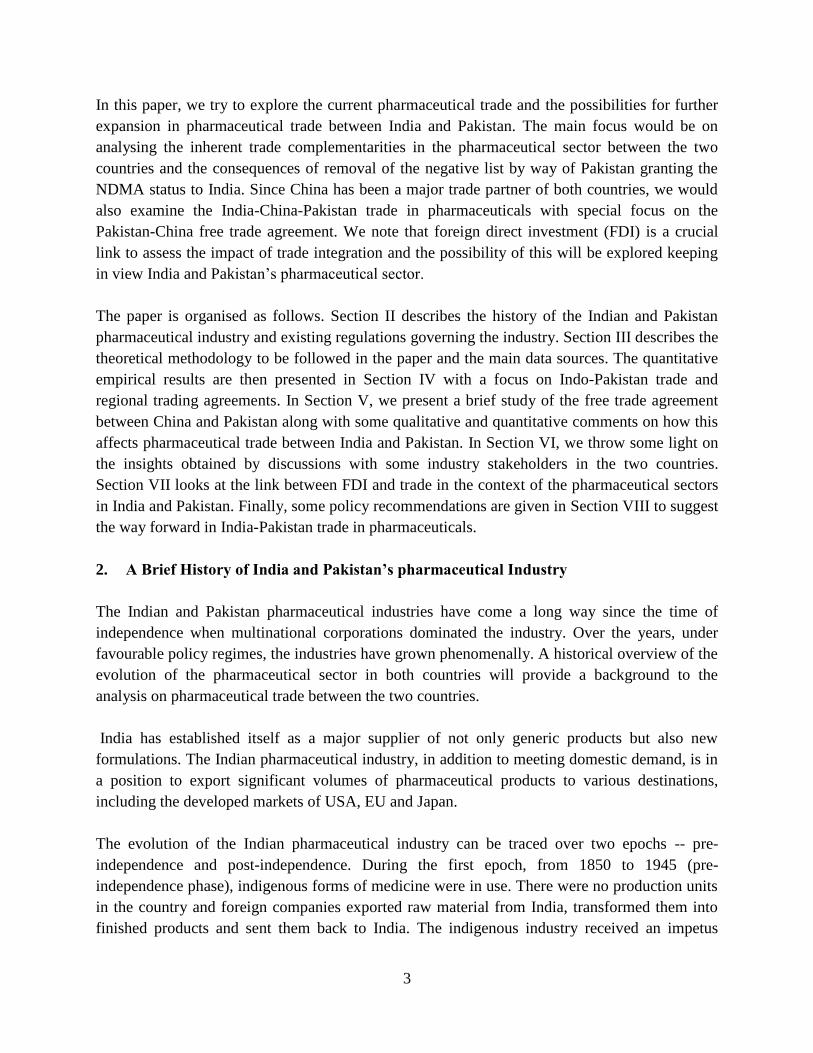
As opposed to the Indian pharmaceutical industry, the Pakistan pharmaceutical sector is still at a
nascent stage. The industry is the 10th
largest in Asia Pacific and was valued at USD 1.63 billion
in 2011 (Amir and Zaman, 2011). There are 600 companies operating and around 45 per cent of
the companies are multinationals. In the current scenario, 80 per cent of the demand for
pharmaceuticals is fulfilled domestically and the rest is covered by imports (Amir and Zaman,
2011). Switzerland, Germany, Denmark, France, United States, Italy and China are the main
countries from which Pakistan imports pharmaceutical items. In 2012, 25 per cent of Pakistan’s
total pharmaceutical imports from the world were from Denmark. Pakistan’s major export
markets are Afghanistan, Sri Lanka, Vietnam, Philippines, Myanmar, Nigeria and Kenya. In
2012, 28 per cent of the total pharmaceutical exports from Pakistan went to Afghanistan.
The contrast in terms of export markets for pharmaceuticals of the two countries is quite clear
and interesting to note. Typically, India seems to have a look-west approach and Pakistan tends
to look more towards the eastern part of the world in terms of where it exports pharmaceutical
items. In terms of imports, one Asian country that has emerged recently as a common exporter of
pharmaceuticals to both India and Pakistan has been China.
4 All figures on shares of countries in India’s and Pakistan’s exports and imports are the authors’ calculations using
data from UN COMTRADE.
3
In this paper, we try to explore the current pharmaceutical trade and the possibilities for further
expansion in pharmaceutical trade between India and Pakistan. The main focus would be on
analysing the inherent trade complementarities in the pharmaceutical sector between the two
countries and the consequences of removal of the negative list by way of Pakistan granting the
NDMA status to India. Since China has been a major trade partner of both countries, we would
also examine the India-China-Pakistan trade in pharmaceuticals with special focus on the
Pakistan-China free trade agreement. We note that foreign direct investment (FDI) is a crucial
link to assess the impact of trade integration and the possibility of this will be explored keeping
in view India and Pakistan’s pharmaceutical sector.
The paper is organised as follows. Section II describes the history of the Indian and Pakistan
pharmaceutical industry and existing regulations governing the industry. Section III describes the
theoretical methodology to be followed in the paper and the main data sources. The quantitative
empirical results are then presented in Section IV with a focus on Indo-Pakistan trade and
regional trading agreements. In Section V, we present a brief study of the free trade agreement
between China and Pakistan along with some qualitative and quantitative comments on how this
affects pharmaceutical trade between India and Pakistan. In Section VI, we throw some light on
the insights obtained by discussions with some industry stakeholders in the two countries.
Section VII looks at the link between FDI and trade in the context of the pharmaceutical sectors
in India and Pakistan. Finally, some policy recommendations are given in Section VIII to suggest
the way forward in India-Pakistan trade in pharmaceuticals.
2. A Brief History of India and Pakistan’s pharmaceutical Industry
The Indian and Pakistan pharmaceutical industries have come a long way since the time of
independence when multinational corporations dominated the industry. Over the years, under
favourable policy regimes, the industries have grown phenomenally. A historical overview of the
evolution of the pharmaceutical sector in both countries will provide a background to the
analysis on pharmaceutical trade between the two countries.
India has established itself as a major supplier of not only generic products but also new
formulations. The Indian pharmaceutical industry, in addition to meeting domestic demand, is in
a position to export significant volumes of pharmaceutical products to various destinations,
including the developed markets of USA, EU and Japan.
The evolution of the Indian pharmaceutical industry can be traced over two epochs -- pre-
independence and post-independence. During the first epoch, from 1850 to 1945 (pre-
independence phase), indigenous forms of medicine were in use. There were no production units
in the country and foreign companies exported raw material from India, transformed them into
finished products and sent them back to India. The indigenous industry received an impetus

4
during World War II when there was a shortage in supply of drugs from foreign companies
(Sahu, 1998).
After independence, the evolution can be divided mainly into three phases:
1945-1970- There was a major therapeutic revolution, with a shift in the structure of the industry
resulting in the growth of the global pharmaceutical industry during this period. However, India
could not capitalise on this growth due to the lack of technology, capital and support from the
government. Concerned by the lack of manufacturing facilities and guided by the perception that
‘foreign technology’ was important for the growth of pharmaceutical sector, the Government of
India brought out the New Industrial Policy Statement, 1948, to liberalise production and
licensing of drugs for MNCs. This led to the free flow of foreign capital and there was rapid
growth in the sector. Despite the liberal attitude towards MNCs, they did not establish any
production units in India. They preferred to import bulk drugs for manufacturing formulations
rather than setup production units in India because production required investment in plant and
machinery and was less profitable than import of bulk drugs to transform into formulations
(Mazumdar, 2013). The government became aware of the reluctance of foreign firms to start
manufacturing bulk drugs from the basic stage in India and the inability of the Indian private
sector because of the limitations of the Indian patent law (Sahu, 1998). Under the Industrial
licensing policy of 1956, the government made it mandatory for foreign companies to produce
drugs from the basic stage by establishing their production units in India. Hence, many foreign
companies started their production in India and, with government support, many domestic
companies also entered the market leading to an increase in drug production.
1970-1995- Even though domestic companies had grown considerably, foreign MNCs still
dominated the pharmaceutical industry until the 1970s. However, during this period, the public
sector and indigenous companies contributed to a significant share of the bulk drug production.
Most foreign companies were engaged in high pay-off formulation production, which resulted in
high prices in India. Hence, the government’s efforts turned to curbing the monopolistic position
of foreign firms. In 1970, the government withdrew the concessions it had granted to foreign
firms (Sahu, 1998). The Patent Act of 1970 recognised only process patents. The life of a patent
was also significantly reduced from 16 to 5 years from the date of sealing or date of filing a
complete application, whichever was shorter. The Foreign Exchange Regulation Act (FERA),
enacted in 1973, put further restrictions on foreign equity holdings and was implemented to
compel MNC’s to produce high technology bulk drugs. For FERA companies, licences were
granted only when companies provided 50 per cent of the drugs to non-associated formulators
and the ratio of value of bulk drugs to own manufacture was 1:5, which was set as 1:10 for
domestic companies. The New Drug Policy, enacted in 1978, reserved production of various
categories of drugs for domestic producers (Mazumdar, 2013). Hence, with the Patents Act, New
Drug Policy and FERA, the share of MNC’s dropped and the industry embarked on a high
5
growth path; simultaneously, there was a fall in medicine prices and a large number of generic
versions of drugs were introduced.
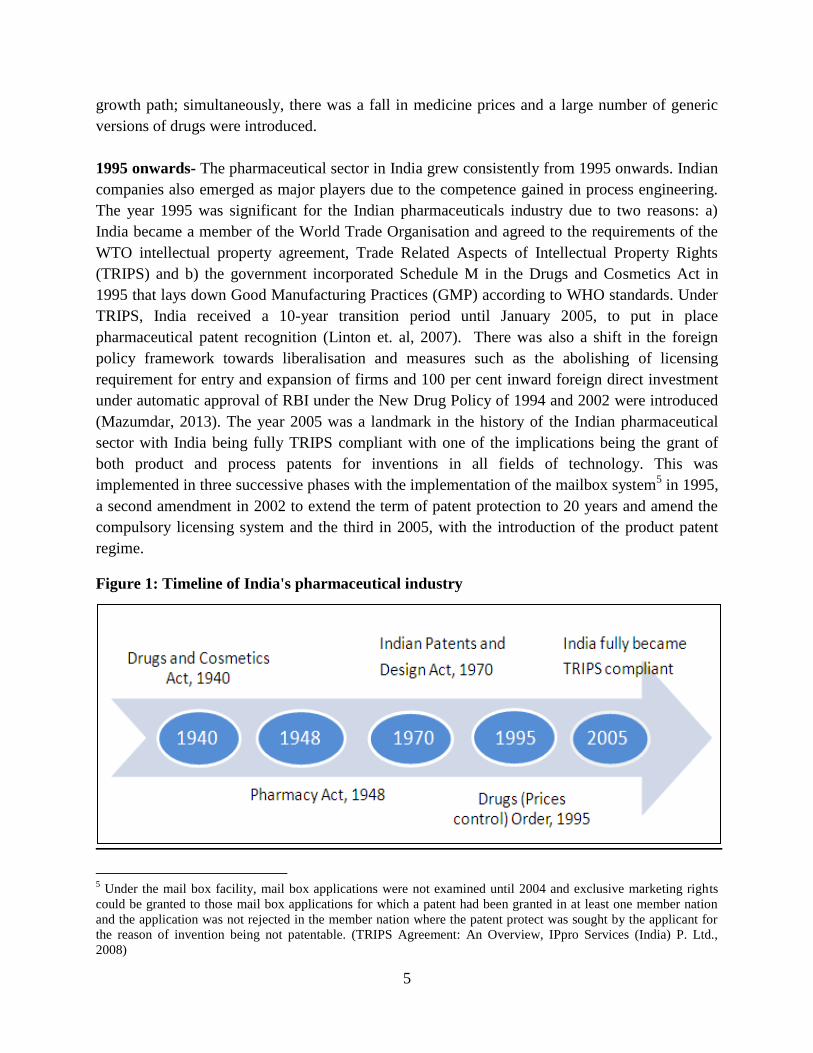
1995 onwards- The pharmaceutical sector in India grew consistently from 1995 onwards. Indian
companies also emerged as major players due to the competence gained in process engineering.
The year 1995 was significant for the Indian pharmaceuticals industry due to two reasons: a)
India became a member of the World Trade Organisation and agreed to the requirements of the
WTO intellectual property agreement, Trade Related Aspects of Intellectual Property Rights
(TRIPS) and b) the government incorporated Schedule M in the Drugs and Cosmetics Act in
1995 that lays down Good Manufacturing Practices (GMP) according to WHO standards. Under
TRIPS, India received a 10-year transition period until January 2005, to put in place
pharmaceutical patent recognition (Linton et. al, 2007). There was also a shift in the foreign
policy framework towards liberalisation and measures such as the abolishing of licensing
requirement for entry and expansion of firms and 100 per cent inward foreign direct investment
under automatic approval of RBI under the New Drug Policy of 1994 and 2002 were introduced
(Mazumdar, 2013). The year 2005 was a landmark in the history of the Indian pharmaceutical
sector with India being fully TRIPS compliant with one of the implications being the grant of
both product and process patents for inventions in all fields of technology. This was
implemented in three successive phases with the implementation of the mailbox system5 in 1995,
a second amendment in 2002 to extend the term of patent protection to 20 years and amend the
compulsory licensing system and the third in 2005, with the introduction of the product patent
regime.
Figure 1: Timeline of India's pharmaceutical industry
5 Under the mail box facility, mail box applications were not examined until 2004 and exclusive marketing rights
could be granted to those mail box applications for which a patent had been granted in at least one member nation
and the application was not rejected in the member nation where the patent protect was sought by the applicant for
the reason of invention being not patentable. (TRIPS Agreement: An Overview, IPpro Services (India) P. Ltd.,
2008)
6
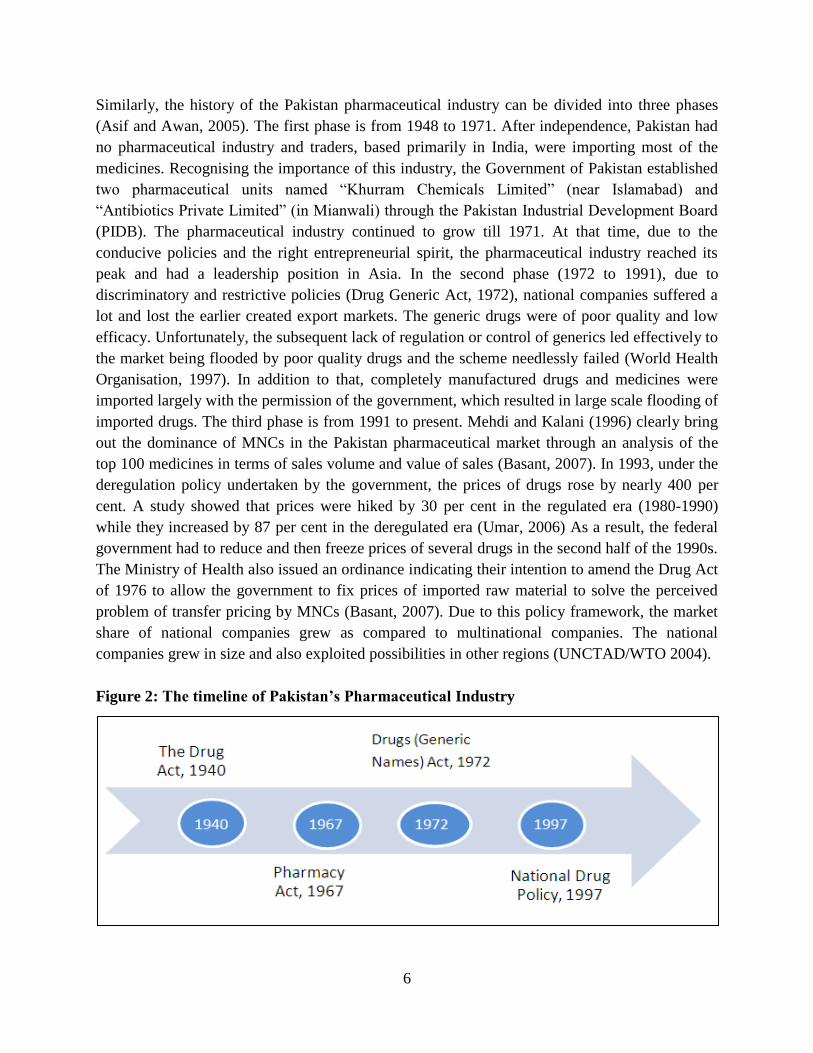
Similarly, the history of the Pakistan pharmaceutical industry can be divided into three phases
(Asif and Awan, 2005). The first phase is from 1948 to 1971. After independence, Pakistan had
no pharmaceutical industry and traders, based primarily in India, were importing most of the
medicines. Recognising the importance of this industry, the Government of Pakistan established
two pharmaceutical units named “Khurram Chemicals Limited” (near Islamabad) and
“Antibiotics Private Limited” (in Mianwali) through the Pakistan Industrial Development Board
(PIDB). The pharmaceutical industry continued to grow till 1971. At that time, due to the
conducive policies and the right entrepreneurial spirit, the pharmaceutical industry reached its
peak and had a leadership position in Asia. In the second phase (1972 to 1991), due to
discriminatory and restrictive policies (Drug Generic Act, 1972), national companies suffered a
lot and lost the earlier created export markets. The generic drugs were of poor quality and low
efficacy. Unfortunately, the subsequent lack of regulation or control of generics led effectively to
the market being flooded by poor quality drugs and the scheme needlessly failed (World Health
Organisation, 1997). In addition to that, completely manufactured drugs and medicines were
imported largely with the permission of the government, which resulted in large scale flooding of
imported drugs. The third phase is from 1991 to present. Mehdi and Kalani (1996) clearly bring
out the dominance of MNCs in the Pakistan pharmaceutical market through an analysis of the
top 100 medicines in terms of sales volume and value of sales (Basant, 2007). In 1993, under the
deregulation policy undertaken by the government, the prices of drugs rose by nearly 400 per
cent. A study showed that prices were hiked by 30 per cent in the regulated era (1980-1990)
while they increased by 87 per cent in the deregulated era (Umar, 2006) As a result, the federal
government had to reduce and then freeze prices of several drugs in the second half of the 1990s.
The Ministry of Health also issued an ordinance indicating their intention to amend the Drug Act
of 1976 to allow the government to fix prices of imported raw material to solve the perceived
problem of transfer pricing by MNCs (Basant, 2007). Due to this policy framework, the market
share of national companies grew as compared to multinational companies. The national
companies grew in size and also exploited possibilities in other regions (UNCTAD/WTO 2004).
Figure 2: The timeline of Pakistan’s Pharmaceutical Industry
7
Perhaps, due to the large scale of imports that the pharmaceutical industry witnessed in its second phase, industry stakeholders are sceptical of integrating with India. There is apparent concern that Pakistan pharmaceutical industry will not be able to compete with the well established Indian pharmaceutical companies because the latter possess economies of scale and are endowed with superior technological and human resources. Factors limiting output like inconsistent policy, lack of funds for upgrading plants, high duties imposed on the formulation industry, poor policy framework, lack of research and development facilities, unavailability of sophisticated machinery, high input costs, discriminatory policies and stringent price control are the major factors that contribute to the poor performance of manufacturing in all sectors in Pakistan (Asif and Awan, 2005). 3. Theoretical Framework The quantitative analysis in the paper consists of examining the trade potential of India and Pakistan in pharmaceuticals. We have used three measures to examine this potential: the trade possibility approach, intra-industry trade index and trade complementarity index. The section also lists the type of data used for empirical analysis. 3.1 Trade Possibility Approach To look at the trade potential in pharmaceutical trade, we have used the Trade Possibility Approach. Trade possibilities exist in items that two countries can import from each other instead of importing from elsewhere in the world. The Trade Possibility Approach is a simple, yet intuitive method, which yields practical results (Taneja et. al, 2013). It is calculated as follows:
Min SE, MI ET where SE, MI and ET are supplier’s global exports, receiver’s global imports and existing trade between the supplier and the receiver (Taneja et. al, 2013). 3.2 Intra-Industry Trade Index The nature of trade between any two countries can be inter-industry or intra industry. Trade theory tells us that the former is normally a characteristic of trade between dissimilar countries in homogenous goods (for example, trade between developed countries and less developed countries). This is often called Ricardian or Heckscher-Ohlin (HOS) trade (Bhagwati et. al, 1998). On the other hand, there can be trade between somewhat “similar countries” in differentiated goods and this is often referred to as IIT or intra-industry trade (Krugman, 1979). Empirically, IIT is defined as the simultaneous export and import of goods in the same industry. It is also seen that IIT is typical of trade in manufactured goods where “product differentiation”
8
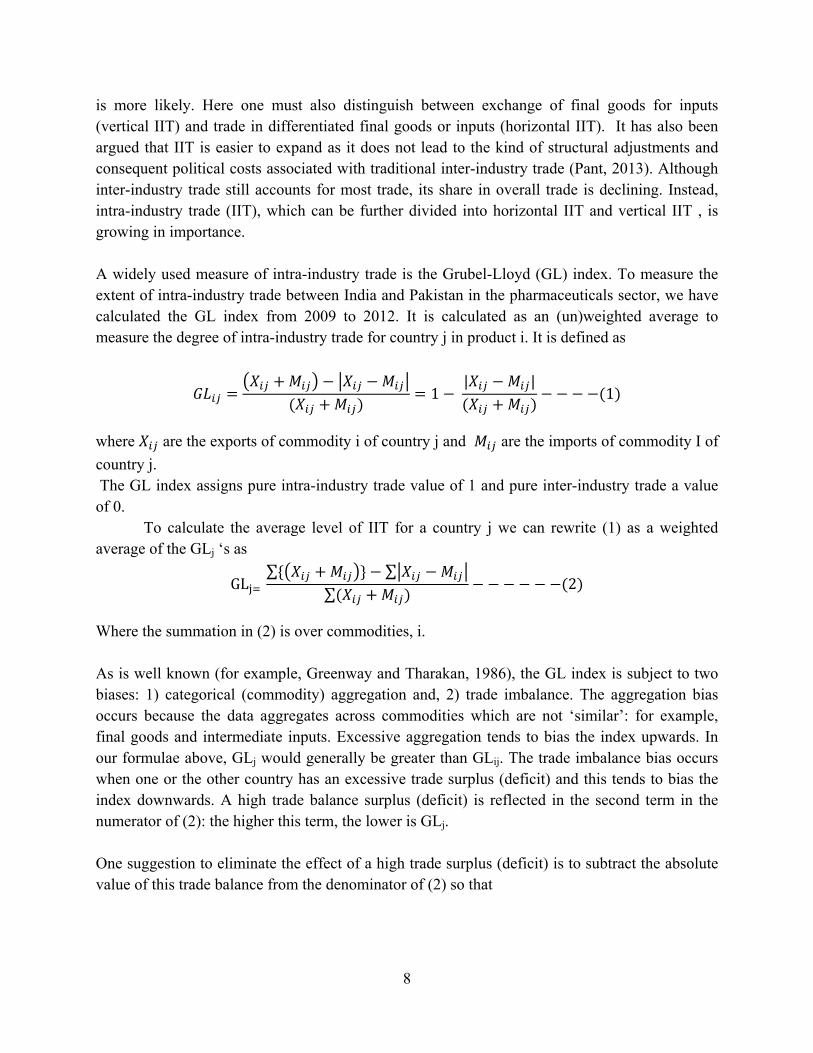
is more likely. Here one must also distinguish between exchange of final goods for inputs (vertical IIT) and trade in differentiated final goods or inputs (horizontal IIT). It has also been argued that IIT is easier to expand as it does not lead to the kind of structural adjustments and consequent political costs associated with traditional inter-industry trade (Pant, 2013). Although inter-industry trade still accounts for most trade, its share in overall trade is declining. Instead, intra-industry trade (IIT), which can be further divided into horizontal IIT and vertical IIT , is growing in importance. A widely used measure of intra-industry trade is the Grubel-Lloyd (GL) index. To measure the extent of intra-industry trade between India and Pakistan in the pharmaceuticals sector, we have calculated the GL index from 2009 to 2012. It is calculated as an (un)weighted average to measure the degree of intra-industry trade for country j in product i. It is defined as
1 | |
1
where are the exports of commodity i of country j and are the imports of commodity I of country j. The GL index assigns pure intra-industry trade value of 1 and pure inter-industry trade a value of 0. To calculate the average level of IIT for a country j we can rewrite (1) as a weighted average of the GLj ‘s as
GL ∑ ∑
∑ 2
Where the summation in (2) is over commodities, i. As is well known (for example, Greenway and Tharakan, 1986), the GL index is subject to two biases: 1) categorical (commodity) aggregation and, 2) trade imbalance. The aggregation bias occurs because the data aggregates across commodities which are not ‘similar’: for example, final goods and intermediate inputs. Excessive aggregation tends to bias the index upwards. In our formulae above, GLj would generally be greater than GLij. The trade imbalance bias occurs when one or the other country has an excessive trade surplus (deficit) and this tends to bias the index downwards. A high trade balance surplus (deficit) is reflected in the second term in the numerator of (2): the higher this term, the lower is GLj. One suggestion to eliminate the effect of a high trade surplus (deficit) is to subtract the absolute value of this trade balance from the denominator of (2) so that
9
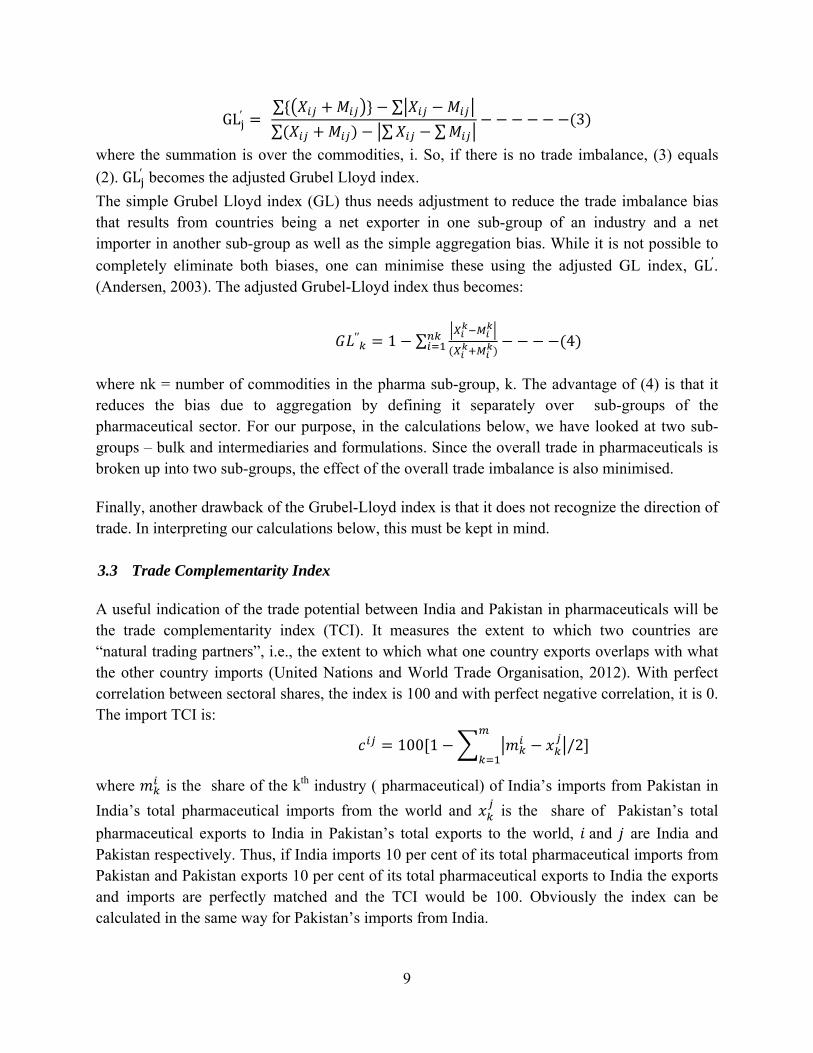
GL′ ∑ ∑∑ ∑ ∑
3
where the summation is over the commodities, i. So, if there is no trade imbalance, (3) equals (2). GL′ becomes the adjusted Grubel Lloyd index. The simple Grubel Lloyd index (GL) thus needs adjustment to reduce the trade imbalance bias that results from countries being a net exporter in one sub-group of an industry and a net importer in another sub-group as well as the simple aggregation bias. While it is not possible to completely eliminate both biases, one can minimise these using the adjusted GL index, GL′. (Andersen, 2003). The adjusted Grubel-Lloyd index thus becomes:
′′ 1 ∑ 4
where nk = number of commodities in the pharma sub-group, k. The advantage of (4) is that it reduces the bias due to aggregation by defining it separately over sub-groups of the pharmaceutical sector. For our purpose, in the calculations below, we have looked at two sub-groups – bulk and intermediaries and formulations. Since the overall trade in pharmaceuticals is broken up into two sub-groups, the effect of the overall trade imbalance is also minimised. Finally, another drawback of the Grubel-Lloyd index is that it does not recognize the direction of trade. In interpreting our calculations below, this must be kept in mind. 3.3 Trade Complementarity Index A useful indication of the trade potential between India and Pakistan in pharmaceuticals will be the trade complementarity index (TCI). It measures the extent to which two countries are “natural trading partners”, i.e., the extent to which what one country exports overlaps with what the other country imports (United Nations and World Trade Organisation, 2012). With perfect correlation between sectoral shares, the index is 100 and with perfect negative correlation, it is 0. The import TCI is:
100 1 /2
where is the share of the kth industry ( pharmaceutical) of India’s imports from Pakistan in India’s total pharmaceutical imports from the world and is the share of Pakistan’s total pharmaceutical exports to India in Pakistan’s total exports to the world, and are India and Pakistan respectively. Thus, if India imports 10 per cent of its total pharmaceutical imports from Pakistan and Pakistan exports 10 per cent of its total pharmaceutical exports to India the exports and imports are perfectly matched and the TCI would be 100. Obviously the index can be calculated in the same way for Pakistan’s imports from India.

10
3.4 Data
For an empirical analysis, trade values and quantities have been extracted from WITS
COMTRADE database. The data has been collected for two basic categories of pharmaceuticals:
bulk and intermediaries, and formulations (Kallummal et al. 2012). The production of
pharmaceutical items entails use of organic, inorganic and other chemicals. Owing to this fact,
our study uses data on 239 pharmaceuticals items for selected HS (Harmonized system) codes
15,17,19,23, 26, 27, 28, 29 and 30.6 The data work in the paper, therefore, is based on the
available classification of products in the pharmaceutical industry by the Department of
Pharmaceuticals (DOP), Indian Drug Manufacturers Association (IDMA) and the paper “Trends
in India’s Trade in Pharmaceutical Sector: Some Insights” by Dr. Murali Kallumal and Kavita
Bugalya (2013) .
4. Empirical Results and Analysis
4.1 Indo-Pakistan Trade and RTAs
Trade between India and Pakistan, due to political and strategic issues, has been fraught with
hindrances. The establishment of SAARC7
(South Asian Association for Regional Co-operation)
in 1985 can be remarked as the initiation of improving relations in the South Asian bloc,
particularly between India and Pakistan. The launching of the South Asian Preferential trade
Agreement (SAPTA) in 1995 was the first major political breakthrough for SAARC since it was
India’s first regional agreement on economic co-operation (Sawhney and Kumar, 2007). Later,
the signing of the SAFTA (South Asian Free Trade Area) Agreement in January 2004 was an
attempt by SAARC countries to further integrate through trade and investment. Nepal, Bhutan,
Maldives and Bangladesh comprised the least developed countries (LDCs) and Pakistan, India
and Sri Lanka the non-LDCs (NLDCs).
The trade liberalisation programme of SAFTA has described the schedules of tariff reductions
for LDCs and NLDCs. Along with this, the contracting states can maintain sensitive lists for
which the tariff reduction schedules will not hold. Sensitive lists are lists of products of special
interest to individual member countries that are exempted from low SAFTA tariffs. The use of
sensitive lists allows countries to protect growing domestic industries or important sources of
customs revenue. However, overuse of sensitive lists can make goods more expensive for
consumers and reduce trade between countries.8
6HS 15 includes animal or vegetable fats and oils and their cleavage products, HS 17 includes sugars and sugar
confectionery, hs 19 includes preparations of cereals, flour, starch or milk, hs 23 includes residues and waste from
the food industries, hs 27 includes mineral fuels, mineral oils and products of their distillation, HS 28 includes
inorganic chemicals, HS 29 includes organic chemicals and HS 30 includes pharmaceutical items
7SAARC was founded by seven countries viz., Bangladesh, Bhutan, India, Maldives, Nepal, Pakistan and Sri Lanka.
8Ministry of Commerce and Industries, Republic of Afghanistan
11
As mentioned earlier, Pakistan prohibits imports of certain commodities from India, known
as the negative list and maintains a sensitive list (a list of products on which no preferential
concessions are allowed) under the South Asian Free Trade Agreement (SAFTA). There are
35 pharmaceutical items in the negative list and 24 pharmaceutical items (at 6 digit level of
HS codes) in the sensitive list (Refer Annexure 2, Table A1 and A2). Most of the items fall in
the category of medicaments, dextrose and antibiotics containing penicillin and its
derivatives thereof. If Pakistan gives the MFN status to India, it will do away with the
negative list. Although most of the pharmaceutical items in the negative list command a 2-3
per cent share in Pakistan’s total imports from the world, their importance cannot be
undermined. In 2012, some of the items such as medicaments had a 36 per cent share in
Pakistan imports of pharmaceutical items from the world and a 27 per cent share in Indian
exports of pharmaceutical items to the world, with a similar trend in the previous years. This
clearly implies that there is a possibility for Pakistan to import these items from India.
The LDCs and NLDCs have affirmed their existing rights and obligations with respect to each
other under the Marakkesh Agreement establishing World Trade Organization (WTO). As
members of the World Trade Organization (WTO), they are supposed to accord "most favoured
nation" (MFN) status to each other. The MFN principle is a principle of non-discrimination
embodied in the General Agreement on Trade and Tariffs (GATT), which means countries
cannot discriminate between their trading partners. The MFN principle ensures that each country
treats the 159 fellow-members of WTO equally. But there are some exceptions for preferential
treatment of developing countries, regional free trade areas and customs unions (World Trade
Organization). India accorded the MFN status to Pakistan in 1996 and Pakistan has assured it
will grant India MFN status soon. However, because Pakistan has not granted MFN status to
India, it maintains a negative list for India. Items in Pakistan’s negative list are those which are
not allowed to be imported from India.
Until 2011, Pakistan maintained a positive list for India specifying permitted items to be
imported. It was when a joint statement was issued laying down full phasing-in of MFN in
November 2011 that Pakistan shifted to a small negative list. Accordingly, India and Pakistan
maintain a sensitive list for its SAFTA members and Pakistan, in addition, maintains a negative
list for India. As of now, India has 6 pharmaceutical items in its sensitive list for NLDCs and
Pakistan has 24 pharmaceutical items (Refer Annexure 2, Table A1 and A3). In addition to the
sensitive list, Pakistan also maintains a negative list for India. Pakistan’s negative list consists of
35 pharmaceutical items9 (Refer Annexure 2, Table A2).
Box 1: MFN: A Hindrance to India Pakistan Pharmaceutical Trade?
9The number of items in the negative and sensitive lists is according to the classification of pharmaceutical items
used in the paper.
12
4.2 Indo-Pakistan Trade in Pharmaceuticals: Potential and Trends
The focus of this section will be to examine the pharmaceutical items which are currently traded
between India and Pakistan and those which are on the sensitive and negative lists. Looking at
pharmaceutical items other than those in the sensitive and negative lists, we will examine the
trend of their share in total trade over the years. The share of Indian exports to Pakistan in India’s
trade with the world in pharmaceutical items has ranged between just 1 and 3 per cent over the
years 2009-12. The trade balance in these items has been in favour of India, possibly because of
the fact that Pakistan’s pharmaceutical sector is still in the developing stage. Consequently,
possibilities for both countries to integrate are untapped and yet to be taken advantage of.
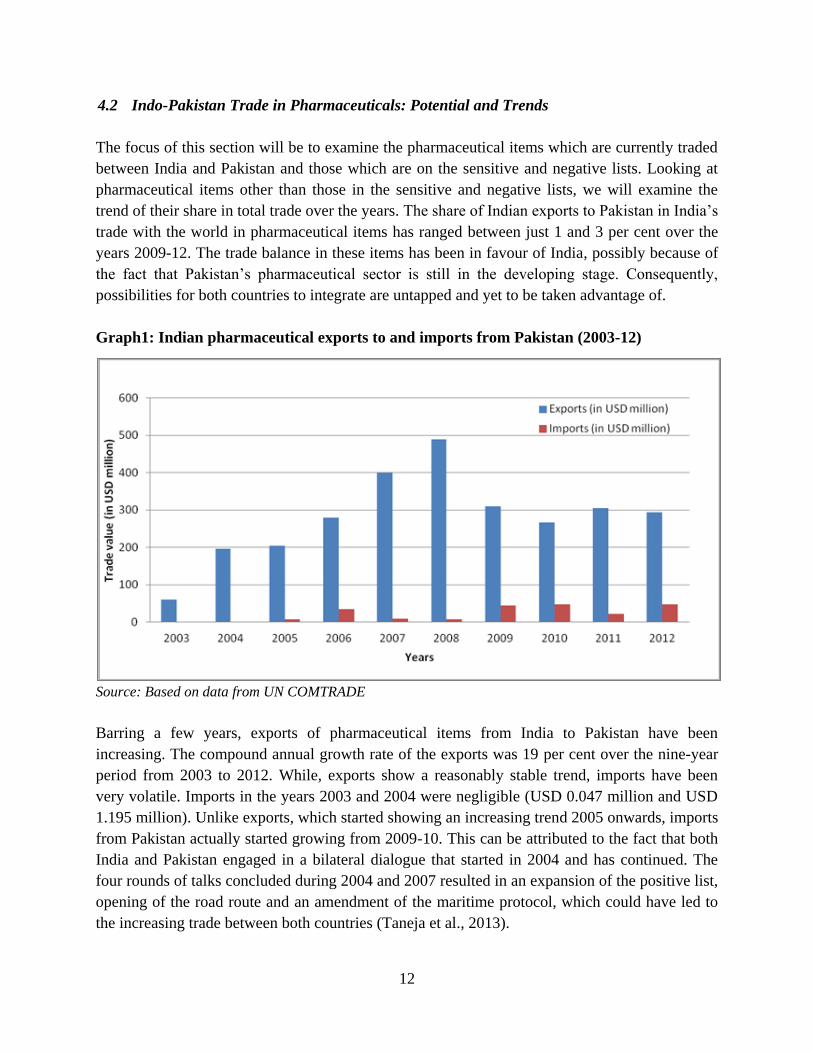
Graph1: Indian pharmaceutical exports to and imports from Pakistan (2003-12)
Source: Based on data from UN COMTRADE
Barring a few years, exports of pharmaceutical items from India to Pakistan have been
increasing. The compound annual growth rate of the exports was 19 per cent over the nine-year
period from 2003 to 2012. While, exports show a reasonably stable trend, imports have been
very volatile. Imports in the years 2003 and 2004 were negligible (USD 0.047 million and USD
1.195 million). Unlike exports, which started showing an increasing trend 2005 onwards, imports
from Pakistan actually started growing from 2009-10. This can be attributed to the fact that both
India and Pakistan engaged in a bilateral dialogue that started in 2004 and has continued. The
four rounds of talks concluded during 2004 and 2007 resulted in an expansion of the positive list,
opening of the road route and an amendment of the maritime protocol, which could have led to
the increasing trade between both countries (Taneja et al., 2013).
13
Examining items which are in the sensitive and negative lists will throw light on the potential for
trade and competitiveness. To examine the trade potential between India and Pakistan of
pharmaceutical goods, we have used the trade possibility approach. Since current trade in
pharmaceuticals between India and Pakistan is limited, this measure will throw light on the trade
potential in pharmaceuticals between the two countries. The results of the trade possibility
exercise show that in 2012, there was an untapped trade potential of USD1,635.5 million in
pharmaceutical items between India and Pakistan. The quantum of export potential from India to
Pakistan is much more than the import potential. Of the trade potential – USD1,635.5 million –
the export potential of India is USD1,534.6 million and import potential is USD102.8 million.
These figures are negligible when compared to the current Indian pharmaceutical exports to
Pakistan, of USD 16.99 million and import of USD 0.07 million in 2012. Clearly,
pharmaceutical trade of both countries with the rest of the world is much greater than the
bilateral trade.
An overview of the trends and potential for trade in pharmaceutical items reveals that current
trade is not zero between India and Pakistan. Markets definitely exist in both countries and there
would be gains for both India and Pakistan from greater trade integration. As regards trade
within the pharmaceutical sector, an insight into intra-industry trade would yield a better picture
of the trade potential between the two countries. Bulk and intermediaries, and formulations form
two major categories of pharmaceutical items and the extent to which there is exchange of these
similar pharmaceuticals will provide a snapshot for future integration in trade between both
countries.
4.3 Intra-Industry Trade between India and Pakistan
It is quite possible that trade between India and Pakistan would lie in the intra-industry trade
category given that they are developing countries and have somewhat “similar” industry
structures. The growth in the Indian pharmaceutical industry is mainly driven by contract
manufacturing. The sourcing of APIs for patented drugs is maintained in-house by most
innovator companies in order to maintain greater flexibility and quality control (Dun and
Bradstreet). The Pakistan pharmaceutical industry is similar. Leading multinationals companies
have their products manufactured by the national companies under contract manufacturing
arrangements (International Trade Centre, UNCTAD/WTO, 2007). Domestic pharmaceutical
manufacturing industries have acquired the latest technologies and have been involved in
contract manufacturing in both countries. The Grubel Lloyd index calculations would help
validate the intra-industry trade in pharmaceuticals between India and Pakistan. Indian exports
and imports of pharmaceuticals along with three intra-industry trade indices (simple, adjusted
and group-wise) are shown in the table below.

14
Table 1: Pharmaceutical exports and imports of India, simple Grubel Lloyd index,
Adjusted Grubel Lloyd index and group-wise adjusted GL indices (2009-12)
2009 2010 2011 2012
Exports (in 1000 US $) 315310.2 272628.7 313274.6 303894.2
Imports (in 1000 US $) 44317.52 48174.89 2138.41 47186.31
Simple Grubel- Lloyd index
(GL) 0.04 0.0015 0.0062 0.0057
Adjusted Grubel- Lloyd (GL’) 0.48 0.69 0.55 0.25
Group-wise GL indices
Bulk and intermediaries
adjusted GL index, GL’’ 0.049 0.0015 0.0069 0.0057
Formulations adjusted GL
index , GL’’ 0.0017 0.0026 0.00003 0.0084
Source: Authors calculations using data from COMTRADE
The GL index value ranges from 0.001 to 0.04. This would imply that intra-industry trade in
pharmaceuticals is not very high between India and Pakistan considering a value of 1 indicates
pure intra-industry trade. The simple GL index, GL, shows a chequered pattern from the years
2009 to 2012, increasing from 2009 to 2010 and decreasing between 2010 and 2011. We have
already noted that this index is affected by trade imbalances. In this case, the trade imbalance is
in favour of India. The adjustment for trade imbalance is shown in the index GL’ in Table 1
above. However, comparison of the changes over time in the either of the two indices reveals
that IIT in general is very limited. As an inspection of GL’ above shows, there was some
increase in IIT between 2009 and 2010 but subsequently, IIT has shown a secular decline. The
results of group-wise GL indices (GL”) seem to indicate that even the limited IIT is occurring
mainly in bulk and intermediaries and IIT in formulations, in particular, is almost non-existent.
This can be because the Indian pharmaceutical industry, being an established one, has spent
much more on R&D and therefore, can produce formulations for which it needs bulk drugs. The
strength of the Indian pharmaceutical industry lies in reverse engineering (Lalitha, 2002) and its
competitive advantage lies in its lower production and research costs, its large pool of low cost
technical and scientifically trained personnel, and the large number of US FDA certified plants
(Greene, 2007). Besides, only a few companies manufacture good quality APIs in Pakistan and
most are dependent on imports from other countries for the raw material requirements of API
(International Trade Centre, UNCTAD/WTO, 2007). The lack of competitiveness of Pakistan’s
formulations industry largely explains why IIT in this sector has not increased over the years. It
also explains resistance to opening up to imports of Indian formulations, which are mostly in
Pakistan’s negative list. Since Grubel and Lloyd (1975), many studies stressed that there is
strong empirical support for the hypothesis that countries that have common borders and have
eliminated or lowered barriers on trade with each other will have relatively high levels of intra-
15
industry trade. Moreover, the extent of intra-industry trade will be positively correlated with
trade intensity. That is, as the trade volume with trade partners increases, there will be more
opportunity for more differentiated products to be traded (Koçyiğit et al., 2000). While it is still
too early to tell, it is clear that increase in IIT between India and Pakistan is also probably limited
by small trading volumes in general. We also see that IIT in formulations is hindered by the
unequal R&D capabilities of the two countries.
4.4 Trade Complementarity
A useful indication of the trade potential between India and Pakistan in pharmaceuticals will be
the trade complementarity index (TCI). The two TCI values are shown below.
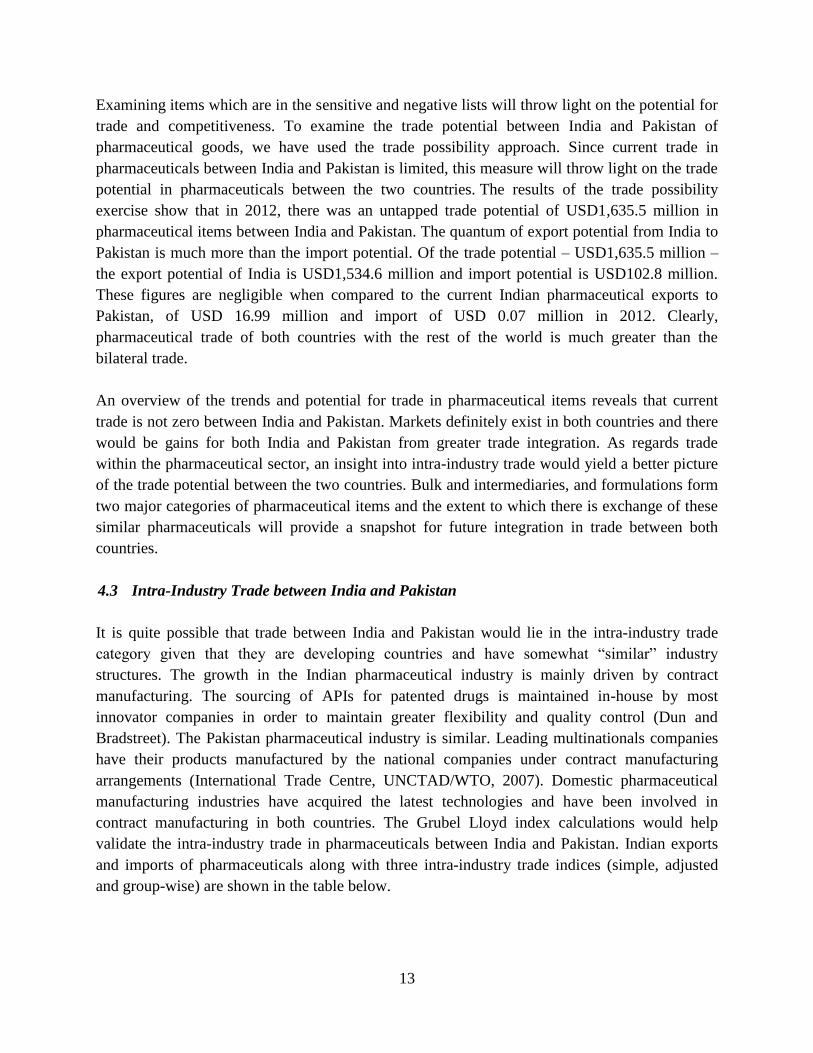
Table 2: Trade Complementarity Index between India and Pakistan
2012
India’s trade complementarity
with Pakistan
Pakistan’s trade
complementarity with India
Trade
Complementarity Index 67.91 72.03
The results for the TCI between India and Pakistan in the year 2012 show that India’s demand
for pharmaceuticals was partially matched by Pakistan’s offer and vice versa. The measure of
adequacy of Pakistan’s export supply to India’s import demand is about 68 per cent whereas, in
the case of India’s exports, it is 72 per cent. Hence, there seems to be a fair degree of
complementarity between the two countries. Expanded trade should exploit this
complementarity. Our discussion of the IIT between the two countries shows that this is not
happening at present.
16
In the recent years, the bio-pharmaceuticals sector has assumed increasing importance in
the light of patent regimes and increasing expenditure on research and development in the
world. In 2010, worldwide R&D spending by the pharmaceuticals and biotechnology sector
grew by 6.2 per cent, strengthening its position as the top R&D investing sector. The rise of
this sector must be exploited to improve trading relations between India and Pakistan.
The current trade between the two countries in bio-pharmaceuticals has been negligible as
compared to that in other pharmaceutical categories. The main trade items of bio-
pharmaceuticals have been antisera and other blood fractions and modified immunological
products, medicaments containing hormones or steroids used as hormones but not
antibiotics, human/animal blood prepared for therapeutic, prophylactic or diagnostic uses;
toxins and cultures of micro-organisms, vaccines for veterinary medicine and extracts of
glands/other organs. Bio-chemical medicines and a few items from the toxins category like
Saxitoxin and Ricin are part of Pakistan’s negative list (Refer Annex 2, Table A2). Most of
the bilateral trade is in the form of Indian exports to Pakistan. Even then, the share of bio-
pharmaceuticals in total Indian pharmaceutical exports to Pakistan is a mere 0.02 per cent.
The indicative potential trade in bio-pharmaceuticals was 31 times the current trade for the
year 2012 (ITC Trade Map).
Collaborative efforts like technology transfer and promoting entrepreneurial know-how
will enhance trade in the bio-pharmaceutical sector which is the upcoming sector in the
pharmaceuticals segment.
Box 2: Bio-Pharmaceuticals: The Link to Strengthening Indo-Pak Pharmaceutical Trade
5. Pakistan-China Trade: The Bottleneck in India-Pak Trade?
For both India and Pakistan, the United States is a major trading partner in pharmaceuticals.
Also, most of the major pharmaceuticals trading partners of both countries are from Europe. In
the Asian region, China is the largest pharmaceuticals exporter to both Pakistan and India. In
fact, China is the only Asian country from which Pakistan gets a major chunk of its
pharmaceutical imports. According to a 2010 KPMG report, the Chinese pharmaceutical industry
is the fifth largest in the world with domestic growth projected at about 20 per cent per annum. It
is characterised by both major and minor players comprising about 5,000 units. China has been
an important producer of bulk drugs (raw material or bulk drugs and intermediaries). The
Chinese pharmaceutical industry has three sub-pharmaceutical industries: 1) chemical medicine
2) traditional Chinese medicine (TCM) and 3) biological products (Kallumal et.al, 2012). The
traditional Chinese medicine and chemical raw materials sectors have enhanced the global
competitiveness of the Chinese pharmaceutical industry. An analysis of the countries from where
Pakistan imports pharmaceutical items shows that the top importing partners of Pakistan –
European countries (Denmark, Switzerland, Germany, Belgium, and Italy) and the United States

17
of America – are outside the Asian region. China is the only Asian country that features in its list
of top 10 import partners.
Graph 2: Share (per cent) in pharmaceutical imports of Pakistan of top 12 suppliers
Source: Trade Map, International Trade Centre
Despite the trade complementarities that exist between India and Pakistan in terms of
geographical proximity and other similarities, Pakistan imports more pharmaceuticals from
China than from India (Refer Annexure 2, Table A4 and A5). Consequently, the potential for
trade in pharmaceuticals between India and Pakistan has remained untapped. Whether this is
because of desire to protect domestic industry or because of political considerations is what will
be looked into in the following sections. The position of China as regards its pharmaceutical
trade with Pakistan will be a crucial link to explain why India-Pakistan trade in pharmaceuticals
remains small.
The theory of customs unions and RTAs tells us that any RTA can lead to trade diversion away
from the non-RTA partners to members of the RTA. This is classified as trade diversion since it
is only the tariff preferences that make member countries lower cost suppliers to other RTA
members. If tariffs did not exist, the lower cost supplier countries would actually lie outside the
RTA (Viner, 1978). Here we look at the issue of such trade diversion for India as a consequence
of the Pakistan-China FTA. Since Pakistan has not given MFN status to India but does give
preferential trade access to China, this issue is worth investigating.
5.1 Are Indian pharmaceutical items substitutes for Chinese exports to Pakistan?
The global economy has been virtually dominated by Chinese exports in nearly all
manufacturing sectors (Kallumal et. al, 2012). China has been increasing its presence in the bulk
0
5
10
15
20
25
30
Shar
e in
val
ue
in
Pak
ista
n's
imp
ort
s (%
)
COUNTRIES
List of supplying markets for pharmaceutical items imported by Pakistan in 2012 (HS code 30)
18
drugs and formulations segments in the pharmaceutical sector. As the world’s fastest growing
economy, China’s pharmaceutical market will definitely have implications for India-Pakistan
trade given that both countries trade with it. The main issue involved with respect to China-
Pakistan and India-Pakistan trade is that being a major trade partner of Pakistan in
pharmaceutical items, it is possible that Chinese exports to Pakistan might counter India-Pakistan
pharmaceutical trade particularly if Chinese exports to Pakistan are given preferential tariff
access. Therefore, it becomes imperative to undertake a detailed analysis of the current
pharmaceutical trade between China and Pakistan keeping in view the China-Pakistan free trade
area (CPFTA) agreement along with the substitutability and complementarity of Indian and
Chinese exports to Pakistan.
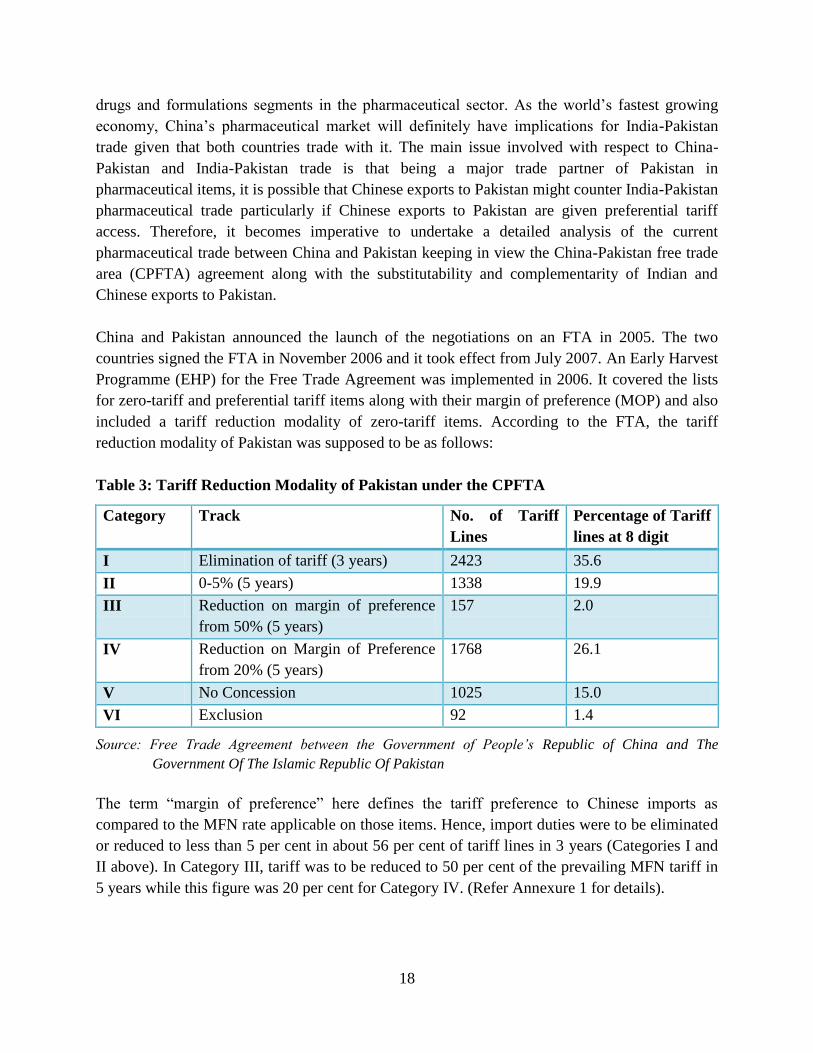
China and Pakistan announced the launch of the negotiations on an FTA in 2005. The two
countries signed the FTA in November 2006 and it took effect from July 2007. An Early Harvest
Programme (EHP) for the Free Trade Agreement was implemented in 2006. It covered the lists
for zero-tariff and preferential tariff items along with their margin of preference (MOP) and also
included a tariff reduction modality of zero-tariff items. According to the FTA, the tariff
reduction modality of Pakistan was supposed to be as follows:
Table 3: Tariff Reduction Modality of Pakistan under the CPFTA
Category Track No. of Tariff
Lines
Percentage of Tariff
lines at 8 digit
I Elimination of tariff (3 years) 2423 35.6
II 0-5% (5 years) 1338 19.9
III Reduction on margin of preference
from 50% (5 years)
157 2.0
IV Reduction on Margin of Preference
from 20% (5 years)
1768 26.1
V No Concession 1025 15.0
VI Exclusion 92 1.4
Source: Free Trade Agreement between the Government of People’s Republic of China and The
Government Of The Islamic Republic Of Pakistan
The term “margin of preference” here defines the tariff preference to Chinese imports as
compared to the MFN rate applicable on those items. Hence, import duties were to be eliminated
or reduced to less than 5 per cent in about 56 per cent of tariff lines in 3 years (Categories I and
II above). In Category III, tariff was to be reduced to 50 per cent of the prevailing MFN tariff in
5 years while this figure was 20 per cent for Category IV. (Refer Annexure 1 for details).
19
In the overall package, Pakistan was to get market access at zero duty on industrial alcohol,
cotton fabrics, bed-linen and other home textiles, marble and other tiles, leather articles, sports
goods, mangoes, citrus fruit and other fruits and vegetables; iron and steel products and
engineering goods. Pakistan has given market access to China mainly in sectors like machinery,
organic and inorganic chemicals, fruits and vegetables, medicaments and other raw materials for
various industries including engineering sector, intermediary goods for engineering sectors, etc.
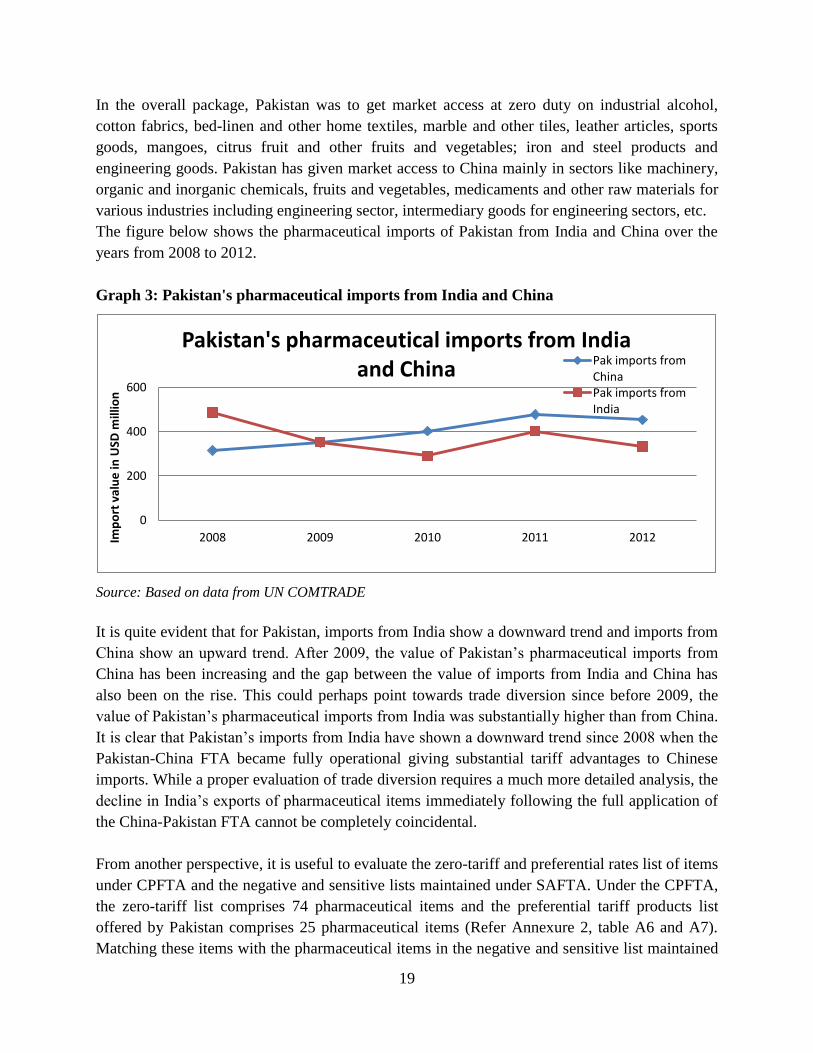
The figure below shows the pharmaceutical imports of Pakistan from India and China over the
years from 2008 to 2012.
Graph 3: Pakistan's pharmaceutical imports from India and China
Source: Based on data from UN COMTRADE
It is quite evident that for Pakistan, imports from India show a downward trend and imports from
China show an upward trend. After 2009, the value of Pakistan’s pharmaceutical imports from
China has been increasing and the gap between the value of imports from India and China has
also been on the rise. This could perhaps point towards trade diversion since before 2009, the
value of Pakistan’s pharmaceutical imports from India was substantially higher than from China.
It is clear that Pakistan’s imports from India have shown a downward trend since 2008 when the
Pakistan-China FTA became fully operational giving substantial tariff advantages to Chinese
imports. While a proper evaluation of trade diversion requires a much more detailed analysis, the
decline in India’s exports of pharmaceutical items immediately following the full application of
the China-Pakistan FTA cannot be completely coincidental.
From another perspective, it is useful to evaluate the zero-tariff and preferential rates list of items
under CPFTA and the negative and sensitive lists maintained under SAFTA. Under the CPFTA,
the zero-tariff list comprises 74 pharmaceutical items and the preferential tariff products list
offered by Pakistan comprises 25 pharmaceutical items (Refer Annexure 2, table A6 and A7).
Matching these items with the pharmaceutical items in the negative and sensitive list maintained
0
200
400
600
2008 2009 2010 2011 2012 Imp
ort
val
ue
in U
SD m
illio
n
Pakistan's pharmaceutical imports from India and China
Pak imports from China Pak imports from India
20
by Pakistan for India reveals that no favourable tariff treatment is given to China over India. The
very fact that the items in the zero-tariff and preferential tariff products are completely different
from the negative list implies that Pakistan does not give preferential treatment to China over
India at least in items on the negative/sensitive list of imports from India. It may be noted that
Pakistan has no negative list of items imported from China.
5.2 Competitiveness of Chinese Pharmaceuticals
The issue of global competitiveness becomes important to see how countries perform in a global
setting. Clearly, China and India both have a certain degree of overall competitiveness in the
global pharmaceutical industry. However, the origin of this competitiveness differs greatly. Since
2004, in the global pharmaceutical value chain production link, China has specialised mainly in
raw medicine, while India has specialised in prepared medicine. It was also observed that China
exported raw medicine while it imported manufactured formulations (Kallumalet.al, 2012).
Pakistan assumes importance in this trilateral, not only as a major importer of pharmaceuticals
but also as a foreign collaborator, owing to its proximity with India and it being a chief importer
from China. In 2012, the share of Pakistan’s pharmaceutical imports, from China was 17 per cent
and 12 per cent from India. As regards competitiveness, considering the geographical proximity,
ease of transportation to India and competitiveness of Indian drugs, the share of imports from
India could be higher.
Are Indian imports competitive? Has the CPFTA diverted trade from India to China? Does
Pakistan need to maintain a negative list for India? A proper analysis of the trade
diverting/creating potential of the CPFTA requires calculation of demand elasticities etc. This is
not possible given the limited data available. We have followed a simpler, yet indicative,
procedure of comparing landed prices in Pakistan for Chinese and Indian pharmaceutical
products for the year 2012.
Unit values are calculated by dividing the trade value by the quantity. Since CIF (cost, insurance,
freight) cost is the actual cost of the imported goods, trade value of Pakistan’s pharmaceutical
imports from China and India have been used to calculate the unit values. The unit values have
been used as proxies for the prices of items in this exercise. Although they suffer from the
quantity bias, this is the closest estimation of prices possible with the data on trade value and
quantity. The table below shows the unit values of top 13 Pakistan imports from China and the
respective unit values of Pakistan imports of those items from India.10
10
This exercise has been carried out using data at the HS 6-digit level from UN COMTRADE rather than at HS 8-
digit level to facilitate comparison and make the results discernible. Hence, wherever applicable, we talk about
categories and not specific items.
21
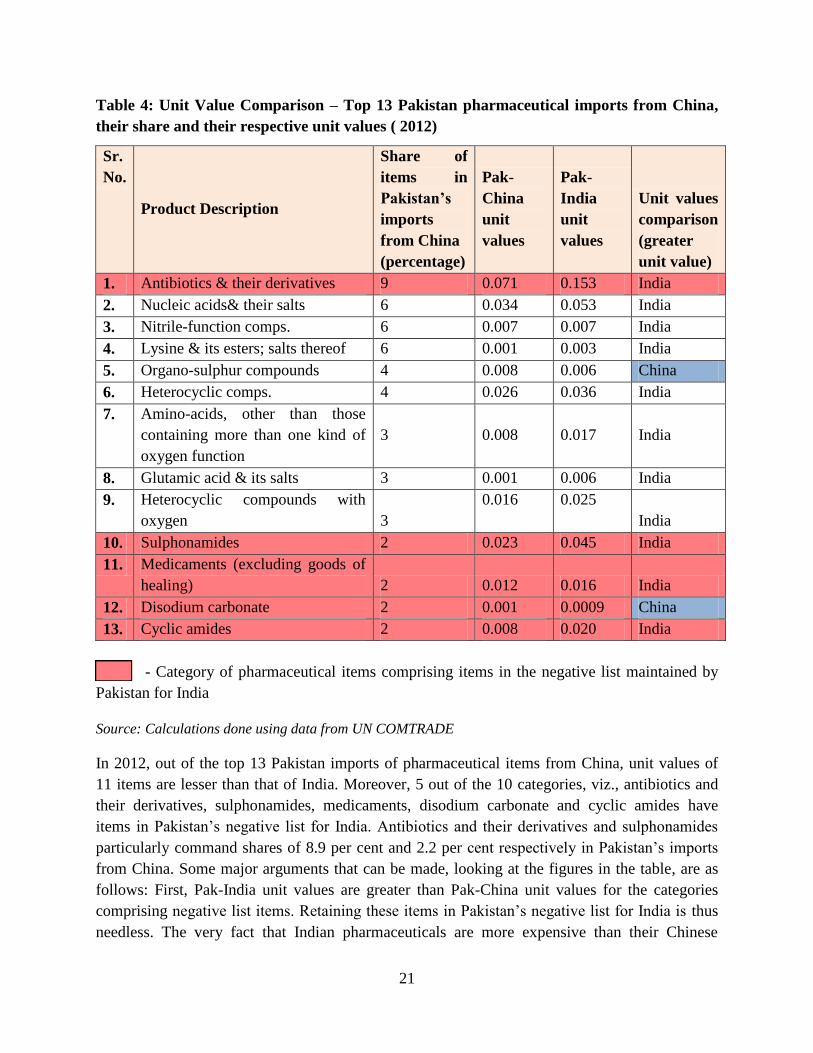
Table 4: Unit Value Comparison – Top 13 Pakistan pharmaceutical imports from China,
their share and their respective unit values ( 2012)
Sr.
No.
Product Description
Share of
items in
Pakistan’s
imports
from China
(percentage)
Pak-
China
unit
values
Pak-
India
unit
values
Unit values
comparison
(greater
unit value)
1. Antibiotics & their derivatives 9 0.071 0.153 India
2. Nucleic acids& their salts 6 0.034 0.053 India
3. Nitrile-function comps. 6 0.007 0.007 India
4. Lysine & its esters; salts thereof 6 0.001 0.003 India
5. Organo-sulphur compounds 4 0.008 0.006 China
6. Heterocyclic comps. 4 0.026 0.036 India
7. Amino-acids, other than those
containing more than one kind of
oxygen function
3 0.008 0.017 India
8. Glutamic acid & its salts 3 0.001 0.006 India
9. Heterocyclic compounds with
oxygen 3
0.016 0.025
India
10. Sulphonamides 2 0.023 0.045 India
11. Medicaments (excluding goods of
healing) 2 0.012 0.016 India
12. Disodium carbonate 2 0.001 0.0009 China
13. Cyclic amides 2 0.008 0.020 India
- Category of pharmaceutical items comprising items in the negative list maintained by
Pakistan for India
Source: Calculations done using data from UN COMTRADE
In 2012, out of the top 13 Pakistan imports of pharmaceutical items from China, unit values of
11 items are lesser than that of India. Moreover, 5 out of the 10 categories, viz., antibiotics and
their derivatives, sulphonamides, medicaments, disodium carbonate and cyclic amides have
items in Pakistan’s negative list for India. Antibiotics and their derivatives and sulphonamides
particularly command shares of 8.9 per cent and 2.2 per cent respectively in Pakistan’s imports
from China. Some major arguments that can be made, looking at the figures in the table, are as
follows: First, Pak-India unit values are greater than Pak-China unit values for the categories
comprising negative list items. Retaining these items in Pakistan’s negative list for India is thus
needless. The very fact that Indian pharmaceuticals are more expensive than their Chinese
22
counterparts would mean that even after removing the items from negative list, Indian items
would have to compete with Chinese items. So, the fear of Indian pharmaceutical items flooding
the Pakistan pharmaceutical industry is misplaced since free competition in the market would
lead to survival of the cheapest and best quality products. The potential gains of increased market
competition are very apparent; lower prices and better quality for consumers, greater discipline
on producers/suppliers to keep their costs down, improvements in technology with positive
effects on production methods and costs and a faster pace of innovation are some of them.
Second, the landed prices of Indian pharmaceutical products would also reflect tariffs payable.
Given the tariff advantage to China (as much as 15 per cent or more in some items), it is possible
that the extension of similar tariff advantages to India could well reduce the landed prices of
Indian goods to the Chinese level or lower. However, a more precise answer would require data
not available at this point. In any case, the argument for maintaining a negative list seems weak
given the open access in these items to China.
An important advantage of opening up trade in pharmaceuticals by eliminating the negative list
would be an increase in consumer surplus. It is also important to note that Pakistan’s imports
from China might be merely replaced by those from India if this happens for common items that
Pakistan imports from India and China. The increased consumer welfare would be a consequence
of increased market competition that would have other spill over benefits in the pharmaceutical
sector. It is worth noting that of the top 15 formulations that are exported from India to Pakistan,
12 figure in India’s major exports of formulations to the world. Given India’s predominant
position in the world market for formulations, there is no doubt that both in terms of quality
(tested in the world market) and price, consumers in Pakistan could benefit enormously by
pruning its negative list for Indian exports.
6. Industry Insights
6.1 View from Pakistan
An interaction with pharmaceutical industry stakeholders in Pakistan revealed that as opposed to
the general view of the Pakistan pharmaceutical sector not willing to open up; there are a few big
players which are proponents of competition and welcome integration with the Indian
pharmaceutical industry. The arguments of the supporters of granting MFN status to India and
hence opening up pharmaceutical trade with India revolve mainly around the following issues:
- Gain to the Pakistan pharmaceutical industry from the research and development
experience of India
- Direct trade as opposed to indirect trade of bulk drugs and intermediaries (raw materials)
that are currently being routed from Dubai to Pakistan
- Larger market access for Pakistan pharmaceutical companies
23
- Possibility of a better drug regulatory framework with greater exposure of the Pakistani
pharmaceutical industry to the Indian market
The R&D profile of Indian pharmaceutical industry includes development of generics, new drug
delivery systems and new drug development (Joseph, 2011). The benefits of this can accrue to
the Pakistan pharmaceutical industry also. Pakistan pharmaceuticals manufacturers are also
looking at getting packaging material from India due to existence of a monopoly in Pakistan.
This direct trade will save costs and improve efficiency. The existence of a weak regulatory
structure (for instance, the herbal medicines division of the Pakistan pharmaceutical sector is
completely unregulated) has also worked to the disadvantage of the pharmaceutical industry in
Pakistan. Liberalising trade will lead to the enhancement of the regulatory framework enabling
producers to compete with Indian suppliers.
Many smaller Pakistan pharmaceutical companies have apprehensions regarding the opening up
of the sector to India. The “fear of competition” and influx of pharmaceutical items from India
are the main reservations of the section of the pharmaceutical industry opposing MFN status to
India. They also need time to prepare and establish themselves to face competition. However, the
Pakistan pharmaceutical sector, due to its “Look East” policy, has been able to compete with the
Indian pharmaceutical items in South-Asian markets such as Vietnam and Philippines. Hence,
providing market access to India with appropriate trigger mechanisms (like imposing quotas, if
necessary) to prevent flooding of Indian pharmaceutical items in the Pakistan pharmaceutical
market will facilitate integration of the sectors in both countries.
As regards Pakistan trade with China, it has flourished in the recent past, mainly due to the
CPFTA. This can be attributed to the fact that Chinese companies can produce generic versions
of branded drugs for lower prices. With reference to China in India-Pakistan trade, the issue of
non-discriminatory access with non-tariff barriers being country-specific comes to the fore.
6.2 View from India
India has substantial comparative advantage over Pakistan in pharmaceuticals (Ahmad, 2013).
Keeping this in view, consultations with Indian exporters held in India were helpful in
corroborating the quantitative exercises undertaken and views from stakeholders in Pakistan.
Interviews with Indian exporters of pharmaceuticals to Pakistan brought to light a few ground
issues that need attention:
- Weak drug regulatory framework in the Pakistan
- Competitive nature of the Pakistan pharmaceutical market – prices of pharmaceuticals
items are quite low
- Logistical issues of banking and visa
- Inclusion of formulations in the negative list as a protectionist measure
24
The regulations for pharmaceutical items are not very stringent in Pakistan and registration for
exports is very easy. In fact, Indian traders are of the opinion that regulations in other partner
countries like Bangladesh are stricter. This had resulted in easy exports of pharmaceutical items
to Pakistan. However, issues related to payments and visas still hamper trade. Banking has to be
carried out through a third party overseas bank, which is costly and time consuming. The Indian
exporters were also concerned with the pricing in the Pakistan pharmaceutical market. They find
the market very competitive and get low prices for their pharmaceutical items. Although most of
the exporters denied any competition from Chinese pharmaceuticals in the pharmaceutical items
exported from India, for a few items, Chinese prices are much lower than Indian drugs. This has
led to the suspension of pharmaceutical trade with Pakistan by a few exporters. Indian exporters
are also unable to export formulations since most of the formulations are in the negative list.
This is attributed to protectionism in Pakistan. Out of the 35 items in Pakistan’s negative list
maintained for India, 14 fall under the category of formulations (Refer Annex 2, Table A2). As
regards competition with China in the Pakistan pharmaceutical market, Indian exporters said that
even though Chinese pharmaceuticals are priced lower, their quality does not match Indian
pharmaceutical items. Even importers from Pakistan prefer the quality and potency of Indian
drugs compared to Chinese imports.
Despite the concerns, Indian traders who have discontinued trade in pharmaceuticals are more
than willing to resume trade provided trade is facilitated via an improvement in banking and
finance. The outlook of stakeholders, both in Pakistan and in India of enhancing trade in
pharmaceuticals is very positive and encouraging.
7. FDI in Pharmaceutical Sector
Traditionally, issues of trade and FDI have generally been discussed separately. Standard trade
theory, in fact, did not throw much light on FDI and the process of integration of the two did not
start until as late as 1980. The link between the two arises because it is now recognised that FDI
and trade can be complements or substitutes. FDI, in fact, is simply another way of doing trade
particularly when the technology component of trade is high (Trefler, 1995; Markusen, 2002,
Pant, 2013). The role of FDI in promoting trade becomes particularly important today when
declining transport costs and tariffs have led to the fragmentation of world production (Krugman,
2008). In general, a firm in one country can interact with the market of another country via
exports (imports), via licensing the sale/production of its commodities (input purchases) in that
country or via locating its own physical production units abroad. It is this last stage that is
normally classified as FDI. While in all cases, the objective is export or import of commodities,
fixed costs are the highest in the case of FDI. The internalisation theory of FDI thus argues that
FDI is generally the last stage for companies engaging in trade (Pant, 1995).
25
In the context of the pharmaceutical industry, it is useful to look at how policy of the two
countries on FDI differs. India had allowed 100 per cent FDI in the pharmaceutical sector
through the automatic approval route in greenfield11
investments and 100 per cent FDI in the
brownfield category, subject to approval from the Foreign Investment Promotion Board (FIPB).
Pakistan allows 100 per cent foreign equity in the manufacturing sector along with 5 per cent
customs duty on plant and machinery and 25 per cent tax relief (Board of Investment, Prime
minister’s office, Govt of Pakistan). Hence, FDI norms in both countries are very liberal and
provide incentives to invest in the pharmaceutical sector.
Yet, there is a vast difference in the nature of foreign involvement in the pharmaceutical industry
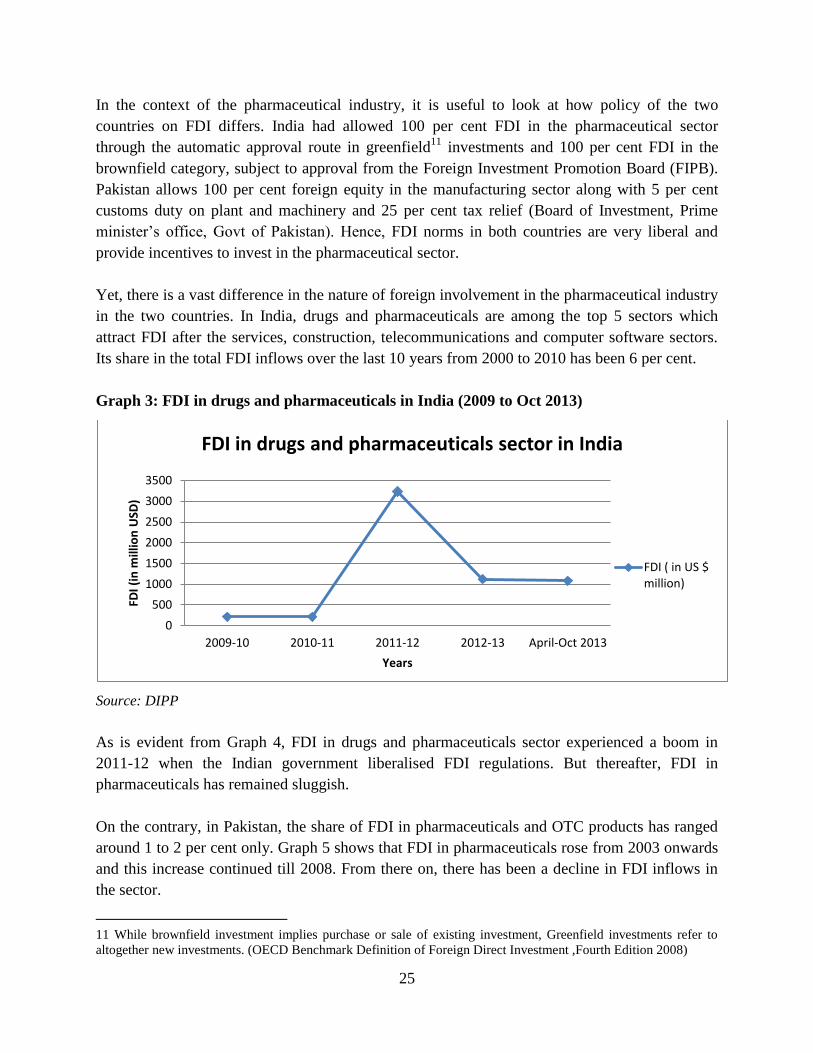
in the two countries. In India, drugs and pharmaceuticals are among the top 5 sectors which
attract FDI after the services, construction, telecommunications and computer software sectors.
Its share in the total FDI inflows over the last 10 years from 2000 to 2010 has been 6 per cent.
Graph 3: FDI in drugs and pharmaceuticals in India (2009 to Oct 2013)
Source: DIPP
As is evident from Graph 4, FDI in drugs and pharmaceuticals sector experienced a boom in
2011-12 when the Indian government liberalised FDI regulations. But thereafter, FDI in
pharmaceuticals has remained sluggish.
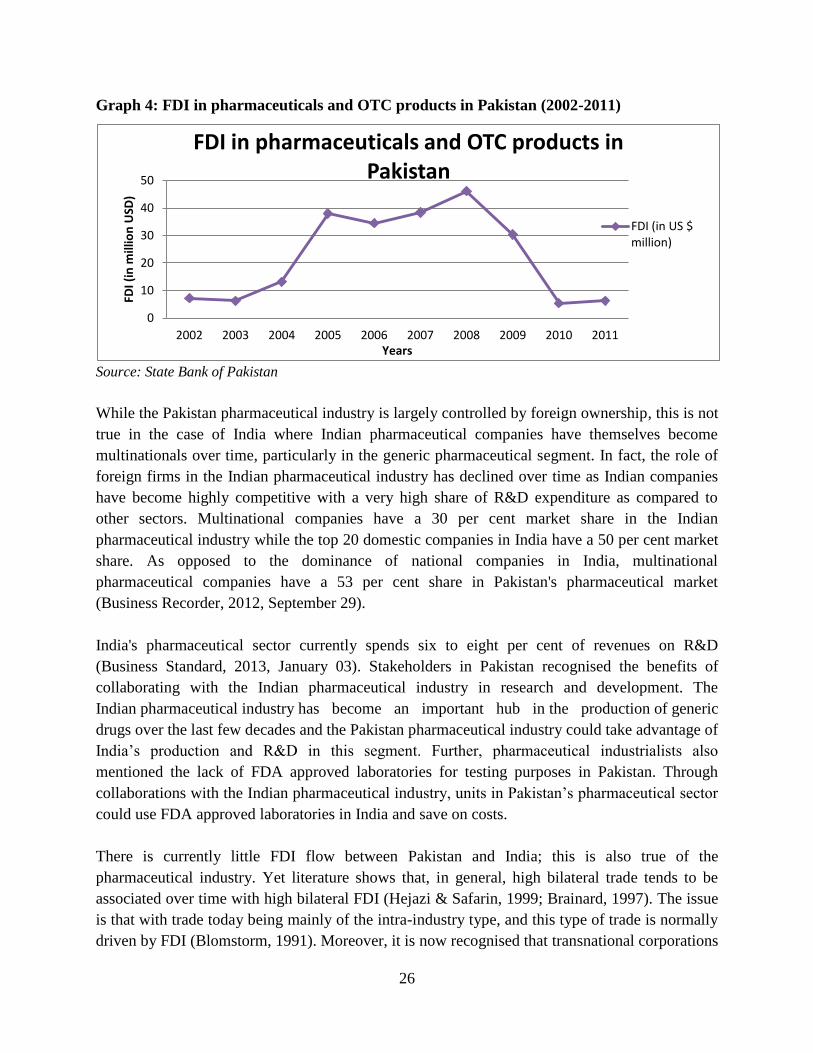
On the contrary, in Pakistan, the share of FDI in pharmaceuticals and OTC products has ranged
around 1 to 2 per cent only. Graph 5 shows that FDI in pharmaceuticals rose from 2003 onwards
and this increase continued till 2008. From there on, there has been a decline in FDI inflows in
the sector.
11 While brownfield investment implies purchase or sale of existing investment, Greenfield investments refer to
altogether new investments. (OECD Benchmark Definition of Foreign Direct Investment ,Fourth Edition 2008)
0
500
1000
1500
2000
2500
3000
3500
2009-10 2010-11 2011-12 2012-13 April-Oct 2013
FDI (
in m
illio
n U
SD)
Years
FDI in drugs and pharmaceuticals sector in India
FDI ( in US $ million)
26
Graph 4: FDI in pharmaceuticals and OTC products in Pakistan (2002-2011)
Source: State Bank of Pakistan
While the Pakistan pharmaceutical industry is largely controlled by foreign ownership, this is not
true in the case of India where Indian pharmaceutical companies have themselves become
multinationals over time, particularly in the generic pharmaceutical segment. In fact, the role of
foreign firms in the Indian pharmaceutical industry has declined over time as Indian companies
have become highly competitive with a very high share of R&D expenditure as compared to
other sectors. Multinational companies have a 30 per cent market share in the Indian
pharmaceutical industry while the top 20 domestic companies in India have a 50 per cent market
share. As opposed to the dominance of national companies in India, multinational
pharmaceutical companies have a 53 per cent share in Pakistan's pharmaceutical market
(Business Recorder, 2012, September 29).
India's pharmaceutical sector currently spends six to eight per cent of revenues on R&D
(Business Standard, 2013, January 03). Stakeholders in Pakistan recognised the benefits of
collaborating with the Indian pharmaceutical industry in research and development. The
Indian pharmaceutical industry has become an important hub in the production of generic
drugs over the last few decades and the Pakistan pharmaceutical industry could take advantage of
India’s production and R&D in this segment. Further, pharmaceutical industrialists also
mentioned the lack of FDA approved laboratories for testing purposes in Pakistan. Through
collaborations with the Indian pharmaceutical industry, units in Pakistan’s pharmaceutical sector
could use FDA approved laboratories in India and save on costs.
There is currently little FDI flow between Pakistan and India; this is also true of the
pharmaceutical industry. Yet literature shows that, in general, high bilateral trade tends to be
associated over time with high bilateral FDI (Hejazi & Safarin, 1999; Brainard, 1997). The issue
is that with trade today being mainly of the intra-industry type, and this type of trade is normally
driven by FDI (Blomstorm, 1991). Moreover, it is now recognised that transnational corporations
0
10
20
30
40
50
2002 2003 2004 2005 2006 2007 2008 2009 2010 2011
FDI (
in m
illio
n U
SD)
Years
FDI in pharmaceuticals and OTC products in Pakistan
FDI (in US $ million)

27
(TNCs) base their decisions on regional rather than country policies towards FDI (Clausing,
2000). Thus, it is argued that in South Asia, it is necessary for countries to harmonise FDI
policies as competition for the same FDI can be harmful, particularly for smaller countries (Das
and Pant, 2006)
Given the current political situation, it is unlikely that high volumes of FDI will flow from India
to Pakistan or vice versa in the immediate future. The possibilities of third country FDI driving
India-Pakistan is worth exploring. Here it is worth noting that most of the RTAs being contracted
today allow for an investment component. This is missing from the SAFTA agreement. The issue
of harmonisation of the FDI policies of India and its neighbours surely deserves a second look,
especially as India has included an investment component in its RTAs with Singapore, South
Korea and Japan.
8. Summary and Policy Recommendations
The pharmaceutical industry is an important component of healthcare system in an economy.
India’s pharmaceutical sector has been pre-dominantly a producer of generic products and has a
large global presence, particularly in the large markets of the developed world. On the other
hand, the Pakistan pharmaceutical sector is still at a developing stage but has been able to gain a
small foothold in the Asia-Pacific region. There are some obvious complementarities here. An
industry sector like pharmaceuticals, with “high social value” and having direct relation to the
health and well-being of consumers, would be an ideal segment to enhance trade and improve
relations between the two countries.
There is substantial trade complementarity and high trade potential of USD 1,635 million in
trade of pharmaceuticals between India and Pakistan. Consultations with stakeholders on both
sides revealed that firms realise the possibility of huge benefits from increased trade and
investment. However, there have been apprehensions among the small players in Pakistan
regarding the influx of pharmaceuticals from India once trade opens up. Since Pakistan imports a
substantial amount of pharmaceuticals from China, the CPFTA is a significant free trade
agreement signed between China and Pakistan in terms of market access. The matching of the
negative list maintained by Pakistan for India and the sensitive lists of both India and Pakistan
under SAFTA with the zero-tariff and preferential lists reveal that Pakistan gives no favourable
treatment to China over India. Out of the top 13 Pakistan imports of pharmaceuticals from China,
unit values of 11 items are lesser than those in which Pakistan trades with India. This points to
the fact that when Pakistan opens its pharmaceutical market to India, competition would
eventually lead to survival of best quality pharmaceutical items in the Pakistan pharmaceutical
market. Consequently, this would have a positive impact on the consumer surplus in the
pharmaceutical sector.
28
Specific to the pharmaceuticals sector, the following policy recommendations are suggested to
propel trade and investment:
1) Removal of pharmaceutical items from the negative list: To give a push to trade in
pharmaceuticals, it is imperative that the negative list maintained by Pakistan for India
should be done away with. Currently, with 35 items at the 6-digit level according to the HS
classification, the negative list contains pharmaceutical items of critical importance such as
penicillin and its derivatives, erythromicin and its derivatives, ingredients for pesticides,
vaccines for veterinary medicine and surgical tapes. Pakistan already trades in these items
with China under the Pakistan-China free trade agreement. Hence, it seems illogical to
continue to maintain a negative list for India in these items. Incorporation of trigger
mechanisms from Pakistan’s side would help combat the apprehensions of smaller
pharmaceutical manufacturers about being flooded with imports from India. In fact,
competition from Indian products can only benefit consumers and this is critical in the health
sector, particularly in developing economies. It may be noted that in this critical sector,
consumer gains should be given greater weightage than temporary production losses.
2) Removal of pharmaceutical raw materials from the sensitive list: Another channel to
enhance trade in pharmaceuticals would be the removal of raw materials from the sensitive
list maintained by Pakistan. The high import duties on raw materials actually reduce the
effective rate of protection12
of final products and this would defeat the purpose of protecting
the Pakistan pharmaceutical industry, if that is the intent. We, therefore, suggest that
protection to final products in Pakistan could be increased by bringing raw materials under a
zero or low duty regime.
3) FDI in pharmaceuticals: Theory recognises that FDI is another way of doing trade, and
traversing this path would certainly give a boost to bilateral trade between India and
Pakistan. However, the internalisation theory of trade establishes that FDI is the last stage of
engagement between countries/companies that trade with each other. So, the prospects of
FDI in pharmaceuticals will come later in the future after trade integration between the two
countries happens. However, some groundwork in harmonising policies towards FDI in this
sector seems necessary.
4) Tapping the traditional medicine segment to enhance trade: Traditional medicine is
another significant area with large potential requiring substantial policy interventions.
Herbal, ayurvedic, Sihdha and Unani medicines are common to both India and Pakistan.
Although the Government of India has realized Good Manufacturing Practices (GMPs) for
the pharmaceutical manufacturing, the need to establish regulatory mechanisms to regulate
12
Effective rate of protection = (Tf - Ti)/ VAint where Tfis the total tariff theoretically or actually paid on the final
product, Ti is the total tariffs paid on importable inputs and VAint is the international value added.

29
herbal medicines is obvious. In India, new rules came into force from June 2000 as an
amendment to the Drugs and Cosmetics Act, 1940. These rules give details regarding
essential infrastructure, personnel and quality control requirements for herbal drug
manufacturing. Implementing GMP requirements is mandatory for the industry. Pakistan also
faces challenges in the traditional medicine system. Challenges such as unknown market
demand, absence of a regulatory environment and framework, i.e., traditional medicines act,
R&D facilities, infrastructure and allocation of appropriate financial resources need to be
worked upon.
5) Potential for trade in bio-pharmaceuticals: Bio-pharmaceuticals, an upcoming field, has a
lot of scope in the pharmaceutical sector. It has been the top R&D investing sector in the
world in recent times. The fact that both India and Pakistan have companies that are engaged
in the manufacture and sale of bio-pharmaceuticals is another reason for the countries to
integrate and collaborate in setting up R&D facilities.
6) Harmonising Regulatory Regimes in pharmaceutical sector: Harmonisation of regulatory
regimes is a prerequisite for smooth and uninterrupted trade. The lack of a standardised
regulatory framework with respect to manufacturing and the lack of FDA approved
laboratories13
in Pakistan have acted as barriers to trade in pharmaceuticals products. A
constitutional amendment in 2010 dissolved the Ministry of Health and shifted the
responsibility to the country’s provincial governments. The Drug Regulatory Authority of
Pakistan (DRAP) was set up only in 2012 to provide for effective co-ordination and
enforcement of The Drugs Act 1976 and to bring harmony in inter-provincial trade in
therapeutic goods.
Pakistan’s counterpart in India, the Central Drugs Standard Control Organisation (CDSCO)
was established under the Drugs and Cosmetics Act, 1940, to regulate the pharmaceutical
sector. The devolution of powers is such that state authorities are responsible for the
manufacture, sale and distribution of drugs while the central authorities are responsible for
approval of new drugs. However, the pricing of drugs is the purview of the central
government’s National Pharmaceutical Pricing Authority (NPPA), which periodically issues
Drug Prices Control Orders (DPCO) that specify maximum retail prices, particularly of bulk
drugs and essential formulations, and hence keep down prices to consumers.
7) Mutual Recognition Agreements: Lastly, if pharmaceutical trade between India and
Pakistan is to expand, it will be necessary to sign mutual recognition agreements (MRAs)
that specify standards to be enforced on the drug industry in both countries. Any fears on
either side of sub-standard drugs flooding the markets can be addressed via these MRAs.
13Stakeholders in Karachi claimed having only 2 FDA approved laboratories for testing in Pakistan – one in
Islamabad and another in Karachi
30
Another issue that is critical in the development of the pharmaceutical sector is research and
development (R&D). The 30 leading Indian pharmaceutical companies spend almost 20 per
cent of their turnover on research and development (Pingle, 2013). Collaborations in research
and development of pharmaceuticals would yield returns for both countries. In fact, Pakistan
can take advantage of India’s world-class R&D facilities through collaborations and joint
ventures.
In the near future, prospects of economic integration seem substantial considering the trade
potential between India and Pakistan. The pharmaceutical sector assumes importance by virtue
of having a direct association with consumers, as regards their health and welfare. The
importance of pharmaceuticals industry also stems from the objective of safeguarding life and
enhancing healthcare. It is regarded as the mainstay of public health in any country (International
Trade Centre, UNCTAD/WTO, 2007). The “Healthcare in India – Vision 2020” document
remarks that ‘Health is best understood as the indispensible basis for defining a person’s sense of
well-being’. The National Drug Policy of Pakistan also states that the government is committed
to the goal of health and is taking all possible measures in the field of health services at large and
drugs in particular. As such, governments all over the world are committed to the goal of health
and well-being of its citizens. Trade in pharmaceuticals can be one of the means to indirectly
resolve healthcare issues and meet related objectives in both countries.
At the production level, the pharmaceutical industries of both India and Pakistan are growing at a
satisfactory rate. Addressing issues that are holding back trade and providing market access are
major steps that need to be taken to integrate the sectors of both countries. Infusing confidence in
manufacturers on both sides to collaborate will help the two countries avail of the obvious trade
complementarities between their pharmaceutical sectors. The prospects of greater trade flows
and investment between India and Pakistan seem bright and the time for this opportune, given
the giant leap that the global pharmaceutical industry has taken.
31
References
Aamir, M. and Zaman, K. (2011). Review of Pakistan Pharmaceutical Industry: SWOT
Analysis. International Journal of Business and Information Technology, p. 114.
Retrieved from http://www.rcci.org.pk/wp-content/uploads/2012/12/SWOT.pdf.
Accessed July 28, 2013.
Ahmad, M. (2013). Trade of Industrial Goods with India: Opportunities and Challenges for
Pakistan. Trade Related Technical Assistance Programme. Retrieved from
http://www.indiapakistantrade.org/pdf/Trade%20of%20Industrial%20Goods%20with%2
0India%20Opportunities%20and%20challenges%20for%20Pakistan.pdf. Accessed May
5, 2014.
Andersen, A. (2003). Empirical Intra-Industry Trade: What We Know and What We Need To
Know. University of British Columbia, Canada. Retrieved from
http://www.sfu.ca/~andresen/papers/Empirical_IIT_Lit_Review.pdf. Accessed August
1,2013.
Asif, M. and Awan, M. (2005). “Pakistani pharmaceutical industry in WTO regime, Issues
and prospects”, Journal of Quality and Technology Management, 01, 21-34.
http://pu.edu.pk/images/publication/PPI_in_WTO_ regime-Issues_and_Prospects.pdf.
Accessed August 10, 2013.
Basant, Rakesh. (2007), “Intellectual Property Rights Regimes: Comparison of Pharma Prices
in India and Pakistan”. Economic and Political Weekly. Retrieved from
http://www.epw.in/system/files/pdf/2007_42/39/Intellectual_Property_Rights_Regimes_
Comparison_of_Pharma_Prices_in_India_and_Pakistan.pdf. Accessed May 5, 2014.
Bhagwati, J.N., Panagriya, A. and Srinivasan, T.N. (1983). Lectures on International Trade,
2nd
edition, MIT Press, Cambridge, Massachusetts, London, England, 1998
Blomstorm, M. (1991). Host Country Benefits of Foreign Investment, National Bureau of
Economic Research. Working Paper 3615
Board of Investment, Government of Pakistan, s.v. "Investor Information Guide."
Brainard, L.S. (1997). An empirical assessment of proximity concentration trade off between
Multinational sales and trade. Working Paper. NBER
Business Recorder (2012, September 29). MNCs have 53 percent share in pharmaceutical
market: National Assembly panel informed. Retrieved from
http://www.brecorder.com/business-a-
economy/189/1243095/?tmpl=component&print=1&layout=default&page=
32
Business Standard (2013, January 03). Dr Reddy’s CEO for double-digit spending on R&D.
Retrieved from http://www.business-standard.com/article/economy-policy/dr-reddy-s-
chairman-for-double-digit-spending-on-r-d-114010300902_1.html.
Business Standard (2013, July 11). Pharma industry to grow by 10-12 percent in FY14: ICRA
Retrieved from http://www.business-standard.com/article/companies/pharma-industry-to-
grow-by-10-12-in-fy14-icra-113070700213_1.html.
Clausing, K (2000). Does MNC activity displace trade? Economic enquiry, pp.190-205
Das, S. K. and Pant, M. (2006). “Incentives for Attracting FDI in South Asia: A Survey”
International Studies, V. 43, no.1, Jan-Mar, 2006.
Greenaway, D. and Tharakan, P.K.M. Imperfect Competition and International Trade: The
policy Aspects of Intra industry Trade, Wheatsheaf Books, Humanities Press, New
Jersey, NY, USA
Hejazi, W and Safarian, E (1999). Modelling Links Between Trade and FDI, industry Canada.
Perspectives on North American Free Trade series.
John, Wilson and Bhatnagar, Aryaman.(2013). Nawaz Sharif and India. ORF Issue Brief,
July, 2013. Observer Research Foundation. Retrieved from
http://orfonline.org/cms/export/orfonline/modules/issuebrief/attachments/Issuebrief55_13
74051510115.pdf. Accessed April 5, 2014
Joseph, R. K. The R&D Scenario in Indian Pharmaceutical Industry. working paper., Research
and Information System for Developing Countries, 2011. Retrieved from
http://www.ris.org.in/images/RIS_images/pdf/dp176_pap.pdf. Accessed November 12,
2013.
Kallummal, M., and Bugalya, K. (2013). Trends in India’s Trade in Pharmaceutical Sector:
Some Insights. Working paper. Centre for WTO Studies (CWS) Indian Institute of
Foreign Trade, New Delhi , 2012. Retrieved from
http://wtocentre.iift.ac.in/workingpaper/Working Paper2.pdf. Accessed August 10, 2013.
Koçyiğit, A., and Şen A. (2013). ”The Extent of Intra-Industry Trade between Turkey and the
European Union: The Impact of Customs Union” .manuscript., Journal of Economic and
Social Research 9(2), 61-84. Retrieved from http://www.fatih.edu.tr/~jesr/jesr.
kocyigit.sen.pdf. Accessed August 20, 2013.
KPMG. (2013). China's pharmaceutical industry – Poised for the giant leap. Retrieved from
http://www.swissnexchina.org/foryou/kpmg-china-pharmaceutical-201106.pdf. Accessed
July 2, 2013.
Krugman, P. (2008). Trade and Wages Reconsidered. Brookings paper on Economic Activity,
Spring: 103-137.

33
Linton, K. C. and Corrado, N. (2007). A “Calibrated Approach”: Pharmaceutical FDI and the
Evolution of Indian Patent Law. United States International Trade Commission, Journal
of International Commerce and Economics. August 2007. Retrieved from
http://www.usitc.gov/publications/332/journals/pharm_fdi_indian_patent_law.pdf
Accessed April 1, 2014.
Markusen, J. (2002), Multinational Firms and the Theory of International Trade, NBER, MIT
Press.
Mazumdar, M. (2013). Chapter 2: An Overview of the Indian Pharmaceutical Sector.
Performance of Pharmaceutical Companies in India: A Critical Analysis of Industrial
Structure, Firm Specific Resources and Emerging Strategies. Springer, 2013.
N. Lalitha (2002), “TRIPS and Pharmaceutical Industry: Issues of Strategic Importance”.
Journal of Review of Development and Change, Vol. VII, No.1, January-June.
Organisation of Pharmaceutical Producers of India. (2012). 46th Annual Report 2011-12.
Retrieved from http://www.indiaoppi.com/memrfildat/publications834845dre/Annual
Report 46th AGM 2011-12_1.pdf.
Pant, M. (1995). FDI in India: The Issues Involved. New Delhi: Lancer Books, 1995.
Pant M. (2013). India and the BRIC’s countries: Issues of Trade and Technology. In Prof. Sajal
Mathur and Meghna Dasgupta (eds.) BRICS Trade Policies, Institutions and Areas of
deepening Cooperation. Centre for WTO Studies. Pg 163-191. Retrieved from
http://wtocentre.iift.ac.in/FA/Brics.pdf. Accessed December 10, 2013
Pingle, S. (2013). Indian Pharma Majors step up R&D spend by 19.7% in 2012-13.
Pharmabiz.com Retrieved from
http://www.pharmabiz.com/NewsDetails.aspx?aid=78023&sid=1. Accessed November
10, 2013.
Sahu, S. K. Globalization and the Indian Pharmaceutical Industry. Retrieved from
http://paperroom.ipsa.org/papers/paper_196.pdf. Accessed April 1, 2014
Sawhney, A. and Kumar, R. (2007). Why SAFTA? Paper submitted to Commonwealth
Secretariat, London.
Taneja, N (2013). Enhancing India-Pakistan Trade, New America Foundation. Retrieved from
http://security.newamerica.net/sites/newamerica.net/files/policydocs/Taneja_IndiaPakTra
de_NAF_0.pdf. Accessed August 20, 2013
Taneja, N., Mishita, M., Prithvijit, M., Samridhi, B. and Dayal, I. (2013). Normalising India
Pakistan Trade. working paper., ICRIER, 2013.
http://icrier.org/pdf/working_paper_267.pdf.
34
Trefler, D (1995), “The Case of Missing Trade”, American Economic Review, 85(5), pp. 1029-
46.
UK Trade and Investment, Biotechnology and Pharmaceutical Opportunities in India.
Retrieved from
http://www.clustercollaboration.eu/documents/10147/101938/Biotechnology and
Pharmaceutical Opportunities in India.pdf. Accessed January 28, 2014.
United Nations and World Trade Organisation. (2012). A Practical Guide to Trade Policy
Analysis. Retrieved from
http://www.wto.org/english/res_e/publications_e/wto_unctad12_e.pdf. Accessed July 25,
2013.
Viner, J. (1978). The Customs Union Issue, Carnegie Endowment for International Peace, Ch.
4, NY, USA, 1950; Chacoliades, M. , International Trade: Theory and Policy, Ch. 21,
McGraw Hill, 1978
World Health Organization, Geneva (1997). WHO Drug Information, Volume 11, Number 4,
1997
World Trade Organisation (2013). Principles of the trading system,
http://www.wto.org/english/thewto_e/whatis_e/tif_e/fact2_e.htm Accessed September 10
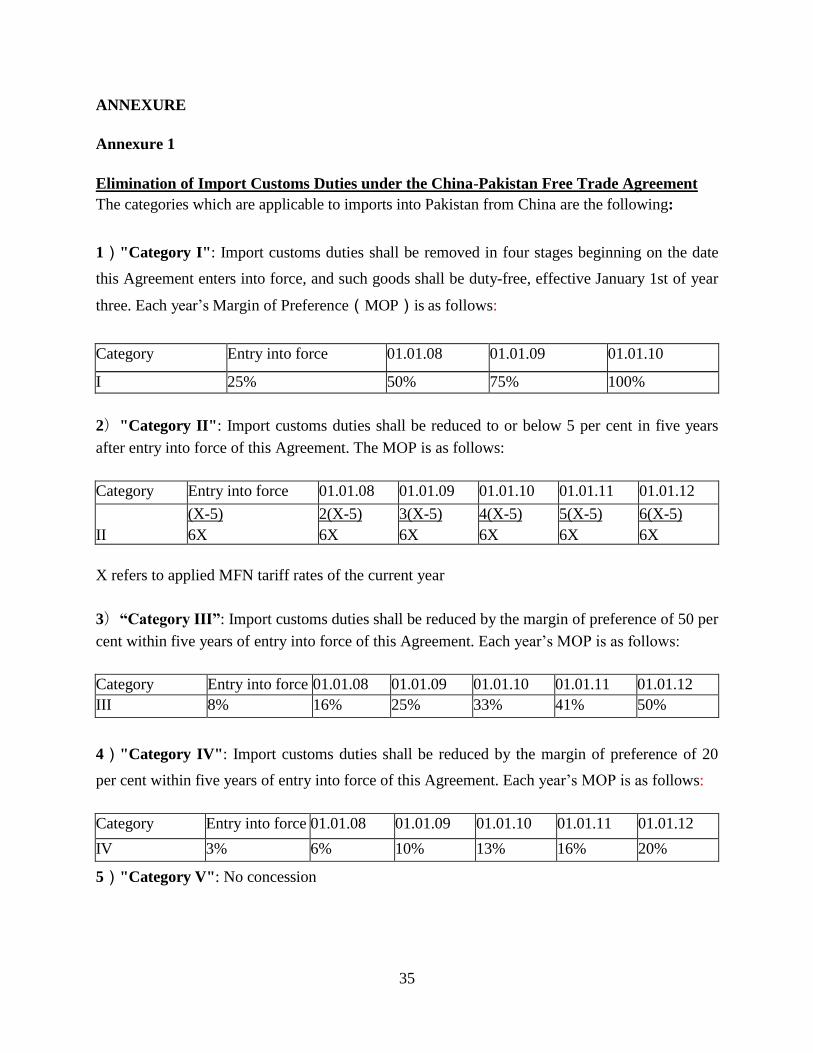
35
ANNEXURE
Annexure 1
Elimination of Import Customs Duties under the China-Pakistan Free Trade Agreement
The categories which are applicable to imports into Pakistan from China are the following:
1)"Category I": Import customs duties shall be removed in four stages beginning on the date
this Agreement enters into force, and such goods shall be duty-free, effective January 1st of year
three. Each year’s Margin of Preference(MOP)is as follows:
Category Entry into force 01.01.08 01.01.09 01.01.10
I 25% 50% 75% 100%
2)"Category II": Import customs duties shall be reduced to or below 5 per cent in five years
after entry into force of this Agreement. The MOP is as follows:
Category Entry into force 01.01.08 01.01.09 01.01.10 01.01.11 01.01.12
II
(X-5)
6X
2(X-5)
6X
3(X-5)
6X
4(X-5)
6X
5(X-5)
6X
6(X-5)
6X
X refers to applied MFN tariff rates of the current year
3)“Category III”: Import customs duties shall be reduced by the margin of preference of 50 per
cent within five years of entry into force of this Agreement. Each year’s MOP is as follows:
Category Entry into force 01.01.08 01.01.09 01.01.10 01.01.11 01.01.12
III 8% 16% 25% 33% 41% 50%
4)"Category IV": Import customs duties shall be reduced by the margin of preference of 20
per cent within five years of entry into force of this Agreement. Each year’s MOP is as follows:
Category Entry into force 01.01.08 01.01.09 01.01.10 01.01.11 01.01.12
IV 3% 6% 10% 13% 16% 20%
5)"Category V": No concession
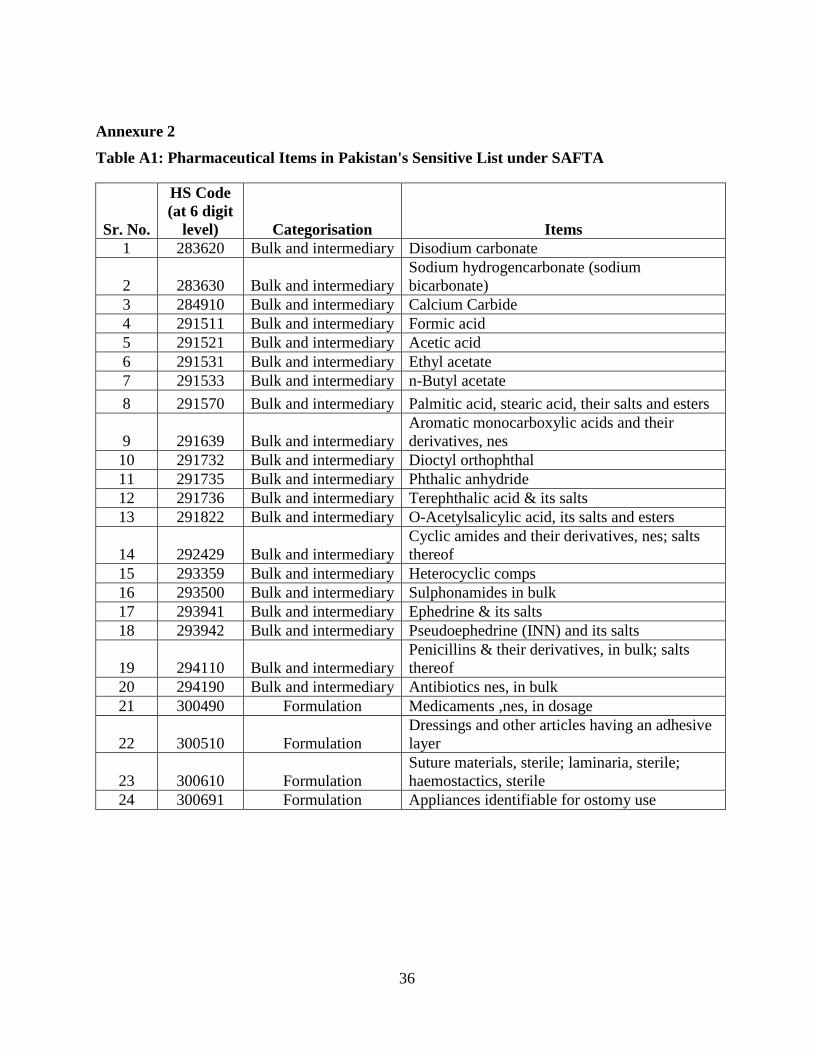
36
Annexure 2
Table A1: Pharmaceutical Items in Pakistan's Sensitive List under SAFTA
Sr. No.
HS Code
(at 6 digit
level) Categorisation Items
1 283620 Bulk and intermediary Disodium carbonate
2 283630 Bulk and intermediary
Sodium hydrogencarbonate (sodium
bicarbonate)
3 284910 Bulk and intermediary Calcium Carbide
4 291511 Bulk and intermediary Formic acid
5 291521 Bulk and intermediary Acetic acid
6 291531 Bulk and intermediary Ethyl acetate
7 291533 Bulk and intermediary n-Butyl acetate
8 291570 Bulk and intermediary Palmitic acid, stearic acid, their salts and esters
9 291639 Bulk and intermediary
Aromatic monocarboxylic acids and their
derivatives, nes
10 291732 Bulk and intermediary Dioctyl orthophthal
11 291735 Bulk and intermediary Phthalic anhydride
12 291736 Bulk and intermediary Terephthalic acid & its salts
13 291822 Bulk and intermediary O-Acetylsalicylic acid, its salts and esters
14 292429 Bulk and intermediary
Cyclic amides and their derivatives, nes; salts
thereof
15 293359 Bulk and intermediary Heterocyclic comps
16 293500 Bulk and intermediary Sulphonamides in bulk
17 293941 Bulk and intermediary Ephedrine & its salts
18 293942 Bulk and intermediary Pseudoephedrine (INN) and its salts
19 294110 Bulk and intermediary
Penicillins & their derivatives, in bulk; salts
thereof
20 294190 Bulk and intermediary Antibiotics nes, in bulk
21 300490 Formulation Medicaments ,nes, in dosage
22 300510 Formulation
Dressings and other articles having an adhesive
layer
23 300610 Formulation
Suture materials, sterile; laminaria, sterile;
haemostactics, sterile
24 300691 Formulation Appliances identifiable for ostomy use
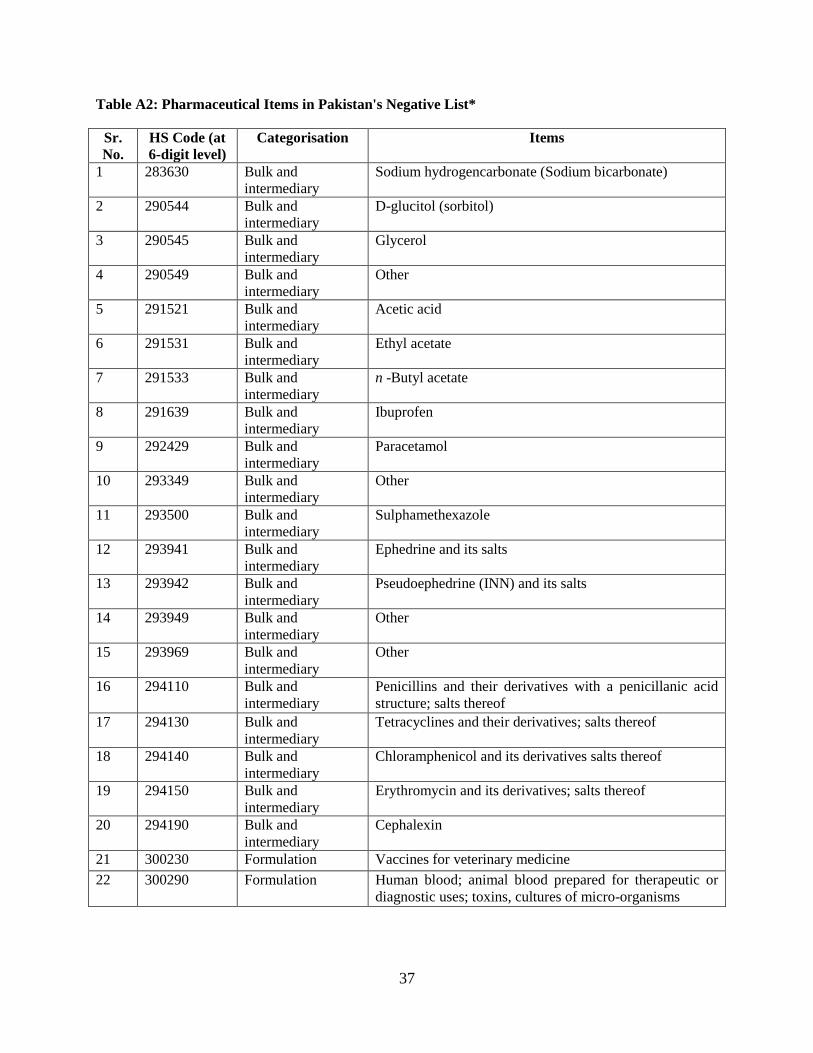
37
Table A2: Pharmaceutical Items in Pakistan's Negative List*
Sr.
No.
HS Code (at
6-digit level)
Categorisation Items
1 283630 Bulk and
intermediary
Sodium hydrogencarbonate (Sodium bicarbonate)
2 290544 Bulk and
intermediary
D-glucitol (sorbitol)
3 290545 Bulk and
intermediary
Glycerol
4 290549 Bulk and
intermediary
Other
5 291521 Bulk and
intermediary
Acetic acid
6 291531 Bulk and
intermediary
Ethyl acetate
7 291533 Bulk and
intermediary
n -Butyl acetate
8 291639 Bulk and
intermediary
Ibuprofen
9 292429 Bulk and
intermediary
Paracetamol
10 293349 Bulk and
intermediary
Other
11 293500 Bulk and
intermediary
Sulphamethexazole
12 293941 Bulk and
intermediary
Ephedrine and its salts
13 293942 Bulk and
intermediary
Pseudoephedrine (INN) and its salts
14 293949 Bulk and
intermediary
Other
15 293969 Bulk and
intermediary
Other
16 294110 Bulk and
intermediary
Penicillins and their derivatives with a penicillanic acid
structure; salts thereof
17 294130 Bulk and
intermediary
Tetracyclines and their derivatives; salts thereof
18 294140 Bulk and
intermediary
Chloramphenicol and its derivatives salts thereof
19 294150 Bulk and
intermediary
Erythromycin and its derivatives; salts thereof
20 294190 Bulk and
intermediary
Cephalexin
21 300230 Formulation Vaccines for veterinary medicine
22 300290 Formulation Human blood; animal blood prepared for therapeutic or
diagnostic uses; toxins, cultures of micro-organisms
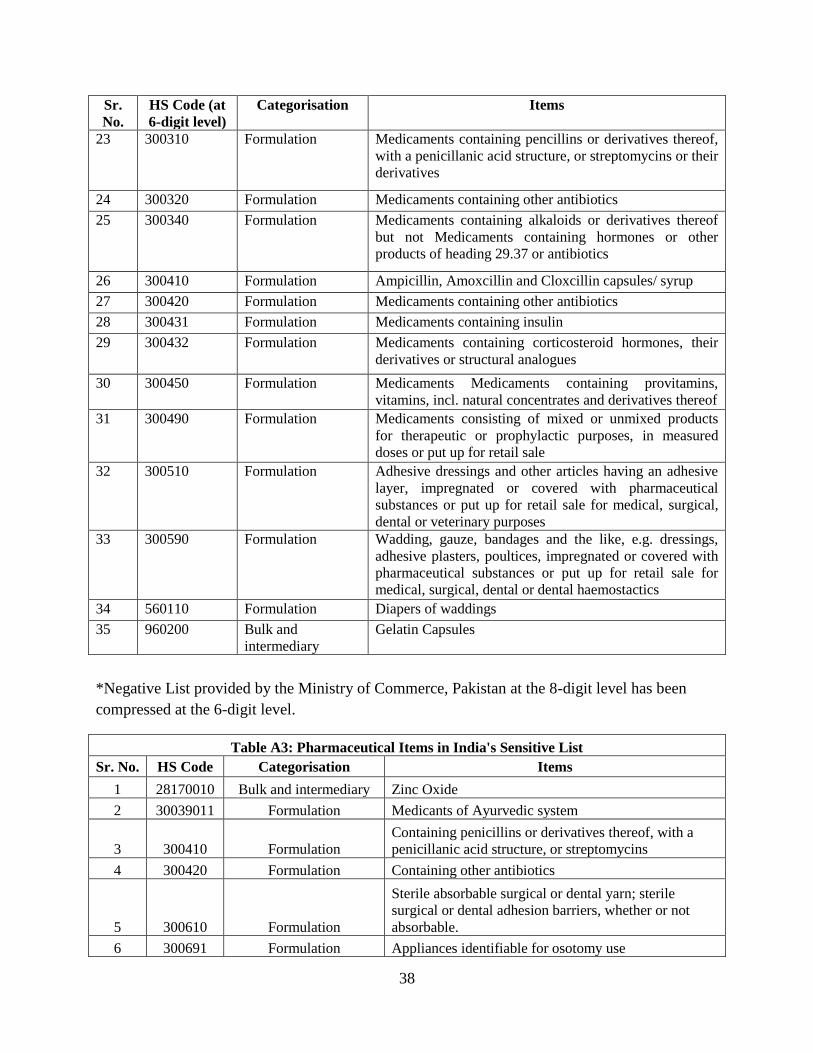
38
Sr.
No.
HS Code (at
6-digit level)
Categorisation Items
23 300310 Formulation Medicaments containing pencillins or derivatives thereof,
with a penicillanic acid structure, or streptomycins or their
derivatives
24 300320 Formulation Medicaments containing other antibiotics
25 300340 Formulation Medicaments containing alkaloids or derivatives thereof
but not Medicaments containing hormones or other
products of heading 29.37 or antibiotics
26 300410 Formulation Ampicillin, Amoxcillin and Cloxcillin capsules/ syrup
27 300420 Formulation Medicaments containing other antibiotics
28 300431 Formulation Medicaments containing insulin
29 300432 Formulation Medicaments containing corticosteroid hormones, their
derivatives or structural analogues
30 300450 Formulation Medicaments Medicaments containing provitamins,
vitamins, incl. natural concentrates and derivatives thereof
31 300490 Formulation Medicaments consisting of mixed or unmixed products
for therapeutic or prophylactic purposes, in measured
doses or put up for retail sale
32 300510 Formulation Adhesive dressings and other articles having an adhesive
layer, impregnated or covered with pharmaceutical
substances or put up for retail sale for medical, surgical,
dental or veterinary purposes
33 300590 Formulation Wadding, gauze, bandages and the like, e.g. dressings,
adhesive plasters, poultices, impregnated or covered with
pharmaceutical substances or put up for retail sale for
medical, surgical, dental or dental haemostactics
34 560110 Formulation Diapers of waddings
35 960200 Bulk and
intermediary
Gelatin Capsules
*Negative List provided by the Ministry of Commerce, Pakistan at the 8-digit level has been
compressed at the 6-digit level.
Table A3: Pharmaceutical Items in India's Sensitive List
Sr. No. HS Code Categorisation Items
1 28170010 Bulk and intermediary Zinc Oxide
2 30039011 Formulation Medicants of Ayurvedic system
3 300410 Formulation
Containing penicillins or derivatives thereof, with a
penicillanic acid structure, or streptomycins
4 300420 Formulation Containing other antibiotics
5 300610 Formulation
Sterile absorbable surgical or dental yarn; sterile
surgical or dental adhesion barriers, whether or not
absorbable.
6 300691 Formulation Appliances identifiable for osotomy use
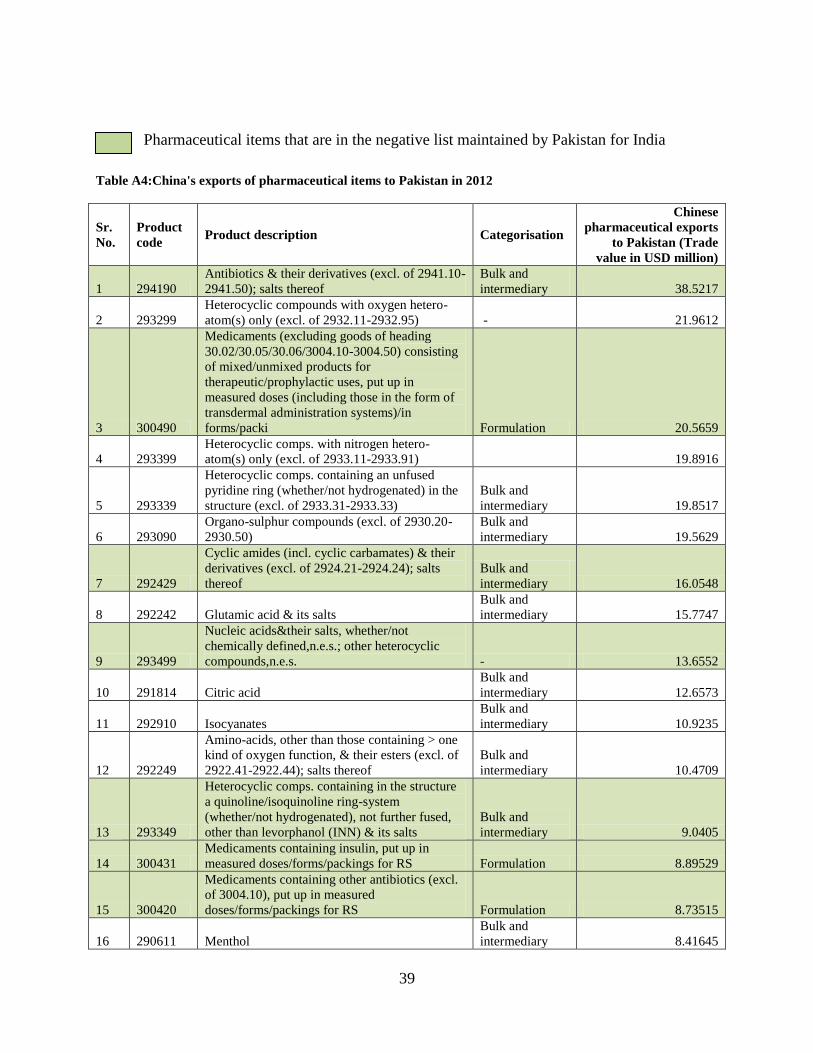
39
- Pharmaceutical items that are in the negative list maintained by Pakistan for India
Table A4:China's exports of pharmaceutical items to Pakistan in 2012
Sr.
No.
Product
code Product description Categorisation
Chinese
pharmaceutical exports
to Pakistan (Trade
value in USD million)
1 294190
Antibiotics & their derivatives (excl. of 2941.10-
2941.50); salts thereof
Bulk and
intermediary 38.5217
2 293299
Heterocyclic compounds with oxygen hetero-
atom(s) only (excl. of 2932.11-2932.95) - 21.9612
3 300490
Medicaments (excluding goods of heading
30.02/30.05/30.06/3004.10-3004.50) consisting
of mixed/unmixed products for
therapeutic/prophylactic uses, put up in
measured doses (including those in the form of
transdermal administration systems)/in
forms/packi Formulation 20.5659
4 293399
Heterocyclic comps. with nitrogen hetero-
atom(s) only (excl. of 2933.11-2933.91)
19.8916
5 293339
Heterocyclic comps. containing an unfused
pyridine ring (whether/not hydrogenated) in the
structure (excl. of 2933.31-2933.33)
Bulk and
intermediary 19.8517
6 293090
Organo-sulphur compounds (excl. of 2930.20-
2930.50)
Bulk and
intermediary 19.5629
7 292429
Cyclic amides (incl. cyclic carbamates) & their
derivatives (excl. of 2924.21-2924.24); salts
thereof
Bulk and
intermediary 16.0548
8 292242 Glutamic acid & its salts
Bulk and
intermediary 15.7747
9 293499
Nucleic acids&their salts, whether/not
chemically defined,n.e.s.; other heterocyclic
compounds,n.e.s. - 13.6552
10 291814 Citric acid
Bulk and
intermediary 12.6573
11 292910 Isocyanates
Bulk and
intermediary 10.9235
12 292249
Amino-acids, other than those containing > one
kind of oxygen function, & their esters (excl. of
2922.41-2922.44); salts thereof
Bulk and
intermediary 10.4709
13 293349
Heterocyclic comps. containing in the structure
a quinoline/isoquinoline ring-system
(whether/not hydrogenated), not further fused,
other than levorphanol (INN) & its salts
Bulk and
intermediary 9.0405
14 300431
Medicaments containing insulin, put up in
measured doses/forms/packings for RS Formulation 8.89529
15 300420
Medicaments containing other antibiotics (excl.
of 3004.10), put up in measured
doses/forms/packings for RS Formulation 8.73515
16 290611 Menthol
Bulk and
intermediary 8.41645

40
Sr.
No.
Product
code Product description Categorisation
Chinese
pharmaceutical exports
to Pakistan (Trade
value in USD million)
17 292250
Amino-alcohol-phenols, amino-acid-phenols &
other amino-comps. with oxygen function
Bulk and
intermediary 8.28442
18 291620
Cyclanic/cyclenic/cycloterpenic monocarboxylic
acids, their anhydrides, halides, peroxides,
peroxyacids & their derivatives
Bulk and
intermediary 8.16303
19 290349
Halogenated derivatives of acyclic hydrocarbons
containing 2/more different halogens (excl. of
2903.41-2903.47) - 7.38842
20 300210
Antisera & other blood fractions & modified
immunological products, whether/not obt. by
means of biotechnological processes Formulation 6.76002
21 290339
Fluorinated/brominated/iodinated derivatives of
acyclic hydrocarbons (excl. of 2903.31) - 6.74451
22 294130 Tetracyclines & their derivatives; salts thereof
Bulk and
intermediary 6.33184
23 293500 Sulphonamides
Bulk and
intermediary 6.02983
24 293329
Heterocyclic comps. containing an unfused
imidazole ring (whether/not hydrogenated) in
the structure, other than hydantoin & its
derivatives
Bulk and
intermediary 5.99395
25 293020 Thiocarbamates & dithiocarbamates
Bulk and
intermediary 5.68032
26 294110
Penicillins & their derivatives with a penicillanic
acid structure; salts thereof
Bulk and
intermediary 5.65925
27 294150 Erythromycin & its derivatives; salts thereof
Bulk and
intermediary 4.7482
28 291539 Esters of acetic acid (excl. of 2915.31-2915.36)
Bulk and
intermediary 4.65472
29 292229
Amino-naphthols&other amino-phenols, other
than those containing more than one kind of
oxygen function(excl. of 2922.21), their
ethers&esters; salts thereof
Bulk and
intermediary 4.453
30 292241 Lysine & its esters; salts thereof
Bulk and
intermediary 4.43298
31 292690
Nitrile-function comps. (excl. of 2926.10-
2923.30) - 4.26749
32 293361 Melamine
Bulk and
intermediary 4.13179
33 292990
Compounds with other nitrogen function, other
than isocyanates - 4.12432
34 293627 Vitamin C & its derivatives - 4.11594
35 300410
Medicaments containing penicillins/derivatives
thereof with a penicillanic acid
structure/streptomycins/their derivatives, put up
in measured doses/forms/packings for RS Formulation 3.9834
36 291614 Esters of methacrylic acid
Bulk and
intermediary 3.89433
37 293359
Heterocyclic comps. containing a pyrimidine
ring (whether/not hydrogenated)/piperazine ring
in the structure (excl. of 2933.52-2933.55)
Bulk and
intermediary 3.8848
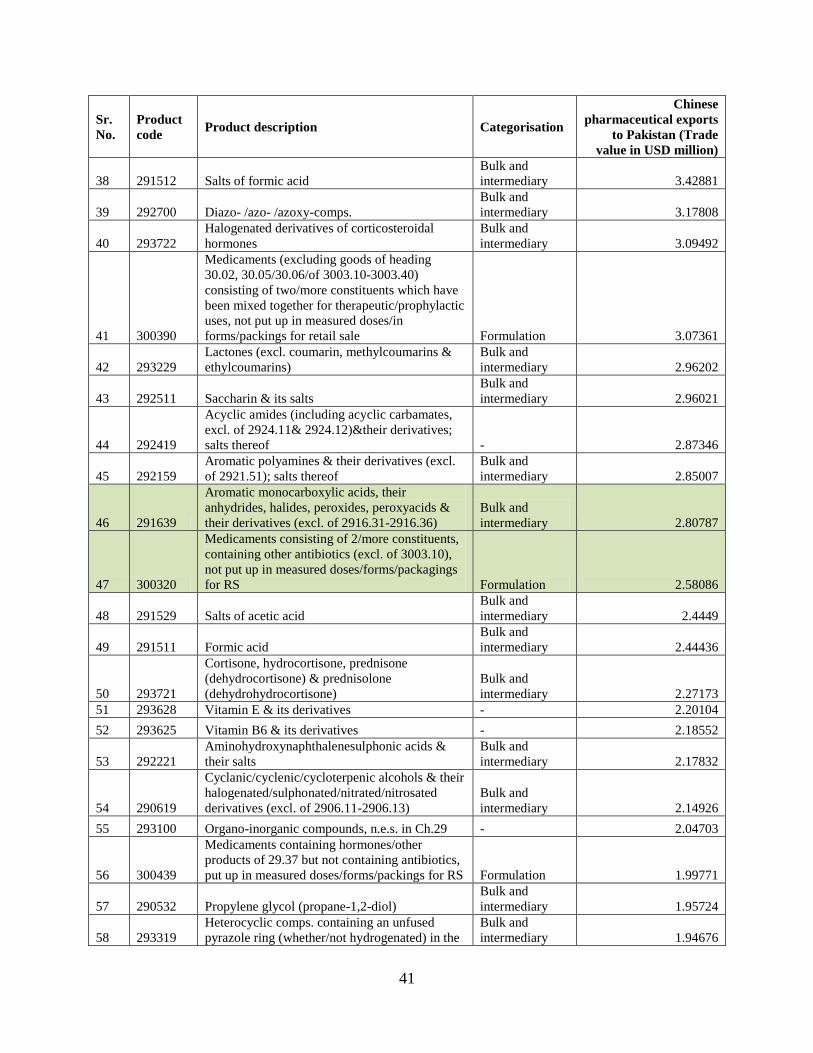
41
Sr.
No.
Product
code Product description Categorisation
Chinese
pharmaceutical exports
to Pakistan (Trade
value in USD million)
38 291512 Salts of formic acid
Bulk and
intermediary 3.42881
39 292700 Diazo- /azo- /azoxy-comps.
Bulk and
intermediary 3.17808
40 293722
Halogenated derivatives of corticosteroidal
hormones
Bulk and
intermediary 3.09492
41 300390
Medicaments (excluding goods of heading
30.02, 30.05/30.06/of 3003.10-3003.40)
consisting of two/more constituents which have
been mixed together for therapeutic/prophylactic
uses, not put up in measured doses/in
forms/packings for retail sale Formulation 3.07361
42 293229
Lactones (excl. coumarin, methylcoumarins &
ethylcoumarins)
Bulk and
intermediary 2.96202
43 292511 Saccharin & its salts
Bulk and
intermediary 2.96021
44 292419
Acyclic amides (including acyclic carbamates,
excl. of 2924.11& 2924.12)&their derivatives;
salts thereof - 2.87346
45 292159
Aromatic polyamines & their derivatives (excl.
of 2921.51); salts thereof
Bulk and
intermediary 2.85007
46 291639
Aromatic monocarboxylic acids, their
anhydrides, halides, peroxides, peroxyacids &
their derivatives (excl. of 2916.31-2916.36)
Bulk and
intermediary 2.80787
47 300320
Medicaments consisting of 2/more constituents,
containing other antibiotics (excl. of 3003.10),
not put up in measured doses/forms/packagings
for RS Formulation 2.58086
48 291529 Salts of acetic acid
Bulk and
intermediary 2.4449
49 291511 Formic acid
Bulk and
intermediary 2.44436
50 293721
Cortisone, hydrocortisone, prednisone
(dehydrocortisone) & prednisolone
(dehydrohydrocortisone)
Bulk and
intermediary 2.27173
51 293628 Vitamin E & its derivatives - 2.20104
52 293625 Vitamin B6 & its derivatives - 2.18552
53 292221
Aminohydroxynaphthalenesulphonic acids &
their salts
Bulk and
intermediary 2.17832
54 290619
Cyclanic/cyclenic/cycloterpenic alcohols & their
halogenated/sulphonated/nitrated/nitrosated
derivatives (excl. of 2906.11-2906.13)
Bulk and
intermediary 2.14926
55 293100 Organo-inorganic compounds, n.e.s. in Ch.29 - 2.04703
56 300439
Medicaments containing hormones/other
products of 29.37 but not containing antibiotics,
put up in measured doses/forms/packings for RS Formulation 1.99771
57 290532 Propylene glycol (propane-1,2-diol)
Bulk and
intermediary 1.95724
58 293319
Heterocyclic comps. containing an unfused
pyrazole ring (whether/not hydrogenated) in the
Bulk and
intermediary 1.94676
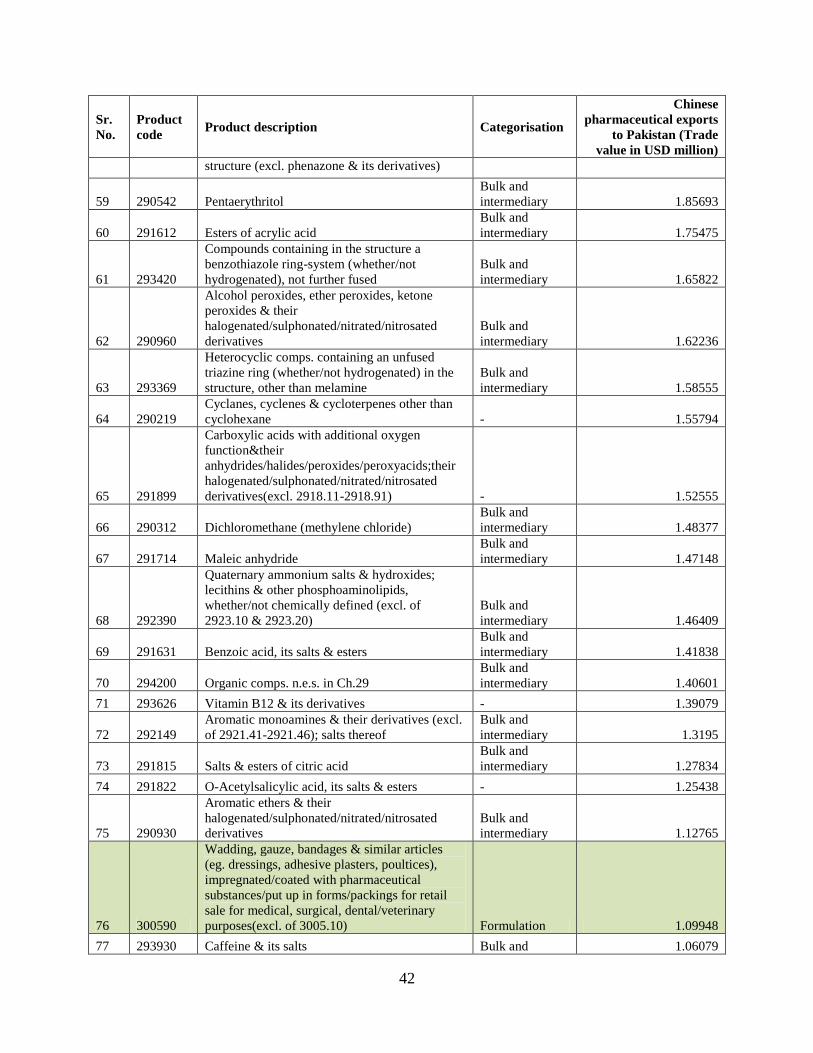
42
Sr.
No.
Product
code Product description Categorisation
Chinese
pharmaceutical exports
to Pakistan (Trade
value in USD million)
structure (excl. phenazone & its derivatives)
59 290542 Pentaerythritol
Bulk and
intermediary 1.85693
60 291612 Esters of acrylic acid
Bulk and
intermediary 1.75475
61 293420
Compounds containing in the structure a
benzothiazole ring-system (whether/not
hydrogenated), not further fused
Bulk and
intermediary 1.65822
62 290960
Alcohol peroxides, ether peroxides, ketone
peroxides & their
halogenated/sulphonated/nitrated/nitrosated
derivatives
Bulk and
intermediary 1.62236
63 293369
Heterocyclic comps. containing an unfused
triazine ring (whether/not hydrogenated) in the
structure, other than melamine
Bulk and
intermediary 1.58555
64 290219
Cyclanes, cyclenes & cycloterpenes other than
cyclohexane - 1.55794
65 291899
Carboxylic acids with additional oxygen
function&their
anhydrides/halides/peroxides/peroxyacids;their
halogenated/sulphonated/nitrated/nitrosated
derivatives(excl. 2918.11-2918.91) - 1.52555
66 290312 Dichloromethane (methylene chloride)
Bulk and
intermediary 1.48377
67 291714 Maleic anhydride
Bulk and
intermediary 1.47148
68 292390
Quaternary ammonium salts & hydroxides;
lecithins & other phosphoaminolipids,
whether/not chemically defined (excl. of
2923.10 & 2923.20)
Bulk and
intermediary 1.46409
69 291631 Benzoic acid, its salts & esters
Bulk and
intermediary 1.41838
70 294200 Organic comps. n.e.s. in Ch.29
Bulk and
intermediary 1.40601
71 293626 Vitamin B12 & its derivatives - 1.39079
72 292149
Aromatic monoamines & their derivatives (excl.
of 2921.41-2921.46); salts thereof
Bulk and
intermediary 1.3195
73 291815 Salts & esters of citric acid
Bulk and
intermediary 1.27834
74 291822 O-Acetylsalicylic acid, its salts & esters - 1.25438
75 290930
Aromatic ethers & their
halogenated/sulphonated/nitrated/nitrosated
derivatives
Bulk and
intermediary 1.12765
76 300590
Wadding, gauze, bandages & similar articles
(eg. dressings, adhesive plasters, poultices),
impregnated/coated with pharmaceutical
substances/put up in forms/packings for retail
sale for medical, surgical, dental/veterinary
purposes(excl. of 3005.10) Formulation 1.09948
77 293930 Caffeine & its salts Bulk and 1.06079
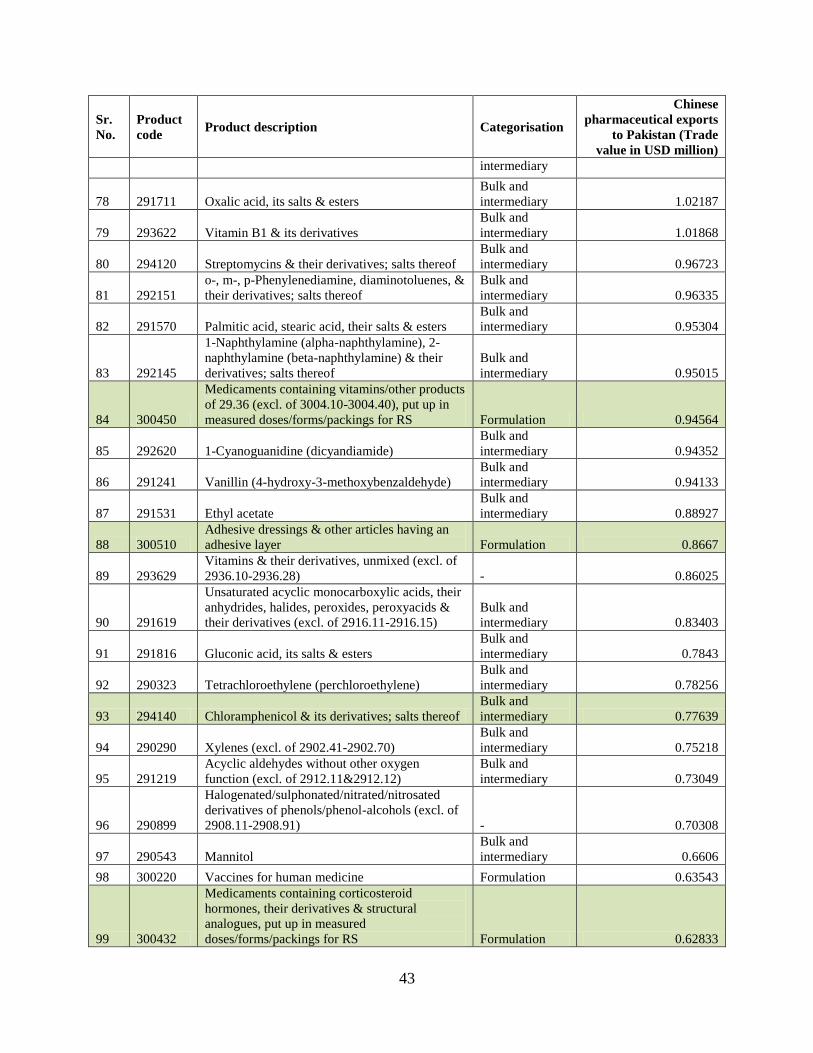
43
Sr.
No.
Product
code Product description Categorisation
Chinese
pharmaceutical exports
to Pakistan (Trade
value in USD million)
intermediary
78 291711 Oxalic acid, its salts & esters
Bulk and
intermediary 1.02187
79 293622 Vitamin B1 & its derivatives
Bulk and
intermediary 1.01868
80 294120 Streptomycins & their derivatives; salts thereof
Bulk and
intermediary 0.96723
81 292151
o-, m-, p-Phenylenediamine, diaminotoluenes, &
their derivatives; salts thereof
Bulk and
intermediary 0.96335
82 291570 Palmitic acid, stearic acid, their salts & esters
Bulk and
intermediary 0.95304
83 292145
1-Naphthylamine (alpha-naphthylamine), 2-
naphthylamine (beta-naphthylamine) & their
derivatives; salts thereof
Bulk and
intermediary 0.95015
84 300450
Medicaments containing vitamins/other products
of 29.36 (excl. of 3004.10-3004.40), put up in
measured doses/forms/packings for RS Formulation 0.94564
85 292620 1-Cyanoguanidine (dicyandiamide)
Bulk and
intermediary 0.94352
86 291241 Vanillin (4-hydroxy-3-methoxybenzaldehyde)
Bulk and
intermediary 0.94133
87 291531 Ethyl acetate
Bulk and
intermediary 0.88927
88 300510
Adhesive dressings & other articles having an
adhesive layer Formulation 0.8667
89 293629
Vitamins & their derivatives, unmixed (excl. of
2936.10-2936.28) - 0.86025
90 291619
Unsaturated acyclic monocarboxylic acids, their
anhydrides, halides, peroxides, peroxyacids &
their derivatives (excl. of 2916.11-2916.15)
Bulk and
intermediary 0.83403
91 291816 Gluconic acid, its salts & esters
Bulk and
intermediary 0.7843
92 290323 Tetrachloroethylene (perchloroethylene)
Bulk and
intermediary 0.78256
93 294140 Chloramphenicol & its derivatives; salts thereof
Bulk and
intermediary 0.77639
94 290290 Xylenes (excl. of 2902.41-2902.70)
Bulk and
intermediary 0.75218
95 291219
Acyclic aldehydes without other oxygen
function (excl. of 2912.11&2912.12)
Bulk and
intermediary 0.73049
96 290899
Halogenated/sulphonated/nitrated/nitrosated
derivatives of phenols/phenol-alcohols (excl. of
2908.11-2908.91) - 0.70308
97 290543 Mannitol
Bulk and
intermediary 0.6606
98 300220 Vaccines for human medicine Formulation 0.63543
99 300432
Medicaments containing corticosteroid
hormones, their derivatives & structural
analogues, put up in measured
doses/forms/packings for RS Formulation 0.62833
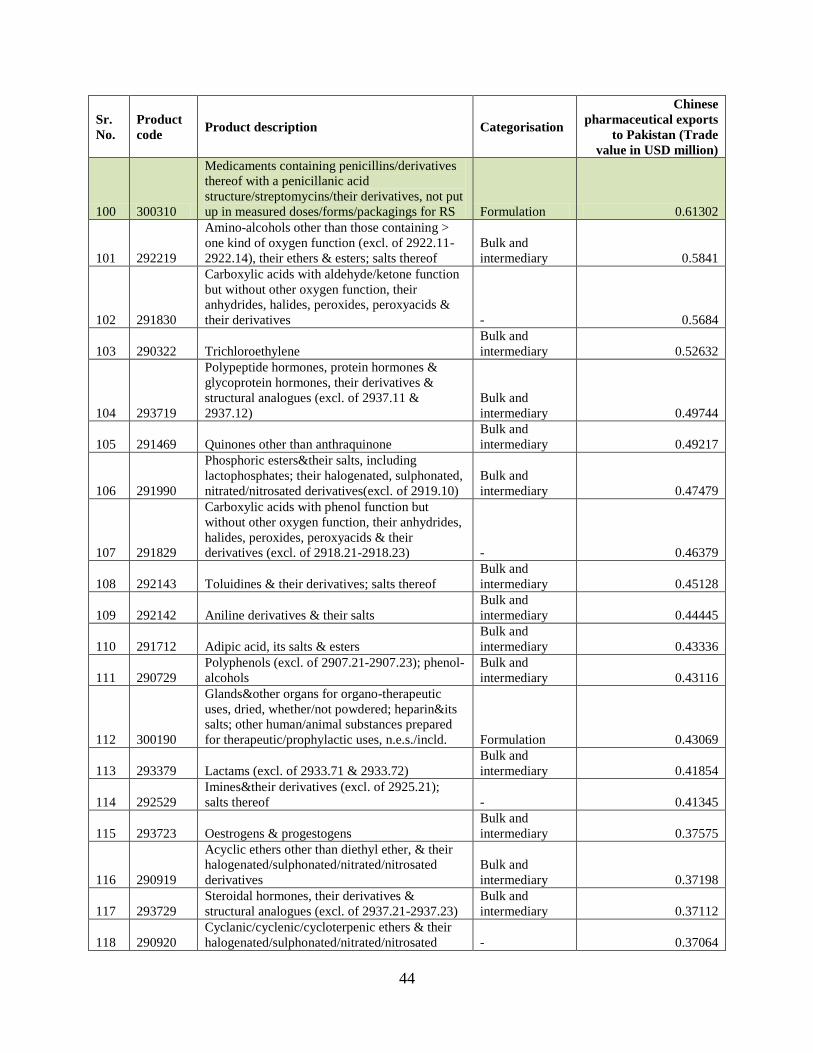
44
Sr.
No.
Product
code Product description Categorisation
Chinese
pharmaceutical exports
to Pakistan (Trade
value in USD million)
100 300310
Medicaments containing penicillins/derivatives
thereof with a penicillanic acid
structure/streptomycins/their derivatives, not put
up in measured doses/forms/packagings for RS Formulation 0.61302
101 292219
Amino-alcohols other than those containing >
one kind of oxygen function (excl. of 2922.11-
2922.14), their ethers & esters; salts thereof
Bulk and
intermediary 0.5841
102 291830
Carboxylic acids with aldehyde/ketone function
but without other oxygen function, their
anhydrides, halides, peroxides, peroxyacids &
their derivatives - 0.5684
103 290322 Trichloroethylene
Bulk and
intermediary 0.52632
104 293719
Polypeptide hormones, protein hormones &
glycoprotein hormones, their derivatives &
structural analogues (excl. of 2937.11 &
2937.12)
Bulk and
intermediary 0.49744
105 291469 Quinones other than anthraquinone
Bulk and
intermediary 0.49217
106 291990
Phosphoric esters&their salts, including
lactophosphates; their halogenated, sulphonated,
nitrated/nitrosated derivatives(excl. of 2919.10)
Bulk and
intermediary 0.47479
107 291829
Carboxylic acids with phenol function but
without other oxygen function, their anhydrides,
halides, peroxides, peroxyacids & their
derivatives (excl. of 2918.21-2918.23) - 0.46379
108 292143 Toluidines & their derivatives; salts thereof
Bulk and
intermediary 0.45128
109 292142 Aniline derivatives & their salts
Bulk and
intermediary 0.44445
110 291712 Adipic acid, its salts & esters
Bulk and
intermediary 0.43336
111 290729
Polyphenols (excl. of 2907.21-2907.23); phenol-
alcohols
Bulk and
intermediary 0.43116
112 300190
Glands&other organs for organo-therapeutic
uses, dried, whether/not powdered; heparin&its
salts; other human/animal substances prepared
for therapeutic/prophylactic uses, n.e.s./incld. Formulation 0.43069
113 293379 Lactams (excl. of 2933.71 & 2933.72)
Bulk and
intermediary 0.41854
114 292529
Imines&their derivatives (excl. of 2925.21);
salts thereof - 0.41345
115 293723 Oestrogens & progestogens
Bulk and
intermediary 0.37575
116 290919
Acyclic ethers other than diethyl ether, & their
halogenated/sulphonated/nitrated/nitrosated
derivatives
Bulk and
intermediary 0.37198
117 293729
Steroidal hormones, their derivatives &
structural analogues (excl. of 2937.21-2937.23)
Bulk and
intermediary 0.37112
118 290920
Cyclanic/cyclenic/cycloterpenic ethers & their
halogenated/sulphonated/nitrated/nitrosated - 0.37064

45
Sr.
No.
Product
code Product description Categorisation
Chinese
pharmaceutical exports
to Pakistan (Trade
value in USD million)
derivatives
119 291590
Saturated acyclic monocarboxylic acids & their
anhydrides, halides, peroxides&peroxyacids;
their halogenated/sulphonated/nitrated/nitrosated
derivatives (excl. of 2915.11-2915.70)
Bulk and
intermediary 0.36795
120 293959
Theophylline & aminophylline (theophylline-
ethylenedia-mine) & their derivatives (excl. of
2939.51); salts thereof , n.e.s.
Bulk and
intermediary 0.36593
121 294000
Sugars, chemically pure, other than sucrose,
lactose, maltose, glucose&fructose; sugar ethers,
sugar acetals&sugar esters,& their salts (excl. of
29.37/29.38/29.39)
Bulk and
intermediary 0.35705
122 292090
Esters of inorganic acids of non-metals (excl.
esters of hydrogen halides) & their salts (excl.of
2919.00&2920.10); their
halogenated/sulphonated/nitrated/nitrosated
derivatives, n.e.s.
Bulk and
intermediary 0.35099
123 292130
Cyclanic/cyclenic/cycloterpenic mono-
/polyamines, & their derivatives; salts thereof
Bulk and
intermediary 0.35073
124 291429
Cyclanic/cyclenic/cycloterpenic ketones without
other oxygen function (excl. camphor,
cyclohexanone & methylcyclohexanones,
ionones & methylionones)
Bulk and
intermediary 0.34599
125 293890
Glycosides, other than rutoside (rutin) & its
derivatives, natural/reproduced by synthesis, &
their salts, ethers, esters & other derivatives
Bulk and
intermediary 0.34412
126 293212 2-Furaldehyde (furfuraldehyde)
Bulk and
intermediary 0.33976
127 290949
Ether-alcohols & their
halogenated/sulphonated/nitrated/nitrosated
derivatives (excl. of 2909.41-2909.44)
Bulk and
intermediary 0.33787
128 291812 Tartaric acid
Bulk and
intermediary 0.33127
129 291260 Paraformaldehyde
Bulk and
intermediary 0.32123
130 300630
Opacifying preparations for X-ray examinations;
diagnostic reagents designed to be administered
to the patient Formulation 0.31002
131 291811 Lactic acid, its salts&esters
Bulk and
intermediary 0.29073
132 291550 Propionic acid, its salts & esters
Bulk and
intermediary 0.28376
133 293621 Vitamins A & their derivatives
Bulk and
intermediary 0.28243
134 291560
Butanoic acids, pentanoic acids, their salts &
esters
Bulk and
intermediary 0.23146
135 290519
Saturated monohydric alcohols (excl. of
2905.11-2905.17)
Bulk and
intermediary 0.22452
136 293623 Vitamin B2 & its derivatives
Bulk and
intermediary 0.22168
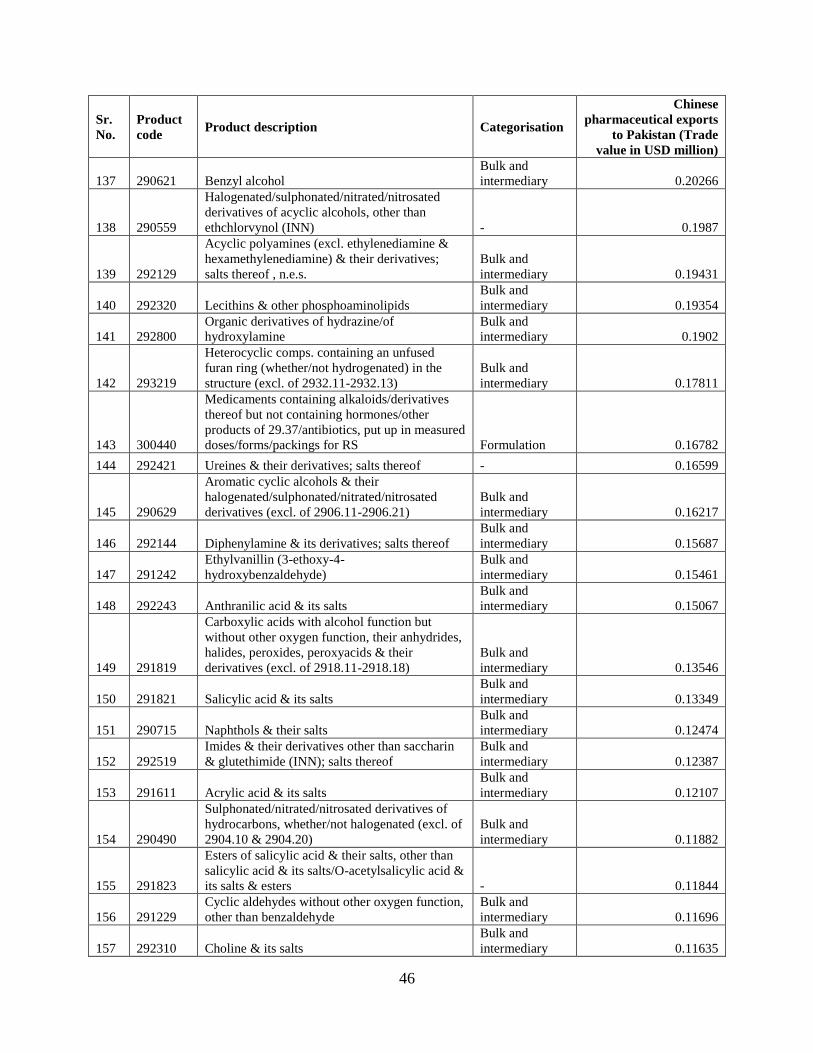
46
Sr.
No.
Product
code Product description Categorisation
Chinese
pharmaceutical exports
to Pakistan (Trade
value in USD million)
137 290621 Benzyl alcohol
Bulk and
intermediary 0.20266
138 290559
Halogenated/sulphonated/nitrated/nitrosated
derivatives of acyclic alcohols, other than
ethchlorvynol (INN) - 0.1987
139 292129
Acyclic polyamines (excl. ethylenediamine &
hexamethylenediamine) & their derivatives;
salts thereof , n.e.s.
Bulk and
intermediary 0.19431
140 292320 Lecithins & other phosphoaminolipids
Bulk and
intermediary 0.19354
141 292800
Organic derivatives of hydrazine/of
hydroxylamine
Bulk and
intermediary 0.1902
142 293219
Heterocyclic comps. containing an unfused
furan ring (whether/not hydrogenated) in the
structure (excl. of 2932.11-2932.13)
Bulk and
intermediary 0.17811
143 300440
Medicaments containing alkaloids/derivatives
thereof but not containing hormones/other
products of 29.37/antibiotics, put up in measured
doses/forms/packings for RS Formulation 0.16782
144 292421 Ureines & their derivatives; salts thereof - 0.16599
145 290629
Aromatic cyclic alcohols & their
halogenated/sulphonated/nitrated/nitrosated
derivatives (excl. of 2906.11-2906.21)
Bulk and
intermediary 0.16217
146 292144 Diphenylamine & its derivatives; salts thereof
Bulk and
intermediary 0.15687
147 291242
Ethylvanillin (3-ethoxy-4-
hydroxybenzaldehyde)
Bulk and
intermediary 0.15461
148 292243 Anthranilic acid & its salts
Bulk and
intermediary 0.15067
149 291819
Carboxylic acids with alcohol function but
without other oxygen function, their anhydrides,
halides, peroxides, peroxyacids & their
derivatives (excl. of 2918.11-2918.18)
Bulk and
intermediary 0.13546
150 291821 Salicylic acid & its salts
Bulk and
intermediary 0.13349
151 290715 Naphthols & their salts
Bulk and
intermediary 0.12474
152 292519
Imides & their derivatives other than saccharin
& glutethimide (INN); salts thereof
Bulk and
intermediary 0.12387
153 291611 Acrylic acid & its salts
Bulk and
intermediary 0.12107
154 290490
Sulphonated/nitrated/nitrosated derivatives of
hydrocarbons, whether/not halogenated (excl. of
2904.10 & 2904.20)
Bulk and
intermediary 0.11882
155 291823
Esters of salicylic acid & their salts, other than
salicylic acid & its salts/O-acetylsalicylic acid &
its salts & esters - 0.11844
156 291229
Cyclic aldehydes without other oxygen function,
other than benzaldehyde
Bulk and
intermediary 0.11696
157 292310 Choline & its salts
Bulk and
intermediary 0.11635
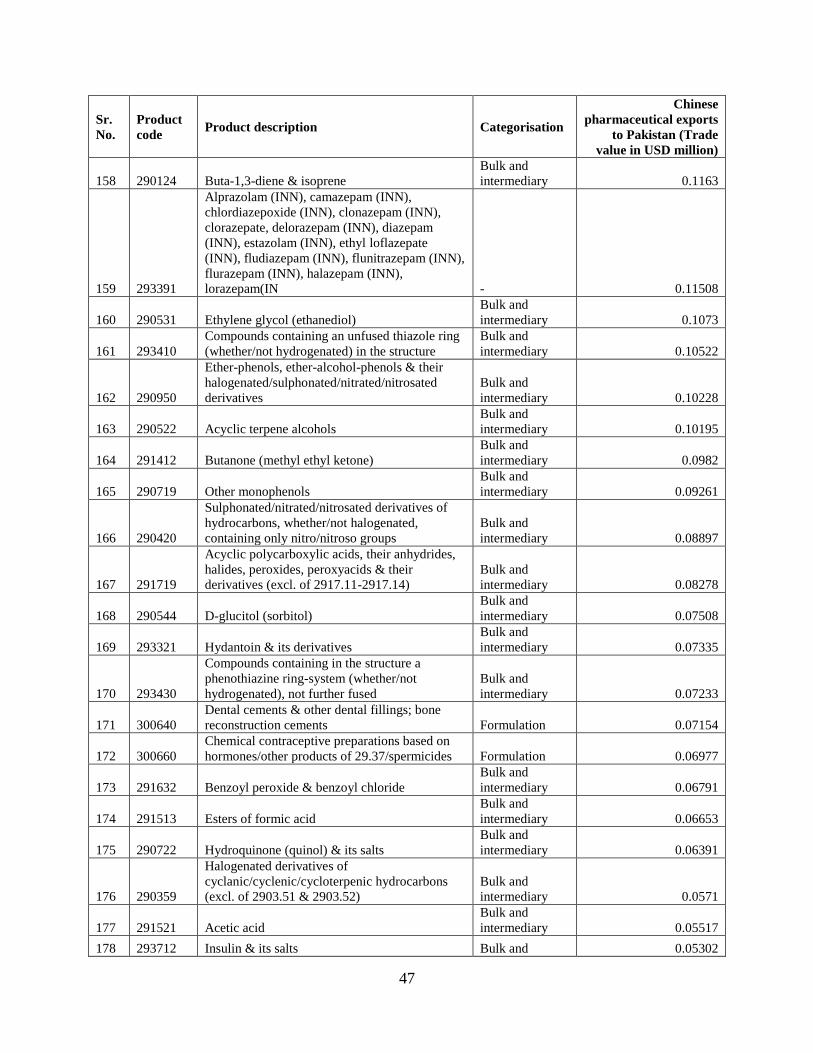
47
Sr.
No.
Product
code Product description Categorisation
Chinese
pharmaceutical exports
to Pakistan (Trade
value in USD million)
158 290124 Buta-1,3-diene & isoprene
Bulk and
intermediary 0.1163
159 293391
Alprazolam (INN), camazepam (INN),
chlordiazepoxide (INN), clonazepam (INN),
clorazepate, delorazepam (INN), diazepam
(INN), estazolam (INN), ethyl loflazepate
(INN), fludiazepam (INN), flunitrazepam (INN),
flurazepam (INN), halazepam (INN),
lorazepam(IN - 0.11508
160 290531 Ethylene glycol (ethanediol)
Bulk and
intermediary 0.1073
161 293410
Compounds containing an unfused thiazole ring
(whether/not hydrogenated) in the structure
Bulk and
intermediary 0.10522
162 290950
Ether-phenols, ether-alcohol-phenols & their
halogenated/sulphonated/nitrated/nitrosated
derivatives
Bulk and
intermediary 0.10228
163 290522 Acyclic terpene alcohols
Bulk and
intermediary 0.10195
164 291412 Butanone (methyl ethyl ketone)
Bulk and
intermediary 0.0982
165 290719 Other monophenols
Bulk and
intermediary 0.09261
166 290420
Sulphonated/nitrated/nitrosated derivatives of
hydrocarbons, whether/not halogenated,
containing only nitro/nitroso groups
Bulk and
intermediary 0.08897
167 291719
Acyclic polycarboxylic acids, their anhydrides,
halides, peroxides, peroxyacids & their
derivatives (excl. of 2917.11-2917.14)
Bulk and
intermediary 0.08278
168 290544 D-glucitol (sorbitol)
Bulk and
intermediary 0.07508
169 293321 Hydantoin & its derivatives
Bulk and
intermediary 0.07335
170 293430
Compounds containing in the structure a
phenothiazine ring-system (whether/not
hydrogenated), not further fused
Bulk and
intermediary 0.07233
171 300640
Dental cements & other dental fillings; bone
reconstruction cements Formulation 0.07154
172 300660
Chemical contraceptive preparations based on
hormones/other products of 29.37/spermicides Formulation 0.06977
173 291632 Benzoyl peroxide & benzoyl chloride
Bulk and
intermediary 0.06791
174 291513 Esters of formic acid
Bulk and
intermediary 0.06653
175 290722 Hydroquinone (quinol) & its salts
Bulk and
intermediary 0.06391
176 290359
Halogenated derivatives of
cyclanic/cyclenic/cycloterpenic hydrocarbons
(excl. of 2903.51 & 2903.52)
Bulk and
intermediary 0.0571
177 291521 Acetic acid
Bulk and
intermediary 0.05517
178 293712 Insulin & its salts Bulk and 0.05302
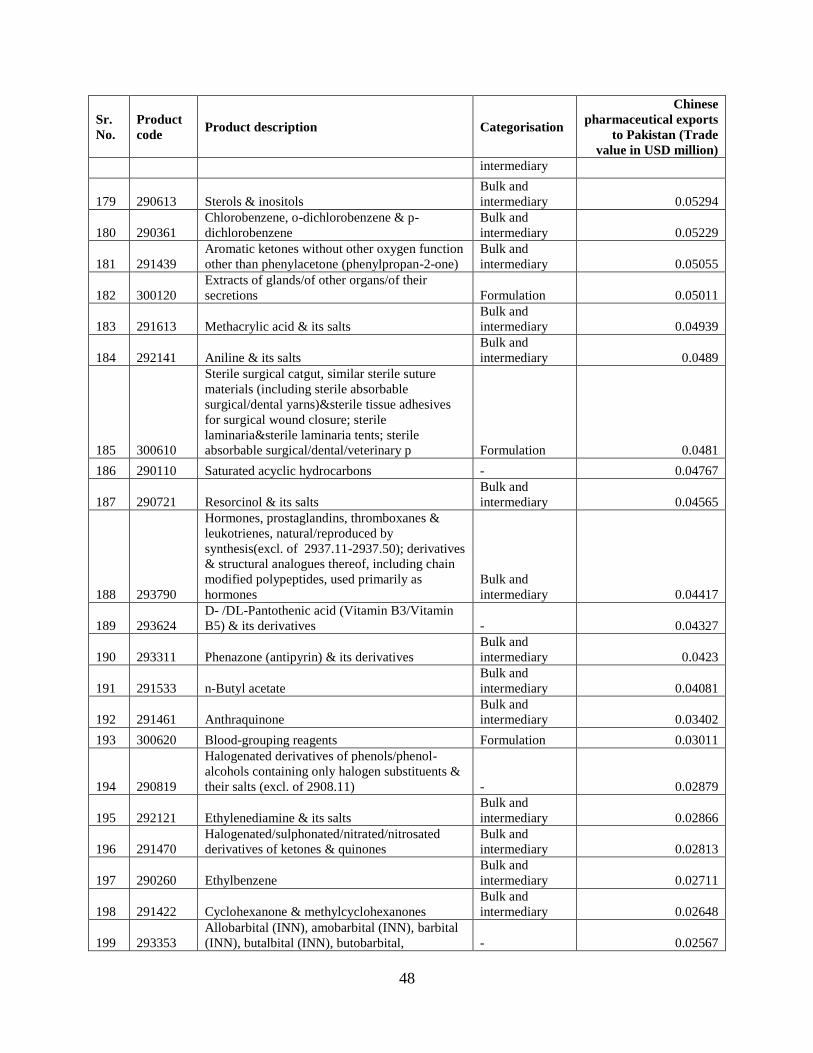
48
Sr.
No.
Product
code Product description Categorisation
Chinese
pharmaceutical exports
to Pakistan (Trade
value in USD million)
intermediary
179 290613 Sterols & inositols
Bulk and
intermediary 0.05294
180 290361
Chlorobenzene, o-dichlorobenzene & p-
dichlorobenzene
Bulk and
intermediary 0.05229
181 291439
Aromatic ketones without other oxygen function
other than phenylacetone (phenylpropan-2-one)
Bulk and
intermediary 0.05055
182 300120
Extracts of glands/of other organs/of their
secretions Formulation 0.05011
183 291613 Methacrylic acid & its salts
Bulk and
intermediary 0.04939
184 292141 Aniline & its salts
Bulk and
intermediary 0.0489
185 300610
Sterile surgical catgut, similar sterile suture
materials (including sterile absorbable
surgical/dental yarns)&sterile tissue adhesives
for surgical wound closure; sterile
laminaria&sterile laminaria tents; sterile
absorbable surgical/dental/veterinary p Formulation 0.0481
186 290110 Saturated acyclic hydrocarbons - 0.04767
187 290721 Resorcinol & its salts
Bulk and
intermediary 0.04565
188 293790
Hormones, prostaglandins, thromboxanes &
leukotrienes, natural/reproduced by
synthesis(excl. of 2937.11-2937.50); derivatives
& structural analogues thereof, including chain
modified polypeptides, used primarily as
hormones
Bulk and
intermediary 0.04417
189 293624
D- /DL-Pantothenic acid (Vitamin B3/Vitamin
B5) & its derivatives - 0.04327
190 293311 Phenazone (antipyrin) & its derivatives
Bulk and
intermediary 0.0423
191 291533 n-Butyl acetate
Bulk and
intermediary 0.04081
192 291461 Anthraquinone
Bulk and
intermediary 0.03402
193 300620 Blood-grouping reagents Formulation 0.03011
194 290819
Halogenated derivatives of phenols/phenol-
alcohols containing only halogen substituents &
their salts (excl. of 2908.11) - 0.02879
195 292121 Ethylenediamine & its salts
Bulk and
intermediary 0.02866
196 291470
Halogenated/sulphonated/nitrated/nitrosated
derivatives of ketones & quinones
Bulk and
intermediary 0.02813
197 290260 Ethylbenzene
Bulk and
intermediary 0.02711
198 291422 Cyclohexanone & methylcyclohexanones
Bulk and
intermediary 0.02648
199 293353
Allobarbital (INN), amobarbital (INN), barbital
(INN), butalbital (INN), butobarbital, - 0.02567
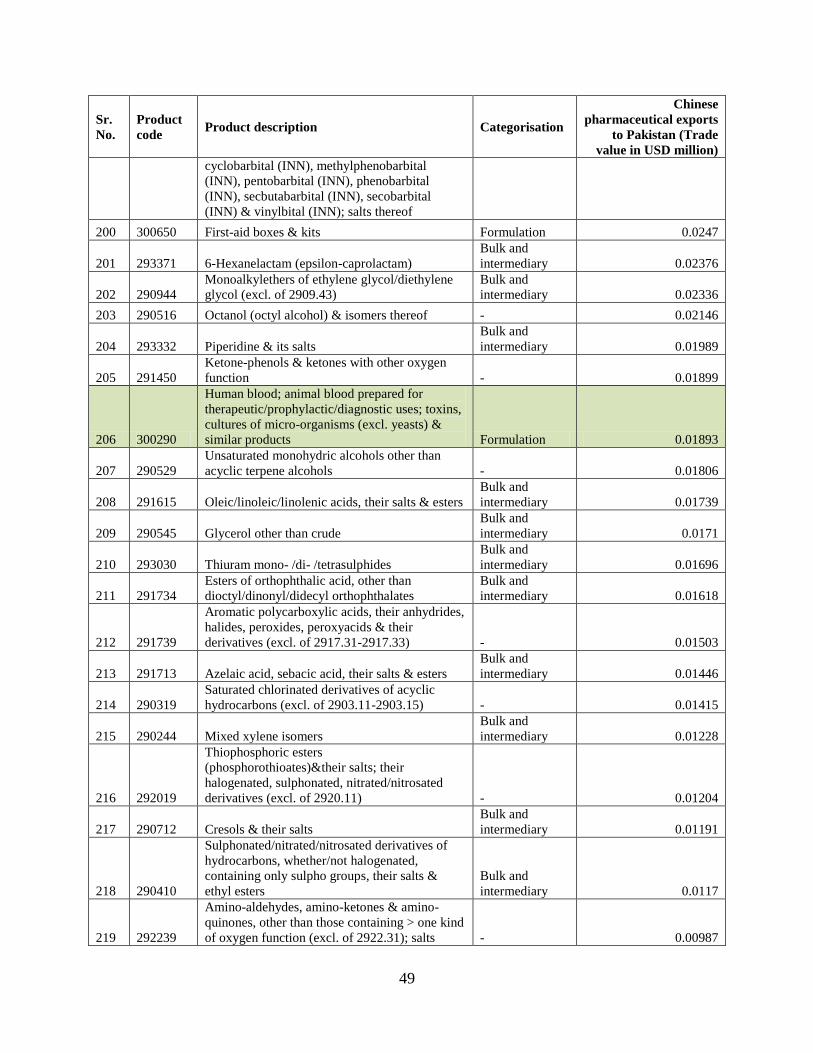
49
Sr.
No.
Product
code Product description Categorisation
Chinese
pharmaceutical exports
to Pakistan (Trade
value in USD million)
cyclobarbital (INN), methylphenobarbital
(INN), pentobarbital (INN), phenobarbital
(INN), secbutabarbital (INN), secobarbital
(INN) & vinylbital (INN); salts thereof
200 300650 First-aid boxes & kits Formulation 0.0247
201 293371 6-Hexanelactam (epsilon-caprolactam)
Bulk and
intermediary 0.02376
202 290944
Monoalkylethers of ethylene glycol/diethylene
glycol (excl. of 2909.43)
Bulk and
intermediary 0.02336
203 290516 Octanol (octyl alcohol) & isomers thereof - 0.02146
204 293332 Piperidine & its salts
Bulk and
intermediary 0.01989
205 291450
Ketone-phenols & ketones with other oxygen
function - 0.01899
206 300290
Human blood; animal blood prepared for
therapeutic/prophylactic/diagnostic uses; toxins,
cultures of micro-organisms (excl. yeasts) &
similar products Formulation 0.01893
207 290529
Unsaturated monohydric alcohols other than
acyclic terpene alcohols - 0.01806
208 291615 Oleic/linoleic/linolenic acids, their salts & esters
Bulk and
intermediary 0.01739
209 290545 Glycerol other than crude
Bulk and
intermediary 0.0171
210 293030 Thiuram mono- /di- /tetrasulphides
Bulk and
intermediary 0.01696
211 291734
Esters of orthophthalic acid, other than
dioctyl/dinonyl/didecyl orthophthalates
Bulk and
intermediary 0.01618
212 291739
Aromatic polycarboxylic acids, their anhydrides,
halides, peroxides, peroxyacids & their
derivatives (excl. of 2917.31-2917.33) - 0.01503
213 291713 Azelaic acid, sebacic acid, their salts & esters
Bulk and
intermediary 0.01446
214 290319
Saturated chlorinated derivatives of acyclic
hydrocarbons (excl. of 2903.11-2903.15) - 0.01415
215 290244 Mixed xylene isomers
Bulk and
intermediary 0.01228
216 292019
Thiophosphoric esters
(phosphorothioates)&their salts; their
halogenated, sulphonated, nitrated/nitrosated
derivatives (excl. of 2920.11) - 0.01204
217 290712 Cresols & their salts
Bulk and
intermediary 0.01191
218 290410
Sulphonated/nitrated/nitrosated derivatives of
hydrocarbons, whether/not halogenated,
containing only sulpho groups, their salts &
ethyl esters
Bulk and
intermediary 0.0117
219 292239
Amino-aldehydes, amino-ketones & amino-
quinones, other than those containing > one kind
of oxygen function (excl. of 2922.31); salts - 0.00987
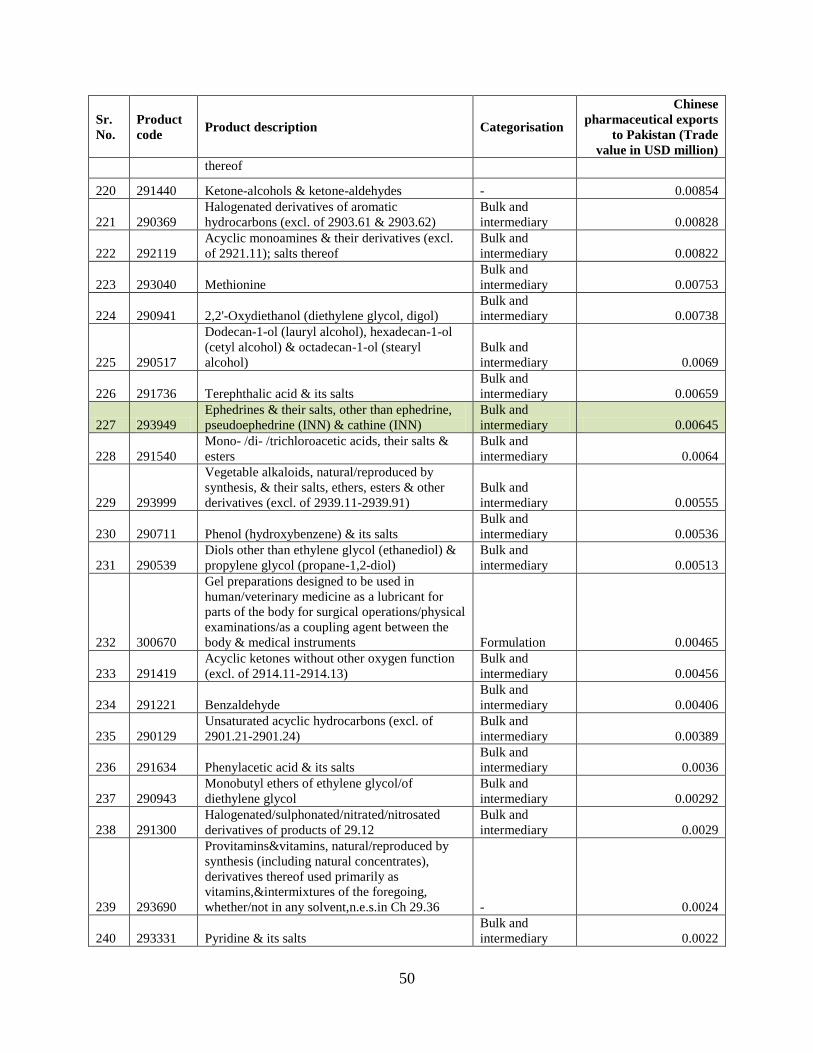
50
Sr.
No.
Product
code Product description Categorisation
Chinese
pharmaceutical exports
to Pakistan (Trade
value in USD million)
thereof
220 291440 Ketone-alcohols & ketone-aldehydes - 0.00854
221 290369
Halogenated derivatives of aromatic
hydrocarbons (excl. of 2903.61 & 2903.62)
Bulk and
intermediary 0.00828
222 292119
Acyclic monoamines & their derivatives (excl.
of 2921.11); salts thereof
Bulk and
intermediary 0.00822
223 293040 Methionine
Bulk and
intermediary 0.00753
224 290941 2,2'-Oxydiethanol (diethylene glycol, digol)
Bulk and
intermediary 0.00738
225 290517
Dodecan-1-ol (lauryl alcohol), hexadecan-1-ol
(cetyl alcohol) & octadecan-1-ol (stearyl
alcohol)
Bulk and
intermediary 0.0069
226 291736 Terephthalic acid & its salts
Bulk and
intermediary 0.00659
227 293949
Ephedrines & their salts, other than ephedrine,
pseudoephedrine (INN) & cathine (INN)
Bulk and
intermediary 0.00645
228 291540
Mono- /di- /trichloroacetic acids, their salts &
esters
Bulk and
intermediary 0.0064
229 293999
Vegetable alkaloids, natural/reproduced by
synthesis, & their salts, ethers, esters & other
derivatives (excl. of 2939.11-2939.91)
Bulk and
intermediary 0.00555
230 290711 Phenol (hydroxybenzene) & its salts
Bulk and
intermediary 0.00536
231 290539
Diols other than ethylene glycol (ethanediol) &
propylene glycol (propane-1,2-diol)
Bulk and
intermediary 0.00513
232 300670
Gel preparations designed to be used in
human/veterinary medicine as a lubricant for
parts of the body for surgical operations/physical
examinations/as a coupling agent between the
body & medical instruments Formulation 0.00465
233 291419
Acyclic ketones without other oxygen function
(excl. of 2914.11-2914.13)
Bulk and
intermediary 0.00456
234 291221 Benzaldehyde
Bulk and
intermediary 0.00406
235 290129
Unsaturated acyclic hydrocarbons (excl. of
2901.21-2901.24)
Bulk and
intermediary 0.00389
236 291634 Phenylacetic acid & its salts
Bulk and
intermediary 0.0036
237 290943
Monobutyl ethers of ethylene glycol/of
diethylene glycol
Bulk and
intermediary 0.00292
238 291300
Halogenated/sulphonated/nitrated/nitrosated
derivatives of products of 29.12
Bulk and
intermediary 0.0029
239 293690
Provitamins&vitamins, natural/reproduced by
synthesis (including natural concentrates),
derivatives thereof used primarily as
vitamins,&intermixtures of the foregoing,
whether/not in any solvent,n.e.s.in Ch 29.36 - 0.0024
240 293331 Pyridine & its salts
Bulk and
intermediary 0.0022
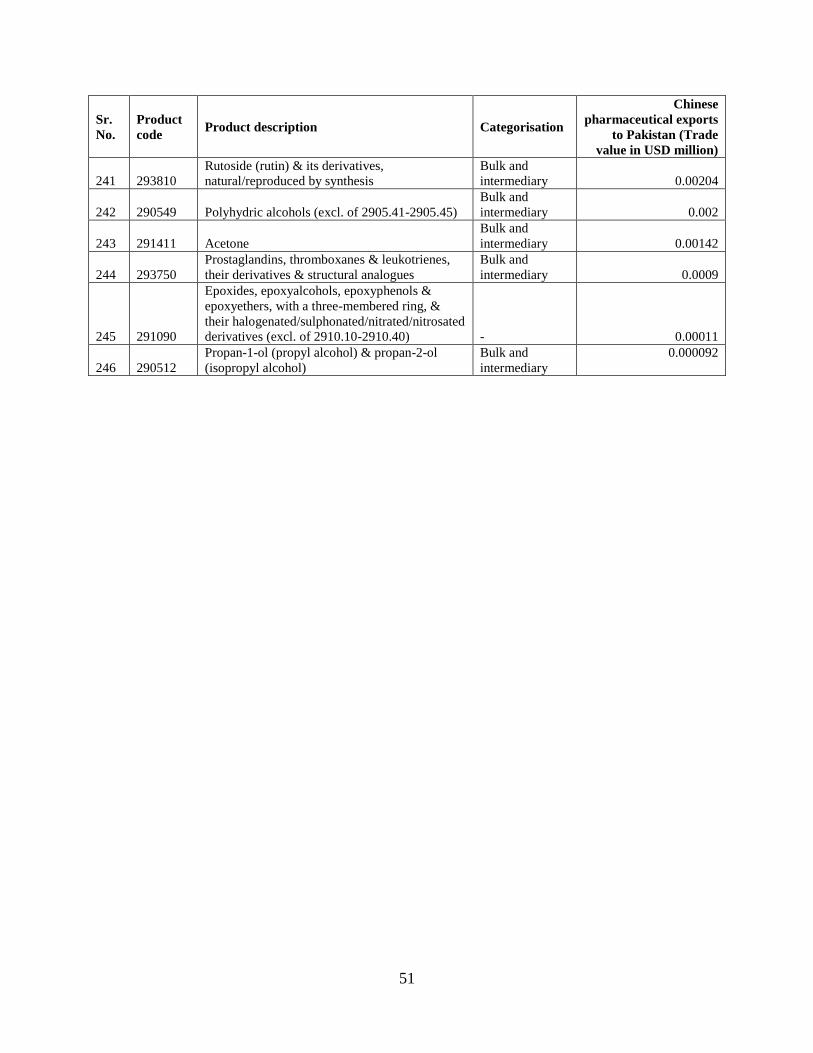
51
Sr.
No.
Product
code Product description Categorisation
Chinese
pharmaceutical exports
to Pakistan (Trade
value in USD million)
241 293810
Rutoside (rutin) & its derivatives,
natural/reproduced by synthesis
Bulk and
intermediary 0.00204
242 290549 Polyhydric alcohols (excl. of 2905.41-2905.45)
Bulk and
intermediary 0.002
243 291411 Acetone
Bulk and
intermediary 0.00142
244 293750
Prostaglandins, thromboxanes & leukotrienes,
their derivatives & structural analogues
Bulk and
intermediary 0.0009
245 291090
Epoxides, epoxyalcohols, epoxyphenols &
epoxyethers, with a three-membered ring, &
their halogenated/sulphonated/nitrated/nitrosated
derivatives (excl. of 2910.10-2910.40) - 0.00011
246 290512
Propan-1-ol (propyl alcohol) & propan-2-ol
(isopropyl alcohol)
Bulk and
intermediary
0.000092
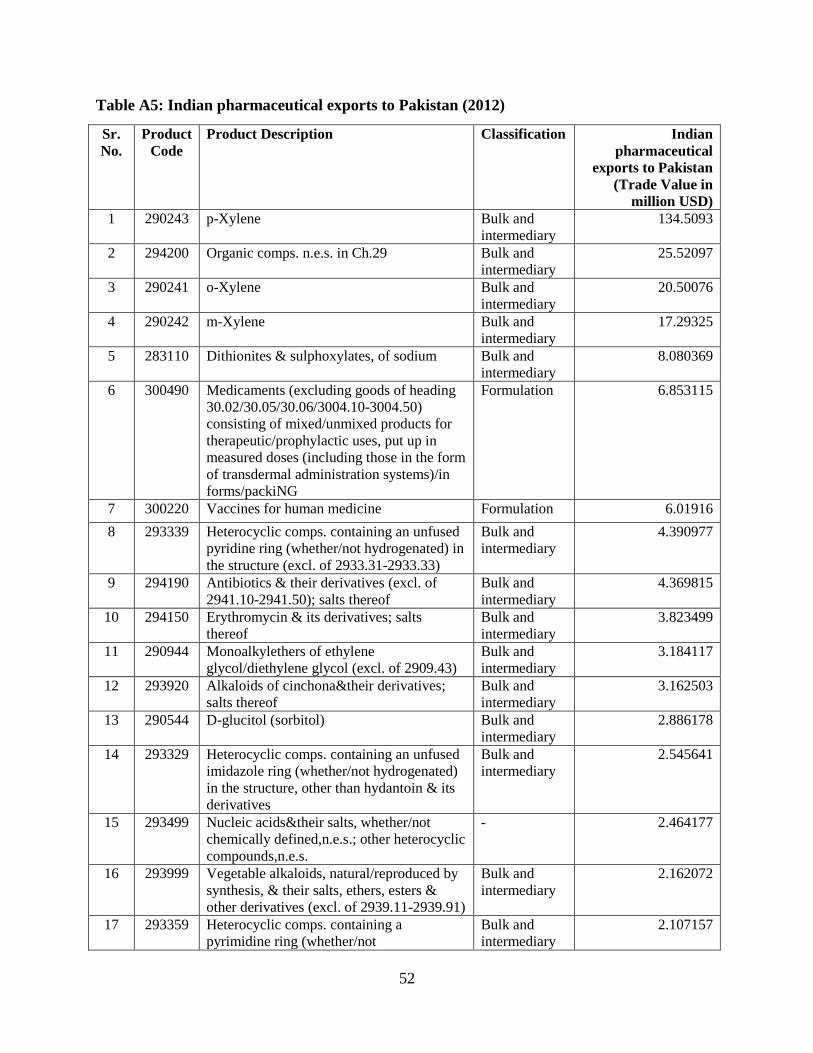
52
Table A5: Indian pharmaceutical exports to Pakistan (2012)
Sr.
No.
Product
Code
Product Description Classification Indian
pharmaceutical
exports to Pakistan
(Trade Value in
million USD)
1 290243 p-Xylene Bulk and
intermediary
134.5093
2 294200 Organic comps. n.e.s. in Ch.29 Bulk and
intermediary
25.52097
3 290241 o-Xylene Bulk and
intermediary
20.50076
4 290242 m-Xylene Bulk and
intermediary
17.29325
5 283110 Dithionites & sulphoxylates, of sodium Bulk and
intermediary
8.080369
6 300490 Medicaments (excluding goods of heading
30.02/30.05/30.06/3004.10-3004.50)
consisting of mixed/unmixed products for
therapeutic/prophylactic uses, put up in
measured doses (including those in the form
of transdermal administration systems)/in
forms/packiNG
Formulation 6.853115
7 300220 Vaccines for human medicine Formulation 6.01916
8 293339 Heterocyclic comps. containing an unfused
pyridine ring (whether/not hydrogenated) in
the structure (excl. of 2933.31-2933.33)
Bulk and
intermediary
4.390977
9 294190 Antibiotics & their derivatives (excl. of
2941.10-2941.50); salts thereof
Bulk and
intermediary
4.369815
10 294150 Erythromycin & its derivatives; salts
thereof
Bulk and
intermediary
3.823499
11 290944 Monoalkylethers of ethylene
glycol/diethylene glycol (excl. of 2909.43)
Bulk and
intermediary
3.184117
12 293920 Alkaloids of cinchona&their derivatives;
salts thereof
Bulk and
intermediary
3.162503
13 290544 D-glucitol (sorbitol) Bulk and
intermediary
2.886178
14 293329 Heterocyclic comps. containing an unfused
imidazole ring (whether/not hydrogenated)
in the structure, other than hydantoin & its
derivatives
Bulk and
intermediary
2.545641
15 293499 Nucleic acids&their salts, whether/not
chemically defined,n.e.s.; other heterocyclic
compounds,n.e.s.
- 2.464177
16 293999 Vegetable alkaloids, natural/reproduced by
synthesis, & their salts, ethers, esters &
other derivatives (excl. of 2939.11-2939.91)
Bulk and
intermediary
2.162072
17 293359 Heterocyclic comps. containing a
pyrimidine ring (whether/not
Bulk and
intermediary
2.107157
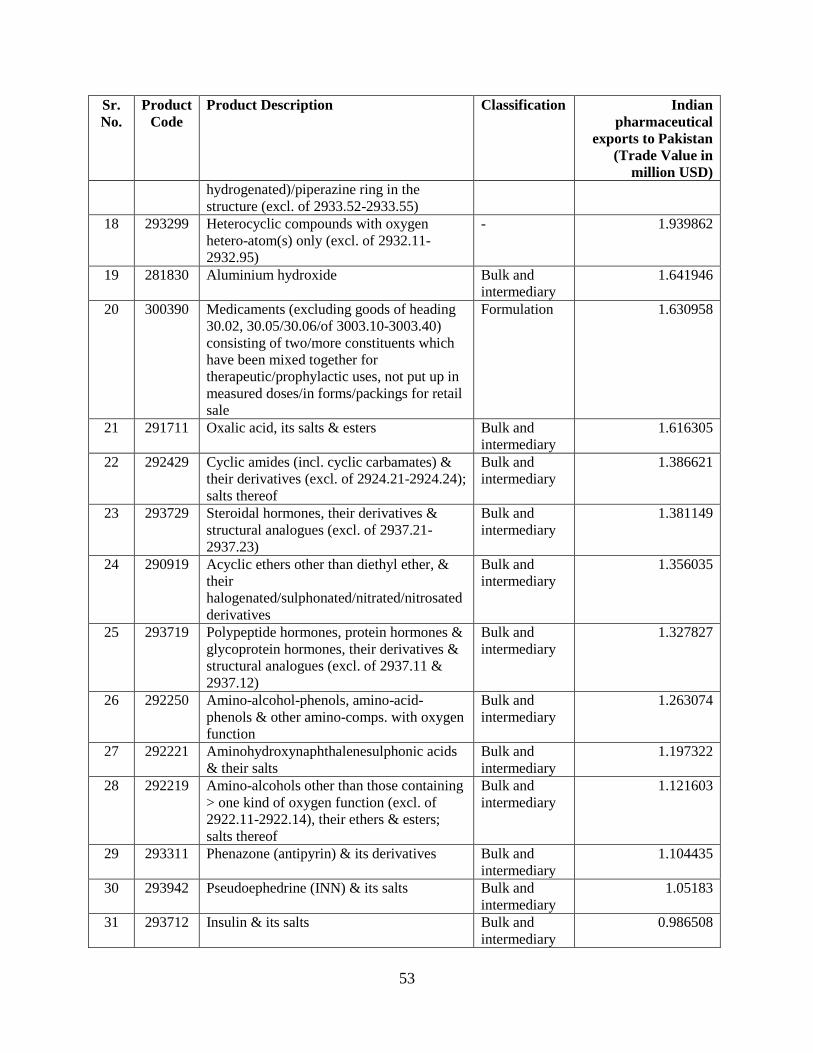
53
Sr.
No.
Product
Code
Product Description Classification Indian
pharmaceutical
exports to Pakistan
(Trade Value in
million USD)
hydrogenated)/piperazine ring in the
structure (excl. of 2933.52-2933.55)
18 293299 Heterocyclic compounds with oxygen
hetero-atom(s) only (excl. of 2932.11-
2932.95)
- 1.939862
19 281830 Aluminium hydroxide Bulk and
intermediary
1.641946
20 300390 Medicaments (excluding goods of heading
30.02, 30.05/30.06/of 3003.10-3003.40)
consisting of two/more constituents which
have been mixed together for
therapeutic/prophylactic uses, not put up in
measured doses/in forms/packings for retail
sale
Formulation 1.630958
21 291711 Oxalic acid, its salts & esters Bulk and
intermediary
1.616305
22 292429 Cyclic amides (incl. cyclic carbamates) &
their derivatives (excl. of 2924.21-2924.24);
salts thereof
Bulk and
intermediary
1.386621
23 293729 Steroidal hormones, their derivatives &
structural analogues (excl. of 2937.21-
2937.23)
Bulk and
intermediary
1.381149
24 290919 Acyclic ethers other than diethyl ether, &
their
halogenated/sulphonated/nitrated/nitrosated
derivatives
Bulk and
intermediary
1.356035
25 293719 Polypeptide hormones, protein hormones &
glycoprotein hormones, their derivatives &
structural analogues (excl. of 2937.11 &
2937.12)
Bulk and
intermediary
1.327827
26 292250 Amino-alcohol-phenols, amino-acid-
phenols & other amino-comps. with oxygen
function
Bulk and
intermediary
1.263074
27 292221 Aminohydroxynaphthalenesulphonic acids
& their salts
Bulk and
intermediary
1.197322
28 292219 Amino-alcohols other than those containing
> one kind of oxygen function (excl. of
2922.11-2922.14), their ethers & esters;
salts thereof
Bulk and
intermediary
1.121603
29 293311 Phenazone (antipyrin) & its derivatives Bulk and
intermediary
1.104435
30 293942 Pseudoephedrine (INN) & its salts Bulk and
intermediary
1.05183
31 293712 Insulin & its salts Bulk and
intermediary
0.986508
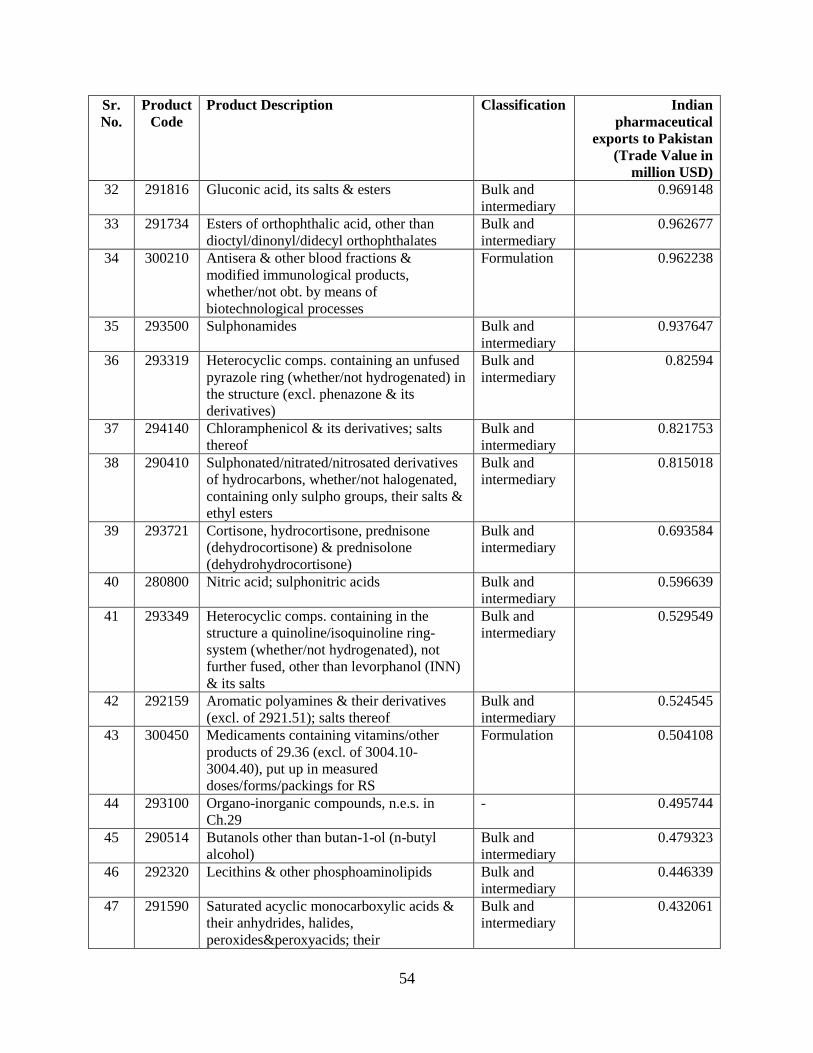
54
Sr.
No.
Product
Code
Product Description Classification Indian
pharmaceutical
exports to Pakistan
(Trade Value in
million USD)
32 291816 Gluconic acid, its salts & esters Bulk and
intermediary
0.969148
33 291734 Esters of orthophthalic acid, other than
dioctyl/dinonyl/didecyl orthophthalates
Bulk and
intermediary
0.962677
34 300210 Antisera & other blood fractions &
modified immunological products,
whether/not obt. by means of
biotechnological processes
Formulation 0.962238
35 293500 Sulphonamides Bulk and
intermediary
0.937647
36 293319 Heterocyclic comps. containing an unfused
pyrazole ring (whether/not hydrogenated) in
the structure (excl. phenazone & its
derivatives)
Bulk and
intermediary
0.82594
37 294140 Chloramphenicol & its derivatives; salts
thereof
Bulk and
intermediary
0.821753
38 290410 Sulphonated/nitrated/nitrosated derivatives
of hydrocarbons, whether/not halogenated,
containing only sulpho groups, their salts &
ethyl esters
Bulk and
intermediary
0.815018
39 293721 Cortisone, hydrocortisone, prednisone
(dehydrocortisone) & prednisolone
(dehydrohydrocortisone)
Bulk and
intermediary
0.693584
40 280800 Nitric acid; sulphonitric acids Bulk and
intermediary
0.596639
41 293349 Heterocyclic comps. containing in the
structure a quinoline/isoquinoline ring-
system (whether/not hydrogenated), not
further fused, other than levorphanol (INN)
& its salts
Bulk and
intermediary
0.529549
42 292159 Aromatic polyamines & their derivatives
(excl. of 2921.51); salts thereof
Bulk and
intermediary
0.524545
43 300450 Medicaments containing vitamins/other
products of 29.36 (excl. of 3004.10-
3004.40), put up in measured
doses/forms/packings for RS
Formulation 0.504108
44 293100 Organo-inorganic compounds, n.e.s. in
Ch.29
- 0.495744
45 290514 Butanols other than butan-1-ol (n-butyl
alcohol)
Bulk and
intermediary
0.479323
46 292320 Lecithins & other phosphoaminolipids Bulk and
intermediary
0.446339
47 291590 Saturated acyclic monocarboxylic acids &
their anhydrides, halides,
peroxides&peroxyacids; their
Bulk and
intermediary
0.432061
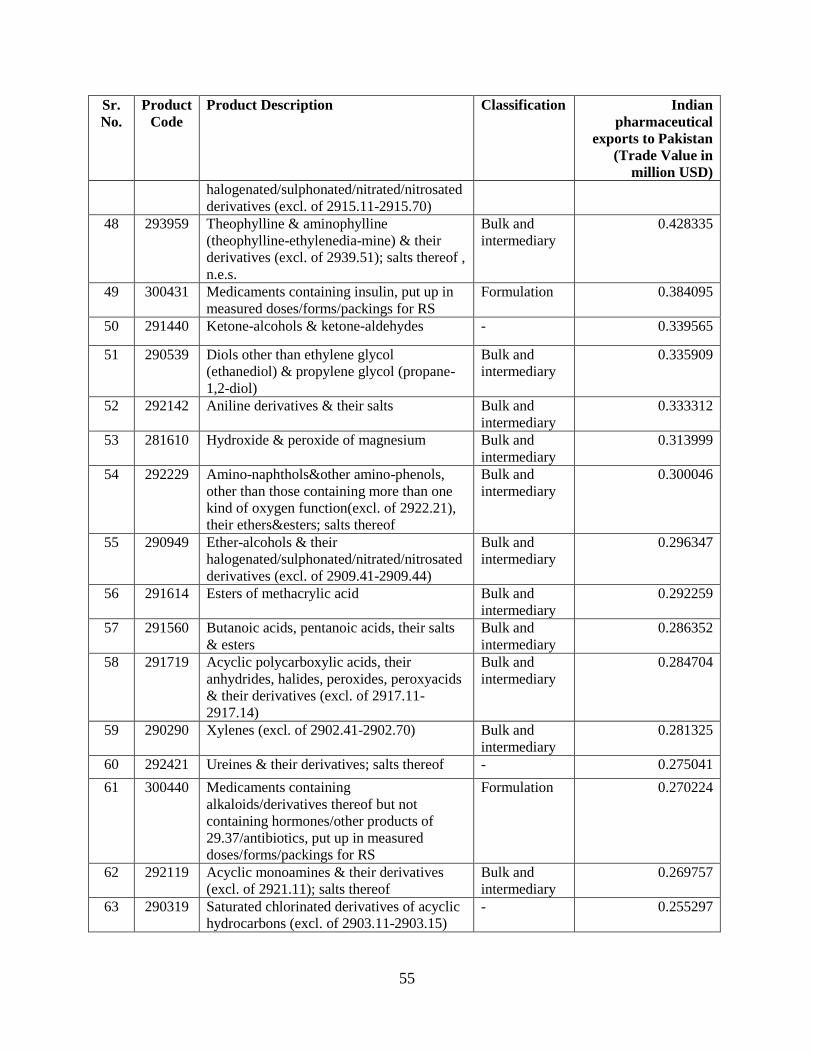
55
Sr.
No.
Product
Code
Product Description Classification Indian
pharmaceutical
exports to Pakistan
(Trade Value in
million USD)
halogenated/sulphonated/nitrated/nitrosated
derivatives (excl. of 2915.11-2915.70)
48 293959 Theophylline & aminophylline
(theophylline-ethylenedia-mine) & their
derivatives (excl. of 2939.51); salts thereof ,
n.e.s.
Bulk and
intermediary
0.428335
49 300431 Medicaments containing insulin, put up in
measured doses/forms/packings for RS
Formulation 0.384095
50 291440 Ketone-alcohols & ketone-aldehydes - 0.339565
51 290539 Diols other than ethylene glycol
(ethanediol) & propylene glycol (propane-
1,2-diol)
Bulk and
intermediary
0.335909
52 292142 Aniline derivatives & their salts Bulk and
intermediary
0.333312
53 281610 Hydroxide & peroxide of magnesium Bulk and
intermediary
0.313999
54 292229 Amino-naphthols&other amino-phenols,
other than those containing more than one
kind of oxygen function(excl. of 2922.21),
their ethers&esters; salts thereof
Bulk and
intermediary
0.300046
55 290949 Ether-alcohols & their
halogenated/sulphonated/nitrated/nitrosated
derivatives (excl. of 2909.41-2909.44)
Bulk and
intermediary
0.296347
56 291614 Esters of methacrylic acid Bulk and
intermediary
0.292259
57 291560 Butanoic acids, pentanoic acids, their salts
& esters
Bulk and
intermediary
0.286352
58 291719 Acyclic polycarboxylic acids, their
anhydrides, halides, peroxides, peroxyacids
& their derivatives (excl. of 2917.11-
2917.14)
Bulk and
intermediary
0.284704
59 290290 Xylenes (excl. of 2902.41-2902.70) Bulk and
intermediary
0.281325
60 292421 Ureines & their derivatives; salts thereof - 0.275041
61 300440 Medicaments containing
alkaloids/derivatives thereof but not
containing hormones/other products of
29.37/antibiotics, put up in measured
doses/forms/packings for RS
Formulation 0.270224
62 292119 Acyclic monoamines & their derivatives
(excl. of 2921.11); salts thereof
Bulk and
intermediary
0.269757
63 290319 Saturated chlorinated derivatives of acyclic
hydrocarbons (excl. of 2903.11-2903.15)
- 0.255297
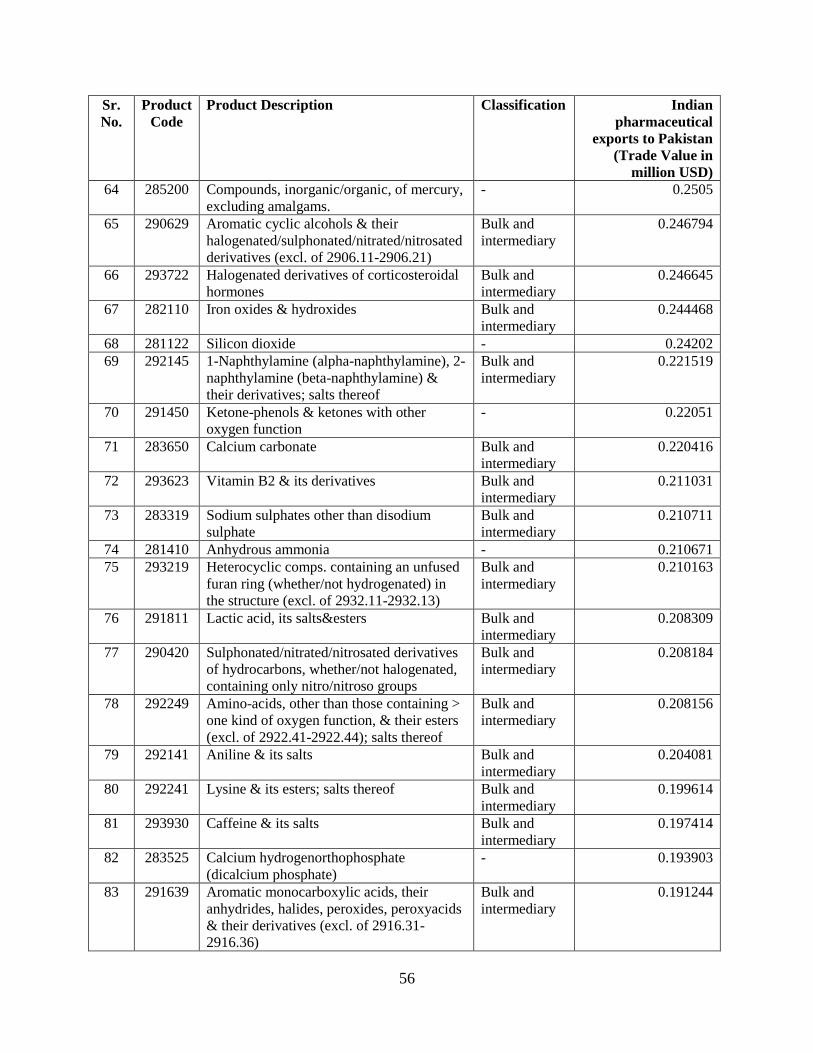
56
Sr.
No.
Product
Code
Product Description Classification Indian
pharmaceutical
exports to Pakistan
(Trade Value in
million USD)
64 285200 Compounds, inorganic/organic, of mercury,
excluding amalgams.
- 0.2505
65 290629 Aromatic cyclic alcohols & their
halogenated/sulphonated/nitrated/nitrosated
derivatives (excl. of 2906.11-2906.21)
Bulk and
intermediary
0.246794
66 293722 Halogenated derivatives of corticosteroidal
hormones
Bulk and
intermediary
0.246645
67 282110 Iron oxides & hydroxides Bulk and
intermediary
0.244468
68 281122 Silicon dioxide - 0.24202
69 292145 1-Naphthylamine (alpha-naphthylamine), 2-
naphthylamine (beta-naphthylamine) &
their derivatives; salts thereof
Bulk and
intermediary
0.221519
70 291450 Ketone-phenols & ketones with other
oxygen function
- 0.22051
71 283650 Calcium carbonate Bulk and
intermediary
0.220416
72 293623 Vitamin B2 & its derivatives Bulk and
intermediary
0.211031
73 283319 Sodium sulphates other than disodium
sulphate
Bulk and
intermediary
0.210711
74 281410 Anhydrous ammonia - 0.210671
75 293219 Heterocyclic comps. containing an unfused
furan ring (whether/not hydrogenated) in
the structure (excl. of 2932.11-2932.13)
Bulk and
intermediary
0.210163
76 291811 Lactic acid, its salts&esters Bulk and
intermediary
0.208309
77 290420 Sulphonated/nitrated/nitrosated derivatives
of hydrocarbons, whether/not halogenated,
containing only nitro/nitroso groups
Bulk and
intermediary
0.208184
78 292249 Amino-acids, other than those containing >
one kind of oxygen function, & their esters
(excl. of 2922.41-2922.44); salts thereof
Bulk and
intermediary
0.208156
79 292141 Aniline & its salts Bulk and
intermediary
0.204081
80 292241 Lysine & its esters; salts thereof Bulk and
intermediary
0.199614
81 293930 Caffeine & its salts Bulk and
intermediary
0.197414
82 283525 Calcium hydrogenorthophosphate
(dicalcium phosphate)
- 0.193903
83 291639 Aromatic monocarboxylic acids, their
anhydrides, halides, peroxides, peroxyacids
& their derivatives (excl. of 2916.31-
2916.36)
Bulk and
intermediary
0.191244

57
Sr.
No.
Product
Code
Product Description Classification Indian
pharmaceutical
exports to Pakistan
(Trade Value in
million USD)
84 293369 Heterocyclic comps. containing an unfused
triazine ring (whether/not hydrogenated) in
the structure, other than melamine
Bulk and
intermediary
0.179368
85 283329 Sulphates other than Sodium sulphates(excl.
of 2833.21-2833.27)
Bulk and
intermediary
0.1741
86 290941 2,2'-Oxydiethanol (diethylene glycol, digol) Bulk and
intermediary
0.169508
87 291539 Esters of acetic acid (excl. of 2915.31-
2915.36)
Bulk and
intermediary
0.163421
88 291813 Salts & esters of tartaric acid Bulk and
intermediary
0.158057
89 292800 Organic derivatives of hydrazine/of
hydroxylamine
Bulk and
intermediary
0.156408
90 291421 Camphor Bulk and
intermediary
0.156244
91 292143 Toluidines & their derivatives; salts thereof Bulk and
intermediary
0.153449
92 281420 Ammonia in aqueous solution - 0.146816
93 284329 Silver comps. other than silver nitrate Bulk and
intermediary
0.135707
94 294110 Penicillins & their derivatives with a
penicillanic acid structure; salts thereof
Bulk and
intermediary
0.130682
95 291631 Benzoic acid, its salts & esters Bulk and
intermediary
0.121254
96 282739 Chlorides (excl. of 2827.10-2827.35), n.e.s. Bulk and
intermediary
0.120628
97 281121 Carbon dioxide - 0.117852
98 290490 Sulphonated/nitrated/nitrosated derivatives
of hydrocarbons, whether/not halogenated
(excl. of 2904.10 & 2904.20)
Bulk and
intermediary
0.117396
99 292151 o-, m-, p-Phenylenediamine,
diaminotoluenes, & their derivatives; salts
thereof
Bulk and
intermediary
0.112538
100 282760 Iodides & iodide oxides Bulk and
intermediary
0.11218
101 293740 Amino-acid derivatives Bulk and
intermediary
0.109285
102 293711 Somatotropin, its derivatives & structural
analogues
Bulk and
intermediary
0.10927
103 290729 Polyphenols (excl. of 2907.21-2907.23);
phenol-alcohols
Bulk and
intermediary
0.108783
104 300420 Medicaments containing other antibiotics
(excl. of 3004.10), put up in measured
doses/forms/packings for RS
Formulation 0.107321
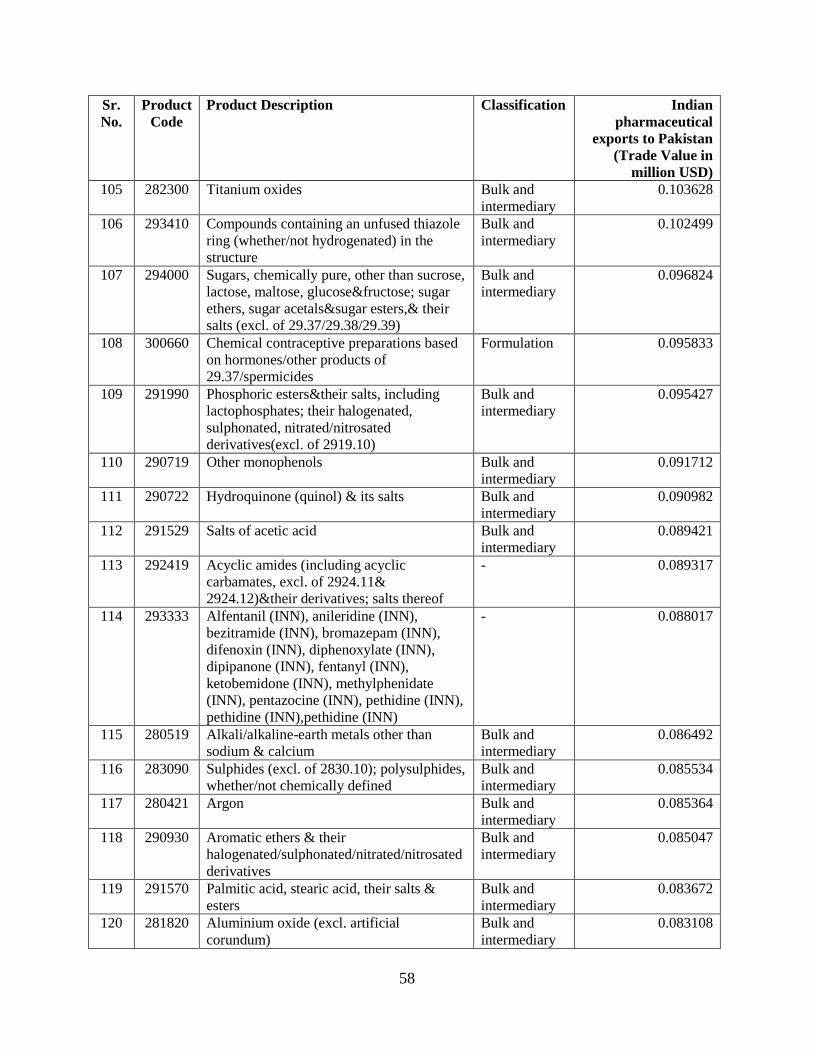
58
Sr.
No.
Product
Code
Product Description Classification Indian
pharmaceutical
exports to Pakistan
(Trade Value in
million USD)
105 282300 Titanium oxides Bulk and
intermediary
0.103628
106 293410 Compounds containing an unfused thiazole
ring (whether/not hydrogenated) in the
structure
Bulk and
intermediary
0.102499
107 294000 Sugars, chemically pure, other than sucrose,
lactose, maltose, glucose&fructose; sugar
ethers, sugar acetals&sugar esters,& their
salts (excl. of 29.37/29.38/29.39)
Bulk and
intermediary
0.096824
108 300660 Chemical contraceptive preparations based
on hormones/other products of
29.37/spermicides
Formulation 0.095833
109 291990 Phosphoric esters&their salts, including
lactophosphates; their halogenated,
sulphonated, nitrated/nitrosated
derivatives(excl. of 2919.10)
Bulk and
intermediary
0.095427
110 290719 Other monophenols Bulk and
intermediary
0.091712
111 290722 Hydroquinone (quinol) & its salts Bulk and
intermediary
0.090982
112 291529 Salts of acetic acid Bulk and
intermediary
0.089421
113 292419 Acyclic amides (including acyclic
carbamates, excl. of 2924.11&
2924.12)&their derivatives; salts thereof
- 0.089317
114 293333 Alfentanil (INN), anileridine (INN),
bezitramide (INN), bromazepam (INN),
difenoxin (INN), diphenoxylate (INN),
dipipanone (INN), fentanyl (INN),
ketobemidone (INN), methylphenidate
(INN), pentazocine (INN), pethidine (INN),
pethidine (INN),pethidine (INN)
- 0.088017
115 280519 Alkali/alkaline-earth metals other than
sodium & calcium
Bulk and
intermediary
0.086492
116 283090 Sulphides (excl. of 2830.10); polysulphides,
whether/not chemically defined
Bulk and
intermediary
0.085534
117 280421 Argon Bulk and
intermediary
0.085364
118 290930 Aromatic ethers & their
halogenated/sulphonated/nitrated/nitrosated
derivatives
Bulk and
intermediary
0.085047
119 291570 Palmitic acid, stearic acid, their salts &
esters
Bulk and
intermediary
0.083672
120 281820 Aluminium oxide (excl. artificial
corundum)
Bulk and
intermediary
0.083108
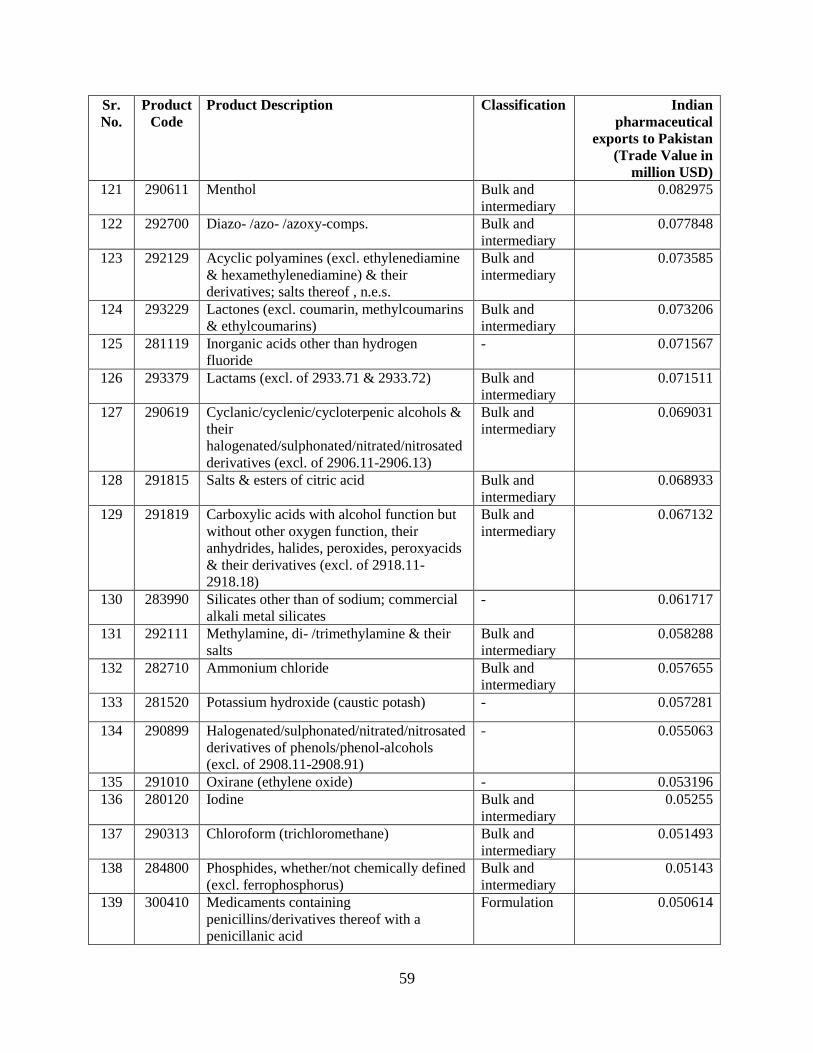
59
Sr.
No.
Product
Code
Product Description Classification Indian
pharmaceutical
exports to Pakistan
(Trade Value in
million USD)
121 290611 Menthol Bulk and
intermediary
0.082975
122 292700 Diazo- /azo- /azoxy-comps. Bulk and
intermediary
0.077848
123 292129 Acyclic polyamines (excl. ethylenediamine
& hexamethylenediamine) & their
derivatives; salts thereof , n.e.s.
Bulk and
intermediary
0.073585
124 293229 Lactones (excl. coumarin, methylcoumarins
& ethylcoumarins)
Bulk and
intermediary
0.073206
125 281119 Inorganic acids other than hydrogen
fluoride
- 0.071567
126 293379 Lactams (excl. of 2933.71 & 2933.72) Bulk and
intermediary
0.071511
127 290619 Cyclanic/cyclenic/cycloterpenic alcohols &
their
halogenated/sulphonated/nitrated/nitrosated
derivatives (excl. of 2906.11-2906.13)
Bulk and
intermediary
0.069031
128 291815 Salts & esters of citric acid Bulk and
intermediary
0.068933
129 291819 Carboxylic acids with alcohol function but
without other oxygen function, their
anhydrides, halides, peroxides, peroxyacids
& their derivatives (excl. of 2918.11-
2918.18)
Bulk and
intermediary
0.067132
130 283990 Silicates other than of sodium; commercial
alkali metal silicates
- 0.061717
131 292111 Methylamine, di- /trimethylamine & their
salts
Bulk and
intermediary
0.058288
132 282710 Ammonium chloride Bulk and
intermediary
0.057655
133 281520 Potassium hydroxide (caustic potash) - 0.057281
134 290899 Halogenated/sulphonated/nitrated/nitrosated
derivatives of phenols/phenol-alcohols
(excl. of 2908.11-2908.91)
- 0.055063
135 291010 Oxirane (ethylene oxide) - 0.053196
136 280120 Iodine Bulk and
intermediary
0.05255
137 290313 Chloroform (trichloromethane) Bulk and
intermediary
0.051493
138 284800 Phosphides, whether/not chemically defined
(excl. ferrophosphorus)
Bulk and
intermediary
0.05143
139 300410 Medicaments containing
penicillins/derivatives thereof with a
penicillanic acid
Formulation 0.050614
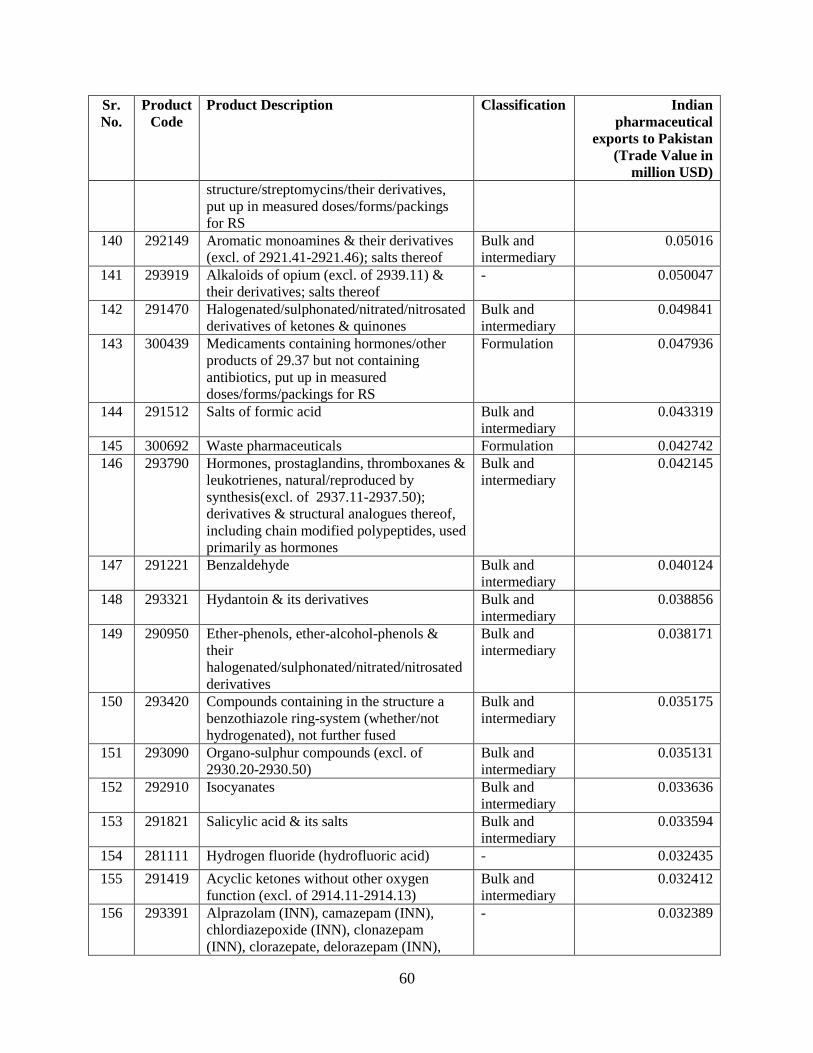
60
Sr.
No.
Product
Code
Product Description Classification Indian
pharmaceutical
exports to Pakistan
(Trade Value in
million USD)
structure/streptomycins/their derivatives,
put up in measured doses/forms/packings
for RS
140 292149 Aromatic monoamines & their derivatives
(excl. of 2921.41-2921.46); salts thereof
Bulk and
intermediary
0.05016
141 293919 Alkaloids of opium (excl. of 2939.11) &
their derivatives; salts thereof
- 0.050047
142 291470 Halogenated/sulphonated/nitrated/nitrosated
derivatives of ketones & quinones
Bulk and
intermediary
0.049841
143 300439 Medicaments containing hormones/other
products of 29.37 but not containing
antibiotics, put up in measured
doses/forms/packings for RS
Formulation 0.047936
144 291512 Salts of formic acid Bulk and
intermediary
0.043319
145 300692 Waste pharmaceuticals Formulation 0.042742
146 293790 Hormones, prostaglandins, thromboxanes &
leukotrienes, natural/reproduced by
synthesis(excl. of 2937.11-2937.50);
derivatives & structural analogues thereof,
including chain modified polypeptides, used
primarily as hormones
Bulk and
intermediary
0.042145
147 291221 Benzaldehyde Bulk and
intermediary
0.040124
148 293321 Hydantoin & its derivatives Bulk and
intermediary
0.038856
149 290950 Ether-phenols, ether-alcohol-phenols &
their
halogenated/sulphonated/nitrated/nitrosated
derivatives
Bulk and
intermediary
0.038171
150 293420 Compounds containing in the structure a
benzothiazole ring-system (whether/not
hydrogenated), not further fused
Bulk and
intermediary
0.035175
151 293090 Organo-sulphur compounds (excl. of
2930.20-2930.50)
Bulk and
intermediary
0.035131
152 292910 Isocyanates Bulk and
intermediary
0.033636
153 291821 Salicylic acid & its salts Bulk and
intermediary
0.033594
154 281111 Hydrogen fluoride (hydrofluoric acid) - 0.032435
155 291419 Acyclic ketones without other oxygen
function (excl. of 2914.11-2914.13)
Bulk and
intermediary
0.032412
156 293391 Alprazolam (INN), camazepam (INN),
chlordiazepoxide (INN), clonazepam
(INN), clorazepate, delorazepam (INN),
- 0.032389
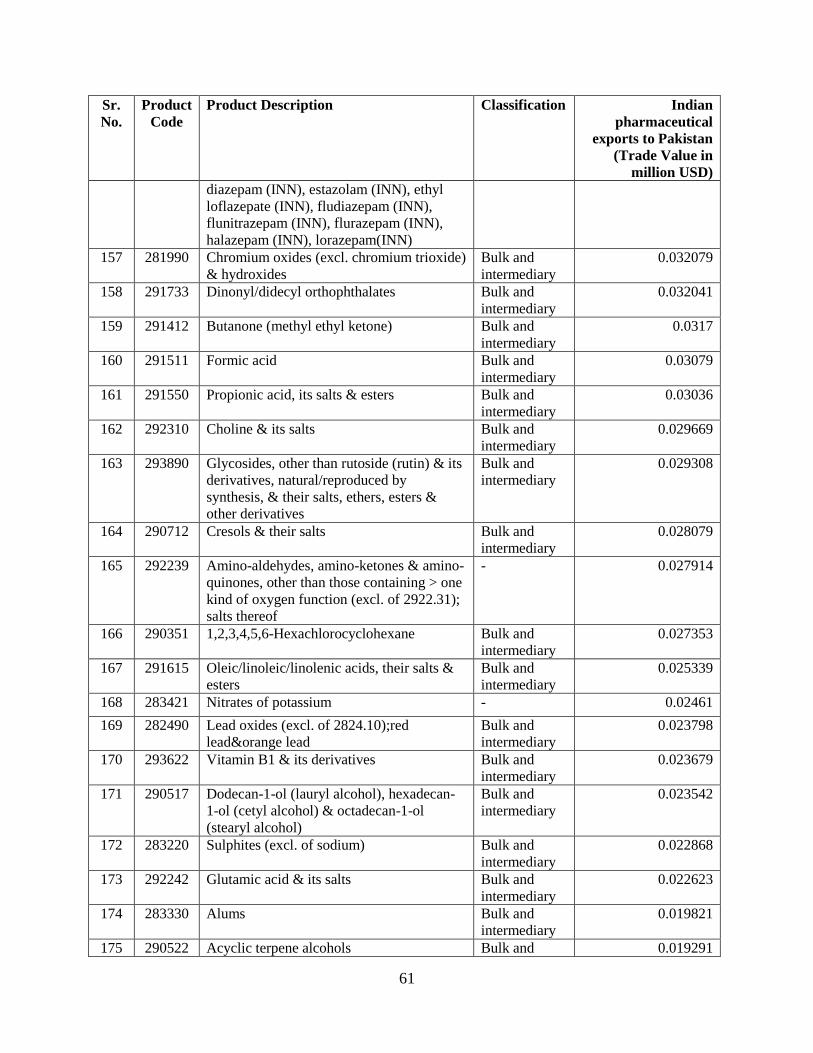
61
Sr.
No.
Product
Code
Product Description Classification Indian
pharmaceutical
exports to Pakistan
(Trade Value in
million USD)
diazepam (INN), estazolam (INN), ethyl
loflazepate (INN), fludiazepam (INN),
flunitrazepam (INN), flurazepam (INN),
halazepam (INN), lorazepam(INN)
157 281990 Chromium oxides (excl. chromium trioxide)
& hydroxides
Bulk and
intermediary
0.032079
158 291733 Dinonyl/didecyl orthophthalates Bulk and
intermediary
0.032041
159 291412 Butanone (methyl ethyl ketone) Bulk and
intermediary
0.0317
160 291511 Formic acid Bulk and
intermediary
0.03079
161 291550 Propionic acid, its salts & esters Bulk and
intermediary
0.03036
162 292310 Choline & its salts Bulk and
intermediary
0.029669
163 293890 Glycosides, other than rutoside (rutin) & its
derivatives, natural/reproduced by
synthesis, & their salts, ethers, esters &
other derivatives
Bulk and
intermediary
0.029308
164 290712 Cresols & their salts Bulk and
intermediary
0.028079
165 292239 Amino-aldehydes, amino-ketones & amino-
quinones, other than those containing > one
kind of oxygen function (excl. of 2922.31);
salts thereof
- 0.027914
166 290351 1,2,3,4,5,6-Hexachlorocyclohexane Bulk and
intermediary
0.027353
167 291615 Oleic/linoleic/linolenic acids, their salts &
esters
Bulk and
intermediary
0.025339
168 283421 Nitrates of potassium - 0.02461
169 282490 Lead oxides (excl. of 2824.10);red
lead&orange lead
Bulk and
intermediary
0.023798
170 293622 Vitamin B1 & its derivatives Bulk and
intermediary
0.023679
171 290517 Dodecan-1-ol (lauryl alcohol), hexadecan-
1-ol (cetyl alcohol) & octadecan-1-ol
(stearyl alcohol)
Bulk and
intermediary
0.023542
172 283220 Sulphites (excl. of sodium) Bulk and
intermediary
0.022868
173 292242 Glutamic acid & its salts Bulk and
intermediary
0.022623
174 283330 Alums Bulk and
intermediary
0.019821
175 290522 Acyclic terpene alcohols Bulk and 0.019291

62
Sr.
No.
Product
Code
Product Description Classification Indian
pharmaceutical
exports to Pakistan
(Trade Value in
million USD)
intermediary
176 292090 Esters of inorganic acids of non-metals
(excl. esters of hydrogen halides) & their
salts (excl.of 2919.00&2920.10); their
halogenated/sulphonated/nitrated/nitrosated
derivatives, n.e.s.
Bulk and
intermediary
0.018555
177 292519 Imides & their derivatives other than
saccharin & glutethimide (INN); salts
thereof
Bulk and
intermediary
0.018441
178 290359 Halogenated derivatives of
cyclanic/cyclenic/cycloterpenic
hydrocarbons (excl. of 2903.51 & 2903.52)
Bulk and
intermediary
0.018178
179 291219 Acyclic aldehydes without other oxygen
function (excl. of 2912.11&2912.12)
Bulk and
intermediary
0.01767
180 291524 Acetic anhydride Bulk and
intermediary
0.017587
181 293040 Methionine Bulk and
intermediary
0.016944
182 293941 Ephedrine & its salts Bulk and
intermediary
0.016222
183 284610 Cerium comps. - 0.015953
184 281129 Inorganic oxygen comps. of non-metals
(excl. of 2811.21& 2811.22),n.e.s.
- 0.015292
185 290329 Unsaturated chlorinated derivatives of
acyclic hydrocarbons (excl. of 2903.21-
2903.23)
Bulk and
intermediary
0.015097
186 291634 Phenylacetic acid & its salts Bulk and
intermediary
0.014261
187 292390 Quaternary ammonium salts & hydroxides;
lecithins & other phosphoaminolipids,
whether/not chemically defined (excl. of
2923.10 & 2923.20)
Bulk and
intermediary
0.014012
188 290559 Halogenated/sulphonated/nitrated/nitrosated
derivatives of acyclic alcohols, other than
ethchlorvynol (INN)
- 0.013501
189 280490 Selenium Bulk and
intermediary
0.01314
190 300290 Human blood; animal blood prepared for
therapeutic/prophylactic/diagnostic uses;
toxins, cultures of micro-organisms (excl.
yeasts) & similar products
Formulation 0.01229
191 294130 Tetracyclines & their derivatives; salts
thereof
Bulk and
intermediary
0.012082
192 293430 Compounds containing in the structure a
phenothiazine ring-system (whether/not
Bulk and
intermediary
0.011737
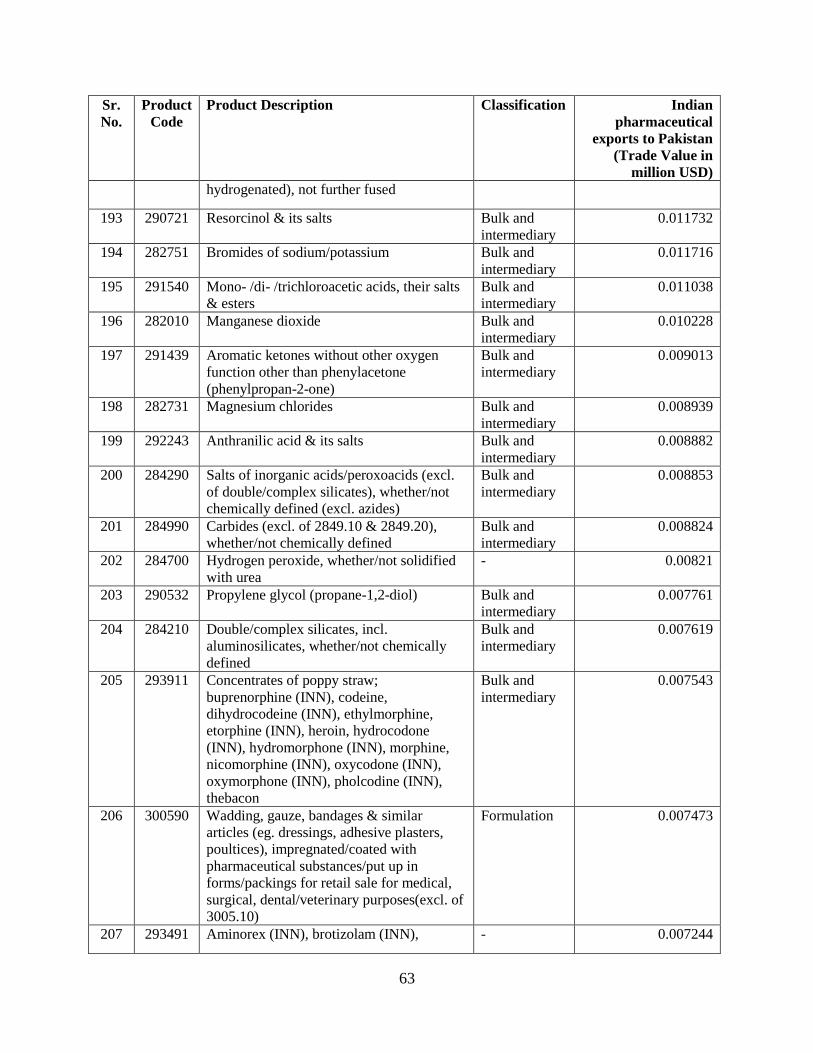
63
Sr.
No.
Product
Code
Product Description Classification Indian
pharmaceutical
exports to Pakistan
(Trade Value in
million USD)
hydrogenated), not further fused
193 290721 Resorcinol & its salts Bulk and
intermediary
0.011732
194 282751 Bromides of sodium/potassium Bulk and
intermediary
0.011716
195 291540 Mono- /di- /trichloroacetic acids, their salts
& esters
Bulk and
intermediary
0.011038
196 282010 Manganese dioxide Bulk and
intermediary
0.010228
197 291439 Aromatic ketones without other oxygen
function other than phenylacetone
(phenylpropan-2-one)
Bulk and
intermediary
0.009013
198 282731 Magnesium chlorides Bulk and
intermediary
0.008939
199 292243 Anthranilic acid & its salts Bulk and
intermediary
0.008882
200 284290 Salts of inorganic acids/peroxoacids (excl.
of double/complex silicates), whether/not
chemically defined (excl. azides)
Bulk and
intermediary
0.008853
201 284990 Carbides (excl. of 2849.10 & 2849.20),
whether/not chemically defined
Bulk and
intermediary
0.008824
202 284700 Hydrogen peroxide, whether/not solidified
with urea
- 0.00821
203 290532 Propylene glycol (propane-1,2-diol) Bulk and
intermediary
0.007761
204 284210 Double/complex silicates, incl.
aluminosilicates, whether/not chemically
defined
Bulk and
intermediary
0.007619
205 293911 Concentrates of poppy straw;
buprenorphine (INN), codeine,
dihydrocodeine (INN), ethylmorphine,
etorphine (INN), heroin, hydrocodone
(INN), hydromorphone (INN), morphine,
nicomorphine (INN), oxycodone (INN),
oxymorphone (INN), pholcodine (INN),
thebacon
Bulk and
intermediary
0.007543
206 300590 Wadding, gauze, bandages & similar
articles (eg. dressings, adhesive plasters,
poultices), impregnated/coated with
pharmaceutical substances/put up in
forms/packings for retail sale for medical,
surgical, dental/veterinary purposes(excl. of
3005.10)
Formulation 0.007473
207 293491 Aminorex (INN), brotizolam (INN), - 0.007244
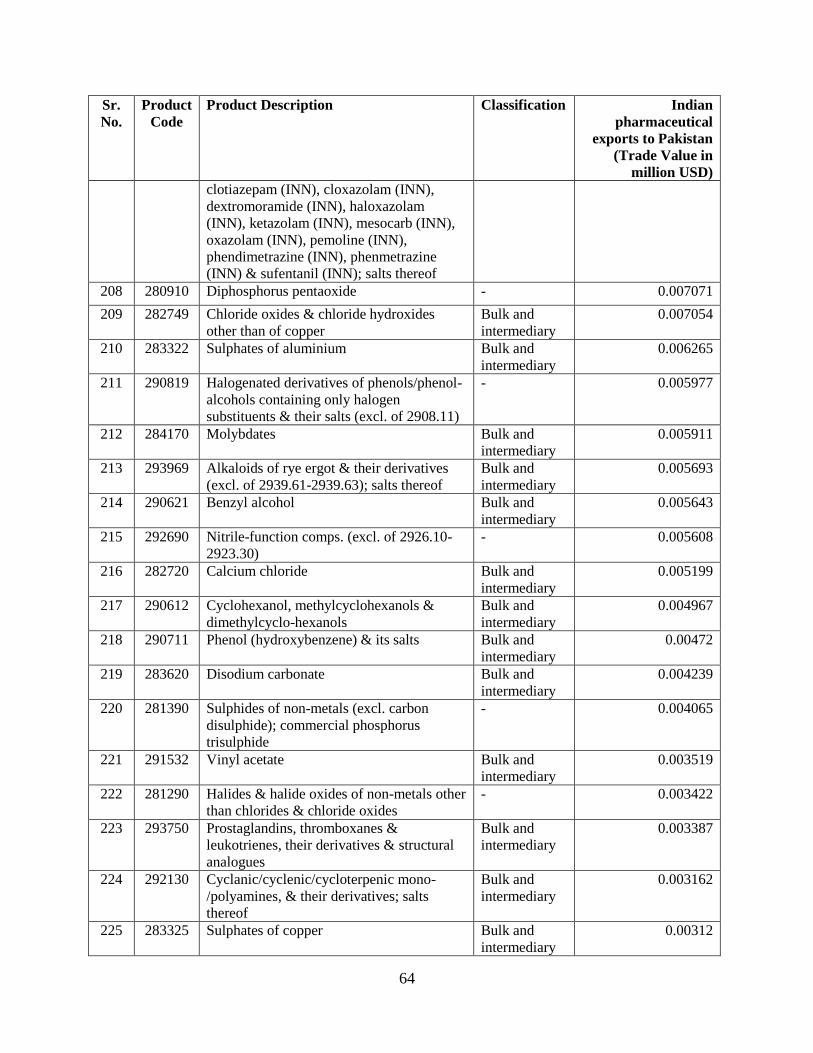
64
Sr.
No.
Product
Code
Product Description Classification Indian
pharmaceutical
exports to Pakistan
(Trade Value in
million USD)
clotiazepam (INN), cloxazolam (INN),
dextromoramide (INN), haloxazolam
(INN), ketazolam (INN), mesocarb (INN),
oxazolam (INN), pemoline (INN),
phendimetrazine (INN), phenmetrazine
(INN) & sufentanil (INN); salts thereof
208 280910 Diphosphorus pentaoxide - 0.007071
209 282749 Chloride oxides & chloride hydroxides
other than of copper
Bulk and
intermediary
0.007054
210 283322 Sulphates of aluminium Bulk and
intermediary
0.006265
211 290819 Halogenated derivatives of phenols/phenol-
alcohols containing only halogen
substituents & their salts (excl. of 2908.11)
- 0.005977
212 284170 Molybdates Bulk and
intermediary
0.005911
213 293969 Alkaloids of rye ergot & their derivatives
(excl. of 2939.61-2939.63); salts thereof
Bulk and
intermediary
0.005693
214 290621 Benzyl alcohol Bulk and
intermediary
0.005643
215 292690 Nitrile-function comps. (excl. of 2926.10-
2923.30)
- 0.005608
216 282720 Calcium chloride Bulk and
intermediary
0.005199
217 290612 Cyclohexanol, methylcyclohexanols &
dimethylcyclo-hexanols
Bulk and
intermediary
0.004967
218 290711 Phenol (hydroxybenzene) & its salts Bulk and
intermediary
0.00472
219 283620 Disodium carbonate Bulk and
intermediary
0.004239
220 281390 Sulphides of non-metals (excl. carbon
disulphide); commercial phosphorus
trisulphide
- 0.004065
221 291532 Vinyl acetate Bulk and
intermediary
0.003519
222 281290 Halides & halide oxides of non-metals other
than chlorides & chloride oxides
- 0.003422
223 293750 Prostaglandins, thromboxanes &
leukotrienes, their derivatives & structural
analogues
Bulk and
intermediary
0.003387
224 292130 Cyclanic/cyclenic/cycloterpenic mono-
/polyamines, & their derivatives; salts
thereof
Bulk and
intermediary
0.003162
225 283325 Sulphates of copper Bulk and
intermediary
0.00312
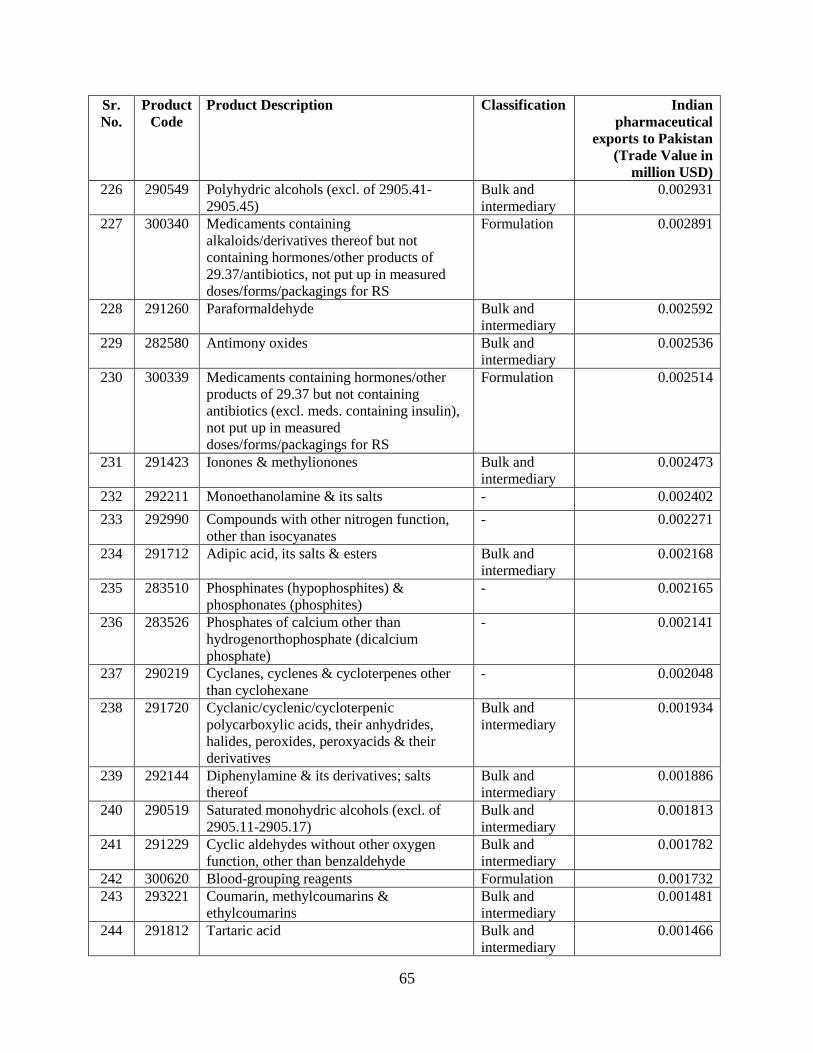
65
Sr.
No.
Product
Code
Product Description Classification Indian
pharmaceutical
exports to Pakistan
(Trade Value in
million USD)
226 290549 Polyhydric alcohols (excl. of 2905.41-
2905.45)
Bulk and
intermediary
0.002931
227 300340 Medicaments containing
alkaloids/derivatives thereof but not
containing hormones/other products of
29.37/antibiotics, not put up in measured
doses/forms/packagings for RS
Formulation 0.002891
228 291260 Paraformaldehyde Bulk and
intermediary
0.002592
229 282580 Antimony oxides Bulk and
intermediary
0.002536
230 300339 Medicaments containing hormones/other
products of 29.37 but not containing
antibiotics (excl. meds. containing insulin),
not put up in measured
doses/forms/packagings for RS
Formulation 0.002514
231 291423 Ionones & methylionones Bulk and
intermediary
0.002473
232 292211 Monoethanolamine & its salts - 0.002402
233 292990 Compounds with other nitrogen function,
other than isocyanates
- 0.002271
234 291712 Adipic acid, its salts & esters Bulk and
intermediary
0.002168
235 283510 Phosphinates (hypophosphites) &
phosphonates (phosphites)
- 0.002165
236 283526 Phosphates of calcium other than
hydrogenorthophosphate (dicalcium
phosphate)
- 0.002141
237 290219 Cyclanes, cyclenes & cycloterpenes other
than cyclohexane
- 0.002048
238 291720 Cyclanic/cyclenic/cycloterpenic
polycarboxylic acids, their anhydrides,
halides, peroxides, peroxyacids & their
derivatives
Bulk and
intermediary
0.001934
239 292144 Diphenylamine & its derivatives; salts
thereof
Bulk and
intermediary
0.001886
240 290519 Saturated monohydric alcohols (excl. of
2905.11-2905.17)
Bulk and
intermediary
0.001813
241 291229 Cyclic aldehydes without other oxygen
function, other than benzaldehyde
Bulk and
intermediary
0.001782
242 300620 Blood-grouping reagents Formulation 0.001732
243 293221 Coumarin, methylcoumarins &
ethylcoumarins
Bulk and
intermediary
0.001481
244 291812 Tartaric acid Bulk and
intermediary
0.001466
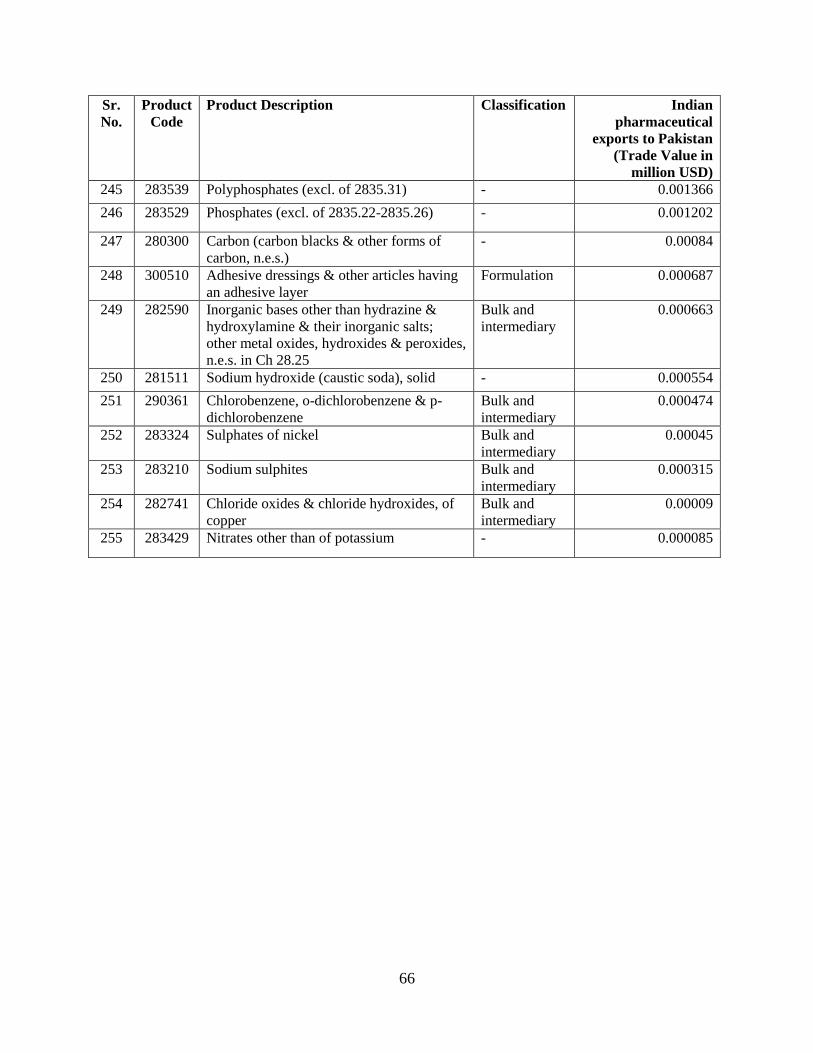
66
Sr.
No.
Product
Code
Product Description Classification Indian
pharmaceutical
exports to Pakistan
(Trade Value in
million USD)
245 283539 Polyphosphates (excl. of 2835.31) - 0.001366
246 283529 Phosphates (excl. of 2835.22-2835.26) - 0.001202
247 280300 Carbon (carbon blacks & other forms of
carbon, n.e.s.)
- 0.00084
248 300510 Adhesive dressings & other articles having
an adhesive layer
Formulation 0.000687
249 282590 Inorganic bases other than hydrazine &
hydroxylamine & their inorganic salts;
other metal oxides, hydroxides & peroxides,
n.e.s. in Ch 28.25
Bulk and
intermediary
0.000663
250 281511 Sodium hydroxide (caustic soda), solid - 0.000554
251 290361 Chlorobenzene, o-dichlorobenzene & p-
dichlorobenzene
Bulk and
intermediary
0.000474
252 283324 Sulphates of nickel Bulk and
intermediary
0.00045
253 283210 Sodium sulphites Bulk and
intermediary
0.000315
254 282741 Chloride oxides & chloride hydroxides, of
copper
Bulk and
intermediary
0.00009
255 283429 Nitrates other than of potassium - 0.000085
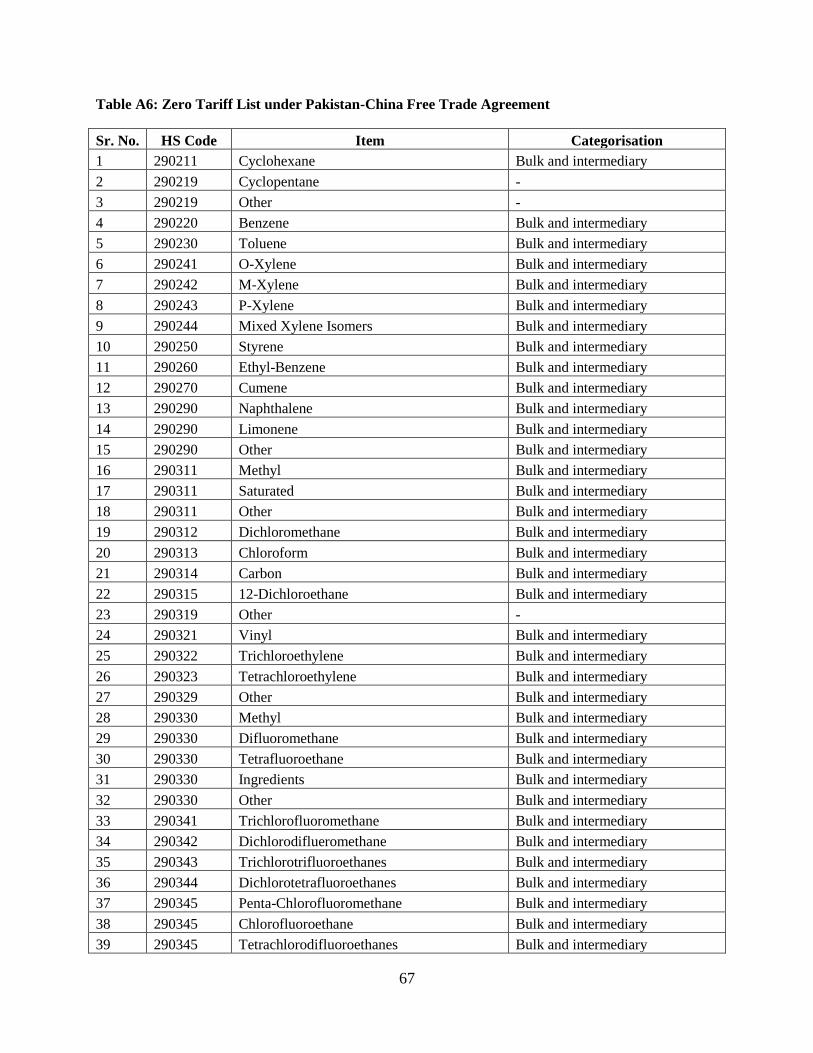
67
Table A6: Zero Tariff List under Pakistan-China Free Trade Agreement
Sr. No. HS Code Item Categorisation
1 290211 Cyclohexane Bulk and intermediary
2 290219 Cyclopentane -
3 290219 Other -
4 290220 Benzene Bulk and intermediary
5 290230 Toluene Bulk and intermediary
6 290241 O-Xylene Bulk and intermediary
7 290242 M-Xylene Bulk and intermediary
8 290243 P-Xylene Bulk and intermediary
9 290244 Mixed Xylene Isomers Bulk and intermediary
10 290250 Styrene Bulk and intermediary
11 290260 Ethyl-Benzene Bulk and intermediary
12 290270 Cumene Bulk and intermediary
13 290290 Naphthalene Bulk and intermediary
14 290290 Limonene Bulk and intermediary
15 290290 Other Bulk and intermediary
16 290311 Methyl Bulk and intermediary
17 290311 Saturated Bulk and intermediary
18 290311 Other Bulk and intermediary
19 290312 Dichloromethane Bulk and intermediary
20 290313 Chloroform Bulk and intermediary
21 290314 Carbon Bulk and intermediary
22 290315 12-Dichloroethane Bulk and intermediary
23 290319 Other -
24 290321 Vinyl Bulk and intermediary
25 290322 Trichloroethylene Bulk and intermediary
26 290323 Tetrachloroethylene Bulk and intermediary
27 290329 Other Bulk and intermediary
28 290330 Methyl Bulk and intermediary
29 290330 Difluoromethane Bulk and intermediary
30 290330 Tetrafluoroethane Bulk and intermediary
31 290330 Ingredients Bulk and intermediary
32 290330 Other Bulk and intermediary
33 290341 Trichlorofluoromethane Bulk and intermediary
34 290342 Dichlorodiflueromethane Bulk and intermediary
35 290343 Trichlorotrifluoroethanes Bulk and intermediary
36 290344 Dichlorotetrafluoroethanes Bulk and intermediary
37 290345 Penta-Chlorofluoromethane Bulk and intermediary
38 290345 Chlorofluoroethane Bulk and intermediary
39 290345 Tetrachlorodifluoroethanes Bulk and intermediary

68
Sr. No. HS Code Item Categorisation
40 290345 Heptachlorofluoropropanes Bulk and intermediary
41 290345 Hexachlorodifluoropropanes Bulk and intermediary
42 290345 Trichloropentafluoropropanes Bulk and intermediary
43 290345 Dichlorohexafluoropropanes Bulk and intermediary
44 290345 Other Bulk and intermediary
45 290346 Bromochlorodifluoromethane Bulk and intermediary
46 290347 Other Bulk and intermediary
47 290349 Chlordifloromethane -
48 290349 Other -
49 290351 Other Bulk and intermediary
50 290359 Other Bulk and intermediary
51 290361 Chlorobenzene Bulk and intermediary
52 290361 O-Dichlorobenzene Bulk and intermediary
53 290361 P-Dichlorobenzene Bulk and intermediary
54 290362 Hexachlorobenze -
55 290369 Other Bulk and intermediary
56 290410 Benzene Bulk and intermediary
57 290410 Other Bulk and intermediary
58 290420 Nirobenzene Bulk and intermediary
59 290420 Other Bulk and intermediary
60 290490 Other Bulk and intermediary
61 290711 Phenol Bulk and intermediary
62 290712 Cresols Bulk and intermediary
63 290713 Octylphenol Bulk and intermediary
64 290714 Xylenols Bulk and intermediary
65 290715 Naphthols Bulk and intermediary
66 290719 Other Bulk and intermediary
67 290721 Resorcinol Bulk and intermediary
68 290722 Hydroquinone Bulk and intermediary
69 290723 4'-Isopropylidenediphenol (Bisphenol Bulk and intermediary
70 290729 Other Bulk and intermediary
71 290810 4-Chloro Bulk and intermediary
72 290810 Other Bulk and intermediary
73 290820 Derivatives Bulk and intermediary
74 290890 Other Bulk and intermediary
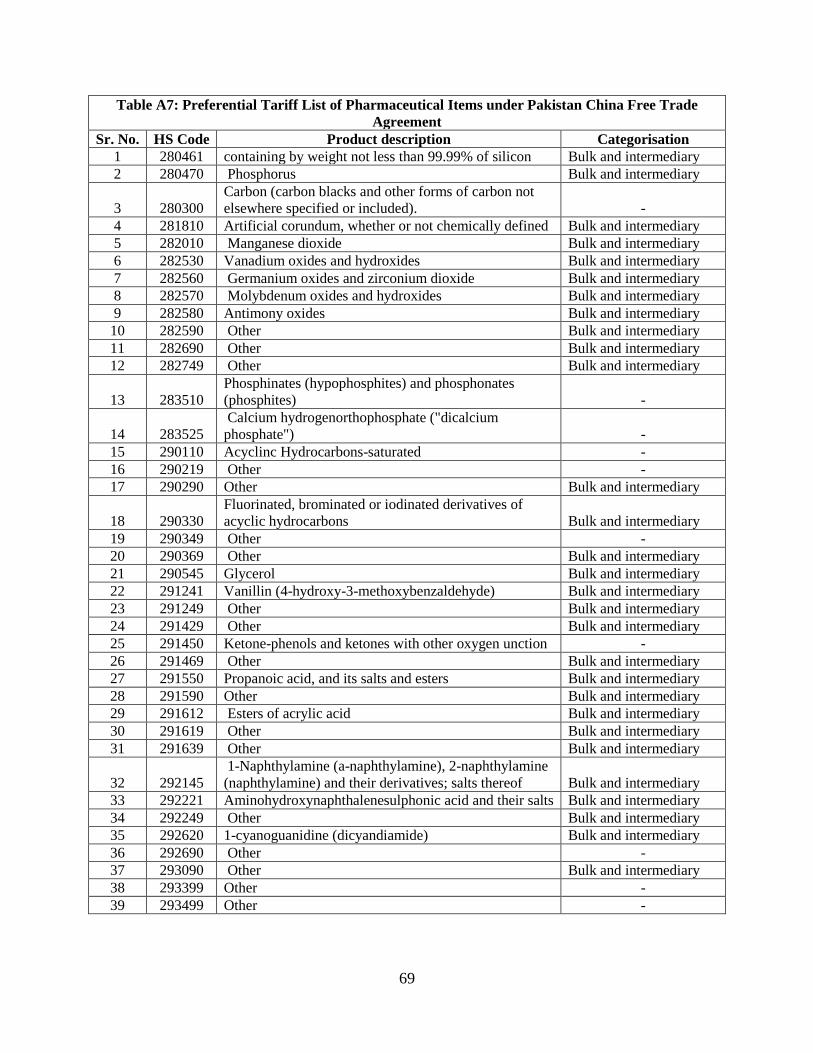
69
Table A7: Preferential Tariff List of Pharmaceutical Items under Pakistan China Free Trade
Agreement
Sr. No. HS Code Product description Categorisation
1 280461 containing by weight not less than 99.99% of silicon Bulk and intermediary
2 280470 Phosphorus Bulk and intermediary
3 280300
Carbon (carbon blacks and other forms of carbon not
elsewhere specified or included). -
4 281810 Artificial corundum, whether or not chemically defined Bulk and intermediary
5 282010 Manganese dioxide Bulk and intermediary
6 282530 Vanadium oxides and hydroxides Bulk and intermediary
7 282560 Germanium oxides and zirconium dioxide Bulk and intermediary
8 282570 Molybdenum oxides and hydroxides Bulk and intermediary
9 282580 Antimony oxides Bulk and intermediary
10 282590 Other Bulk and intermediary
11 282690 Other Bulk and intermediary
12 282749 Other Bulk and intermediary
13 283510
Phosphinates (hypophosphites) and phosphonates
(phosphites) -
14 283525
Calcium hydrogenorthophosphate ("dicalcium
phosphate") -
15 290110 Acyclinc Hydrocarbons-saturated -
16 290219 Other -
17 290290 Other Bulk and intermediary
18 290330
Fluorinated, brominated or iodinated derivatives of
acyclic hydrocarbons Bulk and intermediary
19 290349 Other -
20 290369 Other Bulk and intermediary
21 290545 Glycerol Bulk and intermediary
22 291241 Vanillin (4-hydroxy-3-methoxybenzaldehyde) Bulk and intermediary
23 291249 Other Bulk and intermediary
24 291429 Other Bulk and intermediary
25 291450 Ketone-phenols and ketones with other oxygen unction -
26 291469 Other Bulk and intermediary
27 291550 Propanoic acid, and its salts and esters Bulk and intermediary
28 291590 Other Bulk and intermediary
29 291612 Esters of acrylic acid Bulk and intermediary
30 291619 Other Bulk and intermediary
31 291639 Other Bulk and intermediary
32 292145
1-Naphthylamine (a-naphthylamine), 2-naphthylamine
(naphthylamine) and their derivatives; salts thereof Bulk and intermediary
33 292221 Aminohydroxynaphthalenesulphonic acid and their salts Bulk and intermediary
34 292249 Other Bulk and intermediary
35 292620 1-cyanoguanidine (dicyandiamide) Bulk and intermediary
36 292690 Other -
37 293090 Other Bulk and intermediary
38 293399 Other -
39 293499 Other -
70
LATEST ICRIER’S WORKING PAPERS
NO. TITLE Author YEAR
274 ENHANCING INDIA-PAKISTAN
ECONOMIC COOPERATION:
PROSPECTS FOR INDIAN
INVESTMENT IN PAKISTAN
PALAKH JAIN AND
SAMRIDHI BIMAL
MAY 2014
273 SECURITIES TRANSACTION TAX-
CASE STUDY OF INDIA
NEHA MALIK APRIL 2014
272 IMPACT OF TRANSACTION TAXES
ON COMMODITY DERIVATIVES
TRADING IN INDIA
SAON RAY
NEHA MALIK
MARCH 2014
271 FEEDSTOCK FOR THE
PETROCHEMICAL INDUSTRY
SAON RAY
AMRITA GOLDAR
SWATI SALUJA
FEBRUARY
2014
270 USING IPRS TO PROTECT NICHES?
EVIDENCE FROM THE INDIAN
TEXTILE AND APPAREL INDUSTRY
SUPARNA
KARMAKAR MEENU
TEWARI
JANUARY
2014
269 MONSOON 2013: ESTIMATING THE
IMPACT ON AGRICULTURE
ASHOK GULATI
SHWETA SAINI
SURBHI JAIN
December 2013
268 REMOTENESS AND UNBALANCED
GROWTH:
UNDERSTANDING DIVERGENCE
ACROSS
INDIAN DISTRICTS
SAMARJIT DAS
CHETAN GHATE
PETER E.
ROBERTSON
SEPTEMBER
2013
267 NORMALIZING INDIA PAKISTAN
TRADE
NISHA TANEJA
MISHITA MEHRA
PRITHVIJIT
MUKHERJEE
SAMRIDHI BIMAL
ISHA DAYAL
SEPTEMBER
2013
266 RECESSION AND CHILD LABOR:
A THEORETICAL ANALYSIS
SAHANA ROY
CHOWDHURY
APRIL 2013
71
About ICRIER
Established in August 1981, ICRIER is an autonomous, policy-oriented, not-for-profit, economic
policy think tank. ICRIER's main focus is to enhance the knowledge content of policy making by
undertaking analytical research that is targeted at informing India's policy makers and also at
improving the interface with the global economy. ICRIER's office is located in the institutional
complex of India Habitat Centre, New Delhi.
ICRIER's Board of Governors includes leading academicians, policymakers, and representatives
from the private sector. Dr. Isher Ahluwalia is ICRIER's chairperson. Dr. Rajat Kathuria is
Director and Chief Executive.
ICRIER conducts thematic research in the following seven thrust areas:
Macro-economic Management in an Open Economy
Trade, Openness, Restructuring and Competitiveness
Financial Sector Liberalisation and Regulation
WTO-related Issues
Regional Economic Co-operation with Focus on South Asia
Strategic Aspects of India's International Economic Relations
Environment and Climate Change
To effectively disseminate research findings, ICRIER organises workshops, seminars and
conferences to bring together academicians, policymakers, representatives from industry and
media to create a more informed understanding on issues of major policy interest. ICRIER
routinely invites distinguished scholars and policymakers from around the world to deliver
public lectures and give seminars on economic themes of interest to contemporary India.


![2[1]. Strengthening Indian Agriculture Surabhi ICRIER](https://img.pdfslide.us/doc/110x75/577cdc501a28ab9e78aa4b24/21-strengthening-indian-agriculture-surabhi-icrier.jpg)