Embed Size (px)
Citation preview

Work in Progress Paper:LNG Consumption: Prospects of World and Asian Demand in the Face of Nuclear Energy EvolutionWilliam Clavijo
Niagara Rodrigues
Edmar de Almeida
Renato Queiroz

Contents
Contextualization
Model
Discussion
Concluding remarks
ContextualizationAccelerated growth in the global LNG market during the last decade - an average of 7% between 2000 and 2014.
Main factors:
Issues related to security of supply of fossil energy sources in remoted areas
High oil prices

Contextualization
Source: IGU, 2016
Figure 1. LNG Trade Volumes, 1990 - 2015
244.8 MTPA in 2015
Natural Gas responds for 25% of the global energy demand of which, 10% is supplied through LNG cargoes.
Contextualization
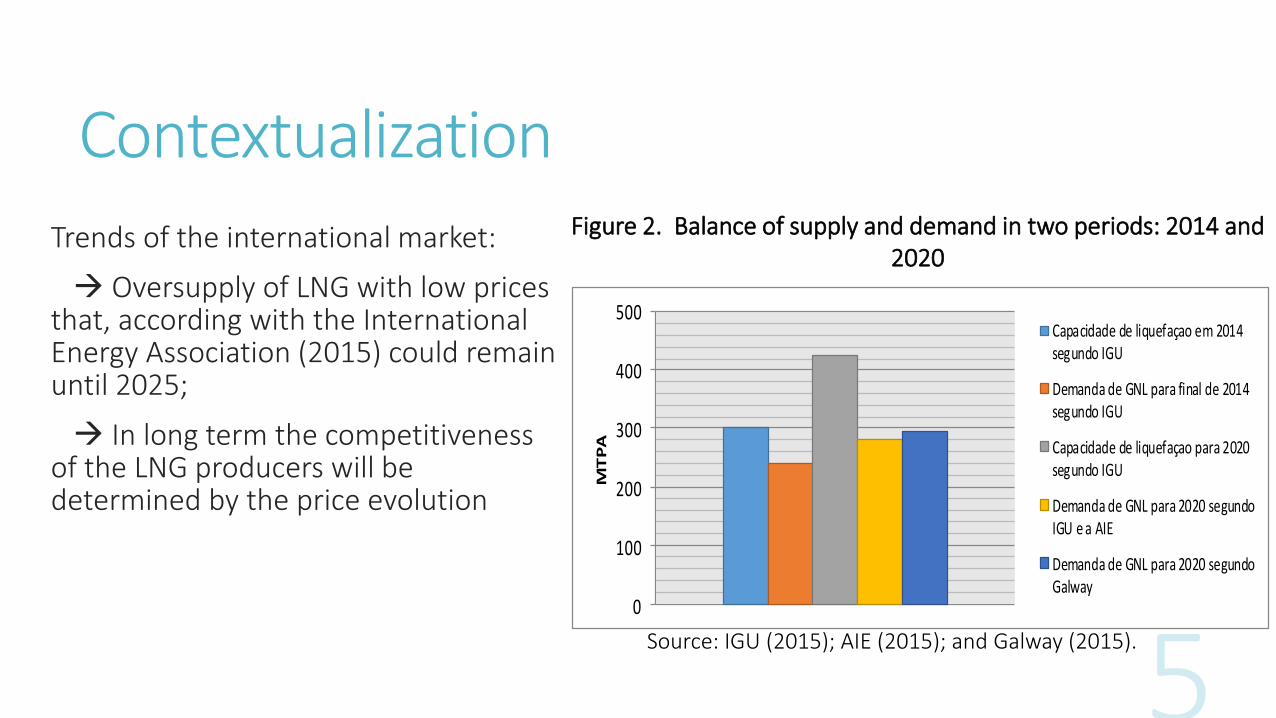
Trends of the international market:
Oversupply of LNG with low prices that, according with the International Energy Association (2015) could remain until 2025;
In long term the competitiveness of the LNG producers will be determined by the price evolution
0
100
200
300
400
500
MT
PA
Capacidade de liquefaçao em 2014segundo IGU
Demanda de GNL para final de 2014segundo IGU
Capacidade de liquefaçao para 2020segundo IGU
Demanda de GNL para 2020 segundoIGU e a AIE
Demanda de GNL para 2020 segundoGalway
Figure 2. Balance of supply and demand in two periods: 2014 and 2020
Source: IGU (2015); AIE (2015); and Galway (2015).

Contextualization
Figure 3. Global demand for natural gas by sector in BCM
Expressive participation of the natural gas on the power electricity generation
Source: IEA, 2015

Contextualization
Figure 4. Electricity demand in TWh
Source: IEA, 2015
2013: 23.650 TWh2020: 26.226 TWh2030: 28.976TWH
“The Asian countries as the driver of the global electricity demand”

Contextualization
Uncertainties regarding the behavior of energy policies in the coming years and the efforts in the replacing on the fossil fuels consumption;
The rapid growth of renewable and nuclear energies; The speed of Japan's return to nuclear power and the pace of expansion of renewable energy
sources;
The speed of growth of Chinese demand;
Chinese domestic production of natural gas;
Volume growth of Chinese imports of natural gas by pipeline; and
Increased demand for LNG as a marine fuel (Bunkers).
The role of nuclear energy
Nuclear Energy represented 11% of the global electricity generation (IEA, 2015).
It´s important participation in the energy matrix in remote countries.
It´s significant growth in Asia, mainly in China, Japan , India and Korea.
The return of Japan to nuclear energy and its goals for 2030
Of 65 nuclear reactors under construction for 2014, 37 are located in Asian countries

Objective Estimate the global and Asian LNG demand considering the expansion of the nuclear energy capacity.
Simulate different future scenarios

Global demand case

Methodology
Time Serie - Error Correction Vector (VEC) from 1977 to 2013
Variables used so far
𝐷𝑔𝑛𝑙𝑡 = 𝛽0 + 𝛽1𝐶𝑒𝑛𝑒𝑙𝑡 + 𝛽2𝑁𝑢𝑐𝑙𝑡 + 𝛽3𝐷𝐹 + 𝜇
𝐷𝑔𝑛𝑙𝑡 World LNG Demand
𝐶𝑒𝑛𝑒𝑙𝑡 World electricity consumption
𝑁𝑢𝑐𝑙𝑡 World nuclear energy production
𝐷𝐹 Dummy for the Fukushima accident

Methodology
Table 1. Average growth rates during the period and projection of the Base Scenario
Source: IEA (2015)
Table 2. Hypothesis of future growth rates
Source: Prepared by the author from WEC/WES (2013), SHELL (2013), IEA (2015) e IAEA/RDS-1
LNG Demand Estimation Scenarios
World (%a.a.)Historical Projection
1977 - 1994 1994 - 2013 2013 - 2020 2020 - 2030
Electric energy consumption 3,32 3,13 2,03 2,05
Nuclear energy production 8,77 0,32 3,2 2,08
World (%a.a.)Projection
2013 - 2020 2020 - 2030
High Nuclear 7,17 3,01
Low Nuclear 1,23 1,4

Preliminary results
The dummy (DF) is not significant and did not capture the expected outcome - the shutdown of Japanese nuclear power plants did not represent a significant impact on the variation in the global demand for LNG.
𝐷𝑔𝑛𝑙𝑡 = 11,18 + 1,64 𝐶𝑒𝑛𝑒𝑙𝑡 − 0,35 𝑁𝑢𝑐𝑙 − 0,25 𝐷𝐹
Estimation of global LNG demand and observed values in the period 1977 - 2013

Preliminary resultsFigure 6: Projected global demand for LNG
Source: Own elaboration of the authors

Preliminary results
AnoCenários (MTPA)
Baixo Nuclear Alto Nuclear
2014 251,86 251,86
2020 268,03 262,76
2025 296,27 282,57
2030 324,05 300,69
Table 3. Projected global demand for LNG: 2014-2030
Source: research results.

CONCLUSION
Small interrelationship between the nuclear and LNG markets - low sensitivity found in the model: 0.35
The medium-term scenario is an over-supply of LNG in the market
The growth in demand will be conditioned by the performance of Asia (in particular China);

Thank you