Embed Size (px)
Citation preview
Working in Early Care and Education in North Carolina
2014 Workforce Study
December, 2014
Child Care Services Association
Working in Early Care and Education in North Carolina
2014 Working in Child Care in North Carolina l Child Care Services Association, 2014
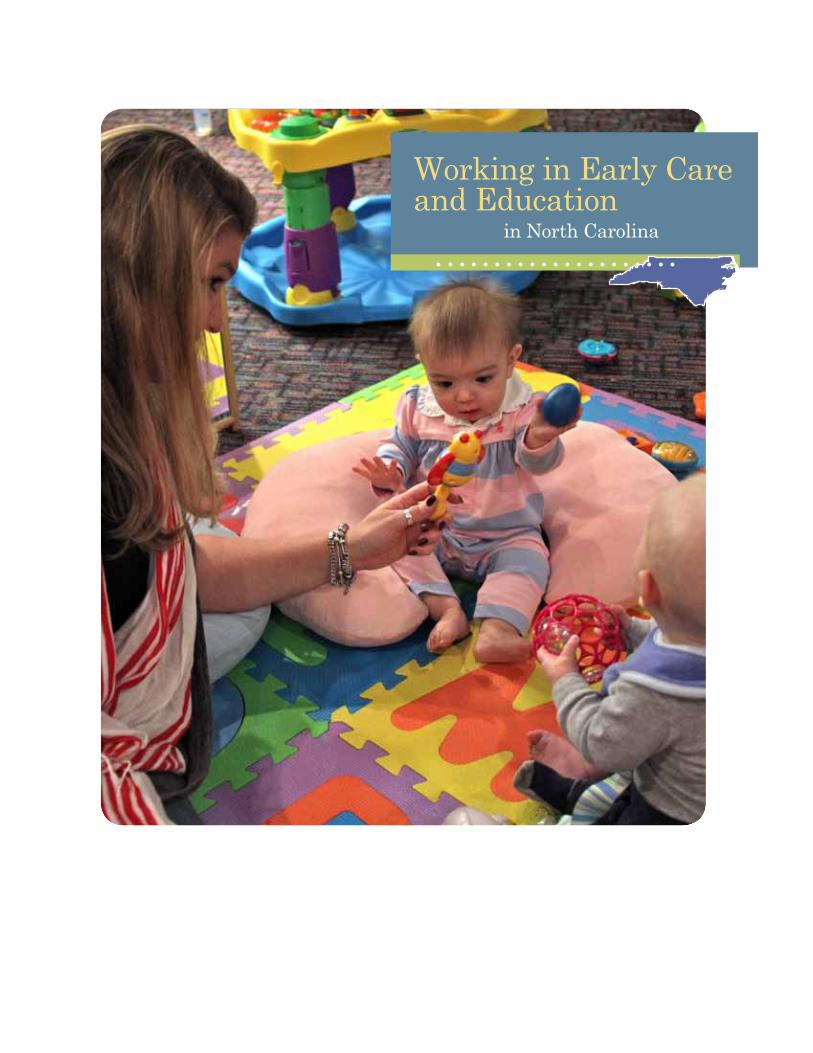
Introduction . . . . . . . . . . . . . . . . . . . . . . . . . . . . . . . . . . . . . . . . . . . . . . . . . . . . . . . . . . . . . . . . . . .1
Findings . . . . . . . . . . . . . . . . . . . . . . . . . . . . . . . . . . . . . . . . . . . . . . . . . . . . . . . . . . . . . . . . . . . . . .3 Early Care and Education (ECE) Centers . . . . . . . . . . . . . . . . . . . . . . . . . . . . . . . . . . . . . . . . . . . . . .3 Star Rating, Organizational Structure, and Regional Differences . . . . . . . . . . . . . . . . . . . . . . . . . . . . . . . .3 Staffing . . . . . . . . . . . . . . . . . . . . . . . . . . . . . . . . . . . . . . . . . . . . . . . . . . . . . . . . . . . . . . . . . .5 Wage Scales . . . . . . . . . . . . . . . . . . . . . . . . . . . . . . . . . . . . . . . . . . . . . . . . . . . . . . . . . . . . . . .5 Wage Scales of Regions . . . . . . . . . . . . . . . . . . . . . . . . . . . . . . . . . . . . . . . . . . . . . . . . . . . . . . . .8
Employment Benefits . . . . . . . . . . . . . . . . . . . . . . . . . . . . . . . . . . . . . . . . . . . . . . . . . . . . . . . . .8 Overtime Pay . . . . . . . . . . . . . . . . . . . . . . . . . . . . . . . . . . . . . . . . . . . . . . . . . . . . . . . . . . . . . .9
Family Child Care Homes (FCC) . . . . . . . . . . . . . . . . . . . . . . . . . . . . . . . . . . . . . . . . . . . . . . . . . . . 10 Earnings and Expenditures . . . . . . . . . . . . . . . . . . . . . . . . . . . . . . . . . . . . . . . . . . . . . . . . . . . . . 10
Benefits . . . . . . . . . . . . . . . . . . . . . . . . . . . . . . . . . . . . . . . . . . . . . . . . . . . . . . . . . . . . . . . . . 11
Profile of the Early Care and Education Workforce . . . . . . . . . . . . . . . . . . . . . . . . . . . . . . . . . . . . . . 11 Education of the Early Care and Education Workforce . . . . . . . . . . . . . . . . . . . . . . . . . . . . . . . . . . . . . 12
Education of Teachers and Assistant Teachers by Age Group Taught . . . . . . . . . . . . . . . . . . . . . . . . . . . 13 Education by Regions . . . . . . . . . . . . . . . . . . . . . . . . . . . . . . . . . . . . . . . . . . . . . . . . . . . . . . . 14 Earnings of the Early Care and Education Workforce . . . . . . . . . . . . . . . . . . . . . . . . . . . . . . . . . . . . . . 15 Wage Trends . . . . . . . . . . . . . . . . . . . . . . . . . . . . . . . . . . . . . . . . . . . . . . . . . . . . . . . . . . . . 16 Earnings of Teachers and Assistant Teachers by Age Group Taught . . . . . . . . . . . . . . . . . . . . . . . . . . . . 18 Earnings by Region . . . . . . . . . . . . . . . . . . . . . . . . . . . . . . . . . . . . . . . . . . . . . . . . . . . . . . . . . 18 Economic Well Being of the Early Care and Education Workforce . . . . . . . . . . . . . . . . . . . . . . . . . . . . . . 18 Professional Support for the Early Care and Education Workforce . . . . . . . . . . . . . . . . . . . . . . . . . . . . . . 20 The T .E .A .C .H . Early Childhood® Project . . . . . . . . . . . . . . . . . . . . . . . . . . . . . . . . . . . . . . . . . . . . 20 Salary Supplements . . . . . . . . . . . . . . . . . . . . . . . . . . . . . . . . . . . . . . . . . . . . . . . . . . . . . . . . 20 Other Center-Provided Support . . . . . . . . . . . . . . . . . . . . . . . . . . . . . . . . . . . . . . . . . . . . . . . . . 21
Experience and Turnover of the Child Care Workforce . . . . . . . . . . . . . . . . . . . . . . . . . . . . . . . . . . . . . 21 Experience and Turnover by Age Group Taught . . . . . . . . . . . . . . . . . . . . . . . . . . . . . . . . . . . . . . 22 Experience in ECE Field by Region . . . . . . . . . . . . . . . . . . . . . . . . . . . . . . . . . . . . . . . . . . . . . . . 23 Workforce Retention . . . . . . . . . . . . . . . . . . . . . . . . . . . . . . . . . . . . . . . . . . . . . . . . . . . . . . . . 24
Conclusion . . . . . . . . . . . . . . . . . . . . . . . . . . . . . . . . . . . . . . . . . . . . . . . . . . . . . . . . . . . . . . . . 26
Appendices A North Carolina Regional CCR&R system - map . . . . . . . . . . . . . . . . . . . . . . . . . . . . . . . . . . . . . . . . . 30 B Survey Methods and Response Rates . . . . . . . . . . . . . . . . . . . . . . . . . . . . . . . . . . . . . . . . . . . . . . . 31 C Definition of Terms . . . . . . . . . . . . . . . . . . . . . . . . . . . . . . . . . . . . . . . . . . . . . . . . . . . . . . . . . . 35 D NC Counties by Type of Urbanization . . . . . . . . . . . . . . . . . . . . . . . . . . . . . . . . . . . . . . . . . . . . . . . 36
Acknowledgements . . . . . . . . . . . . . . . . . . . . . . . . . . . . . . . . . . . . . . . . . . . . . . . . . . . . . . . . . . . . 37
List of TablesTable 1 Regional Distribution of Centers by Star Level, Type of Organization, and Capacity . . . . . . . . . . . . . . . . . .3Table 2 Birth to Five Enrollment in Centers by Star Rating & Organizational Structure by Region . . . . . . . . . . . . . . .4Table 3 Median Hourly Wages in Centers Statewide and for Centers by NC Pre-K Classroom Designation . . . . . . . . . . . . . . . . . . . . . . . . . . . . . . . . . . . . . . . . . .5Table 4 Wages of ECE Teaching Staff in NC by NC Pre-K Classroom Designation . . . . . . . . . . . . . . . . . . . . . . . . .6Table 5 Median Wage Scales in Centers by Region . . . . . . . . . . . . . . . . . . . . . . . . . . . . . . . . . . . . . . . . . . .8Table 6 Employment Benefits in ECE Centers . . . . . . . . . . . . . . . . . . . . . . . . . . . . . . . . . . . . . . . . . . . . . .8Table 7 Health Insurance and Wages by Auspice . . . . . . . . . . . . . . . . . . . . . . . . . . . . . . . . . . . . . . . . . . . .9Table 8 Demographic Profile of Early Childhood Workforce in North Carolina . . . . . . . . . . . . . . . . . . . . . . . . . 11
Table of Contents
2014 Working in Child Care in North Carolina l Child Care Services Association, 2014
Table 9 Education of Center Directors, Teachers, Assistant Teachers, and Family Child Care Providers . . . . . . . . . . . 12Table 10 Education Levels by Region . . . . . . . . . . . . . . . . . . . . . . . . . . . . . . . . . . . . . . . . . . . . . . . . . . . 14Table 11 Self-Reported Earnings of the Early Care and Education Workforce . . . . . . . . . . . . . . . . . . . . . . . . . . . 15Table 12 Director, Teacher, Teacher Assistant, and FCC Provider Earnings by Region . . . . . . . . . . . . . . . . . . . . . . 18Table 13 Individual Economic Well Being of Child Care Providers . . . . . . . . . . . . . . . . . . . . . . . . . . . . . . . . . . 19Table 14 Professional Support Benefits in Child Care Centers . . . . . . . . . . . . . . . . . . . . . . . . . . . . . . . . . . . . 21Table 15 ECE Workforce Experience . . . . . . . . . . . . . . . . . . . . . . . . . . . . . . . . . . . . . . . . . . . . . . . . . . . . 21Table 16 ECE Workforce Turnover . . . . . . . . . . . . . . . . . . . . . . . . . . . . . . . . . . . . . . . . . . . . . . . . . . . . . 22Table 17 Median Years of Experience by Type of Staff and Region . . . . . . . . . . . . . . . . . . . . . . . . . . . . . . . . . 23Table 18 Factors Motivating ECE Directors and FCC Providers to Stay in the Field . . . . . . . . . . . . . . . . . . . . . . . . 24
List of FiguresFigure 1 Benefits in Programs With and Without NC Pre-K Classrooms . . . . . . . . . . . . . . . . . . . . . . . . . . . . . . .9Figure 2 Teacher Educational Gains Over Time . . . . . . . . . . . . . . . . . . . . . . . . . . . . . . . . . . . . . . . . . . . . . 13Figure 3 Percent of Teaching Staff with an ECE Related Degree by Age Group Taught . . . . . . . . . . . . . . . . . . . . . 14Figure 4 Median Hourly Wage of Teachers by Level of Education . . . . . . . . . . . . . . . . . . . . . . . . . . . . . . . . . 16Figure 5 Self Reported Wages of Preschool Teachers in Centers With and Without NC Pre-K Classrooms . . . . . . . . . . 17Figure 6 Factors Motivating Teaching Staff to Stay in the Field . . . . . . . . . . . . . . . . . . . . . . . . . . . . . . . . . . . 25Figure 7 Median Wage of Teaching Staff, by Educational Level, Community Type, and Auspices . . . . . . . . . . . . . . 27Figure 8 Educational Attainment of Center Based Teachers and Teaching Staff by Age of Children Served . . . . . . . . 28
Table of Contents
With funding from the Division of Child Development and Early Education, through a Race to the Top Early Learning Challenge Grant, Child Care Services Association (CCSA) conducted a statewide survey of the early care and education workforce in North Carolina from February 2014 through October 2014 . This study provides comprehensive data on teachers, assistant teachers, and directors in early care and education centers and family child care providers and on the licensed early care and education programs in which they work . Licensed centers include programs operated by public schools, for-profit entities, and not-for-profit entities, including Head Start . Additional information from similar studies conducted by CCSA in 2011 - 2013 is also provided . Comparison of the data from these surveys enables readers to learn about the continuities and changes in the early care and education (ECE) system and workforce that may have occurred over this time period between 2011-2014 . This report also references data from the 2001 and 2003 CCSA workforce studies to provide a perspective on changes over a longer period of time .
Data for the center-based workforce report were collected through two linked surveys of samples of early childhood program directors and of teachers working in those programs conducted from February 2014 through October 2014 (based on information as of January 2014 1) . Useable surveys were obtained from 760 directors who constituted 72% of a stratified random sample (n=1055) of all directors of licensed
child care programs in North Carolina . This response constitutes about 19% of the population of all early care and education programs serving children birth through five in the state . The sample was designed to include 25% of the programs within each of the 14 Child Care Resource and Referral (CCR&R) regions . A map of the regions can be found in Appendix A . Directors were asked to distribute surveys to their teaching staff and useable surveys were returned by 2,997 teaching staff out of an estimated 6,579 in the participating centers (46%) . An additional 289 surveys were returned by teachers in programs with non-responding directors .
Program level and teacher level data have been weighted to reflect the statewide populations of centers and teaching staff respectively, adjusting for known individual, program, and community characteristics associated with response bias . These factors include the location, size, sponsorship, and star rating of a program as well as previous participation in a CCSA survey . Most percentages and other values reported in text, tables, and graphs incorporate these sampling weights, permitting extrapolation to the population of centers (N=4,009) serving children under six who are not yet in school . In addition, non-response at the teaching staff level was adjusted for by weighting to correct for non-response among centers . Fortunately, most of the centers (60 .5%) whose directors returned their own surveys yielded at least some teacher surveys . The mean center level teaching staff response rate was 33% . Almost three-quarters of these centers (73 .1%) yielded responses from at least 70% of their teaching staff . One in six (17%) responding centers yielded surveys from all (100%) of the teaching staff . Because of this situation, information from the directors’ surveys was used to assess how center and director characteristics might have affected response levels from the teaching staff . Among the relevant factors investigated, location, size, sponsorship, star-rating, and designation as a NC Pre-Kindergarten site affected teacher survey response . As a result, second stage weights were applied and adjusted for the differential response associated with these center characteristics . This multi-level weighting process gives us further confidence that the results from 3,286 teaching staff surveys completed and returned in 2014 can be statistically generalized to the statewide population of early childhood teaching staff that is estimated to consist of approximately 28,200 individuals .
Data for family child care providers included in this report were collected through a survey of a sample of family child care providers conducted from February 2014 to September 2014 (based on information as of January 20141) . Numerous attempts were made to survey a stratified random sample (n=766) of all licensed family child care providers in North Carolina . This number constitutes about 31% of the population of all family child care homes serving children birth through five years old within each of the 14 Child Care Resource and Referral (CCR&R) regions, with a slight oversampling in those regions with relatively few homes . Useable surveys were obtained from 555 programs, or 72% of those attempted . This yields a sample that constitutes about 22% of the overall family child care provider population . Program data have been weighted to reflect the statewide populations of family child care providers, adjusting for known program and community characteristics associated with response bias . Percentages and other values reported in tables
Introduction
1 Data from NC Division of Child Development and Early Education (DCDEE), January 2014 .
1
Working in Early Care & Education in North Carolina 2014 Workforce Study

and graphs incorporate these sampling weights, permitting extrapolation to the population of family child care programs (N=2504) serving children under six who are not yet in school . Responding family child care home providers mirrored all segments of the overall population of home providers in the state with slight differences . Overall, 4-and 5- star homes were more likely to respond (77%) than 3-star homes (73%) or less highly rated homes (63%) . Sampling weights have been adjusted to compensate for this bias . More information about the sampling design and survey execution is contained in Appendix B to this report .
Throughout this report, the median value is usually reported as the measure of central tendency, e .g ., for hourly wages and time intervals . As such, “average” is used interchangeably with “median” unless specifically noted otherwise .
A feature of the workforce study this year involved continuing the capacity to conduct longitudinal studies in the future through the establishment of a special panel of centers . This panel consists of a subset of centers from which data has been and will continue to be collected over several years . In order to construct this panel, all centers which had responded to CCSA workforce surveys in both 2012 and in 2013, along with an additional random sample of centers represented in the 2013 survey, were included in the group of centers invited to participate in the 2014 survey . Panel data from the 2012, 2013, 2014, and 2015 surveys will be available for examination to enable longitudinal analyses . Additional information about the sampling design and survey execution is contained in Appendix B to this report . Further information is available upon request .
Introduction
2
2014 Working in Child Care in North Carolina l Child Care Services Association, 2014
Early Care and Education (ECE) Centers
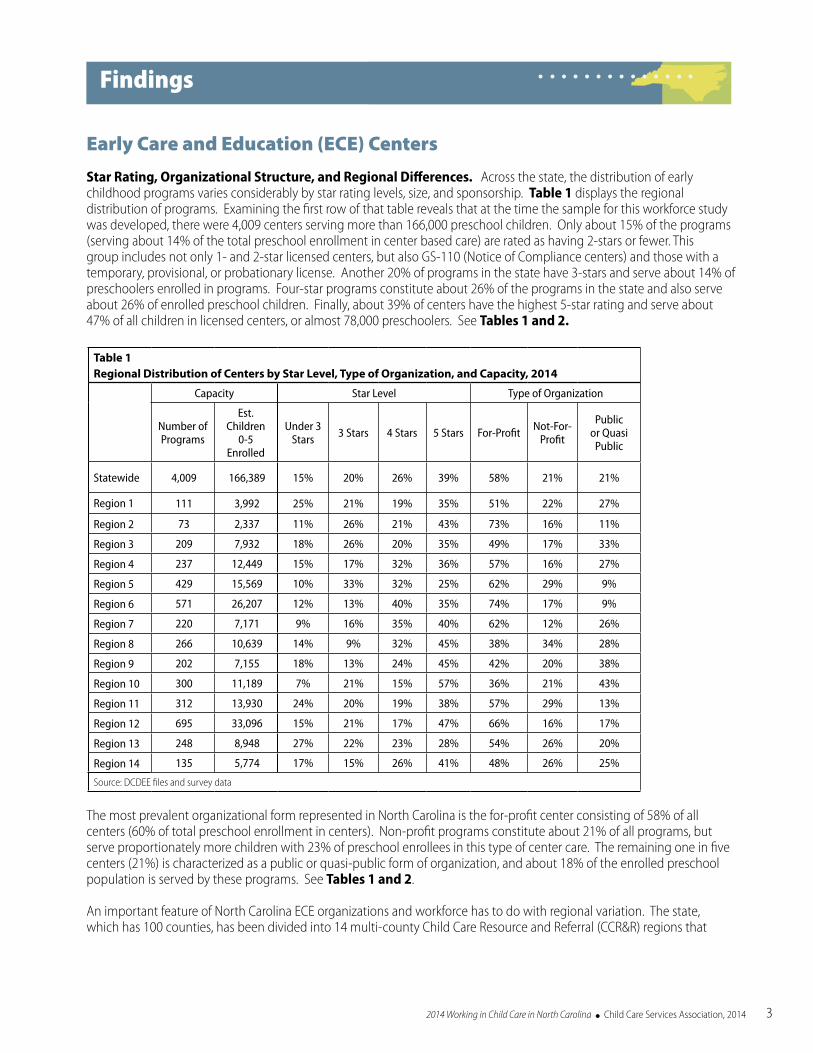
Star Rating, Organizational Structure, and Regional Differences. Across the state, the distribution of early childhood programs varies considerably by star rating levels, size, and sponsorship . Table 1 displays the regional distribution of programs . Examining the first row of that table reveals that at the time the sample for this workforce study was developed, there were 4,009 centers serving more than 166,000 preschool children . Only about 15% of the programs (serving about 14% of the total preschool enrollment in center based care) are rated as having 2-stars or fewer . This group includes not only 1- and 2-star licensed centers, but also GS-110 (Notice of Compliance centers) and those with a temporary, provisional, or probationary license . Another 20% of programs in the state have 3-stars and serve about 14% of preschoolers enrolled in programs . Four-star programs constitute about 26% of the programs in the state and also serve about 26% of enrolled preschool children . Finally, about 39% of centers have the highest 5-star rating and serve about 47% of all children in licensed centers, or almost 78,000 preschoolers . See Tables 1 and 2.
The most prevalent organizational form represented in North Carolina is the for-profit center consisting of 58% of all centers (60% of total preschool enrollment in centers) . Non-profit programs constitute about 21% of all programs, but serve proportionately more children with 23% of preschool enrollees in this type of center care . The remaining one in five centers (21%) is characterized as a public or quasi-public form of organization, and about 18% of the enrolled preschool population is served by these programs . See Tables 1 and 2 .
An important feature of North Carolina ECE organizations and workforce has to do with regional variation . The state, which has 100 counties, has been divided into 14 multi-county Child Care Resource and Referral (CCR&R) regions that
3
Findings
Table 1Regional Distribution of Centers by Star Level, Type of Organization, and Capacity, 2014
Capacity Star Level Type of Organization
Number of Programs
Est. Children
0-5 Enrolled
Under 3 Stars 3 Stars 4 Stars 5 Stars For-Profit Not-For-
Profit
Public or Quasi
Public
Statewide 4,009 166,389 15% 20% 26% 39% 58% 21% 21%
Region 1 111 3,992 25% 21% 19% 35% 51% 22% 27%
Region 2 73 2,337 11% 26% 21% 43% 73% 16% 11%
Region 3 209 7,932 18% 26% 20% 35% 49% 17% 33%
Region 4 237 12,449 15% 17% 32% 36% 57% 16% 27%
Region 5 429 15,569 10% 33% 32% 25% 62% 29% 9%
Region 6 571 26,207 12% 13% 40% 35% 74% 17% 9%
Region 7 220 7,171 9% 16% 35% 40% 62% 12% 26%
Region 8 266 10,639 14% 9% 32% 45% 38% 34% 28%
Region 9 202 7,155 18% 13% 24% 45% 42% 20% 38%
Region 10 300 11,189 7% 21% 15% 57% 36% 21% 43%
Region 11 312 13,930 24% 20% 19% 38% 57% 29% 13%
Region 12 695 33,096 15% 21% 17% 47% 66% 16% 17%
Region 13 248 8,948 27% 22% 23% 28% 54% 26% 20%
Region 14 135 5,774 17% 15% 26% 41% 48% 26% 25%
Source: DCDEE files and survey data
vary substantially in terms of their resources and scale . See Appendix A . The smallest region (Region 2) has only 73 centers serving fewer than 3,000 children altogether, while the largest (Region 12) has almost 700 programs serving over 33,000 children . This 10-fold difference in scale of regions also reflects a wide variation in the socio-economic and demographic characteristics of these different regions with important implications for the supply, quality, and status of ECE programs and the educational levels and wages of the ECE workforce . In general, more urbanized regions have more centers and serve larger numbers of preschool children, while the smaller, more rural and isolated regions have fewer numbers of programs, as well as fewer children and staff .
The quality ratings of programs differ substantially by region, with some, but not all, of the more rural, smaller regions lagging behind . See Table 1 . For example, although only 15% of programs have under 3-stars across the whole state, regions differ from a low of 7% in Region 10 to a high of 27% in Region 13 . In three of the state’s regions (1, 11, and 13) more than one in five programs is rated below three stars . At the other end of the scale, it should be noted that although 39% of the programs in the state are rated as 5-star, regions vary from a low of 25% (Region 5) to a high of 57% (Region 10) . There is also substantial variation across the state in how programs are organized . For-profit programs can comprise 74% of programs as in Region 6 or as few
as 36% as in Region 10 . Similarly, non-profits range from 34% of the programs in Region 8 to just 12% in Region 7 . Finally, although about one out of every five programs is sponsored by public or quasi-public organizations, including public schools and some Head Start programs, these programs represent 43% of the centers in Region 10 yet only 9% in Regions 5 and 6 . These differences can affect conditions of the workforce such as salaries and benefits .
The overall quality of programs in which children are enrolled varies widely across the state . This is evident from examining the aggregate enrollment in programs arrayed by stars and by organizational structure across regions . See Table 2 . Statewide only about one in seven children are enrolled in programs with fewer than three stars, but only 5% of children receive care in such settings in Region 5 . Yet in some regions of the state, i .e ., Regions 13 and 14, 20% or more of children are enrolled in such programs . Conversely, although 47% of children in licensed center-based care statewide are enrolled in 5-star programs, in 6 regions more than 50% of children are receiving this highest rated level of care . These include Regions 1, 2, 6, 9, 10, and 12 .
In a similar fashion, children in different regions receive care from programs with different kinds of organizational structures . Statewide, about 60% of children are served by for-profit centers, 23% by not-for-profit centers, and about 18% by public or quasi-public organizations . Although most
44 Data from DCDEE Statistical and Summary Report
January 2007 and January 2012 except Subsidy information, November 2011 .
Table 2 Birth to Five Enrollment in Centers by Star Rating and Organizational Structure by Region, 2014
Region Total
Star Rating of Program Organizational Structure
Under 3 Stars
3 Stars
4 Stars
5 Stars
For- Profit
Not- For-
Profit
Public or
Quasi Public
Statewide 166,389 14% 14% 26% 47% 60% 23% 18%
Region 1 3,992 15% 12% 16% 56% 36% 24% 40%
Region 2 2,337 7% 16% 20% 57% 57% 29% 14%
Region 3 7,932 15% 21% 23% 41% 51% 25% 24%
Region 4 12,449 13% 10% 33% 44% 66% 14% 20%
Region 5 15,569 5% 29% 33% 33% 51% 33% 16%
Region 6 26,207 8% 5% 33% 53% 72% 17% 11%
Region 7 7,171 18% 18% 42% 22% 66% 22% 11%
Region 8 10,639 17% 5% 31% 47% 36% 34% 31%
Region 9 7,155 8% 4% 24% 63% 47% 16% 37%
Region 10 11,189 12% 16% 19% 53% 45% 28% 27%
Region 11 13,930 17% 17% 21% 45% 61% 31% 8%
Region 12 33,096 16% 14% 15% 55% 72% 14% 14%
Region 13 8,948 21% 19% 28% 31% 53% 36% 11%
Region 14 5,774 22% 9% 28% 42% 59% 20% 21%
Source: DCDEE files and survey data
2014 Working in Child Care in North Carolina l Child Care Services Association, 2014
children are receiving care in for-profit centers, this varies widely by region from a low of 36% in Regions 1 and 8 to a high of 72% in Regions 6 and 12 . In a similar fashion, the percentage of children receiving care in not-for-profit centers varies from a low of 14% in Regions 4 and 12 to a high of 36% in Region 13 . Finally, although in some areas of the state more than 30% of children are enrolled in public programs (Regions 1, 8, and 9), in Region 11, only 8% of children are enrolled in such public programs .
Staffing. The child care center staff that participated in the survey represented a wide variety of positions in the early childhood field and worked with children of all ages . Weighting those responses to represent the total director population yielded results that show titles such as: director (57%); director/owner (25%); principal (6%); and with the remaining naming various other titles such as administrator, assistant director, coordinator, lead, manager, and supervisor .
Among staff who completed a teacher survey, about three quarters identified themselves as teachers or lead teachers . Almost another quarter were assistant teachers, teacher’s aides, or floaters . Re-categorizing these responses resulted in about 73% being considered “teachers” and 25% being considered “assistant teachers .” About half of those filling out the teacher survey indicated that they work with infants, toddlers, or twos at least some of the time . Half indicated that they work only with older preschool children . Respondents to the teacher survey included a small number of other staff (2%) with a wide variety of self-reported job titles including therapist, bus driver, cook, or administrative support persons . Although these individuals reported that they teach or work with classrooms of children, on the basis of available information, they could not be reliably classified as either a teacher or an assistant teacher . These individuals are included in aggregate results describing “teaching staff” but are omitted from those analyses where “teachers” and “assistant teachers” are reported separately .
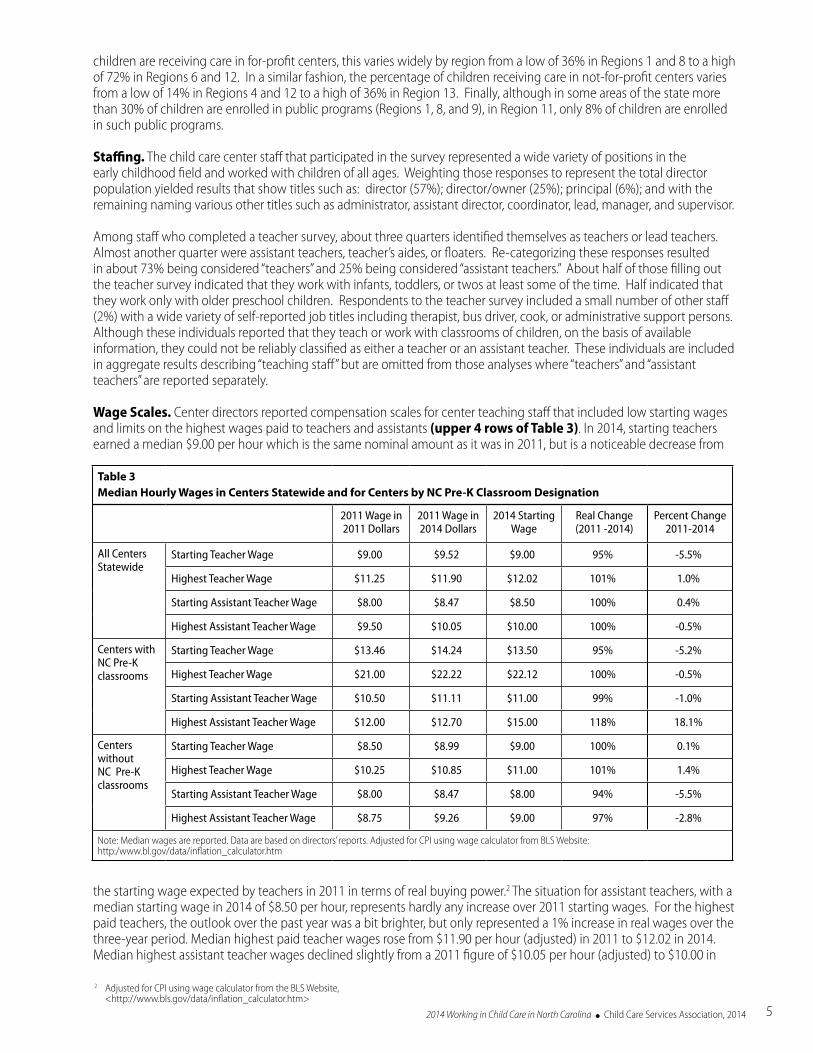
Wage Scales. Center directors reported compensation scales for center teaching staff that included low starting wages and limits on the highest wages paid to teachers and assistants (upper 4 rows of Table 3) . In 2014, starting teachers earned a median $9 .00 per hour which is the same nominal amount as it was in 2011, but is a noticeable decrease from
the starting wage expected by teachers in 2011 in terms of real buying power .2 The situation for assistant teachers, with a median starting wage in 2014 of $8 .50 per hour, represents hardly any increase over 2011 starting wages . For the highest paid teachers, the outlook over the past year was a bit brighter, but only represented a 1% increase in real wages over the three-year period . Median highest paid teacher wages rose from $11 .90 per hour (adjusted) in 2011 to $12 .02 in 2014 . Median highest assistant teacher wages declined slightly from a 2011 figure of $10 .05 per hour (adjusted) to $10 .00 in
5
2 Adjusted for CPI using wage calculator from the BLS Website, <http://www .bls .gov/data/inflation_calculator .htm>
Table 3Median Hourly Wages in Centers Statewide and for Centers by NC Pre-K Classroom Designation
2011 Wage in 2011 Dollars
2011 Wage in 2014 Dollars
2014 Starting Wage
Real Change (2011 -2014)
Percent Change 2011-2014
All Centers Statewide
Starting Teacher Wage $9.00 $9.52 $9.00 95% -5.5%
Highest Teacher Wage $11.25 $11.90 $12.02 101% 1.0%
Starting Assistant Teacher Wage $8.00 $8.47 $8.50 100% 0.4%
Highest Assistant Teacher Wage $9.50 $10.05 $10.00 100% -0.5%
Centers with NC Pre-K classrooms
Starting Teacher Wage $13.46 $14.24 $13.50 95% -5.2%
Highest Teacher Wage $21.00 $22.22 $22.12 100% -0.5%
Starting Assistant Teacher Wage $10.50 $11.11 $11.00 99% -1.0%
Highest Assistant Teacher Wage $12.00 $12.70 $15.00 118% 18.1%
Centers without NC Pre-K classrooms
Starting Teacher Wage $8.50 $8.99 $9.00 100% 0.1%
Highest Teacher Wage $10.25 $10.85 $11.00 101% 1.4%
Starting Assistant Teacher Wage $8.00 $8.47 $8.00 94% -5.5%
Highest Assistant Teacher Wage $8.75 $9.26 $9.00 97% -2.8%
Note: Median wages are reported . Data are based on directors’ reports . Adjusted for CPI using wage calculator from BLS Website: http:/www .bl .gov/data/inflation_calculator .htm
2014 . However, the typical highest wage of a teacher increased by a yearly average of $ .04 per hour in real terms . The median wage of the highest paid assistant teacher actually declined by more than a penny per hour per year over this period .
Despite these overall trends, there are important wage scale and wage progression differences for teaching staff depending on whether or not they work in a program that has an NC Pre-K classroom on site . Licensed early care and education programs with NC Pre-K classrooms have substantially better compensation at all levels than do those without such classrooms as shown in the lower two panels of Table 3 . For starting teachers and assistant teachers and for highest paid teachers and assistant teachers, working in settings with an NC Pre-K classroom results in higher compensation . The median highest paid teachers working in settings with an NC Pre-K classroom make over twice as much as do the highest paid teachers in settings without an NC Pre-K classroom (median highest wage of $22 .12 vs . $11 .00 per hour) . However, there is still a substantial wage premium for an assistant teacher who is just starting out: $11 .00 in those settings that have an NC Pre-K classroom vs . $8 .00 in other settings . This difference seems to grow with seniority as highest paid assistant teachers were reported to have a median wage of $15 .00 in settings with NC Pre-K classrooms compared with only $9 .00 per hour in other settings . Data suggest that employment at a site with an NC Pre-K classroom results in a more rapid wage progression for all of the staff in such settings .
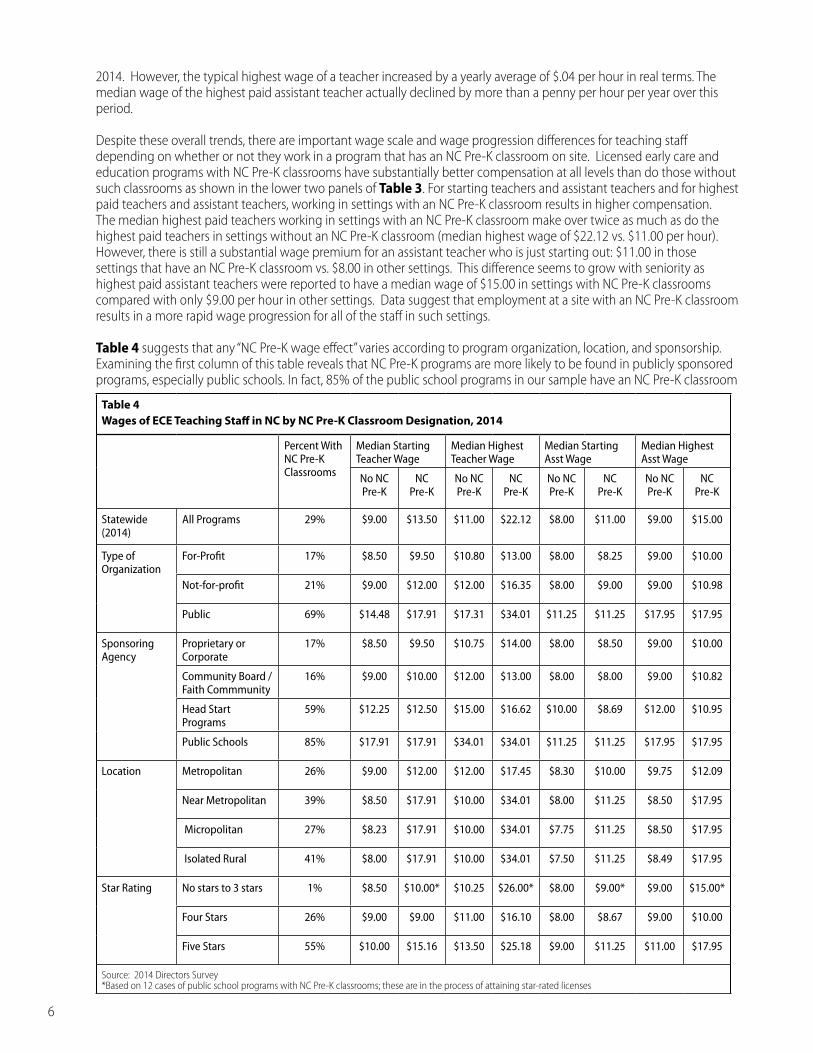
Table 4 suggests that any “NC Pre-K wage effect” varies according to program organization, location, and sponsorship . Examining the first column of this table reveals that NC Pre-K programs are more likely to be found in publicly sponsored programs, especially public schools . In fact, 85% of the public school programs in our sample have an NC Pre-K classroom
6
Table 4Wages of ECE Teaching Staff in NC by NC Pre-K Classroom Designation, 2014
Percent With NC Pre-K Classrooms
Median Starting Teacher Wage
Median Highest Teacher Wage
Median Starting Asst Wage
Median Highest Asst Wage
No NC Pre-K
NC Pre-K
No NC Pre-K
NC Pre-K
No NC Pre-K
NC Pre-K
No NC Pre-K
NC Pre-K
Statewide (2014)
All Programs 29% $9.00 $13.50 $11.00 $22.12 $8.00 $11.00 $9.00 $15.00
Type of Organization
For-Profit 17% $8.50 $9.50 $10.80 $13.00 $8.00 $8.25 $9.00 $10.00
Not-for-profit 21% $9.00 $12.00 $12.00 $16.35 $8.00 $9.00 $9.00 $10.98
Public 69% $14.48 $17.91 $17.31 $34.01 $11.25 $11.25 $17.95 $17.95
Sponsoring Agency
Proprietary or Corporate
17% $8.50 $9.50 $10.75 $14.00 $8.00 $8.50 $9.00 $10.00
Community Board / Faith Commmunity
16% $9.00 $10.00 $12.00 $13.00 $8.00 $8.00 $9.00 $10.82
Head Start Programs
59% $12.25 $12.50 $15.00 $16.62 $10.00 $8.69 $12.00 $10.95
Public Schools 85% $17.91 $17.91 $34.01 $34.01 $11.25 $11.25 $17.95 $17.95
Location Metropolitan 26% $9.00 $12.00 $12.00 $17.45 $8.30 $10.00 $9.75 $12.09
Near Metropolitan 39% $8.50 $17.91 $10.00 $34.01 $8.00 $11.25 $8.50 $17.95
Micropolitan 27% $8.23 $17.91 $10.00 $34.01 $7.75 $11.25 $8.50 $17.95
Isolated Rural 41% $8.00 $17.91 $10.00 $34.01 $7.50 $11.25 $8.49 $17.95
Star Rating No stars to 3 stars 1% $8.50 $10.00* $10.25 $26.00* $8.00 $9.00* $9.00 $15.00*
Four Stars 26% $9.00 $9.00 $11.00 $16.10 $8.00 $8.67 $9.00 $10.00
Five Stars 55% $10.00 $15.16 $13.50 $25.18 $9.00 $11.25 $11.00 $17.95
Source: 2014 Directors Survey *Based on 12 cases of public school programs with NC Pre-K classrooms; these are in the process of attaining star-rated licenses

2014 Working in Child Care in North Carolina l Child Care Services Association, 2014
while well over half of Head Start programs (59%) also have NC Pre-K classrooms . On the other hand, the far more prevalent for-profit and not-for-profit centers are much less likely to have NC Pre-K classrooms . However, NC Pre-K classrooms are disproportionately likely to be found in more rural as opposed to more urban counties . About 41% of the centers located in isolated rural counties have NC Pre-K classrooms, while only 26% of centers located in the state’s most populous and prosperous metropolitan counties have such classrooms . (See Appendix D for county breakdown by urbanization .) In centers without NC Pre-K classrooms there is a $1 .00 per hour starting wage difference for both teachers and assistants between those located in the most urbanized metropolitan counties and those located in isolated rural counties . Among centers with NC Pre-K classrooms, median starting wages for teachers and assistants are higher than in those centers without NC Pre-K classrooms . Further median starting and peak wages are consistently high and uniform across the three most rural types of communities, and only slightly lower in metropolitan areas, where a larger number and proportions of the centers with pre-K classrooms are operated by non-public providers .
Further, there is a positive correlation between a program’s star rating and the likelihood of having an NC Pre-K classroom; more than half of 5-star programs in the state have NC Pre-K classrooms, while virtually none of the 3-star or below programs have these classrooms . This is to be expected because the state’s NC Pre-K standards are related to license type .
The impact of centers in the non-profit and public sectors is especially pronounced in rural counties where employment challenges are greatest . Such an effect suggests that sustained career opportunities may be developed in these settings with a more attractive wage structure and progression . Urban centers without NC Pre-K programs have a better teaching staff wage profile than do rural centers, while the reverse is true of rural centers where programs with NC Pre-K classrooms display a more favorable wage structure than their urban counterparts . As seen in the bottom rows of Table 4, there is a positive relationship between better wages for teaching staff and program quality as indicated by star rating . This positive relationship is true in settings without an NC Pre-K classroom, but is even more pronounced in programs with NC Pre-K classrooms .
Thus, there appears to be mutually reinforcing relationships between centers’ star ratings, public sector or public school sponsorship, and the presence of an NC Pre-K designation . Further, all of these factors seem to influence the development of a more favorable wage structure for the teaching staff of these programs . By state mandate, NC Pre-K classrooms are required to maintain high quality as indicated by higher license levels . Along with this requirement, teachers who work in NC Pre-K classrooms must have at least a bachelor’s degree and Birth-Kindergarten teaching license and must be compensated somewhat comparably to licensed teachers in public schools . Given these criteria, the fact that higher license levels overall report higher starting salaries comes as no surprise . Both teachers and assistant teachers who work in higher star-rated centers earn higher wages, and this pattern seems likely influenced somewhat by having an NC Pre-K classroom .
7
Wage Scales of Regions. Breaking the wage scales down by regions shows great variation in starting and highest paid teachers and assistant teachers geographically . See Table 5 . Teachers working in Regions 5 and 14 can expect the lowest starting median wages of $8 .00/hour and are not likely to exceed $10 .00/hour as their highest wage . On
the other end of the spectrum, in Regions 4, 9, 10, and 12, median starting compensation meets or exceeds $10 .00/hour with wages peaking at $16 .35/hour in Region 10 . Statewide, assistant teachers can expect to have an average maximum wage of about $10 .00 per hour, ranging from $7 .69 to $11 .04 depending on their location . Only programs in Regions 10 and 12 compensate their highest paid assistant teachers with a median of $11 .00 per hour or more . 3
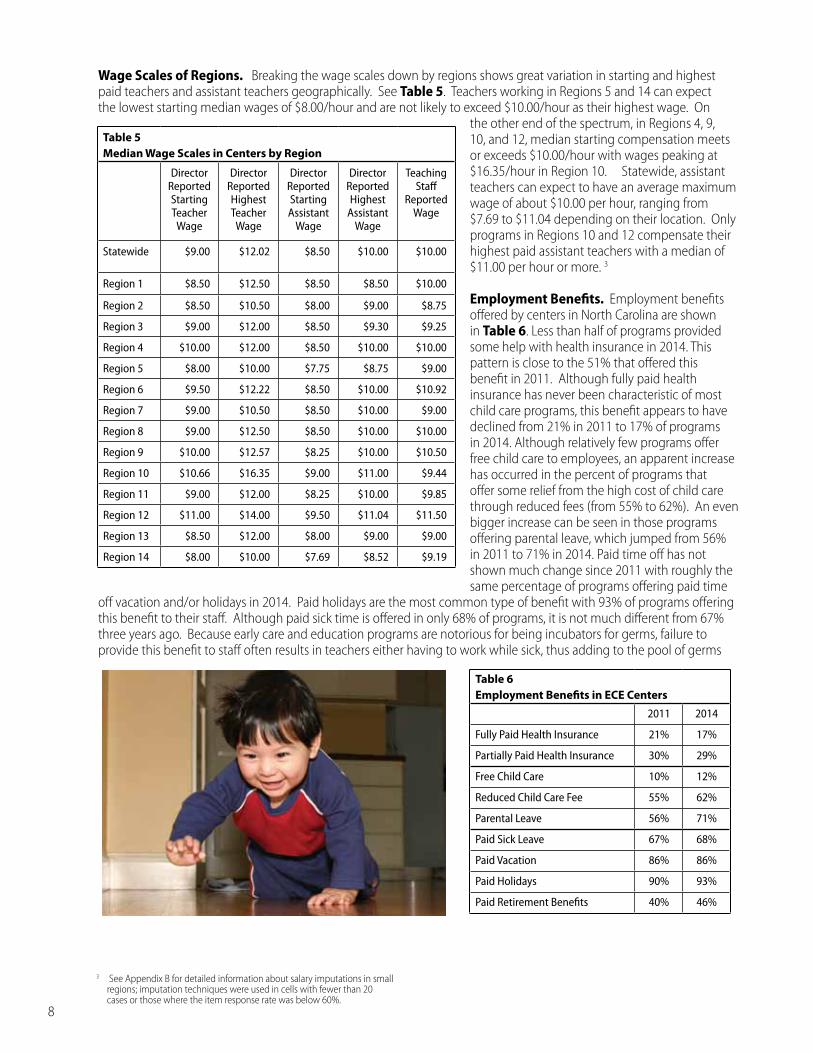
Employment Benefits. Employment benefits offered by centers in North Carolina are shown in Table 6 . Less than half of programs provided some help with health insurance in 2014 . This pattern is close to the 51% that offered this benefit in 2011 . Although fully paid health insurance has never been characteristic of most child care programs, this benefit appears to have declined from 21% in 2011 to 17% of programs in 2014 . Although relatively few programs offer free child care to employees, an apparent increase has occurred in the percent of programs that offer some relief from the high cost of child care through reduced fees (from 55% to 62%) . An even bigger increase can be seen in those programs offering parental leave, which jumped from 56% in 2011 to 71% in 2014 . Paid time off has not shown much change since 2011 with roughly the same percentage of programs offering paid time
off vacation and/or holidays in 2014 . Paid holidays are the most common type of benefit with 93% of programs offering this benefit to their staff . Although paid sick time is offered in only 68% of programs, it is not much different from 67% three years ago . Because early care and education programs are notorious for being incubators for germs, failure to provide this benefit to staff often results in teachers either having to work while sick, thus adding to the pool of germs
8
3 See Appendix B for detailed information about salary imputations in small regions; imputation techniques were used in cells with fewer than 20 cases or those where the item response rate was below 60% .
Table 6Employment Benefits in ECE Centers
2011 2014
Fully Paid Health Insurance 21% 17%
Partially Paid Health Insurance 30% 29%
Free Child Care 10% 12%
Reduced Child Care Fee 55% 62%
Parental Leave 56% 71%
Paid Sick Leave 67% 68%
Paid Vacation 86% 86%
Paid Holidays 90% 93%
Paid Retirement Benefits 40% 46%
Table 5Median Wage Scales in Centers by Region
Director Reported Starting Teacher
Wage
Director Reported Highest Teacher
Wage
Director Reported Starting Assistant
Wage
Director Reported Highest
Assistant Wage
Teaching Staff
Reported Wage
Statewide $9.00 $12.02 $8.50 $10.00 $10.00
Region 1 $8.50 $12.50 $8.50 $8.50 $10.00
Region 2 $8.50 $10.50 $8.00 $9.00 $8.75
Region 3 $9.00 $12.00 $8.50 $9.30 $9.25
Region 4 $10.00 $12.00 $8.50 $10.00 $10.00
Region 5 $8.00 $10.00 $7.75 $8.75 $9.00
Region 6 $9.50 $12.22 $8.50 $10.00 $10.92
Region 7 $9.00 $10.50 $8.50 $10.00 $9.00
Region 8 $9.00 $12.50 $8.50 $10.00 $10.00
Region 9 $10.00 $12.57 $8.25 $10.00 $10.50
Region 10 $10.66 $16.35 $9.00 $11.00 $9.44
Region 11 $9.00 $12.00 $8.25 $10.00 $9.85
Region 12 $11.00 $14.00 $9.50 $11.04 $11.50
Region 13 $8.50 $12.00 $8.00 $9.00 $9.00
Region 14 $8.00 $10.00 $7.69 $8.52 $9.19
2014 Working in Child Care in North Carolina l Child Care Services Association, 2014
found in programs, or having to take unpaid leave until they are well .
Over the years since NC Pre-K’s inception (formerly More at Four), public pre-k programs have contributed to increases in many types of benefits . Working in sites with an NC Pre-K classroom increases the opportunity to receive full health insurance, parental leave, sick time, and retirement . See Figure 1 . NC Pre-K programs are the drivers for increasing the overall benefits provided in 2014 from programs offering these benefits over a decade ago .
Whether or not a child care provider receives any support with health insurance (as well as other benefits and their wages) relates to the organizational auspice of the program in which she works . See Table 7 . All publicly sponsored programs offer their teachers either free or reduced health insurance, and in most of these programs, a teacher can expect a starting wage of at least $11 .50 per hour and most can expect to make at least close to $16 .00 per hour after some time . Those
providers working in non-profits (excluding those sponsored by faith communities) fell just under public employees with 55% receiving full or partially paid health insurance with a starting median wage of $9 .50 per hour and highest median wage of $12 .00 per hour . On the other end of the scale, employees in single center, for-profit programs had a median starting wage of just $8 .50 per hour (typically having a top wage of $10 .50) and only 16% received support with employer offered health insurance . These types of centers are the most prevalent form of organization in the state; almost 40% of all centers in the state are single site, private, for-profit centers . On the other hand, less than one in four programs statewide are publicly sponsored, and fewer still are public school sites .
These wage findings reflect similar national findings from the Government Accountability Office4, which found low wages among all child care providers but higher pay for individuals working in publicly funded programs such as Head Start .
Overtime Pay. Among the 42% of the teaching staff who reported that they had ever worked over 40 hours per week, about half (51%) said that their centers paid them time and a half for the overtime hours that they worked . When directors were asked this same question about their teaching staff, a comparable 43% said that their teachers sometimes work over 40
9
Table 7Health Insurance and Wages by Auspice, 2014
Type of Center Pct Employers Who Offer at Least Partly Paid Health Insurance
Median Starting Teacher Wage
Median Highest Teacher Wage
Private for-profit (single center) 16% $8.50 $10.50
Private not-for-profit (sponsored by faith community)
39% $9.00 $11.55
Private for-profit (multi-center) 47% $9.00 $12.00
Private not-for-profit (comm./board sponsored)
55% $9.50 $12.00
Public Program (Mental Hlth, Comm. College)
100% $11.51 $15.86
Head Start 100% $12.50 $16.35
Public School 100% $17.91 $34.01
4 US Government Accountability Office Report to the Chairman, Committee on Finance, US Senate, February 2012 . “Early Childcare and Education . HHS and Education are Taking Steps to Improve Workforce Data and Enhance Worker Quality .”

hours per week . However, 66% of these directors explained that teachers who are asked to work over 40 hours per week are compensated at one and a half times their regular hourly wage . Another 8% of employers, mostly in public school settings, report that their teachers are on annual salaries and exempt from overtime requirements, while another 10%, again mostly in the public schools, reported time off in lieu of additional compensation . Federal wage and hour law requires that non-exempt workers such as early care and education teachers receive time and a half for overtime hours . This law does not apply to public sector employees who may receive time off in lieu of paid compensation . Regardless of setting, 18% of teachers reported that they have worked over 40 hours per week on occasion without receiving any type of compensation or time off .
Family Child Care (FCC) Homes
Family child care providers constitute a relatively small, but nonetheless important sector of child care providers in North Carolina . Altogether more than 2,500 FCC providers use their own homes as the site of care and education for over 11,000 children across the state . Enrollment for January 2014 for full and part time children ranged from zero to fifteen children, with a median of five young children in each home .
FCC operators differ in significant ways from centers in terms of their demographics and career trajectories . The typical FCC provider was 51 years old in 2014, and had been in business at her current location for a median of 13 years (compared to only 5 .4 years in 2003) . The median number of years that a FCC provider had been working in the child care field is 17 years . Providers typically worked long hours (52 .5 hrs/week), which was the same as in the 2012 survey . There is a great deal of variability in how long the home-based providers spend working (as estimated by the number of hours they are open) . However, 95% of them are working more than 40 hours per week, and one in five works 65 hours per week or more . Among the special services offered by the responding homes were evening care (79%), overnight care (51%), drop-in care (69%), holiday care (43%), weekend care (39%), and care for sick children (20%) . The comparable figures reported in the 2012 survey were almost identical: evening care (78%), overnight care (50%), drop-in care (71%), holiday care (44%), and weekend care (42%) . Only the service of care for sick children seems to have declined over the last two years from 26% reported in the 2012 survey . Nonetheless, availability of these services from FCC providers seems to have increased since 2003 when far fewer offered them: (53% evening, 27% overnight, 53% drop-in, 25% holiday, and 3% sick child) . This pattern suggests that these providers may be responding to a greater need for non-traditional types of care by exhibiting more willingness to offer these types of services in their own homes .
Earnings and Expenditures. Family child care providers’ median gross monthly earnings come from a varying mix of child care tuition fees, subsidy payments, and Child and Adult Care Food Program reimbursements . Their expenditures included items such as food, toys, substitute care, advertising, training fees, diapers, crafts, transportation, supplies, field trips, and gifts for the children . Home occupancy costs such as utilities, cleaning, and rent or mortgage payments are not included . Based on these data, estimated gross yearly earnings were $29,160 . Food costs represent between a third and a half of providers’ monthly expenditures, and 77% of family child care providers defrayed this expense by participating in the Child and Adult Care Food Program . In 2003, a similar percent, 78%, of providers participated in the Child and Adult Care Food Program . Currently almost 6 in 10 (59%) FCC providers participate in the child care subsidy program and an additional 20% currently have no subsidized children in the program, but are willing to take them .
Median hourly earnings in 2014 were $7 .05, estimated by dividing net monthly earnings by the number of hours each home was open . The bottom 20% of FCC providers earned less than $3 .75 per hour, and only one in five FCC operators made more than $11 .00 per hour . However, the typical net earnings of a FCC provider seems to have improved from the time of our previous survey in 2012 when FCC providers netted $6 .03 per hour, which represents $6 .24 per hour in 2014
107 These percentages may not equal the sum of the percentages in
Table 9 due to rounding .
2014 Working in Child Care in North Carolina l Child Care Services Association, 2014
dollars . Thus, FCC providers seemed to have increased their net hourly income by about $ .81 per hour over the last two years . Family child care providers in our survey in 2003 reported a median net income of $5 .71 per hour . Using data from the Consumer Price Index, $5 .71 per hour in 2003 translates to $7 .39 in 2014 dollars . This being the case, family child care provider earnings have actually dropped by about 5% over the last eleven years .
Benefits. Family child care providers usually work alone or with the help of an unpaid or underpaid family member, and are less likely than centers to have established policies regarding paid benefits . Hence, family child care providers are much less likely to receive any paid benefits . Child care tuition covered providers’ vacation time in 55% of homes, and 50% of providers charge for days when they are sick . These numbers are similar overall to 2012 when 53% of providers charged for vacation days and 51% charged for sick days . In 2003, 43% of parents paid for vacation days and 51% paid for sick days . These measures help identify the extent to which providers run their child care programs using a business model designed to meet providers’ personal and professional needs .
Profile of the Early Care & Education Workforce
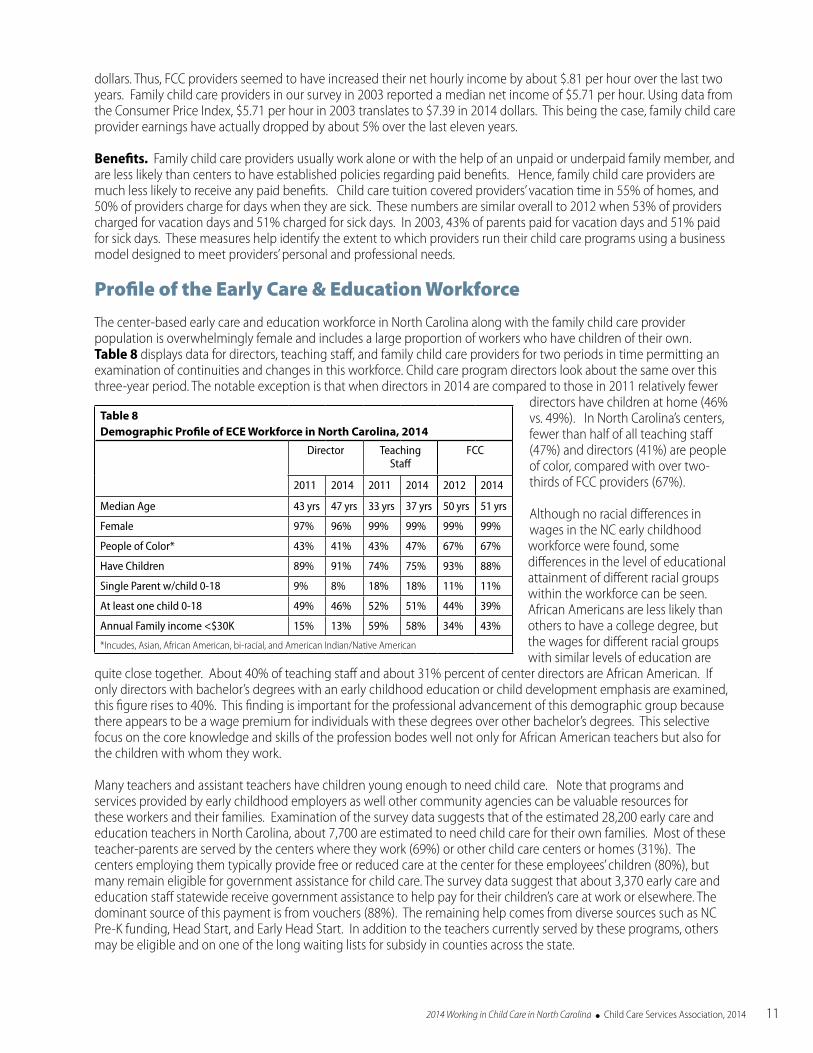
The center-based early care and education workforce in North Carolina along with the family child care provider population is overwhelmingly female and includes a large proportion of workers who have children of their own . Table 8 displays data for directors, teaching staff, and family child care providers for two periods in time permitting an examination of continuities and changes in this workforce . Child care program directors look about the same over this three-year period . The notable exception is that when directors in 2014 are compared to those in 2011 relatively fewer
directors have children at home (46% vs . 49%) . In North Carolina’s centers, fewer than half of all teaching staff (47%) and directors (41%) are people of color, compared with over two-thirds of FCC providers (67%) .
Although no racial differences in wages in the NC early childhood workforce were found, some differences in the level of educational attainment of different racial groups within the workforce can be seen . African Americans are less likely than others to have a college degree, but the wages for different racial groups with similar levels of education are
quite close together . About 40% of teaching staff and about 31% percent of center directors are African American . If only directors with bachelor’s degrees with an early childhood education or child development emphasis are examined, this figure rises to 40% . This finding is important for the professional advancement of this demographic group because there appears to be a wage premium for individuals with these degrees over other bachelor’s degrees . This selective focus on the core knowledge and skills of the profession bodes well not only for African American teachers but also for the children with whom they work .
Many teachers and assistant teachers have children young enough to need child care . Note that programs and services provided by early childhood employers as well other community agencies can be valuable resources for these workers and their families . Examination of the survey data suggests that of the estimated 28,200 early care and education teachers in North Carolina, about 7,700 are estimated to need child care for their own families . Most of these teacher-parents are served by the centers where they work (69%) or other child care centers or homes (31%) . The centers employing them typically provide free or reduced care at the center for these employees’ children (80%), but many remain eligible for government assistance for child care . The survey data suggest that about 3,370 early care and education staff statewide receive government assistance to help pay for their children’s care at work or elsewhere . The dominant source of this payment is from vouchers (88%) . The remaining help comes from diverse sources such as NC Pre-K funding, Head Start, and Early Head Start . In addition to the teachers currently served by these programs, others may be eligible and on one of the long waiting lists for subsidy in counties across the state .
11
Table 8Demographic Profile of ECE Workforce in North Carolina, 2014
Director Teaching Staff
FCC
2011 2014 2011 2014 2012 2014
Median Age 43 yrs 47 yrs 33 yrs 37 yrs 50 yrs 51 yrs
Female 97% 96% 99% 99% 99% 99%
People of Color* 43% 41% 43% 47% 67% 67%
Have Children 89% 91% 74% 75% 93% 88%
Single Parent w/child 0-18 9% 8% 18% 18% 11% 11%
At least one child 0-18 49% 46% 52% 51% 44% 39%
Annual Family income <$30K 15% 13% 59% 58% 34% 43%
*Incudes, Asian, African American, bi-racial, and American Indian/Native American
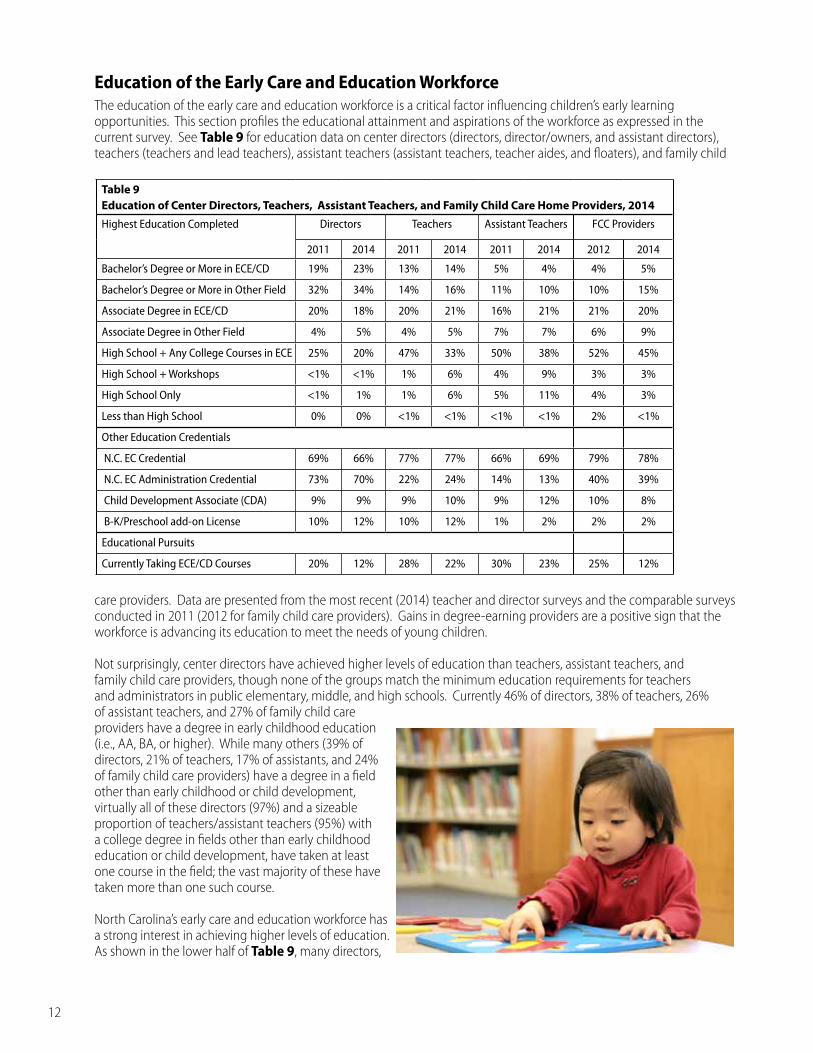
Education of the Early Care and Education WorkforceThe education of the early care and education workforce is a critical factor influencing children’s early learning opportunities . This section profiles the educational attainment and aspirations of the workforce as expressed in the current survey . See Table 9 for education data on center directors (directors, director/owners, and assistant directors), teachers (teachers and lead teachers), assistant teachers (assistant teachers, teacher aides, and floaters), and family child
care providers . Data are presented from the most recent (2014) teacher and director surveys and the comparable surveys conducted in 2011 (2012 for family child care providers) . Gains in degree-earning providers are a positive sign that the workforce is advancing its education to meet the needs of young children .
Not surprisingly, center directors have achieved higher levels of education than teachers, assistant teachers, and family child care providers, though none of the groups match the minimum education requirements for teachers and administrators in public elementary, middle, and high schools . Currently 46% of directors, 38% of teachers, 26% of assistant teachers, and 27% of family child care providers have a degree in early childhood education (i .e ., AA, BA, or higher) . While many others (39% of directors, 21% of teachers, 17% of assistants, and 24% of family child care providers) have a degree in a field other than early childhood or child development, virtually all of these directors (97%) and a sizeable proportion of teachers/assistant teachers (95%) with a college degree in fields other than early childhood education or child development, have taken at least one course in the field; the vast majority of these have taken more than one such course .
North Carolina’s early care and education workforce has a strong interest in achieving higher levels of education . As shown in the lower half of Table 9, many directors,
12
Table 9Education of Center Directors, Teachers, Assistant Teachers, and Family Child Care Home Providers, 2014
Highest Education Completed Directors Teachers Assistant Teachers FCC Providers
2011 2014 2011 2014 2011 2014 2012 2014
Bachelor’s Degree or More in ECE/CD 19% 23% 13% 14% 5% 4% 4% 5%
Bachelor’s Degree or More in Other Field 32% 34% 14% 16% 11% 10% 10% 15%
Associate Degree in ECE/CD 20% 18% 20% 21% 16% 21% 21% 20%
Associate Degree in Other Field 4% 5% 4% 5% 7% 7% 6% 9%
High School + Any College Courses in ECE 25% 20% 47% 33% 50% 38% 52% 45%
High School + Workshops <1% <1% 1% 6% 4% 9% 3% 3%
High School Only <1% 1% 1% 6% 5% 11% 4% 3%
Less than High School 0% 0% <1% <1% <1% <1% 2% <1%
Other Education Credentials
N.C. EC Credential 69% 66% 77% 77% 66% 69% 79% 78%
N.C. EC Administration Credential 73% 70% 22% 24% 14% 13% 40% 39%
Child Development Associate (CDA) 9% 9% 9% 10% 9% 12% 10% 8%
B-K/Preschool add-on License 10% 12% 10% 12% 1% 2% 2% 2%
Educational Pursuits
Currently Taking ECE/CD Courses 20% 12% 28% 22% 30% 23% 25% 12%
2014 Working in Child Care in North Carolina l Child Care Services Association, 2014
teachers, assistant teachers, and family child care providers have completed college courses . Furthermore, 22% of the teachers, 23% of assistants, and 12% of family child care providers said that they were currently taking courses leading to a degree or credential in the early childhood field . Of those taking classes, 44% of teachers and 46% of assistant teachers were working towards a two-year degree and 16% of teachers and 24% of assistant teachers were working towards a bachelor’s degree . In 2014, 80%, of directors, 56% of teachers, and 42% of assistants indicated that they had attained an associate, bachelor’s, or master’s degree in some field . In comparison, 75% of directors, 51% of teachers, and 39% of assistants in 2011 had earned an associate, bachelor’s, or master’s degree in some field . Additionally, 12% of directors, 12% of teachers, and 2% of assistant teachers have a B-K/Preschool add-on Teacher License compared to 10% of directors, 10% of teachers, and 1% of assistant teachers in 2011 . Family child care providers have also increased and maintained their educational credentials as well . Almost half now have some college degree, almost 80% have an NC Early Childhood Credential, and almost 40% have an NC EC Administration Credential .
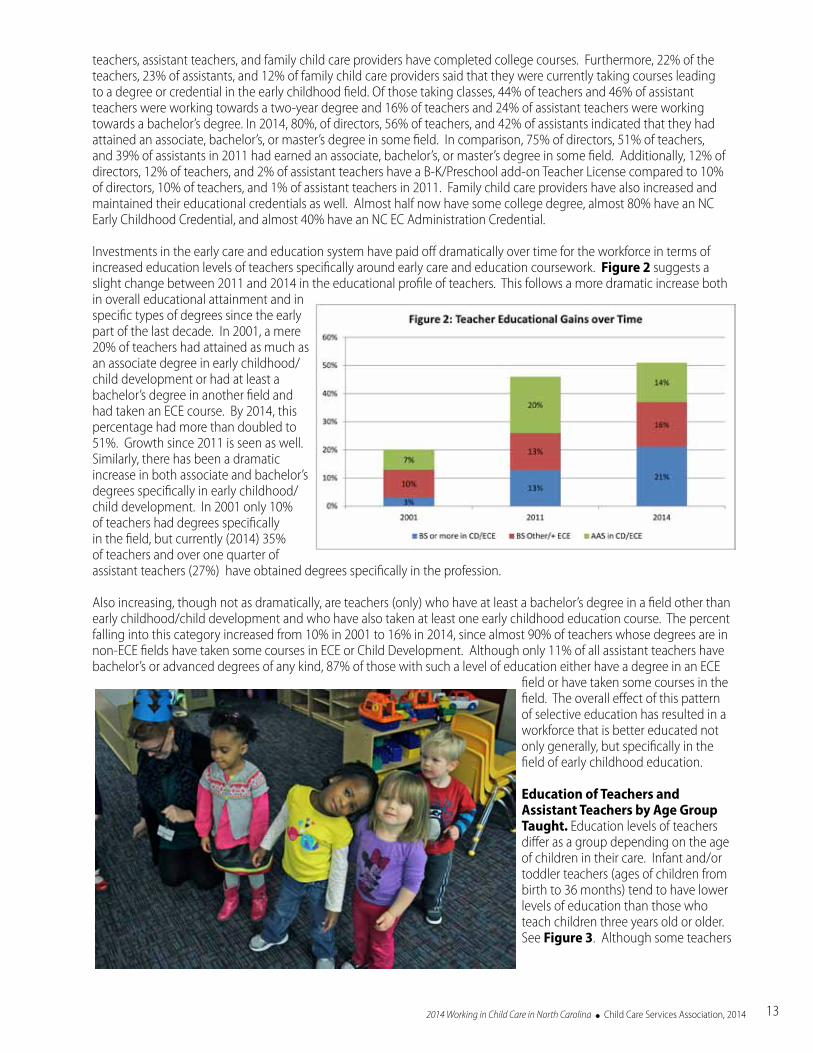
Investments in the early care and education system have paid off dramatically over time for the workforce in terms of increased education levels of teachers specifically around early care and education coursework . Figure 2 suggests a slight change between 2011 and 2014 in the educational profile of teachers . This follows a more dramatic increase both in overall educational attainment and in specific types of degrees since the early part of the last decade . In 2001, a mere 20% of teachers had attained as much as an associate degree in early childhood/child development or had at least a bachelor’s degree in another field and had taken an ECE course . By 2014, this percentage had more than doubled to 51% . Growth since 2011 is seen as well . Similarly, there has been a dramatic increase in both associate and bachelor’s degrees specifically in early childhood/child development . In 2001 only 10% of teachers had degrees specifically in the field, but currently (2014) 35% of teachers and over one quarter of assistant teachers (27%) have obtained degrees specifically in the profession .
Also increasing, though not as dramatically, are teachers (only) who have at least a bachelor’s degree in a field other than early childhood/child development and who have also taken at least one early childhood education course . The percent falling into this category increased from 10% in 2001 to 16% in 2014, since almost 90% of teachers whose degrees are in non-ECE fields have taken some courses in ECE or Child Development . Although only 11% of all assistant teachers have bachelor’s or advanced degrees of any kind, 87% of those with such a level of education either have a degree in an ECE
field or have taken some courses in the field . The overall effect of this pattern of selective education has resulted in a workforce that is better educated not only generally, but specifically in the field of early childhood education .
Education of Teachers and Assistant Teachers by Age Group Taught. Education levels of teachers differ as a group depending on the age of children in their care . Infant and/or toddler teachers (ages of children from birth to 36 months) tend to have lower levels of education than those who teach children three years old or older . See Figure 3 . Although some teachers
13
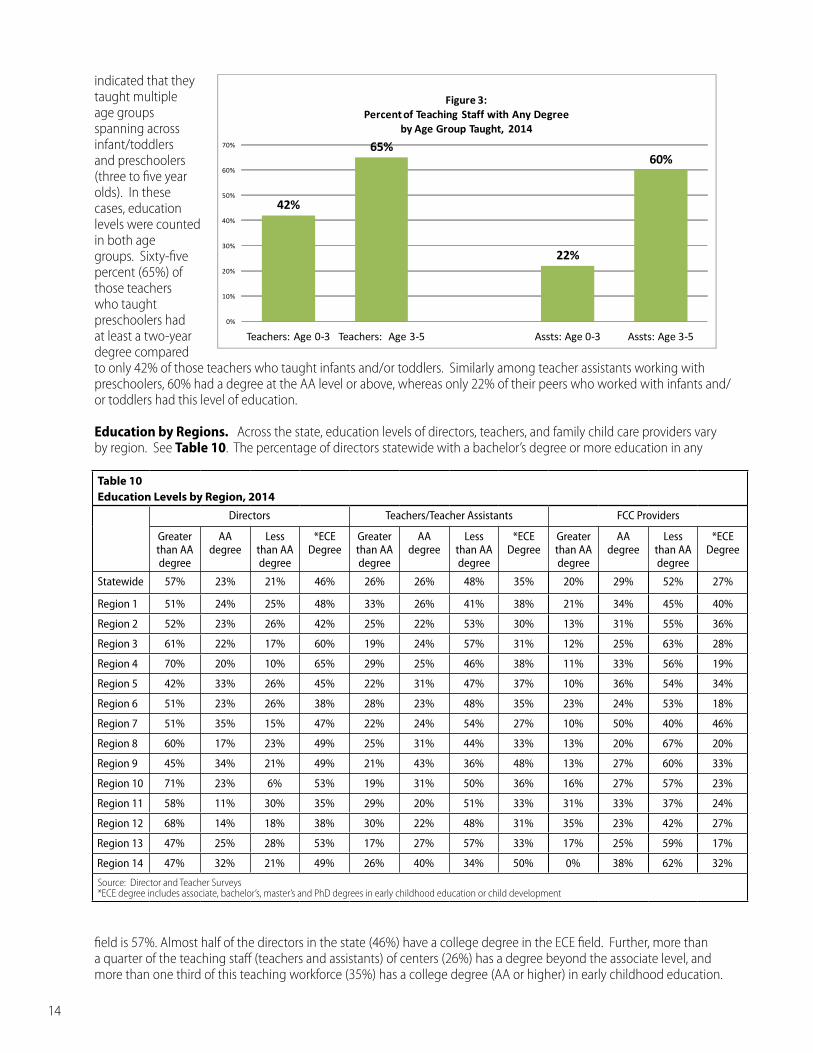
indicated that they taught multiple age groups spanning across infant/toddlers and preschoolers (three to five year olds) . In these cases, education levels were counted in both age groups . Sixty-five percent (65%) of those teachers who taught preschoolers had at least a two-year degree compared to only 42% of those teachers who taught infants and/or toddlers . Similarly among teacher assistants working with preschoolers, 60% had a degree at the AA level or above, whereas only 22% of their peers who worked with infants and/or toddlers had this level of education .
Education by Regions. Across the state, education levels of directors, teachers, and family child care providers vary by region . See Table 10 . The percentage of directors statewide with a bachelor’s degree or more education in any
field is 57% . Almost half of the directors in the state (46%) have a college degree in the ECE field . Further, more than a quarter of the teaching staff (teachers and assistants) of centers (26%) has a degree beyond the associate level, and more than one third of this teaching workforce (35%) has a college degree (AA or higher) in early childhood education .
14 9 http://quickfacts .census .gov/qfd/states/37000 .html .
42%
65%
22%
60%
0%
10%
20%
30%
40%
50%
60%
70%
Teachers: Age 0-3 Teachers: Age 3-5 Assts: Age 0-3 Assts: Age 3-5
Figure 3:Percent of Teaching Staff with Any Degree
by Age Group Taught, 2014
Table 10Education Levels by Region, 2014
Directors Teachers/Teacher Assistants FCC Providers
Greater than AA degree
AA degree
Less than AA degree
*ECE Degree
Greater than AA degree
AA degree
Less than AA degree
*ECE Degree
Greater than AA degree
AA degree
Less than AA degree
*ECE Degree
Statewide 57% 23% 21% 46% 26% 26% 48% 35% 20% 29% 52% 27%
Region 1 51% 24% 25% 48% 33% 26% 41% 38% 21% 34% 45% 40%
Region 2 52% 23% 26% 42% 25% 22% 53% 30% 13% 31% 55% 36%
Region 3 61% 22% 17% 60% 19% 24% 57% 31% 12% 25% 63% 28%
Region 4 70% 20% 10% 65% 29% 25% 46% 38% 11% 33% 56% 19%
Region 5 42% 33% 26% 45% 22% 31% 47% 37% 10% 36% 54% 34%
Region 6 51% 23% 26% 38% 28% 23% 48% 35% 23% 24% 53% 18%
Region 7 51% 35% 15% 47% 22% 24% 54% 27% 10% 50% 40% 46%
Region 8 60% 17% 23% 49% 25% 31% 44% 33% 13% 20% 67% 20%
Region 9 45% 34% 21% 49% 21% 43% 36% 48% 13% 27% 60% 33%
Region 10 71% 23% 6% 53% 19% 31% 50% 36% 16% 27% 57% 23%
Region 11 58% 11% 30% 35% 29% 20% 51% 33% 31% 33% 37% 24%
Region 12 68% 14% 18% 38% 30% 22% 48% 31% 35% 23% 42% 27%
Region 13 47% 25% 28% 53% 17% 27% 57% 33% 17% 25% 59% 17%
Region 14 47% 32% 21% 49% 26% 40% 34% 50% 0% 38% 62% 32%
Source: Director and Teacher Surveys*ECE degree includes associate, bachelor’s, master’s and PhD degrees in early childhood education or child development
2014 Working in Child Care in North Carolina l Child Care Services Association, 2014
This includes associate, bachelor’s, master’s, and PhD degrees in early childhood education or child development . However, almost half of this teaching workforce (48%) has not achieved the associate degree level of education . Among FCC providers, 49% have some college degree, and over one quarter (27%) have at least an AA degree in an ECE field . On the other hand, only 20% of FCC providers have more than an AA degree and 52% have no college degree .
Region 11 exhibits the lowest overall level of education for directors with almost one third (30%) of the directors having no college degree . In a similar fashion, teaching staff in this region have a comparatively low level of education; 56% do not have a college degree . On the other hand, two regions with especially high percentages of directors with ECE degrees, Region 3 (60%) and Region 4 (65%), also have higher percentages of teaching staff who have less than an AA degree . Higher levels of education can be seen in a number of regions . For directors, Regions 4, 7, and 10 stand out in that more than 85% of their directors have some type of college degree . Region 10 has the highest percent of directors with at least a bachelor’s degree at 71% . When looking specifically at ECE degrees, Region 4 has highest percent of directors with this type of degree at 65% .
For teachers and assistant teachers, Regions 9 and 14 lead the way with two-thirds of the workforce having some type of college degree . Regions 9 and 14 also stand out because about half of the teaching staff have ECE degrees . Region 1, however, has the highest percent of teachers/assistant teachers with bachelor’s degree or higher at 33% .
Among FCC providers, there is a great deal of variability across regions . Although slightly more than half (52%) of FCC providers across the state has no college degree, that percentage varies from a low of 37% (Region 11) to a high of 67% (Region 8) . Conversely only one out of every five FCC providers has a bachelor’s degree or greater statewide . However, 30% or more of FCC providers in two regions, (11 and 12) have this level of education, while in Region 14, no FCC provider in our sample has a bachelor’s degree or greater . Degrees in the field of early childhood education are held by 27% of FCC providers, but that varies from 17% in Region 13 to 46% in Region 7 .
Regional variation in educational levels of the workforce is likely affected by the wide geographic variation in the availability of educational resources and supports across the state . For many North Carolinians in rural communities, access barriers hinder the ability to obtain continuing education . At times, accessibility can be limited by distance, i .e . the excessive commute to an on-campus class . Other times, accessing higher education in rural areas can be limited by insufficient technological support or resources such as limited internet availability or only dial up access .
Earnings of the Early Care and Education Workforce Workforce earnings in North Carolina remain low . See Table 11 . The median self-reported wage of $10 .00 per hour for child care teachers and assistants in North Carolina does not compare favorably to the starting wage of public school
teachers in the state ($17 .91 per hour not including local supplements) . Child care center directors’ self-reported median hourly wage of $15 .00 barely competes with that of the starting public school teachers despite the added responsibility of running a business . With such low earnings, it is
1510 T .E .A .C .H . Early Childhood® Data received from participant evaluation
received in 2011 .
Table 11Self-Reported Earnings of the Early Care and Education Workforce, 2011-2014
2011 Wage in 2014 dollars
2014 Wage Real Change (2011-2014)
Percent Change 2011-2014
90th percentile wage: Teacher & Asst Teacher $15.22 $14.48 95.1% -4.9%
50th percentile wage: Teacher & Asst Teacher $10.35 $10.00 96.6% -3.4%
10th percentile wage: Teacher & Asst Teacher $7.92 $8.00 101.0% 1.0%
90th percentile wage: Director $26.92 $28.75 106.8% 6.8%
50th percentile wage: Director $15.83 $15.00 94.8% -5.2%
10th percentile wage: Director $10.56 $10.00 94.7% -5.3%
90th percentile wage: FCC Provider $12.88 $13.37 103.8% 3.8%
50th percentile wage: FCC Provider $6.22 $7.05 113.3% 13.3%
10th percentile wage: FCC Provider $0.31 $2.09 674.2% 574.2%
Source: Director, Teacher and FCC Surveys, FCC figures are 2012 earnings reported in 2014 dollars .
no wonder that early care and education teachers (10% of teachers and 15% of assistant teachers) said that they worked another paid job in addition to their job as a teacher or assistant . The median number of hours worked per week in these additional jobs was 13 for teachers and 15 for assistants .
Wage Trends. Wages for the early childhood workforce have not been keeping pace with the cost of living for the most part . See Table 11 . In 2011, teachers and assistants had a median wage of $10 .35 in 2014 dollars . By 2014, the median wage for these early childhood professionals was still only at $10 .00 . This represents a decline in wages of nearly 3 .4% . Real wages declined even more for those in the top 10% of earnings, but those in the bottom ten percent saw their real wages increase somewhat from $7 .92 to $8 .00, an increase of 1% .
Center directors experienced a similar kind of wage trajectory over the last few years . In the mid-range, wages declined from a median of $15 .83 in 2011 to $15 .00 in 2014, a decline in real wages of almost 5 .2% . Those directors at the top, in the 90th percentile, saw a gain of 6 .8% to a real wage $28 .75 per hour . The past few years might be best characterized as one of wage stagnation for most of the early childhood workforce, with some slight improvements for those with the lowest wages and income and for directors with the highest incomes .
The situation for FCC providers involved consistent gains across the board, but their earnings are still quite low . Examining the entire distribution of family child care provider earnings (after expenses) reveals that minimum wage is not reached until the 51st percentile, so that only about half make above minimum wage . These providers also work long hours, which in part accounts for the relatively low hourly wages displayed in Table 11 .
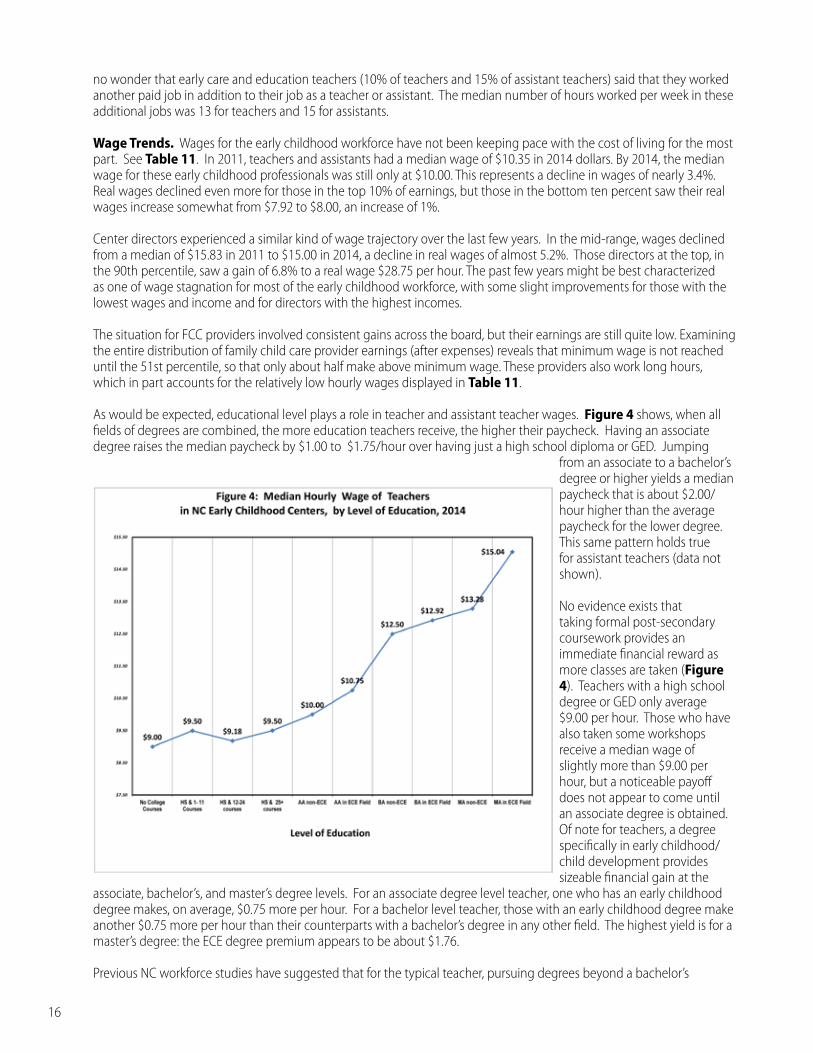
As would be expected, educational level plays a role in teacher and assistant teacher wages . Figure 4 shows, when all fields of degrees are combined, the more education teachers receive, the higher their paycheck . Having an associate degree raises the median paycheck by $1 .00 to $1 .75/hour over having just a high school diploma or GED . Jumping
from an associate to a bachelor’s degree or higher yields a median paycheck that is about $2 .00/hour higher than the average paycheck for the lower degree . This same pattern holds true for assistant teachers (data not shown) .
No evidence exists that taking formal post-secondary coursework provides an immediate financial reward as more classes are taken (Figure 4) . Teachers with a high school degree or GED only average $9 .00 per hour . Those who have also taken some workshops receive a median wage of slightly more than $9 .00 per hour, but a noticeable payoff does not appear to come until an associate degree is obtained . Of note for teachers, a degree specifically in early childhood/child development provides sizeable financial gain at the
associate, bachelor’s, and master’s degree levels . For an associate degree level teacher, one who has an early childhood degree makes, on average, $0 .75 more per hour . For a bachelor level teacher, those with an early childhood degree make another $0 .75 more per hour than their counterparts with a bachelor’s degree in any other field . The highest yield is for a master’s degree: the ECE degree premium appears to be about $1 .76 .
Previous NC workforce studies have suggested that for the typical teacher, pursuing degrees beyond a bachelor’s
16
2014 Working in Child Care in North Carolina l Child Care Services Association, 2014
level in early childhood may not advance wages . In the 2012 survey, teachers with a bachelor’s degree in early childhood/child development, earned a median salary of $13 .84/hour as opposed to teachers with a master’s degree in early childhood/child development who averaged $13 .52/hour . Wage estimates for individuals with master’s degrees in prior studies were inconclusive about the value of ECE/CD master’s degrees in part because they were based on relatively few cases overall and an especially small number of post-baccalaureate degrees in the early childhood/child development field . However, relatively more individuals in the 2013 workforce sample reported both hourly wages and having a master’s degree level of education . Further, in this 2014 study, there is even a larger number of individuals reported having ECE/CD
master’s degrees (N=50) as well as master’s degrees in other fields (N=49) . These replicate our findings from the 2012 and 2013 studies . Although the magnitude of this year’s effects are not as large as in previous years, these results suggest a real wage premium for those with bachelor’s degrees with an early childhood emphasis versus those with a different kind of bachelor’s degree, and an even stronger wage premium occurs for those with an early childhood master’s versus those with a different type of master’s degree .
For assistant teachers, a broad similar trend holds true linking increased education and improved wages, though not as dramatically or consistently as with teachers . The small numbers of assistant teachers, especially at the higher levels of educational attainment, make it difficult to draw firm conclusions about links between education and wages . Further it may be likely that as teacher assistants acquire more academic credentials they may be promoted to become teachers . More definitive examination of career progression and wage progression questions will probably require longtitudinal analyses tracking individuals over time .
Educational attainment is not as clearly linked to income for family child care providers . When grouped into just two categories, earnings do tend to rise for family child care providers . FCC providers without a BA in ECE earn $6 .98 per hour but those with a BA in early childhood education earn $9 .42 per hour . However, the number of FCC providers with this degree is very small and may not yield a reliable estimate No consistent pattern of earnings differences emerged for the AA degree or other levels of education .
The presence of NC Pre-K is a significant factor in teacher pay . As Figure 5 demonstrates, for teachers, being in a center with an NC Pre-K classroom and/or teaching in an NC Pre-K classroom increases the opportunity for a larger paycheck . State policy mandates comparable compensation to public schools for those directly in NC Pre-K classrooms, so a higher salary specifically for NC Pre-K classroom teachers is expected . However, there is no directive for those in non NC Pre-K classrooms operated by centers that also have NC Pre-K classrooms . However, data indicate that there has been a positive impact or “spillover effect” for these teachers as well . Preschool teachers who work in early care and education programs
17
$10.00
$12.00
$15.63
$7.50
$8.50
$9.50
$10.50
$11.50
$12.50
$13.50
$14.50
$15.50
$16.50
ECE Cntr: No NC Pre-k ECE Cntr w/NC Pre-K Teaches NC Pre-K Class
Figure 5: Self Reported Wages of Preschool Teachers in Centers With and Without NC Pre-K Classrooms, 2014
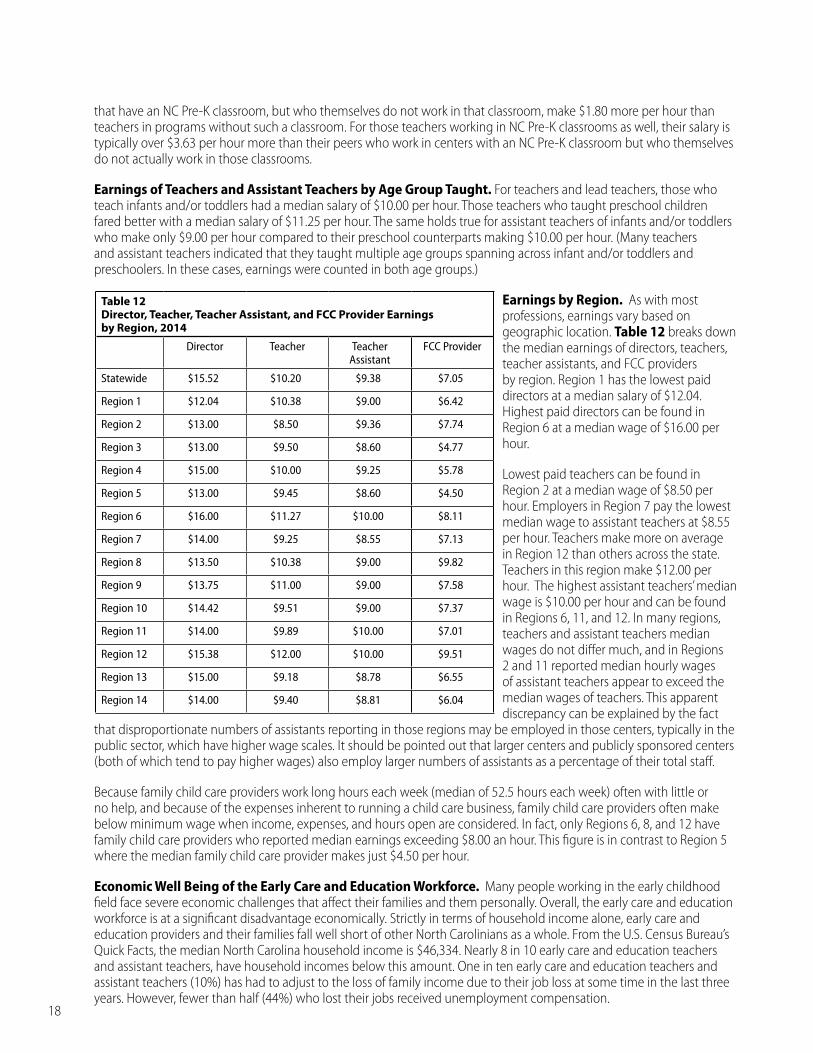
that have an NC Pre-K classroom, but who themselves do not work in that classroom, make $1 .80 more per hour than teachers in programs without such a classroom . For those teachers working in NC Pre-K classrooms as well, their salary is typically over $3 .63 per hour more than their peers who work in centers with an NC Pre-K classroom but who themselves do not actually work in those classrooms .
Earnings of Teachers and Assistant Teachers by Age Group Taught. For teachers and lead teachers, those who teach infants and/or toddlers had a median salary of $10 .00 per hour . Those teachers who taught preschool children fared better with a median salary of $11 .25 per hour . The same holds true for assistant teachers of infants and/or toddlers who make only $9 .00 per hour compared to their preschool counterparts making $10 .00 per hour . (Many teachers and assistant teachers indicated that they taught multiple age groups spanning across infant and/or toddlers and preschoolers . In these cases, earnings were counted in both age groups .)
Earnings by Region. As with most professions, earnings vary based on geographic location . Table 12 breaks down the median earnings of directors, teachers, teacher assistants, and FCC providers by region . Region 1 has the lowest paid directors at a median salary of $12 .04 . Highest paid directors can be found in Region 6 at a median wage of $16 .00 per hour .
Lowest paid teachers can be found in Region 2 at a median wage of $8 .50 per hour . Employers in Region 7 pay the lowest median wage to assistant teachers at $8 .55 per hour . Teachers make more on average in Region 12 than others across the state . Teachers in this region make $12 .00 per hour . The highest assistant teachers’ median wage is $10 .00 per hour and can be found in Regions 6, 11, and 12 . In many regions, teachers and assistant teachers median wages do not differ much, and in Regions 2 and 11 reported median hourly wages of assistant teachers appear to exceed the median wages of teachers . This apparent discrepancy can be explained by the fact
that disproportionate numbers of assistants reporting in those regions may be employed in those centers, typically in the public sector, which have higher wage scales . It should be pointed out that larger centers and publicly sponsored centers (both of which tend to pay higher wages) also employ larger numbers of assistants as a percentage of their total staff .
Because family child care providers work long hours each week (median of 52 .5 hours each week) often with little or no help, and because of the expenses inherent to running a child care business, family child care providers often make below minimum wage when income, expenses, and hours open are considered . In fact, only Regions 6, 8, and 12 have family child care providers who reported median earnings exceeding $8 .00 an hour . This figure is in contrast to Region 5 where the median family child care provider makes just $4 .50 per hour .
Economic Well Being of the Early Care and Education Workforce. Many people working in the early childhood field face severe economic challenges that affect their families and them personally . Overall, the early care and education workforce is at a significant disadvantage economically . Strictly in terms of household income alone, early care and education providers and their families fall well short of other North Carolinians as a whole . From the U .S . Census Bureau’s Quick Facts, the median North Carolina household income is $46,334 . Nearly 8 in 10 early care and education teachers and assistant teachers, have household incomes below this amount . One in ten early care and education teachers and assistant teachers (10%) has had to adjust to the loss of family income due to their job loss at some time in the last three years . However, fewer than half (44%) who lost their jobs received unemployment compensation .
18
Table 12Director, Teacher, Teacher Assistant, and FCC Provider Earnings by Region, 2014
Director Teacher Teacher Assistant
FCC Provider
Statewide $15.52 $10.20 $9.38 $7.05
Region 1 $12.04 $10.38 $9.00 $6.42
Region 2 $13.00 $8.50 $9.36 $7.74
Region 3 $13.00 $9.50 $8.60 $4.77
Region 4 $15.00 $10.00 $9.25 $5.78
Region 5 $13.00 $9.45 $8.60 $4.50
Region 6 $16.00 $11.27 $10.00 $8.11
Region 7 $14.00 $9.25 $8.55 $7.13
Region 8 $13.50 $10.38 $9.00 $9.82
Region 9 $13.75 $11.00 $9.00 $7.58
Region 10 $14.42 $9.51 $9.00 $7.37
Region 11 $14.00 $9.89 $10.00 $7.01
Region 12 $15.38 $12.00 $10.00 $9.51
Region 13 $15.00 $9.18 $8.78 $6.55
Region 14 $14.00 $9.40 $8.81 $6.04
2014 Working in Child Care in North Carolina l Child Care Services Association, 2014
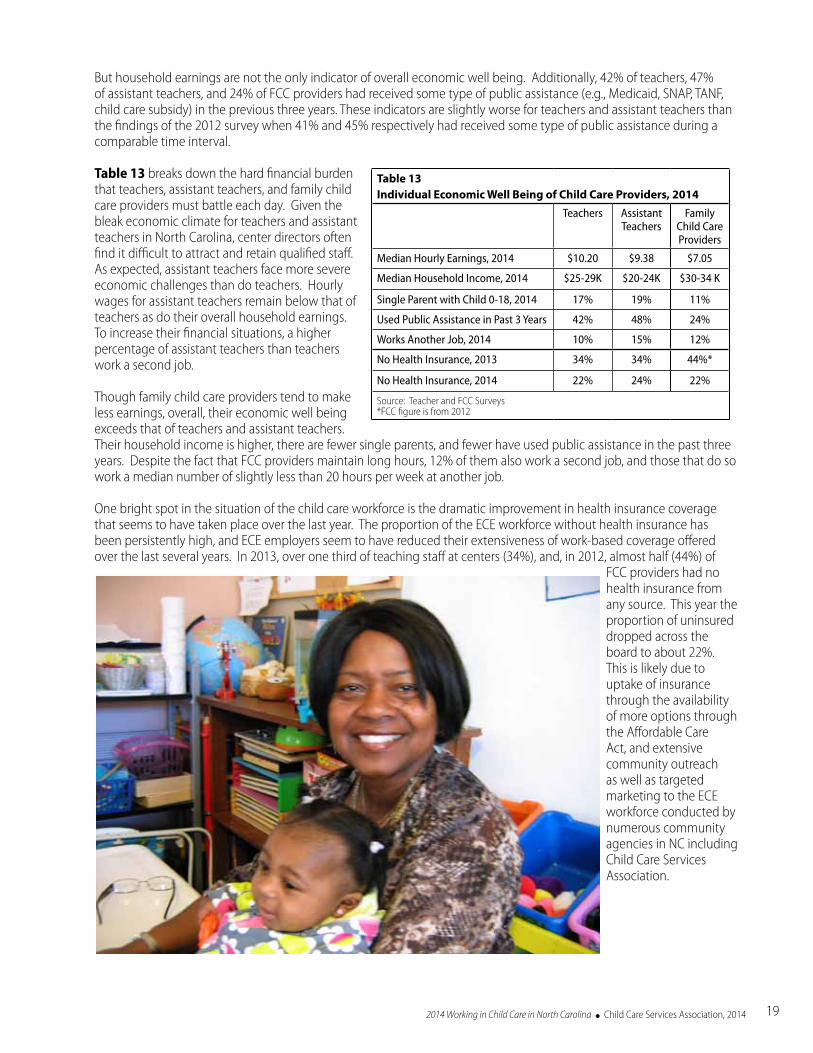
But household earnings are not the only indicator of overall economic well being . Additionally, 42% of teachers, 47% of assistant teachers, and 24% of FCC providers had received some type of public assistance (e .g ., Medicaid, SNAP, TANF, child care subsidy) in the previous three years . These indicators are slightly worse for teachers and assistant teachers than the findings of the 2012 survey when 41% and 45% respectively had received some type of public assistance during a comparable time interval .
Table 13 breaks down the hard financial burden that teachers, assistant teachers, and family child care providers must battle each day . Given the bleak economic climate for teachers and assistant teachers in North Carolina, center directors often find it difficult to attract and retain qualified staff . As expected, assistant teachers face more severe economic challenges than do teachers . Hourly wages for assistant teachers remain below that of teachers as do their overall household earnings . To increase their financial situations, a higher percentage of assistant teachers than teachers work a second job .
Though family child care providers tend to make less earnings, overall, their economic well being exceeds that of teachers and assistant teachers . Their household income is higher, there are fewer single parents, and fewer have used public assistance in the past three years . Despite the fact that FCC providers maintain long hours, 12% of them also work a second job, and those that do so work a median number of slightly less than 20 hours per week at another job .
One bright spot in the situation of the child care workforce is the dramatic improvement in health insurance coverage that seems to have taken place over the last year . The proportion of the ECE workforce without health insurance has been persistently high, and ECE employers seem to have reduced their extensiveness of work-based coverage offered over the last several years . In 2013, over one third of teaching staff at centers (34%), and, in 2012, almost half (44%) of
FCC providers had no health insurance from any source . This year the proportion of uninsured dropped across the board to about 22% . This is likely due to uptake of insurance through the availability of more options through the Affordable Care Act, and extensive community outreach as well as targeted marketing to the ECE workforce conducted by numerous community agencies in NC including Child Care Services Association .
19
Table 13Individual Economic Well Being of Child Care Providers, 2014
Teachers Assistant Teachers
Family Child Care Providers
Median Hourly Earnings, 2014 $10.20 $9.38 $7.05
Median Household Income, 2014 $25-29K $20-24K $30-34 K
Single Parent with Child 0-18, 2014 17% 19% 11%
Used Public Assistance in Past 3 Years 42% 48% 24%
Works Another Job, 2014 10% 15% 12%
No Health Insurance, 2013 34% 34% 44%*
No Health Insurance, 2014 22% 24% 22%
Source: Teacher and FCC Surveys *FCC figure is from 2012
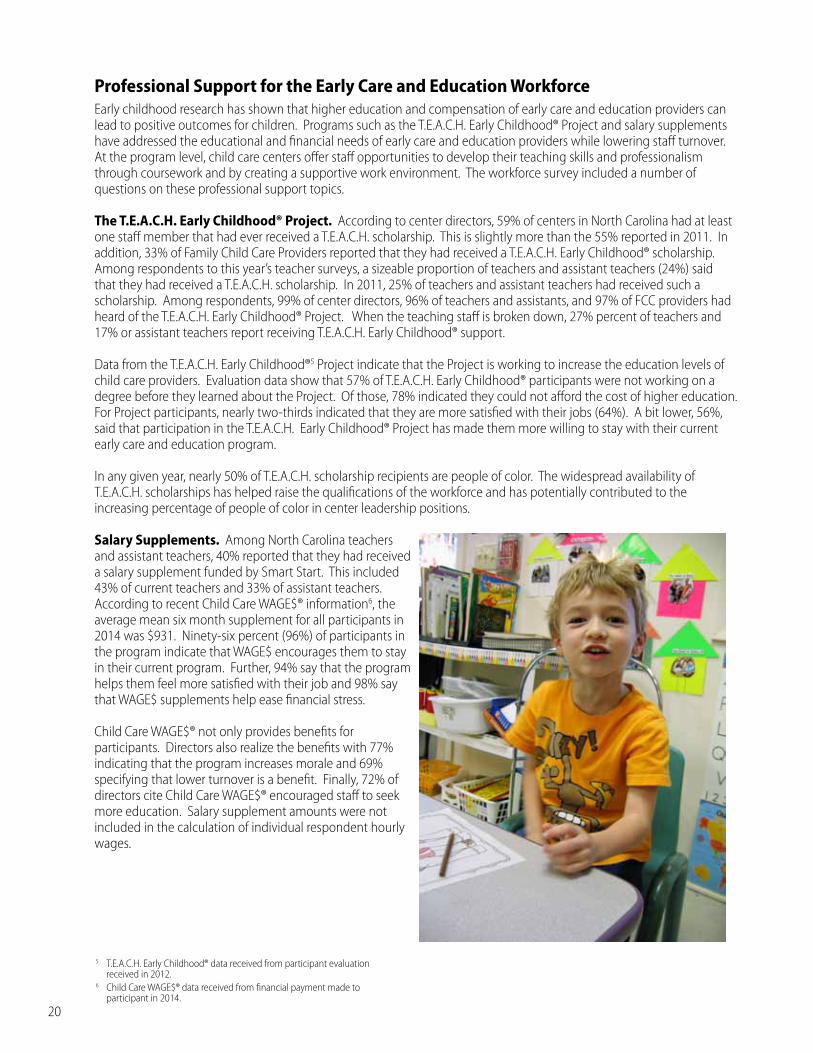
Professional Support for the Early Care and Education Workforce Early childhood research has shown that higher education and compensation of early care and education providers can lead to positive outcomes for children . Programs such as the T .E .A .C .H . Early Childhood® Project and salary supplements have addressed the educational and financial needs of early care and education providers while lowering staff turnover . At the program level, child care centers offer staff opportunities to develop their teaching skills and professionalism through coursework and by creating a supportive work environment . The workforce survey included a number of questions on these professional support topics .
The T.E.A.C.H. Early Childhood® Project. According to center directors, 59% of centers in North Carolina had at least one staff member that had ever received a T .E .A .C .H . scholarship . This is slightly more than the 55% reported in 2011 . In addition, 33% of Family Child Care Providers reported that they had received a T .E .A .C .H . Early Childhood® scholarship . Among respondents to this year’s teacher surveys, a sizeable proportion of teachers and assistant teachers (24%) said that they had received a T .E .A .C .H . scholarship . In 2011, 25% of teachers and assistant teachers had received such a scholarship . Among respondents, 99% of center directors, 96% of teachers and assistants, and 97% of FCC providers had heard of the T .E .A .C .H . Early Childhood® Project . When the teaching staff is broken down, 27% percent of teachers and 17% or assistant teachers report receiving T .E .A .C .H . Early Childhood® support .
Data from the T .E .A .C .H . Early Childhood®5 Project indicate that the Project is working to increase the education levels of child care providers . Evaluation data show that 57% of T .E .A .C .H . Early Childhood® participants were not working on a degree before they learned about the Project . Of those, 78% indicated they could not afford the cost of higher education . For Project participants, nearly two-thirds indicated that they are more satisfied with their jobs (64%) . A bit lower, 56%, said that participation in the T .E .A .C .H . Early Childhood® Project has made them more willing to stay with their current early care and education program .
In any given year, nearly 50% of T .E .A .C .H . scholarship recipients are people of color . The widespread availability of T .E .A .C .H . scholarships has helped raise the qualifications of the workforce and has potentially contributed to the increasing percentage of people of color in center leadership positions .
Salary Supplements. Among North Carolina teachers and assistant teachers, 40% reported that they had received a salary supplement funded by Smart Start . This included 43% of current teachers and 33% of assistant teachers . According to recent Child Care WAGE$® information6, the average mean six month supplement for all participants in 2014 was $931 . Ninety-six percent (96%) of participants in the program indicate that WAGE$ encourages them to stay in their current program . Further, 94% say that the program helps them feel more satisfied with their job and 98% say that WAGE$ supplements help ease financial stress .
Child Care WAGE$® not only provides benefits for participants . Directors also realize the benefits with 77% indicating that the program increases morale and 69% specifying that lower turnover is a benefit . Finally, 72% of directors cite Child Care WAGE$® encouraged staff to seek more education . Salary supplement amounts were not included in the calculation of individual respondent hourly wages .
20
5 T .E .A .C .H . Early Childhood® data received from participant evaluation received in 2012 .
6 Child Care WAGE$® data received from financial payment made to participant in 2014 .
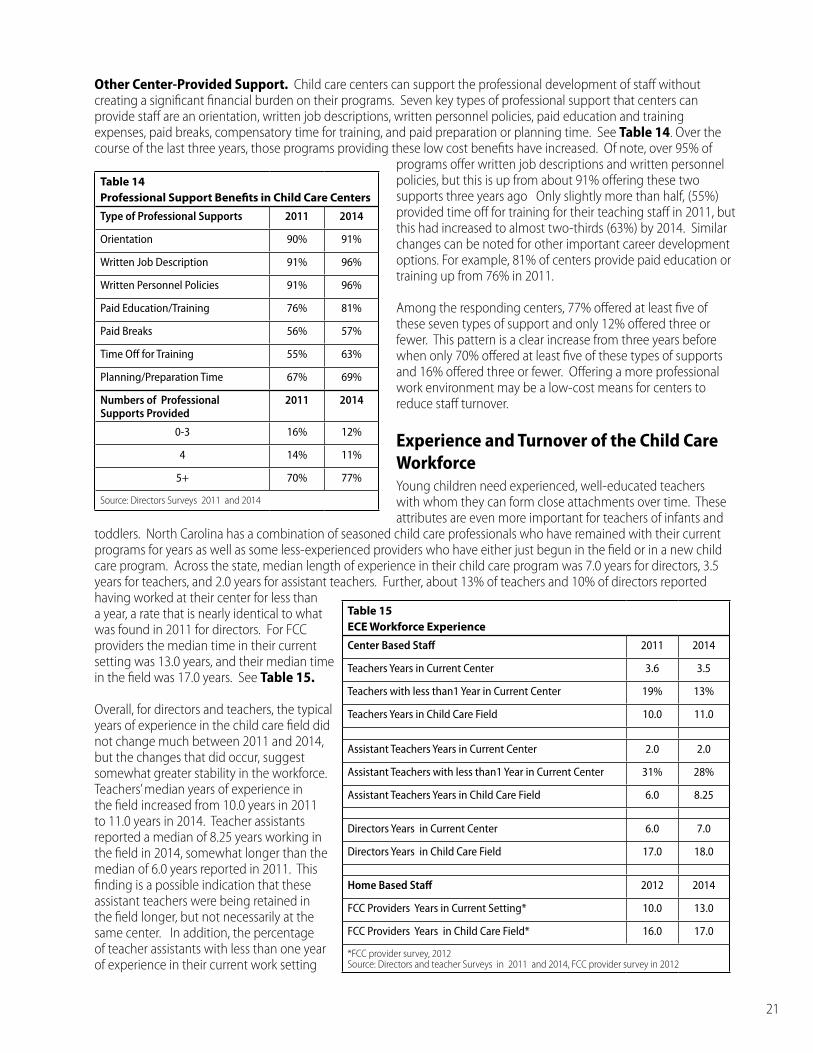
Other Center-Provided Support. Child care centers can support the professional development of staff without creating a significant financial burden on their programs . Seven key types of professional support that centers can provide staff are an orientation, written job descriptions, written personnel policies, paid education and training expenses, paid breaks, compensatory time for training, and paid preparation or planning time . See Table 14 . Over the course of the last three years, those programs providing these low cost benefits have increased . Of note, over 95% of
programs offer written job descriptions and written personnel policies, but this is up from about 91% offering these two supports three years ago Only slightly more than half, (55%) provided time off for training for their teaching staff in 2011, but this had increased to almost two-thirds (63%) by 2014 . Similar changes can be noted for other important career development options . For example, 81% of centers provide paid education or training up from 76% in 2011 .
Among the responding centers, 77% offered at least five of these seven types of support and only 12% offered three or fewer . This pattern is a clear increase from three years before when only 70% offered at least five of these types of supports and 16% offered three or fewer . Offering a more professional work environment may be a low-cost means for centers to reduce staff turnover .
Experience and Turnover of the Child Care WorkforceYoung children need experienced, well-educated teachers with whom they can form close attachments over time . These attributes are even more important for teachers of infants and
toddlers . North Carolina has a combination of seasoned child care professionals who have remained with their current programs for years as well as some less-experienced providers who have either just begun in the field or in a new child care program . Across the state, median length of experience in their child care program was 7 .0 years for directors, 3 .5 years for teachers, and 2 .0 years for assistant teachers . Further, about 13% of teachers and 10% of directors reported having worked at their center for less than a year, a rate that is nearly identical to what was found in 2011 for directors . For FCC providers the median time in their current setting was 13 .0 years, and their median time in the field was 17 .0 years . See Table 15.
Overall, for directors and teachers, the typical years of experience in the child care field did not change much between 2011 and 2014, but the changes that did occur, suggest somewhat greater stability in the workforce . Teachers’ median years of experience in the field increased from 10 .0 years in 2011 to 11 .0 years in 2014 . Teacher assistants reported a median of 8 .25 years working in the field in 2014, somewhat longer than the median of 6 .0 years reported in 2011 . This finding is a possible indication that these assistant teachers were being retained in the field longer, but not necessarily at the same center . In addition, the percentage of teacher assistants with less than one year of experience in their current work setting
21
Table 14Professional Support Benefits in Child Care Centers
Type of Professional Supports 2011 2014
Orientation 90% 91%
Written Job Description 91% 96%
Written Personnel Policies 91% 96%
Paid Education/Training 76% 81%
Paid Breaks 56% 57%
Time Off for Training 55% 63%
Planning/Preparation Time 67% 69%
Numbers of Professional Supports Provided
2011 2014
0-3 16% 12%
4 14% 11%
5+ 70% 77%
Source: Directors Surveys 2011 and 2014
Table 15ECE Workforce Experience
Center Based Staff 2011 2014
Teachers Years in Current Center 3.6 3.5
Teachers with less than1 Year in Current Center 19% 13%
Teachers Years in Child Care Field 10.0 11.0
Assistant Teachers Years in Current Center 2.0 2.0
Assistant Teachers with less than1 Year in Current Center 31% 28%
Assistant Teachers Years in Child Care Field 6.0 8.25
Directors Years in Current Center 6.0 7.0
Directors Years in Child Care Field 17.0 18.0
Home Based Staff 2012 2014
FCC Providers Years in Current Setting* 10.0 13.0
FCC Providers Years in Child Care Field* 16.0 17.0
*FCC provider survey, 2012 Source: Directors and teacher Surveys in 2011 and 2014, FCC provider survey in 2012
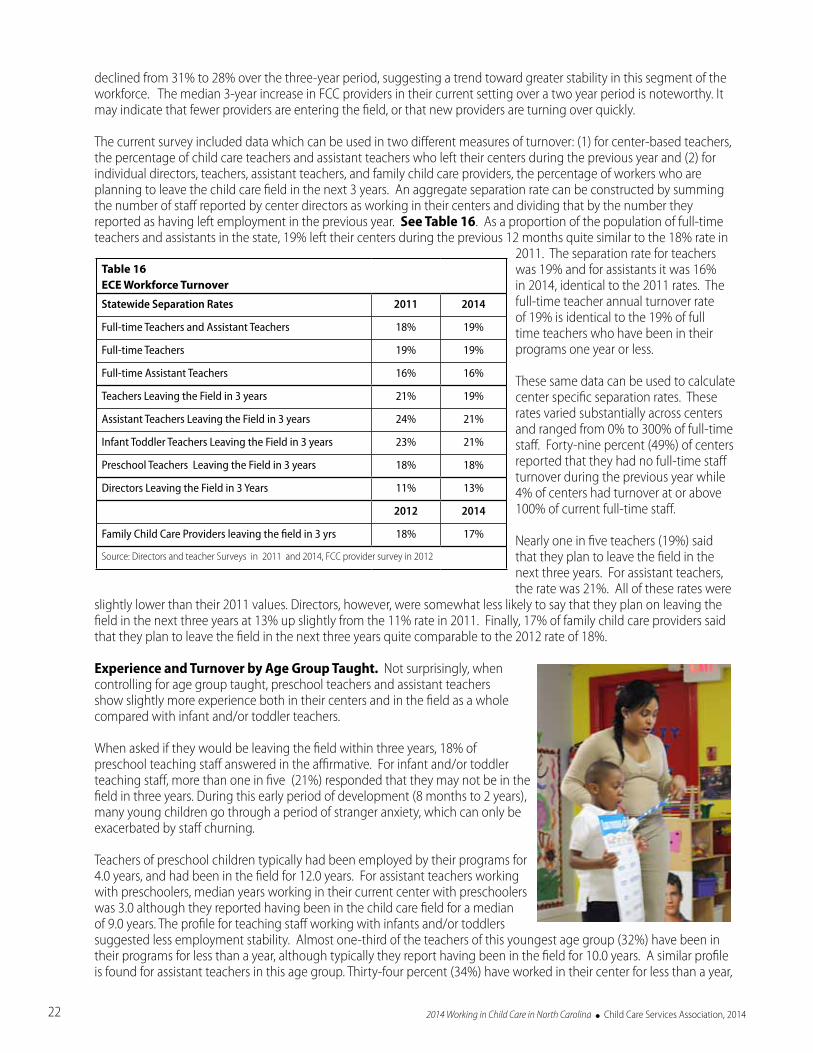
2014 Working in Child Care in North Carolina l Child Care Services Association, 2014
declined from 31% to 28% over the three-year period, suggesting a trend toward greater stability in this segment of the workforce . The median 3-year increase in FCC providers in their current setting over a two year period is noteworthy . It may indicate that fewer providers are entering the field, or that new providers are turning over quickly .
The current survey included data which can be used in two different measures of turnover: (1) for center-based teachers, the percentage of child care teachers and assistant teachers who left their centers during the previous year and (2) for individual directors, teachers, assistant teachers, and family child care providers, the percentage of workers who are planning to leave the child care field in the next 3 years . An aggregate separation rate can be constructed by summing the number of staff reported by center directors as working in their centers and dividing that by the number they reported as having left employment in the previous year . See Table 16 . As a proportion of the population of full-time teachers and assistants in the state, 19% left their centers during the previous 12 months quite similar to the 18% rate in
2011 . The separation rate for teachers was 19% and for assistants it was 16% in 2014, identical to the 2011 rates . The full-time teacher annual turnover rate of 19% is identical to the 19% of full time teachers who have been in their programs one year or less .
These same data can be used to calculate center specific separation rates . These rates varied substantially across centers and ranged from 0% to 300% of full-time staff . Forty-nine percent (49%) of centers reported that they had no full-time staff turnover during the previous year while 4% of centers had turnover at or above 100% of current full-time staff .
Nearly one in five teachers (19%) said that they plan to leave the field in the next three years . For assistant teachers, the rate was 21% . All of these rates were
slightly lower than their 2011 values . Directors, however, were somewhat less likely to say that they plan on leaving the field in the next three years at 13% up slightly from the 11% rate in 2011 . Finally, 17% of family child care providers said that they plan to leave the field in the next three years quite comparable to the 2012 rate of 18% .
Experience and Turnover by Age Group Taught. Not surprisingly, when controlling for age group taught, preschool teachers and assistant teachers show slightly more experience both in their centers and in the field as a whole compared with infant and/or toddler teachers .
When asked if they would be leaving the field within three years, 18% of preschool teaching staff answered in the affirmative . For infant and/or toddler teaching staff, more than one in five (21%) responded that they may not be in the field in three years . During this early period of development (8 months to 2 years), many young children go through a period of stranger anxiety, which can only be exacerbated by staff churning .
Teachers of preschool children typically had been employed by their programs for 4 .0 years, and had been in the field for 12 .0 years . For assistant teachers working with preschoolers, median years working in their current center with preschoolers was 3 .0 although they reported having been in the child care field for a median of 9 .0 years . The profile for teaching staff working with infants and/or toddlers suggested less employment stability . Almost one-third of the teachers of this youngest age group (32%) have been in their programs for less than a year, although typically they report having been in the field for 10 .0 years . A similar profile is found for assistant teachers in this age group . Thirty-four percent (34%) have worked in their center for less than a year,
22
Table 16ECE Workforce Turnover
Statewide Separation Rates 2011 2014
Full-time Teachers and Assistant Teachers 18% 19%
Full-time Teachers 19% 19%
Full-time Assistant Teachers 16% 16%
Teachers Leaving the Field in 3 years 21% 19%
Assistant Teachers Leaving the Field in 3 years 24% 21%
Infant Toddler Teachers Leaving the Field in 3 years 23% 21%
Preschool Teachers Leaving the Field in 3 years 18% 18%
Directors Leaving the Field in 3 Years 11% 13%
2012 2014
Family Child Care Providers leaving the field in 3 yrs 18% 17%
Source: Directors and teacher Surveys in 2011 and 2014, FCC provider survey in 2012
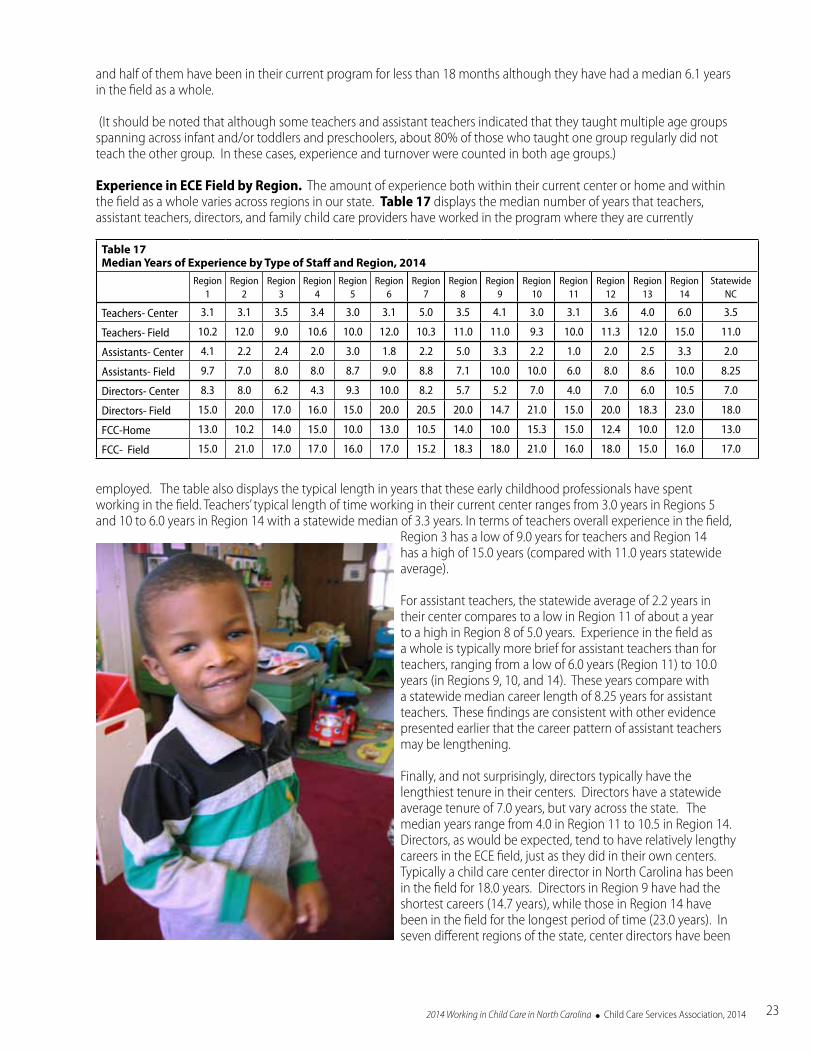
2014 Working in Child Care in North Carolina l Child Care Services Association, 2014 23
and half of them have been in their current program for less than 18 months although they have had a median 6 .1 years in the field as a whole .
(It should be noted that although some teachers and assistant teachers indicated that they taught multiple age groups spanning across infant and/or toddlers and preschoolers, about 80% of those who taught one group regularly did not teach the other group . In these cases, experience and turnover were counted in both age groups .)
Experience in ECE Field by Region. The amount of experience both within their current center or home and within the field as a whole varies across regions in our state . Table 17 displays the median number of years that teachers, assistant teachers, directors, and family child care providers have worked in the program where they are currently
employed . The table also displays the typical length in years that these early childhood professionals have spent working in the field . Teachers’ typical length of time working in their current center ranges from 3 .0 years in Regions 5 and 10 to 6 .0 years in Region 14 with a statewide median of 3 .3 years . In terms of teachers overall experience in the field,
Region 3 has a low of 9 .0 years for teachers and Region 14 has a high of 15 .0 years (compared with 11 .0 years statewide average) .
For assistant teachers, the statewide average of 2 .2 years in their center compares to a low in Region 11 of about a year to a high in Region 8 of 5 .0 years . Experience in the field as a whole is typically more brief for assistant teachers than for teachers, ranging from a low of 6 .0 years (Region 11) to 10 .0 years (in Regions 9, 10, and 14) . These years compare with a statewide median career length of 8 .25 years for assistant teachers . These findings are consistent with other evidence presented earlier that the career pattern of assistant teachers may be lengthening .
Finally, and not surprisingly, directors typically have the lengthiest tenure in their centers . Directors have a statewide average tenure of 7 .0 years, but vary across the state . The median years range from 4 .0 in Region 11 to 10 .5 in Region 14 . Directors, as would be expected, tend to have relatively lengthy careers in the ECE field, just as they did in their own centers . Typically a child care center director in North Carolina has been in the field for 18 .0 years . Directors in Region 9 have had the shortest careers (14 .7 years), while those in Region 14 have been in the field for the longest period of time (23 .0 years) . In seven different regions of the state, center directors have been
Table 17Median Years of Experience by Type of Staff and Region, 2014
Region 1
Region 2
Region 3
Region 4
Region 5
Region 6
Region 7
Region 8
Region 9
Region 10
Region 11
Region 12
Region 13
Region 14
Statewide NC
Teachers- Center 3.1 3.1 3.5 3.4 3.0 3.1 5.0 3.5 4.1 3.0 3.1 3.6 4.0 6.0 3.5
Teachers- Field 10.2 12.0 9.0 10.6 10.0 12.0 10.3 11.0 11.0 9.3 10.0 11.3 12.0 15.0 11.0
Assistants- Center 4.1 2.2 2.4 2.0 3.0 1.8 2.2 5.0 3.3 2.2 1.0 2.0 2.5 3.3 2.0
Assistants- Field 9.7 7.0 8.0 8.0 8.7 9.0 8.8 7.1 10.0 10.0 6.0 8.0 8.6 10.0 8.25
Directors- Center 8.3 8.0 6.2 4.3 9.3 10.0 8.2 5.7 5.2 7.0 4.0 7.0 6.0 10.5 7.0
Directors- Field 15.0 20.0 17.0 16.0 15.0 20.0 20.5 20.0 14.7 21.0 15.0 20.0 18.3 23.0 18.0
FCC-Home 13.0 10.2 14.0 15.0 10.0 13.0 10.5 14.0 10.0 15.3 15.0 12.4 10.0 12.0 13.0
FCC- Field 15.0 21.0 17.0 17.0 16.0 17.0 15.2 18.3 18.0 21.0 16.0 18.0 15.0 16.0 17.0

2014 Working in Child Care in North Carolina l Child Care Services Association, 201424
in the ECE field typically for two decades or more .
Family child care providers have been in business for an average of 13 .0 years statewide, and in every region typically have been in business for a decade or more and in the field for at least 15 years . Home providers in Regions 4 and 11 have typically owned their businesses for 15 years compared to Regions 5, 9, and 13 where providers average 10 years . In terms of overall experience in the field, Regions 1 and 13 have a low of 15 years for family child care providers and Region 10 has a high of 21 .0 years . This figure compares to a 17 .0 year statewide average .
Workforce Retention. Survey respondents who indicated that they planned to leave the field within three years were then asked what would make them stay in the field . Directors and teachers provided some similar and some different motivators stemming from the unique roles and responsibilities of each group . Higher earnings were listed by the largest group of directors (44%) as a motivator to stay in the field . See Table 18 . Likewise, more benefits was also a concern of many directors (31%), while fewer problems with money for the center was also listed by 28% of directors as a way to keep them in the field . The remaining items suggest that almost one in five of those directors intending to leave the field within the next three years might be deterred from doing so if there were better professional growth opportunities and an easier mechanism for finding substitute teachers . More administrative help and the availability of more qualified teachers might also deter some directors’ withdrawal from the early childhood field . Despite these factors, it is important to note that more than a quarter of the directors (26%) who are planning to leave the field in the next few years said nothing would stop them from doing this, as they are planning on retiring .
Table 18Factors Motivating ECE Directors and FCC Providers to Stay in the Field, 2014
Center Directors Family Child Care Providers
Motivator Percent Naming this Motivator
Motivator Percent Naming this Motivator
More pay 45% Earn more money 47%
More benefits 31% More time off 28%
Fewer money problems for center 28% Finding substitutes 23%
Finding qualified teachers 23% Receive training 15%
More administrative help 17% More respect from families
13%
Working fewer hours 17% Meet others 11%
Professional growth opportunities 17%
Better working conditions 11% Other reason 43%
Finding substitutes 11%
Source: Director Surveys Source: FCC Surveys
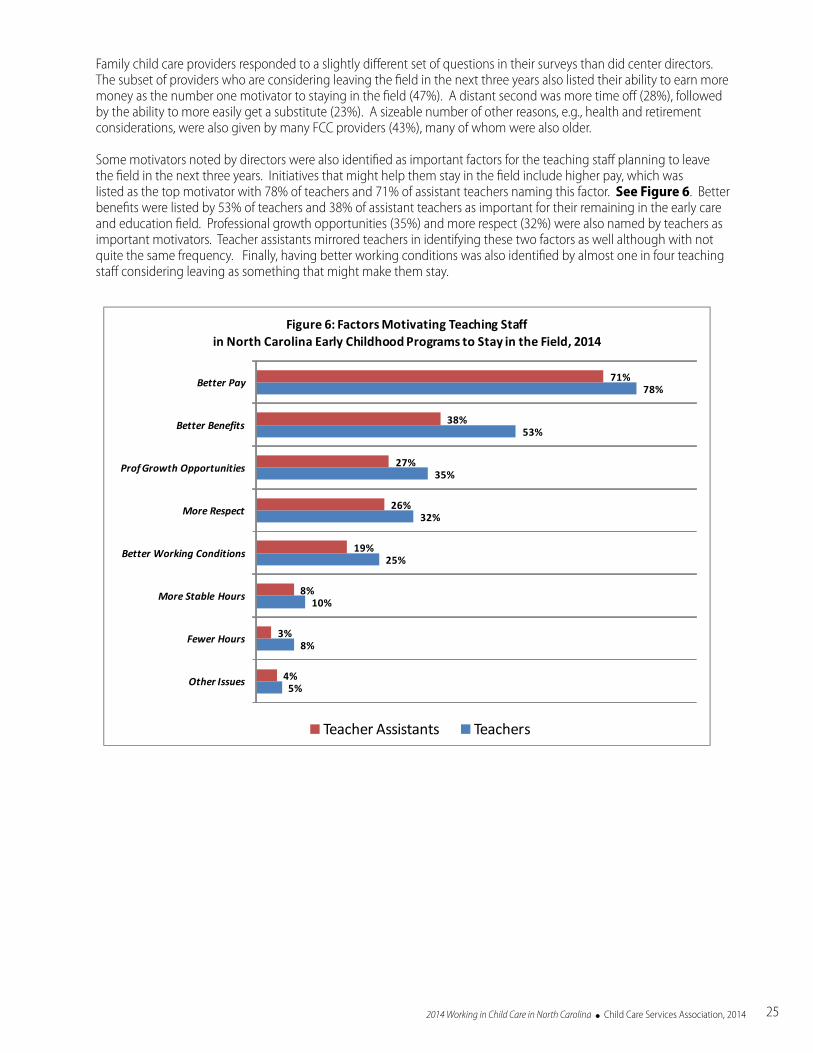
2014 Working in Child Care in North Carolina l Child Care Services Association, 2014 25
Family child care providers responded to a slightly different set of questions in their surveys than did center directors . The subset of providers who are considering leaving the field in the next three years also listed their ability to earn more money as the number one motivator to staying in the field (47%) . A distant second was more time off (28%), followed by the ability to more easily get a substitute (23%) . A sizeable number of other reasons, e .g ., health and retirement considerations, were also given by many FCC providers (43%), many of whom were also older .
Some motivators noted by directors were also identified as important factors for the teaching staff planning to leave the field in the next three years . Initiatives that might help them stay in the field include higher pay, which was listed as the top motivator with 78% of teachers and 71% of assistant teachers naming this factor . See Figure 6 . Better benefits were listed by 53% of teachers and 38% of assistant teachers as important for their remaining in the early care and education field . Professional growth opportunities (35%) and more respect (32%) were also named by teachers as important motivators . Teacher assistants mirrored teachers in identifying these two factors as well although with not quite the same frequency . Finally, having better working conditions was also identified by almost one in four teaching staff considering leaving as something that might make them stay .
5%
8%
10%
25%
32%
35%
53%
78%
4%
3%
8%
19%
26%
27%
38%
71%
Other Issues
Fewer Hours
More Stable Hours
Better Working Conditions
More Respect
Prof Growth Opportunities
Better Benefits
Better Pay
Figure 6: Factors Motivating Teaching Staff in North Carolina Early Childhood Programs to Stay in the Field, 2014
Teacher Assistants Teachers

2014 Working in Child Care in North Carolina l Child Care Services Association, 201426
Remarkable progress has been made in the education of the early care and education workforce in North Carolina . In the most recent period covered in this report, 2011-2014, the profession continues to show slow, but steady progress . With a significant percentage of center directors holding a two year degree or higher has come some salary gains in some employment settings, though overall the increase continues to fall far short of public school teacher salaries and in general has not kept up with inflation . Similarly, teachers and family child care providers have also increased their education levels although they are not seeing parallel increases in compensation . Regardless, early care and education providers are feeling the rewards of the field and remaining in their chosen profession . The median duration of careers in the field for all types of ECE professionals (18 years for directors, 11 years for teachers, 8 .25 years for assistant teachers, and 17 years for family child care providers), is quite remarkable given the challenges that the field presents .
Centers seem to be doing their share for advancing employees by providing supports and services to their staff . Maintaining or increasing employees’ wages and health insurance coverage remains a challenge for all small businesses in this state and elsewhere, and in this respect, the centers in North Carolina profiled in this report are no exception . However, what does distinguish North Carolina’s early care and education sector is notable expansions in the range of employment benefits provided to teaching staff in recent years . Three distinct types of improvements stand out:
• expanding the use of some HR practices and policies such as formal orientation programs and the institution of standardized job descriptions and personnel policies that hold the promise of making employees’ work lives more rational and predictable;
• increasing and broadening support for employee career development and recognition of teachers as educational professionals through targeted benefits such as paid breaks, time off for training, and payment for preparation and planning time; and
• providing in-kind support in the form of free or reduced rate child care services for employees, many of whom are the heads of struggling young families faced with their own need for safe, affordable, quality child care .
These particular kind of benefits do come at some cost to employers but are not reflected in the actual paychecks that their employees receive . However, they do represent rational human resource investments that will pay dividends in the short and long term . Such investments are likely to have a near term impact on the lives of their employees, enabling them to advance careers as educational professionals . They may help as well promote a healthier work-family balance, and enrich the lives of these teachers’ children . To the extent that such benefits encourage stability in the workforce and reduce employee turnover, they will affect employer viability and enhance the capacity of these providers to provide quality services to the larger community .
Although the educational profile of teaching staff and directors has not changed much in the last two years, the 2014 workforce reflects a substantial improvement in the situation from over a decade ago when only 5% of the teaching staff had at least a bachelor’s degree with an ECE/CD emphasis . By 2014 that percentage had almost tripled . Similarly only 11% of teachers had an AA degree in ECE/CD in 2003, while over 1 in 5 had this degree in 2014 . Over the same period, the percentage of directors with a bachelor’s degree or more in ECE/CD more than doubled from 10% to 23% .
Despite the fact that there have not been widespread gains in the material rewards for ECE teachers overall, significant sectors within the profession have sought and received more education and been rewarded with more compensation . Many more teachers continue to seek additional educational experiences and credentials even as they remain actively engaged in the workforce and providing service to North Carolina’s young children .
For these individual teachers, these educational gains have translated into increased wages and career mobility, and the positive relationship between more education and higher wages has been demonstrated across the state in all
Conclusion
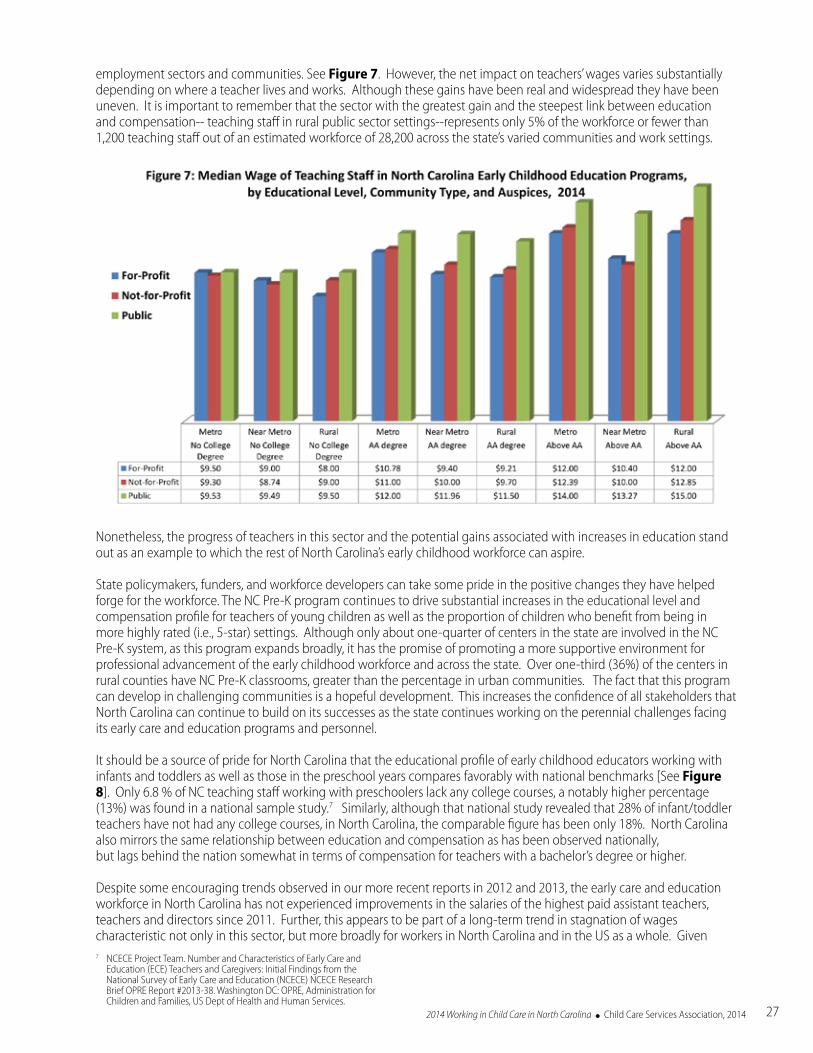
2014 Working in Child Care in North Carolina l Child Care Services Association, 2014 27
employment sectors and communities . See Figure 7 . However, the net impact on teachers’ wages varies substantially depending on where a teacher lives and works . Although these gains have been real and widespread they have been uneven . It is important to remember that the sector with the greatest gain and the steepest link between education and compensation-- teaching staff in rural public sector settings--represents only 5% of the workforce or fewer than 1,200 teaching staff out of an estimated workforce of 28,200 across the state’s varied communities and work settings .
Nonetheless, the progress of teachers in this sector and the potential gains associated with increases in education stand out as an example to which the rest of North Carolina’s early childhood workforce can aspire .
State policymakers, funders, and workforce developers can take some pride in the positive changes they have helped forge for the workforce . The NC Pre-K program continues to drive substantial increases in the educational level and compensation profile for teachers of young children as well as the proportion of children who benefit from being in more highly rated (i .e ., 5-star) settings . Although only about one-quarter of centers in the state are involved in the NC Pre-K system, as this program expands broadly, it has the promise of promoting a more supportive environment for professional advancement of the early childhood workforce and across the state . Over one-third (36%) of the centers in rural counties have NC Pre-K classrooms, greater than the percentage in urban communities . The fact that this program can develop in challenging communities is a hopeful development . This increases the confidence of all stakeholders that North Carolina can continue to build on its successes as the state continues working on the perennial challenges facing its early care and education programs and personnel .
It should be a source of pride for North Carolina that the educational profile of early childhood educators working with infants and toddlers as well as those in the preschool years compares favorably with national benchmarks [See Figure 8] . Only 6 .8 % of NC teaching staff working with preschoolers lack any college courses, a notably higher percentage (13%) was found in a national sample study .7 Similarly, although that national study revealed that 28% of infant/toddler teachers have not had any college courses, in North Carolina, the comparable figure has been only 18% . North Carolina also mirrors the same relationship between education and compensation as has been observed nationally, but lags behind the nation somewhat in terms of compensation for teachers with a bachelor’s degree or higher .
Despite some encouraging trends observed in our more recent reports in 2012 and 2013, the early care and education workforce in North Carolina has not experienced improvements in the salaries of the highest paid assistant teachers, teachers and directors since 2011 . Further, this appears to be part of a long-term trend in stagnation of wages characteristic not only in this sector, but more broadly for workers in North Carolina and in the US as a whole . Given 7 NCECE Project Team . Number and Characteristics of Early Care and
Education (ECE) Teachers and Caregivers: Initial Findings from the National Survey of Early Care and Education (NCECE) NCECE Research Brief OPRE Report #2013-38 . Washington DC: OPRE, Administration for Children and Families, US Dept of Health and Human Services .
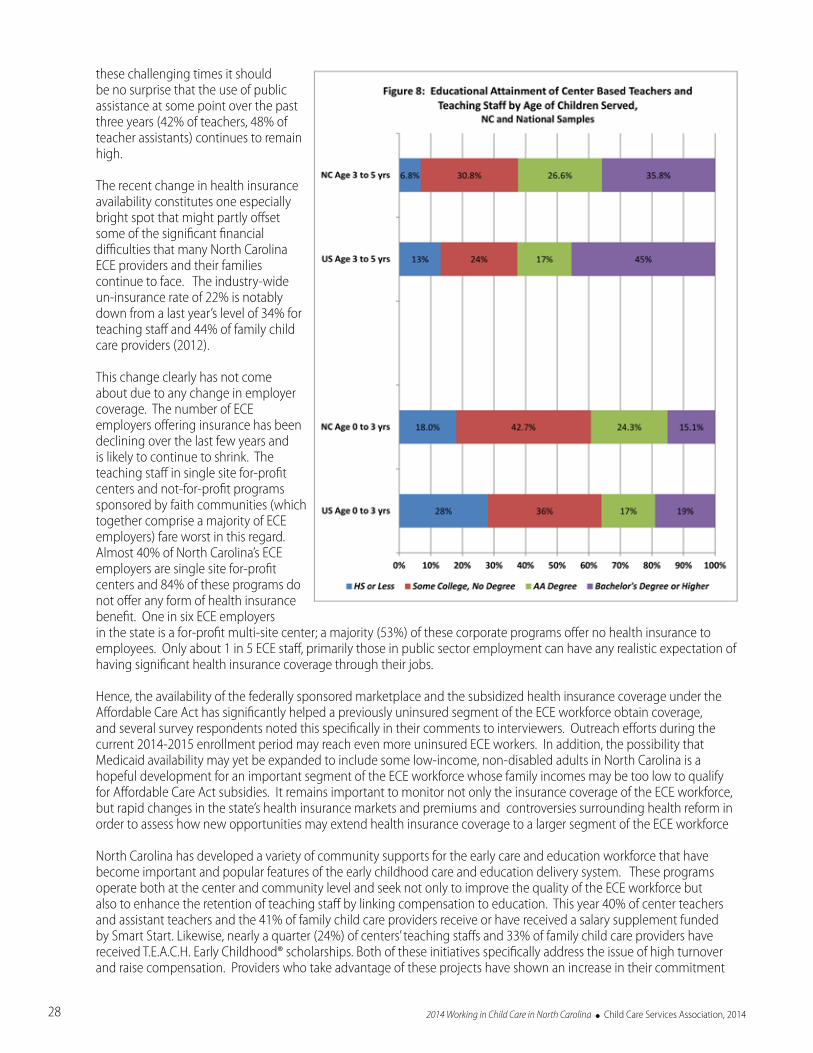
2014 Working in Child Care in North Carolina l Child Care Services Association, 201428
these challenging times it should be no surprise that the use of public assistance at some point over the past three years (42% of teachers, 48% of teacher assistants) continues to remain high .
The recent change in health insurance availability constitutes one especially bright spot that might partly offset some of the significant financial difficulties that many North Carolina ECE providers and their families continue to face . The industry-wide un-insurance rate of 22% is notably down from a last year’s level of 34% for teaching staff and 44% of family child care providers (2012) .
This change clearly has not come about due to any change in employer coverage . The number of ECE employers offering insurance has been declining over the last few years and is likely to continue to shrink . The teaching staff in single site for-profit centers and not-for-profit programs sponsored by faith communities (which together comprise a majority of ECE employers) fare worst in this regard . Almost 40% of North Carolina’s ECE employers are single site for-profit centers and 84% of these programs do not offer any form of health insurance benefit . One in six ECE employers in the state is a for-profit multi-site center; a majority (53%) of these corporate programs offer no health insurance to employees . Only about 1 in 5 ECE staff, primarily those in public sector employment can have any realistic expectation of having significant health insurance coverage through their jobs .
Hence, the availability of the federally sponsored marketplace and the subsidized health insurance coverage under the Affordable Care Act has significantly helped a previously uninsured segment of the ECE workforce obtain coverage, and several survey respondents noted this specifically in their comments to interviewers . Outreach efforts during the current 2014-2015 enrollment period may reach even more uninsured ECE workers . In addition, the possibility that Medicaid availability may yet be expanded to include some low-income, non-disabled adults in North Carolina is a hopeful development for an important segment of the ECE workforce whose family incomes may be too low to qualify for Affordable Care Act subsidies . It remains important to monitor not only the insurance coverage of the ECE workforce, but rapid changes in the state’s health insurance markets and premiums and controversies surrounding health reform in order to assess how new opportunities may extend health insurance coverage to a larger segment of the ECE workforce
North Carolina has developed a variety of community supports for the early care and education workforce that have become important and popular features of the early childhood care and education delivery system . These programs operate both at the center and community level and seek not only to improve the quality of the ECE workforce but also to enhance the retention of teaching staff by linking compensation to education . This year 40% of center teachers and assistant teachers and the 41% of family child care providers receive or have received a salary supplement funded by Smart Start . Likewise, nearly a quarter (24%) of centers’ teaching staffs and 33% of family child care providers have received T .E .A .C .H . Early Childhood® scholarships . Both of these initiatives specifically address the issue of high turnover and raise compensation . Providers who take advantage of these projects have shown an increase in their commitment

2014 Working in Child Care in North Carolina l Child Care Services Association, 2014 29
to remaining in their programs for a period of time . Turnover of staff in NC centers has remained at similar levels and patterns as those observed in 2011, but lower than it was a decade ago .
Overall, North Carolina has remained stagnant or suffered losses in the typical wages paid assistant teachers, teachers and directors over the last decade . Despite this, center based staff have been working in their programs at about the same length of time as they were in 2011, but this remains at a higher level than was the case a decade ago . The constant challenge of supporting workforce professional development while raising wages and lowering turnover is clearly at play across North Carolina . Early childhood programs and the workforce face some significant challenges . Without some new and targeted investments, North Carolina’s gains over the last ten years may have peaked and may actually decline as the rest of the economy improves . The availability of better paying jobs in the coming years may actually draw away those in the workforce that have become better educated, because wages in early childhood programs have not kept up . At this point, however, North Carolina can remain cautiously optimistic that the early care and education workforce will continue to demonstrate resilience in advancing their profession and their dedication to the cause of North Carolina’s young children .
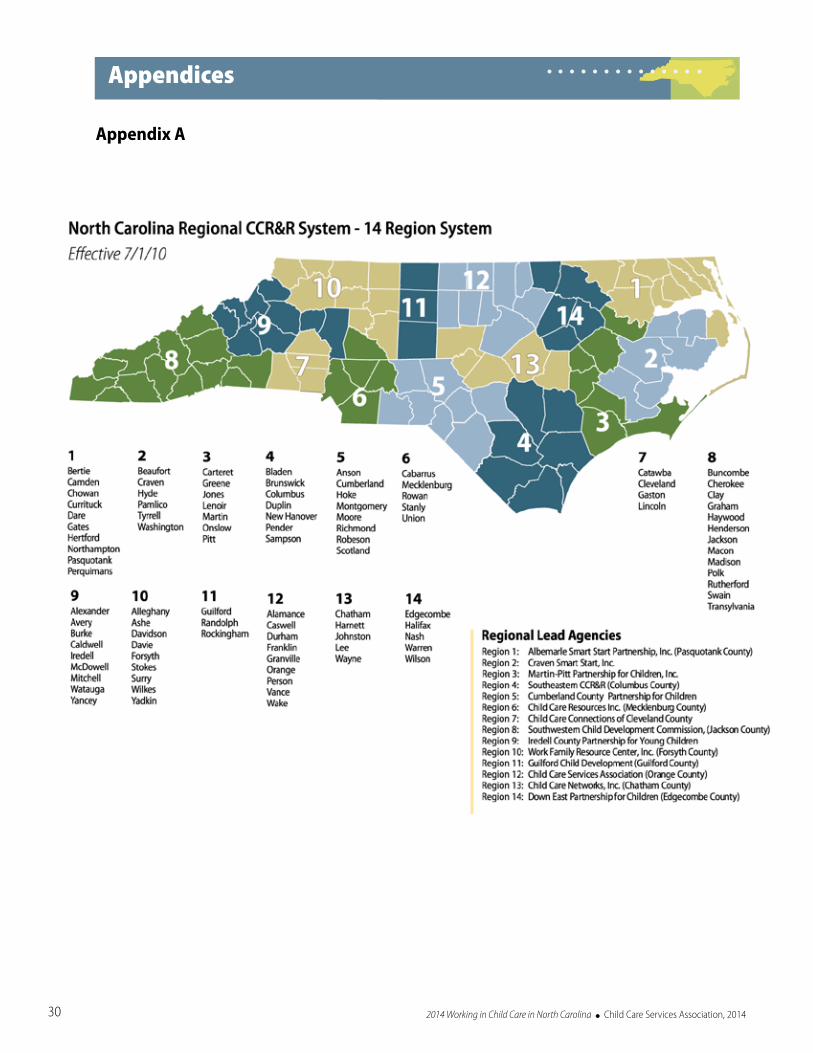
2014 Working in Child Care in North Carolina l Child Care Services Association, 201430
Appendix A
Appendices
2014 Working in Child Care in North Carolina l Child Care Services Association, 2014
Appendix B
Survey Methods and Response Rates
Survey instruments. The written and online versions of the questionnaires used in this survey were based on the forms for child care center directors, and teachers previously created and used by the authors of this study . The questionnaires were modified to include currently relevant and time-sensitive items . There were three separate instruments: (1) a director’s survey which was intended for directors of early care and education programs; (2) a teaching staff survey which was provided to teachers and teachers’ assistants in those programs whose directors participated in the study and (3) a family child care provider survey identical to the one used in the 2012 workforce study .
Sampling Strategy. Licensed child care centers selected for survey participation were drawn from January 2014 regulatory data of the North Carolina Division of Child Development and Early Education . At that time, several types of programs were excluded from the sampling frame that was constructed for the study . Those programs that served only school-age children or that provided care only during the summer months were excluded . It should be noted that those public pre-k programs which are not licensed (and hence are not included in the licensure files) are excluded from this study . Unlike the 2013 study, licensed family child care homes were included as they had been in 2012 .
The total population of child care centers was sorted by location in each of the 14 multi-county Child Care Resource and Referral (CCR&R) Regions . Each region was further divided according to its star rating (five categories) and size of program as measured by numbers of children aged 5 and under enrolled in the program (five categories) . Each program within each cell was then assigned a random number and sorted by that number . Within each region the first 25% of each region’s centers were randomly selected to mirror the star ratings and size categories of the overall population of child care programs in each region . For three of the smaller regions which in the past had not yielded sufficiently large numbers of cases to generate reliable statistical estimates, additional cases were sampled and targeted for inclusion . This process yielded a target sample of 1055 centers selected to be surveyed . The goal was to obtain data from 70% of the centers .
The total population of child care homes was stratified by region and a random sample of consisting of 1055 was selected to be worked to completion . The sample was constructed to target approximately one quarter of all homes . Just as in the case of the centers, the sample was designed to slightly over-represent homes in three of the smaller regions which in the past had not yielded sufficiently large numbers of cases to generate reliable statistical estimates .
A feature of the workforce study which was introduced in 2013 and continued in 2014 involved initiating the capacity to conduct longitudinal studies in the future through the establishment of a special panel of centers . This panel consists of a subset of centers from which data has been obtained and will continue to be collected over several years . In order to construct this panel, all centers which had responded to CCSA workforce surveys in both 2011 and in 2012 were identified along with an additional random sample of centers represented in the 2012 survey only were included in the group of centers invited to participate in the 2013 . These cases were then substituted for the first randomly drawn cases in each of the 14 regions . Similarly an additional panel for the 2014 survey was constructed from all centers responding to both the 2012 and 2013 surveys and No separate analyses are reported here using the 2013 or 2014 longitudinal panels separately, but a similar design is expected to be incorporated into the planned 2015 survey . These panel data will be available for use in special longitudinal analyses in the future as need arises and opportunities to use them become available . Additional information about the sampling design is available upon request .
Survey Implementation Processes. To begin the study, all centers with a valid email address on file with the Division of Child Development and Early Education were sent an online survey uniquely linked to their email address . Several reminder emails were sent and phone calls were made to remind center directors to check their emails and respond to the surveys . For programs with no email addresses and for those programs who failed to respond after numerous attempts through email, phone calls were made in an attempt to conduct the surveys over the phone .
Following numerous phone attempts, non-responding programs were sent a survey in the mail . Center packets included a cover letter, questionnaire and postage-paid return envelope for the director; cover letter, questionnaire and postage-paid return envelope for each teacher/assistant teacher to be surveyed, and raffle tickets and small thank you gifts for the director and teachers .
31
2014 Working in Child Care in North Carolina l Child Care Services Association, 201432
For programs in which the director had completed the survey either online or by phone, packets were sent that included a cover letter for the director and a small thank you gift . Also included were enough surveys for each teacher and assistant teacher, postage-paid return envelopes, raffle tickets and small gifts .
To ensure a high survey response rate, repeated email reminders, phone calls and mailings were made to child care centers to remind and assist participants in responding . When requested, mailings were faxed to programs . Staff also asked each participating program to confirm the number of full-and part-time teachers and assistant teachers who were included in ratios for children birth to five . This number was used to help estimate the teachers’ participation rate .
Each panel case was replaced with the next highest randomly numbered case in the same region with a similar star rating and size category . At the end of the survey process it was found that none of the 1055 cases originally selected had to be replaced with newly targeted ones . Both replacement cases and panel cases have been documented on the subsequent files .
Similarly to centers, all family child care homes with a valid email address on file with the Division of Child Development and Early Education were sent an online survey uniquely linked to their email address . Several reminder emails were sent and phone calls were made to remind providers to check their emails and respond to the surveys . For programs with no email addresses and for those programs who failed to respond after numerous attempts through email, phone calls were made in an attempt to conduct the surveys over the phone .
Following numerous phone attempts, non-responding programs were sent a survey in the mail . Family child care packets included a cover letter, questionnaire and postage-paid return envelope, raffle ticket and small thank you gift . Surveys of samples of early childhood program directors, teachers working in those programs and family child care providers were conducted over the period from February 2014 through October 2014 .
Survey Response Results: Centers Useable surveys were obtained from 760 directors, which constitutes 72% of the stratified random sample (N =1055) . This number constitutes about 19% of the total population of all directors in the state .
The director survey data were examined for differential response of directors of centers by region, by type of center, by size and by star rating, and panel vs . non-panel sample segment . Weights were constructed and applied which would allow generalization of the sample data up to the level of the 4,023 centers in the population and on the sampling frame .
Survey Response Results: Teachers The second stage of the survey process involved surveying teaching staff and built upon the first phase . All directors in the selected centers identified in the first phase were contacted and asked to distribute surveys to their teaching staff, and useable surveys were returned by 2,708 teaching staff out of an estimated 5,910 believed to be working in centers at the time of the survey (46%) . This level of response is somewhat below the 50% target level . This estimate of a denominator of eligible was based on directors’ most accurate and recent reports of their own eligible teaching staff (i .e ., teacher/assistant teacher) . This number was either what directors reported on their own surveys or based on reports collected through a supplementary phone call made by CCSA staff to confirm the appropriate number of teaching staff eligible to receive the survey . This number could and frequently did differ from the number of personnel recorded on the license file .
Because of fluctuations in employment, variations in who is or is not defined as a full or part time employee, and other reporting anomalies, the eligible statewide population of teaching staff is not currently known with complete precision . Estimates of that teaching staff population in centers were calculated by three different methods using both director survey data and data from the sampling frame, to arrive at a teaching staff population size . This year, the three estimates differed slightly and we chose to use the middle estimate; our best estimate of the population of center teaching staff in February 2014 is about 28,200 .
Centers also varied in the extent to which their teaching staff responded to the survey . Within center response rates were estimated by using as a denominator the number of surveys that were distributed to center directors . This number was based on the number of teaching staff that center directors reported to survey staff would qualify for the survey as reported above . Teaching staff participation rates at the 760 centers varied from no teaching staff responses (0%) to all teaching staff responding (100%) with an average rate of 40%, with a median rate of 33 . The 760 centers whose directors had responded to their survey were arrayed by the level of teaching staff response, it was found that 17 percent yielded responses from all (100%) staff working at the center, 27% yielded responses from more than half of the staff

2014 Working in Child Care in North Carolina l Child Care Services Association, 2014 33
(but less than all) working at the center, 17% yielded responses some but less than half of the staff . Finally 40 percent of the centers yielded no responses (0%) from teaching staff . When teaching staff participation rates were calculated separately by region, by center size, and by star ratings, no average rates in these various cells fell below 33% and several were above 50% .
Not surprisingly, teacher participation rates are related to a number of characteristics of the center and this variation in response level was taken into account in establishing and adjusting the teacher level analysis weights described below . Responses were also received from centers whose directors did not respond to the survey .
Survey Response Results: FCCs Useable surveys were obtained from 555 FCC providers, which constitutes 72% of the stratified random sample (N =766) . This number constitutes about 22% of the total population of all FCCs in the state (N=2,504) . Weights were constructed and applied which would allow generalization of the sample data up to the level of the 2,504 FCCs in the population and on the sampling frame .
Survey Weighting Strategies. Program and teacher level data have been weighted to reflect the statewide populations of centers and teaching staff respectively, adjusting for known individual, program and community characteristics associated with response bias . Percentages and other values reported in tables and graphs incorporate these sampling weights, permitting extrapolation to the actual population of centers (N=4,009) and an estimated teaching staff population (N=28, 183) . In a similar fashion, family child care homes were weighted up to the statewide population of FCCs (N=2,504) .
In general, sampling weights reflected the inverse of the probability of selection and response for each of the strata used in the sampling design described above . First stage corrections were made for size, star rating and type of organization factors for centers, and for star rating level for FCCs . When this process was completed, each of these samples (centers and FCCs) was rescaled to reflect the geographic distribution of cases in the 14 Child Care Resource and Referral regions . A similar process was employed for the second stage of the sample consisting of teaching staff who worked in centers . These included teaching staff who responded to the teaching staff survey, but who worked in centers whose directors did not answer the director surveys . These survey units were again adjusted to reflect an estimate of within center response level, and geographic rescaling was performed to conform with (but not exactly match) the percentage distribution of the aggregate numbers of teaching staff as provided on the sampling frame across the 14 Child Care Resource and Referral regions .
As part of the data analysis process, cases in each of the datasets were weighted so as to create more unbiased population estimates . Weighting schemes incorporated variables that affected probabilities of selection of a case as well as the other variables used in sample stratification which were empirically tested and found to display a distribution that approximated the actual probability of survey response for either a director, a teaching staff member, or a family child care provider . Samples were then tested to assure that the totals in the up-weighted datasets summed to approximate the estimated statewide totals of variables which could be known on the population of cases while at the same time reasonably reflecting regional percentage estimates .
The results of the application of these weights for each type of sample suggest that the weighting strategy employed proved to be quite effective in representing the population and major sub-populations of analytic significance . It should be noted, however, that the weighting process used in the report quite effectively adjusts for biases in estimates of measures of central tendency, e .g ., means and medians that might be due to differential response . This process does not address the issue of precision of those estimates, and such measures of dispersion as variance, standard error, standard deviation . This situation is not problematic for this summary report, because no confidence intervals were reported, nor were formal tests of statistical significance reported or conducted . However, with further analysis such estimates could be calculated from the datasets by using more intensive statistical procedures . Further details are available upon request .
Starting/Highest Paid Teacher and Director Salary Calculations. Regional estimates of wage progression of teachers and assistant teachers were difficult to construct because initial and peak wages were often missing in the directors’ surveys . Fortunately, wage data reported in the teacher survey were available to fill in some of the gaps . If initial wages were missing from the director’s survey, available corresponding data from teachers’ surveys were used for
2014 Working in Child Care in North Carolina l Child Care Services Association, 201434
initial wages, if the teacher or assistant teacher had been employed in the center for two years or less . Similarly, if the highest wage for a teacher or assistant was missing from the director survey, the highest actual wage reported by any of the appropriate staff who had been working at the center for 10 or more years was used to impute the highest wage . Similarly if director survey data were available from the director, the center specific response rate was above 80 percent, and recently hired or long term teacher hourly wage data were missing, estimates were made from the corresponding items in the director surveys Through this process, reasonably sound estimates of the wage progression could be constructed for each of the regions and the median wage estimates displayed some upward progression between initial and highest wage and were reasonably close to the corresponding estimates in the 2013 survey .
In more than 48% of the cases, the value of hourly wage of the director was missing in the original directors’ survey and could not be estimated from other data . This is not surprising as many of these directors are small business operators and have difficulty expressing their income in hourly wage or annual salary terms . A wage estimate quantity was calculated using the multiple imputation procedure in SPSS which uses information from non-missing cases to create plausible values for missing cases . A regression equation was used to identify statistically significant correlates of known values of the hourly wage that were reported . The following dichotomous or continuous variables were included in the imputation process: size, quality rating, auspices, and NC Pre-K program participation, length of tenure, education, and reported family income of the director, as well as the starting wages of teachers in the program as reported by the director . These variables were then employed in the multiple imputation procedure . This process was replicated five times and the median of those five replications was used as the director’s hourly wage estimate . Imputed values were flagged and overall estimates with and without imputed variables were compared and found to be similar . Because data were more complete than in previous surveys, wage imputations were used in fewer regional estimates than last year . Further, estimates of median wages using and excluding the imputed values rarely differed .
In various places within the report, organizational categories were collapsed for simplification . A three-fold categorization of organizational structure was employed in many analyses of the survey data: For-profit centers, non-profit centers and public sponsored programs . NC Pre-K programs (formerly More at Four) are represented among all three organizational structures . However, it is important to recall that public pre-k programs that are not licensed were not included as part of this study .
Appendix C contains more information on definitions used in the report . Appendix D contains information about the urbanization categories used in this report .
Weighted estimates of the number of teaching staff in NC Centers. Given the uncertainty about statewide denominators it is difficult to directly assess a response rate for part- and full-time teachers and assistants in North Carolina child care centers . This study used the number 28,183 as the basis for weighting up teaching staff survey respondents . The sum of teaching staff reported in the 4,009 centers on the 2014 license file is 27,935 . The estimated statewide population of teaching staff based on weighting using only the 1,055 randomly sampled cases that were attempted up to the state population of 4,009 centers is larger (N=28,481) . The estimate from the director’s survey responses of the number of teaching staff that should have received surveys (N=28,183) is almost midway between the other two estimates, Hence, we chose to rescale all the teaching staff survey weights to add up to this number and to describe the statewide population of teaching staff as being in the range of 28,200 . Teaching staff survey responses were weighted up to reflect the probability of selection and response at the center level to reflect the known number of licensed centers in North Carolina at the time the sampling frame was constructed in 2014 .
Weighted statewide estimates of the total staff size (i .e ., all full and part time teachers and assistants) based on directors survey responses were larger than the number generated using the other methods described above . This is probably due largely to inconsistent recording of the part-time segment teaching staff workforce . This number in difficult to specify, and varies somewhat depending on how “part-time” and how “intermittent” these workers are at a given center, and how the center and the individual workers define themselves, and whether or not they can be unduplicated from survey or license data if they work at several centers . Although it is more difficult to assess the number of different persons falling in the category of “part-time”, these types of individuals are probably less likely than their full time counterparts to be included in the dataset generated from the teacher surveys and reported on here . The extent to which these part-time workers have jobs in other settings, consider their child care work a “second job,” or actually identify with or aspire to careers in child development is not well understood . Although it would be possible to perform a separate analysis of part time teaching staff, it would be difficult to draw meaningful conclusions from examination of an extrapolation from the small number of cases available in the teaching staff survey database .
2014 Working in Child Care in North Carolina l Child Care Services Association, 2014 35
Appendix C
Definitions of TermsChild Care Centers- an arrangement where, at any one time, there are three or more preschool-age children or nine or more school-age children receiving care .(from Child Care Center Handbook produced by the Division of Child Development and Early Education, 2009) Centers may be found in community buildings, churches or synagogues, buildings built specifically for child care, in private homes or in public buildings .
For-profit centers-Child care centers ranging from single-classroom facilities consisting of a multi-age group of children and one teacher/director to multi-site facilities enrolling hundreds of children and employing a director, assistant director, lead teachers and assistant teachers that are operated as sole proprietorships, partnerships, or corporations with the goal of making a profit for their owner or stockholders .
Non-profit centers-Child care centers operated by a board of directors that govern the program, that is mission-driven and not operated with a goal of making a profit . These programs may be sponsored by community or faith-based organizations . Includes programs with a Notice of Compliance (GS-110) as well as centers with a star-rated license .
Public (sponsored programs)-Head Start sites, public school sponsored and other publicly funded programs .
Unlicensed Pre-K programs - any child care program or arrangement consisting of two or more separate components, each of which operates for four hours or less per day with different children attending each component .(http://ncchildcare .dhhs .state .nc .us/providers/pv_sn2_rcc .asp)
NC Pre-K-a community-based education initiative designed to prepare at-risk four-year-olds in North Carolina for success in school . Pre-kindergarten classrooms operate for the school day and school year and are provided in diverse settings such as public and private schools, Head Start centers, and community-based child care centers and preschools .(http://ncchildcare .dhhs .state .nc .us/providers/pv_providres .asp)
People of color-People who self identify as Asian, African-American, bi-racial, or American Indian/Native American .
Median-one of three measures of central tendency; the number representing the case which has equal cases above and below it . Throughout this report, “average” is used interchangeably with “median” .
Degree-either an associate degree, bachelor’s degree, master’s degree or Ph .D . from an institute of higher learning .
Degree in ECE-an associate, bachelor’s or master’s degree or Ph .D . in either early childhood education or child development .
Degree in other-an associate, bachelor’s or master’s degree or Ph .D . in a field of study other than early childhood education or child development .
Star rated license system-North Carolina’s Star Rated License System gives stars to child care programs based on how well they are doing in providing quality child care . Child Care programs receive a rating of one to five stars . A rating of one star means that a child care program meets North Carolina’s minimum licensing standards for child care . Programs that choose to voluntarily meet higher standards can apply for a two to five star license .(http://ncchildcare .dhhs .state .nc .us/parents/pr_sn2_slfaq .asp)
T.E.A.C.H. Early Childhood®- This program provides comprehensive educational scholarships that help pay the cost of tuition, books, and travel, and may insure paid release time, require compensation incentives and encourage retention for child care providers working on a credential or degree in early childhood education or child development .(www .childcareservices .org)
Child Care WAGE$® Project- This program provides salary supplements that are linked to the education level of participants and are paid every six months as long as participants remain in child care program .(www .childcareservices .org)
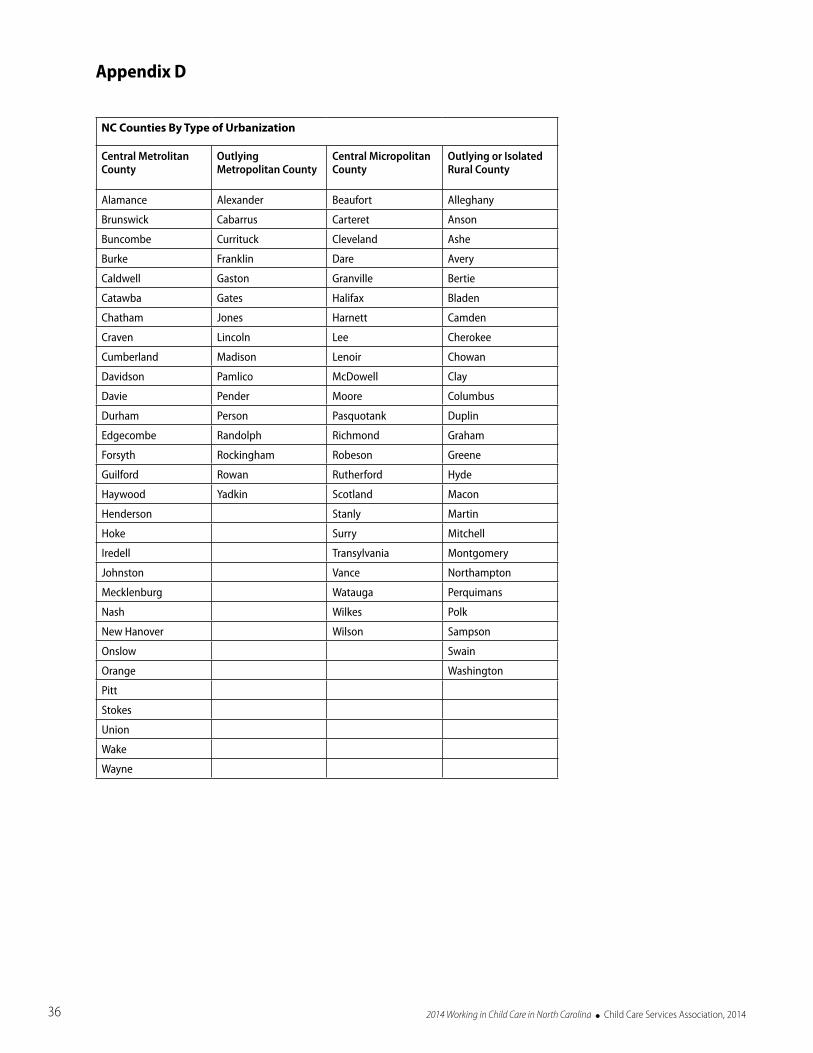
2014 Working in Child Care in North Carolina l Child Care Services Association, 201436
Appendix D
NC Counties By Type of Urbanization
Central Metrolitan County
Outlying Metropolitan County
Central Micropolitan County
Outlying or Isolated Rural County
Alamance Alexander Beaufort Alleghany
Brunswick Cabarrus Carteret Anson
Buncombe Currituck Cleveland Ashe
Burke Franklin Dare Avery
Caldwell Gaston Granville Bertie
Catawba Gates Halifax Bladen
Chatham Jones Harnett Camden
Craven Lincoln Lee Cherokee
Cumberland Madison Lenoir Chowan
Davidson Pamlico McDowell Clay
Davie Pender Moore Columbus
Durham Person Pasquotank Duplin
Edgecombe Randolph Richmond Graham
Forsyth Rockingham Robeson Greene
Guilford Rowan Rutherford Hyde
Haywood Yadkin Scotland Macon
Henderson Stanly Martin
Hoke Surry Mitchell
Iredell Transylvania Montgomery
Johnston Vance Northampton
Mecklenburg Watauga Perquimans
Nash Wilkes Polk
New Hanover Wilson Sampson
Onslow Swain
Orange Washington
Pitt
Stokes
Union
Wake
Wayne
2014 Working in Child Care in North Carolina l Child Care Services Association, 2014 37
Child Care Services Association would like to thank:
The Division of Child Development and Early Education for funding this study through a Race to the Top-Early Learning Challenge grant .
Dr . Thomas Konrad for performing the weighting, data analysis and report writing .
The child care providers who participated in the survey and who have dedicated themselves to providing quality care for young children in North Carolina .
For more information about the 2014 Statewide Workforce Survey, please contact the Research Department at Child Care Services Association, (919) 967-3272 or research@childcareservices .org .
This study was managed and co-authored by CCSA staff Lisa Stallings, Mary Martin, Sue Russell and Anna Carter . Final report design was created by Jimmy Holcomb .
PO Box 901Chapel Hill, NC 27514
Acknowledgements
2014 Working in Child Care in North Carolina l Child Care Services Association, 2014
Working in Early Care and Education in North Carolina
2014 Workforce Study
December, 2014Child Care Services Association
PO Box 901Chapel Hill, NC 27514