Embed Size (px)
Citation preview
Flood Damage Mitigation: Report
Nov- 2013: P. Choudhury-NIT Silchar, Assami
Working Group
Principal Investigator : Parthasarathi Choudhury
Professor, Department of Civil Engineering
NIT Silchar, Silchar, Assam
Email: [email protected]
Team members :
P.J. Roy, Assistant Professor, Department of Civil Engineering, NIT Silchar, Assam
: J. Nongthombam, PhD student
: Ms. N.Ullah, PhD student
: Ms. Arti Devi, PhD student : Ms. S. Debbarman, PhD student
Flood Damage Mitigation: Report
Nov- 2013: P. Choudhury-NIT Silchar, Assam1
List of Figures:
Figure No Description Page
no
1.1 Ariel map of the study area
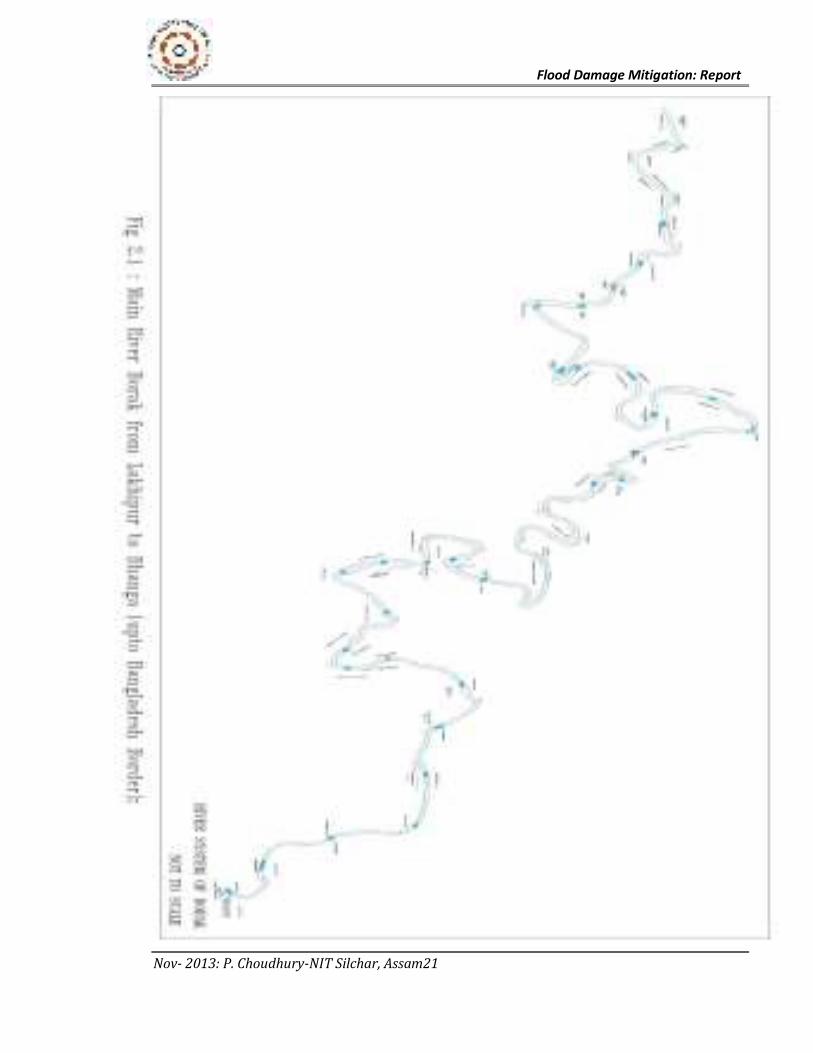
2.1 Main River Borak from Lakhipur to Bhanga (upto Bangladesh
Border)
2.2 Section Details of Barak River upto 500m countryside
2.3 Jiri Water shed
2.4 Cross sectional details of river Jiri
2.5 Ciri Water shed
2.6 Cross sectional details of river Ciri
2.7 Sonai Water shed
2.8 Cross sectional details of river Sonai
2.9 Badri Water shed
2.10 Cross sectional details of river Badri
2.11 Madhura Water shed
2.12 Cross sectional details of river Madhura
2.13 Jatinga Water shed
2.14 Cross sectional details of river Jatinga
2.15 Gagra Water shed
2.16 Cross sectional details of river Gagra
2.17 katakhal Water shed
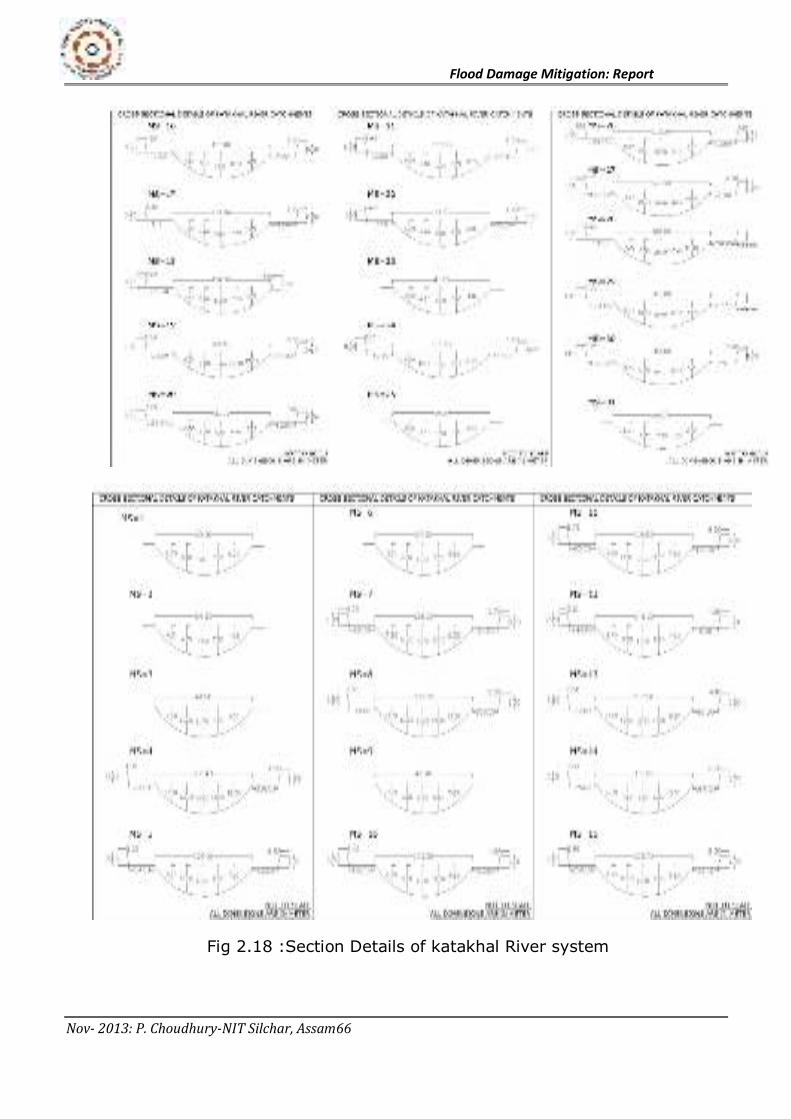
2.18 Cross sectional details of river katakhal
2.19 Longai Water shed
2.20 Cross sectional details of river Longai
3.1 Grid Points Covering the Study Area
4.1 Flow chart for GIS application.
4.2 Digital Elevation Model of Jiri sub basin
4.3 Digital Elevation Model of Chiri sub basin
4.4 Digital Elevation Model of Madhura sub basin
4.5 Digital Elevation Model of Ghagra sub basin
4.6 Digital Elevation Model of Jatinga sub basin
4.7 Drainage network in Jiri sub catchment
4.8 Drainage network in Chiri sub catchment
4.9 Drainage network in Madhura sub catchment
4.10 Drainage network in Ghagra sub catchment
4.11 Drainage network in Jatinga sub catchment
4.12 Flow direction in Jatinga sub catchment
4.13 Drainage network in Katakhal sub catchment
4.14 Drainage network in Sonai sub catchment
4.15 Slope map for Chiri sub catchment
4.16 Slope map for Jiri sub catchment
4.17 Slope map for Ghagra sub catchment
4.18 Slope map for Madhura sub catchment
4.19 Slope map for Jatinga sub catchment
Flood Damage Mitigation: Report
Nov- 2013: P. Choudhury-NIT Silchar, Assam2
4.20 Slope map for Katakhal sub catchment
4.21 Slope map for Sonai sub catchment
5.1 1st order watersheds for Madhura
5.2 2nd Order sub-watersheds for Madhura.
5.3 2nd Order sub-watersheds for Madhura.
5.4 3rd Order sub-watersheds for Madhura
5.5 4th Order sub-watersheds for Madhura.
5.6 5th Order sub-watersheds for Madhura.
5.7 Madhura watershed (6th Order).
5.8 1st Order sub-watersheds for Ghagra.
5.9 2nd order sub-watersheds for Ghagra.
5.10 3rd Order sub-watersheds for Ghagra
5.11 4th Order sub-watersheds for Ghagra.
5.12 5th order sub-watersheds for Ghagra.
5.13 Ghagra watershed (6th order).
5.14 Selected sub-watersheds for Madhura.
5.15 Selected sub-watersheds for Ghagra.
5.16 Estimation of ratios BA RR , and LR for 1
5MSW
5.17 Estimation of ratios BA RR , and LR for 2
5MSW .
5.18 Estimation of ratios BA RR , and LR for 3
5MSW .
5.19 Estimation of ratios BA RR , and LR for 1
3MSW .
5.20 Estimation of ratios BA RR , and LR for 1
5GSW
5.21 Estimation of ratios BA RR , and LR for 2
5GSW .
5.22 Estimation of ratios BA RR , and LR for
1
4GSW
5.23 Estimation of ratios BA RR , and LR for
2
4GSW .
5.24 Estimation of ratios BA RR , and LR for 1
3GSW
Flood Damage Mitigation: Report
Nov- 2013: P. Choudhury-NIT Silchar, Assam3
5.25 Estimation of ratios
BA RR , and LR for 2
3GSW .
5.26 Figure 5.26: Estimation of ratios
BA RR , and LR for 3
3GSW .
5.27 Estimation of ratios
BA RR , and LR for 4
3GSW .
5.28 1hr UH for Madhura sub-watershed 1
5MSW .
5.29 1hr UH for Madhura sub-watershed 2
5MSW .
5.30 1hr UH for Madhura sub-watershed 3
5MSW .
5.31 1hr UH for Madhura sub-watershed 1
3MSW .
5.32 1hr UH for Ghagra sub-watershed 1
5GSW .
5.33 1hr UH for Ghagra sub-watershed 2
5GSW .
5.34 1hr UH for Ghagra sub-watershed
1
4GSW .
5.35 1hr UH for Ghagra sub-watershed
2
4GSW .
5.36 1hr UH for Ghagra sub-watershed 1
3GSW .
5.37 1hr UH for Ghagra sub-watershed 2
3GSW .
5.38 1hr UH for Ghagra sub-watershed 3
3GSW .
5.39 1hr UH for Ghagra sub-watershed 4
3GSW .
5.40 1hr UH for Machura watershed.
5.41 1hr UH for Ghagra watershed
5.42 1hr UH ordinates for Chiri subbasin
5.43 1hr UH ordinates for Jiri subbasin
5.44 1hr UH ordinates for Jhatinga subbasin
5.45 1hr UH ordinates for Sonai Subbasin
5.46 1hr UH ordinates for Katakhal subbasin
6.1 represents the flood event from 10th – 17th July, 2004 at BpGhat.
6.2 Represents the flood event from 19th – 29th July, 2004 at
BpGhat
6.3 The flood event from 11th – 21st June, 2006 at BpGhat.
6.4 Observed and simulated discharge at Annapurnaghat (event-1)
Flood Damage Mitigation: Report
Nov- 2013: P. Choudhury-NIT Silchar, Assam4
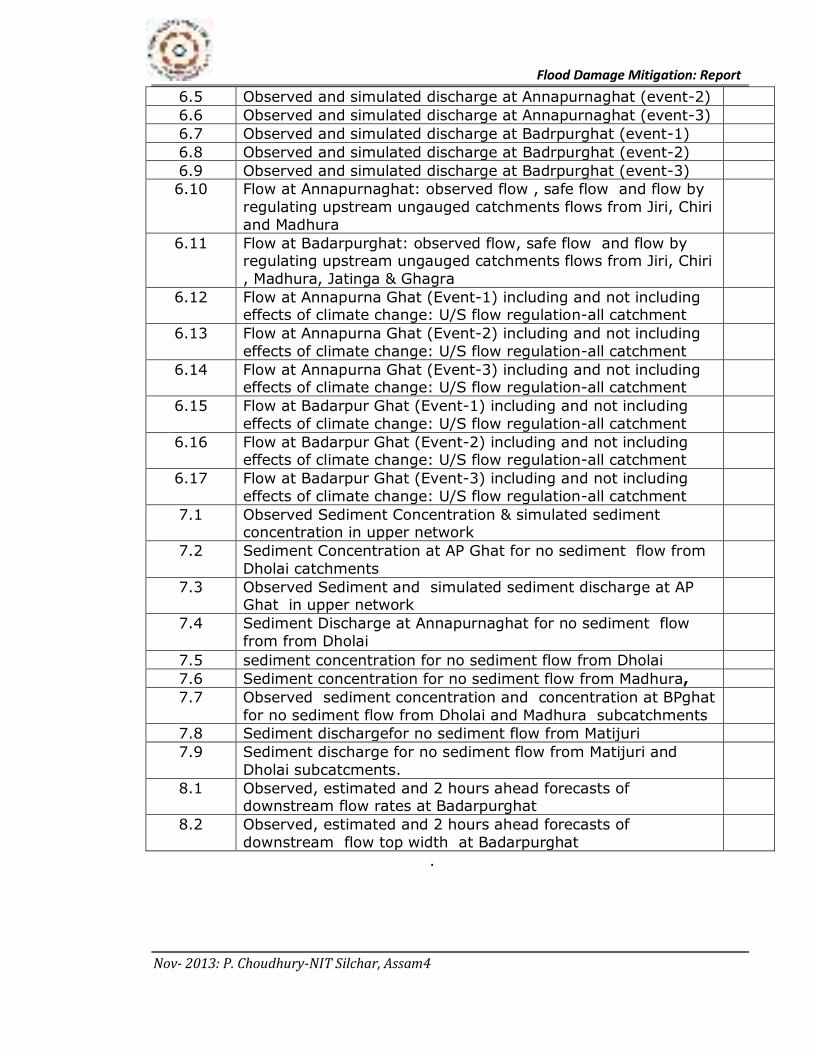
6.5 Observed and simulated discharge at Annapurnaghat (event-2)
6.6 Observed and simulated discharge at Annapurnaghat (event-3)
6.7 Observed and simulated discharge at Badrpurghat (event-1)
6.8 Observed and simulated discharge at Badrpurghat (event-2)
6.9 Observed and simulated discharge at Badrpurghat (event-3)
6.10 Flow at Annapurnaghat: observed flow , safe flow and flow by
regulating upstream ungauged catchments flows from Jiri, Chiri
and Madhura
6.11 Flow at Badarpurghat: observed flow, safe flow and flow by regulating upstream ungauged catchments flows from Jiri, Chiri
, Madhura, Jatinga & Ghagra
6.12 Flow at Annapurna Ghat (Event-1) including and not including effects of climate change: U/S flow regulation-all catchment
6.13 Flow at Annapurna Ghat (Event-2) including and not including
effects of climate change: U/S flow regulation-all catchment
6.14 Flow at Annapurna Ghat (Event-3) including and not including effects of climate change: U/S flow regulation-all catchment
6.15 Flow at Badarpur Ghat (Event-1) including and not including
effects of climate change: U/S flow regulation-all catchment
6.16 Flow at Badarpur Ghat (Event-2) including and not including effects of climate change: U/S flow regulation-all catchment
6.17 Flow at Badarpur Ghat (Event-3) including and not including
effects of climate change: U/S flow regulation-all catchment
7.1 Observed Sediment Concentration & simulated sediment concentration in upper network
7.2 Sediment Concentration at AP Ghat for no sediment flow from
Dholai catchments
7.3 Observed Sediment and simulated sediment discharge at AP Ghat in upper network
7.4 Sediment Discharge at Annapurnaghat for no sediment flow
from from Dholai
7.5 sediment concentration for no sediment flow from Dholai
7.6 Sediment concentration for no sediment flow from Madhura,
7.7 Observed sediment concentration and concentration at BPghat
for no sediment flow from Dholai and Madhura subcatchments
7.8 Sediment dischargefor no sediment flow from Matijuri
7.9 Sediment discharge for no sediment flow from Matijuri and
Dholai subcatcments.
8.1 Observed, estimated and 2 hours ahead forecasts of downstream flow rates at Badarpurghat
8.2 Observed, estimated and 2 hours ahead forecasts of
downstream flow top width at Badarpurghat
.
Flood Damage Mitigation: Report
Nov- 2013: P. Choudhury-NIT Silchar, Assam5
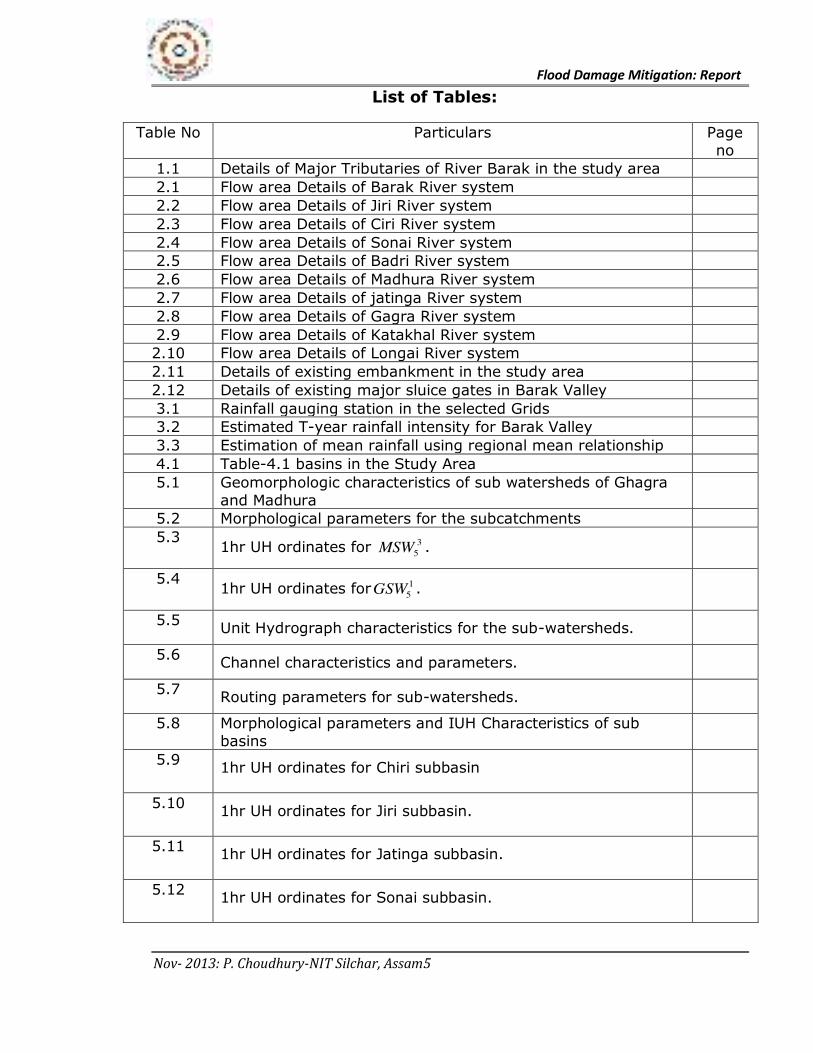
List of Tables:
Table No Particulars Page
no
1.1 Details of Major Tributaries of River Barak in the study area
2.1 Flow area Details of Barak River system
2.2 Flow area Details of Jiri River system
2.3 Flow area Details of Ciri River system
2.4 Flow area Details of Sonai River system
2.5 Flow area Details of Badri River system
2.6 Flow area Details of Madhura River system
2.7 Flow area Details of jatinga River system
2.8 Flow area Details of Gagra River system
2.9 Flow area Details of Katakhal River system
2.10 Flow area Details of Longai River system
2.11 Details of existing embankment in the study area
2.12 Details of existing major sluice gates in Barak Valley
3.1 Rainfall gauging station in the selected Grids
3.2 Estimated T-year rainfall intensity for Barak Valley
3.3 Estimation of mean rainfall using regional mean relationship
4.1 Table-4.1 basins in the Study Area
5.1 Geomorphologic characteristics of sub watersheds of Ghagra
and Madhura
5.2 Morphological parameters for the subcatchments
5.3 1hr UH ordinates for 3
5MSW .
5.4 1hr UH ordinates for 1
5GSW .
5.5 Unit Hydrograph characteristics for the sub-watersheds.
5.6 Channel characteristics and parameters.
5.7 Routing parameters for sub-watersheds.
5.8 Morphological parameters and IUH Characteristics of sub
basins
5.9 1hr UH ordinates for Chiri subbasin
5.10 1hr UH ordinates for Jiri subbasin.
5.11 1hr UH ordinates for Jatinga subbasin.
5.12 1hr UH ordinates for Sonai subbasin.
Flood Damage Mitigation: Report
Nov- 2013: P. Choudhury-NIT Silchar, Assam6
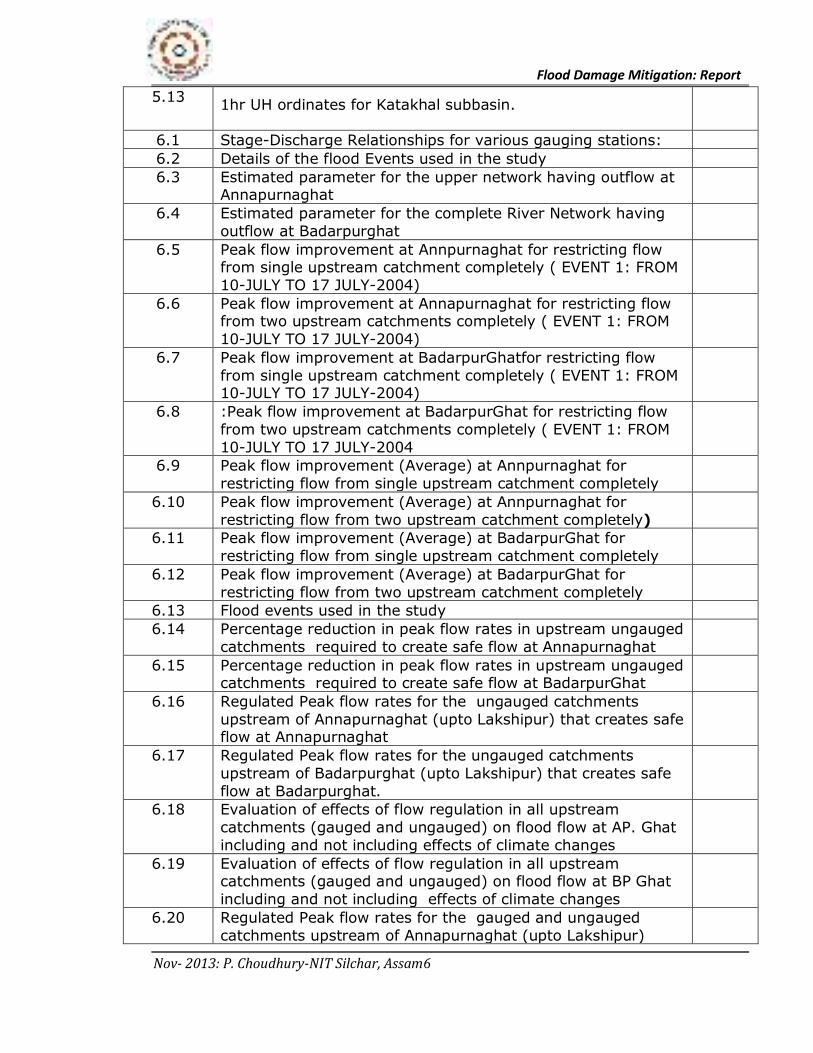
5.13 1hr UH ordinates for Katakhal subbasin.
6.1 Stage-Discharge Relationships for various gauging stations:
6.2 Details of the flood Events used in the study
6.3 Estimated parameter for the upper network having outflow at Annapurnaghat
6.4 Estimated parameter for the complete River Network having
outflow at Badarpurghat
6.5 Peak flow improvement at Annpurnaghat for restricting flow from single upstream catchment completely ( EVENT 1: FROM
10-JULY TO 17 JULY-2004)
6.6 Peak flow improvement at Annapurnaghat for restricting flow from two upstream catchments completely ( EVENT 1: FROM
10-JULY TO 17 JULY-2004)
6.7 Peak flow improvement at BadarpurGhatfor restricting flow
from single upstream catchment completely ( EVENT 1: FROM 10-JULY TO 17 JULY-2004)
6.8 :Peak flow improvement at BadarpurGhat for restricting flow
from two upstream catchments completely ( EVENT 1: FROM
10-JULY TO 17 JULY-2004
6.9 Peak flow improvement (Average) at Annpurnaghat for
restricting flow from single upstream catchment completely
6.10 Peak flow improvement (Average) at Annpurnaghat for
restricting flow from two upstream catchment completely)
6.11 Peak flow improvement (Average) at BadarpurGhat for
restricting flow from single upstream catchment completely
6.12 Peak flow improvement (Average) at BadarpurGhat for
restricting flow from two upstream catchment completely
6.13 Flood events used in the study
6.14 Percentage reduction in peak flow rates in upstream ungauged
catchments required to create safe flow at Annapurnaghat
6.15 Percentage reduction in peak flow rates in upstream ungauged catchments required to create safe flow at BadarpurGhat
6.16 Regulated Peak flow rates for the ungauged catchments
upstream of Annapurnaghat (upto Lakshipur) that creates safe flow at Annapurnaghat
6.17 Regulated Peak flow rates for the ungauged catchments
upstream of Badarpurghat (upto Lakshipur) that creates safe
flow at Badarpurghat.
6.18 Evaluation of effects of flow regulation in all upstream
catchments (gauged and ungauged) on flood flow at AP. Ghat
including and not including effects of climate changes
6.19 Evaluation of effects of flow regulation in all upstream catchments (gauged and ungauged) on flood flow at BP Ghat
including and not including effects of climate changes
6.20 Regulated Peak flow rates for the gauged and ungauged
catchments upstream of Annapurnaghat (upto Lakshipur)
Flood Damage Mitigation: Report
Nov- 2013: P. Choudhury-NIT Silchar, Assam7
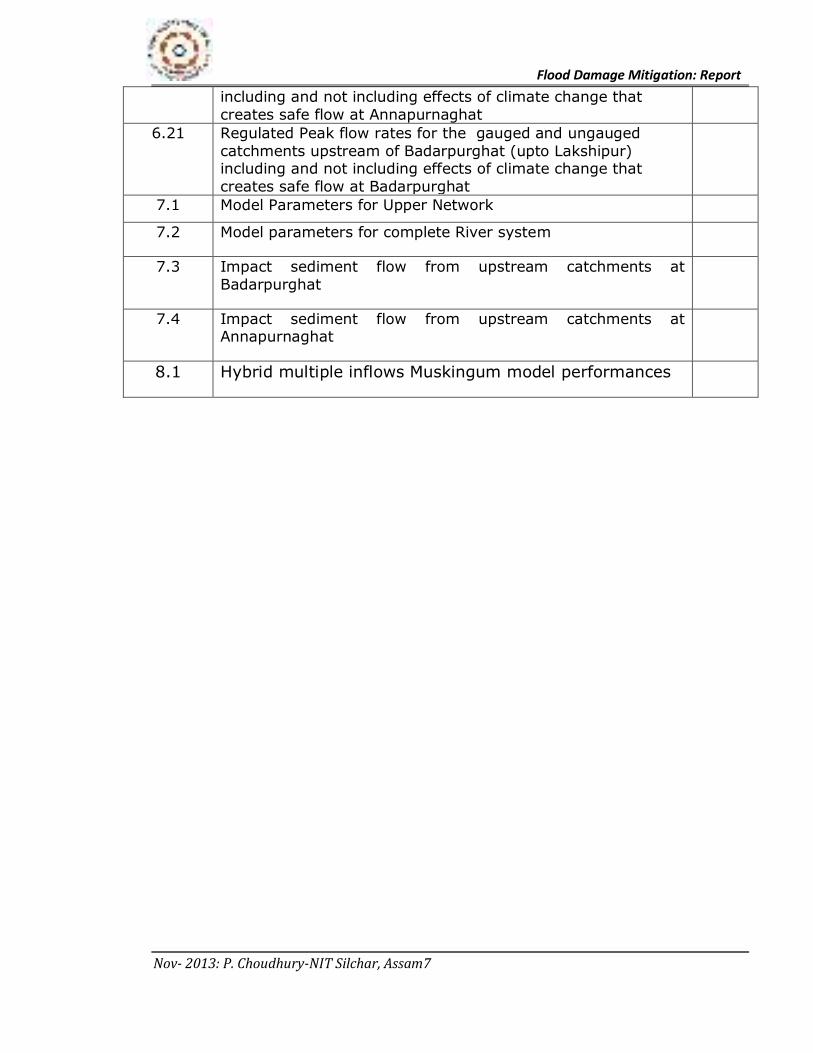
including and not including effects of climate change that
creates safe flow at Annapurnaghat
6.21 Regulated Peak flow rates for the gauged and ungauged
catchments upstream of Badarpurghat (upto Lakshipur) including and not including effects of climate change that
creates safe flow at Badarpurghat
7.1 Model Parameters for Upper Network
7.2 Model parameters for complete River system
7.3 Impact sediment flow from upstream catchments at
Badarpurghat
7.4 Impact sediment flow from upstream catchments at Annapurnaghat
8.1 Hybrid multiple inflows Muskingum model performances
Flood Damage Mitigation: Report
Nov- 2013: P. Choudhury-NIT Silchar, Assam8
FLOOD DAMAGE MITIGATION MEASURES FOR BARAK
VALLEY IN SOUTH ASSAM INCLUDING EFFECTS OF
CLIMATE CHANGE
Abstract: In the present study attempt has been made to determine the extent
of flow regulations required in the upstream catchments to have safe flow at
important downstream damage locations in Barak river system. There are a
number of gauged and ungauged catchments in the study area and downstream
flow simulation model incorporating flows from all the upstream gauged and
ungauged catchments have been developed for the river system. To determine
the existing flow capacity of the sections in the tributary river systems as well
as in the main river the sections are surveyed at a regular interval and at all
critical sections along a river course and the required channel parameters and
other sectional details such as flow area, top width etc are
determined/computed. Expected maximum rainfall intensity for different return
periods for the study area is obtained by applying L-moment techniques for the
homogeneous zone identified by applying fuzzy C-means based clustering
techniques.
Three flood events considering availability of rainfall records in the study area
are selected and used to conduct flood movement analysis for the river system.
Stage-discharge relationships for all gauging stations are developed applying
regression technique and are used to express the flow depths measured at a
gauging station in terms of the discharge value. Flow contributions from the
ungauged catchments are obtained by using GIUH approach. Important
morphological parameters for the tributary river systems required for
developing the GIUH models are derived using the DEM, stream network, slope
map and data obtained by direct field measurements. The IUHs obtained for the
catchments are lagged using s-curve technique to derive 1-hour unit
hydrograph. Contributions from the important ungauged catchments are
determined by using 1-hour unit hydrograph for the catchments and the rainfall
excess for the storm events during the selected flood periods. Flow
Flood Damage Mitigation: Report
Nov- 2013: P. Choudhury-NIT Silchar, Assam9
contributions from the gauged and ungauged catchments are integrated using
equivalent inflow for a number of upstream flows applicable to the river
networks in the study area. Sediment flow simulation model for the river
system are developed using the sediment concentration and sediment discharge
data collected for the river system. The model is used to assess the relative
contributions of the catchments in sediment load in the river reaches.
Downstream flow rate and flow top width forecasting models have been
developed for the river system that can be applied to forecast downstream flow
conditions well in advance on the basis of upstream flow rates recorded at
several upstream sections. Linear Programming model is formulated for the
river networks having outflow at Annapurnaghat and Badarpurghat to
determine effects of upstream flows on the downstream flows. The model is
applied for two cases: (i) when upstream flows from the major ungauged
catchments are regulated (ii) when flows from all upstream catchments are
regulated. The effects of climate change on the flow rates are incorporated in
the LP model and for the changed climatic conditions flow controls required in
all major catchments upstream of the potential damage sections at
Annapurnaghat and Badarpurghat are evaluated. Based on the survey works,
field trips and laboratory works conducted to asses existing flow capacity of the
channel systems, functioning of the sluice gates in the districts of Cachar,
Karimjang and Hailakandi and status of existing embankments along the river
courses etc. some observations/recommendations are forwarded that may be
considered for further study and / implementation for improving overall flood
condition in the valley
Flood Damage Mitigation: Report
Nov- 2013: P. Choudhury-NIT Silchar, Assam10
1.0 Introduction:
The Barak river system is the second largest system in the North Eastern
region of India and falls within hydro meteorological sub zone, 2c of India. The
river system drains 26,193 Sq. Km in India with approximately 6562 Sq. Km
from the state of Assam. The area is quite undeveloped compared to other
parts of India. The main river Barak receives a large number of minor
tributaries and 20 major tributaries out of which 12 are wholly in India. Flood
and erosion problems in Barak valley is a major cause of concern, every year
there is colossal flood losses in the valley. The GOI is considering various steps
for alleviating the problem of natural disasters like flood, and landslide in this
area.
The main river Barak has an approximate length of 900 km out of which
532 km is in India and nearly 129 km is in the state of Assam. The valley has
an average width of 25-30 km and is situated in the route of south-west
monsoon. Highest annual rainfall for the valley= 4194 mm recorded at Silchar
in 1989. Maximum discharge for the Barak river system= 7786.08 sm3
recorded at Badarpur in 1976. As per available records, nearly 3.50 lakh
hectares of land area in the valley is flood prone and some protection against
flood damages is available to 57% of the flood prone areas only. There are 26
nos of major sluice gates in the valley and approximately 738 km long
embankments along the main river and its tributaries exist to help reduce the
impact of flood. But, as most part of these embankments has outlived the life
span the embankments develop large breaches regularly during monsoon
seasons causing huge flood damages.
Some of the main factors that acting singly or in combination causes flood in
the valley are:
(i) High incidence of rainfall, (ii) Deforestation in the upper catchments (iii)
Inadequate natural drainage system (iii) Reduction in natural reservoirs (iv)
Heavy encroachment in the riverine area (v) Large scale construction activities
without proper planning
Flood Damage Mitigation: Report
Nov- 2013: P. Choudhury-NIT Silchar, Assam11
To improve flood scenario reducing flood related losses in the valley it is
imperative that some actions be initiated against the controllable factors
mentioned above. Some of the recommendations may be construction of
embankments in the existing gap positions, raising heights of the existing
embankments, afforestation in the upper catchments and adoption of suitable
watershed management plans to reduce sediment load in the channels. To
tackle flood problems in the valley solution is to be achieved incorporating due
weightage to all hydrologic and hydraulic factors effecting flood movement in
the river system. A comprehensive and integrated mitigation plan should be
prepared based on the hydraulic, hydrologic factors and local conditions of
natural reservoirs, drainage system etc. In the present study different possible
measures for mitigating flood damage in the Barak valley comprising three
districts namely, Cachar, Karimganj and Hailakandi using available and
generated hydrologic and hydraulic information on the study area is
investigated. The study is aimed at evaluatingeffects of different sub
catchments on the downstream flood scenarios at important locations, namely
at Annapurnaghat and at Badrapurghat for different possible actions in the
upstream catchments and river reaches. To formulate comprehensive flood
damage mitigation plan investigations that need to be conducted under the
study are:- examination of (i) existing flow capacity for different channels in
the system, (ii) Adequacy of existing embankments and sluice gates (iii)
Sediment load in the river system and erosion potential of different sub
catchments and (iv) Development of an efficient tool for improved flood
forecasting incorporating flow contribution from gauged and ungauged
catchments in the river systemand (v) Assessment of effects of climate change
on flood flow in the river system.
1.1 Study Area and Data Used
In the present report investigation works conducted for recommending
suitable flood damage mitigation measures for Barak valley with the main river
running from Phulertal at Lakhipur to international boarder point in Karimganj
district along with study results and findings are presented. The main river
Flood Damage Mitigation: Report
Nov- 2013: P. Choudhury-NIT Silchar, Assam12
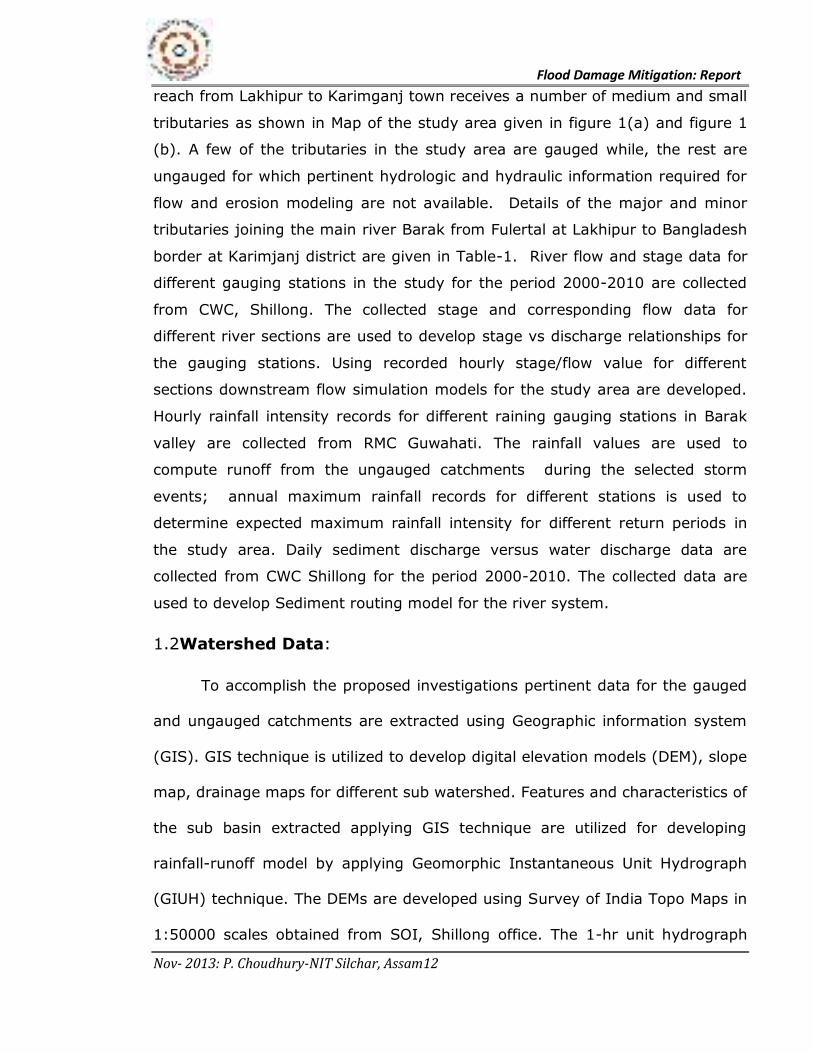
reach from Lakhipur to Karimganj town receives a number of medium and small
tributaries as shown in Map of the study area given in figure 1(a) and figure 1
(b). A few of the tributaries in the study area are gauged while, the rest are
ungauged for which pertinent hydrologic and hydraulic information required for
flow and erosion modeling are not available. Details of the major and minor
tributaries joining the main river Barak from Fulertal at Lakhipur to Bangladesh
border at Karimjanj district are given in Table-1. River flow and stage data for
different gauging stations in the study for the period 2000-2010 are collected
from CWC, Shillong. The collected stage and corresponding flow data for
different river sections are used to develop stage vs discharge relationships for
the gauging stations. Using recorded hourly stage/flow value for different
sections downstream flow simulation models for the study area are developed.
Hourly rainfall intensity records for different raining gauging stations in Barak
valley are collected from RMC Guwahati. The rainfall values are used to
compute runoff from the ungauged catchments during the selected storm
events; annual maximum rainfall records for different stations is used to
determine expected maximum rainfall intensity for different return periods in
the study area. Daily sediment discharge versus water discharge data are
collected from CWC Shillong for the period 2000-2010. The collected data are
used to develop Sediment routing model for the river system.
1.2Watershed Data:
To accomplish the proposed investigations pertinent data for the gauged
and ungauged catchments are extracted using Geographic information system
(GIS). GIS technique is utilized to develop digital elevation models (DEM), slope
map, drainage maps for different sub watershed. Features and characteristics of
the sub basin extracted applying GIS technique are utilized for developing
rainfall-runoff model by applying Geomorphic Instantaneous Unit Hydrograph
(GIUH) technique. The DEMs are developed using Survey of India Topo Maps in
1:50000 scales obtained from SOI, Shillong office. The 1-hr unit hydrograph
Flood Damage Mitigation: Report
Nov- 2013: P. Choudhury-NIT Silchar, Assam13
developed for the important ungauged catchments in the study area are used to
compute direct runoff hydrograph for these catchments for a set of identified
storm events during the period 2000-2010.
1.3 River Networks
The Barak river network in the study area that drains three districts in
the valley: Cachar, Karimganj and Hailakandi districts is segmented into a
upper network and a lower river network. The upper networkterminates at the
downstream gauging station at AnnapurnaGhat in the River Barak and receives
flows from the upstream ungauged sub catchments of Jiri,, Chiri , Madhura and
gauged subcatchments of Dholai and Maniarkhal apart from the upstream flows
gauged at Fulertal in Barak at Lakhipur. The lower network consists of the main
river Barak from the upstream point at Annapurnaghat to the downstream point
at Badarpurghat. The downstream flow at Badarpurghat is due to the inflow at
Annapurnaghat, flows from the ungauged subcatchments Jatinga, Ghagra and
flow from the tributary Katakhal with gauging station at Matijuri. To simulate
and forecast water and sediment discharge at two important downstream
locations namely, Barak at AnnapurnaGhat, near Silchar town and Barak at
BadarpurGhat near Badarpur in Karimganj District water and sediment
discharge simulation and forecasting models for the upper network with
downstream station at AnnapurnaGhat and for the complete river network with
Badarpurghat as the downstream station are developed.
Flood Damage Mitigation: Report
Nov- 2013: P. Choudhury-NIT Silchar, Assam14
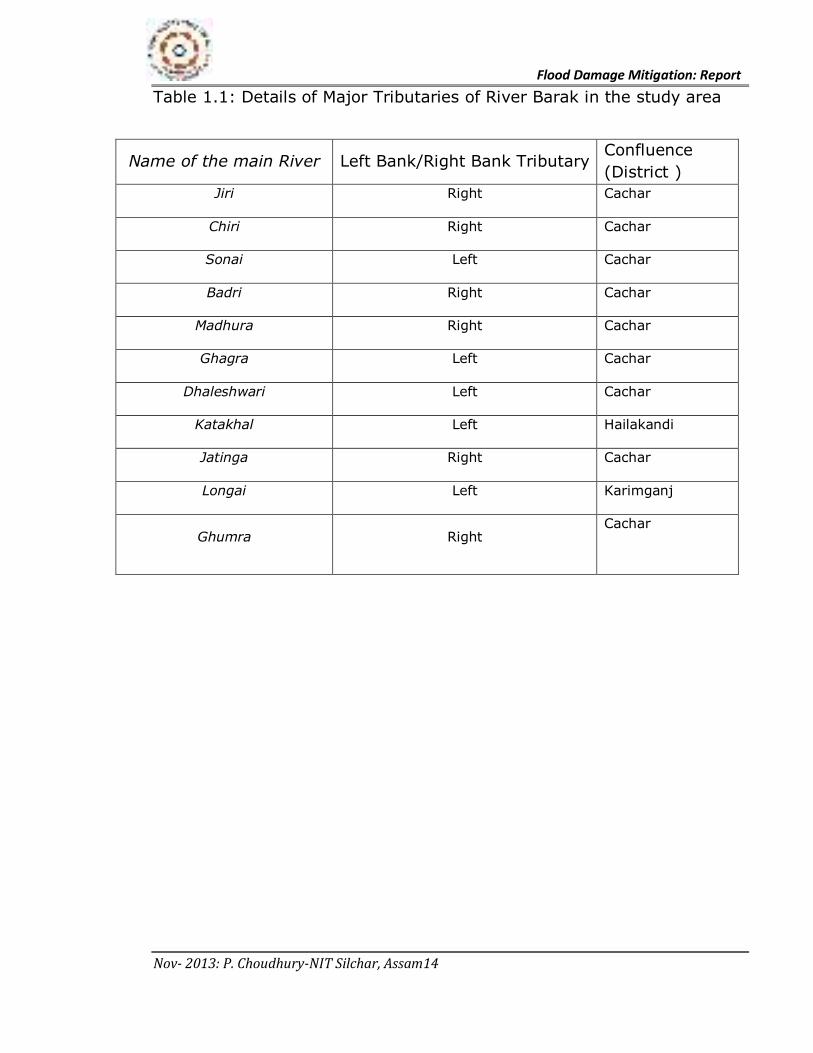
Table 1.1: Details of Major Tributaries of River Barak in the study area
Name of the main River Left Bank/Right Bank Tributary Confluence
(District )
Jiri Right Cachar
Chiri Right Cachar
Sonai Left Cachar
Badri Right Cachar
Madhura Right Cachar
Ghagra Left Cachar
Dhaleshwari Left Cachar
Katakhal Left Hailakandi
Jatinga Right Cachar
Longai Left Karimganj
Ghumra Right Cachar
Flood Damage Mitigation: Report
Nov- 2013: P. Choudhury-NIT Silchar, Assam15
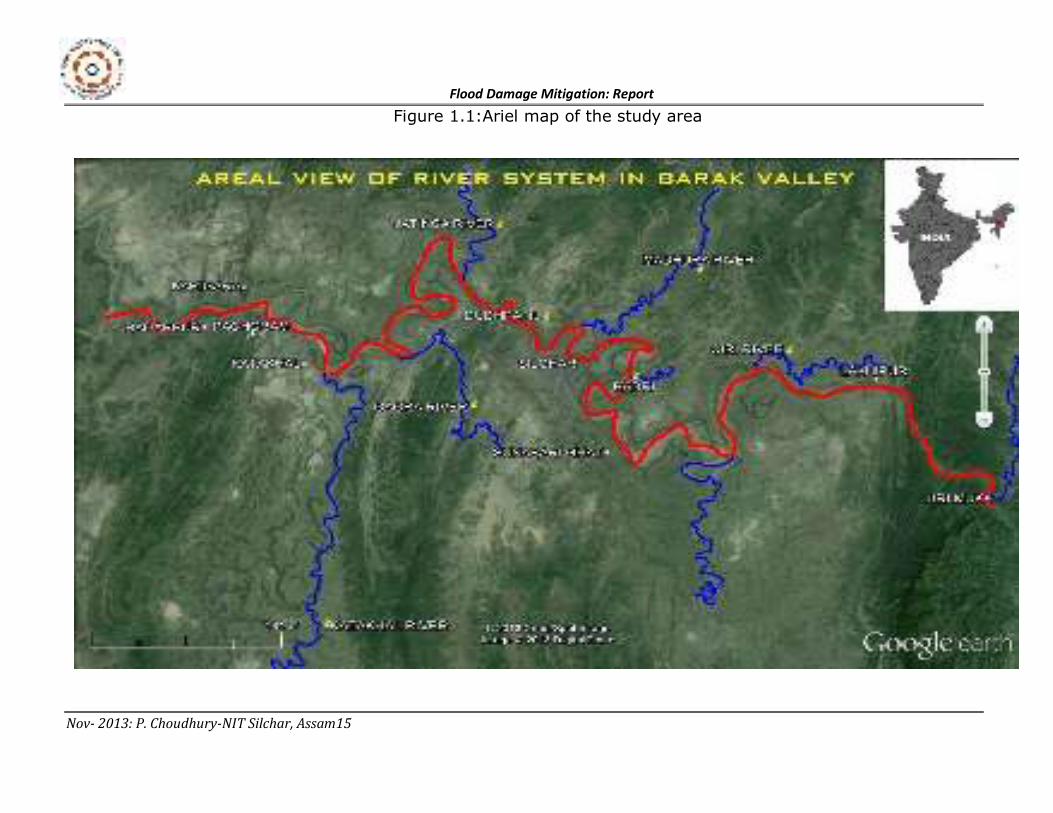
Figure 1.1:Ariel map of the study area
Flood Damage Mitigation: Report
Nov- 2013: P. Choudhury-NIT Silchar, Assam16
1.4 Objectives of the present study:
The majorobjectives of the present work are to study effectiveness of the
existing flood control measures in Barak valley and to recommend suitable
measures for mitigating flood damages. Following are the major objectives of
the present study
(i) Assessment of existing flow capacity for different channels in the river
system.
(ii) Assessment of effectiveness of existing embankments in the study area
(iii) Improvement works for lateral channels and natural reservoirs
(iv) Investigation on sediment load in the river system and erosion potential
for different sub catchments.
(v) Evaluation of impacts of flows from upstream catchments on downstream
flood flows
(vi) Development of an improved flood forecasting tool for the study area
incorporating flow contribution from gauged and ungauged catchments
(vii) Evaluation of effects of climate change on flood flows in the river
system.
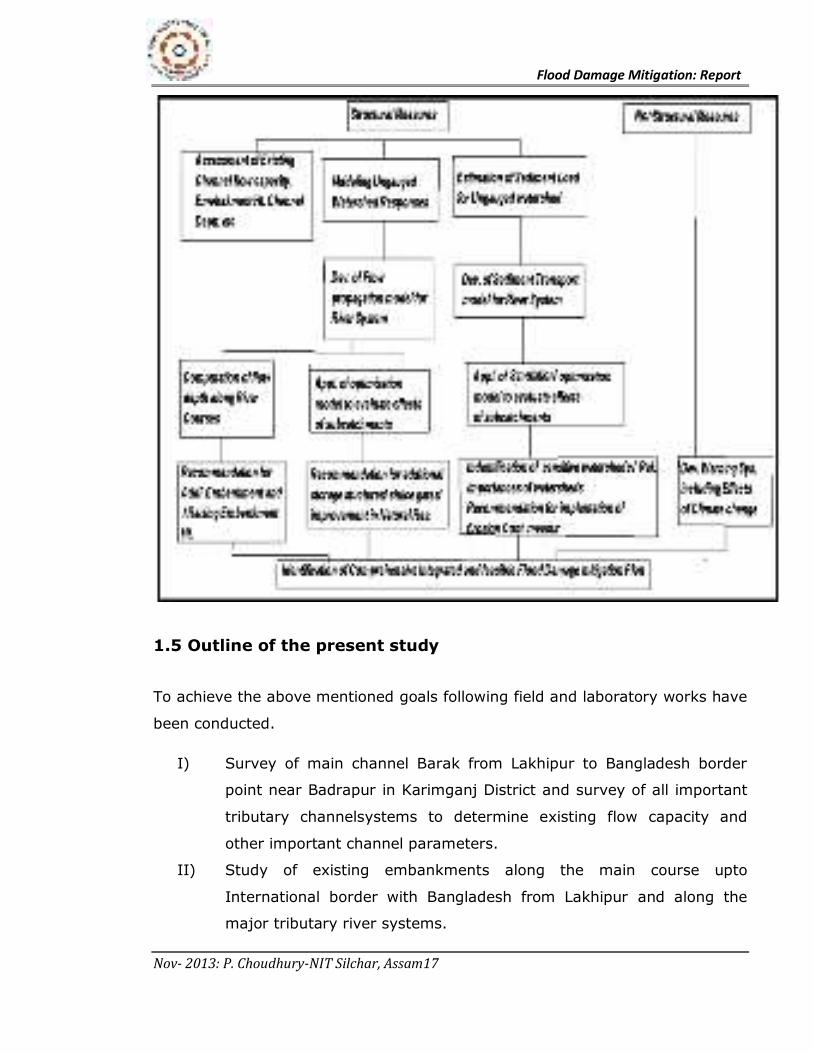
Flow Chart depicting development of flood damage mitigation plan for the study
area consisting of three districts in south Assam, Cachar, Karimgajj and
Hailakandi is presented in the figure given next
Flood Damage Mitigation: Report
Nov- 2013: P. Choudhury-NIT Silchar, Assam17
1.5 Outline of the present study
To achieve the above mentioned goals following field and laboratory works have
been conducted.
I) Survey of main channel Barak from Lakhipur to Bangladesh border
point near Badrapur in Karimganj District and survey of all important
tributary channelsystems to determine existing flow capacity and
other important channel parameters.
II) Study of existing embankments along the main course upto
International border with Bangladesh from Lakhipur and along the
major tributary river systems.
Flood Damage Mitigation: Report
Nov- 2013: P. Choudhury-NIT Silchar, Assam18
III) Development of Stage- Discharge relationship for the gauging stations
in the study area.
IV) Estimation of T-year rainfall intensity for the study area by applying L-
moment techniques.
V) Development of Slope Map, Drainage Map, Digital Elevation models
for important subcatchments in the study area and extraction of
geomorphologic parameters, hydraulic and channel parameters by
using Geographic Information System (GIS)
VI) Development of 1-hr unit hydrograph for the ungauged subcatcments
in the study area
VII) Development and application of flow routing modelsfor the upper
network and the complete river network in the study areato simulate
flood flow rates at Annapurnaghat near Silchar and Badarpurgaht near
Badarpur in Karimganj district.
VIII) Development and applications of sediment flow routing model to
simulate downstream sediment discharge and sediment concentration
at important downstream locations and assessment of relative effects
of erosion from different subcatchments.
IX) Formulation and applications of optimization models to assess impacts
of flows from different sub catchment on downstream flood flows and
to evaluate suitable control measures for protecting the important
downstream locations.
X) Development of flow forecasting model to forecast common
downstream flows on the basis of upstream flows/ river satages.
XI) Development of Climate change module to evaluate effects of climate
change on flood flow in the study area and to recommend suitable
control measures under the changed scenarios.
Detailed description of the studies conducted to achieve the targets is
presented in the subsequent sections and subsections.
Flood Damage Mitigation: Report
Nov- 2013: P. Choudhury-NIT Silchar, Assam19
2.0 Assessment of Flow Capacity of Different Channels in the
River SysteminBarak Valley
2.1 Main Channel: River Barak
To assess flow capacity of the main channel Barak from Lakhipur in
Assam, India upto international border with Bangladesh various data and maps
available with the department of water resources, GOA have been utilized.
Digital data and images collected from NRSA are used with GIS technique to
identify critical and vulnerable channel locations; to extract different
morphometric and geomorphologic characteristics of the channel system such
as, length, slope, areas etc and to estimate channel width at different locations.
On the basis of preliminary assessment made using digital images field
measurements for flow depth, cross sectional areas, flow velocity etc. have
beenundertaken at the identified and other critical location to estimate existing
flow capacity for the channels in the river system. The main river course from
Lakhipur to Badarpurghat have been surveyed to assess channel flow capacity
at an interval of 2 km approximately covering critical locations such as sharp
bend, narrow widths etc. M/S M.S Survey, Hoogly, Kolkata was entrusted to job
of survey works. The agency surveyed the main river course in two parts and
covered the channel stretch upto international border with Bangladesh. Some
representative survey details of the main river is included in the following
sections and full details submitted by the agency is sent separately along with
this report.
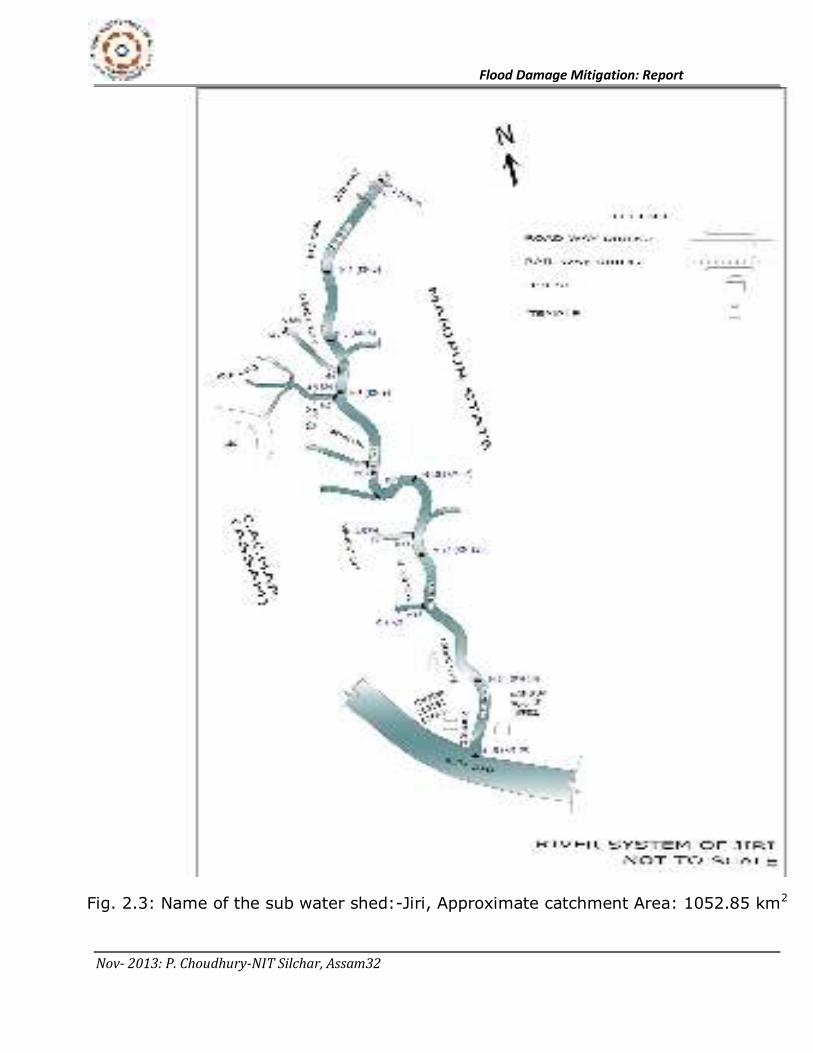
2.2 Tributary River Systems:
The important tributary channel systems that have been surveyed to estimate
flow capacity and other pertinent details includes the right bank tributaries, Jiri,
Chiri,Badri, Madhura and Jhatinga and the left bank tributaries Sonai, Ghagra,
Katakhal and Longai. A team of technical and non technical staff from the
department of Civil Engineering completed the survey works of the important
tributary channel systems in the study area. Relevant section details of the
Flood Damage Mitigation: Report
Nov- 2013: P. Choudhury-NIT Silchar, Assam20
tributary drainage systems such as top with, maximum flow depth, average
flow area etc. at a regular interval and at all critical locationsare obtained by
direct measurement and / laboratory computation. The detailed description of
the tributary river system along with pertinent details is presented
subsequently.
2.3 Details of Existing Embankments and Sluice Gates in the
Study Area:
The survey team traversed through the river network in the study area
collected details of the existing embankments along the main river and along
the tributaries. Details of existing sluice gates in the subcatchments as well as
existing water bodies were also recorded /measured by the team. Distance of
the existing embankments from the central axis of the river course, height of
the embankment, length of the embankment etc have been
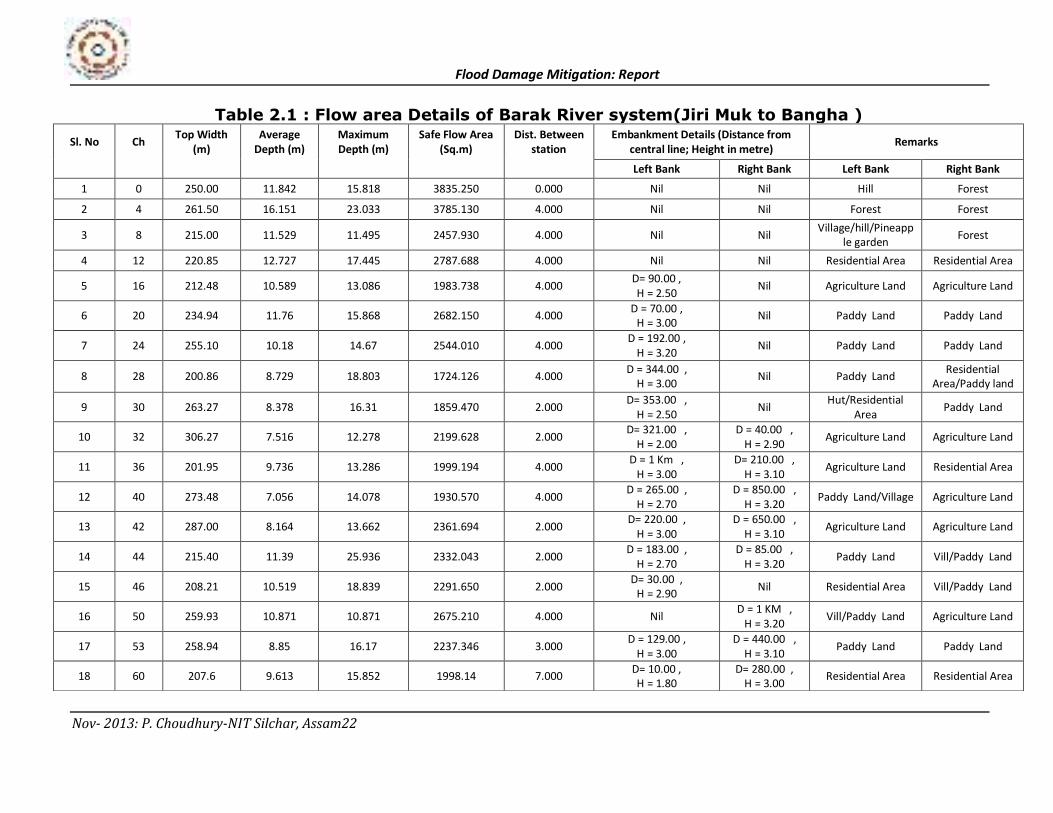
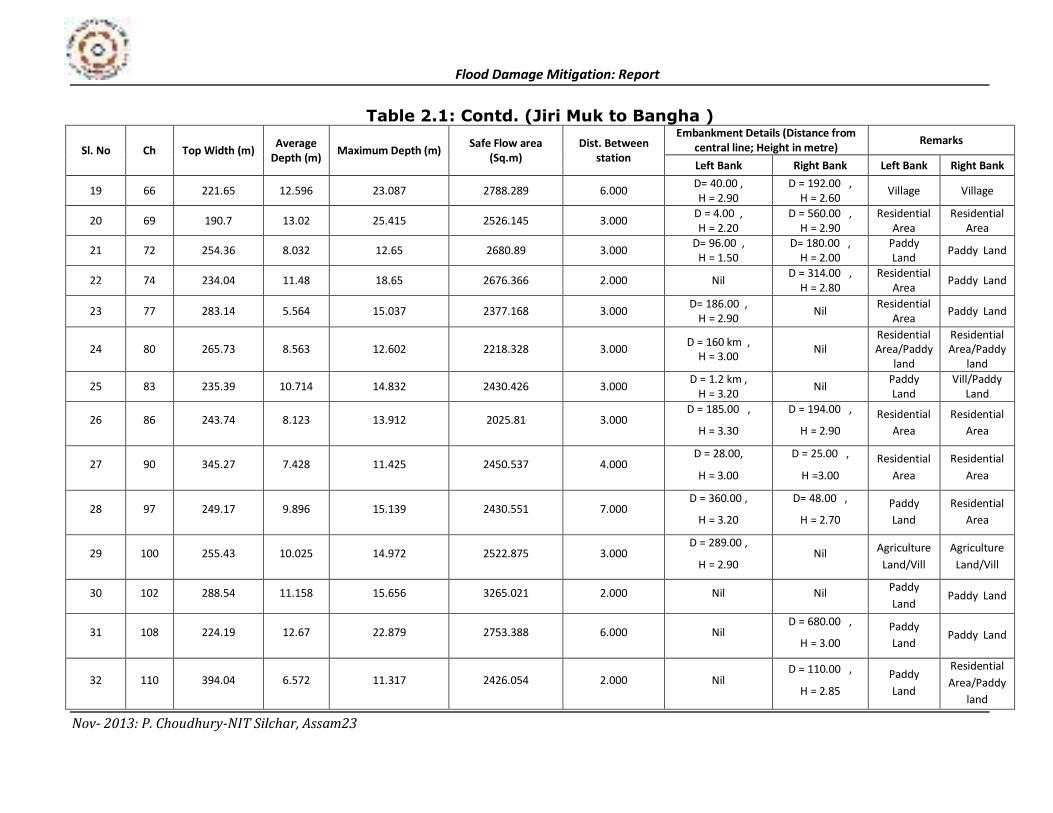
measured/computed for the entire river networks.Details of the embankments
along the main river course from Lakhipur to Bhanga in Karimganj district and
along the tributary channels in the major sub catchments are as follows:flow
areas of section along the river courses in the valley are presented in Tables
2.1 through 2.10; map of the river courses and section details are given in
figures 2.1 through figures 2.20(c); Details of existing embankment along the
major tributary river systems and along the main river Barak is given in Table-
2.21 and list of the existing major sluice gates in the study area is available in
Table-2.12
Flood Damage Mitigation: Report
Nov- 2013: P. Choudhury-NIT Silchar, Assam21
Flood Damage Mitigation: Report
Nov- 2013: P. Choudhury-NIT Silchar, Assam22
Table 2.1 : Flow area Details of Barak River system(Jiri Muk to Bangha )
Sl. No Ch Top Width
(m)
Average
Depth (m)
Maximum
Depth (m)
Safe Flow Area
(Sq.m)
Dist. Between
station
Embankment Details (Distance from
central line; Height in metre) Remarks
Left Bank Right Bank Left Bank Right Bank
1 0 250.00 11.842 15.818 3835.250 0.000 Nil Nil Hill Forest
2 4 261.50 16.151 23.033 3785.130 4.000 Nil Nil Forest Forest
3 8 215.00 11.529 11.495 2457.930 4.000 Nil Nil Village/hill/Pineapp
le garden Forest
4 12 220.85 12.727 17.445 2787.688 4.000 Nil Nil Residential Area Residential Area
5 16 212.48 10.589 13.086 1983.738 4.000 D= 90.00 ,
H = 2.50 Nil Agriculture Land Agriculture Land
6 20 234.94 11.76 15.868 2682.150 4.000 D = 70.00 ,
H = 3.00 Nil Paddy Land Paddy Land
7 24 255.10 10.18 14.67 2544.010 4.000 D = 192.00 ,
H = 3.20 Nil Paddy Land Paddy Land
8 28 200.86 8.729 18.803 1724.126 4.000 D = 344.00 ,
H = 3.00 Nil Paddy Land
Residential
Area/Paddy land
9 30 263.27 8.378 16.31 1859.470 2.000 D= 353.00 ,
H = 2.50 Nil
Hut/Residential
Area Paddy Land
10 32 306.27 7.516 12.278 2199.628 2.000 D= 321.00 ,
H = 2.00
D = 40.00 ,
H = 2.90 Agriculture Land Agriculture Land
11 36 201.95 9.736 13.286 1999.194 4.000 D = 1 Km ,
H = 3.00
D= 210.00 ,
H = 3.10 Agriculture Land Residential Area
12 40 273.48 7.056 14.078 1930.570 4.000 D = 265.00 ,
H = 2.70
D = 850.00 ,
H = 3.20 Paddy Land/Village Agriculture Land
13 42 287.00 8.164 13.662 2361.694 2.000 D= 220.00 ,
H = 3.00
D = 650.00 ,
H = 3.10 Agriculture Land Agriculture Land
14 44 215.40 11.39 25.936 2332.043 2.000 D = 183.00 ,
H = 2.70
D = 85.00 ,
H = 3.20 Paddy Land Vill/Paddy Land
15 46 208.21 10.519 18.839 2291.650 2.000 D= 30.00 ,
H = 2.90 Nil Residential Area Vill/Paddy Land
16 50 259.93 10.871 10.871 2675.210 4.000 Nil D = 1 KM ,
H = 3.20 Vill/Paddy Land Agriculture Land
17 53 258.94 8.85 16.17 2237.346 3.000 D = 129.00 ,
H = 3.00
D = 440.00 ,
H = 3.10 Paddy Land Paddy Land
18 60 207.6 9.613 15.852 1998.14 7.000 D= 10.00 ,
H = 1.80
D= 280.00 ,
H = 3.00 Residential Area Residential Area
Flood Damage Mitigation: Report
Nov- 2013: P. Choudhury-NIT Silchar, Assam23
Table 2.1: Contd. (Jiri Muk to Bangha )
Sl. No Ch Top Width (m) Average
Depth (m) Maximum Depth (m)
Safe Flow area
(Sq.m)
Dist. Between
station
Embankment Details (Distance from
central line; Height in metre) Remarks
Left Bank Right Bank Left Bank Right Bank
19 66 221.65 12.596 23.087 2788.289 6.000 D= 40.00 ,
H = 2.90
D = 192.00 ,
H = 2.60 Village Village
20 69 190.7 13.02 25.415 2526.145 3.000 D = 4.00 ,
H = 2.20
D = 560.00 ,
H = 2.90
Residential
Area
Residential
Area
21 72 254.36 8.032 12.65 2680.89 3.000 D= 96.00 ,
H = 1.50
D= 180.00 ,
H = 2.00
Paddy
Land Paddy Land
22 74 234.04 11.48 18.65 2676.366 2.000 Nil D = 314.00 ,
H = 2.80
Residential
Area Paddy Land
23 77 283.14 5.564 15.037 2377.168 3.000 D= 186.00 ,
H = 2.90 Nil
Residential
Area Paddy Land
24 80 265.73 8.563 12.602 2218.328 3.000 D = 160 km ,
H = 3.00 Nil
Residential
Area/Paddy
land
Residential
Area/Paddy
land
25 83 235.39 10.714 14.832 2430.426 3.000 D = 1.2 km ,
H = 3.20 Nil
Paddy
Land
Vill/Paddy
Land
26 86 243.74 8.123 13.912 2025.81 3.000 D = 185.00 ,
H = 3.30
D = 194.00 ,
H = 2.90
Residential
Area
Residential
Area
27 90 345.27 7.428 11.425 2450.537 4.000 D = 28.00,
H = 3.00
D = 25.00 ,
H =3.00
Residential
Area
Residential
Area
28 97 249.17 9.896 15.139 2430.551 7.000 D = 360.00 ,
H = 3.20
D= 48.00 ,
H = 2.70
Paddy
Land
Residential
Area
29 100 255.43 10.025 14.972 2522.875 3.000 D = 289.00 ,
H = 2.90 Nil
Agriculture
Land/Vill
Agriculture
Land/Vill
30 102 288.54 11.158 15.656 3265.021 2.000 Nil Nil Paddy
Land Paddy Land
31 108 224.19 12.67 22.879 2753.388 6.000 Nil D = 680.00 ,
H = 3.00
Paddy
Land Paddy Land
32 110 394.04 6.572 11.317 2426.054 2.000 Nil D = 110.00 ,
H = 2.85
Paddy
Land
Residential
Area/Paddy
land
Flood Damage Mitigation: Report
Nov- 2013: P. Choudhury-NIT Silchar, Assam24
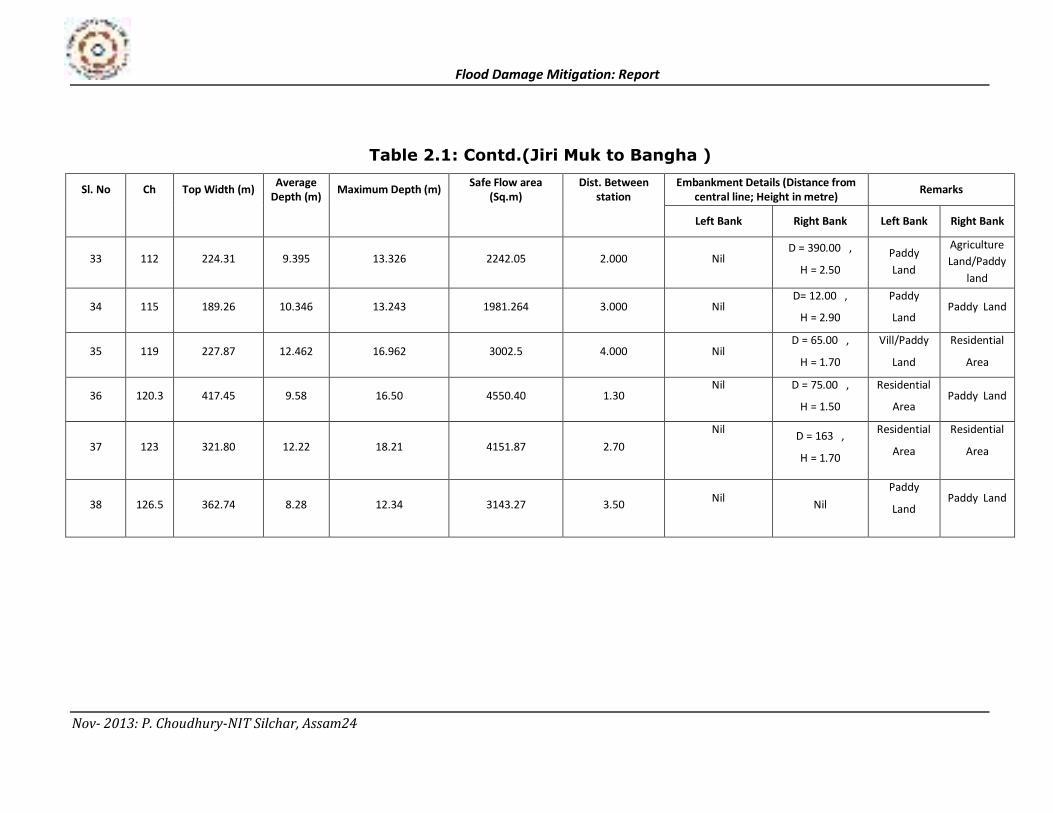
Table 2.1: Contd.(Jiri Muk to Bangha )
Sl. No Ch Top Width (m) Average
Depth (m) Maximum Depth (m)
Safe Flow area
(Sq.m)
Dist. Between
station
Embankment Details (Distance from
central line; Height in metre) Remarks
Left Bank Right Bank Left Bank Right Bank
33 112 224.31 9.395 13.326 2242.05 2.000 Nil D = 390.00 ,
H = 2.50
Paddy
Land
Agriculture
Land/Paddy
land
34 115 189.26 10.346 13.243 1981.264 3.000 Nil D= 12.00 ,
H = 2.90
Paddy
Land Paddy Land
35 119 227.87 12.462 16.962 3002.5 4.000 Nil D = 65.00 ,
H = 1.70
Vill/Paddy
Land
Residential
Area
36 120.3 417.45 9.58 16.50 4550.40 1.30 Nil D = 75.00 ,
H = 1.50
Residential
Area Paddy Land
37 123 321.80 12.22 18.21 4151.87 2.70
Nil D = 163 ,
H = 1.70
Residential
Area
Residential
Area
38 126.5 362.74 8.28 12.34 3143.27 3.50 Nil
Nil
Paddy
Land Paddy Land
Flood Damage Mitigation: Report
Nov- 2013: P. Choudhury-NIT Silchar, Assam25
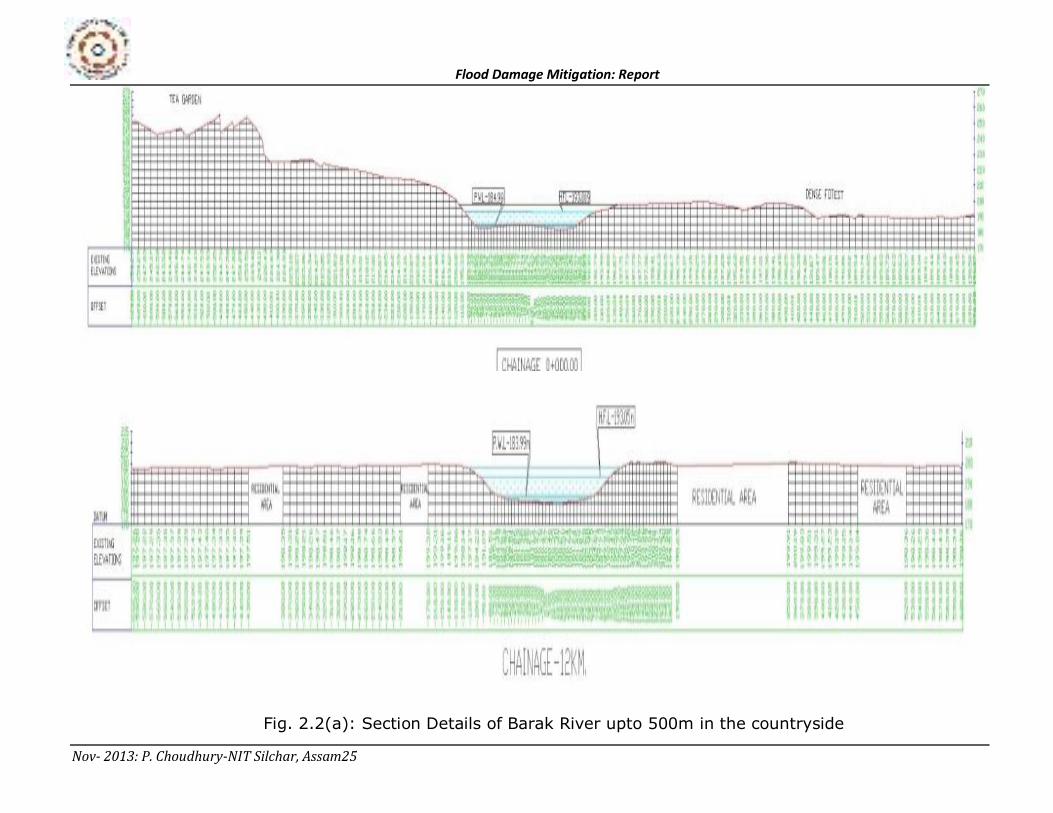
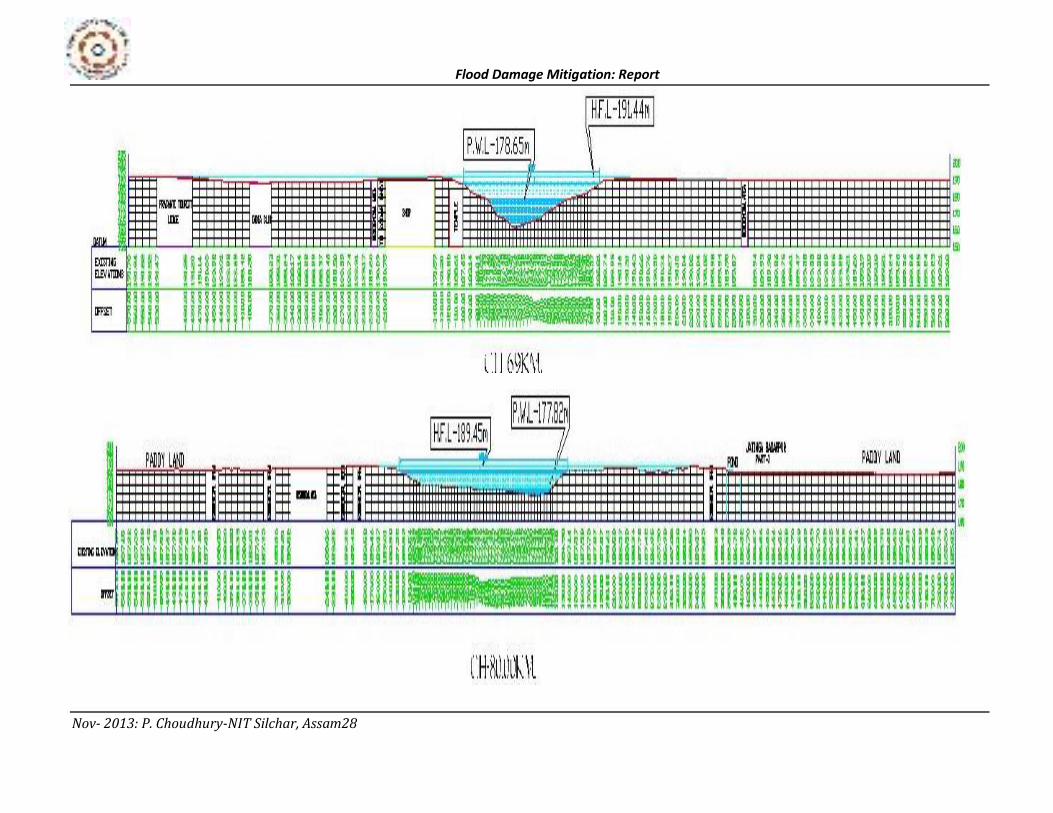
Fig. 2.2(a): Section Details of Barak River upto 500m in the countryside
Flood Damage Mitigation: Report
Nov- 2013: P. Choudhury-NIT Silchar, Assam26
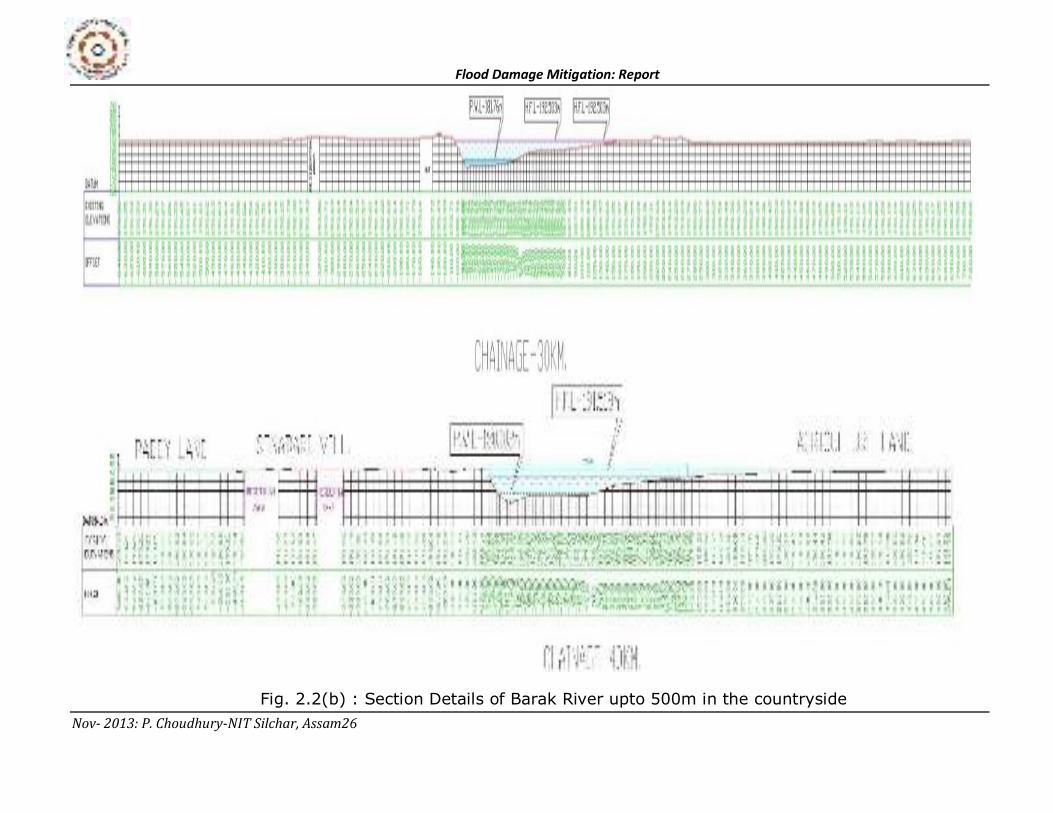
Fig. 2.2(b) : Section Details of Barak River upto 500m in the countryside
Flood Damage Mitigation: Report
Nov- 2013: P. Choudhury-NIT Silchar, Assam27
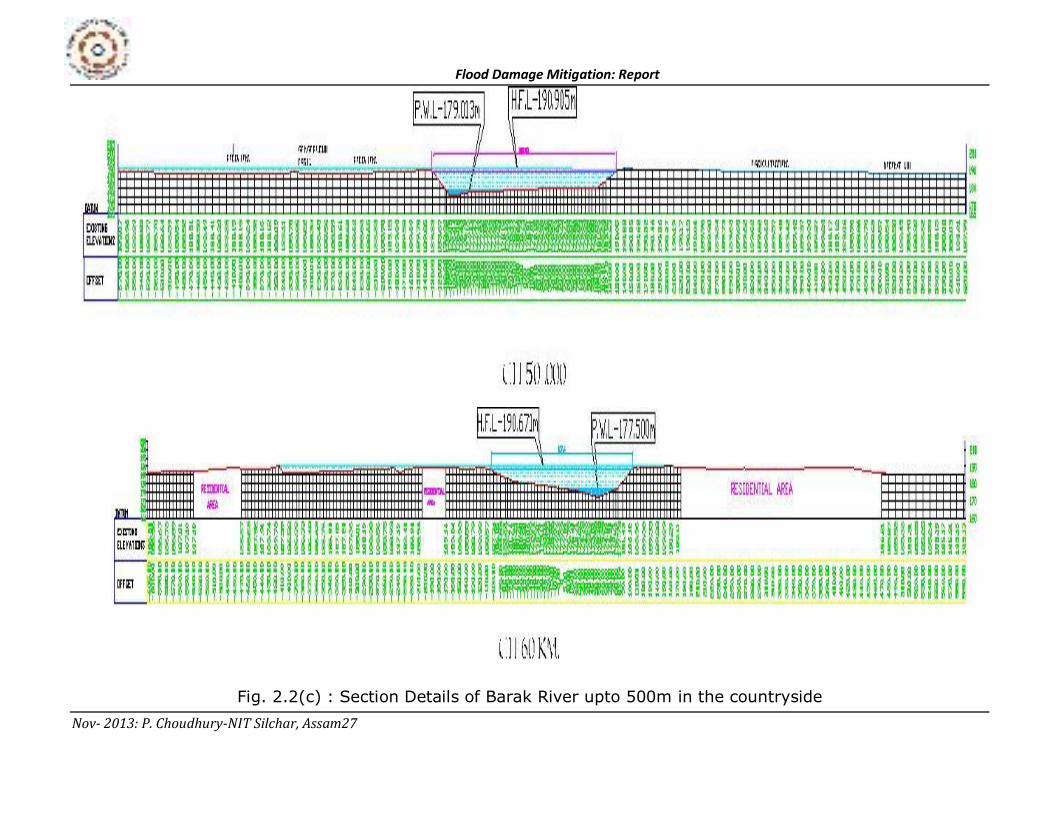
Fig. 2.2(c) : Section Details of Barak River upto 500m in the countryside
Flood Damage Mitigation: Report
Nov- 2013: P. Choudhury-NIT Silchar, Assam28
Flood Damage Mitigation: Report
Nov- 2013: P. Choudhury-NIT Silchar, Assam29
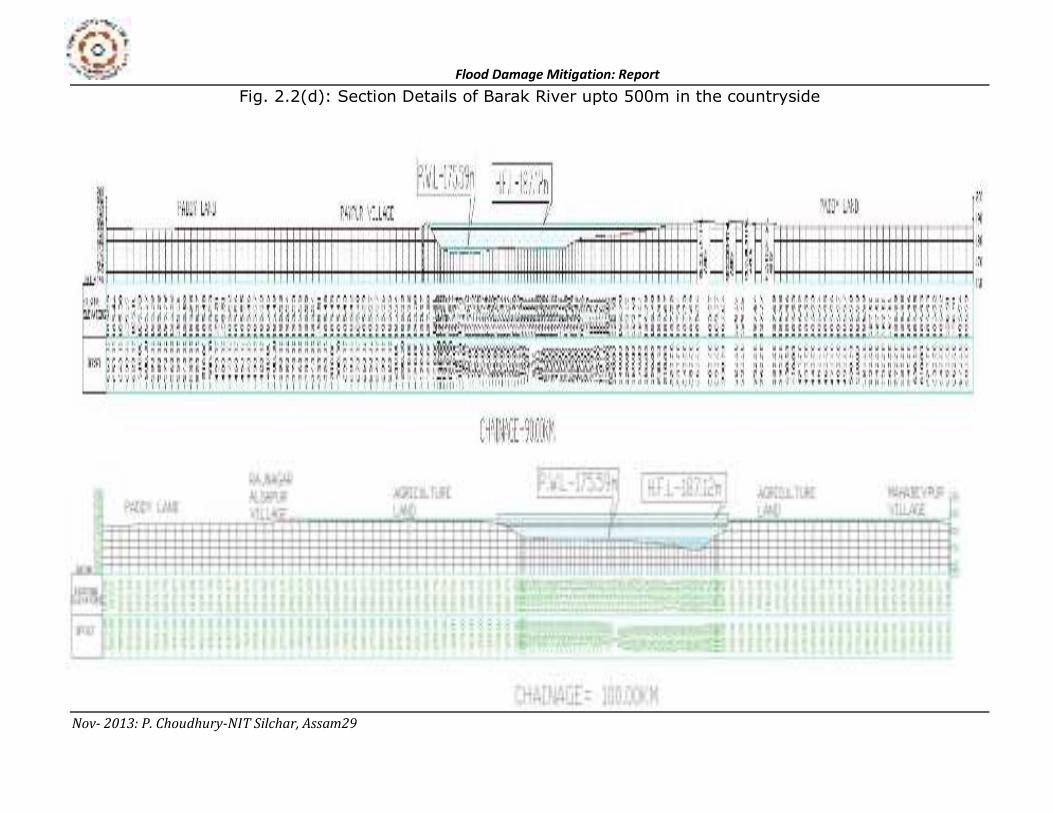
Fig. 2.2(d): Section Details of Barak River upto 500m in the countryside
Flood Damage Mitigation: Report
Nov- 2013: P. Choudhury-NIT Silchar, Assam30
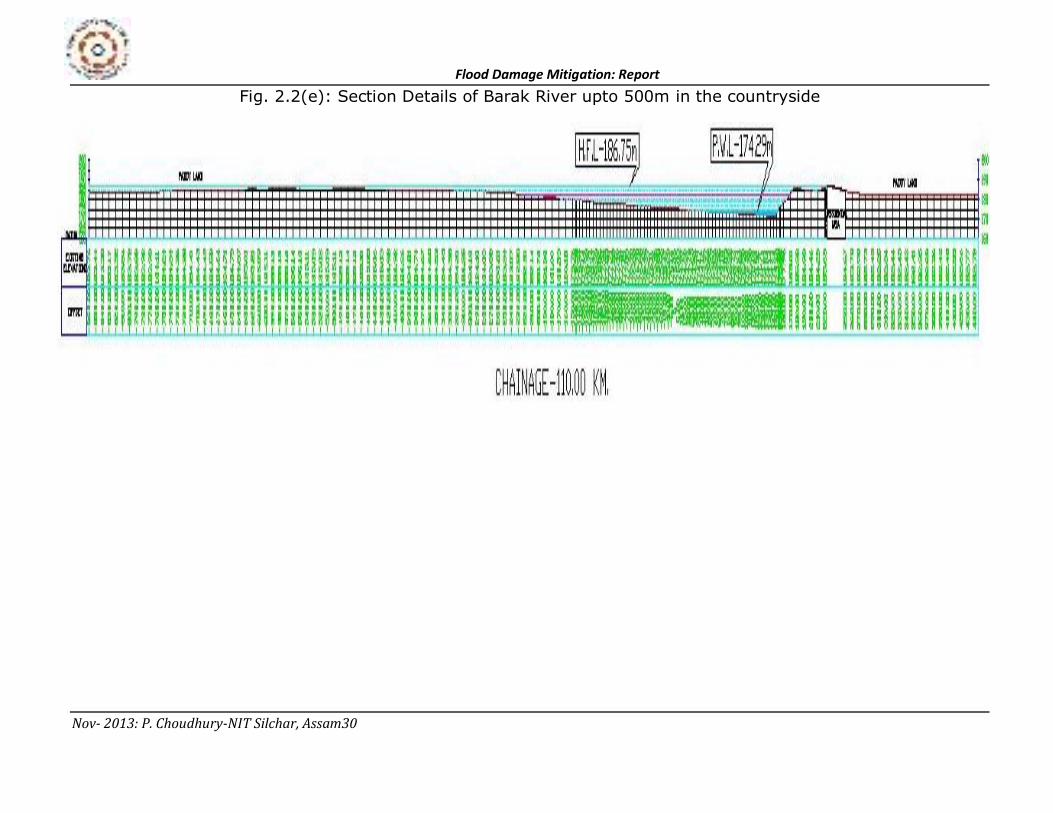
Fig. 2.2(e): Section Details of Barak River upto 500m in the countryside
Flood Damage Mitigation: Report
Nov- 2013: P. Choudhury-NIT Silchar, Assam31
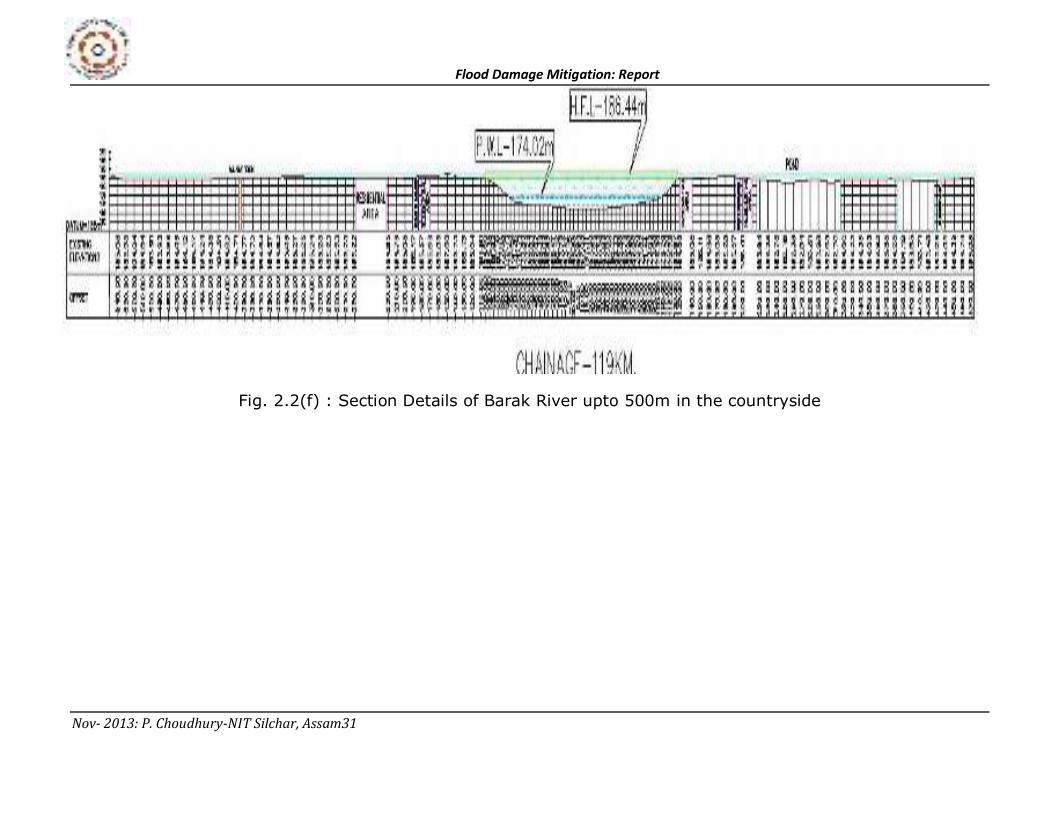
Fig. 2.2(f) : Section Details of Barak River upto 500m in the countryside
Flood Damage Mitigation: Report
Nov- 2013: P. Choudhury-NIT Silchar, Assam32
Fig. 2.3: Name of the sub water shed:-Jiri, Approximate catchment Area: 1052.85 km2
Flood Damage Mitigation: Report
Nov- 2013: P. Choudhury-NIT Silchar, Assam33
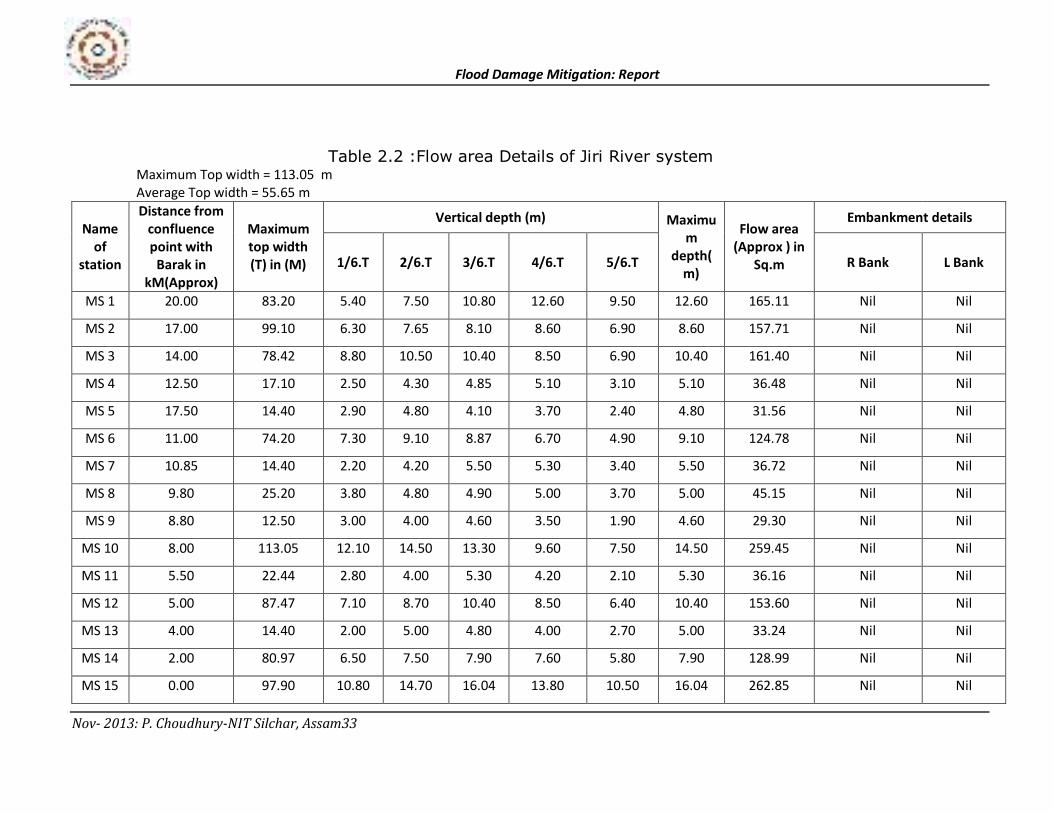
Table 2.2 :Flow area Details of Jiri River system
Maximum Top width = 113.05 m
Average Top width = 55.65 m
Name
of
station
Distance from
confluence
point with
Barak in
kM(Approx)
Maximum
top width
(T) in (M)
Vertical depth (m) Maximu
m
depth(
m)
Flow area
(Approx ) in
Sq.m
Embankment details
1/6.T 2/6.T 3/6.T 4/6.T 5/6.T R Bank L Bank
MS 1 20.00 83.20 5.40 7.50 10.80 12.60 9.50 12.60 165.11 Nil Nil
MS 2 17.00 99.10 6.30 7.65 8.10 8.60 6.90 8.60 157.71 Nil Nil
MS 3 14.00 78.42 8.80 10.50 10.40 8.50 6.90 10.40 161.40 Nil Nil
MS 4 12.50 17.10 2.50 4.30 4.85 5.10 3.10 5.10 36.48 Nil Nil
MS 5 17.50 14.40 2.90 4.80 4.10 3.70 2.40 4.80 31.56 Nil Nil
MS 6 11.00 74.20 7.30 9.10 8.87 6.70 4.90 9.10 124.78 Nil Nil
MS 7 10.85 14.40 2.20 4.20 5.50 5.30 3.40 5.50 36.72 Nil Nil
MS 8 9.80 25.20 3.80 4.80 4.90 5.00 3.70 5.00 45.15 Nil Nil
MS 9 8.80 12.50 3.00 4.00 4.60 3.50 1.90 4.60 29.30 Nil Nil
MS 10 8.00 113.05 12.10 14.50 13.30 9.60 7.50 14.50 259.45 Nil Nil
MS 11 5.50 22.44 2.80 4.00 5.30 4.20 2.10 5.30 36.16 Nil Nil
MS 12 5.00 87.47 7.10 8.70 10.40 8.50 6.40 10.40 153.60 Nil Nil
MS 13 4.00 14.40 2.00 5.00 4.80 4.00 2.70 5.00 33.24 Nil Nil
MS 14 2.00 80.97 6.50 7.50 7.90 7.60 5.80 7.90 128.99 Nil Nil
MS 15 0.00 97.90 10.80 14.70 16.04 13.80 10.50 16.04 262.85 Nil Nil
Flood Damage Mitigation: Report
Nov- 2013: P. Choudhury-NIT Silchar, Assam34
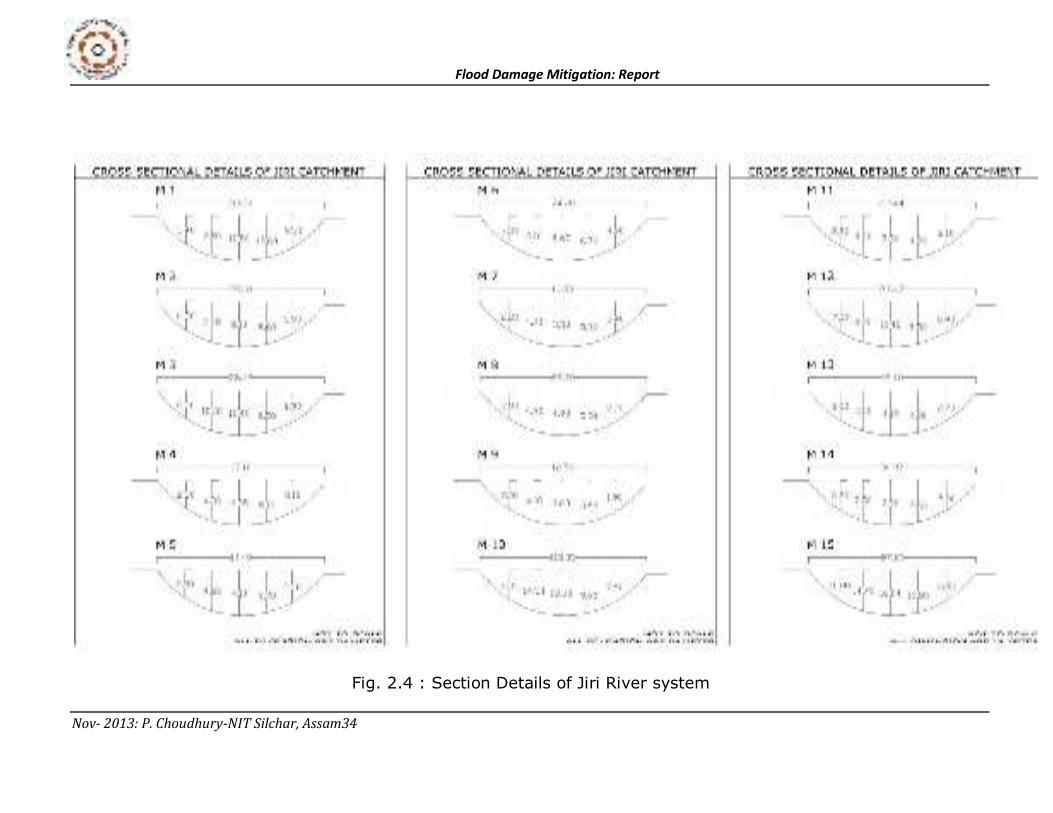
Fig. 2.4 : Section Details of Jiri River system
Flood Damage Mitigation: Report
Nov- 2013: P. Choudhury-NIT Silchar, Assam35
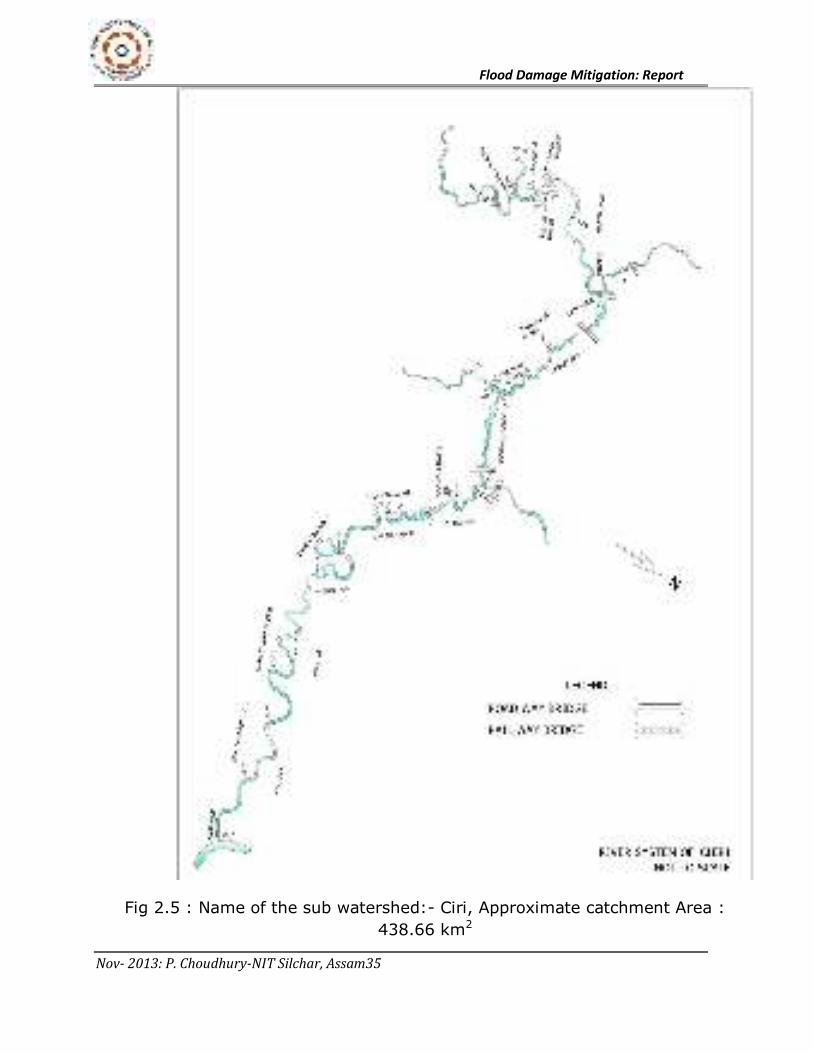
Fig 2.5 : Name of the sub watershed:- Ciri, Approximate catchment Area :
438.66 km2
Flood Damage Mitigation: Report
Nov- 2013: P. Choudhury-NIT Silchar, Assam36
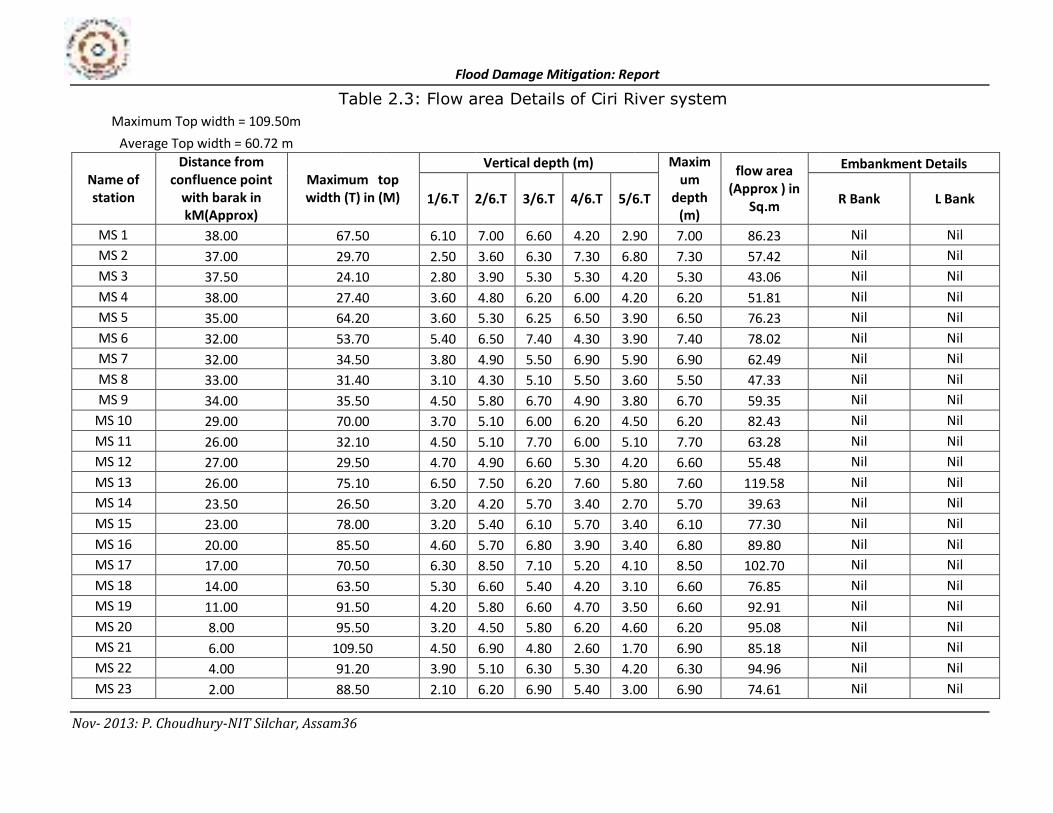
Table 2.3: Flow area Details of Ciri River system Maximum Top width = 109.50m
Average Top width = 60.72 m
Name of
station
Distance from
confluence point
with barak in
kM(Approx)
Maximum top
width (T) in (M)
Vertical depth (m) Maxim
um
depth
(m)
flow area
(Approx ) in
Sq.m
Embankment Details
1/6.T 2/6.T 3/6.T 4/6.T 5/6.T R Bank L Bank
MS 1 38.00 67.50 6.10 7.00 6.60 4.20 2.90 7.00 86.23 Nil Nil
MS 2 37.00 29.70 2.50 3.60 6.30 7.30 6.80 7.30 57.42 Nil Nil
MS 3 37.50 24.10 2.80 3.90 5.30 5.30 4.20 5.30 43.06 Nil Nil
MS 4 38.00 27.40 3.60 4.80 6.20 6.00 4.20 6.20 51.81 Nil Nil
MS 5 35.00 64.20 3.60 5.30 6.25 6.50 3.90 6.50 76.23 Nil Nil
MS 6 32.00 53.70 5.40 6.50 7.40 4.30 3.90 7.40 78.02 Nil Nil
MS 7 32.00 34.50 3.80 4.90 5.50 6.90 5.90 6.90 62.49 Nil Nil
MS 8 33.00 31.40 3.10 4.30 5.10 5.50 3.60 5.50 47.33 Nil Nil
MS 9 34.00 35.50 4.50 5.80 6.70 4.90 3.80 6.70 59.35 Nil Nil
MS 10 29.00 70.00 3.70 5.10 6.00 6.20 4.50 6.20 82.43 Nil Nil
MS 11 26.00 32.10 4.50 5.10 7.70 6.00 5.10 7.70 63.28 Nil Nil
MS 12 27.00 29.50 4.70 4.90 6.60 5.30 4.20 6.60 55.48 Nil Nil
MS 13 26.00 75.10 6.50 7.50 6.20 7.60 5.80 7.60 119.58 Nil Nil
MS 14 23.50 26.50 3.20 4.20 5.70 3.40 2.70 5.70 39.63 Nil Nil
MS 15 23.00 78.00 3.20 5.40 6.10 5.70 3.40 6.10 77.30 Nil Nil
MS 16 20.00 85.50 4.60 5.70 6.80 3.90 3.40 6.80 89.80 Nil Nil
MS 17 17.00 70.50 6.30 8.50 7.10 5.20 4.10 8.50 102.70 Nil Nil
MS 18 14.00 63.50 5.30 6.60 5.40 4.20 3.10 6.60 76.85 Nil Nil
MS 19 11.00 91.50 4.20 5.80 6.60 4.70 3.50 6.60 92.91 Nil Nil
MS 20 8.00 95.50 3.20 4.50 5.80 6.20 4.60 6.20 95.08 Nil Nil
MS 21 6.00 109.50 4.50 6.90 4.80 2.60 1.70 6.90 85.18 Nil Nil
MS 22 4.00 91.20 3.90 5.10 6.30 5.30 4.20 6.30 94.96 Nil Nil
MS 23 2.00 88.50 2.10 6.20 6.90 5.40 3.00 6.90 74.61 Nil Nil
Flood Damage Mitigation: Report
Nov- 2013: P. Choudhury-NIT Silchar, Assam37
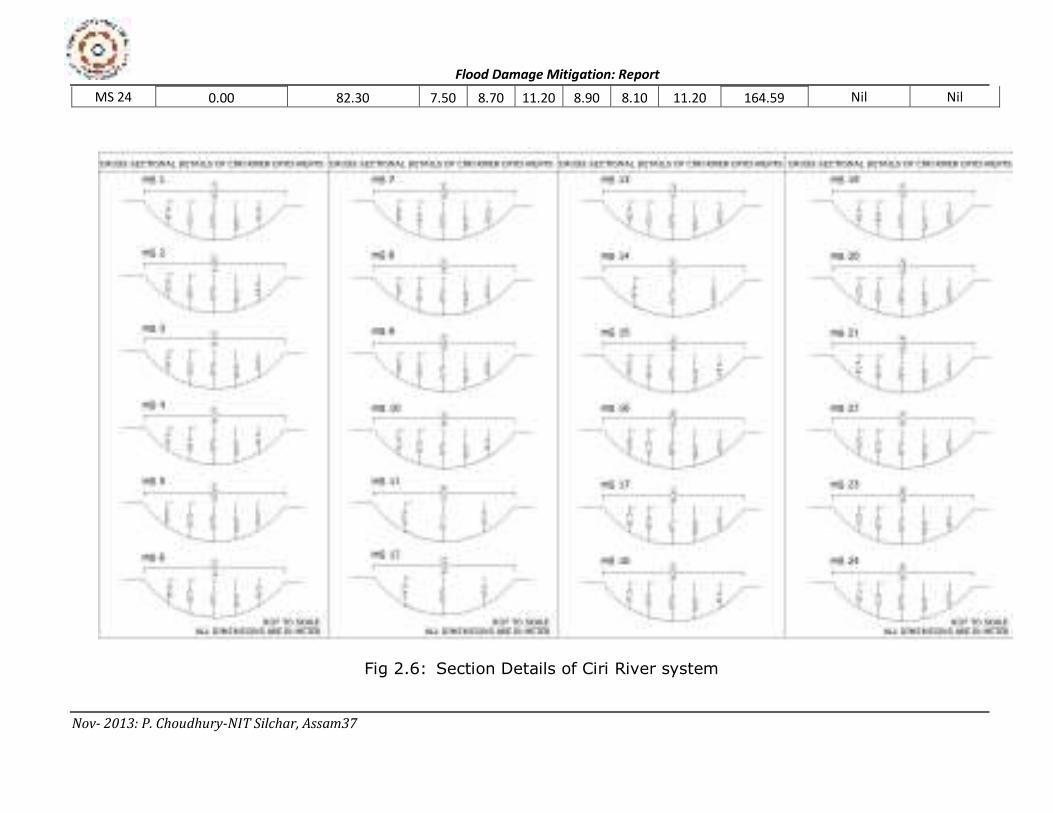
MS 24 0.00 82.30 7.50 8.70 11.20 8.90 8.10 11.20 164.59 Nil Nil
Fig 2.6: Section Details of Ciri River system
Flood Damage Mitigation: Report
Nov- 2013: P. Choudhury-NIT Silchar, Assam38
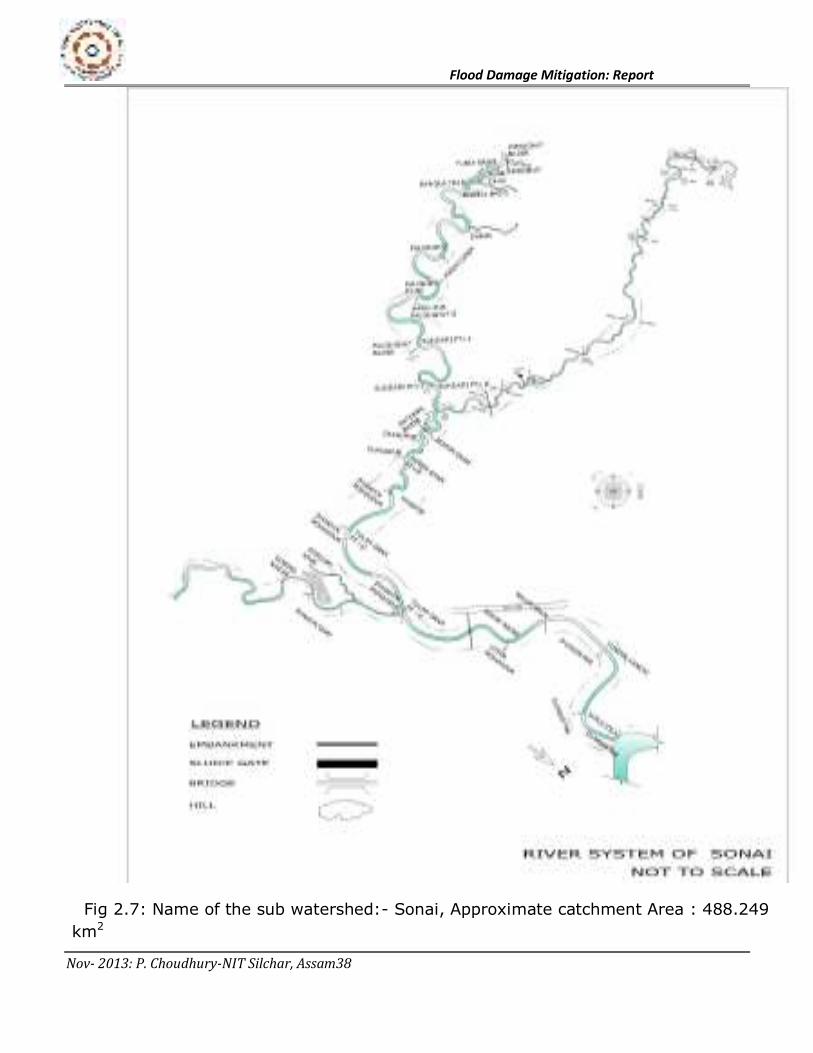
Fig 2.7: Name of the sub watershed:- Sonai, Approximate catchment Area : 488.249
km2
Flood Damage Mitigation: Report
Nov- 2013: P. Choudhury-NIT Silchar, Assam39
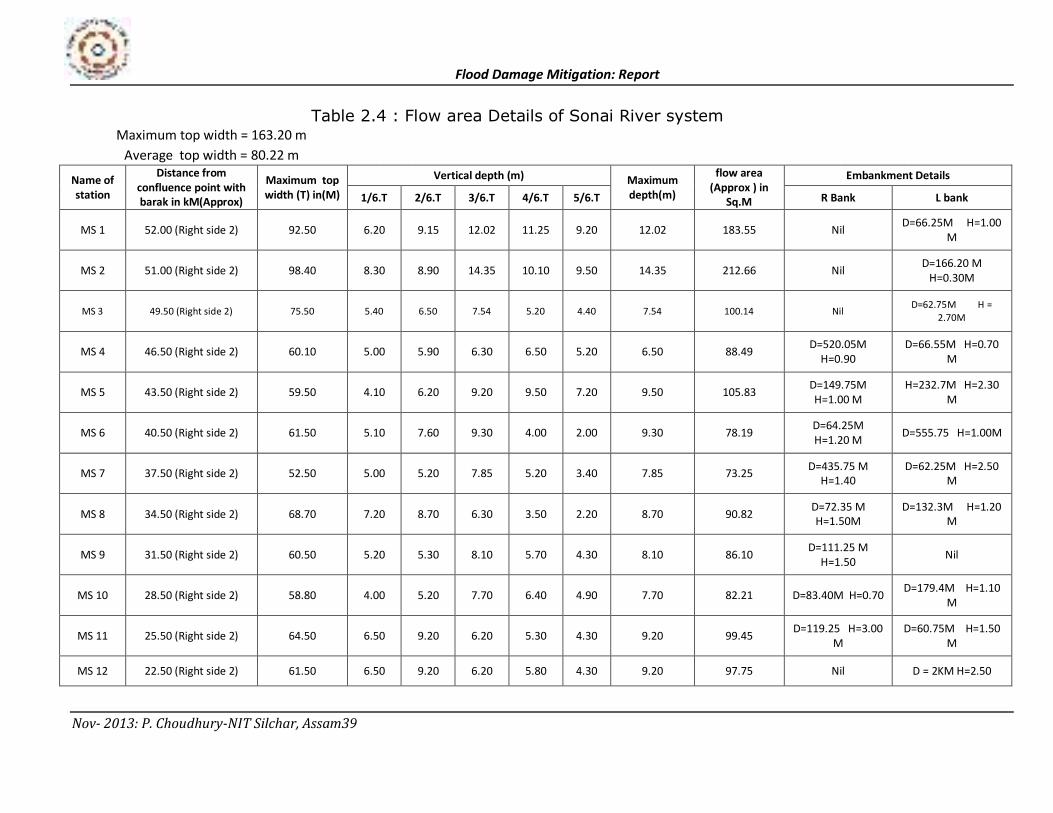
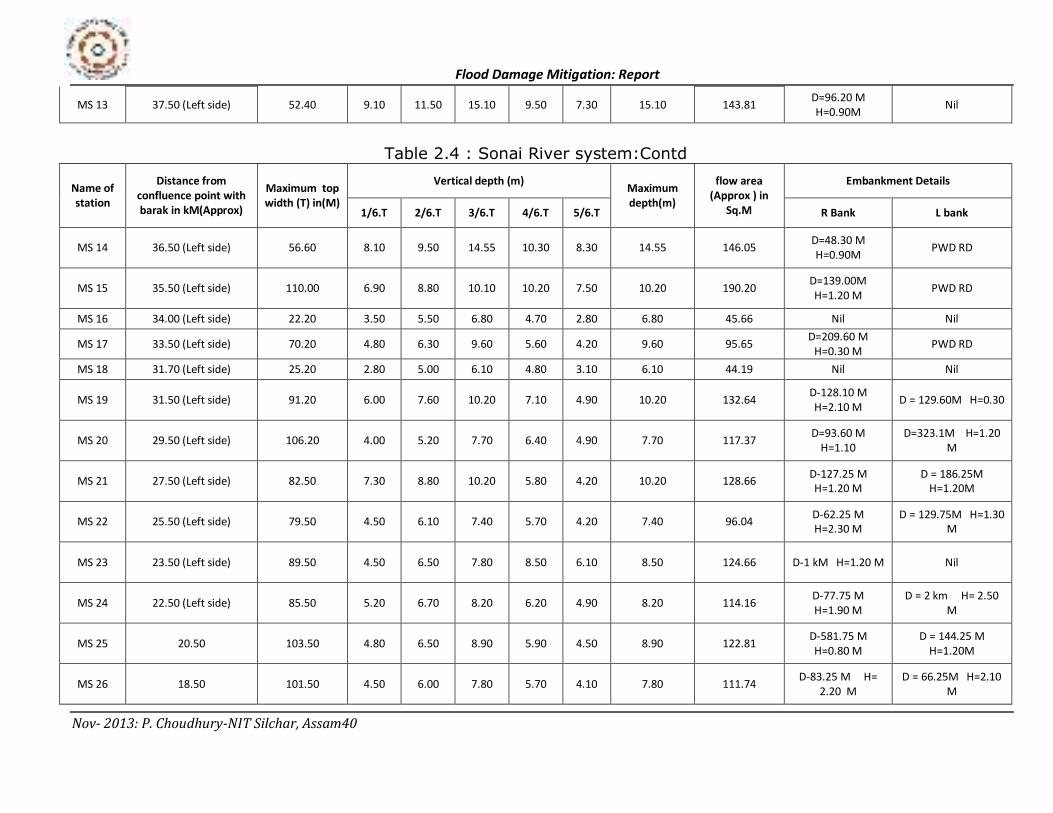
Table 2.4 : Flow area Details of Sonai River system Maximum top width = 163.20 m
Average top width = 80.22 m
Name of
station
Distance from
confluence point with
barak in kM(Approx)
Maximum top
width (T) in(M)
Vertical depth (m) Maximum
depth(m)
flow area
(Approx ) in
Sq.M
Embankment Details
1/6.T 2/6.T 3/6.T 4/6.T 5/6.T R Bank L bank
MS 1 52.00 (Right side 2) 92.50 6.20 9.15 12.02 11.25 9.20 12.02 183.55 Nil D=66.25M H=1.00
M
MS 2 51.00 (Right side 2) 98.40 8.30 8.90 14.35 10.10 9.50 14.35 212.66 Nil D=166.20 M
H=0.30M
MS 3 49.50 (Right side 2) 75.50 5.40 6.50 7.54 5.20 4.40 7.54 100.14 Nil D=62.75M H =
2.70M
MS 4 46.50 (Right side 2) 60.10 5.00 5.90 6.30 6.50 5.20 6.50 88.49 D=520.05M
H=0.90
D=66.55M H=0.70
M
MS 5 43.50 (Right side 2) 59.50 4.10 6.20 9.20 9.50 7.20 9.50 105.83 D=149.75M
H=1.00 M
H=232.7M H=2.30
M
MS 6 40.50 (Right side 2) 61.50 5.10 7.60 9.30 4.00 2.00 9.30 78.19 D=64.25M
H=1.20 M D=555.75 H=1.00M
MS 7 37.50 (Right side 2) 52.50 5.00 5.20 7.85 5.20 3.40 7.85 73.25 D=435.75 M
H=1.40
D=62.25M H=2.50
M
MS 8 34.50 (Right side 2) 68.70 7.20 8.70 6.30 3.50 2.20 8.70 90.82 D=72.35 M
H=1.50M
D=132.3M H=1.20
M
MS 9 31.50 (Right side 2) 60.50 5.20 5.30 8.10 5.70 4.30 8.10 86.10 D=111.25 M
H=1.50 Nil
MS 10 28.50 (Right side 2) 58.80 4.00 5.20 7.70 6.40 4.90 7.70 82.21 D=83.40M H=0.70 D=179.4M H=1.10
M
MS 11 25.50 (Right side 2) 64.50 6.50 9.20 6.20 5.30 4.30 9.20 99.45 D=119.25 H=3.00
M
D=60.75M H=1.50
M
MS 12 22.50 (Right side 2) 61.50 6.50 9.20 6.20 5.80 4.30 9.20 97.75 Nil D = 2KM H=2.50
Flood Damage Mitigation: Report
Nov- 2013: P. Choudhury-NIT Silchar, Assam40
MS 13 37.50 (Left side) 52.40 9.10 11.50 15.10 9.50 7.30 15.10 143.81 D=96.20 M
H=0.90M Nil
Table 2.4 : Sonai River system:Contd
Name of
station
Distance from
confluence point with
barak in kM(Approx)
Maximum top
width (T) in(M)
Vertical depth (m) Maximum
depth(m)
flow area
(Approx ) in
Sq.M
Embankment Details
1/6.T 2/6.T 3/6.T 4/6.T 5/6.T R Bank L bank
MS 14 36.50 (Left side) 56.60 8.10 9.50 14.55 10.30 8.30 14.55 146.05 D=48.30 M
H=0.90M PWD RD
MS 15 35.50 (Left side) 110.00 6.90 8.80 10.10 10.20 7.50 10.20 190.20 D=139.00M
H=1.20 M PWD RD
MS 16 34.00 (Left side) 22.20 3.50 5.50 6.80 4.70 2.80 6.80 45.66 Nil Nil
MS 17 33.50 (Left side) 70.20 4.80 6.30 9.60 5.60 4.20 9.60 95.65 D=209.60 M
H=0.30 M PWD RD
MS 18 31.70 (Left side) 25.20 2.80 5.00 6.10 4.80 3.10 6.10 44.19 Nil Nil
MS 19 31.50 (Left side) 91.20 6.00 7.60 10.20 7.10 4.90 10.20 132.64 D-128.10 M
H=2.10 M D = 129.60M H=0.30
MS 20 29.50 (Left side) 106.20 4.00 5.20 7.70 6.40 4.90 7.70 117.37 D=93.60 M
H=1.10
D=323.1M H=1.20
M
MS 21 27.50 (Left side) 82.50 7.30 8.80 10.20 5.80 4.20 10.20 128.66 D-127.25 M
H=1.20 M
D = 186.25M
H=1.20M
MS 22 25.50 (Left side) 79.50 4.50 6.10 7.40 5.70 4.20 7.40 96.04 D-62.25 M
H=2.30 M
D = 129.75M H=1.30
M
MS 23 23.50 (Left side) 89.50 4.50 6.50 7.80 8.50 6.10 8.50 124.66 D-1 kM H=1.20 M Nil
MS 24 22.50 (Left side) 85.50 5.20 6.70 8.20 6.20 4.90 8.20 114.16 D-77.75 M
H=1.90 M
D = 2 km H= 2.50
M
MS 25 20.50 103.50 4.80 6.50 8.90 5.90 4.50 8.90 122.81 D-581.75 M
H=0.80 M
D = 144.25 M
H=1.20M
MS 26 18.50 101.50 4.50 6.00 7.80 5.70 4.10 7.80 111.74 D-83.25 M H=
2.20 M
D = 66.25M H=2.10
M
Flood Damage Mitigation: Report
Nov- 2013: P. Choudhury-NIT Silchar, Assam41
MS 27 16.50 108.00 5.80 7.10 8.80 6.30 4.30 8.80 135.30 D-774 M H=2.00
M
D = 153.50 M H=
3.00
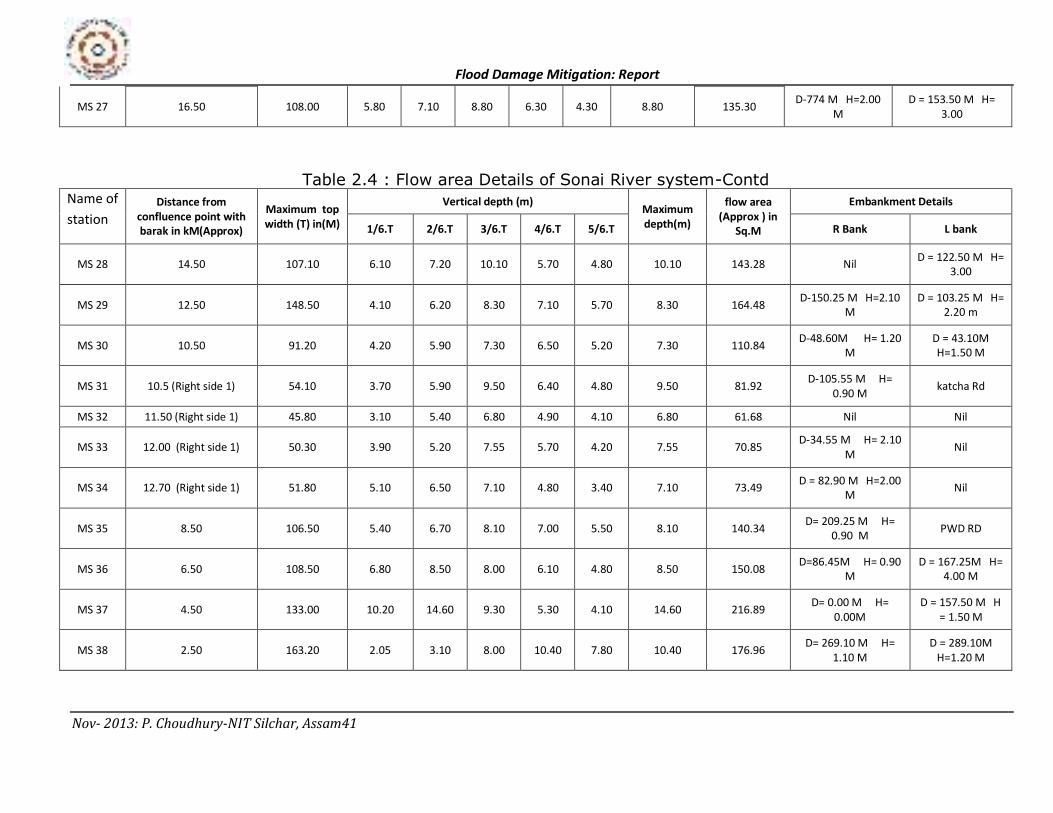
Table 2.4 : Flow area Details of Sonai River system-Contd Name of
station
Distance from
confluence point with
barak in kM(Approx)
Maximum top
width (T) in(M)
Vertical depth (m) Maximum
depth(m)
flow area
(Approx ) in
Sq.M
Embankment Details
1/6.T 2/6.T 3/6.T 4/6.T 5/6.T R Bank L bank
MS 28 14.50 107.10 6.10 7.20 10.10 5.70 4.80 10.10 143.28 Nil D = 122.50 M H=
3.00
MS 29 12.50 148.50 4.10 6.20 8.30 7.10 5.70 8.30 164.48 D-150.25 M H=2.10
M
D = 103.25 M H=
2.20 m
MS 30 10.50 91.20 4.20 5.90 7.30 6.50 5.20 7.30 110.84 D-48.60M H= 1.20
M
D = 43.10M
H=1.50 M
MS 31 10.5 (Right side 1) 54.10 3.70 5.90 9.50 6.40 4.80 9.50 81.92 D-105.55 M H=
0.90 M katcha Rd
MS 32 11.50 (Right side 1) 45.80 3.10 5.40 6.80 4.90 4.10 6.80 61.68 Nil Nil
MS 33 12.00 (Right side 1) 50.30 3.90 5.20 7.55 5.70 4.20 7.55 70.85 D-34.55 M H= 2.10
M Nil
MS 34 12.70 (Right side 1) 51.80 5.10 6.50 7.10 4.80 3.40 7.10 73.49 D = 82.90 M H=2.00
M Nil
MS 35 8.50 106.50 5.40 6.70 8.10 7.00 5.50 8.10 140.34 D= 209.25 M H=
0.90 M PWD RD
MS 36 6.50 108.50 6.80 8.50 8.00 6.10 4.80 8.50 150.08 D=86.45M H= 0.90
M
D = 167.25M H=
4.00 M
MS 37 4.50 133.00 10.20 14.60 9.30 5.30 4.10 14.60 216.89 D= 0.00 M H=
0.00M
D = 157.50 M H
= 1.50 M
MS 38 2.50 163.20 2.05 3.10 8.00 10.40 7.80 10.40 176.96 D= 269.10 M H=
1.10 M
D = 289.10M
H=1.20 M
Flood Damage Mitigation: Report
Nov- 2013: P. Choudhury-NIT Silchar, Assam42
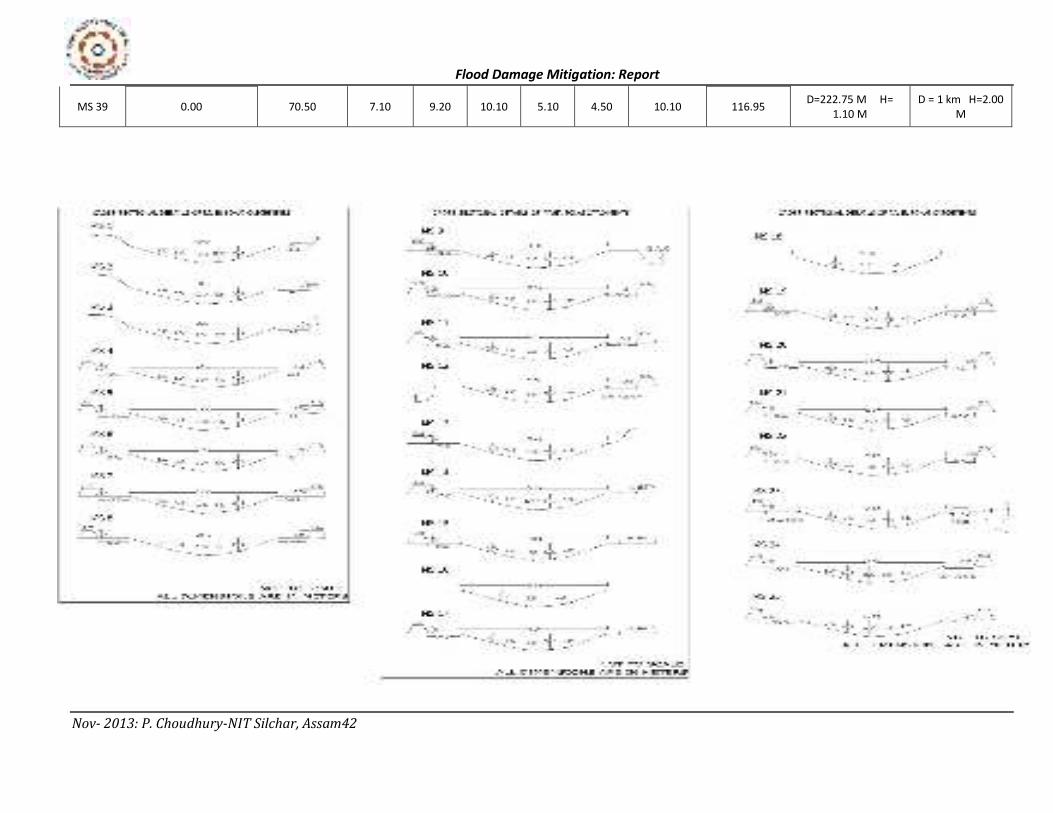
MS 39 0.00 70.50 7.10 9.20 10.10 5.10 4.50 10.10 116.95 D=222.75 M H=
1.10 M
D = 1 km H=2.00
M
Flood Damage Mitigation: Report
Nov- 2013: P. Choudhury-NIT Silchar, Assam43
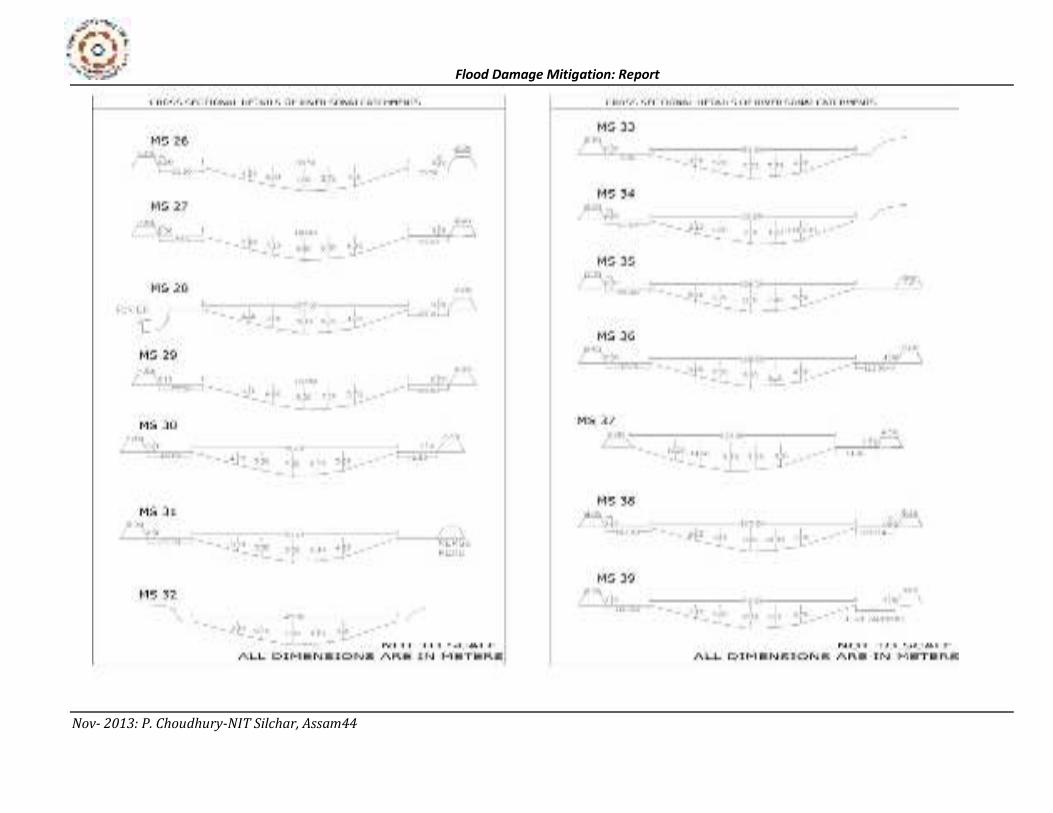
Fig 2.8(a) : Section Details of Sonai River system
Flood Damage Mitigation: Report
Nov- 2013: P. Choudhury-NIT Silchar, Assam44
Flood Damage Mitigation: Report
Nov- 2013: P. Choudhury-NIT Silchar, Assam45
Fig 2.8(b) : Section Details of Sonai River system-Contd
Flood Damage Mitigation: Report
Nov- 2013: P. Choudhury-NIT Silchar, Assam46
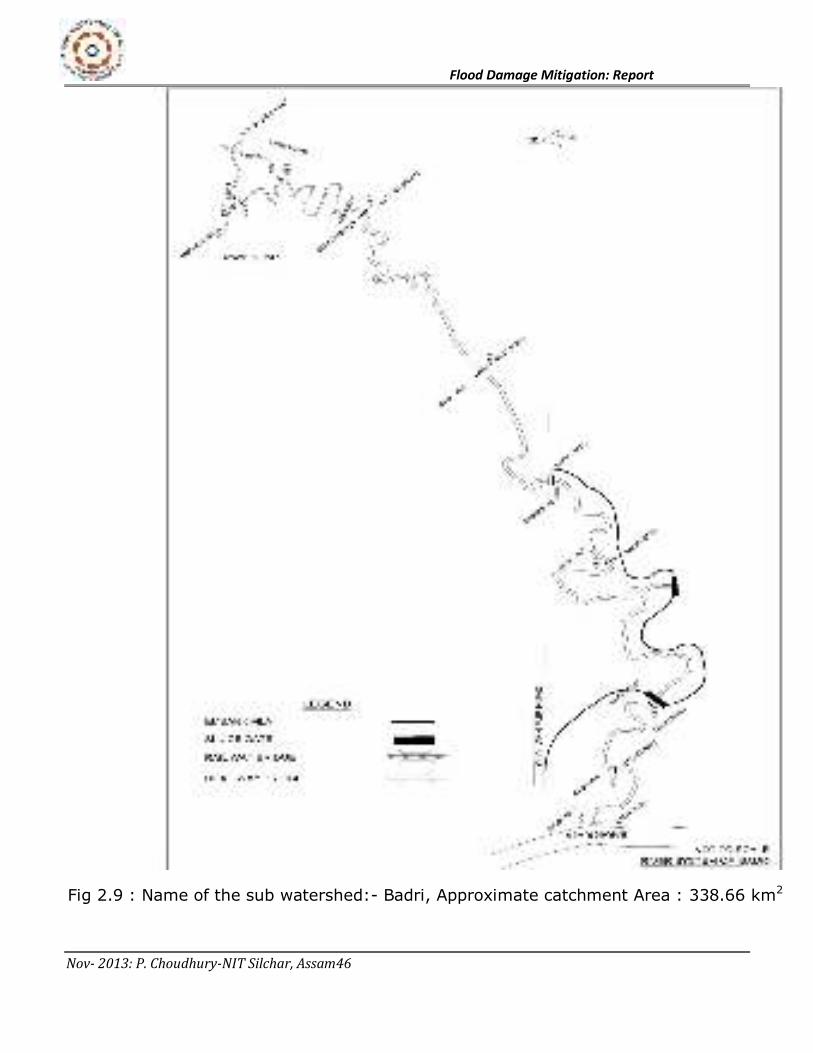
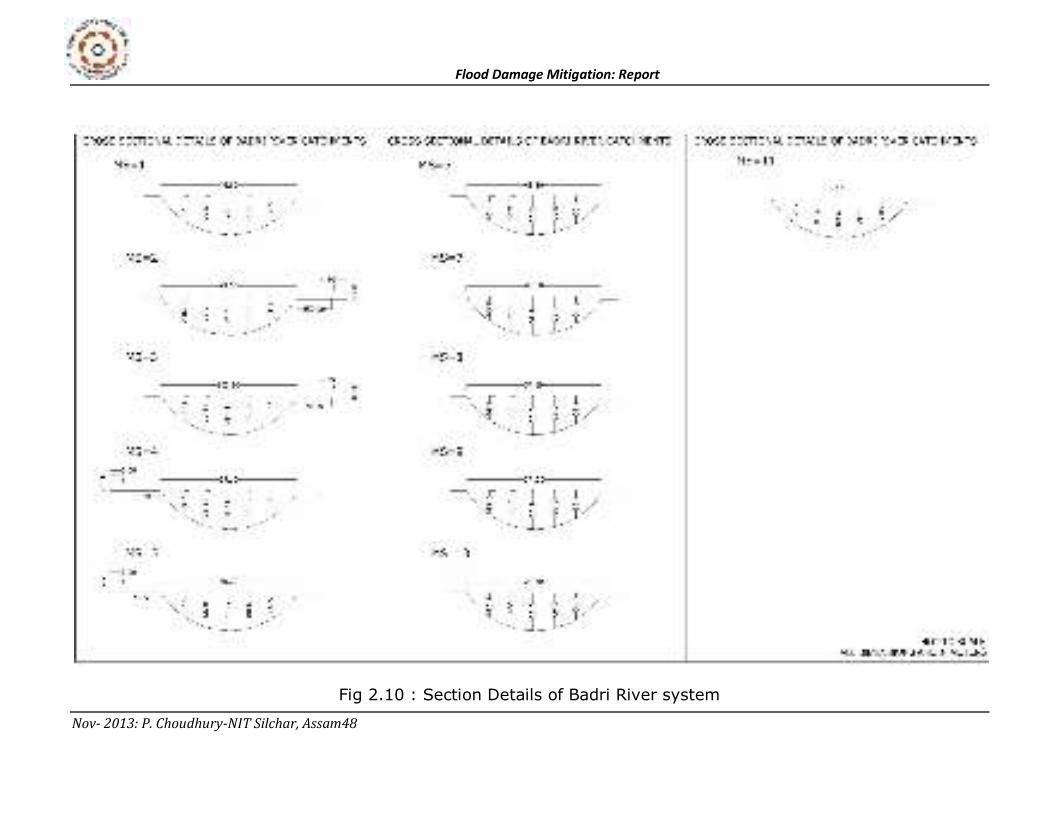
Fig 2.9 : Name of the sub watershed:- Badri, Approximate catchment Area : 338.66 km2
Flood Damage Mitigation: Report
Nov- 2013: P. Choudhury-NIT Silchar, Assam47
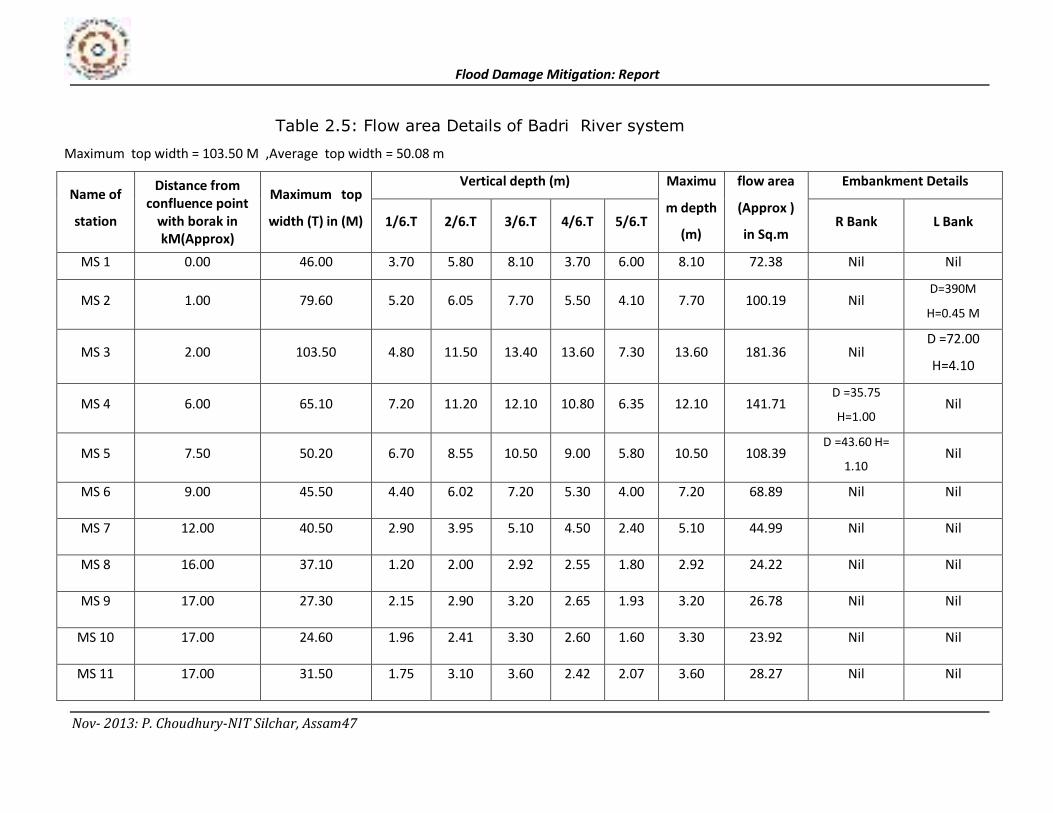
Table 2.5: Flow area Details of Badri River system
Maximum top width = 103.50 M ,Average top width = 50.08 m
Name of
station
Distance from
confluence point
with borak in
kM(Approx)
Maximum top
width (T) in (M)
Vertical depth (m) Maximu
m depth
(m)
flow area
(Approx )
in Sq.m
Embankment Details
1/6.T 2/6.T 3/6.T 4/6.T 5/6.T R Bank L Bank
MS 1 0.00 46.00 3.70 5.80 8.10 3.70 6.00 8.10 72.38 Nil Nil
MS 2 1.00 79.60 5.20 6.05 7.70 5.50 4.10 7.70 100.19 Nil D=390M
H=0.45 M
MS 3 2.00 103.50 4.80 11.50 13.40 13.60 7.30 13.60 181.36 Nil D =72.00
H=4.10
MS 4 6.00 65.10 7.20 11.20 12.10 10.80 6.35 12.10 141.71 D =35.75
H=1.00 Nil
MS 5 7.50 50.20 6.70 8.55 10.50 9.00 5.80 10.50 108.39 D =43.60 H=
1.10 Nil
MS 6 9.00 45.50 4.40 6.02 7.20 5.30 4.00 7.20 68.89 Nil Nil
MS 7 12.00 40.50 2.90 3.95 5.10 4.50 2.40 5.10 44.99 Nil Nil
MS 8 16.00 37.10 1.20 2.00 2.92 2.55 1.80 2.92 24.22 Nil Nil
MS 9 17.00 27.30 2.15 2.90 3.20 2.65 1.93 3.20 26.78 Nil Nil
MS 10 17.00 24.60 1.96 2.41 3.30 2.60 1.60 3.30 23.92 Nil Nil
MS 11 17.00 31.50 1.75 3.10 3.60 2.42 2.07 3.60 28.27 Nil Nil
Flood Damage Mitigation: Report
Nov- 2013: P. Choudhury-NIT Silchar, Assam48
Fig 2.10 : Section Details of Badri River system
Flood Damage Mitigation: Report
Nov- 2013: P. Choudhury-NIT Silchar, Assam49
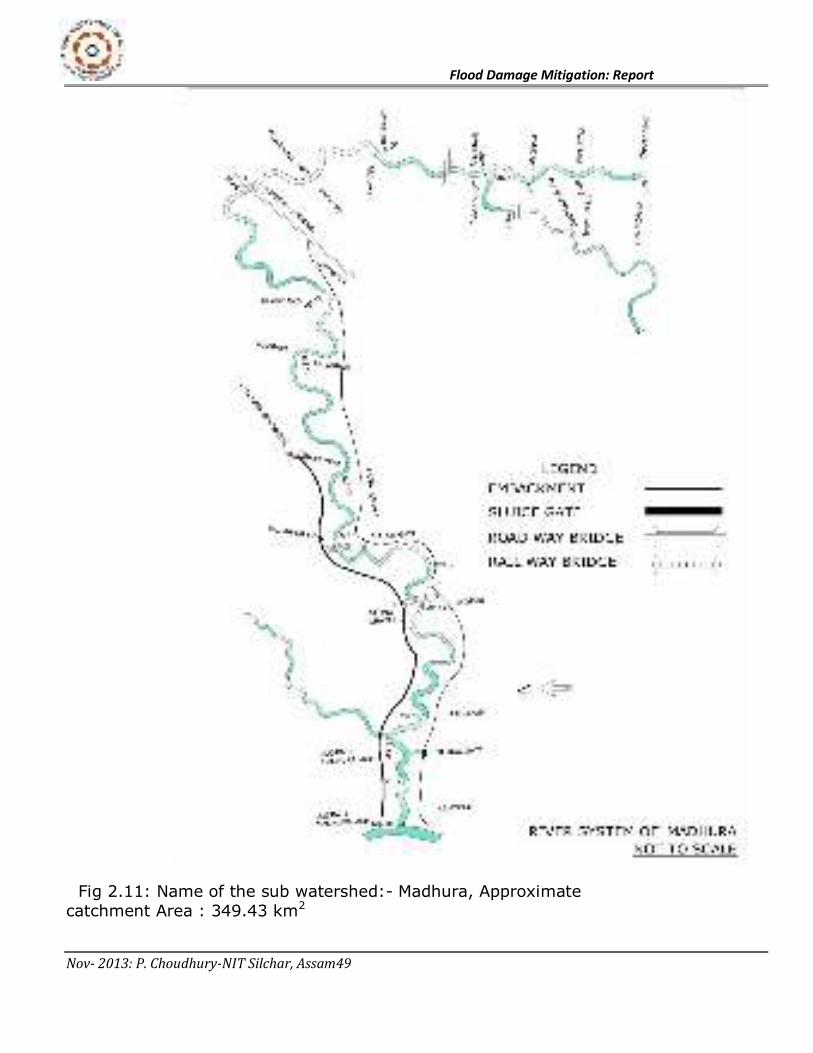
Fig 2.11: Name of the sub watershed:- Madhura, Approximate
catchment Area : 349.43 km2
Flood Damage Mitigation: Report
Nov- 2013: P. Choudhury-NIT Silchar, Assam50
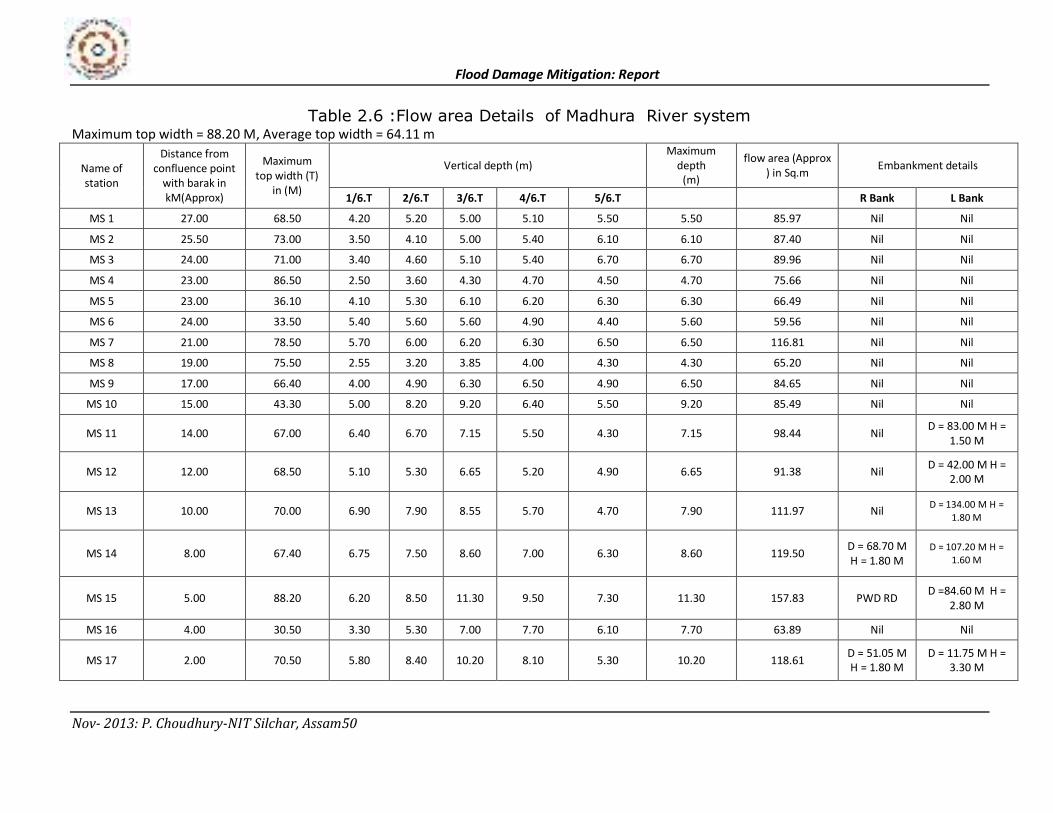
Table 2.6 :Flow area Details of Madhura River system
Maximum top width = 88.20 M, Average top width = 64.11 m
Name of
station
Distance from
confluence point
with barak in
kM(Approx)
Maximum
top width (T)
in (M)
Vertical depth (m)
Maximum
depth
(m)
flow area (Approx
) in Sq.m Embankment details
1/6.T 2/6.T 3/6.T 4/6.T 5/6.T
R Bank L Bank
MS 1 27.00 68.50 4.20 5.20 5.00 5.10 5.50 5.50 85.97 Nil Nil
MS 2 25.50 73.00 3.50 4.10 5.00 5.40 6.10 6.10 87.40 Nil Nil
MS 3 24.00 71.00 3.40 4.60 5.10 5.40 6.70 6.70 89.96 Nil Nil
MS 4 23.00 86.50 2.50 3.60 4.30 4.70 4.50 4.70 75.66 Nil Nil
MS 5 23.00 36.10 4.10 5.30 6.10 6.20 6.30 6.30 66.49 Nil Nil
MS 6 24.00 33.50 5.40 5.60 5.60 4.90 4.40 5.60 59.56 Nil Nil
MS 7 21.00 78.50 5.70 6.00 6.20 6.30 6.50 6.50 116.81 Nil Nil
MS 8 19.00 75.50 2.55 3.20 3.85 4.00 4.30 4.30 65.20 Nil Nil
MS 9 17.00 66.40 4.00 4.90 6.30 6.50 4.90 6.50 84.65 Nil Nil
MS 10 15.00 43.30 5.00 8.20 9.20 6.40 5.50 9.20 85.49 Nil Nil
MS 11 14.00 67.00 6.40 6.70 7.15 5.50 4.30 7.15 98.44 Nil D = 83.00 M H =
1.50 M
MS 12 12.00 68.50 5.10 5.30 6.65 5.20 4.90 6.65 91.38 Nil D = 42.00 M H =
2.00 M
MS 13 10.00 70.00 6.90 7.90 8.55 5.70 4.70 7.90 111.97 Nil D = 134.00 M H =
1.80 M
MS 14 8.00 67.40 6.75 7.50 8.60 7.00 6.30 8.60 119.50 D = 68.70 M
H = 1.80 M
D = 107.20 M H =
1.60 M
MS 15 5.00 88.20 6.20 8.50 11.30 9.50 7.30 11.30 157.83 PWD RD D =84.60 M H =
2.80 M
MS 16 4.00 30.50 3.30 5.30 7.00 7.70 6.10 7.70 63.89 Nil Nil
MS 17 2.00 70.50 5.80 8.40 10.20 8.10 5.30 10.20 118.61 D = 51.05 M
H = 1.80 M
D = 11.75 M H =
3.30 M
Flood Damage Mitigation: Report
Nov- 2013: P. Choudhury-NIT Silchar, Assam51
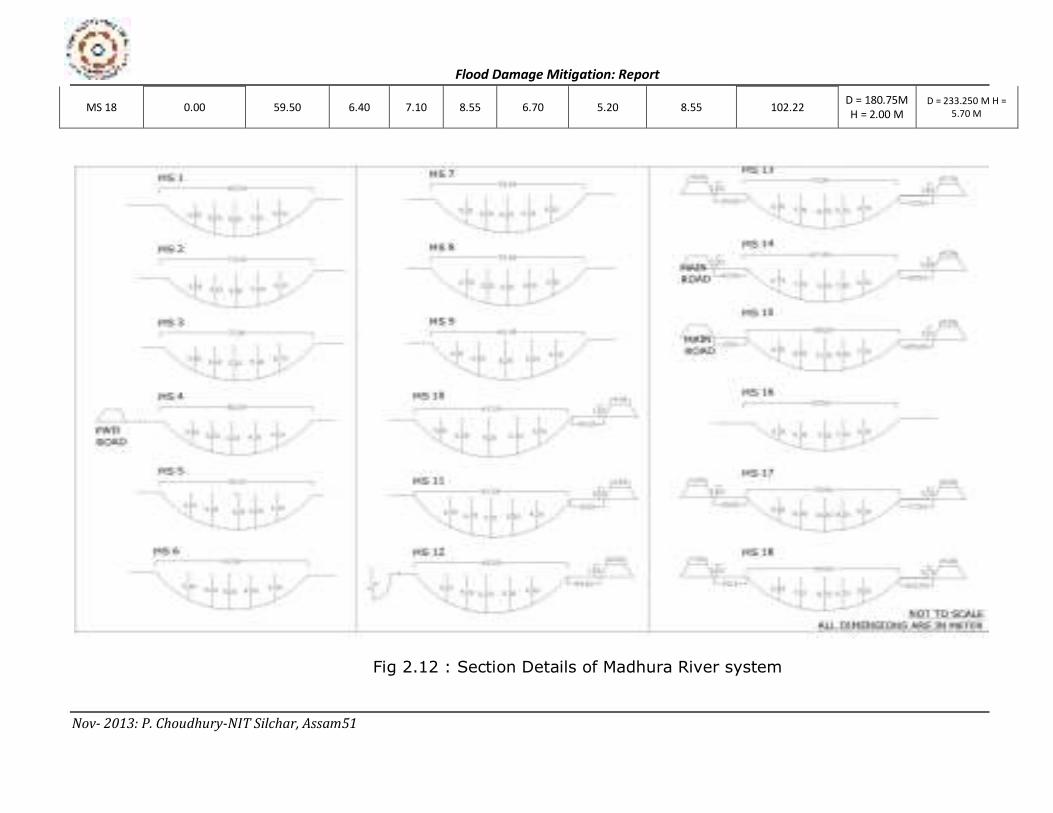
MS 18 0.00 59.50 6.40 7.10 8.55 6.70 5.20 8.55 102.22 D = 180.75M
H = 2.00 M
D = 233.250 M H =
5.70 M
Fig 2.12 : Section Details of Madhura River system
Flood Damage Mitigation: Report
Nov- 2013: P. Choudhury-NIT Silchar, Assam52
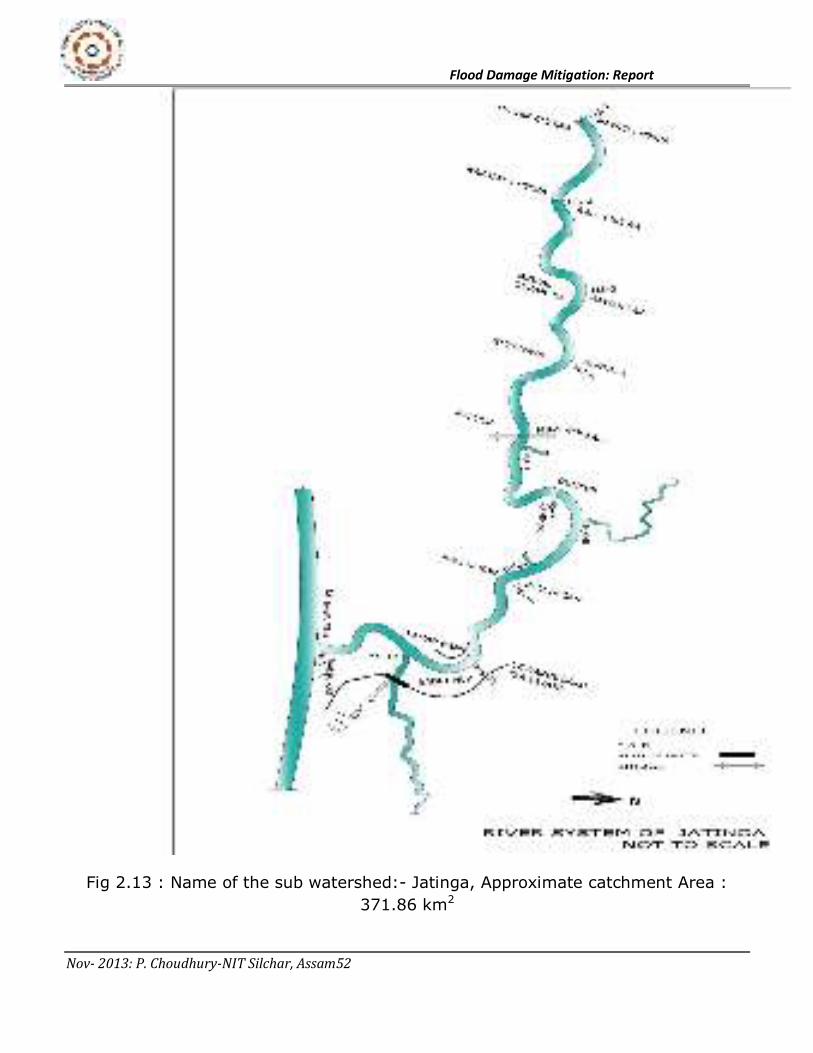
Fig 2.13 : Name of the sub watershed:- Jatinga, Approximate catchment Area :
371.86 km2
Flood Damage Mitigation: Report
Nov- 2013: P. Choudhury-NIT Silchar, Assam53
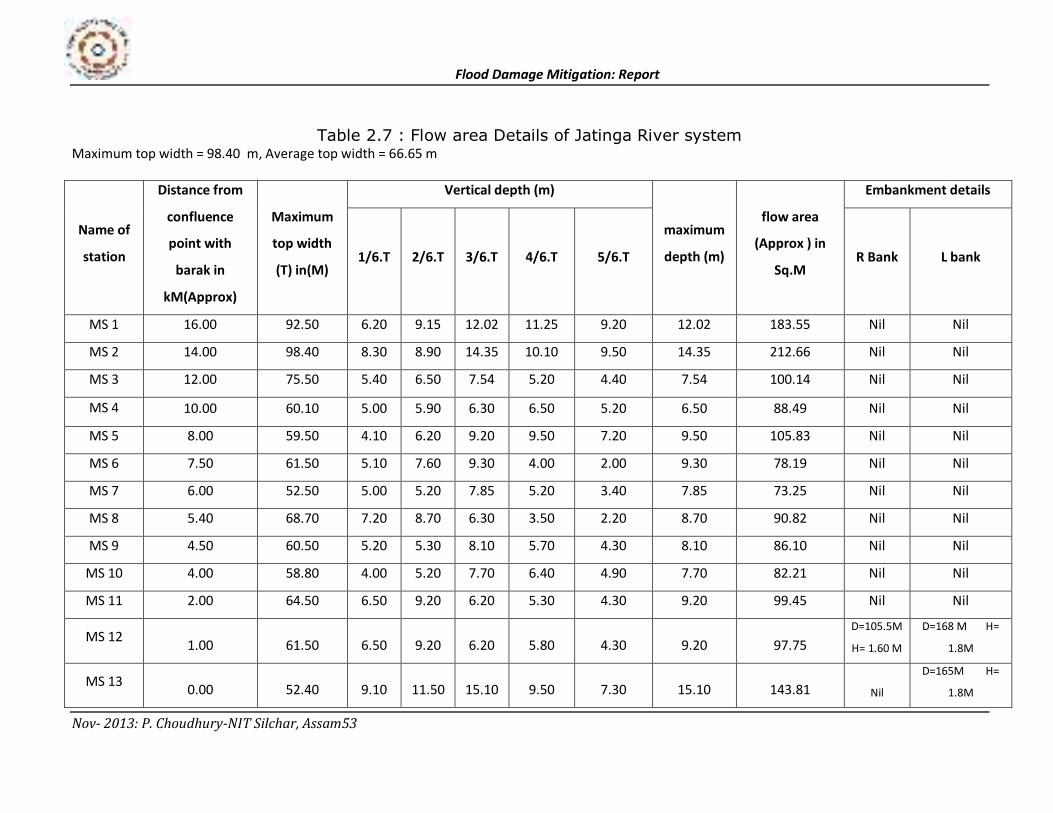
Table 2.7 : Flow area Details of Jatinga River system
Maximum top width = 98.40 m, Average top width = 66.65 m
Name of
station
Distance from
confluence
point with
barak in
kM(Approx)
Maximum
top width
(T) in(M)
Vertical depth (m)
maximum
depth (m)
flow area
(Approx ) in
Sq.M
Embankment details
1/6.T 2/6.T 3/6.T 4/6.T 5/6.T R Bank L bank
MS 1 16.00 92.50 6.20 9.15 12.02 11.25 9.20 12.02 183.55 Nil Nil
MS 2 14.00 98.40 8.30 8.90 14.35 10.10 9.50 14.35 212.66 Nil Nil
MS 3 12.00 75.50 5.40 6.50 7.54 5.20 4.40 7.54 100.14 Nil Nil
MS 4 10.00 60.10 5.00 5.90 6.30 6.50 5.20 6.50 88.49 Nil Nil
MS 5 8.00 59.50 4.10 6.20 9.20 9.50 7.20 9.50 105.83 Nil Nil
MS 6 7.50 61.50 5.10 7.60 9.30 4.00 2.00 9.30 78.19 Nil Nil
MS 7 6.00 52.50 5.00 5.20 7.85 5.20 3.40 7.85 73.25 Nil Nil
MS 8 5.40 68.70 7.20 8.70 6.30 3.50 2.20 8.70 90.82 Nil Nil
MS 9 4.50 60.50 5.20 5.30 8.10 5.70 4.30 8.10 86.10 Nil Nil
MS 10 4.00 58.80 4.00 5.20 7.70 6.40 4.90 7.70 82.21 Nil Nil
MS 11 2.00 64.50 6.50 9.20 6.20 5.30 4.30 9.20 99.45 Nil Nil
MS 12
1.00 61.50 6.50 9.20 6.20 5.80 4.30 9.20 97.75
D=105.5M
H= 1.60 M
D=168 M H=
1.8M
MS 13
0.00 52.40 9.10 11.50 15.10 9.50 7.30 15.10 143.81 Nil
D=165M H=
1.8M
Flood Damage Mitigation: Report
Nov- 2013: P. Choudhury-NIT Silchar, Assam54
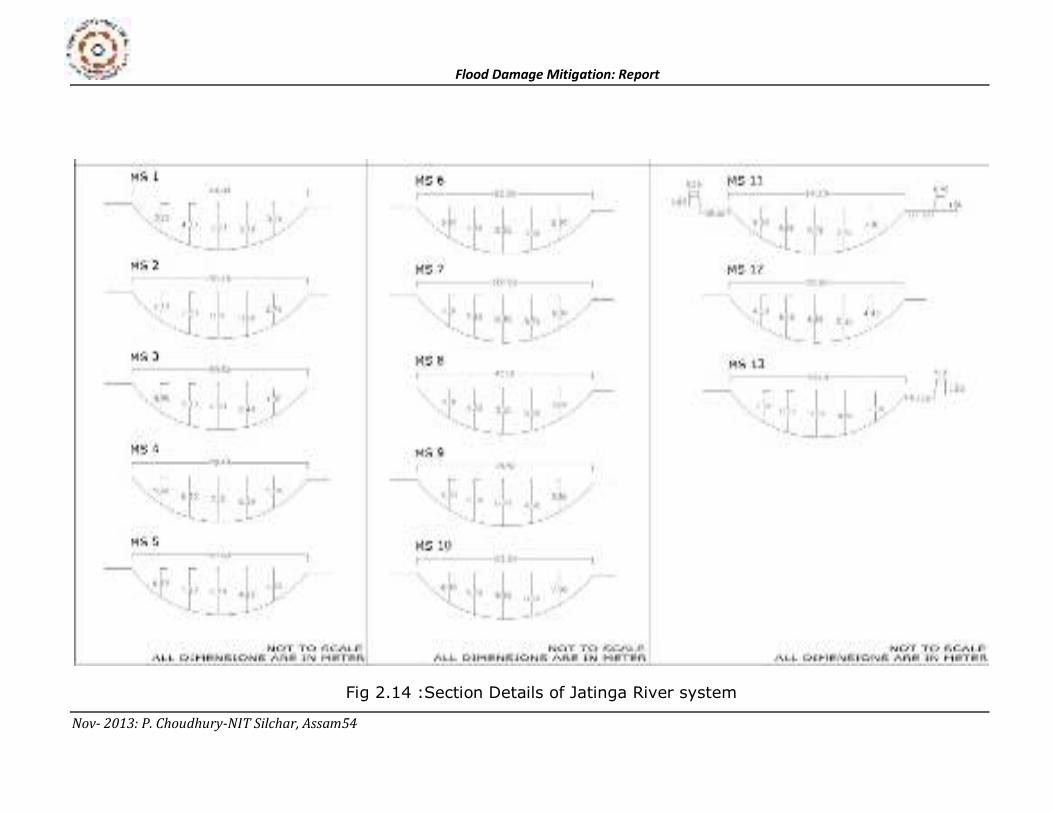
Fig 2.14 :Section Details of Jatinga River system
Flood Damage Mitigation: Report
Nov- 2013: P. Choudhury-NIT Silchar, Assam55
`
Flood Damage Mitigation: Report
Nov- 2013: P. Choudhury-NIT Silchar, Assam56
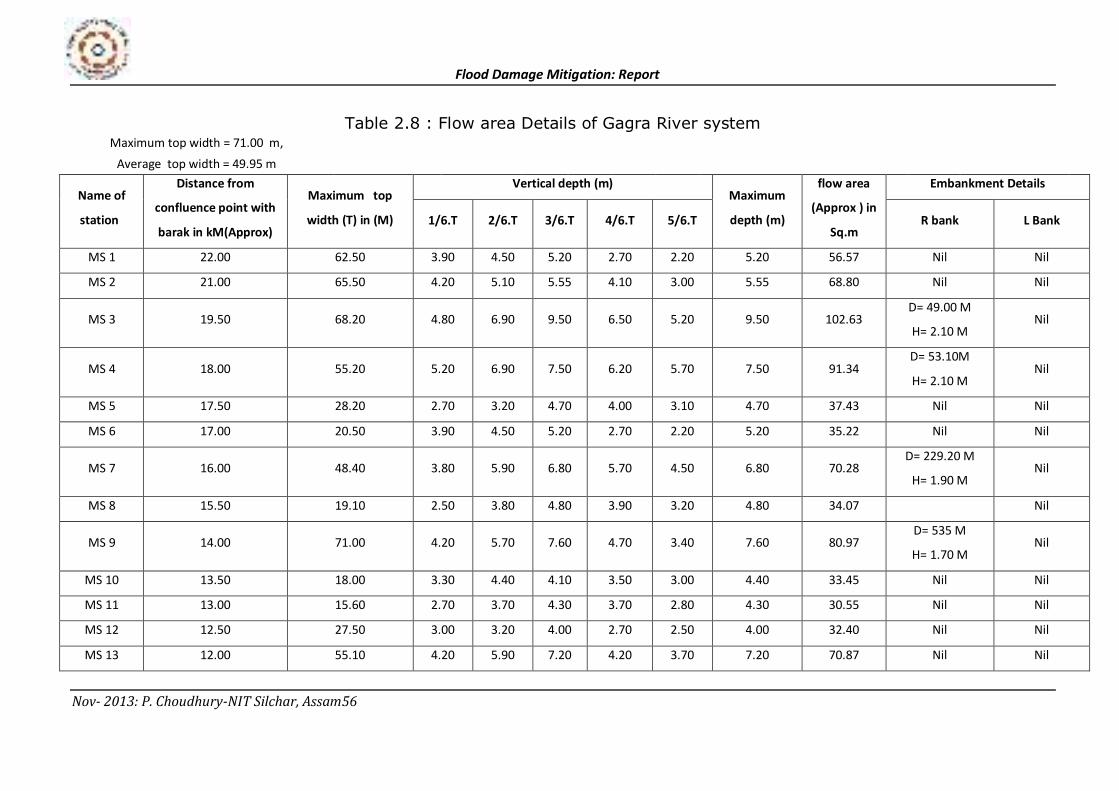
Table 2.8 : Flow area Details of Gagra River system Maximum top width = 71.00 m,
Average top width = 49.95 m
Name of
station
Distance from
confluence point with
barak in kM(Approx)
Maximum top
width (T) in (M)
Vertical depth (m) Maximum
depth (m)
flow area
(Approx ) in
Sq.m
Embankment Details
1/6.T 2/6.T 3/6.T 4/6.T 5/6.T R bank L Bank
MS 1 22.00 62.50 3.90 4.50 5.20 2.70 2.20 5.20 56.57 Nil Nil
MS 2 21.00 65.50 4.20 5.10 5.55 4.10 3.00 5.55 68.80 Nil Nil
MS 3 19.50 68.20 4.80 6.90 9.50 6.50 5.20 9.50 102.63 D= 49.00 M
H= 2.10 M Nil
MS 4 18.00 55.20 5.20 6.90 7.50 6.20 5.70 7.50 91.34 D= 53.10M
H= 2.10 M Nil
MS 5 17.50 28.20 2.70 3.20 4.70 4.00 3.10 4.70 37.43 Nil Nil
MS 6 17.00 20.50 3.90 4.50 5.20 2.70 2.20 5.20 35.22 Nil Nil
MS 7 16.00 48.40 3.80 5.90 6.80 5.70 4.50 6.80 70.28 D= 229.20 M
H= 1.90 M Nil
MS 8 15.50 19.10 2.50 3.80 4.80 3.90 3.20 4.80 34.07
Nil
MS 9 14.00 71.00 4.20 5.70 7.60 4.70 3.40 7.60 80.97 D= 535 M
H= 1.70 M Nil
MS 10 13.50 18.00 3.30 4.40 4.10 3.50 3.00 4.40 33.45 Nil Nil
MS 11 13.00 15.60 2.70 3.70 4.30 3.70 2.80 4.30 30.55 Nil Nil
MS 12 12.50 27.50 3.00 3.20 4.00 2.70 2.50 4.00 32.40 Nil Nil
MS 13 12.00 55.10 4.20 5.90 7.20 4.20 3.70 7.20 70.87 Nil Nil
Flood Damage Mitigation: Report
Nov- 2013: P. Choudhury-NIT Silchar, Assam57
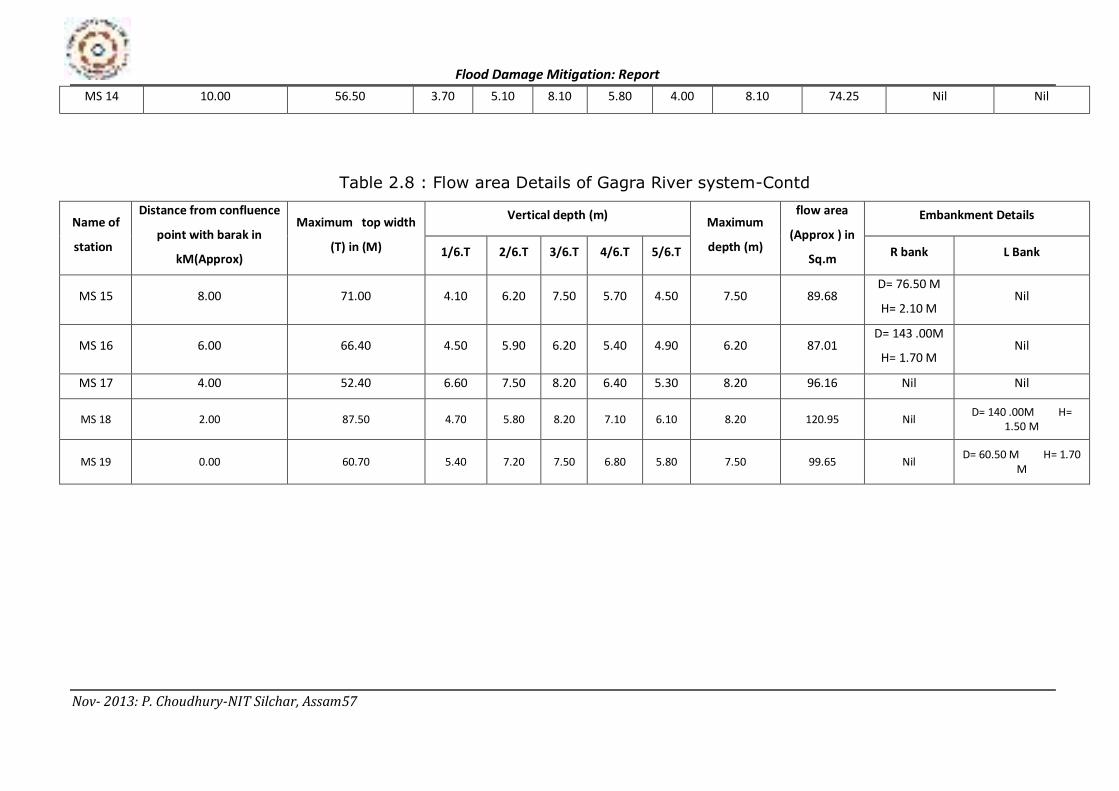
MS 14 10.00 56.50 3.70 5.10 8.10 5.80 4.00 8.10 74.25 Nil Nil
Table 2.8 : Flow area Details of Gagra River system-Contd
Name of
station
Distance from confluence
point with barak in
kM(Approx)
Maximum top width
(T) in (M)
Vertical depth (m) Maximum
depth (m)
flow area
(Approx ) in
Sq.m
Embankment Details
1/6.T 2/6.T 3/6.T 4/6.T 5/6.T R bank L Bank
MS 15 8.00 71.00 4.10 6.20 7.50 5.70 4.50 7.50 89.68 D= 76.50 M
H= 2.10 M Nil
MS 16 6.00 66.40 4.50 5.90 6.20 5.40 4.90 6.20 87.01 D= 143 .00M
H= 1.70 M Nil
MS 17 4.00 52.40 6.60 7.50 8.20 6.40 5.30 8.20 96.16 Nil Nil
MS 18 2.00 87.50 4.70 5.80 8.20 7.10 6.10 8.20 120.95 Nil D= 140 .00M H=
1.50 M
MS 19 0.00 60.70 5.40 7.20 7.50 6.80 5.80 7.50 99.65 Nil D= 60.50 M H= 1.70
M
Flood Damage Mitigation: Report
Nov- 2013: P. Choudhury-NIT Silchar, Assam58
Flood Damage Mitigation: Report
Nov- 2013: P. Choudhury-NIT Silchar, Assam59
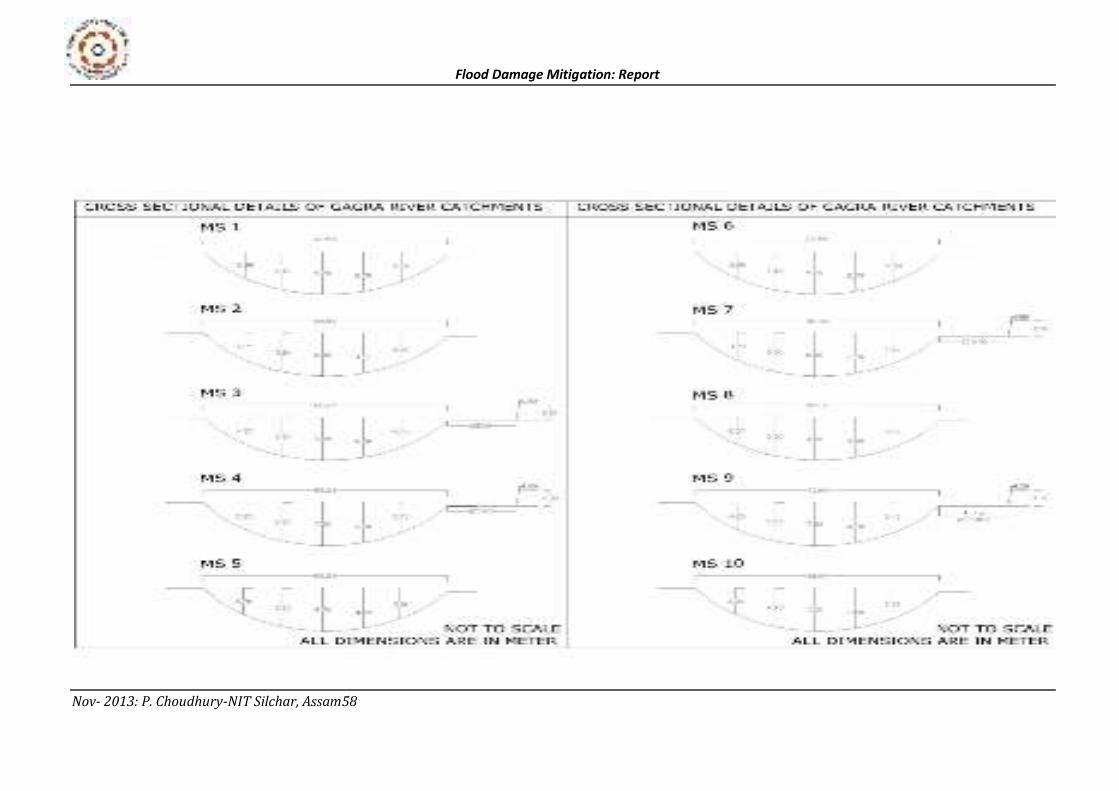
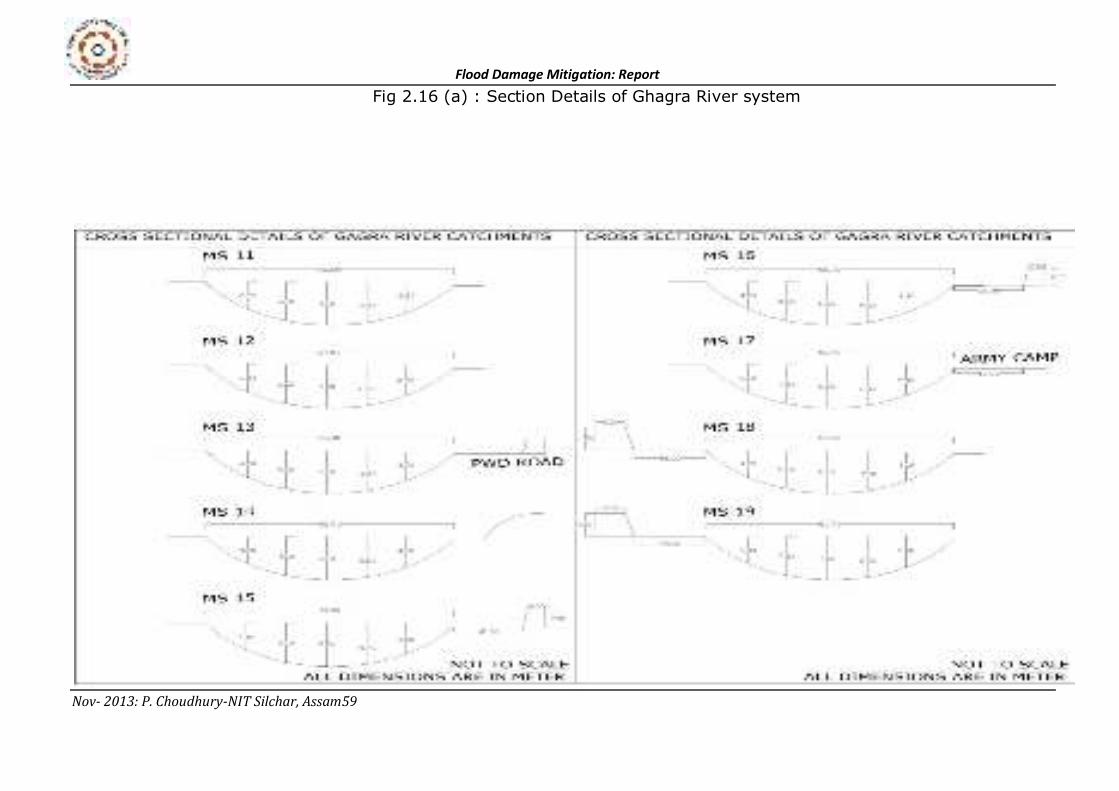
Fig 2.16 (a) : Section Details of Ghagra River system
Flood Damage Mitigation: Report
Nov- 2013: P. Choudhury-NIT Silchar, Assam60
Fig 2.16 (b) : Section Details of Ghagra River system-contd
Flood Damage Mitigation: Report
Nov- 2013: P. Choudhury-NIT Silchar, Assam61
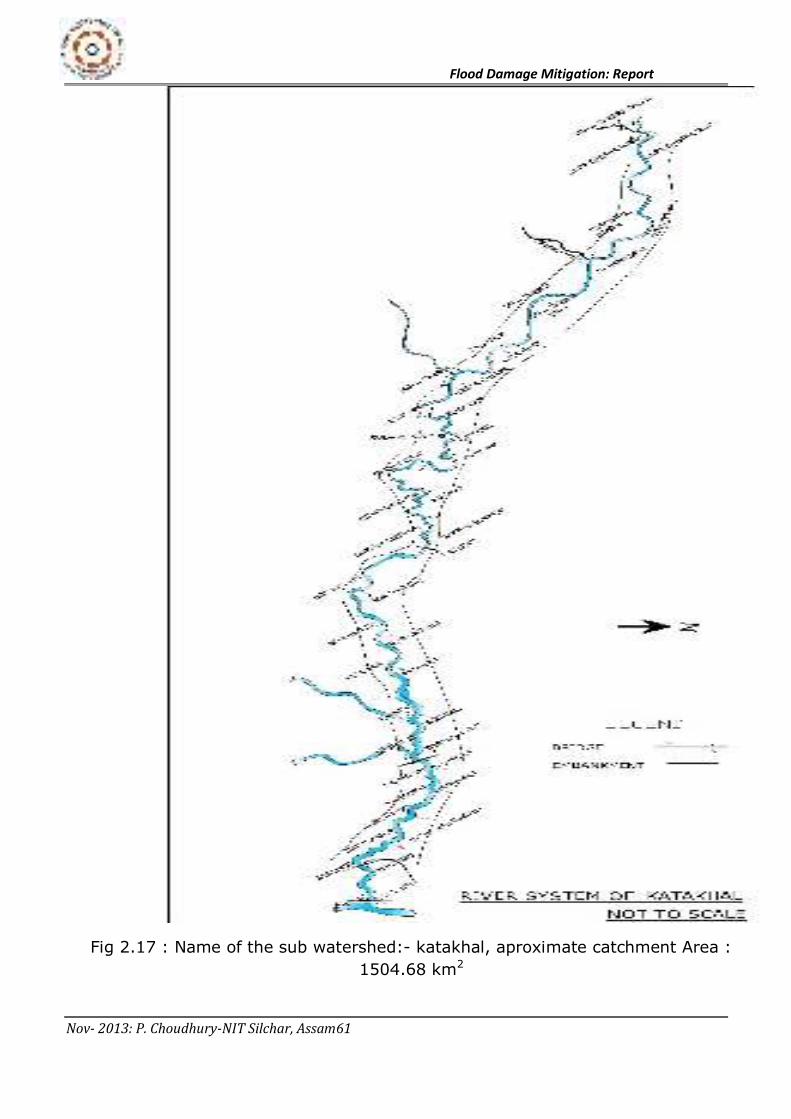
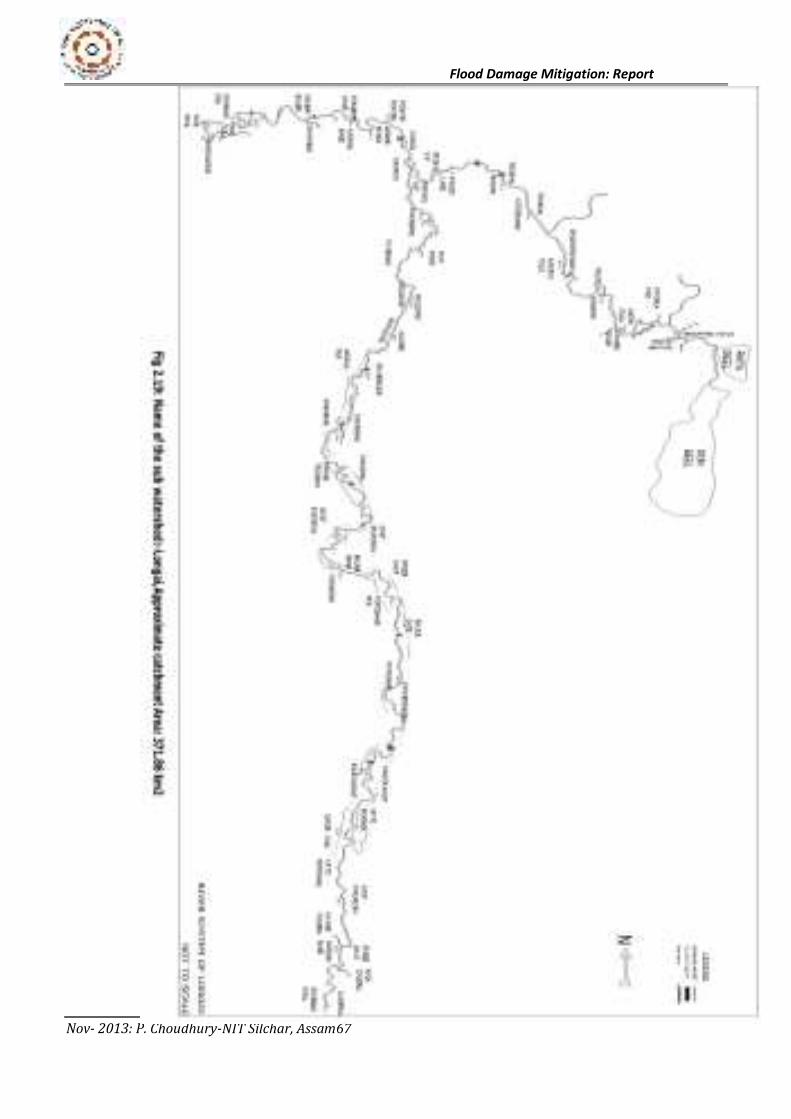
Fig 2.17 : Name of the sub watershed:- katakhal, aproximate catchment Area :
1504.68 km2
Flood Damage Mitigation: Report
Nov- 2013: P. Choudhury-NIT Silchar, Assam62
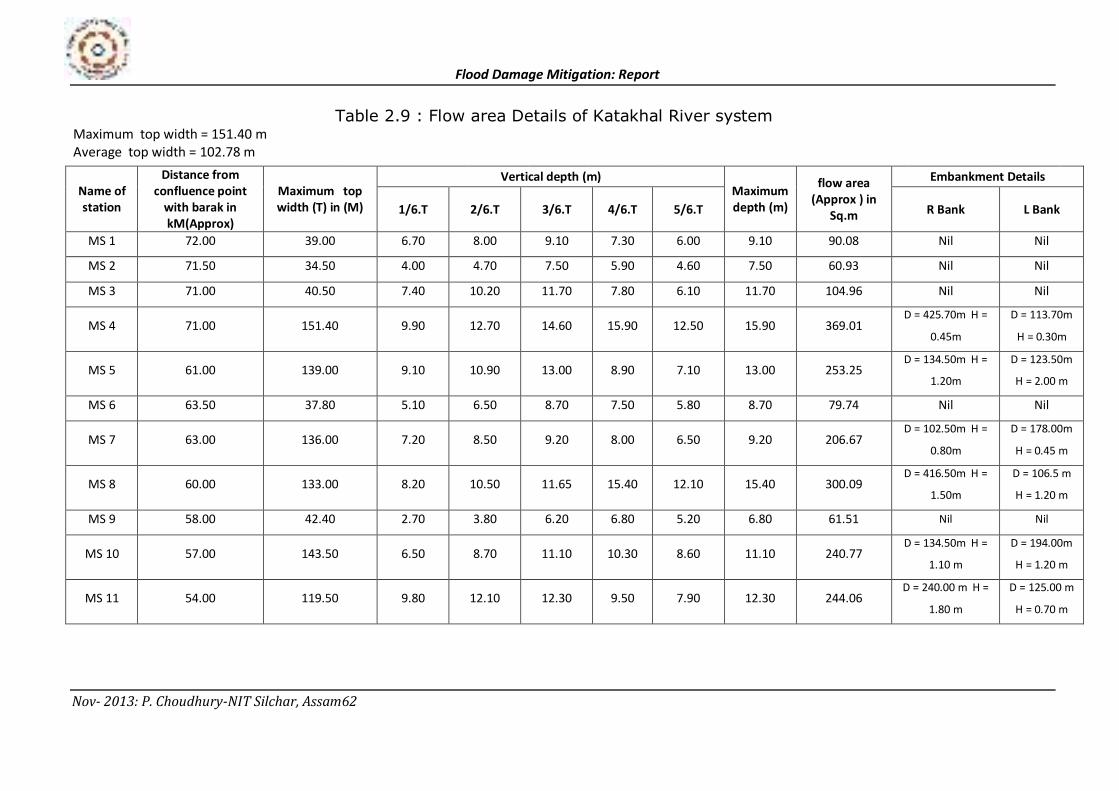
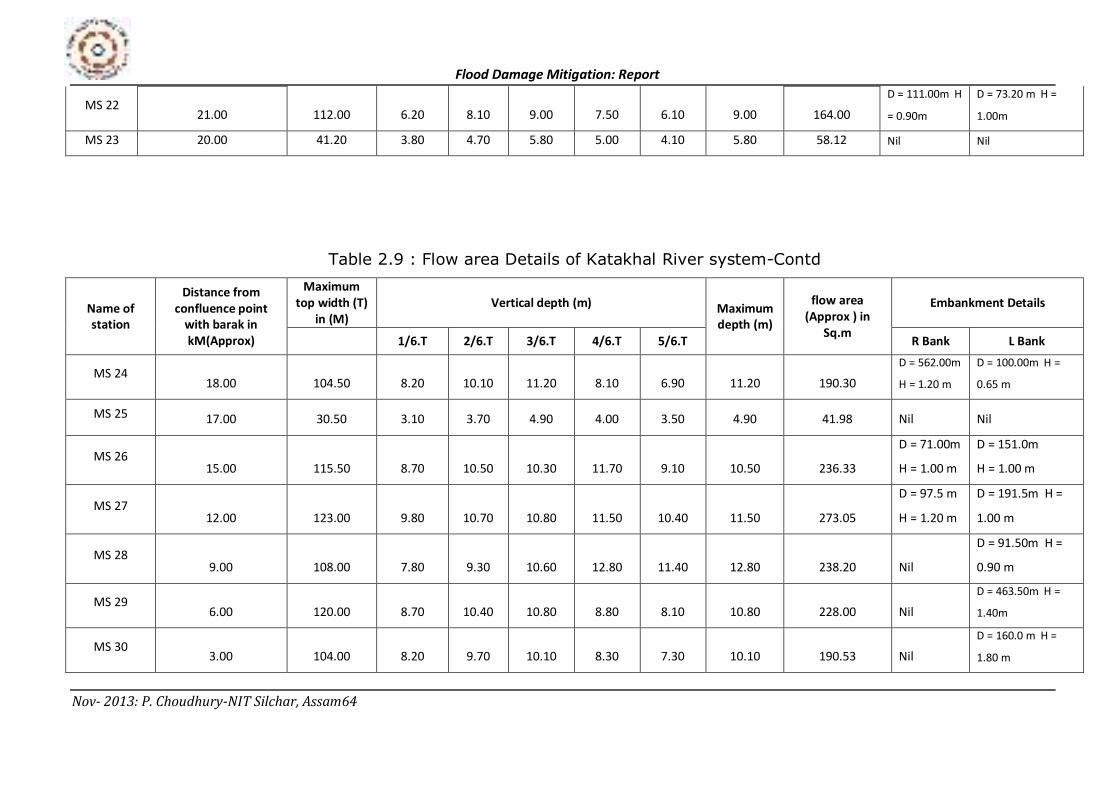
Table 2.9 : Flow area Details of Katakhal River system Maximum top width = 151.40 m
Average top width = 102.78 m
Name of
station
Distance from
confluence point
with barak in
kM(Approx)
Maximum top
width (T) in (M)
Vertical depth (m) Maximum
depth (m)
flow area
(Approx ) in
Sq.m
Embankment Details
1/6.T 2/6.T 3/6.T 4/6.T 5/6.T R Bank L Bank
MS 1 72.00 39.00 6.70 8.00 9.10 7.30 6.00 9.10 90.08 Nil Nil
MS 2 71.50 34.50 4.00 4.70 7.50 5.90 4.60 7.50 60.93 Nil Nil
MS 3 71.00 40.50 7.40 10.20 11.70 7.80 6.10 11.70 104.96 Nil Nil
MS 4 71.00 151.40 9.90 12.70 14.60 15.90 12.50 15.90 369.01 D = 425.70m H =
0.45m
D = 113.70m
H = 0.30m
MS 5 61.00 139.00 9.10 10.90 13.00 8.90 7.10 13.00 253.25 D = 134.50m H =
1.20m
D = 123.50m
H = 2.00 m
MS 6 63.50 37.80 5.10 6.50 8.70 7.50 5.80 8.70 79.74 Nil Nil
MS 7 63.00 136.00 7.20 8.50 9.20 8.00 6.50 9.20 206.67 D = 102.50m H =
0.80m
D = 178.00m
H = 0.45 m
MS 8 60.00 133.00 8.20 10.50 11.65 15.40 12.10 15.40 300.09 D = 416.50m H =
1.50m
D = 106.5 m
H = 1.20 m
MS 9 58.00 42.40 2.70 3.80 6.20 6.80 5.20 6.80 61.51 Nil Nil
MS 10 57.00 143.50 6.50 8.70 11.10 10.30 8.60 11.10 240.77 D = 134.50m H =
1.10 m
D = 194.00m
H = 1.20 m
MS 11 54.00 119.50 9.80 12.10 12.30 9.50 7.90 12.30 244.06 D = 240.00 m H =
1.80 m
D = 125.00 m
H = 0.70 m
Flood Damage Mitigation: Report
Nov- 2013: P. Choudhury-NIT Silchar, Assam63
MS 12 51.00 146.00 8.40 9.30 10.10 8.80 7.60 10.10 251.07 D = 81.00 m H =
1.10 m
D = 221.00 m
H = 2.50m
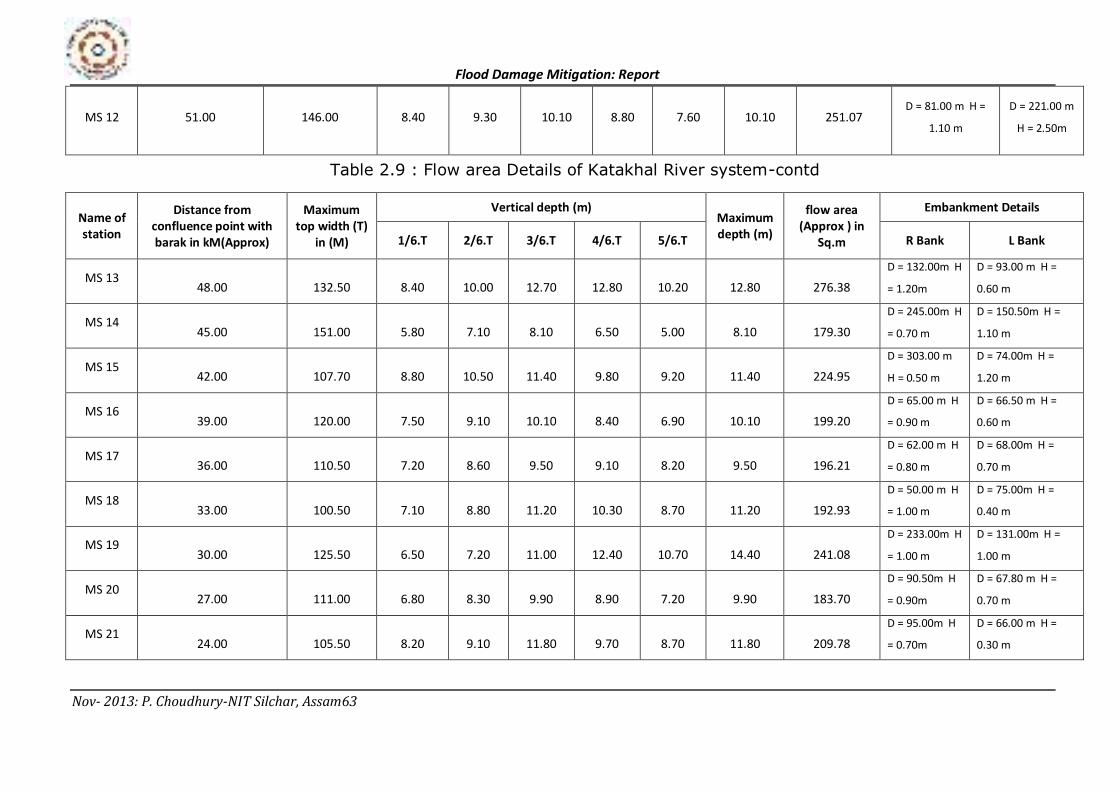
Table 2.9 : Flow area Details of Katakhal River system-contd
Name of
station
Distance from
confluence point with
barak in kM(Approx)
Maximum
top width (T)
in (M)
Vertical depth (m) Maximum
depth (m)
flow area
(Approx ) in
Sq.m
Embankment Details
1/6.T 2/6.T 3/6.T 4/6.T 5/6.T R Bank L Bank
MS 13 48.00 132.50 8.40 10.00 12.70 12.80 10.20 12.80 276.38
D = 132.00m H
= 1.20m
D = 93.00 m H =
0.60 m
MS 14 45.00 151.00 5.80 7.10 8.10 6.50 5.00 8.10 179.30
D = 245.00m H
= 0.70 m
D = 150.50m H =
1.10 m
MS 15 42.00 107.70 8.80 10.50 11.40 9.80 9.20 11.40 224.95
D = 303.00 m
H = 0.50 m
D = 74.00m H =
1.20 m
MS 16 39.00 120.00 7.50 9.10 10.10 8.40 6.90 10.10 199.20
D = 65.00 m H
= 0.90 m
D = 66.50 m H =
0.60 m
MS 17 36.00 110.50 7.20 8.60 9.50 9.10 8.20 9.50 196.21
D = 62.00 m H
= 0.80 m
D = 68.00m H =
0.70 m
MS 18 33.00 100.50 7.10 8.80 11.20 10.30 8.70 11.20 192.93
D = 50.00 m H
= 1.00 m
D = 75.00m H =
0.40 m
MS 19 30.00 125.50 6.50 7.20 11.00 12.40 10.70 14.40 241.08
D = 233.00m H
= 1.00 m
D = 131.00m H =
1.00 m
MS 20 27.00 111.00 6.80 8.30 9.90 8.90 7.20 9.90 183.70
D = 90.50m H
= 0.90m
D = 67.80 m H =
0.70 m
MS 21 24.00 105.50 8.20 9.10 11.80 9.70 8.70 11.80 209.78
D = 95.00m H
= 0.70m
D = 66.00 m H =
0.30 m
Flood Damage Mitigation: Report
Nov- 2013: P. Choudhury-NIT Silchar, Assam64
MS 22 21.00 112.00 6.20 8.10 9.00 7.50 6.10 9.00 164.00
D = 111.00m H
= 0.90m
D = 73.20 m H =
1.00m
MS 23 20.00 41.20 3.80 4.70 5.80 5.00 4.10 5.80 58.12 Nil Nil
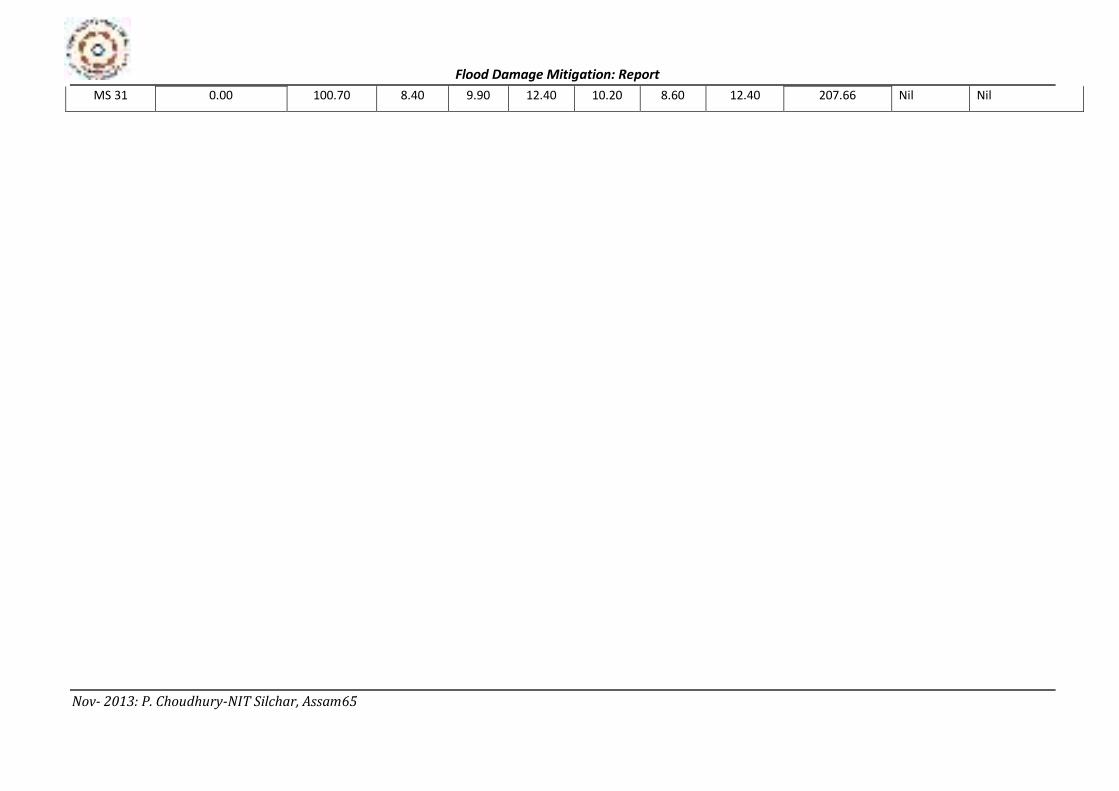
Table 2.9 : Flow area Details of Katakhal River system-Contd
Name of
station
Distance from
confluence point
with barak in
kM(Approx)
Maximum
top width (T)
in (M)
Vertical depth (m) Maximum
depth (m)
flow area
(Approx ) in
Sq.m
Embankment Details
1/6.T 2/6.T 3/6.T 4/6.T 5/6.T R Bank L Bank
MS 24 18.00 104.50 8.20 10.10 11.20 8.10 6.90 11.20 190.30
D = 562.00m
H = 1.20 m
D = 100.00m H =
0.65 m
MS 25 17.00 30.50 3.10 3.70 4.90 4.00 3.50 4.90 41.98 Nil Nil
MS 26 15.00 115.50 8.70 10.50 10.30 11.70 9.10 10.50 236.33
D = 71.00m
H = 1.00 m
D = 151.0m
H = 1.00 m
MS 27 12.00 123.00 9.80 10.70 10.80 11.50 10.40 11.50 273.05
D = 97.5 m
H = 1.20 m
D = 191.5m H =
1.00 m
MS 28 9.00 108.00 7.80 9.30 10.60 12.80 11.40 12.80 238.20 Nil
D = 91.50m H =
0.90 m
MS 29 6.00 120.00 8.70 10.40 10.80 8.80 8.10 10.80 228.00 Nil
D = 463.50m H =
1.40m
MS 30 3.00 104.00 8.20 9.70 10.10 8.30 7.30 10.10 190.53 Nil
D = 160.0 m H =
1.80 m
Flood Damage Mitigation: Report
Nov- 2013: P. Choudhury-NIT Silchar, Assam65
MS 31 0.00 100.70 8.40 9.90 12.40 10.20 8.60 12.40 207.66 Nil Nil
Flood Damage Mitigation: Report
Nov- 2013: P. Choudhury-NIT Silchar, Assam66
Fig 2.18 :Section Details of katakhal River system
Flood Damage Mitigation: Report
Nov- 2013: P. Choudhury-NIT Silchar, Assam67
Flood Damage Mitigation: Report
Nov- 2013: P. Choudhury-NIT Silchar, Assam68
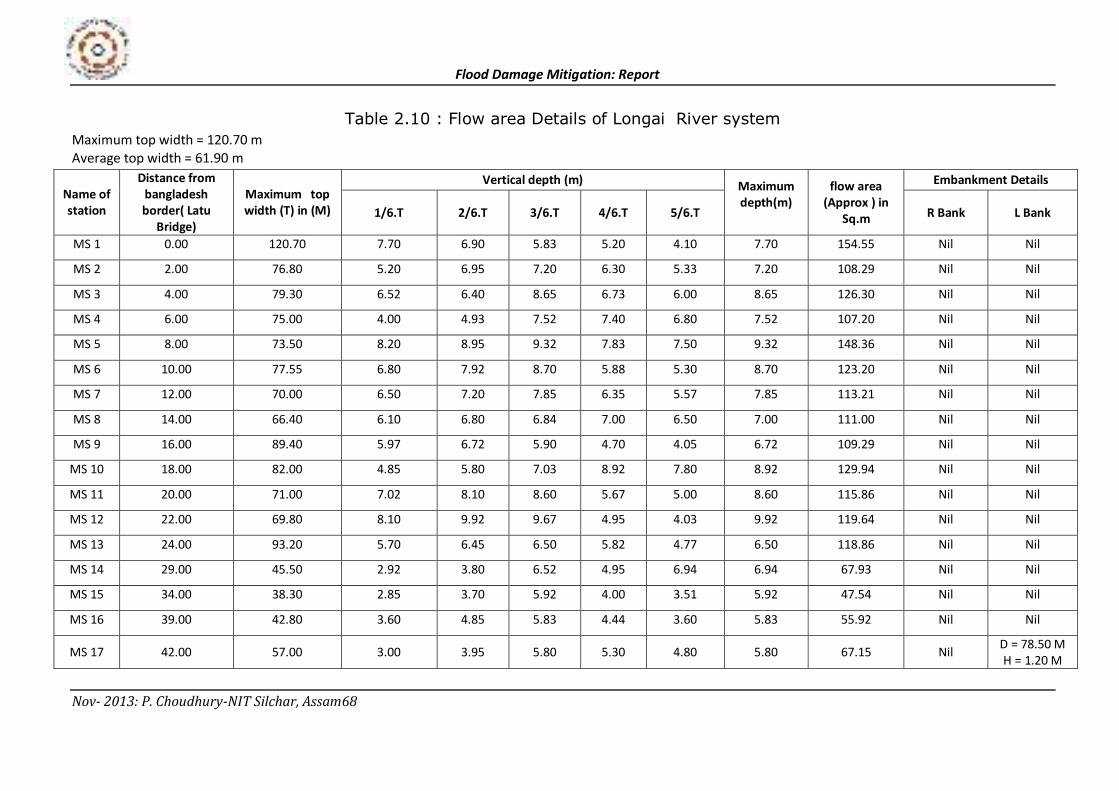
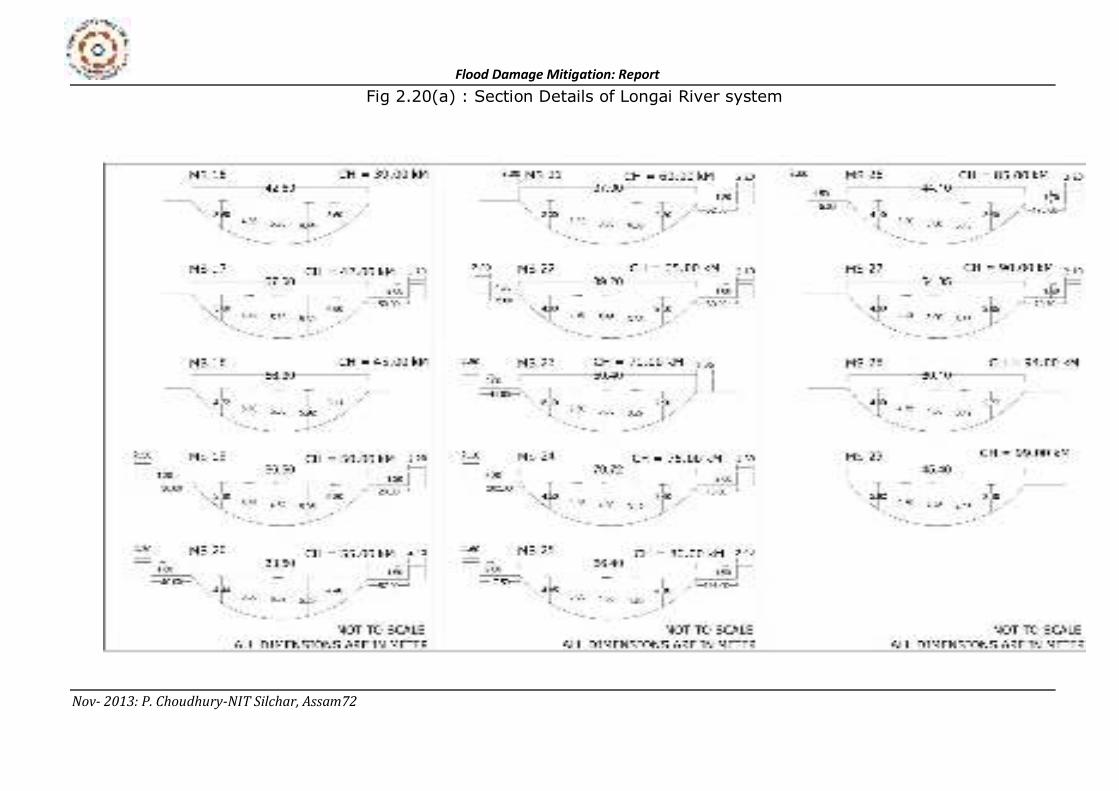
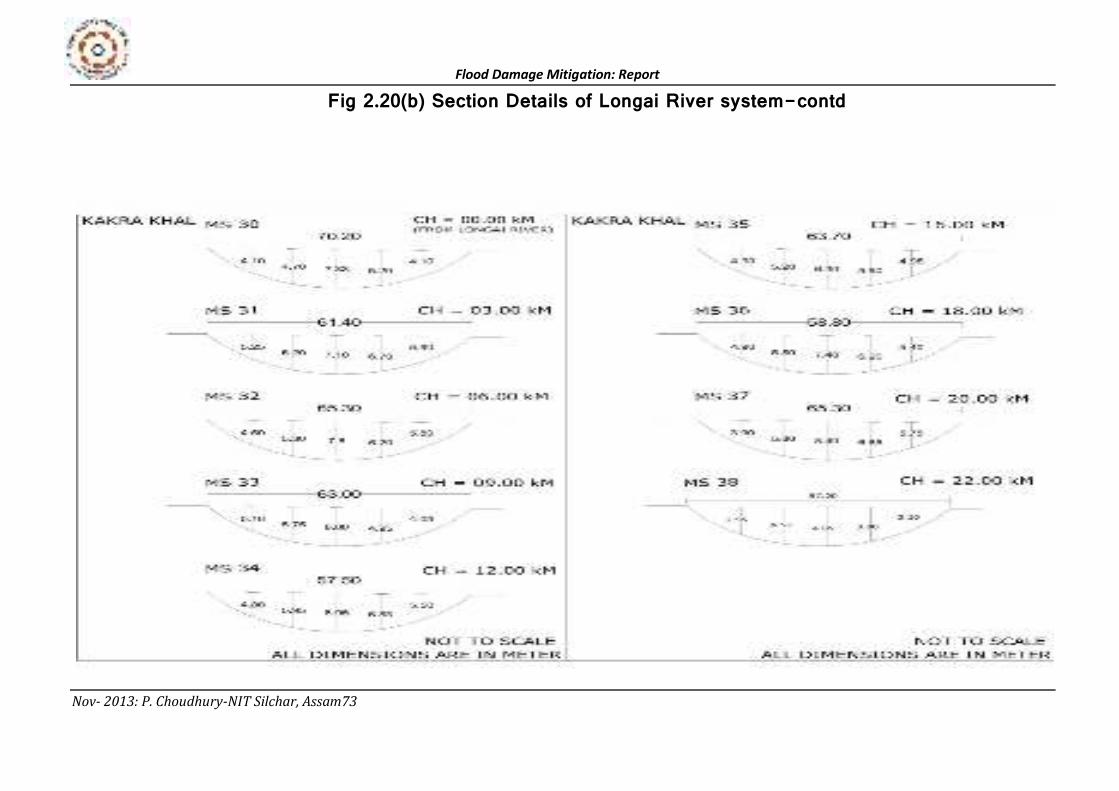
Table 2.10 : Flow area Details of Longai River system
Maximum top width = 120.70 m
Average top width = 61.90 m
Name of
station
Distance from
bangladesh
border( Latu
Bridge)
Maximum top
width (T) in (M)
Vertical depth (m) Maximum
depth(m)
flow area
(Approx ) in
Sq.m
Embankment Details
1/6.T 2/6.T 3/6.T 4/6.T 5/6.T R Bank L Bank
MS 1 0.00 120.70 7.70 6.90 5.83 5.20 4.10 7.70 154.55 Nil Nil
MS 2 2.00 76.80 5.20 6.95 7.20 6.30 5.33 7.20 108.29 Nil Nil
MS 3 4.00 79.30 6.52 6.40 8.65 6.73 6.00 8.65 126.30 Nil Nil
MS 4 6.00 75.00 4.00 4.93 7.52 7.40 6.80 7.52 107.20 Nil Nil
MS 5 8.00 73.50 8.20 8.95 9.32 7.83 7.50 9.32 148.36 Nil Nil
MS 6 10.00 77.55 6.80 7.92 8.70 5.88 5.30 8.70 123.20 Nil Nil
MS 7 12.00 70.00 6.50 7.20 7.85 6.35 5.57 7.85 113.21 Nil Nil
MS 8 14.00 66.40 6.10 6.80 6.84 7.00 6.50 7.00 111.00 Nil Nil
MS 9 16.00 89.40 5.97 6.72 5.90 4.70 4.05 6.72 109.29 Nil Nil
MS 10 18.00 82.00 4.85 5.80 7.03 8.92 7.80 8.92 129.94 Nil Nil
MS 11 20.00 71.00 7.02 8.10 8.60 5.67 5.00 8.60 115.86 Nil Nil
MS 12 22.00 69.80 8.10 9.92 9.67 4.95 4.03 9.92 119.64 Nil Nil
MS 13 24.00 93.20 5.70 6.45 6.50 5.82 4.77 6.50 118.86 Nil Nil
MS 14 29.00 45.50 2.92 3.80 6.52 4.95 6.94 6.94 67.93 Nil Nil
MS 15 34.00 38.30 2.85 3.70 5.92 4.00 3.51 5.92 47.54 Nil Nil
MS 16 39.00 42.80 3.60 4.85 5.83 4.44 3.60 5.83 55.92 Nil Nil
MS 17 42.00 57.00 3.00 3.95 5.80 5.30 4.80 5.80 67.15 Nil D = 78.50 M
H = 1.20 M
Flood Damage Mitigation: Report
Nov- 2013: P. Choudhury-NIT Silchar, Assam69
MS 18 45.00 56.30 4.22 5.10 5.60 5.92 3.44 5.92 69.18 Nil Nil
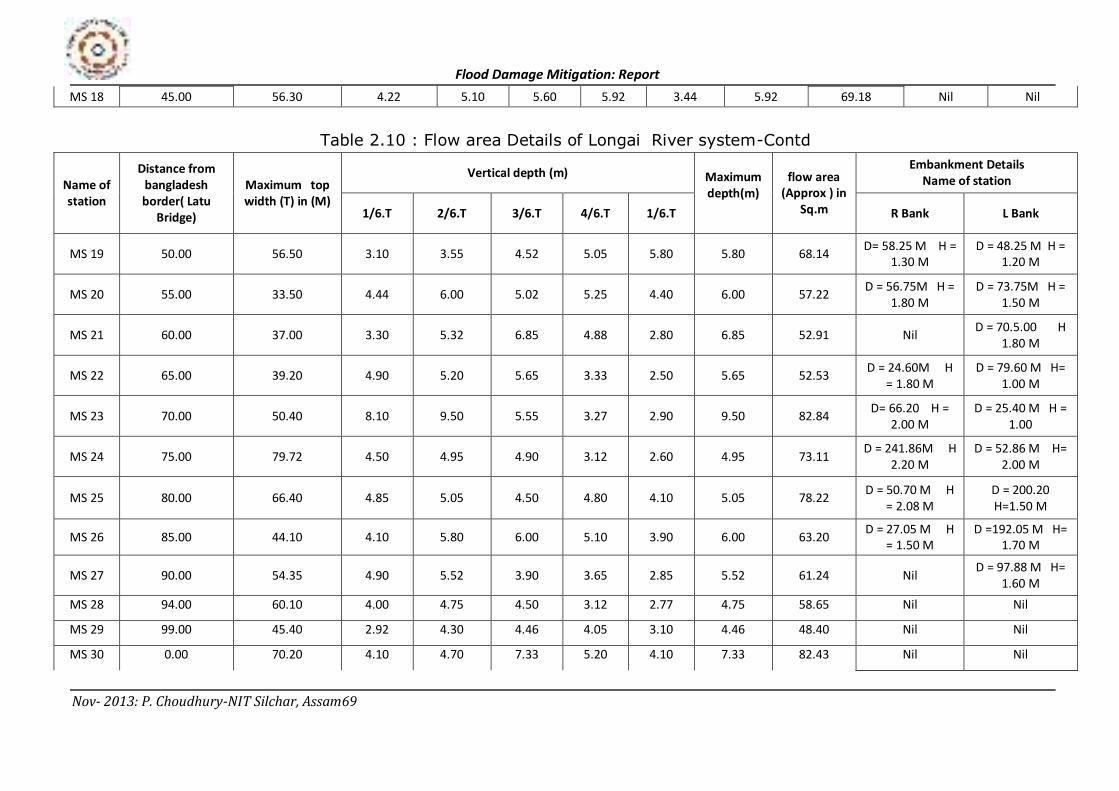
Table 2.10 : Flow area Details of Longai River system-Contd
Name of
station
Distance from
bangladesh
border( Latu
Bridge)
Maximum top
width (T) in (M)
Vertical depth (m) Maximum
depth(m)
flow area
(Approx ) in
Sq.m
Embankment Details
Name of station
1/6.T 2/6.T 3/6.T 4/6.T 1/6.T R Bank L Bank
MS 19 50.00 56.50 3.10 3.55 4.52 5.05 5.80 5.80 68.14 D= 58.25 M H =
1.30 M
D = 48.25 M H =
1.20 M
MS 20 55.00 33.50 4.44 6.00 5.02 5.25 4.40 6.00 57.22 D = 56.75M H =
1.80 M
D = 73.75M H =
1.50 M
MS 21 60.00 37.00 3.30 5.32 6.85 4.88 2.80 6.85 52.91 Nil D = 70.5.00 H
1.80 M
MS 22 65.00 39.20 4.90 5.20 5.65 3.33 2.50 5.65 52.53 D = 24.60M H
= 1.80 M
D = 79.60 M H=
1.00 M
MS 23 70.00 50.40 8.10 9.50 5.55 3.27 2.90 9.50 82.84 D= 66.20 H =
2.00 M
D = 25.40 M H =
1.00
MS 24 75.00 79.72 4.50 4.95 4.90 3.12 2.60 4.95 73.11 D = 241.86M H
2.20 M
D = 52.86 M H=
2.00 M
MS 25 80.00 66.40 4.85 5.05 4.50 4.80 4.10 5.05 78.22 D = 50.70 M H
= 2.08 M
D = 200.20
H=1.50 M
MS 26 85.00 44.10 4.10 5.80 6.00 5.10 3.90 6.00 63.20 D = 27.05 M H
= 1.50 M
D =192.05 M H=
1.70 M
MS 27 90.00 54.35 4.90 5.52 3.90 3.65 2.85 5.52 61.24 Nil D = 97.88 M H=
1.60 M
MS 28 94.00 60.10 4.00 4.75 4.50 3.12 2.77 4.75 58.65 Nil Nil
MS 29 99.00 45.40 2.92 4.30 4.46 4.05 3.10 4.46 48.40 Nil Nil
MS 30 0.00 70.20 4.10 4.70 7.33 5.20 4.10 7.33 82.43 Nil Nil
Flood Damage Mitigation: Report
Nov- 2013: P. Choudhury-NIT Silchar, Assam70
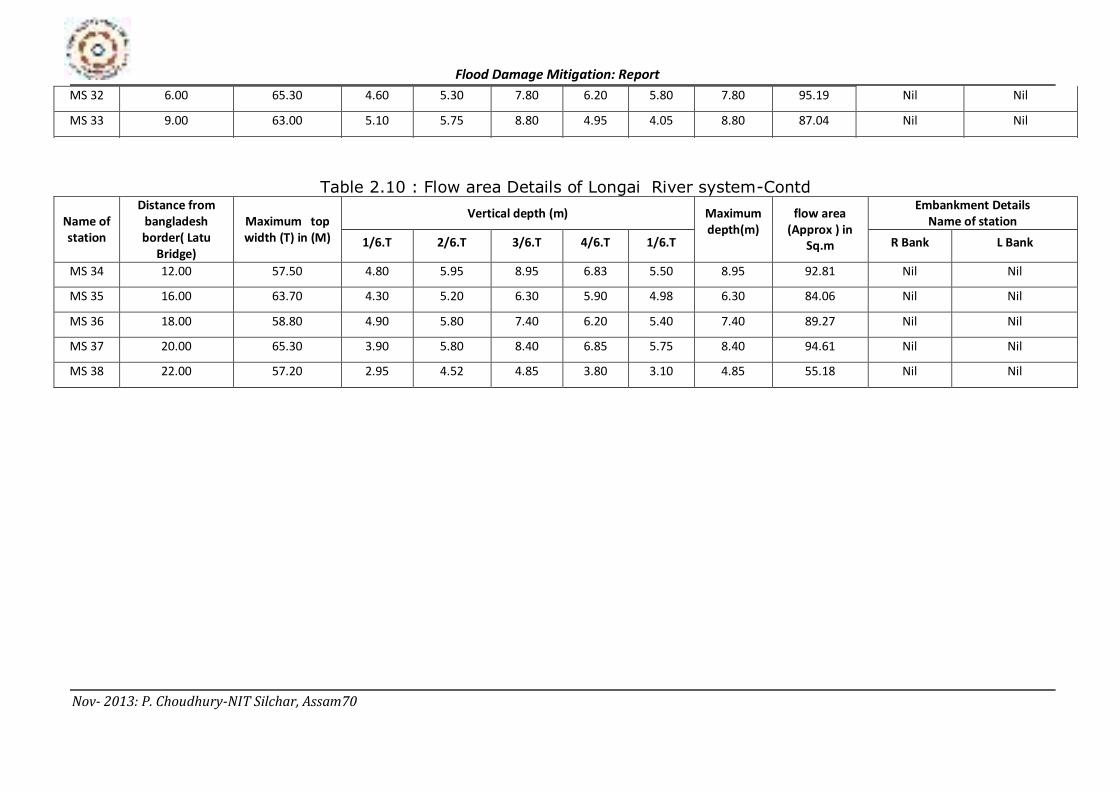
MS 32 6.00 65.30 4.60 5.30 7.80 6.20 5.80 7.80 95.19 Nil Nil
MS 33 9.00 63.00 5.10 5.75 8.80 4.95 4.05 8.80 87.04 Nil Nil
Table 2.10 : Flow area Details of Longai River system-Contd
Name of
station
Distance from
bangladesh
border( Latu
Bridge)
Maximum top
width (T) in (M)
Vertical depth (m) Maximum
depth(m)
flow area
(Approx ) in
Sq.m
Embankment Details
Name of station
1/6.T 2/6.T 3/6.T 4/6.T 1/6.T R Bank L Bank
MS 34 12.00 57.50 4.80 5.95 8.95 6.83 5.50 8.95 92.81 Nil Nil
MS 35 16.00 63.70 4.30 5.20 6.30 5.90 4.98 6.30 84.06 Nil Nil
MS 36 18.00 58.80 4.90 5.80 7.40 6.20 5.40 7.40 89.27 Nil Nil
MS 37 20.00 65.30 3.90 5.80 8.40 6.85 5.75 8.40 94.61 Nil Nil
MS 38 22.00 57.20 2.95 4.52 4.85 3.80 3.10 4.85 55.18 Nil Nil
Flood Damage Mitigation: Report
Nov- 2013: P. Choudhury-NIT Silchar, Assam71
Flood Damage Mitigation: Report
Nov- 2013: P. Choudhury-NIT Silchar, Assam72
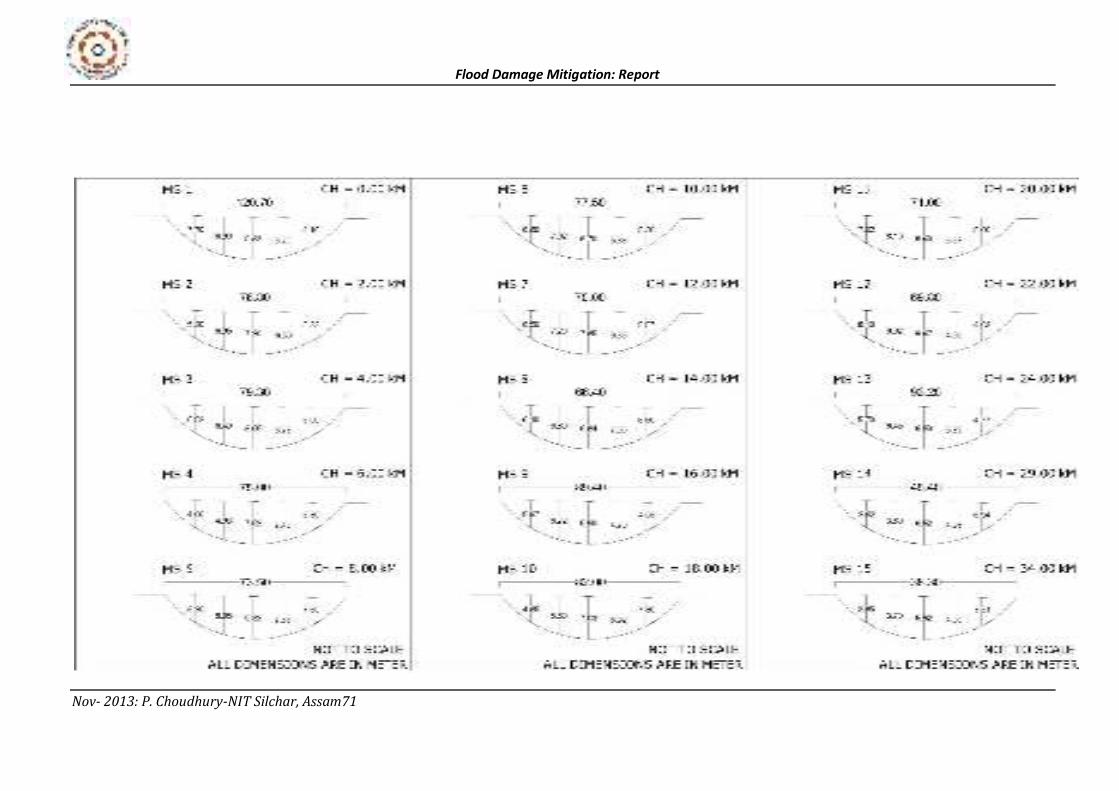
Fig 2.20(a) : Section Details of Longai River system
Flood Damage Mitigation: Report
Nov- 2013: P. Choudhury-NIT Silchar, Assam73
Fig 2.20(b) Section Details of Longai River system-contd

Flood Damage Mitigation: Report
Nov- 2013: P. Choudhury-NIT Silchar, Assam74
Fig 2.20(c) Section Details of Longai River system-contd
Flood Damage Mitigation:
Report
Nov- 2013: P. Choudhury-NIT Silchar, Assam75
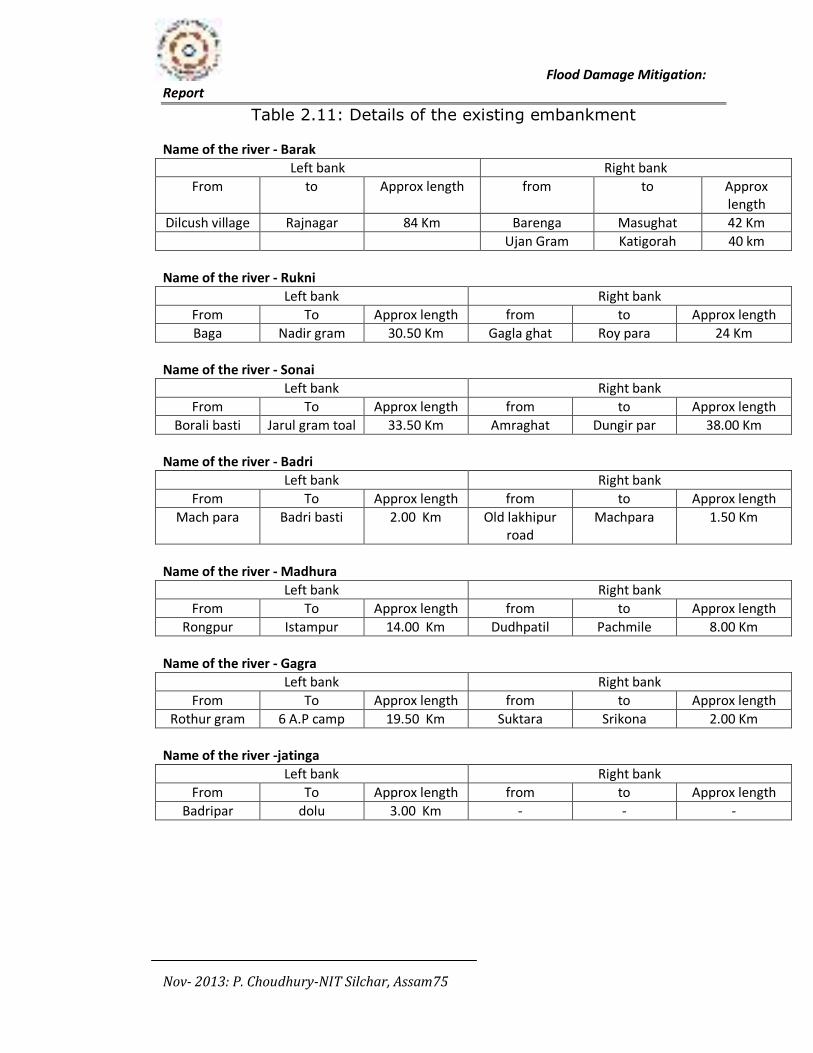
Table 2.11: Details of the existing embankment
Name of the river - Barak
Left bank Right bank
From to Approx length from to Approx
length
Dilcush village Rajnagar 84 Km Barenga Masughat 42 Km
Ujan Gram Katigorah 40 km
Name of the river - Rukni
Left bank Right bank
From To Approx length from to Approx length
Baga Nadir gram 30.50 Km Gagla ghat Roy para 24 Km
Name of the river - Sonai
Left bank Right bank
From To Approx length from to Approx length
Borali basti Jarul gram toal 33.50 Km Amraghat Dungir par 38.00 Km
Name of the river - Badri
Left bank Right bank
From To Approx length from to Approx length
Mach para Badri basti 2.00 Km Old lakhipur
road
Machpara 1.50 Km
Name of the river - Madhura
Left bank Right bank
From To Approx length from to Approx length
Rongpur Istampur 14.00 Km Dudhpatil Pachmile 8.00 Km
Name of the river - Gagra
Left bank Right bank
From To Approx length from to Approx length
Rothur gram 6 A.P camp 19.50 Km Suktara Srikona 2.00 Km
Name of the river -jatinga
Left bank Right bank
From To Approx length from to Approx length
Badripar dolu 3.00 Km - - -
Flood Damage Mitigation:
Report
Nov- 2013: P. Choudhury-NIT Silchar, Assam76
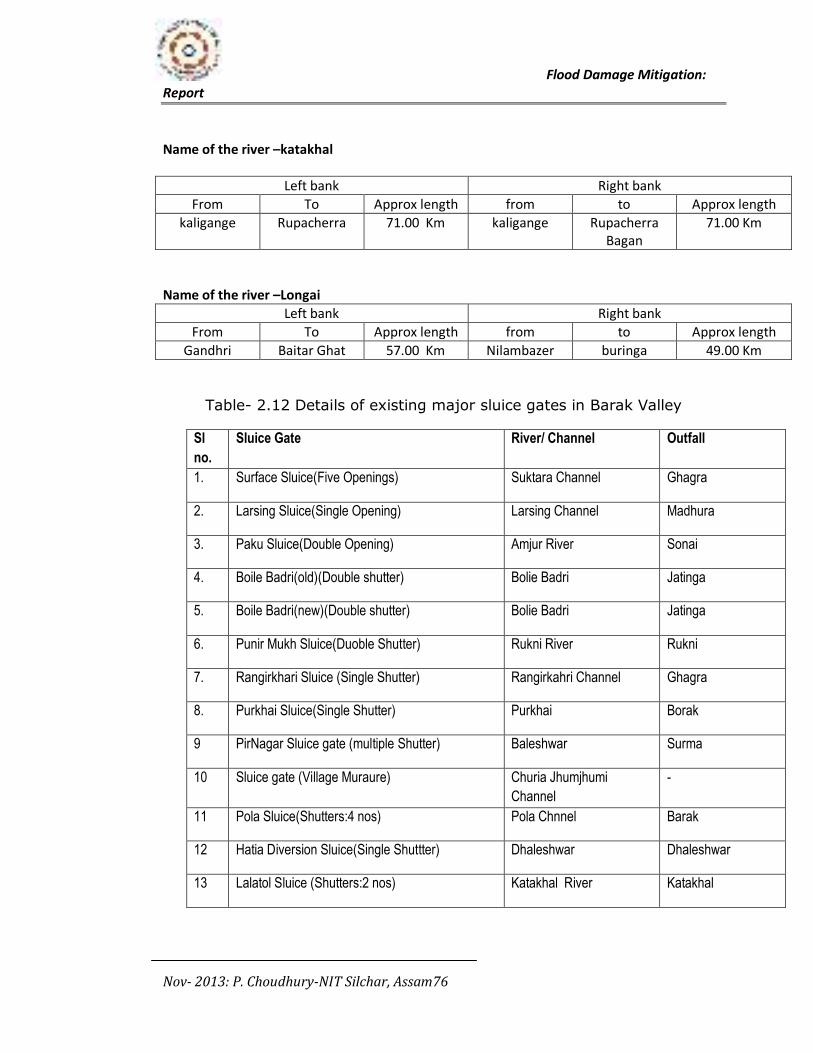
Name of the river –katakhal
Left bank Right bank
From To Approx length from to Approx length
kaligange Rupacherra 71.00 Km kaligange Rupacherra
Bagan
71.00 Km
Name of the river –Longai
Left bank Right bank
From To Approx length from to Approx length
Gandhri Baitar Ghat 57.00 Km Nilambazer buringa 49.00 Km
Table- 2.12 Details of existing major sluice gates in Barak Valley
Sl
no.
Sluice Gate River/ Channel Outfall
1. Surface Sluice(Five Openings) Suktara Channel Ghagra
2. Larsing Sluice(Single Opening) Larsing Channel Madhura
3. Paku Sluice(Double Opening) Amjur River Sonai
4. Boile Badri(old)(Double shutter) Bolie Badri Jatinga
5. Boile Badri(new)(Double shutter) Bolie Badri Jatinga
6. Punir Mukh Sluice(Duoble Shutter) Rukni River Rukni
7. Rangirkhari Sluice (Single Shutter) Rangirkahri Channel Ghagra
8. Purkhai Sluice(Single Shutter) Purkhai Borak
9 PirNagar Sluice gate (multiple Shutter) Baleshwar Surma
10 Sluice gate (Village Muraure) Churia Jhumjhumi
Channel
-
11 Pola Sluice(Shutters:4 nos) Pola Chnnel Barak
12 Hatia Diversion Sluice(Single Shuttter) Dhaleshwar Dhaleshwar
13 Lalatol Sluice (Shutters:2 nos) Katakhal River Katakhal
Flood Damage Mitigation:
Report
Nov- 2013: P. Choudhury-NIT Silchar, Assam77
3.0 Rainfall Analysis:
The Barak Valley is situated in the southern part of Assam and consists of
Cachar, Hailakandi and Karimganj districts. The entire area of this valley
lies within the hydro-meteorological Sub-Zone 2(C) of India. Reliable
rainfall frequency analysis for the sites can be carried out if the available
data are of longer periods as compared to the desired return periods. In
order to gather rainfall affecting information from those of the ungaged
areas roughly 14 numbers of (10 latitude X 10 longitude) grid points are
selected to cover the entire study area. The large scale atmospheric
variables affecting rainfall and seasonality of rainfall data for each of the
grid points are extracted from NCEP Operational Plotting Page (
www.esrl.noaa.gov/psd/data/hisdata/) and GPCC Precipitation Data Set
(www.esrl.noaa.gov) which are used along with the location parameters (
latitude and longitude) as attributes for the regionalization of the Sub-Zone
into two homogeneous regions by Fuzzy c-means clustering. The use of
large scale atmospheric variables as attributes can form reliable regions
than the use of site data alone because these variables give information
from the ungauged areas. The two delineated regions are tested for
discordancy and regional homogeneity using the site data available in the
grid points. L-moment based index-rainfall approach ( Hosking and Wallis
1990, 1993, 1997) is used for the rainfall frequency analysis of this Valley.
In case of the gauged sites a regional rainfall frequency relationship for the
estimation of rainfall of various return periods was derived using the
selected distributions whereas for those of the ungauged sites a regional
mean rainfall relationship with latitude and longitude of the sites was
developed using multiple linear regression. The objectives of this study is to
conduct regional extreme rainfall frequency analysis for Barak Valley of
India using L-moments approach.
Flood Damage Mitigation:
Report
Nov- 2013: P. Choudhury-NIT Silchar, Assam78
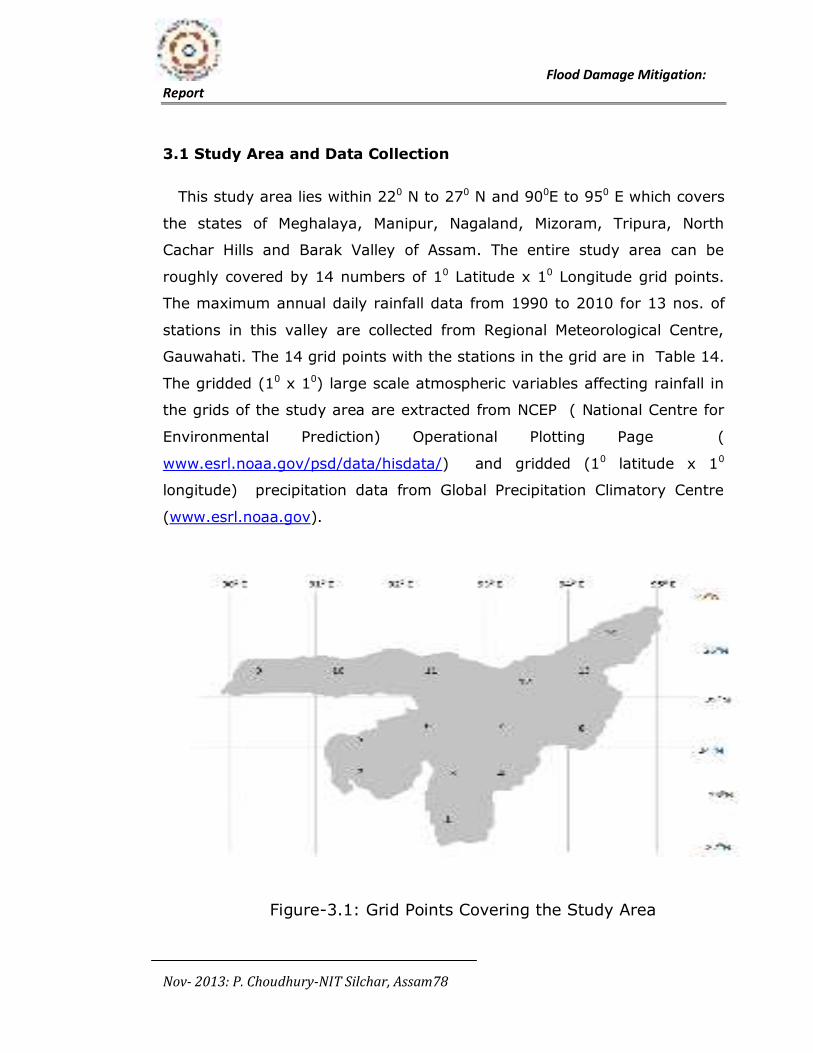
3.1 Study Area and Data Collection
This study area lies within 220 N to 270 N and 900E to 950 E which covers
the states of Meghalaya, Manipur, Nagaland, Mizoram, Tripura, North
Cachar Hills and Barak Valley of Assam. The entire study area can be
roughly covered by 14 numbers of 10 Latitude x 10 Longitude grid points.
The maximum annual daily rainfall data from 1990 to 2010 for 13 nos. of
stations in this valley are collected from Regional Meteorological Centre,
Gauwahati. The 14 grid points with the stations in the grid are in Table 14.
The gridded (10 x 10) large scale atmospheric variables affecting rainfall in
the grids of the study area are extracted from NCEP ( National Centre for
Environmental Prediction) Operational Plotting Page (
www.esrl.noaa.gov/psd/data/hisdata/) and gridded (10 latitude x 10
longitude) precipitation data from Global Precipitation Climatory Centre
(www.esrl.noaa.gov).
Figure-3.1: Grid Points Covering the Study Area
Flood Damage Mitigation:
Report
Nov- 2013: P. Choudhury-NIT Silchar, Assam79
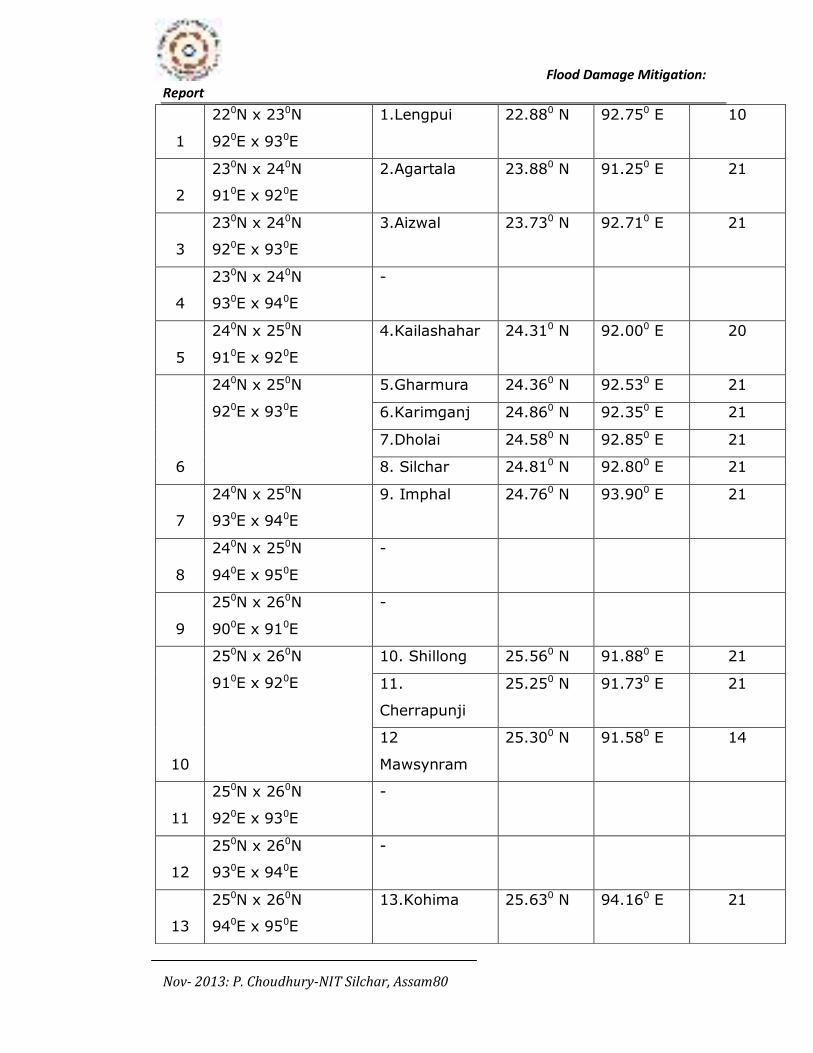
Table- 3.1: Rainfall gauging station in the selected Grids
Grid
Poin
ts
Latitude Longitude Stations in the
Grid
Latitude Longitude Length of
Record
Flood Damage Mitigation:
Report
Nov- 2013: P. Choudhury-NIT Silchar, Assam80
1
220N x 230N
920E x 930E
1.Lengpui 22.880 N 92.750 E 10
2
230N x 240N
910E x 920E
2.Agartala 23.880 N 91.250 E 21
3
230N x 240N
920E x 930E
3.Aizwal 23.730 N 92.710 E 21
4
230N x 240N
930E x 940E
-
5
240N x 250N
910E x 920E
4.Kailashahar 24.310 N 92.000 E 20
6
240N x 250N
920E x 930E
5.Gharmura 24.360 N 92.530 E 21
6.Karimganj 24.860 N 92.350 E 21
7.Dholai 24.580 N 92.850 E 21
8. Silchar 24.810 N 92.800 E 21
7
240N x 250N
930E x 940E
9. Imphal 24.760 N 93.900 E 21
8
240N x 250N
940E x 950E
-
9
250N x 260N
900E x 910E
-
10
250N x 260N
910E x 920E
10. Shillong 25.560 N 91.880 E 21
11.
Cherrapunji
25.250 N 91.730 E 21
12
Mawsynram
25.300 N 91.580 E 14
11
250N x 260N
920E x 930E
-
12
250N x 260N
930E x 940E
-
13
250N x 260N
940E x 950E
13.Kohima 25.630 N 94.160 E 21
Flood Damage Mitigation:
Report
Nov- 2013: P. Choudhury-NIT Silchar, Assam81
3.2 L-moments Approach:
L-moments are linear combinations of probability weighted moments
(PWM). The probability weighted moments are calculated from the ranked
observations X1 > X2 > X3 ……………> Xn. Greenwood et al (1979)
summarizes the theory of probability weighted moments and defined them
as
br = N-1 𝑥𝑗 𝑁𝑗=𝑟+1
j−1 j−2 ……………………..(j−r) N−1 N−2 N−3 ………..(N−r)
The first four L-moments are
ʎ1 = β0ʎ2 = 2 β1 - β0ʎ3 = 6 β2 - 6β1 + β0ʎ4 = 20 β3 - 30β2 +12 β1- β0
where ʎ1 is the L-mean which measures the central tendency, ʎ2 is the L-
standard deviation which measures the dispersion. Again,(Hosking, 1990)
defined the dimensionless L-moment ratios
𝜏 = L- coefficient of variance, L-cv = ʎ2ʎ1
, 𝜏3 = L- skewness = ʎ3ʎ2
, 𝜏4 = L-
kurtosis = ʎ4ʎ2
3.3 Discordancy measure
Hosking & Wallis (1993) defined discordancy measure of sites to detect the
discordance sites among other sites as Di = 1
3 (ui – ū )T A-1(ui – ū ) where,
ui = (𝜏, 𝜏3,𝜏4)T is a vector containing 𝜏, 𝜏3,𝜏4 values of site i, the superscript
T denotes transpose of a matrix or vector,
14
260N x 270N
940E x 950E
-
Flood Damage Mitigation:
Report
Nov- 2013: P. Choudhury-NIT Silchar, Assam82
ū = 1𝑁 ∑ui be the ( unweighted ) group average of ui, A-1 is the inverse of
the covariance matrix A of ui The elements of A-1 are given by the
relation,
A =1𝑁 (
𝑁𝑗=1 ui – ū )(ui – ū )T ,where N is the number of sites in the
region.
The discordancy (Di) of the 13 sites are determined and the station
Lengpui has its Di value greater than the critical value of 2.869 for 13
stations. The valley has to be sub-divided into regions to see whether the
Di value of this site can be adjusted below the critical value by combining
with some other sites and to form hydrologically similar homogeneous
regions using Fuzzy c-means clustering.
3.4Fuzzy c-means clustering -
In this study Fuzzy c-means clustering is carried out in MATLAB
using large scale atmospheric variables affecting rainfall, location
parameters and seasonality of rainfall as attributes. Two regions are
formed by assigning the membership of each grid points in the clusters
equal or greater than to a threshold; Ti = max { 1
c,
1
2[max (µij)]}, where c =
no. of clusters and µij = maximum membership of the ith grid point in the jth
cluster. These two regions consist of grid point 1 to 5 in region I and 6 to
14 grid points in region II. The Di values for the sites in the two regions are
less than their respective critical values i.e.1.333 for Region I and 2.329 for
Region II which indicates that there are no discordance sites.
Annual maximum rainfall intensity for the rain gauging stations in the
valley for last 21 years from 1990 to 2010 is collected from RMC Guwahati.
The annual maximum rainfall in recorded for various station are used to
estimate 10,20,30,40,50,75 and 100 year return period rainfall intensity for
the gauging stations. Estimation of extreme rainfall intensity for this valley
is obtained from the regional extreme rainfall frequency analysis of the
Flood Damage Mitigation:
Report
Nov- 2013: P. Choudhury-NIT Silchar, Assam83
sub-zone. Here, L-moments based regional frequency analysis approach is
used. The discordancy(Di) measure for screening out the data of the
unusual sites was conducted. Fuzzy c-means clustering analysis with
location parameters, seasonality of rainfall and large scale atmospheric
variables affecting rainfall in the study area was used as attributes for
regionalization of the Sub-Zone into homogeneous regions. Heterogeneity
measure has been conducted by carrying out 500 simulations using a 4-
parameter Kappa distribution. Five extreme value distributions Generalized
Pareto (GPD), Generalized Logistic (GLO), Generalized Extreme Value
(GEV), Pearson Type III and Log Normal (LN3) were used to select the best
fit distribution for the regions. Based on ZDIST statistics and L-moment ratio
diagrams GLO for region I and GPD for region II were selected as the best
fit distributions. Regional rainfall formula for the estimation of rainfall for
various return periods was derived for the gauged sites using the selected
distributions and growth factors for the regions were derived. For the
ungauged sites a regional mean relationship with latitude and longitude of
the sites were developed using multiple linear regression. Brief
methodology applied in analyzing the extreme rainfall events is
summarized below:
3.5 Brief Methodology:
L-moment approach analysis (Hosking & Wallis, 1990) consists of the
following steps-
(a) Screening of data using a discordancy measure.
(b) Formation of homogeneous regions using clustering method and
refinement by conducting homogeneity test.
(c) Choice of distribution using Goodness of fit test – ZDIST statistics and
L-moment ratio diagram.
Flood Damage Mitigation:
Report
Nov- 2013: P. Choudhury-NIT Silchar, Assam84
(d) Establishment of rainfall frequency relationship using index-
flood/rainfall method and Development of regional growth curves.
The discordancy (Di) measure of the 13 sites are conducted and one of
the sites has its Di value greater than the critical value of 2.869 for 13 sites
(Hosking & Wallis). To adjust this Di value below the critical value and to
include this site in the analysis, the study area has been clustered into two
regions- region I comprising the grid points (1, 2, 3, 4 & 5) and region II
comprising the grid points (6, 7, 8, 9, 10, 11, 12, 13 & 14) respectively
using Fuzzy c-means clustering in MATLAB with large scale atmospheric
variables affecting rainfall, location parameters and seasonality of rainfall
as attributes and refinement by conducting homogeneity test. The
heterogeneity measure has been conducted by carrying out 500
simulations using a 4-parameter Kappa distribution in a computer
programme written in JAVA. From the result of Goodness of fit test using
ZDIST statistics and L-moment ratio diagram, GLO for region I and GPD for
region II have been selected as the best fit distribution. The parameters of
the selected distributions are estimated using L-moments and regional
growth factors are derived by index-flood procedure(Dalrymple, 1960) with
the development of regional rainfall formula for the two regions as –
Region I
XT = [0.43096 + 0.50370 {(1−F )
F }-0.26895] . X (3.1)
Region II
XT = 1.69161 – 1.10411 (1- F )0.59644. X (3.2)
Where, X = at site mean rainfall, F = (1 - 1
T ) and T = return period.
T-year rainfall intensity for Barak Valley of Assam is carried out using
(3.2) as this valley lies within region II.
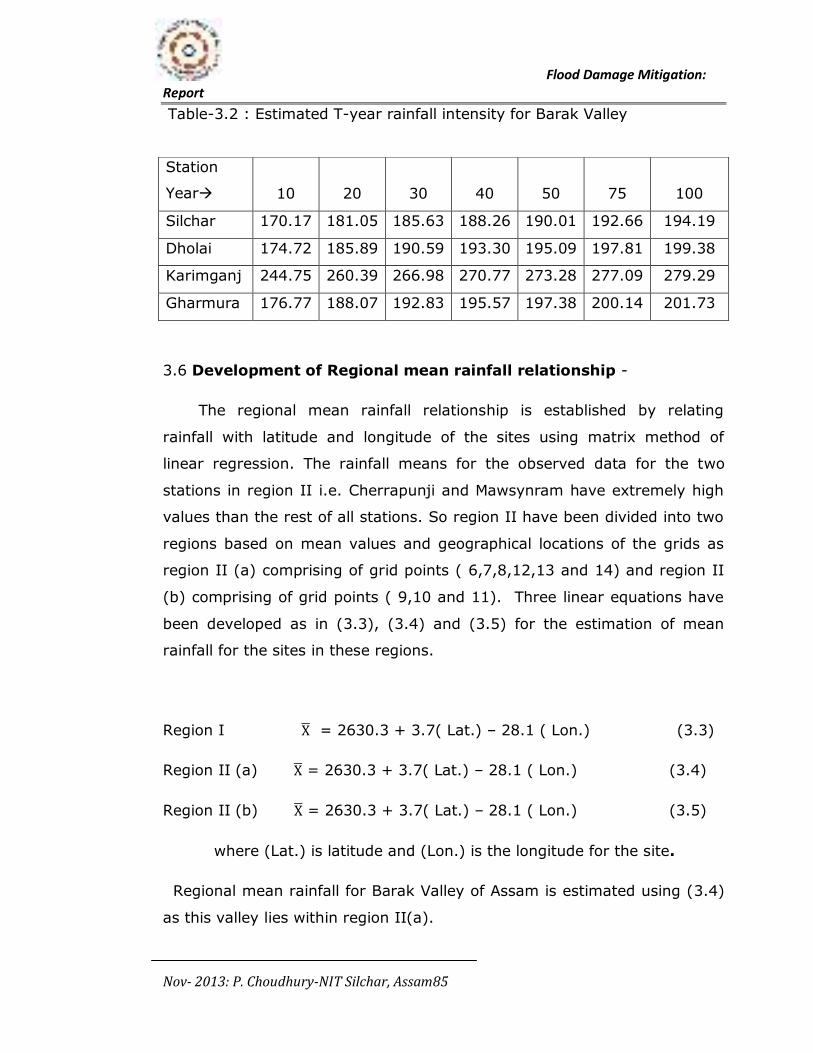
Flood Damage Mitigation:
Report
Nov- 2013: P. Choudhury-NIT Silchar, Assam85
Table-3.2 : Estimated T-year rainfall intensity for Barak Valley
3.6 Development of Regional mean rainfall relationship -
The regional mean rainfall relationship is established by relating
rainfall with latitude and longitude of the sites using matrix method of
linear regression. The rainfall means for the observed data for the two
stations in region II i.e. Cherrapunji and Mawsynram have extremely high
values than the rest of all stations. So region II have been divided into two
regions based on mean values and geographical locations of the grids as
region II (a) comprising of grid points ( 6,7,8,12,13 and 14) and region II
(b) comprising of grid points ( 9,10 and 11). Three linear equations have
been developed as in (3.3), (3.4) and (3.5) for the estimation of mean
rainfall for the sites in these regions.
Region I X = 2630.3 + 3.7( Lat.) – 28.1 ( Lon.) (3.3)
Region II (a) X = 2630.3 + 3.7( Lat.) – 28.1 ( Lon.) (3.4)
Region II (b) X = 2630.3 + 3.7( Lat.) – 28.1 ( Lon.) (3.5)
where (Lat.) is latitude and (Lon.) is the longitude for the site.
Regional mean rainfall for Barak Valley of Assam is estimated using (3.4)
as this valley lies within region II(a).
Station
Year 10 20 30 40 50 75 100
Silchar 170.17 181.05 185.63 188.26 190.01 192.66 194.19
Dholai 174.72 185.89 190.59 193.30 195.09 197.81 199.38
Karimganj 244.75 260.39 266.98 270.77 273.28 277.09 279.29
Gharmura 176.77 188.07 192.83 195.57 197.38 200.14 201.73
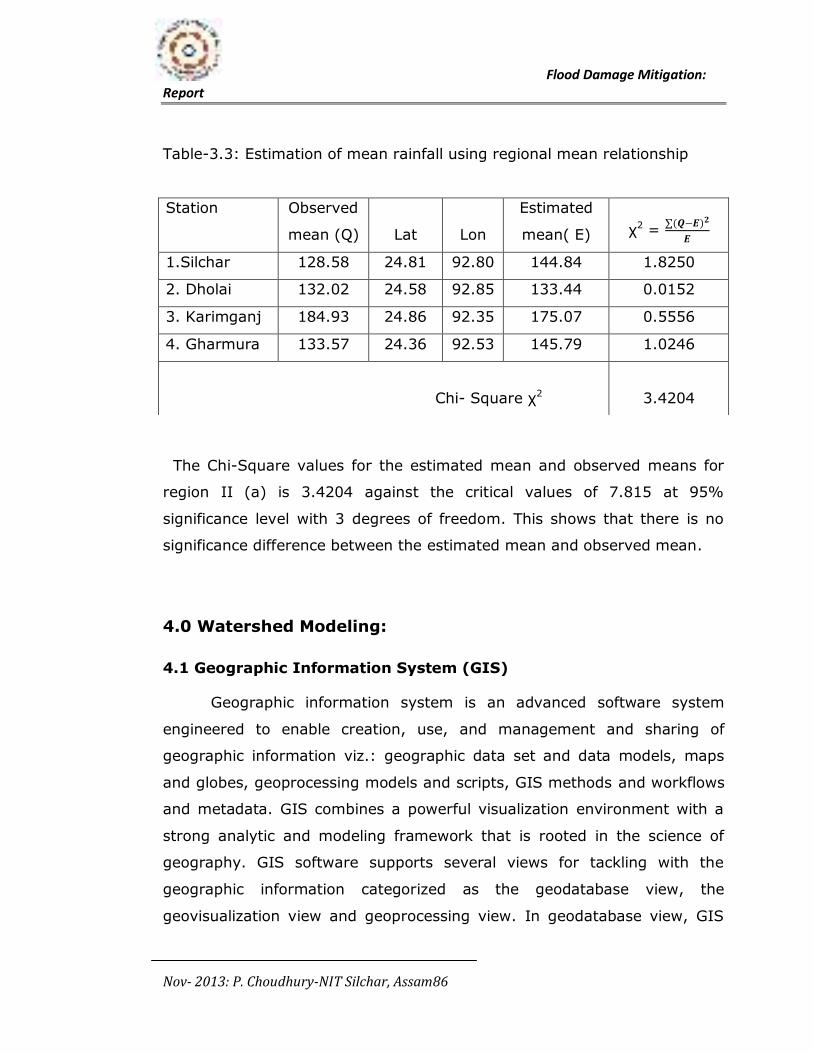
Flood Damage Mitigation:
Report
Nov- 2013: P. Choudhury-NIT Silchar, Assam86
Table-3.3: Estimation of mean rainfall using regional mean relationship
The Chi-Square values for the estimated mean and observed means for
region II (a) is 3.4204 against the critical values of 7.815 at 95%
significance level with 3 degrees of freedom. This shows that there is no
significance difference between the estimated mean and observed mean.
4.0 Watershed Modeling:
4.1 Geographic Information System (GIS)
Geographic information system is an advanced software system
engineered to enable creation, use, and management and sharing of
geographic information viz.: geographic data set and data models, maps
and globes, geoprocessing models and scripts, GIS methods and workflows
and metadata. GIS combines a powerful visualization environment with a
strong analytic and modeling framework that is rooted in the science of
geography. GIS software supports several views for tackling with the
geographic information categorized as the geodatabase view, the
geovisualization view and geoprocessing view. In geodatabase view, GIS
Station Observed
mean (Q) Lat Lon
Estimated
mean( E) χ2 = ∑(𝑸−𝑬)𝟐𝑬
1.Silchar 128.58 24.81 92.80 144.84 1.8250
2. Dholai 132.02 24.58 92.85 133.44 0.0152
3. Karimganj 184.93 24.86 92.35 175.07 0.5556
4. Gharmura 133.57 24.36 92.53 145.79 1.0246
Chi- Square χ2 3.4204
Flood Damage Mitigation:
Report
Nov- 2013: P. Choudhury-NIT Silchar, Assam87
acts as a spatial database that connects datasets representing geographic
information in terms of features, rasters, attributes, terrains, networks, etc.
In geovisualization view, GIS acts as an advanced maps and other views
that show features and feature relationships on the earth’s surface which
enable storing, querying, analyzing, and displaying of geospatial data.
Lastly, in geoprocessing view it acts as information transformation tools
that can extract new data set from existing information. These
geoprocessing functions take information from existing datasets, apply
analytic functions, and write results into new derived datasets.
Geoprocessing also involves the ability to program and to automate a
sequence of operation on geographic data to create new information. The
ability of GIS to handle and process geospatial data in which the
characteristics variables varies spatially distinguishes GIS from other
information system. ArcGIS Desktop is a professional GIS application that
comprises of three main software products: ArcView, ArcEditor, and ArcInfo
which provides a scalable framework for implementing GIS techniques in
prominent field like hydrology, environmental sciences, etc.
Applying GIS techniques DEM models for the entire Earth surface
have been generated by different agencies that are available free of cost.
The United States Geological Survey (USGS) is the primary distributor of
The Shuttle Radar Topography Mission (SRTM), developed jointly by the
National Aeronautics and Space Administration (NASA) and the National
Geospatial Intelligence Agency (NGA), providing elevation datasets. The
SRTM is projected into a geographic coordinate system (GCS) with the
WGS84 horizontal datum and the EGM96 vertical datum (USGS, 2006). The
Advanced Spaceborne Thermal Emission and Reflection Radiometer
(ASTER) is an advanced multispectral imager that was launched on board
NASA’s Terra spacecraft in December, 1999. The ASTER Digital Elevation
Model (DEM) product is generated using bands 3N (nadir-viewing) and 3B
(backward-viewing) of an ASTER Level-1A image acquired by the Visible
Near Infrared (VNIR) sensor. Apart from the DEM developed by discretizing
Flood Damage Mitigation:
Report
Nov- 2013: P. Choudhury-NIT Silchar, Assam88
the top maps these DEMs though may have some imperfections can be
used as an input to quantify the characteristics of the land surface after
rectification
4.2 Geomorphologic parameter estimation using GIS aided
techniques
Estimation of geomorphologic parameters for a watershed can be
achieved using different tools like hydrology, 3D analysis, Statistics, etc. in
ArcGIS . These tools can be applied individually or used in sequence to
create stream network to delineate watersheds. The process of estimation
of geomorphologic characteristics of a watershed using GIS techniques
involves the following sequential stepsas shown in the chart given in the
next page:
4.3 Development of Digital Elevation Model (DEM) for the
watersheds:
Digital Elevation Model for the important watershed in the study area
are developed using GIS technique by applying ArcGIS software.
Generation of DEM using topographic map can be accomplished by
following the steps and applying different GIS tools as shown in the above
chart. Survey of India (SOI) provides topographic maps of different scales
like 1:25,000, 1:50,000, etc. Topographic maps for the study area were
collected from the office of Survey of India, Shillong. The maps were
processed and brought to GIS environment in .tiff format. Using GIS
software ArcGIS, coordinate system are defined for the topographic maps
using suitable projected/ geographic coordinate system available in GIS
software. The georeferenced map is used as input in GIS platform and
contour digitization is done using Editing tool. The completed vector data of
digitized contour is used with 3D analysis tool to generate Triangulated
Irregular Network (TIN). Further using generated TIN as input in 3D
analysis tool, DEM for the watersheds are generated. In the present study
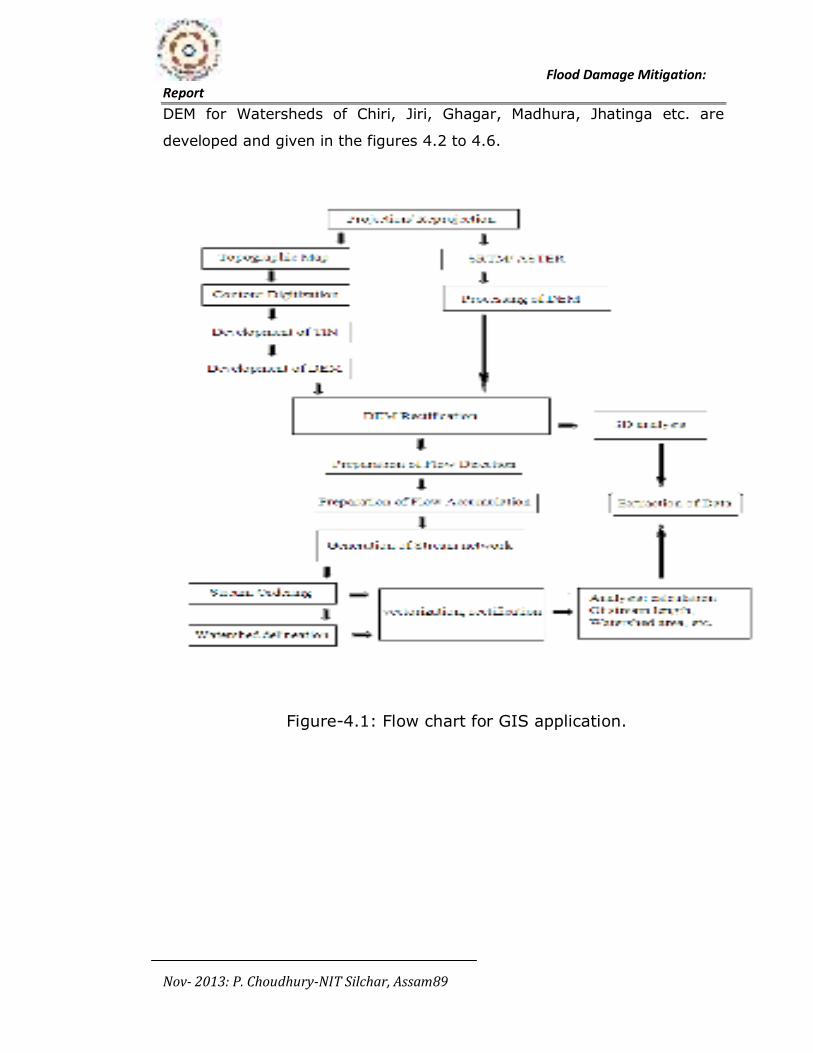
Flood Damage Mitigation:
Report
Nov- 2013: P. Choudhury-NIT Silchar, Assam89
DEM for Watersheds of Chiri, Jiri, Ghagar, Madhura, Jhatinga etc. are
developed and given in the figures 4.2 to 4.6.
Figure-4.1: Flow chart for GIS application.
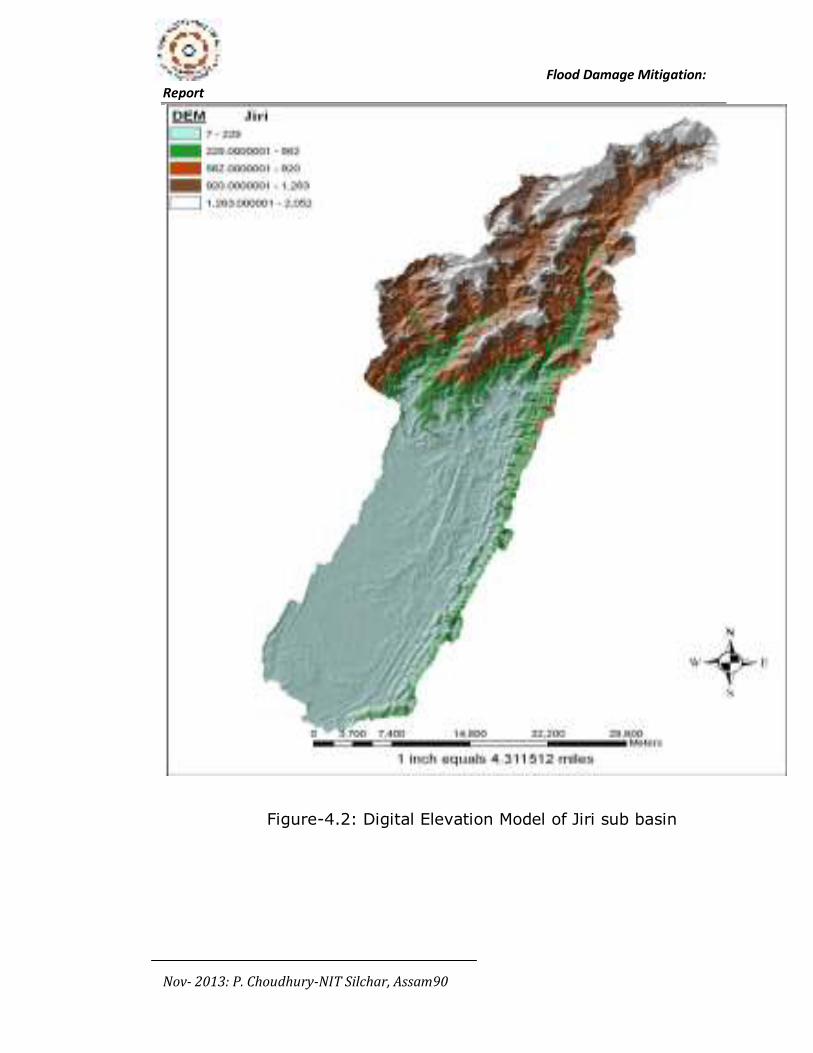
Flood Damage Mitigation:
Report
Nov- 2013: P. Choudhury-NIT Silchar, Assam90
Figure-4.2: Digital Elevation Model of Jiri sub basin
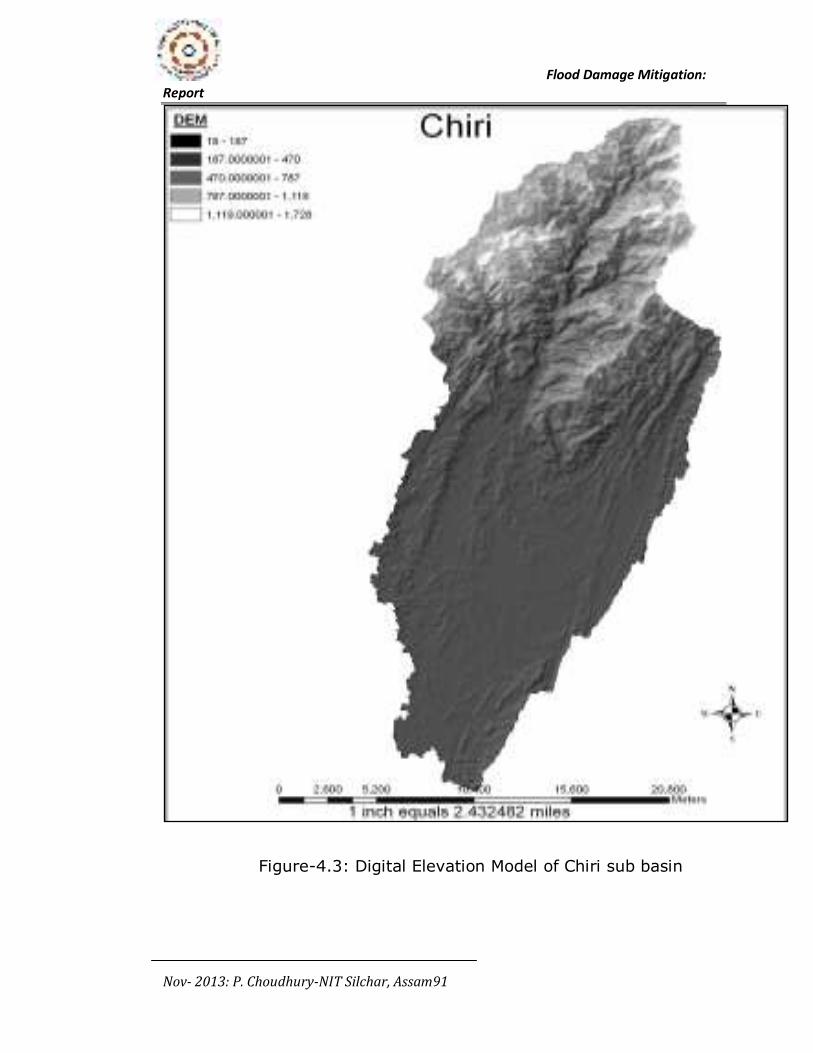
Flood Damage Mitigation:
Report
Nov- 2013: P. Choudhury-NIT Silchar, Assam91
Figure-4.3: Digital Elevation Model of Chiri sub basin
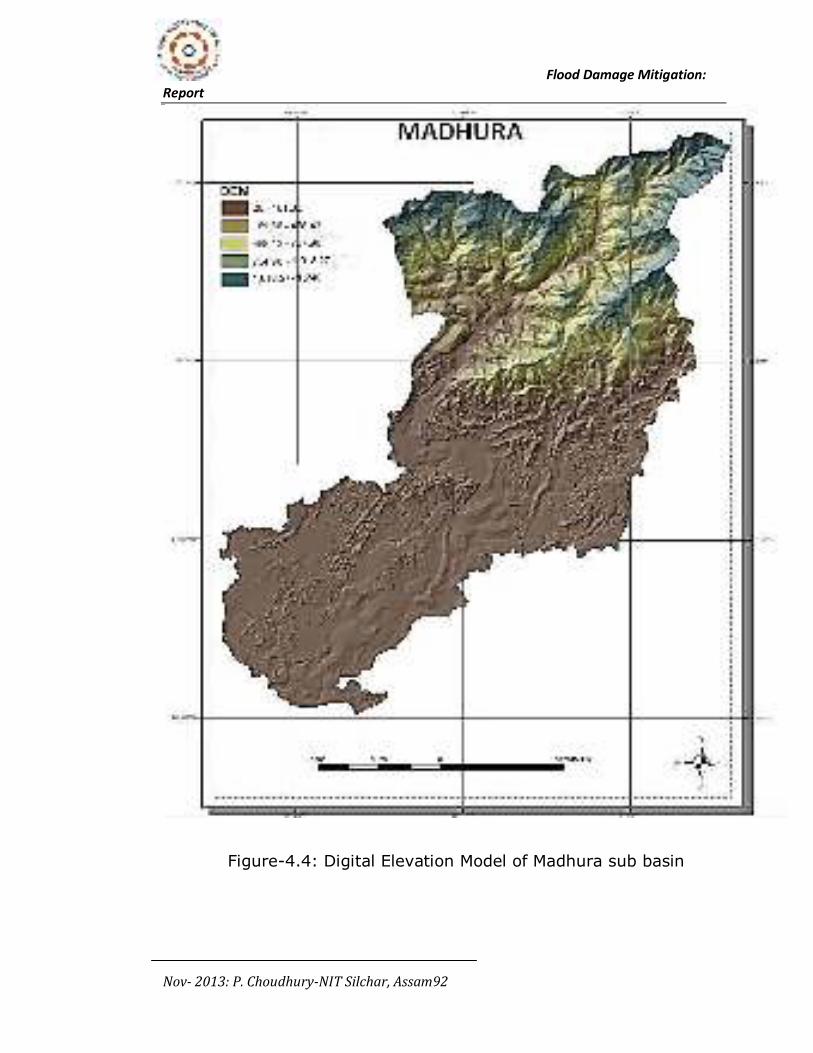
Flood Damage Mitigation:
Report
Nov- 2013: P. Choudhury-NIT Silchar, Assam92
Figure-4.4: Digital Elevation Model of Madhura sub basin
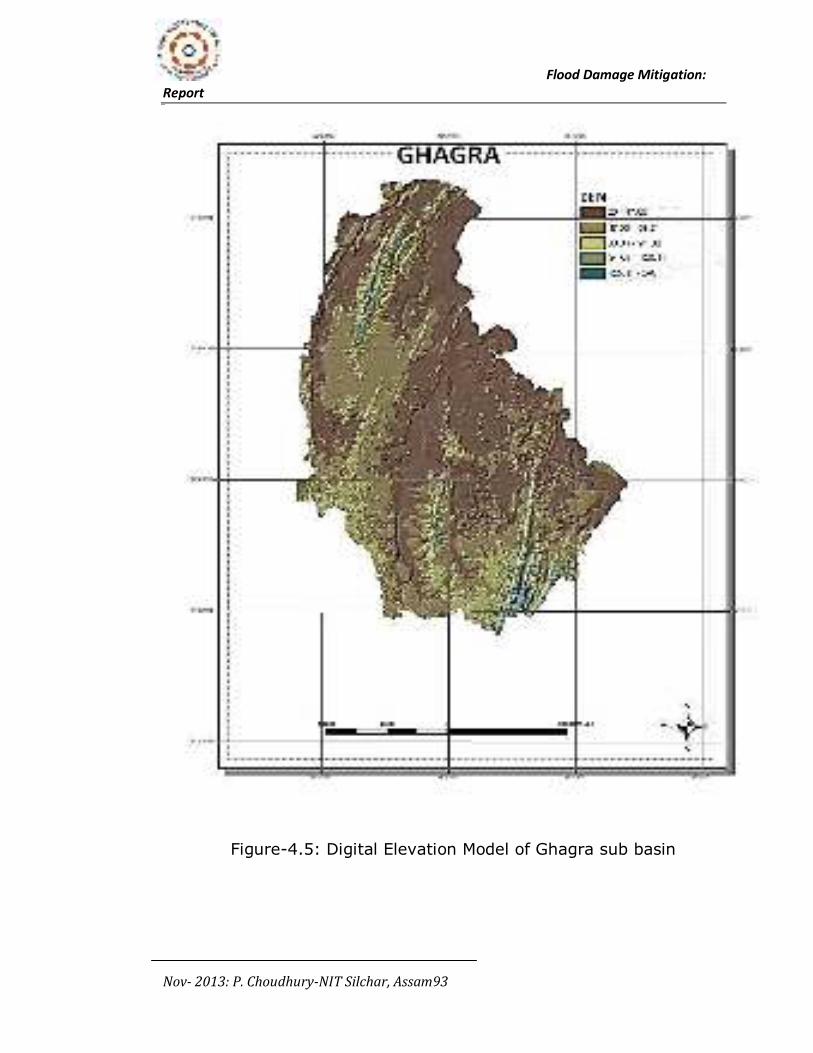
Flood Damage Mitigation:
Report
Nov- 2013: P. Choudhury-NIT Silchar, Assam93
Figure-4.5: Digital Elevation Model of Ghagra sub basin
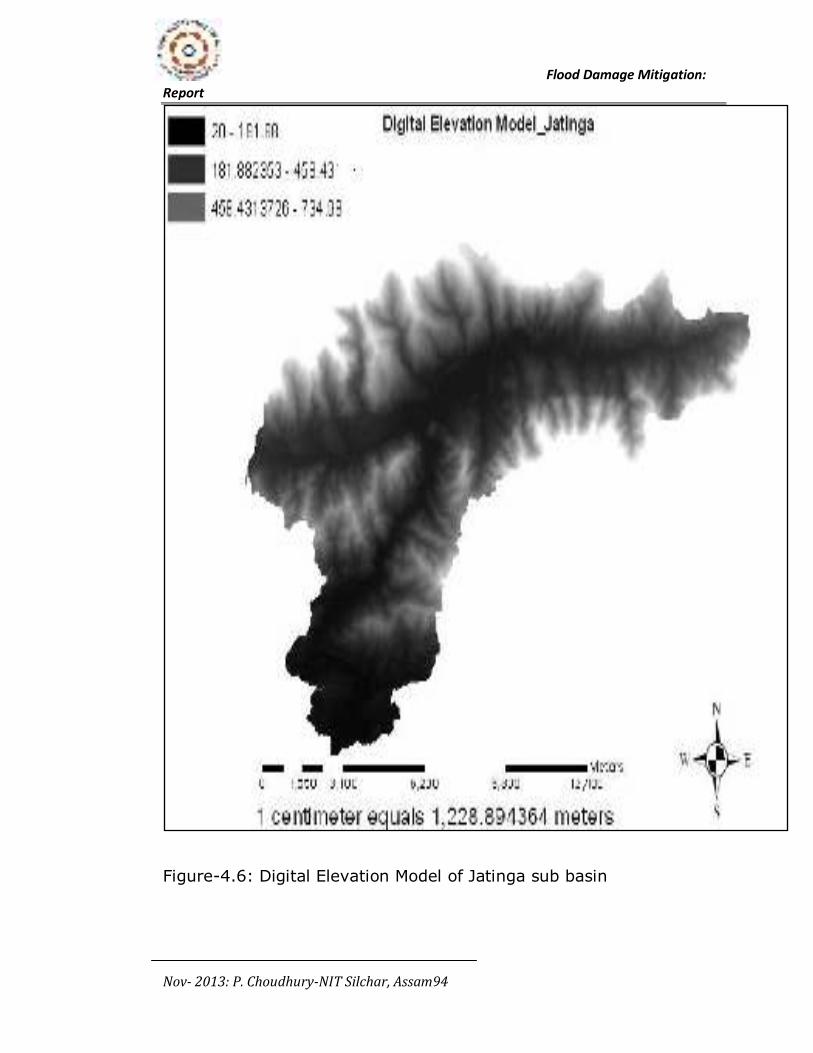
Flood Damage Mitigation:
Report
Nov- 2013: P. Choudhury-NIT Silchar, Assam94
Figure-4.6: Digital Elevation Model of Jatinga sub basin
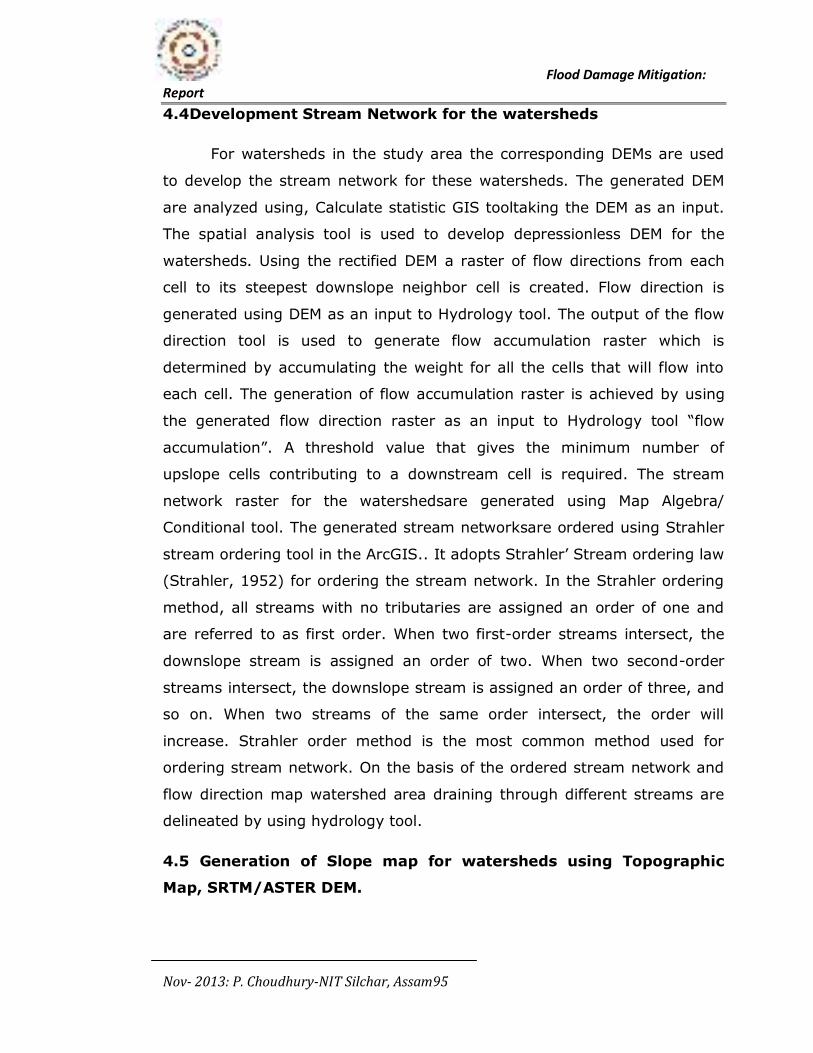
Flood Damage Mitigation:
Report
Nov- 2013: P. Choudhury-NIT Silchar, Assam95
4.4Development Stream Network for the watersheds
For watersheds in the study area the corresponding DEMs are used
to develop the stream network for these watersheds. The generated DEM
are analyzed using, Calculate statistic GIS tooltaking the DEM as an input.
The spatial analysis tool is used to develop depressionless DEM for the
watersheds. Using the rectified DEM a raster of flow directions from each
cell to its steepest downslope neighbor cell is created. Flow direction is
generated using DEM as an input to Hydrology tool. The output of the flow
direction tool is used to generate flow accumulation raster which is
determined by accumulating the weight for all the cells that will flow into
each cell. The generation of flow accumulation raster is achieved by using
the generated flow direction raster as an input to Hydrology tool “flow
accumulation”. A threshold value that gives the minimum number of
upslope cells contributing to a downstream cell is required. The stream
network raster for the watershedsare generated using Map Algebra/
Conditional tool. The generated stream networksare ordered using Strahler
stream ordering tool in the ArcGIS.. It adopts Strahler’ Stream ordering law
(Strahler, 1952) for ordering the stream network. In the Strahler ordering
method, all streams with no tributaries are assigned an order of one and
are referred to as first order. When two first-order streams intersect, the
downslope stream is assigned an order of two. When two second-order
streams intersect, the downslope stream is assigned an order of three, and
so on. When two streams of the same order intersect, the order will
increase. Strahler order method is the most common method used for
ordering stream network. On the basis of the ordered stream network and
flow direction map watershed area draining through different streams are
delineated by using hydrology tool.
4.5 Generation of Slope map for watersheds using Topographic
Map, SRTM/ASTER DEM.
Flood Damage Mitigation:
Report
Nov- 2013: P. Choudhury-NIT Silchar, Assam96
The slope map of a watershed represents the degree of steepness (slope)
of the watershed surface at different locations. The Slope map in slope
percent for the watersheds is developed using rectified DEM in 3D analysis
tool. Detailed description of the sub basins in the study area, drainage
networks and slope map for the sub basins are presented in the tables and
figures listed below.
Figure-4.7: Drainage network in Jiri sub catchment
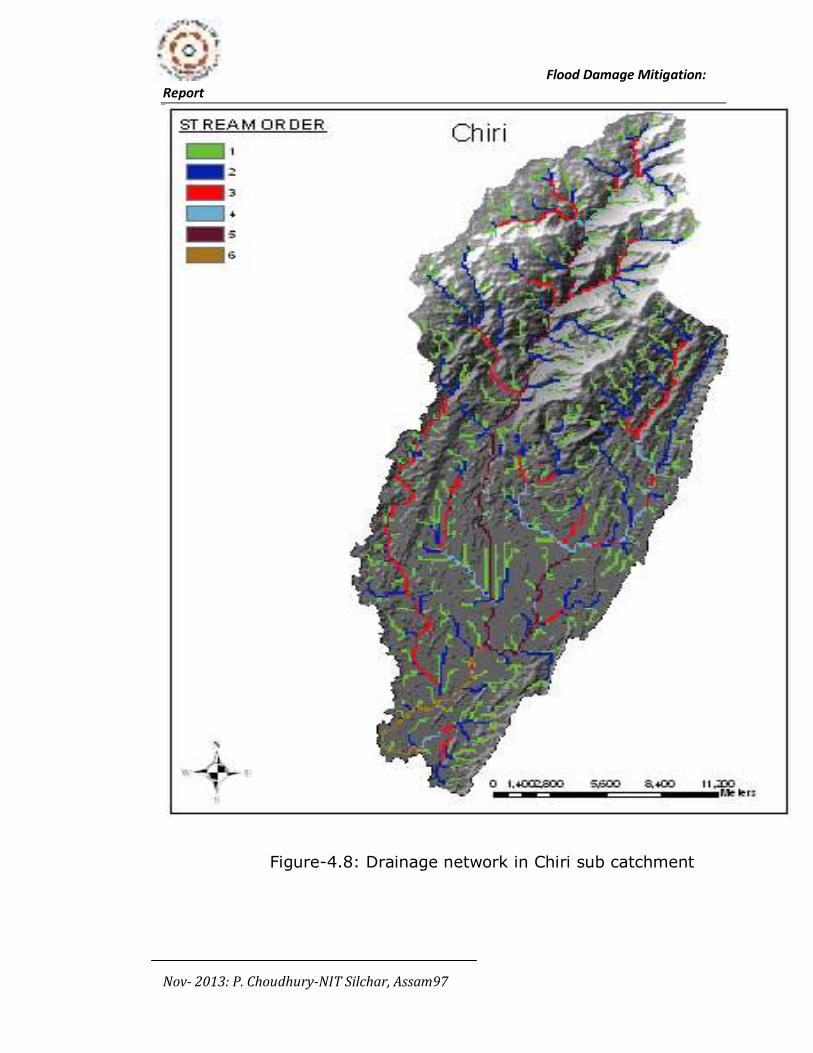
Flood Damage Mitigation:
Report
Nov- 2013: P. Choudhury-NIT Silchar, Assam97
Figure-4.8: Drainage network in Chiri sub catchment
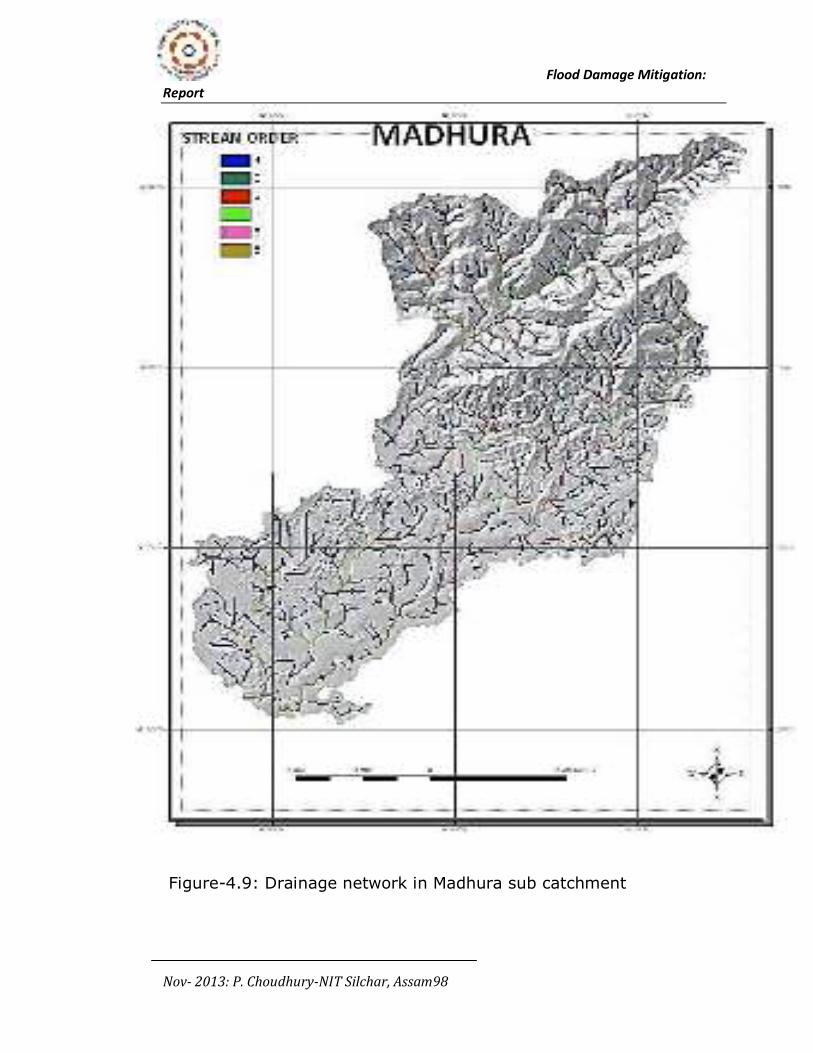
Flood Damage Mitigation:
Report
Nov- 2013: P. Choudhury-NIT Silchar, Assam98
Figure-4.9: Drainage network in Madhura sub catchment
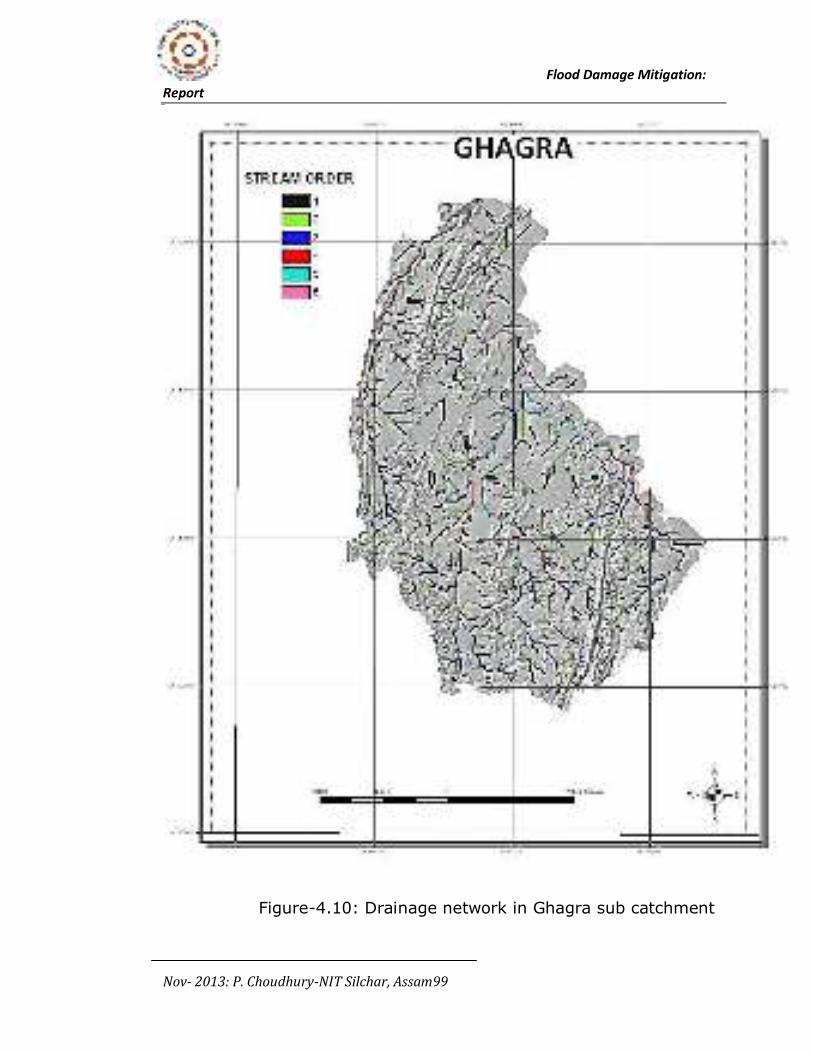
Flood Damage Mitigation:
Report
Nov- 2013: P. Choudhury-NIT Silchar, Assam99
Figure-4.10: Drainage network in Ghagra sub catchment
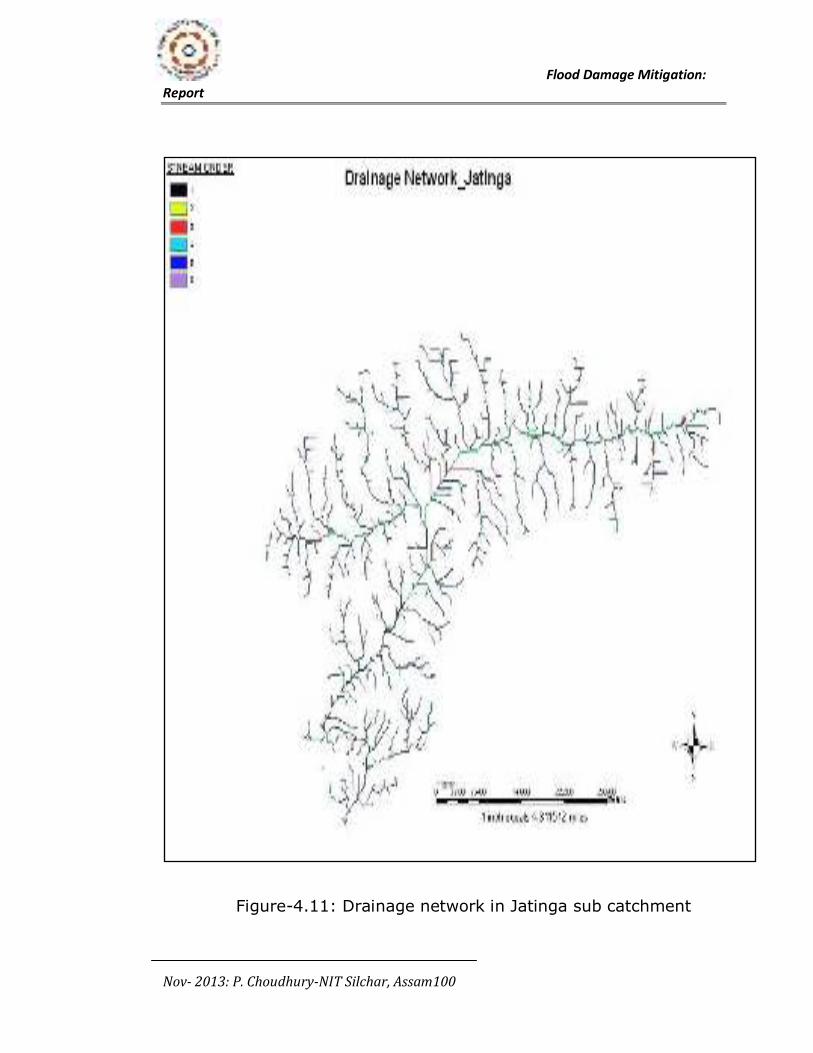
Flood Damage Mitigation:
Report
Nov- 2013: P. Choudhury-NIT Silchar, Assam100
Figure-4.11: Drainage network in Jatinga sub catchment
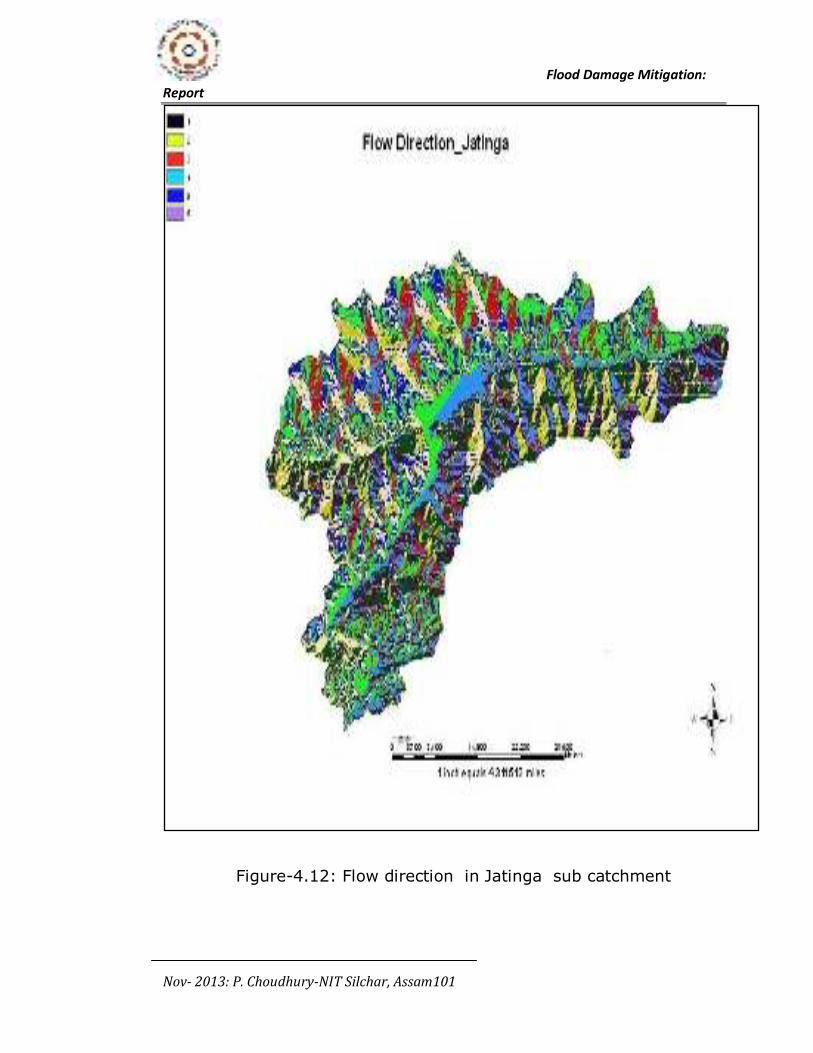
Flood Damage Mitigation:
Report
Nov- 2013: P. Choudhury-NIT Silchar, Assam101
Figure-4.12: Flow direction in Jatinga sub catchment
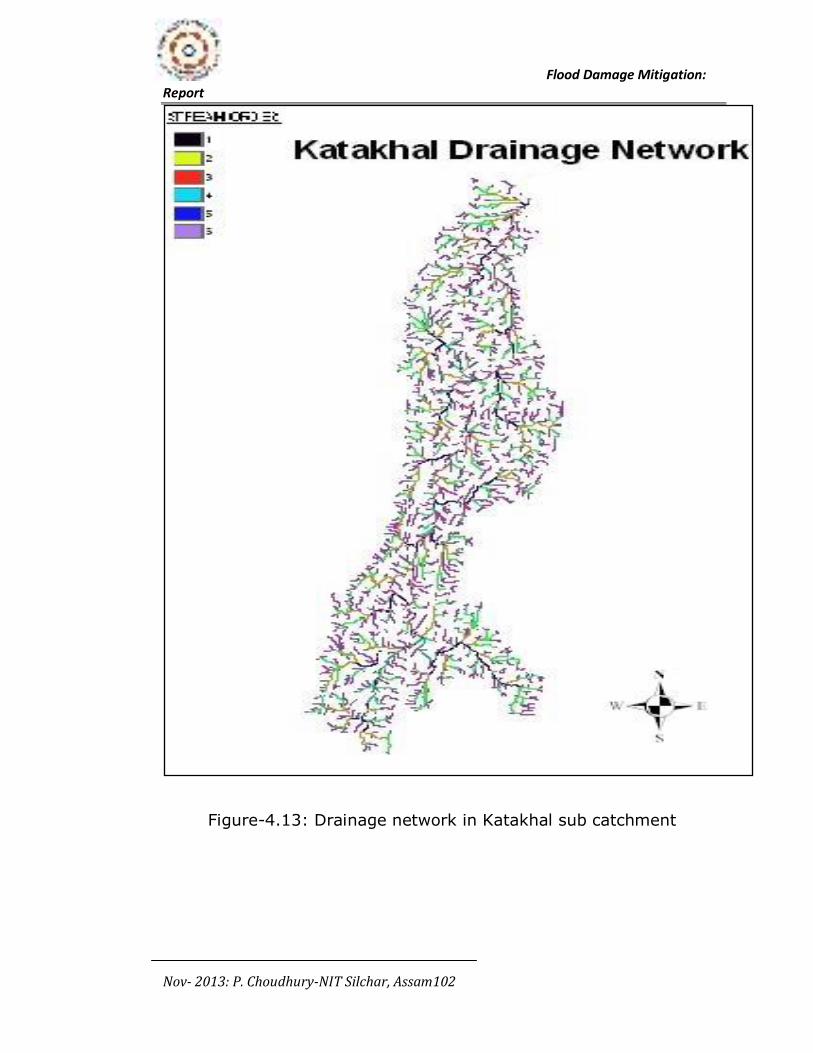
Flood Damage Mitigation:
Report
Nov- 2013: P. Choudhury-NIT Silchar, Assam102
Figure-4.13: Drainage network in Katakhal sub catchment
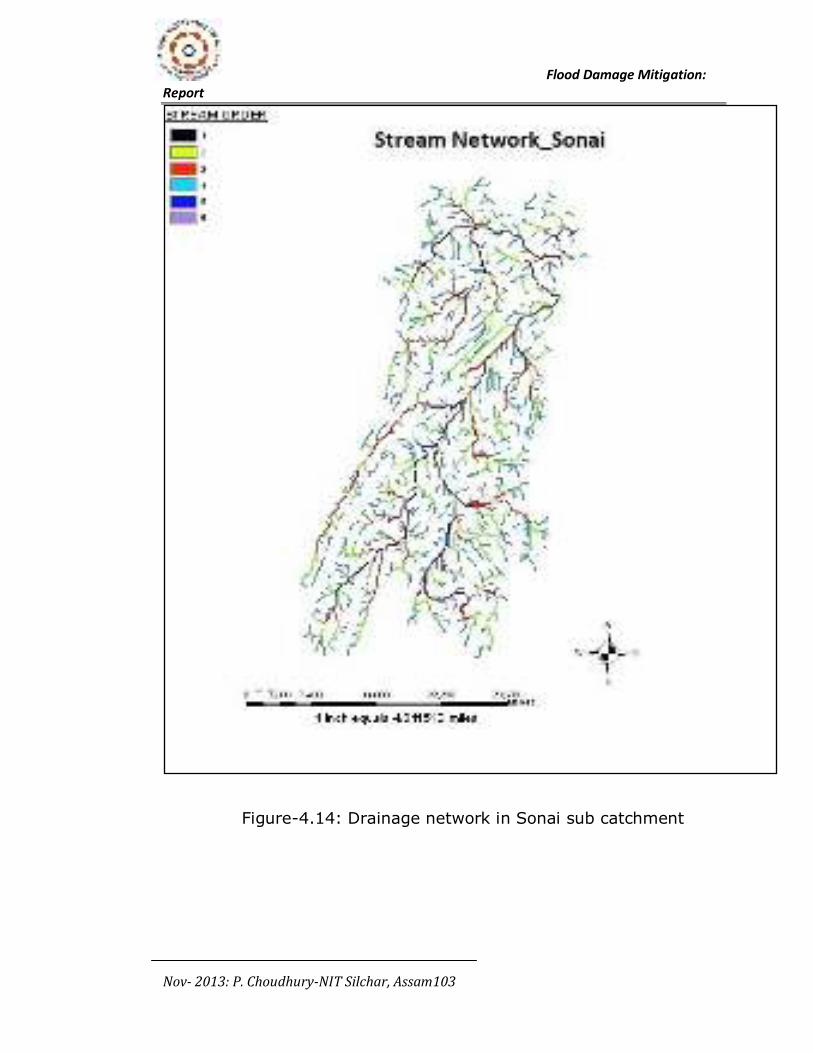
Flood Damage Mitigation:
Report
Nov- 2013: P. Choudhury-NIT Silchar, Assam103
Figure-4.14: Drainage network in Sonai sub catchment
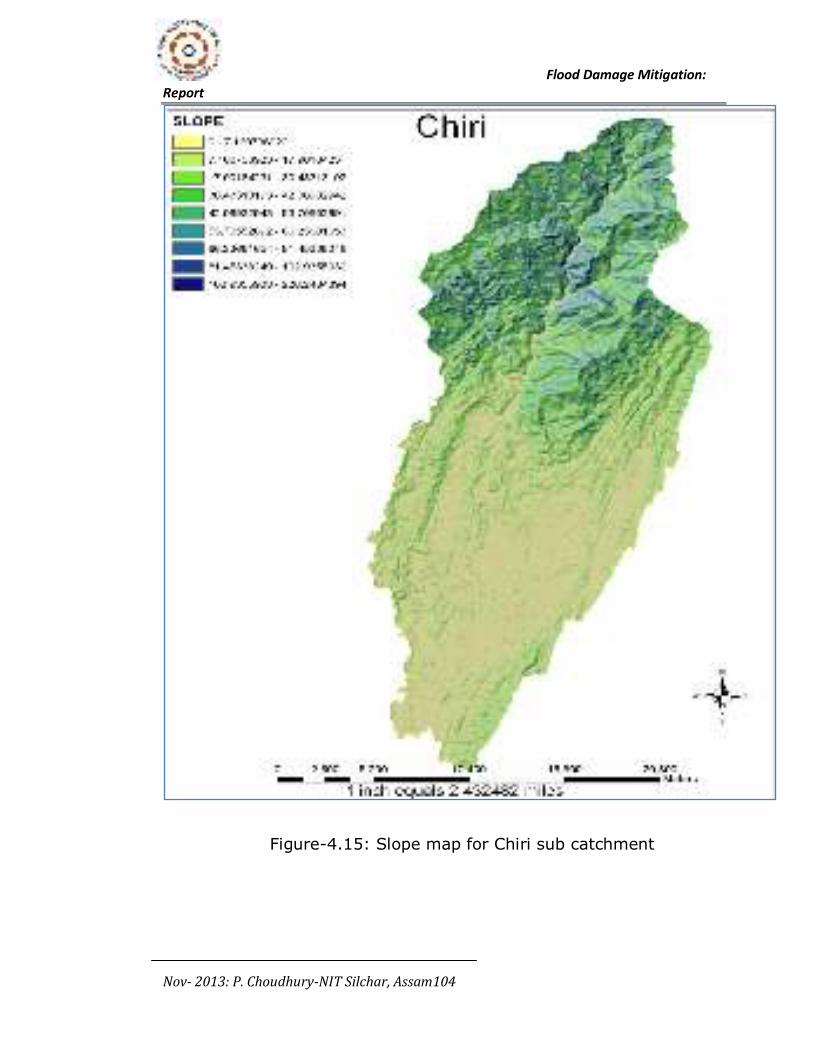
Flood Damage Mitigation:
Report
Nov- 2013: P. Choudhury-NIT Silchar, Assam104
Figure-4.15: Slope map for Chiri sub catchment
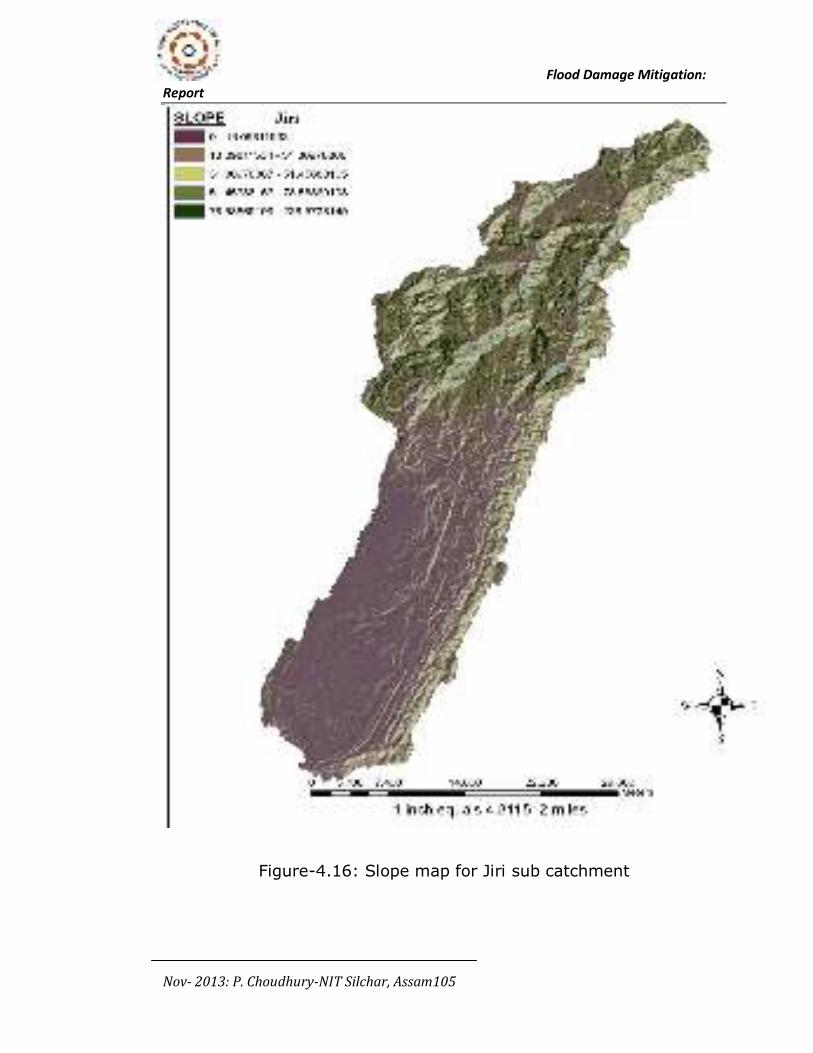
Flood Damage Mitigation:
Report
Nov- 2013: P. Choudhury-NIT Silchar, Assam105
Figure-4.16: Slope map for Jiri sub catchment
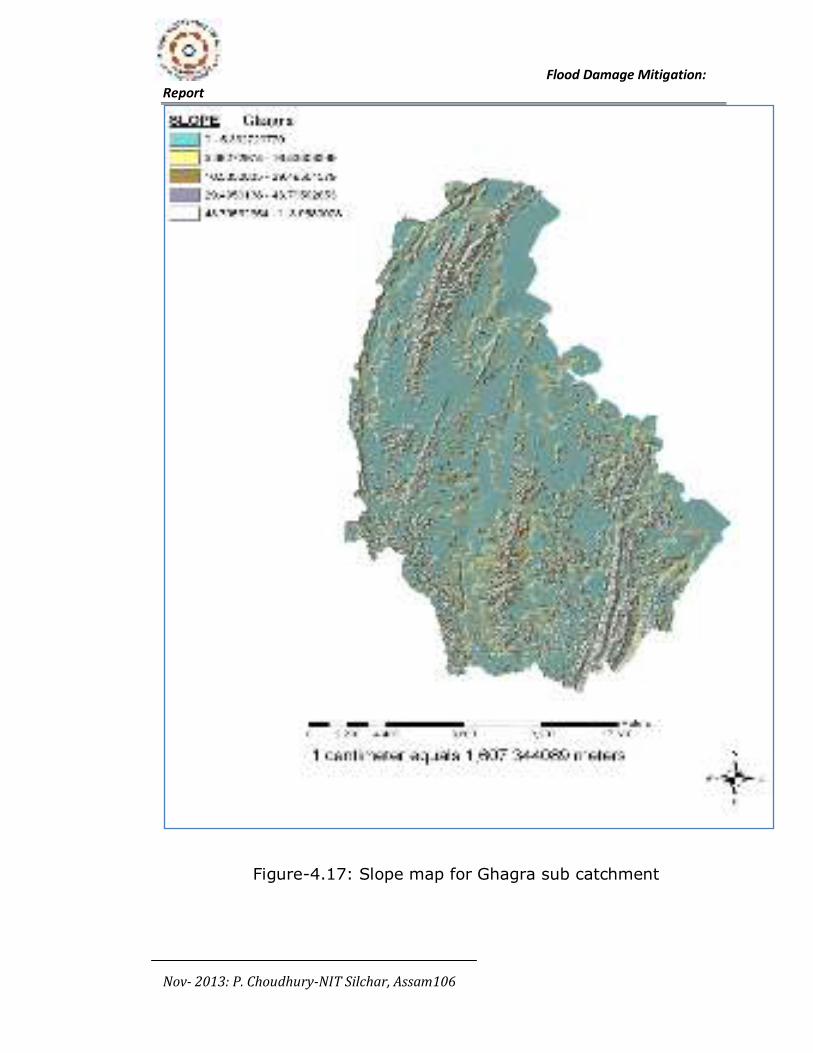
Flood Damage Mitigation:
Report
Nov- 2013: P. Choudhury-NIT Silchar, Assam106
Figure-4.17: Slope map for Ghagra sub catchment
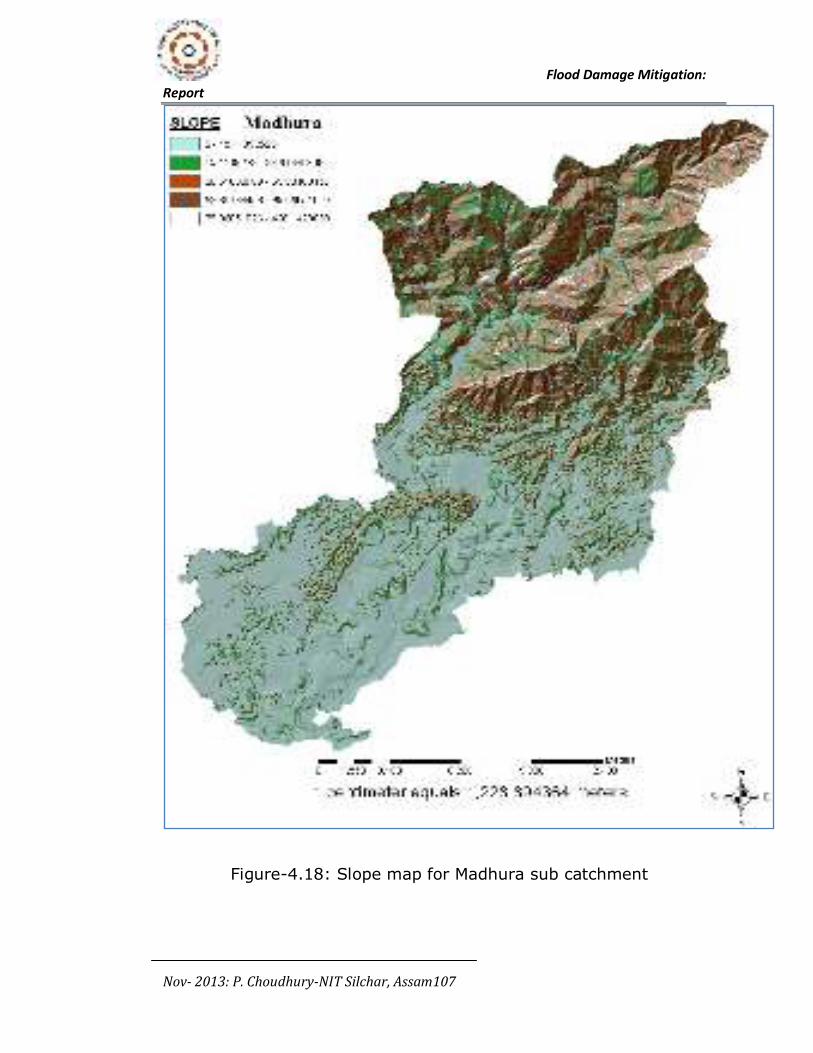
Flood Damage Mitigation:
Report
Nov- 2013: P. Choudhury-NIT Silchar, Assam107
Figure-4.18: Slope map for Madhura sub catchment
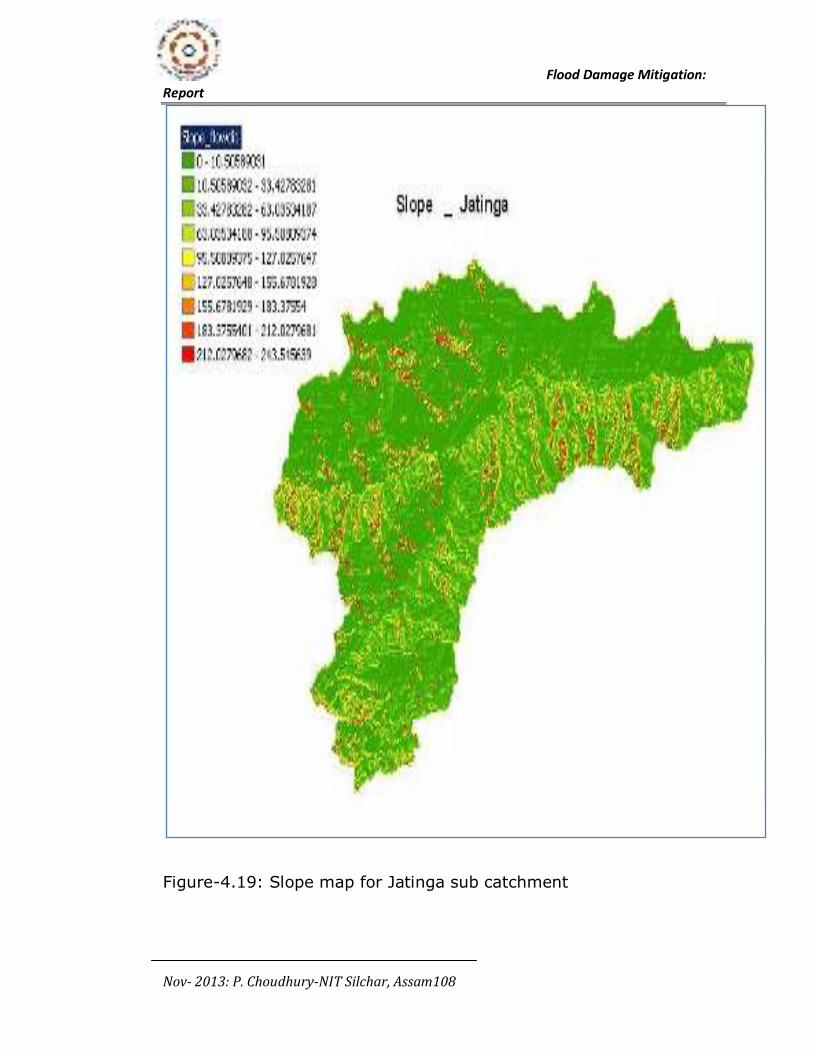
Flood Damage Mitigation:
Report
Nov- 2013: P. Choudhury-NIT Silchar, Assam108
Figure-4.19: Slope map for Jatinga sub catchment
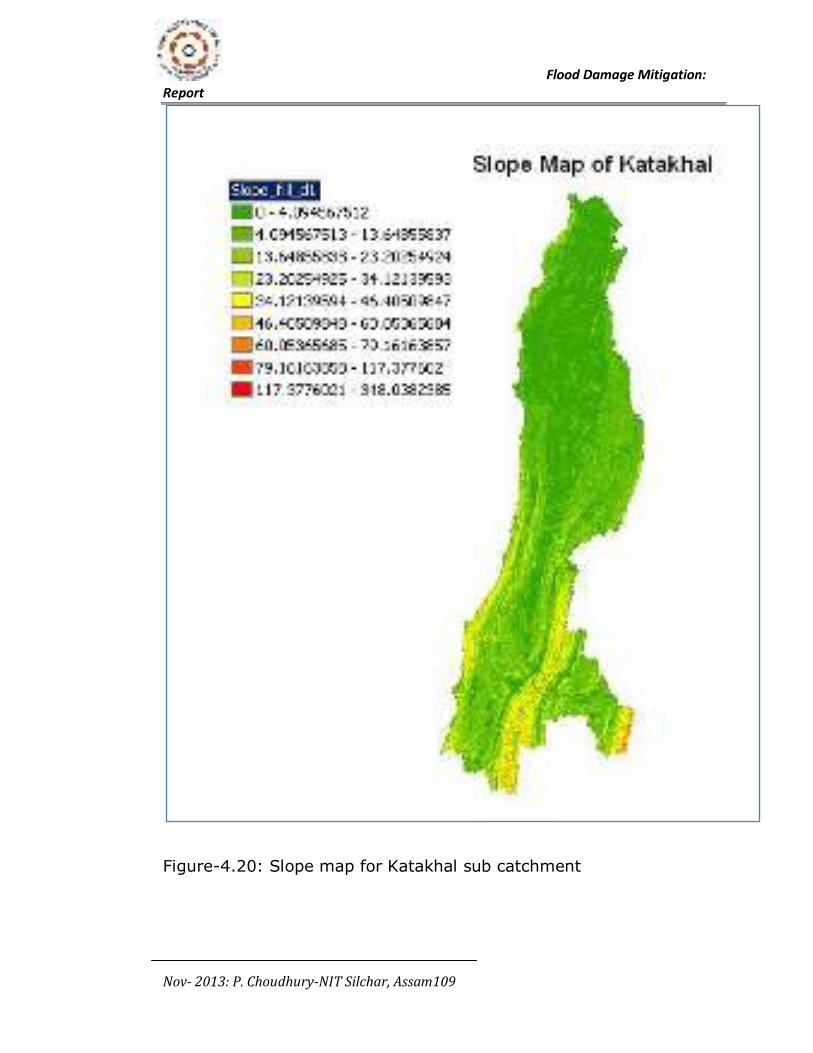
Flood Damage Mitigation:
Report
Nov- 2013: P. Choudhury-NIT Silchar, Assam109
Figure-4.20: Slope map for Katakhal sub catchment
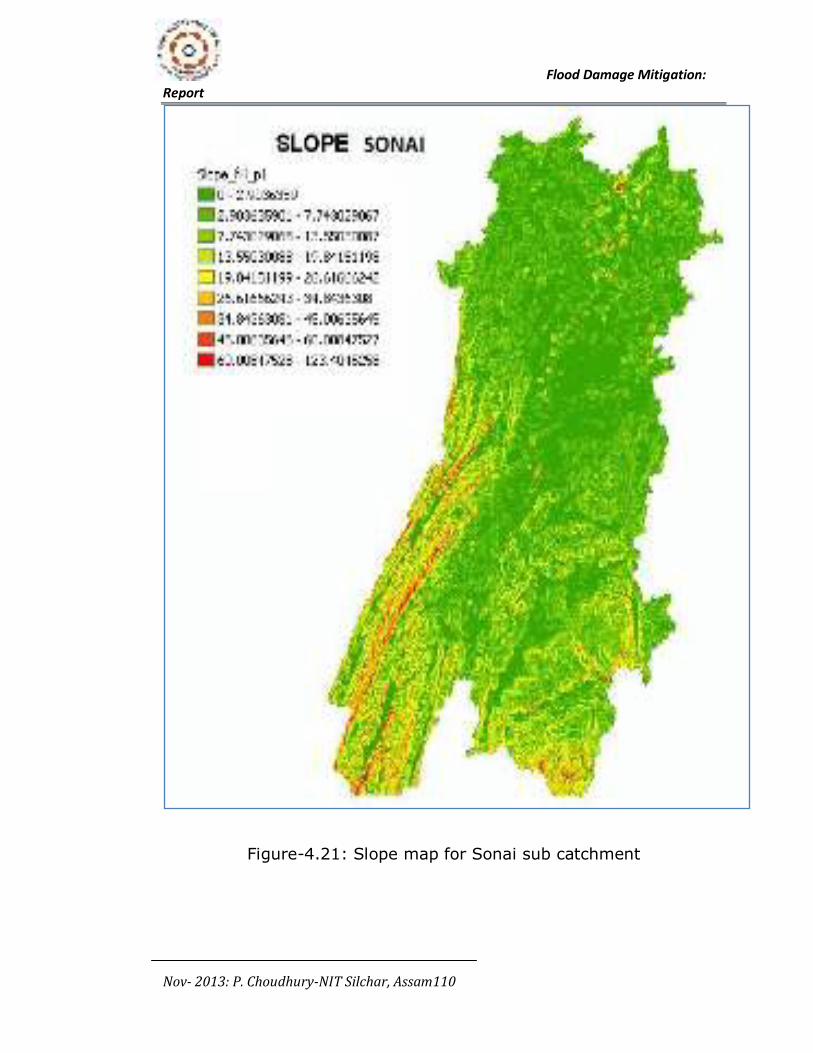
Flood Damage Mitigation:
Report
Nov- 2013: P. Choudhury-NIT Silchar, Assam110
Figure-4.21: Slope map for Sonai sub catchment
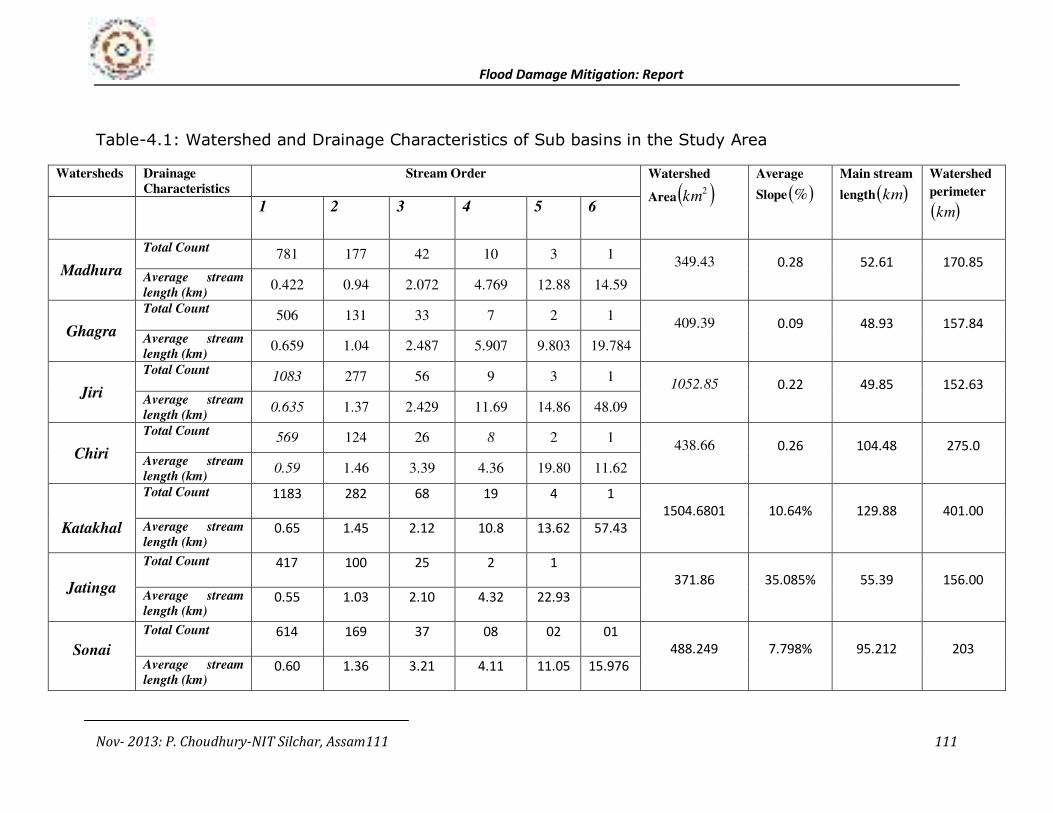
Flood Damage Mitigation: Report
Nov- 2013: P. Choudhury-NIT Silchar, Assam111 111
Table-4.1: Watershed and Drainage Characteristics of Sub basins in the Study Area
Watersheds Drainage
Characteristics
Stream Order Watershed
Area 2km
Average
Slope %
Main stream
length km
Watershed
perimeter
km 1 2 3 4 5 6
Madhura
Total Count 781 177 42 10 3 1
349.43 0.28 52.61 170.85 Average stream
length (km) 0.422 0.94 2.072 4.769 12.88 14.59
Ghagra
Total Count 506 131 33 7 2 1
409.39 0.09 48.93 157.84 Average stream
length (km) 0.659 1.04 2.487 5.907 9.803 19.784
Jiri
Total Count 1083 277 56 9 3 1
1052.85 0.22 49.85 152.63 Average stream
length (km) 0.635 1.37 2.429 11.69 14.86 48.09
Chiri
Total Count 569 124 26 8 2 1
438.66 0.26 104.48 275.0 Average stream
length (km) 0.59 1.46 3.39 4.36 19.80 11.62
Katakhal
Total Count 1183 282 68 19 4 1
1504.6801 10.64% 129.88 401.00 Average stream
length (km) 0.65 1.45 2.12 10.8 13.62 57.43
Jatinga
Total Count 417 100 25 2 1
371.86 35.085% 55.39 156.00 Average stream
length (km) 0.55 1.03 2.10 4.32 22.93
Sonai
Total Count 614 169 37 08 02 01
488.249 7.798% 95.212 203 Average stream
length (km) 0.60 1.36 3.21 4.11 11.05 15.976
Flood Damage Mitigation: Report
Nov- 2013: P. Choudhury-NIT Silchar, Assam112
5.0 Hydrological Modeling: Development of Unit Hydrographs
Hydrologic responses of a watershed are influenced by geomorphologic
characteristics of the watershed. Characterization and quantification of such
characteristics is useful and essential in the process of evaluating the hydrologic
response of a watershed. These characteristics relate to the physical
characteristics of the drainage basin and drainage network; physical
characteristics of the drainage basin include drainage area, basin shape, ground
slope, and centroid (i.e. centre of gravity of the basin). Channel characteristics
include channel order, channel length, channel slope, channel profile, and
drainage density. Handling and modeling of such spatially varying parameters
have become more efficient and accurate with the emergence of advance
computing techniques, Geographic Information System (GIS). For deriving UH
using GIUH models different watershed characteristics such as stream length,
watershed area, slope, etc are essential. Using topographic maps/SRTM/ASTER
data and remote sensing data in GIS software like ArcGIS, ERDAS imagine,
ILWISS, etc Digital Elevation Model (DEM) can be developed and analyzed. With
DEM as an input to quantify the watershed characteristics slope map, stream
map, etc may be obtained. Watershed characteristics for the sub basins in the
study areathat were estimated by using GIS supported techniquesis given in
table-4.1. DEM, Stream networks and the slope maps for the watersheds in the
study area are also presented in the earlier sections. Using DEM flow direction
and flow accumulation maps for the watersheds are developed. With the
drainage network map as input and using Strahler’s stream ordering law the
drainage network for the watersheds are ordered applying GIS stream ordering
tool. On the basis of the ordered drainage network, areas drained and stream
lengths for different stream orders are obtained. Horton’s geomorphologic
parameters (Horton, 1945)AR ,
BR and LR for the watershed are estimated
graphically by plotting average areas drained, stream numbers and average
stream length respectively against the stream orders. Absolute slope value for
the best fit line is taken to compute the ratios. Graphical representations
showing best fit line is used for computingAR ,
BR and LR for the watersheds.
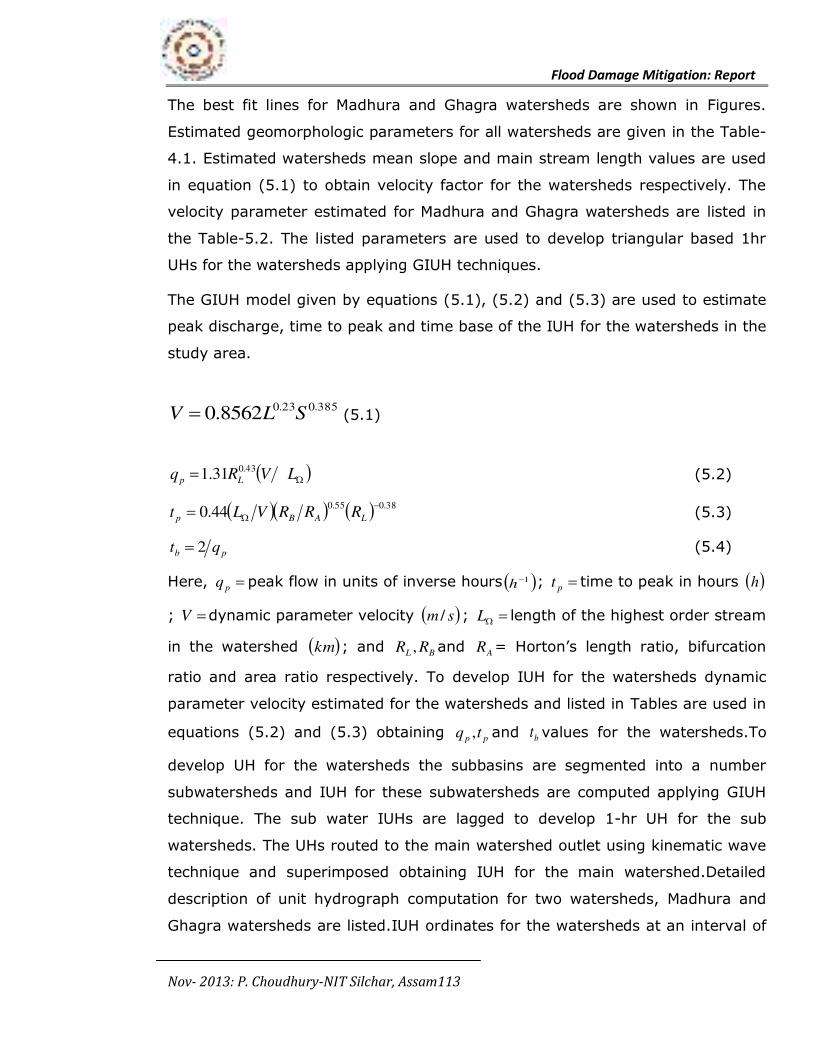
Flood Damage Mitigation: Report
Nov- 2013: P. Choudhury-NIT Silchar, Assam113
The best fit lines for Madhura and Ghagra watersheds are shown in Figures.
Estimated geomorphologic parameters for all watersheds are given in the Table-
4.1. Estimated watersheds mean slope and main stream length values are used
in equation (5.1) to obtain velocity factor for the watersheds respectively. The
velocity parameter estimated for Madhura and Ghagra watersheds are listed in
the Table-5.2. The listed parameters are used to develop triangular based 1hr
UHs for the watersheds applying GIUH techniques.
The GIUH model given by equations (5.1), (5.2) and (5.3) are used to estimate
peak discharge, time to peak and time base of the IUH for the watersheds in the
study area.
385.023.08562.0 SLV (5.1)
LVRq Lp
43.031.1 (5.2)
38.055.044.0
LABp RRRVLt (5.3)
pb qt 2 (5.4)
Here, pq peak flow in units of inverse hours 1h ; pt time to peak in hours h
; V dynamic parameter velocity sm / ; L length of the highest order stream
in the watershed km ; and BL RR , and AR = Horton’s length ratio, bifurcation
ratio and area ratio respectively. To develop IUH for the watersheds dynamic
parameter velocity estimated for the watersheds and listed in Tables are used in
equations (5.2) and (5.3) obtaining pp tq , and bt values for the watersheds.To
develop UH for the watersheds the subbasins are segmented into a number
subwatersheds and IUH for these subwatersheds are computed applying GIUH
technique. The sub water IUHs are lagged to develop 1-hr UH for the sub
watersheds. The UHs routed to the main watershed outlet using kinematic wave
technique and superimposed obtaining IUH for the main watershed.Detailed
description of unit hydrograph computation for two watersheds, Madhura and
Ghagra watersheds are listed.IUH ordinates for the watersheds at an interval of
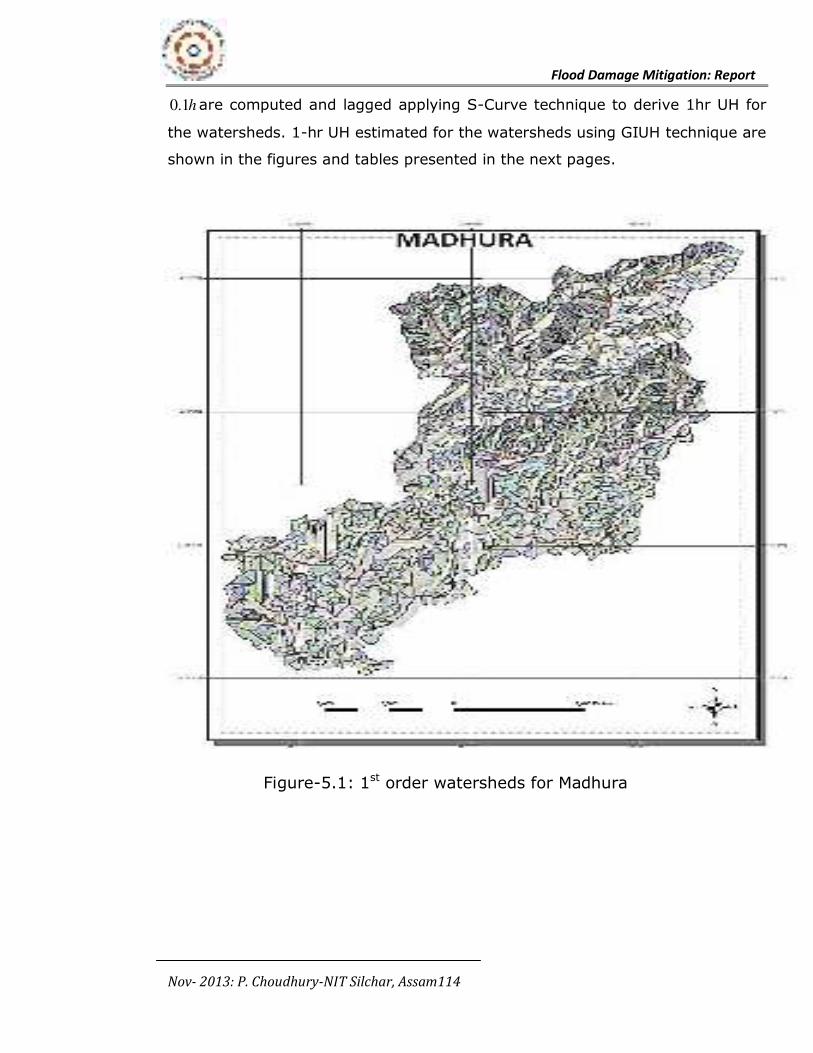
Flood Damage Mitigation: Report
Nov- 2013: P. Choudhury-NIT Silchar, Assam114
h1.0 are computed and lagged applying S-Curve technique to derive 1hr UH for
the watersheds. 1-hr UH estimated for the watersheds using GIUH technique are
shown in the figures and tables presented in the next pages.
Figure-5.1: 1st order watersheds for Madhura
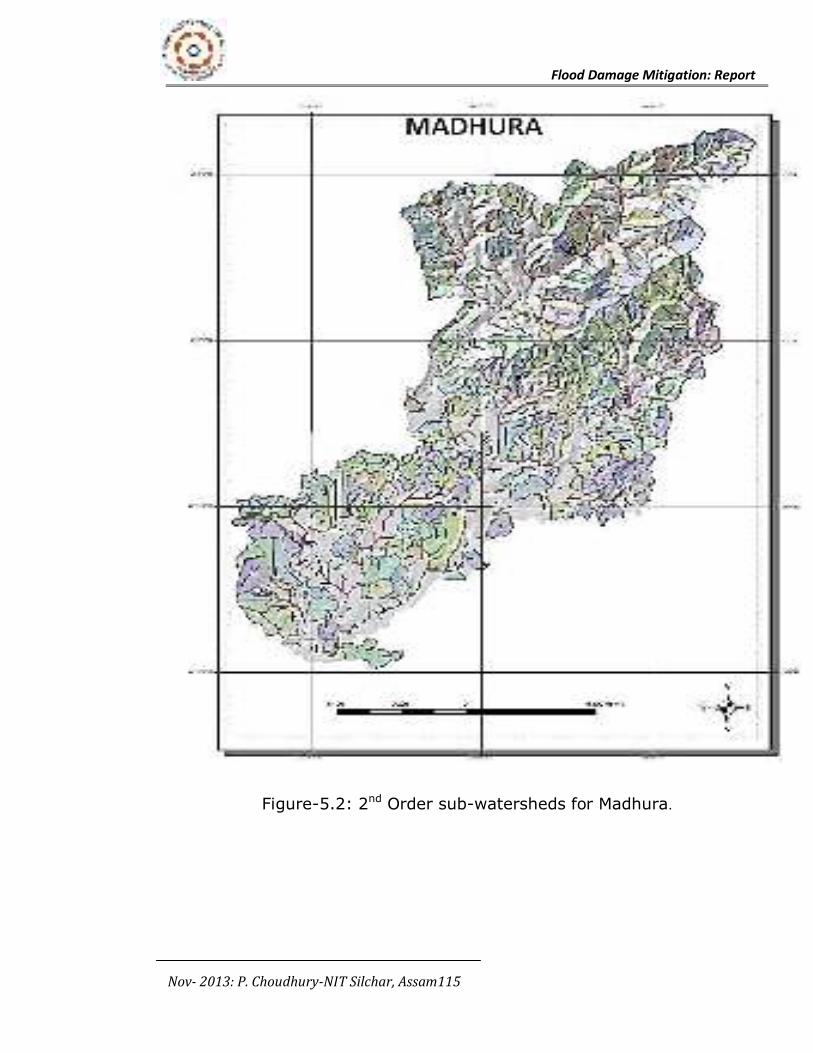
Flood Damage Mitigation: Report
Nov- 2013: P. Choudhury-NIT Silchar, Assam115
Figure-5.2: 2nd Order sub-watersheds for Madhura.
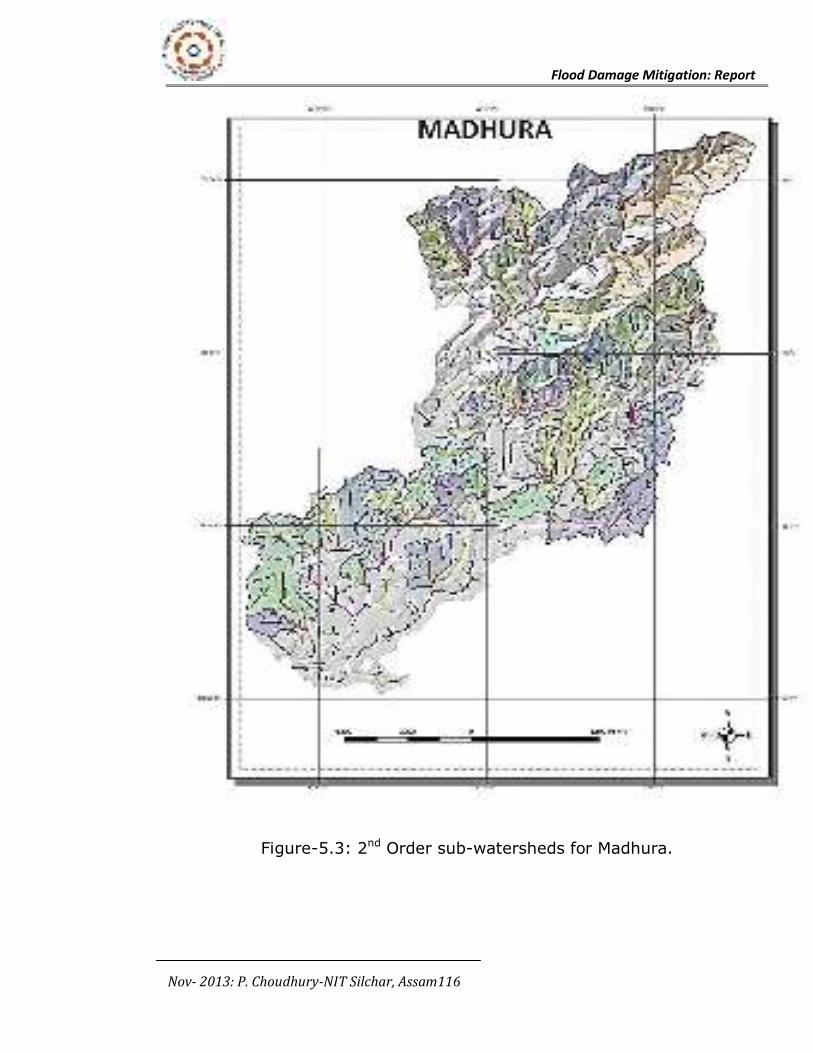
Flood Damage Mitigation: Report
Nov- 2013: P. Choudhury-NIT Silchar, Assam116
Figure-5.3: 2nd Order sub-watersheds for Madhura.
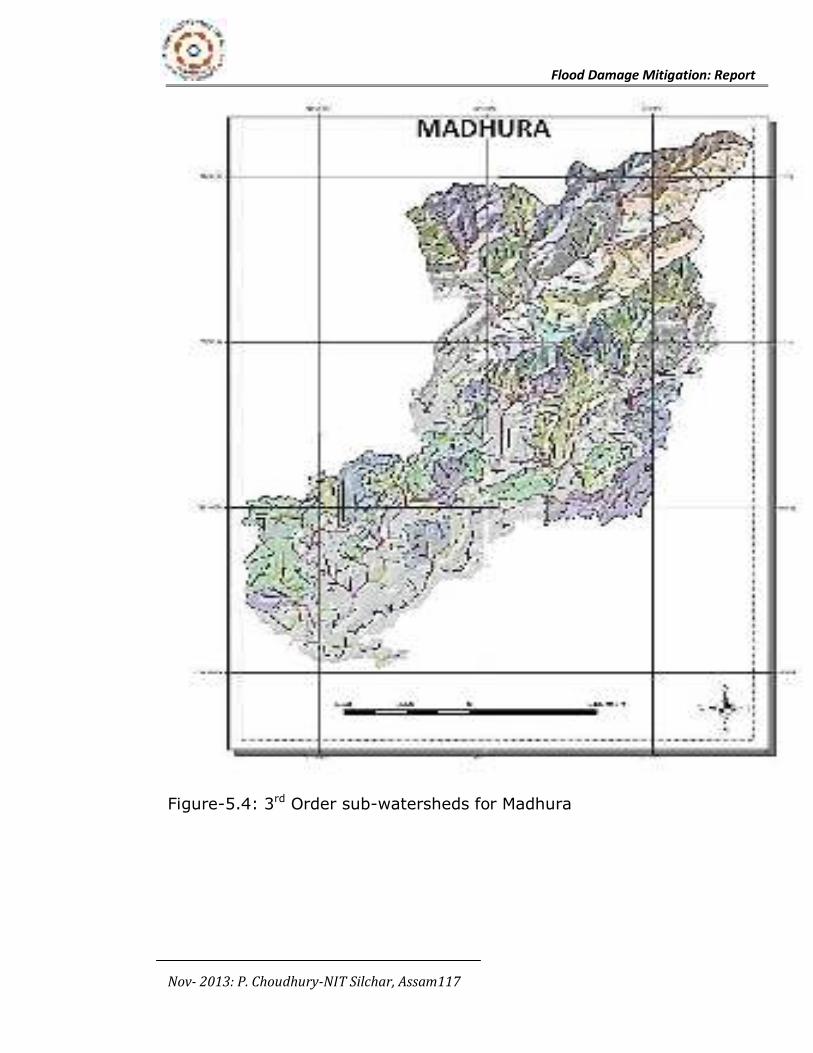
Flood Damage Mitigation: Report
Nov- 2013: P. Choudhury-NIT Silchar, Assam117
Figure-5.4: 3rd Order sub-watersheds for Madhura
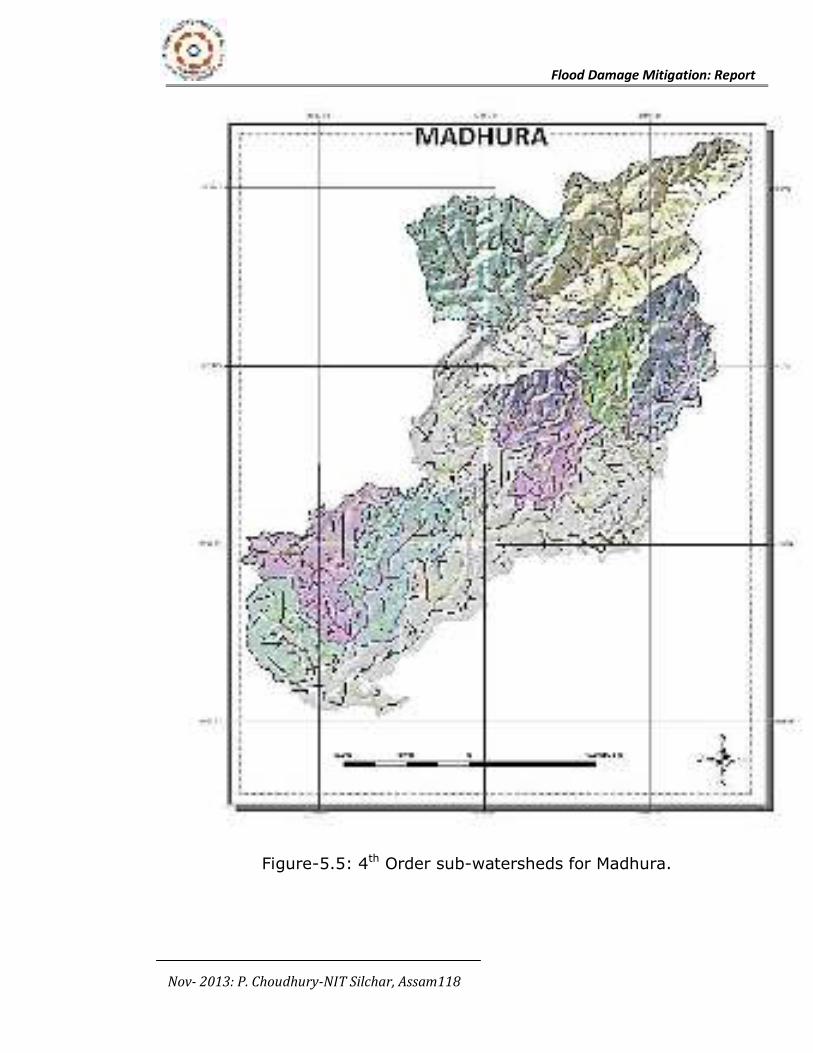
Flood Damage Mitigation: Report
Nov- 2013: P. Choudhury-NIT Silchar, Assam118
Figure-5.5: 4th Order sub-watersheds for Madhura.
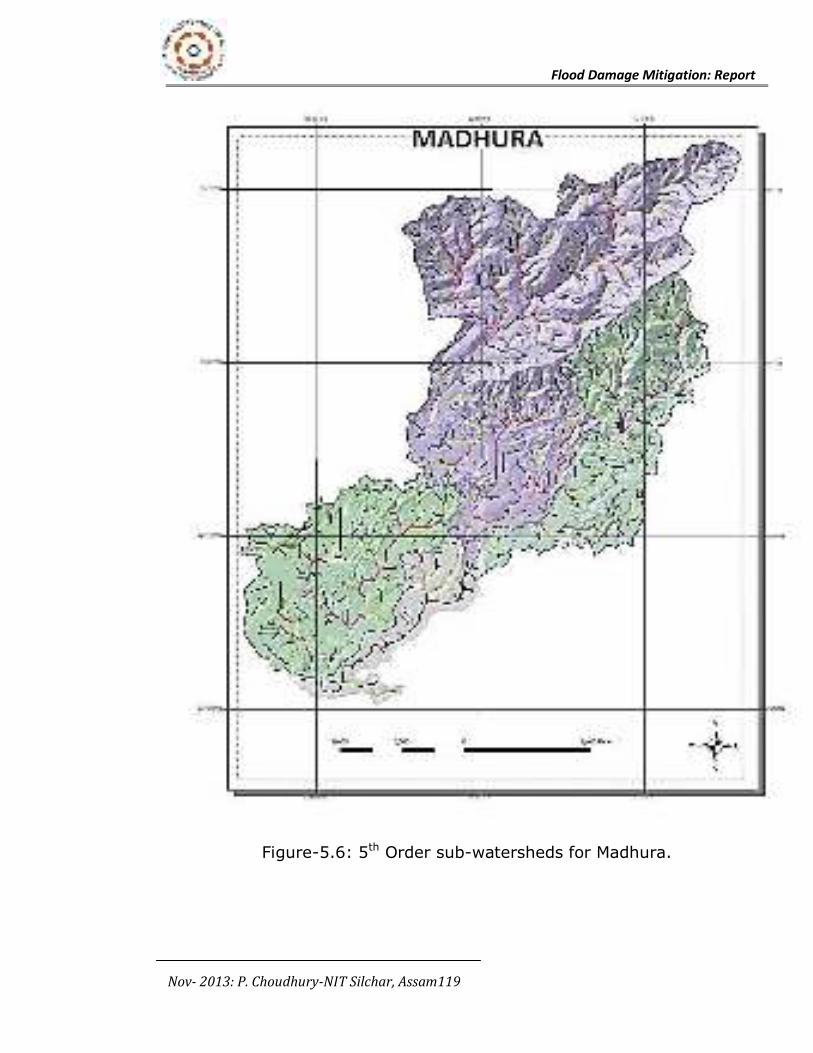
Flood Damage Mitigation: Report
Nov- 2013: P. Choudhury-NIT Silchar, Assam119
Figure-5.6: 5th Order sub-watersheds for Madhura.
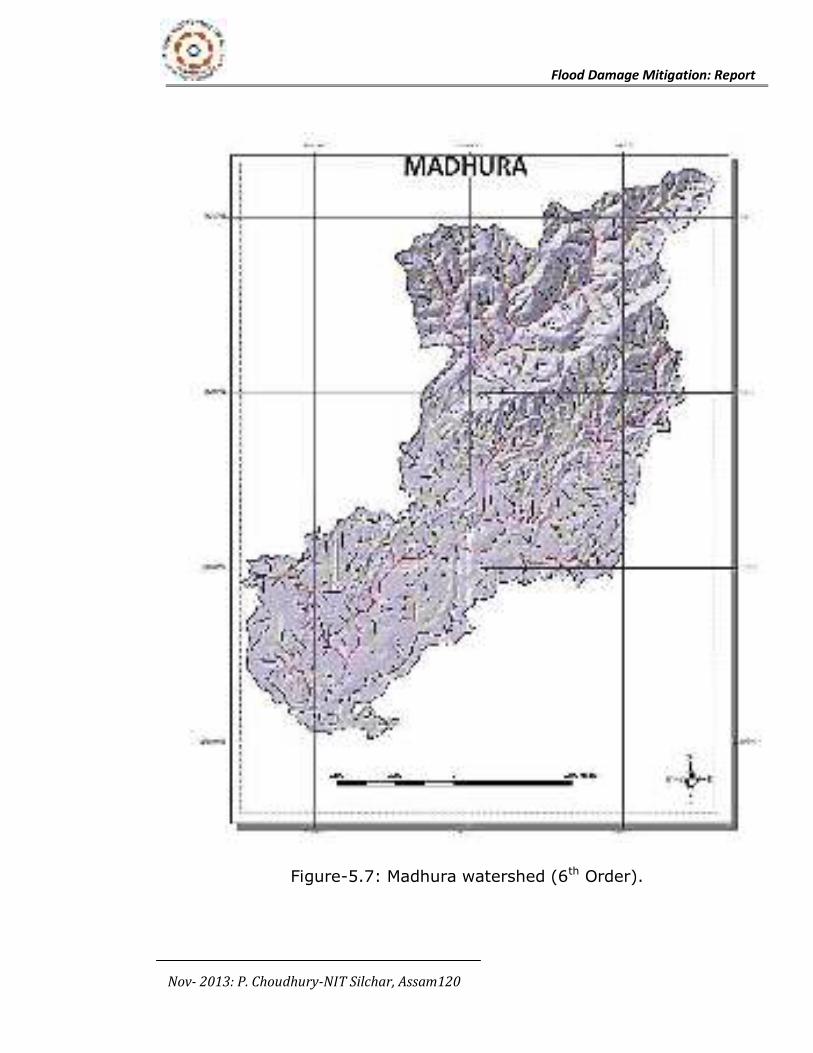
Flood Damage Mitigation: Report
Nov- 2013: P. Choudhury-NIT Silchar, Assam120
Figure-5.7: Madhura watershed (6th Order).
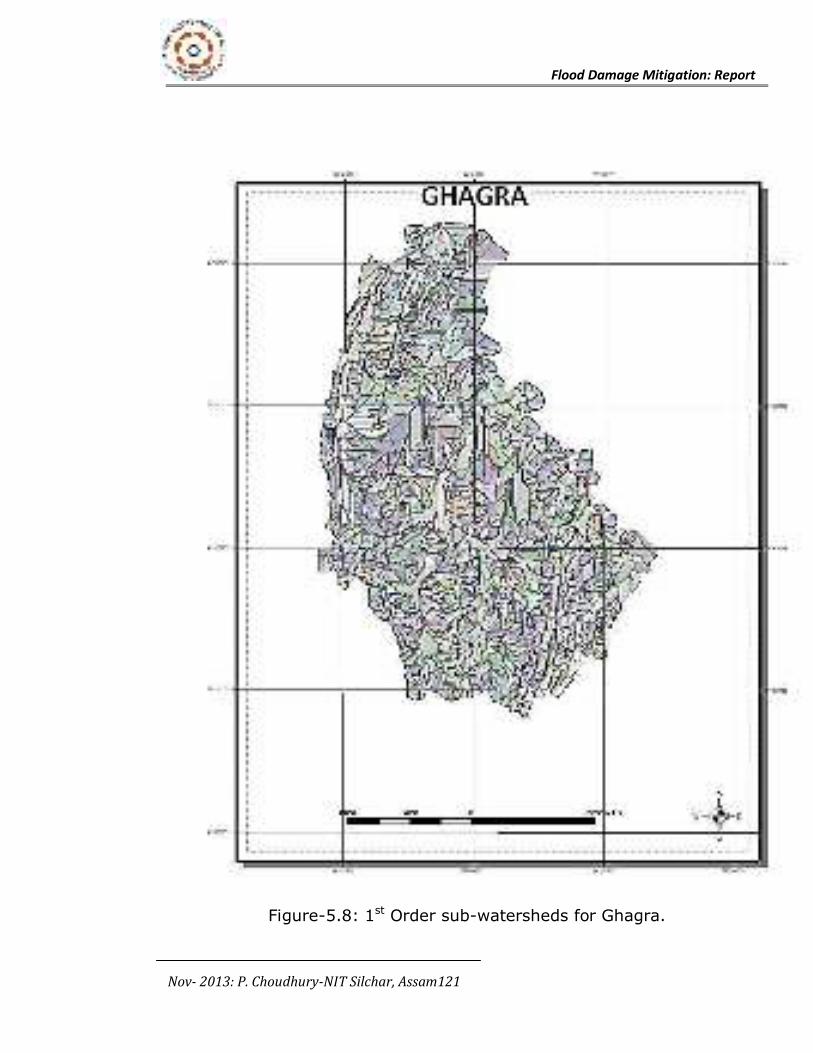
Flood Damage Mitigation: Report
Nov- 2013: P. Choudhury-NIT Silchar, Assam121
Figure-5.8: 1st Order sub-watersheds for Ghagra.
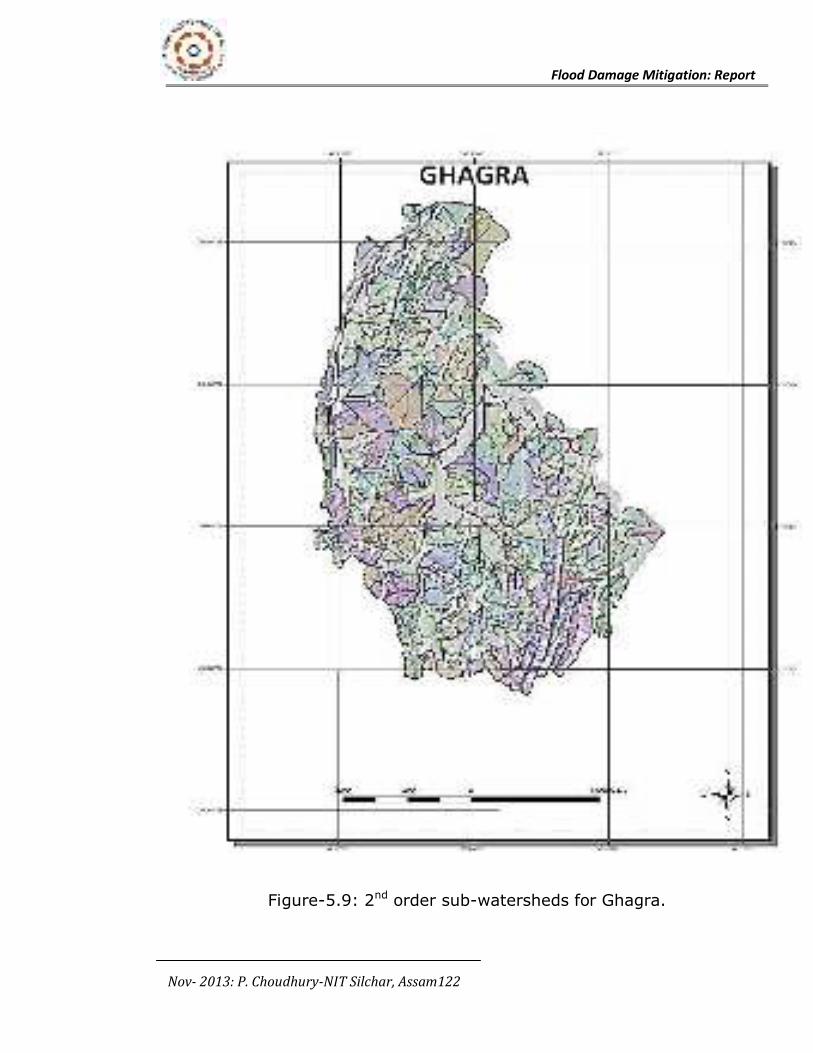
Flood Damage Mitigation: Report
Nov- 2013: P. Choudhury-NIT Silchar, Assam122
Figure-5.9: 2nd order sub-watersheds for Ghagra.
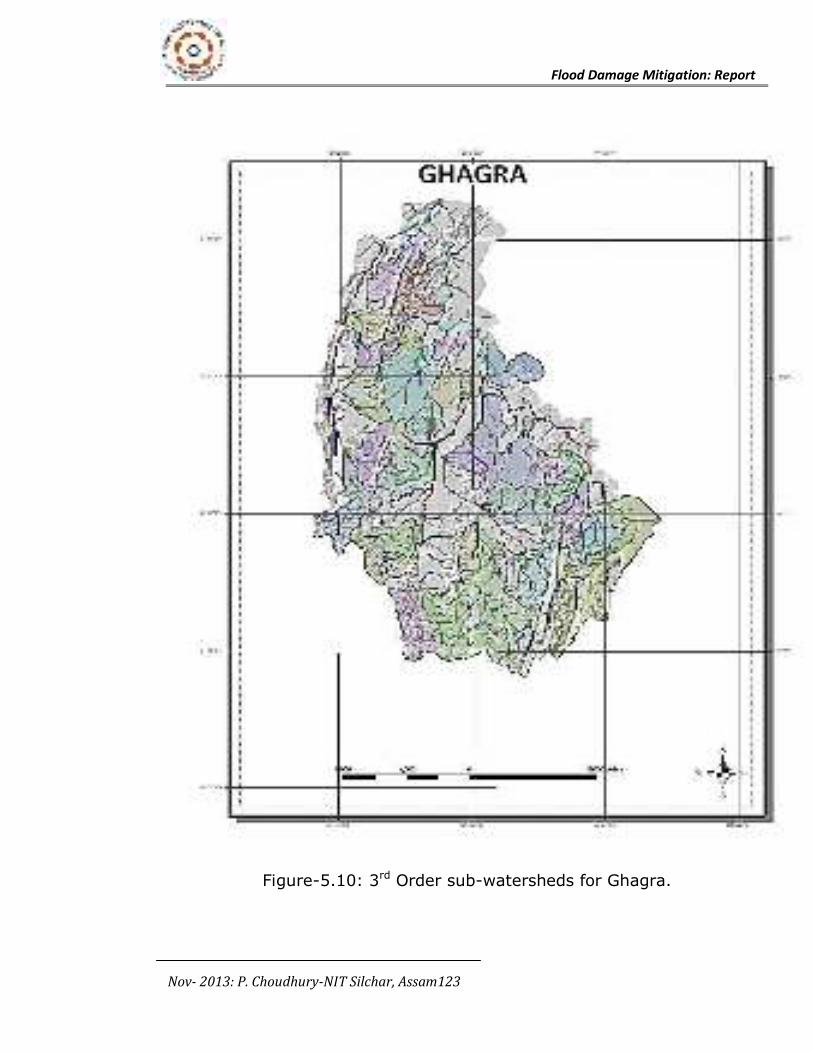
Flood Damage Mitigation: Report
Nov- 2013: P. Choudhury-NIT Silchar, Assam123
Figure-5.10: 3rd Order sub-watersheds for Ghagra.
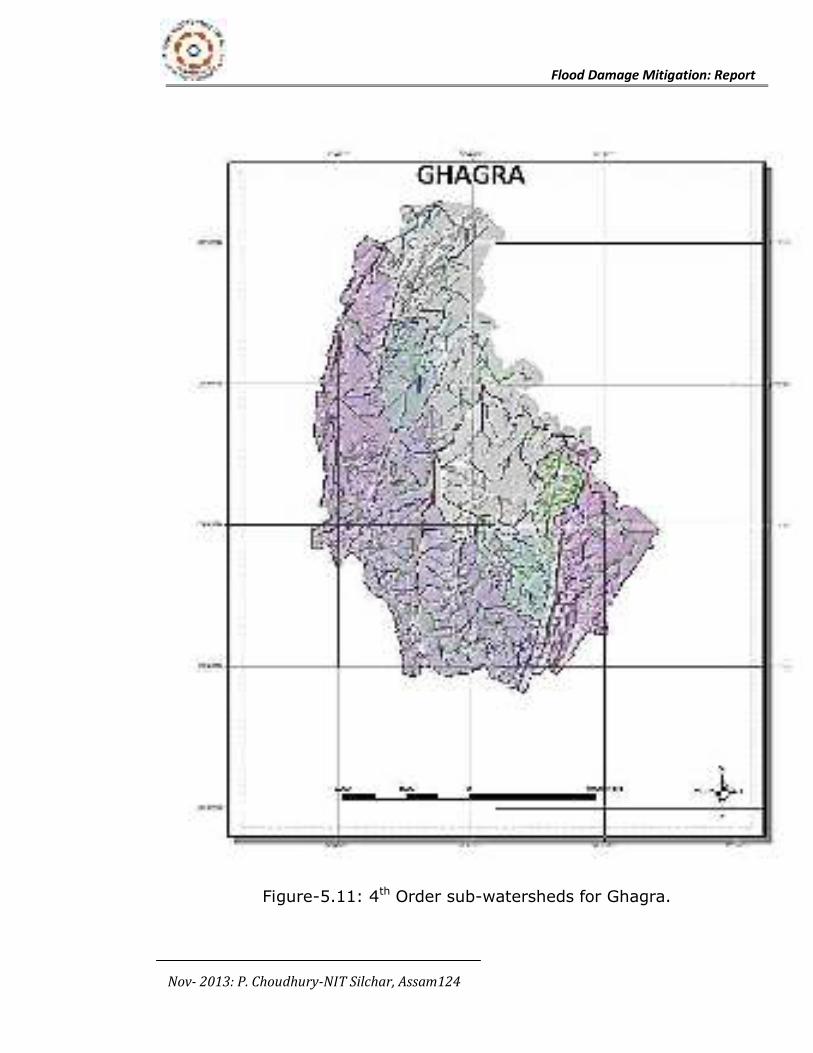
Flood Damage Mitigation: Report
Nov- 2013: P. Choudhury-NIT Silchar, Assam124
Figure-5.11: 4th Order sub-watersheds for Ghagra.
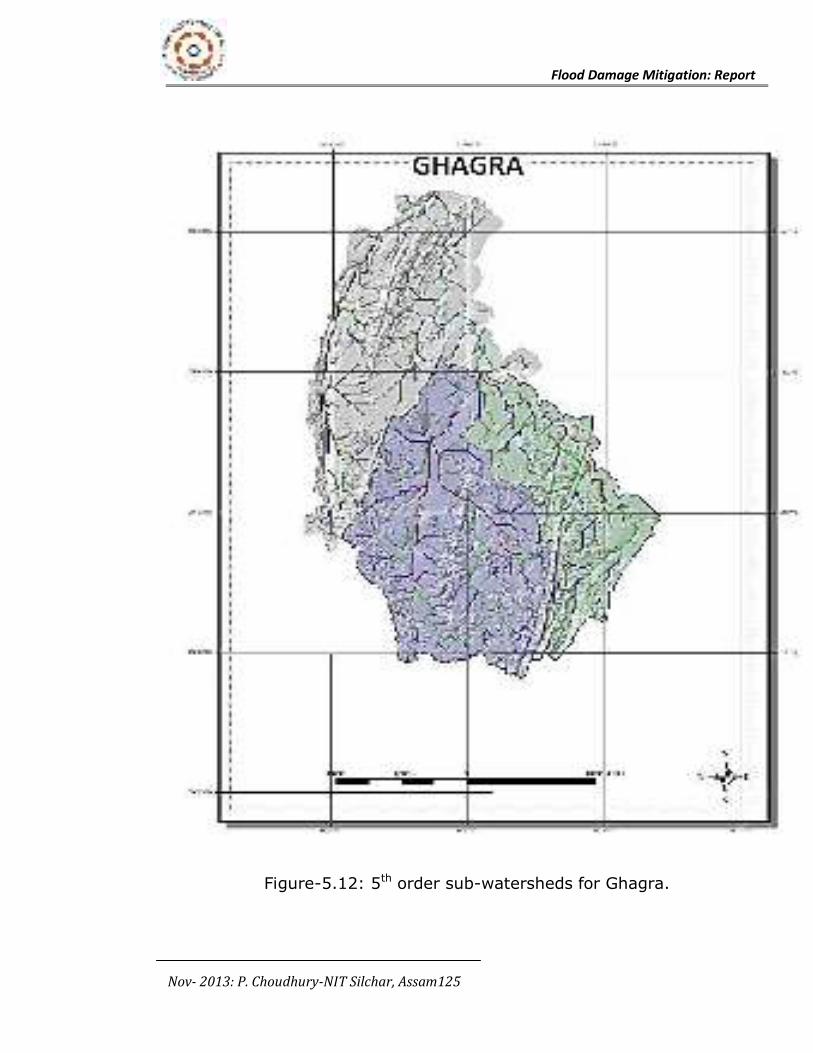
Flood Damage Mitigation: Report
Nov- 2013: P. Choudhury-NIT Silchar, Assam125
Figure-5.12: 5th order sub-watersheds for Ghagra.
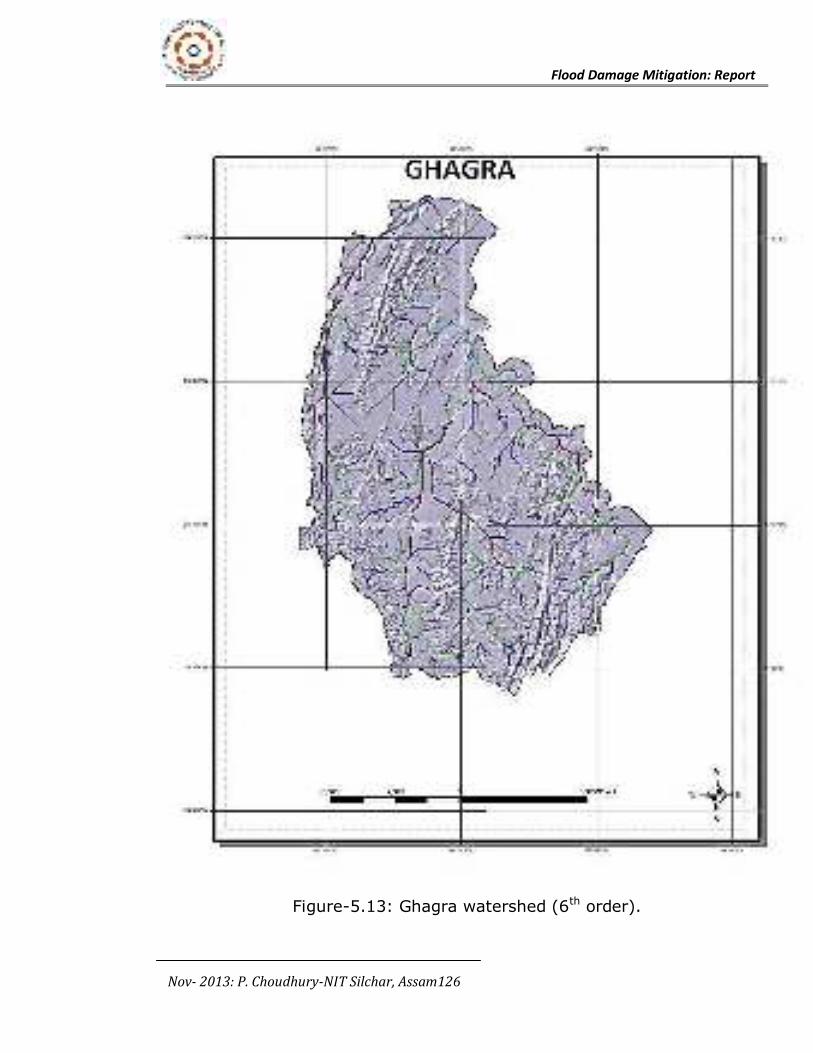
Flood Damage Mitigation: Report
Nov- 2013: P. Choudhury-NIT Silchar, Assam126
Figure-5.13: Ghagra watershed (6th order).
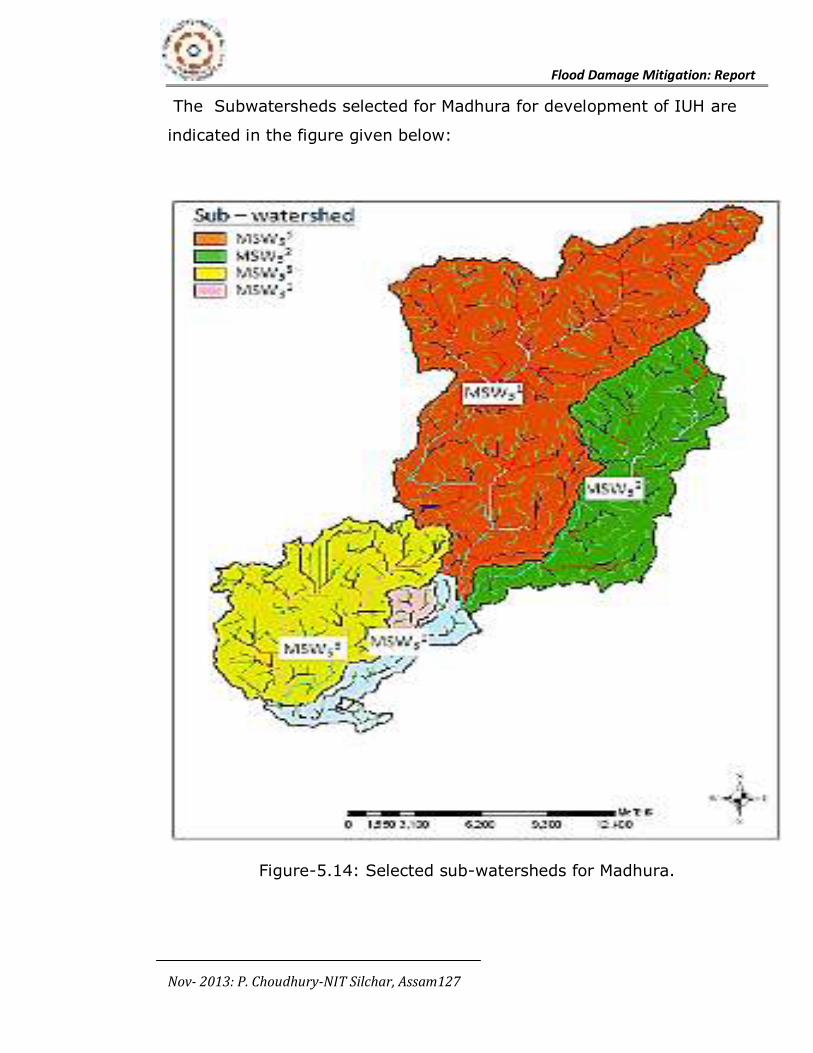
Flood Damage Mitigation: Report
Nov- 2013: P. Choudhury-NIT Silchar, Assam127
The Subwatersheds selected for Madhura for development of IUH are
indicated in the figure given below:
Figure-5.14: Selected sub-watersheds for Madhura.
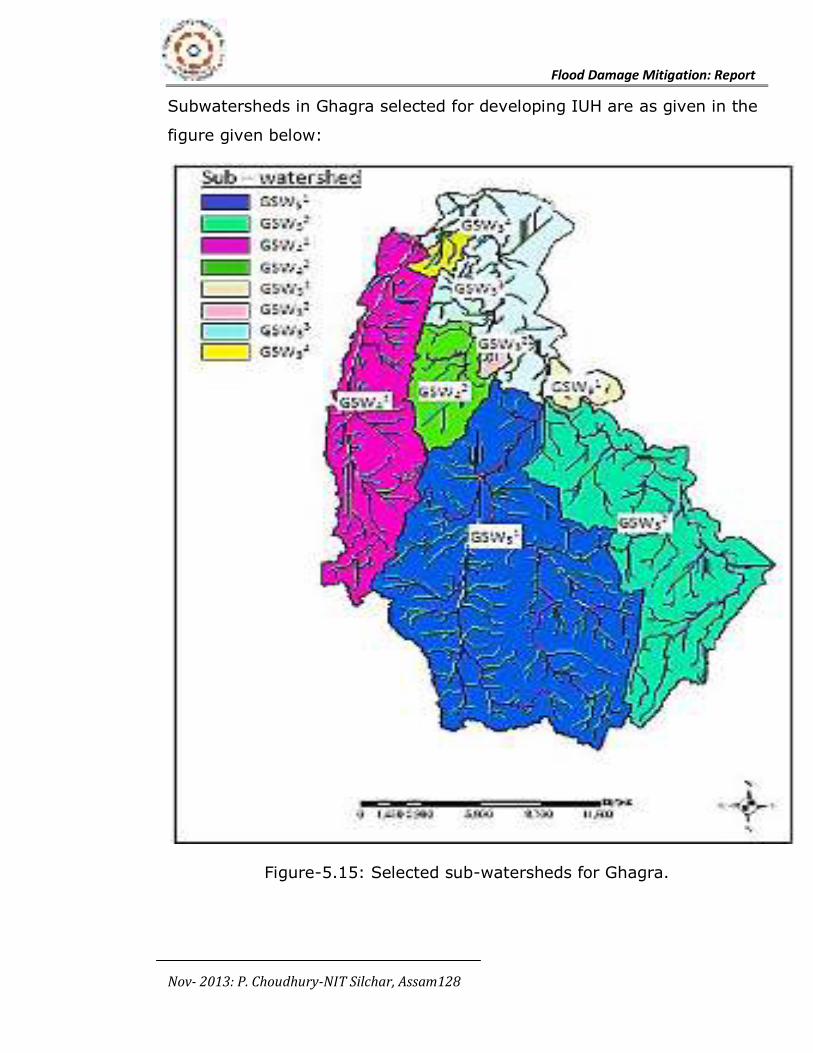
Flood Damage Mitigation: Report
Nov- 2013: P. Choudhury-NIT Silchar, Assam128
Subwatersheds in Ghagra selected for developing IUH are as given in the
figure given below:
Figure-5.15: Selected sub-watersheds for Ghagra.
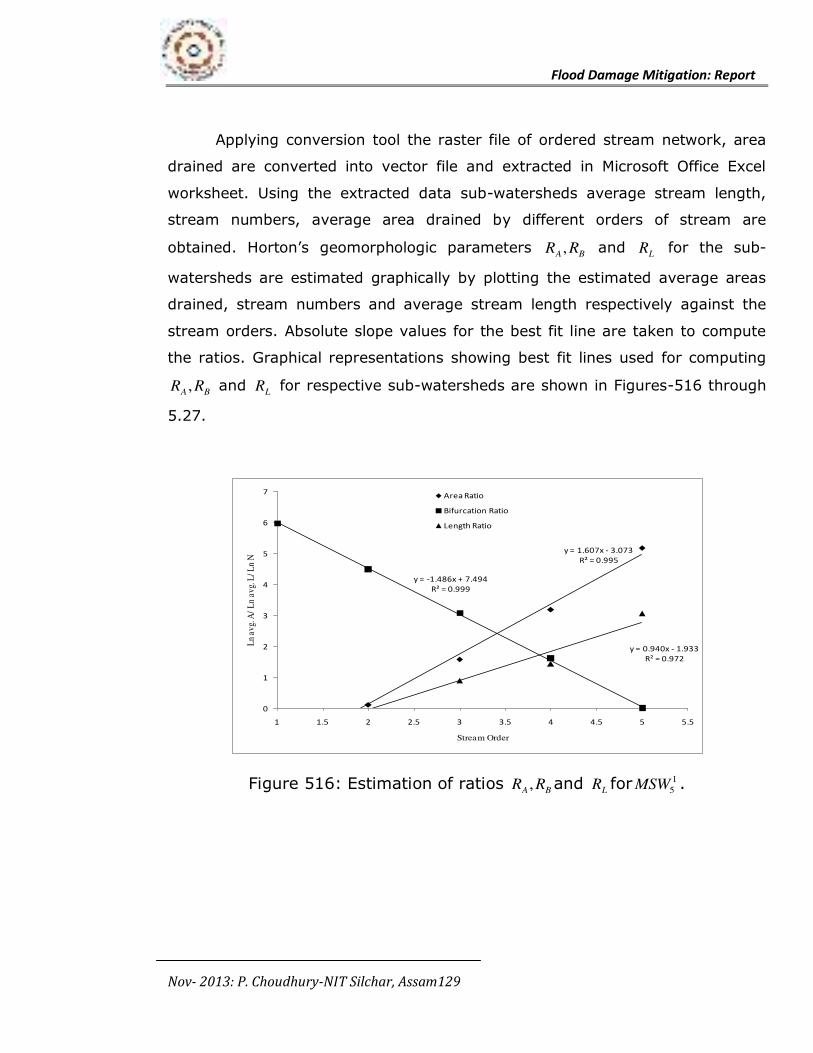
Flood Damage Mitigation: Report
Nov- 2013: P. Choudhury-NIT Silchar, Assam129
Applying conversion tool the raster file of ordered stream network, area
drained are converted into vector file and extracted in Microsoft Office Excel
worksheet. Using the extracted data sub-watersheds average stream length,
stream numbers, average area drained by different orders of stream are
obtained. Horton’s geomorphologic parameters BA RR , and
LR for the sub-
watersheds are estimated graphically by plotting the estimated average areas
drained, stream numbers and average stream length respectively against the
stream orders. Absolute slope values for the best fit line are taken to compute
the ratios. Graphical representations showing best fit lines used for computing
BA RR , and LR for respective sub-watersheds are shown in Figures-516 through
5.27.
Figure 516: Estimation of ratios BA RR , and LR for 1
5MSW .
y = 1.607x - 3.073
R² = 0.995
y = -1.486x + 7.494
R² = 0.999
y = 0.940x - 1.933
R² = 0.972
0
1
2
3
4
5
6
7
1 1.5 2 2.5 3 3.5 4 4.5 5 5.5
Ln
av
g. A
/ L
n a
vg.
L/
Ln
N
Stream Order
Area Ratio
Bifurcation Ratio
Length Ratio
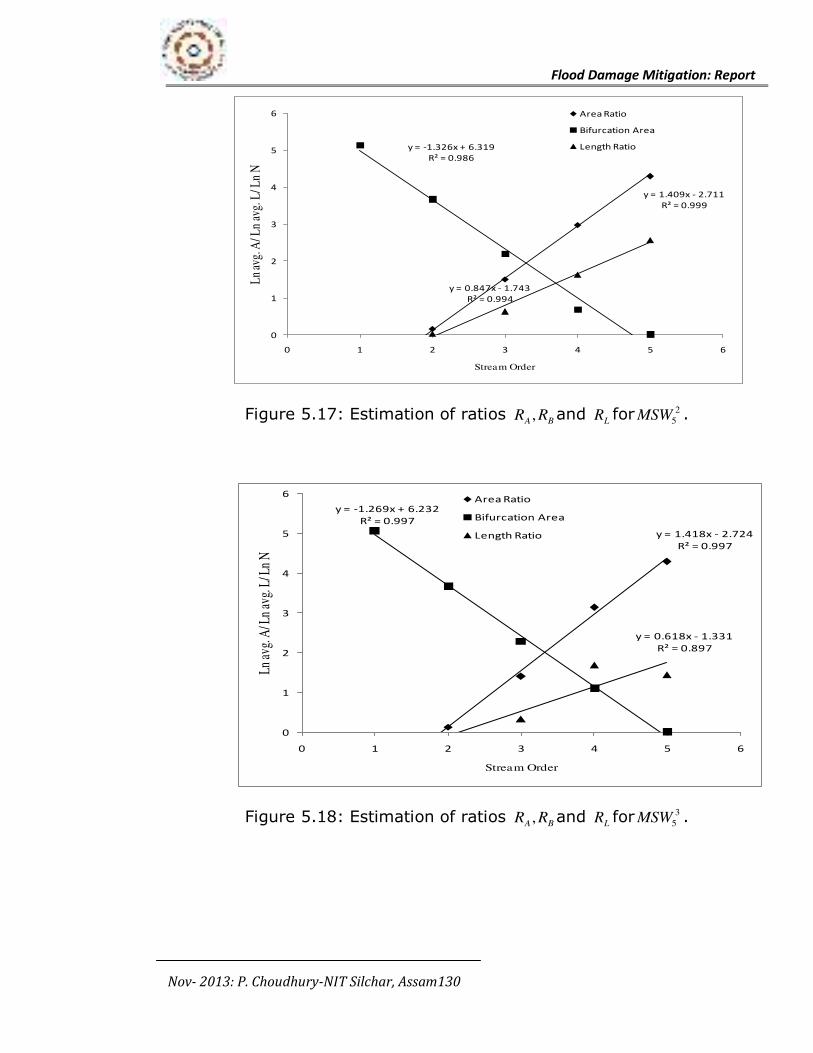
Flood Damage Mitigation: Report
Nov- 2013: P. Choudhury-NIT Silchar, Assam130
Figure 5.17: Estimation of ratios BA RR , and
LR for 2
5MSW .
Figure 5.18: Estimation of ratios BA RR , and LR for 3
5MSW .
y = 1.409x - 2.711
R² = 0.999
y = -1.326x + 6.319
R² = 0.986
y = 0.847x - 1.743
R² = 0.994
0
1
2
3
4
5
6
0 1 2 3 4 5 6
Ln
avg.
A/ L
n av
g. L
/ Ln
N
Stream Order
Area Ratio
Bifurcation Area
Length Ratio
y = 1.418x - 2.724
R² = 0.997
y = -1.269x + 6.232
R² = 0.997
y = 0.618x - 1.331
R² = 0.897
0
1
2
3
4
5
6
0 1 2 3 4 5 6
Ln a
vg. A
/ Ln
avg.
L/ L
n N
Stream Order
Area Ratio
Bifurcation Area
Length Ratio
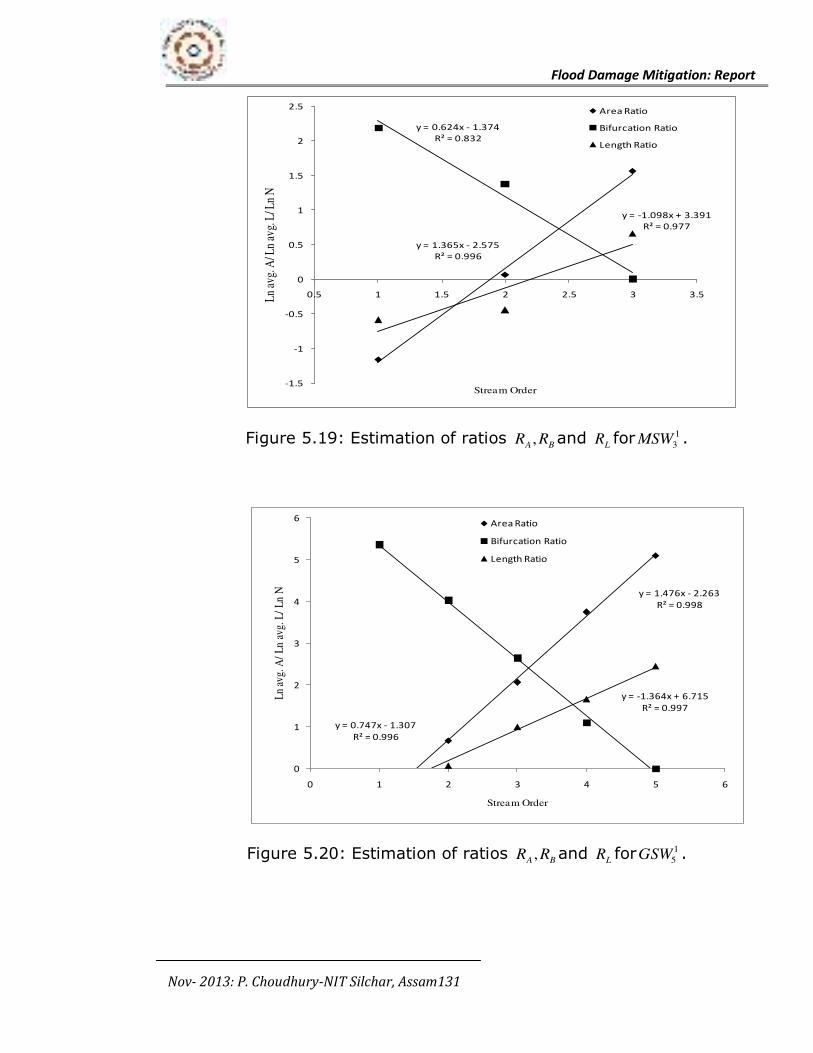
Flood Damage Mitigation: Report
Nov- 2013: P. Choudhury-NIT Silchar, Assam131
Figure 5.19: Estimation of ratios BA RR , and
LR for 1
3MSW .
Figure 5.20: Estimation of ratios BA RR , and LR for 1
5GSW .
y = 1.365x - 2.575
R² = 0.996
y = -1.098x + 3.391
R² = 0.977
y = 0.624x - 1.374
R² = 0.832
-1.5
-1
-0.5
0
0.5
1
1.5
2
2.5
0.5 1 1.5 2 2.5 3 3.5Ln
avg.
A/ L
n av
g. L
/ Ln
N
Stream Order
Area Ratio
Bifurcation Ratio
Length Ratio
y = 1.476x - 2.263
R² = 0.998
y = -1.364x + 6.715
R² = 0.997
y = 0.747x - 1.307
R² = 0.996
0
1
2
3
4
5
6
0 1 2 3 4 5 6
Ln
avg.
A/
Ln
avg.
L/
Ln
N
Stream Order
Area Ratio
Bifurcation Ratio
Length Ratio
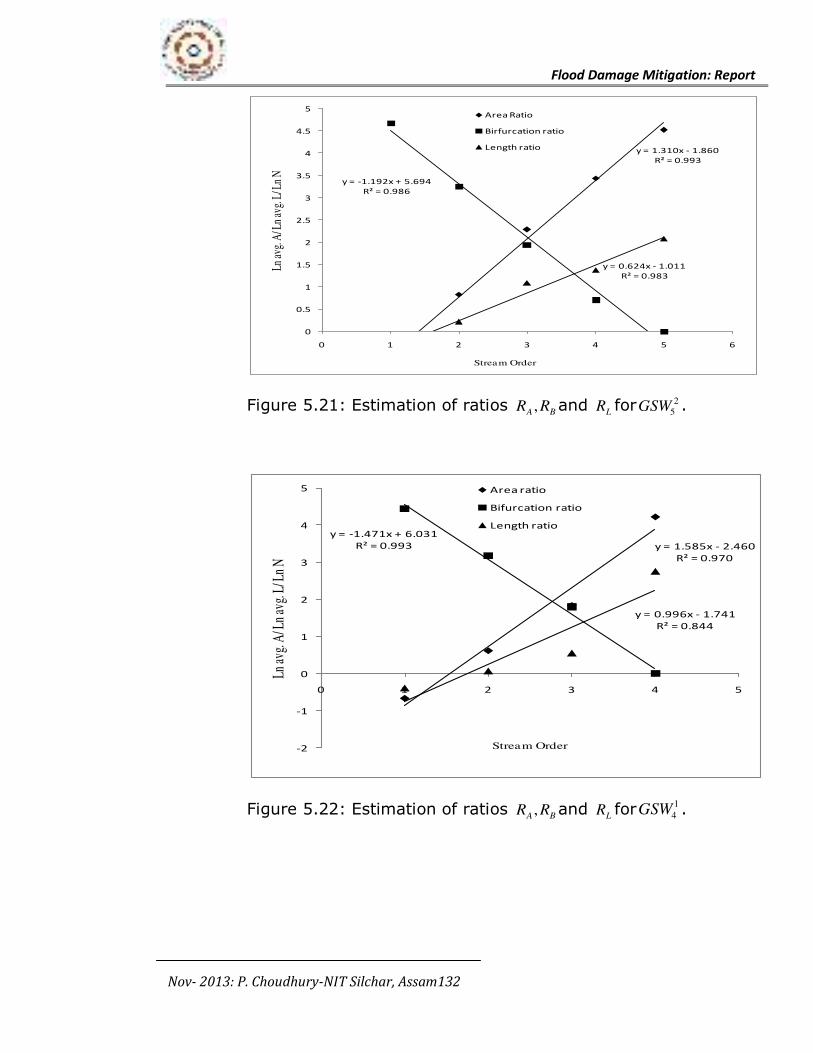
Flood Damage Mitigation: Report
Nov- 2013: P. Choudhury-NIT Silchar, Assam132
Figure 5.21: Estimation of ratios BA RR , and LR for 2
5GSW .
Figure 5.22: Estimation of ratios BA RR , and LR for1
4GSW .
y = 1.310x - 1.860
R² = 0.993
y = -1.192x + 5.694
R² = 0.986
y = 0.624x - 1.011
R² = 0.983
0
0.5
1
1.5
2
2.5
3
3.5
4
4.5
5
0 1 2 3 4 5 6
Ln a
vg. A
/ Ln
avg.
L/ L
n N
Stream Order
Area Ratio
Birfurcation ratio
Length ratio
y = 1.585x - 2.460
R² = 0.970
y = -1.471x + 6.031
R² = 0.993
y = 0.996x - 1.741
R² = 0.844
-2
-1
0
1
2
3
4
5
0 1 2 3 4 5
Ln a
vg. A
/ Ln
avg.
L/ L
n N
Stream Order
Area ratio
Bifurcation ratio
Length ratio
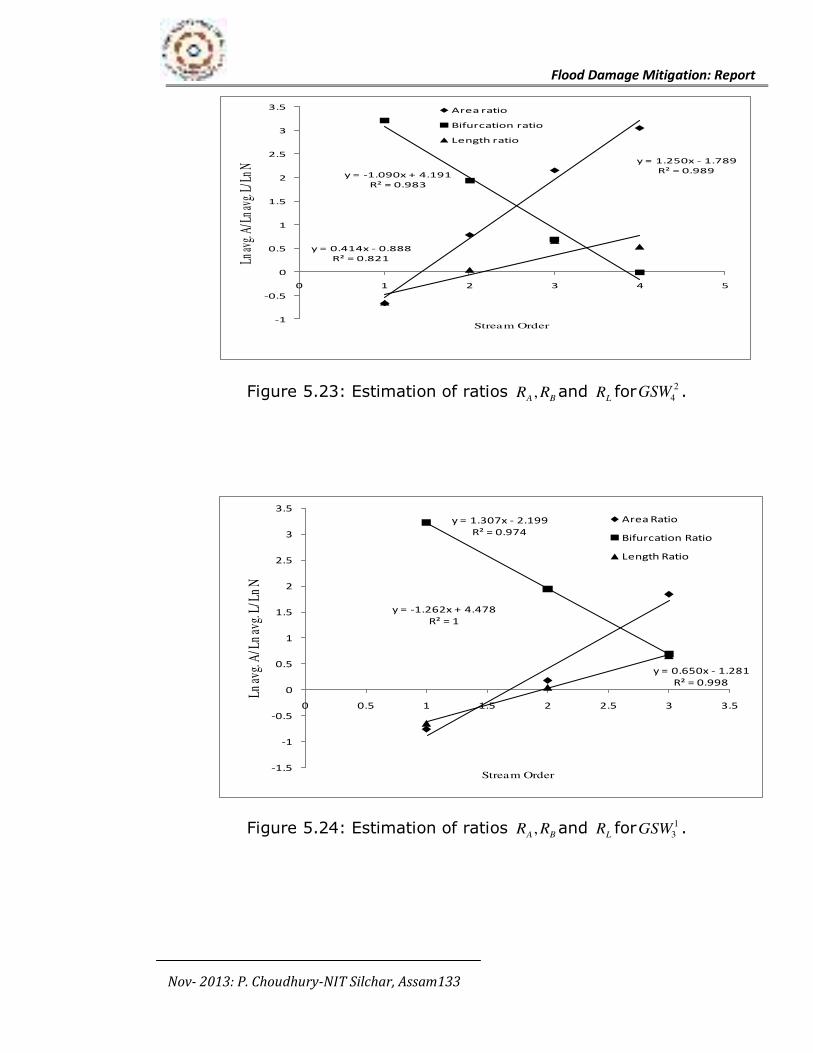
Flood Damage Mitigation: Report
Nov- 2013: P. Choudhury-NIT Silchar, Assam133
Figure 5.23: Estimation of ratios BA RR , and
LR for 2
4GSW .
Figure 5.24: Estimation of ratios BA RR , and LR for 1
3GSW .
y = 1.250x - 1.789
R² = 0.989y = -1.090x + 4.191
R² = 0.983
y = 0.414x - 0.888
R² = 0.821
-1
-0.5
0
0.5
1
1.5
2
2.5
3
3.5
0 1 2 3 4 5
Ln av
g. A/
Ln a
vg. L
/ Ln N
Stream Order
Area ratio
Bifurcation ratio
Length ratio
y = 1.307x - 2.199
R² = 0.974
y = -1.262x + 4.478
R² = 1
y = 0.650x - 1.281
R² = 0.998
-1.5
-1
-0.5
0
0.5
1
1.5
2
2.5
3
3.5
0 0.5 1 1.5 2 2.5 3 3.5
Ln a
vg. A
/ Ln
avg.
L/ L
n N
Stream Order
Area Ratio
Bifurcation Ratio
Length Ratio
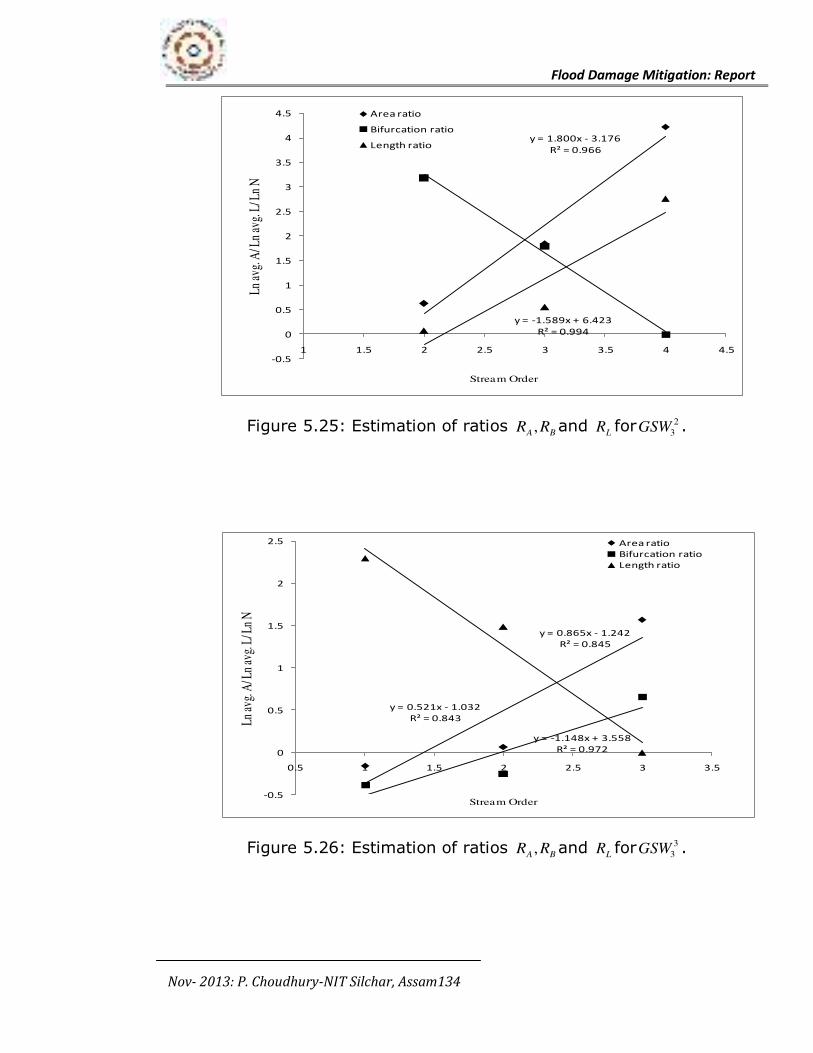
Flood Damage Mitigation: Report
Nov- 2013: P. Choudhury-NIT Silchar, Assam134
Figure 5.25: Estimation of ratios BA RR , and LR for 2
3GSW .
Figure 5.26: Estimation of ratios BA RR , and LR for 3
3GSW .
y = 1.800x - 3.176
R² = 0.966
y = -1.589x + 6.423
R² = 0.994
-0.5
0
0.5
1
1.5
2
2.5
3
3.5
4
4.5
1 1.5 2 2.5 3 3.5 4 4.5
Ln a
vg. A
/ Ln
avg.
L/ L
n N
Stream Order
Area ratio
Bifurcation ratio
Length ratio
y = 0.865x - 1.242
R² = 0.845
y = 0.521x - 1.032
R² = 0.843
y = -1.148x + 3.558
R² = 0.972
-0.5
0
0.5
1
1.5
2
2.5
0.5 1 1.5 2 2.5 3 3.5
Ln a
vg. A
/ Ln
avg.
L/ L
n N
Stream Order
Area ratio
Bifurcation ratio
Length ratio
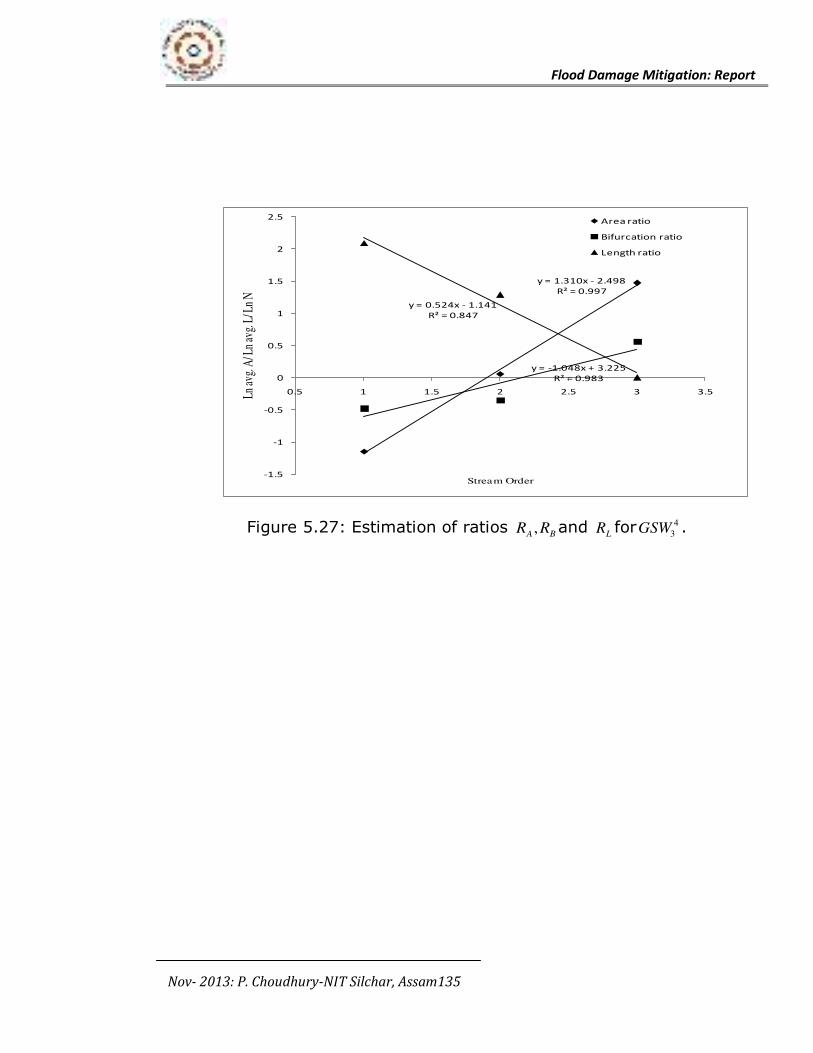
Flood Damage Mitigation: Report
Nov- 2013: P. Choudhury-NIT Silchar, Assam135
Figure 5.27: Estimation of ratios BA RR , and LR for 4
3GSW .
y = 1.310x - 2.498
R² = 0.997
y = 0.524x - 1.141
R² = 0.847
y = -1.048x + 3.225
R² = 0.983
-1.5
-1
-0.5
0
0.5
1
1.5
2
2.5
0.5 1 1.5 2 2.5 3 3.5Ln a
vg. A
/ Ln
avg.
L/ L
n N
Stream Order
Area ratio
Bifurcation ratio
Length ratio
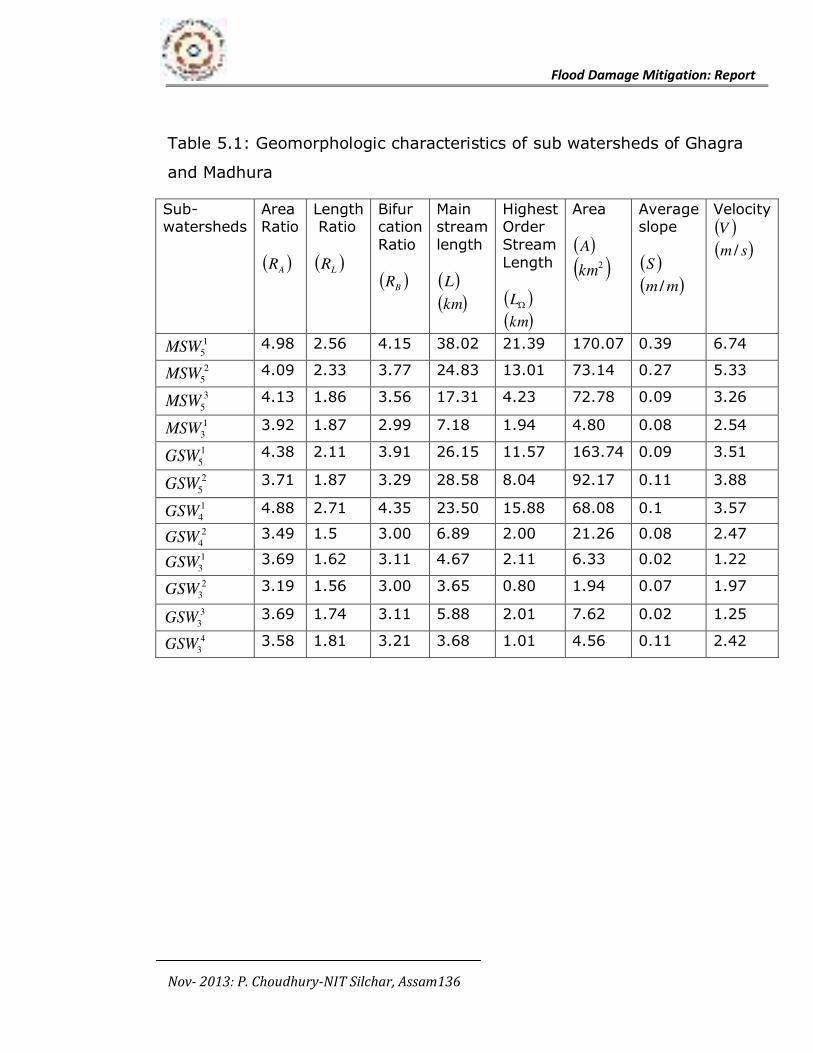
Flood Damage Mitigation: Report
Nov- 2013: P. Choudhury-NIT Silchar, Assam136
Table 5.1: Geomorphologic characteristics of sub watersheds of Ghagra
and Madhura
Sub-watersheds
Area Ratio
AR
Length Ratio
LR
Bifur cation
Ratio
BR
Main stream
length
L
km
Highest Order
Stream
Length
L
km
Area
A
2km
Average slope
S
mm /
Velocity
V
sm /
1
5MSW 4.98 2.56 4.15 38.02 21.39 170.07 0.39 6.74
2
5MSW 4.09 2.33 3.77 24.83 13.01 73.14 0.27 5.33
3
5MSW 4.13 1.86 3.56 17.31 4.23 72.78 0.09 3.26
1
3MSW 3.92 1.87 2.99 7.18 1.94 4.80 0.08 2.54
1
5GSW 4.38 2.11 3.91 26.15 11.57 163.74 0.09 3.51
2
5GSW 3.71 1.87 3.29 28.58 8.04 92.17 0.11 3.88
1
4GSW 4.88 2.71 4.35 23.50 15.88 68.08 0.1 3.57
2
4GSW 3.49 1.5 3.00 6.89 2.00 21.26 0.08 2.47
1
3GSW 3.69 1.62 3.11 4.67 2.11 6.33 0.02 1.22
2
3GSW 3.19 1.56 3.00 3.65 0.80 1.94 0.07 1.97
3
3GSW 3.69 1.74 3.11 5.88 2.01 7.62 0.02 1.25
4
3GSW 3.58 1.81 3.21 3.68 1.01 4.56 0.11 2.42
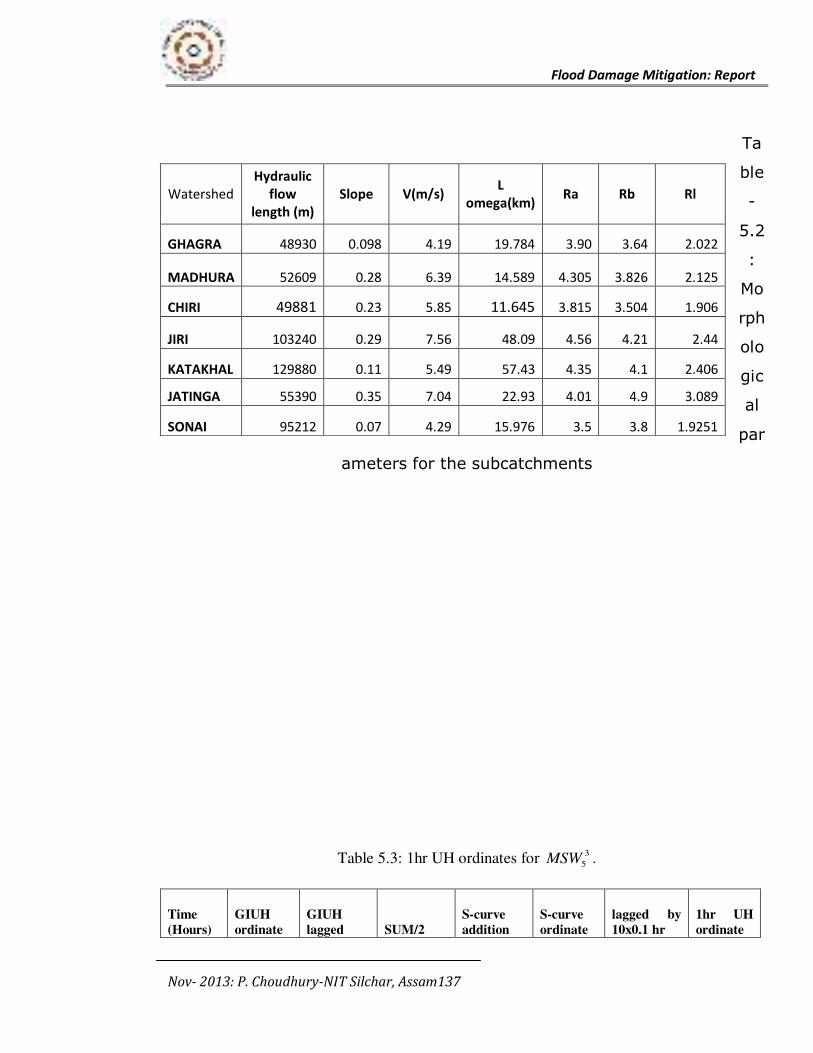
Flood Damage Mitigation: Report
Nov- 2013: P. Choudhury-NIT Silchar, Assam137
Ta
ble
-
5.2
:
Mo
rph
olo
gic
al
par
ameters for the subcatchments
Table 5.3: 1hr UH ordinates for 3
5MSW .
Time
(Hours)
GIUH
ordinate
GIUH
lagged SUM/2
S-curve
addition
S-curve
ordinate
lagged by
10x0.1 hr
1hr UH
ordinate
Watershed
Hydraulic
flow
length (m)
Slope V(m/s) L
omega(km) Ra Rb Rl
GHAGRA 48930 0.098 4.19 19.784 3.90 3.64 2.022
MADHURA 52609 0.28 6.39 14.589 4.305 3.826 2.125
CHIRI 49881 0.23 5.85 11.645 3.815 3.504 1.906
JIRI 103240 0.29 7.56 48.09 4.56 4.21 2.44
KATAKHAL 129880 0.11 5.49 57.43 4.35 4.1 2.406
JATINGA 55390 0.35 7.04 22.93 4.01 4.9 3.089
SONAI 95212 0.07 4.29 15.976 3.5 3.8 1.9251
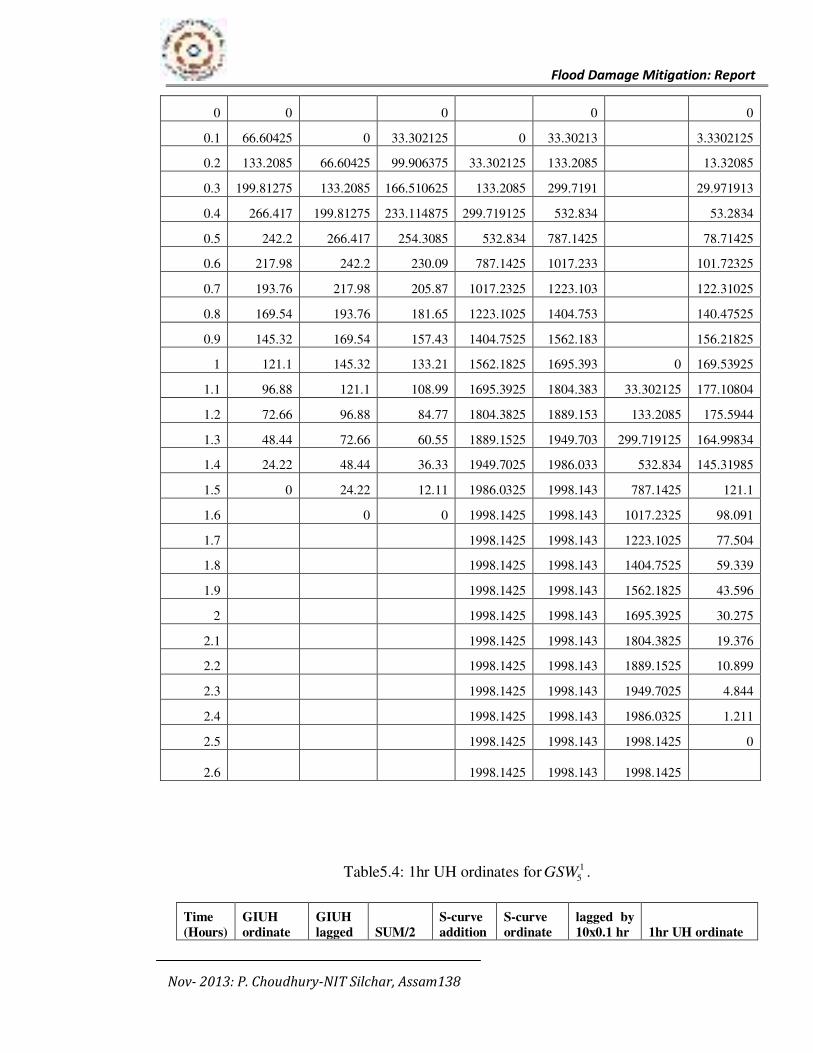
Flood Damage Mitigation: Report
Nov- 2013: P. Choudhury-NIT Silchar, Assam138
0 0
0
0
0
0.1 66.60425 0 33.302125 0 33.30213
3.3302125
0.2 133.2085 66.60425 99.906375 33.302125 133.2085
13.32085
0.3 199.81275 133.2085 166.510625 133.2085 299.7191
29.971913
0.4 266.417 199.81275 233.114875 299.719125 532.834
53.2834
0.5 242.2 266.417 254.3085 532.834 787.1425
78.71425
0.6 217.98 242.2 230.09 787.1425 1017.233
101.72325
0.7 193.76 217.98 205.87 1017.2325 1223.103
122.31025
0.8 169.54 193.76 181.65 1223.1025 1404.753
140.47525
0.9 145.32 169.54 157.43 1404.7525 1562.183
156.21825
1 121.1 145.32 133.21 1562.1825 1695.393 0 169.53925
1.1 96.88 121.1 108.99 1695.3925 1804.383 33.302125 177.10804
1.2 72.66 96.88 84.77 1804.3825 1889.153 133.2085 175.5944
1.3 48.44 72.66 60.55 1889.1525 1949.703 299.719125 164.99834
1.4 24.22 48.44 36.33 1949.7025 1986.033 532.834 145.31985
1.5 0 24.22 12.11 1986.0325 1998.143 787.1425 121.1
1.6
0 0 1998.1425 1998.143 1017.2325 98.091
1.7
1998.1425 1998.143 1223.1025 77.504
1.8
1998.1425 1998.143 1404.7525 59.339
1.9
1998.1425 1998.143 1562.1825 43.596
2
1998.1425 1998.143 1695.3925 30.275
2.1
1998.1425 1998.143 1804.3825 19.376
2.2
1998.1425 1998.143 1889.1525 10.899
2.3
1998.1425 1998.143 1949.7025 4.844
2.4
1998.1425 1998.143 1986.0325 1.211
2.5
1998.1425 1998.143 1998.1425 0
2.6
1998.1425 1998.143 1998.1425
Table5.4: 1hr UH ordinates for 1
5GSW .
Time
(Hours)
GIUH
ordinate
GIUH
lagged SUM/2
S-curve
addition
S-curve
ordinate
lagged by
10x0.1 hr 1hr UH ordinate
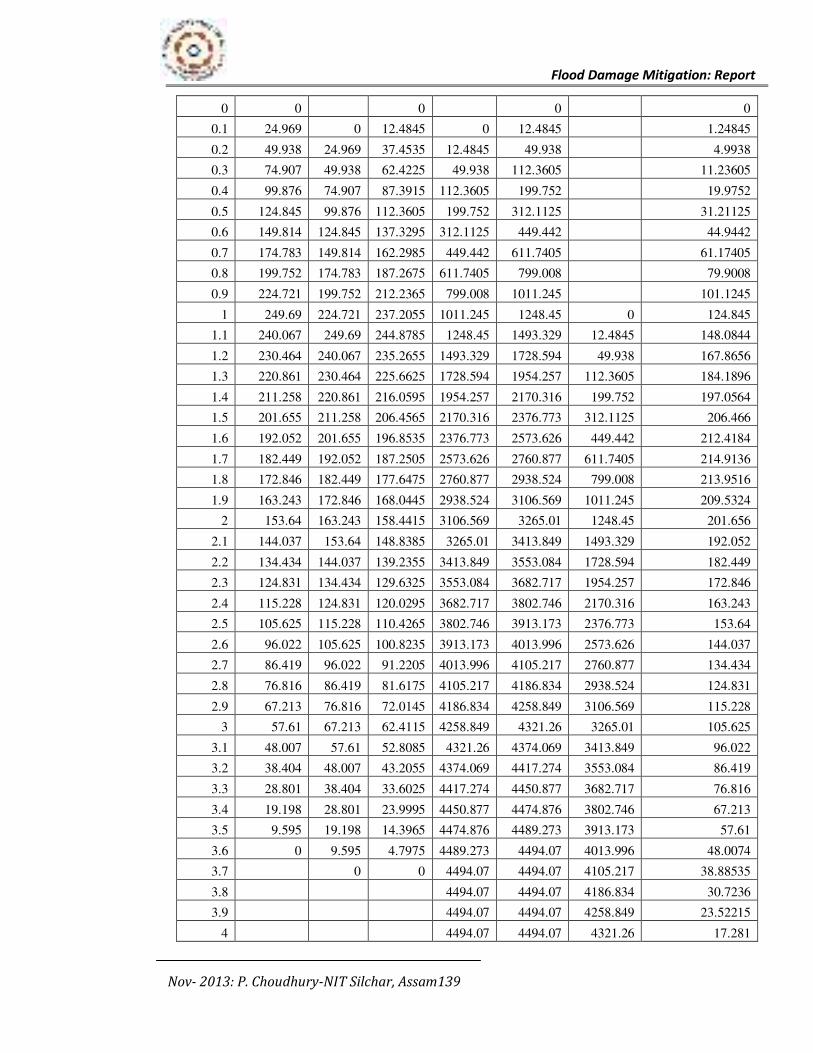
Flood Damage Mitigation: Report
Nov- 2013: P. Choudhury-NIT Silchar, Assam139
0 0
0
0
0
0.1 24.969 0 12.4845 0 12.4845
1.24845
0.2 49.938 24.969 37.4535 12.4845 49.938
4.9938
0.3 74.907 49.938 62.4225 49.938 112.3605
11.23605
0.4 99.876 74.907 87.3915 112.3605 199.752
19.9752
0.5 124.845 99.876 112.3605 199.752 312.1125
31.21125
0.6 149.814 124.845 137.3295 312.1125 449.442
44.9442
0.7 174.783 149.814 162.2985 449.442 611.7405
61.17405
0.8 199.752 174.783 187.2675 611.7405 799.008
79.9008
0.9 224.721 199.752 212.2365 799.008 1011.245
101.1245
1 249.69 224.721 237.2055 1011.245 1248.45 0 124.845
1.1 240.067 249.69 244.8785 1248.45 1493.329 12.4845 148.0844
1.2 230.464 240.067 235.2655 1493.329 1728.594 49.938 167.8656
1.3 220.861 230.464 225.6625 1728.594 1954.257 112.3605 184.1896
1.4 211.258 220.861 216.0595 1954.257 2170.316 199.752 197.0564
1.5 201.655 211.258 206.4565 2170.316 2376.773 312.1125 206.466
1.6 192.052 201.655 196.8535 2376.773 2573.626 449.442 212.4184
1.7 182.449 192.052 187.2505 2573.626 2760.877 611.7405 214.9136
1.8 172.846 182.449 177.6475 2760.877 2938.524 799.008 213.9516
1.9 163.243 172.846 168.0445 2938.524 3106.569 1011.245 209.5324
2 153.64 163.243 158.4415 3106.569 3265.01 1248.45 201.656
2.1 144.037 153.64 148.8385 3265.01 3413.849 1493.329 192.052
2.2 134.434 144.037 139.2355 3413.849 3553.084 1728.594 182.449
2.3 124.831 134.434 129.6325 3553.084 3682.717 1954.257 172.846
2.4 115.228 124.831 120.0295 3682.717 3802.746 2170.316 163.243
2.5 105.625 115.228 110.4265 3802.746 3913.173 2376.773 153.64
2.6 96.022 105.625 100.8235 3913.173 4013.996 2573.626 144.037
2.7 86.419 96.022 91.2205 4013.996 4105.217 2760.877 134.434
2.8 76.816 86.419 81.6175 4105.217 4186.834 2938.524 124.831
2.9 67.213 76.816 72.0145 4186.834 4258.849 3106.569 115.228
3 57.61 67.213 62.4115 4258.849 4321.26 3265.01 105.625
3.1 48.007 57.61 52.8085 4321.26 4374.069 3413.849 96.022
3.2 38.404 48.007 43.2055 4374.069 4417.274 3553.084 86.419
3.3 28.801 38.404 33.6025 4417.274 4450.877 3682.717 76.816
3.4 19.198 28.801 23.9995 4450.877 4474.876 3802.746 67.213
3.5 9.595 19.198 14.3965 4474.876 4489.273 3913.173 57.61
3.6 0 9.595 4.7975 4489.273 4494.07 4013.996 48.0074
3.7
0 0 4494.07 4494.07 4105.217 38.88535
3.8
4494.07 4494.07 4186.834 30.7236
3.9
4494.07 4494.07 4258.849 23.52215
4
4494.07 4494.07 4321.26 17.281
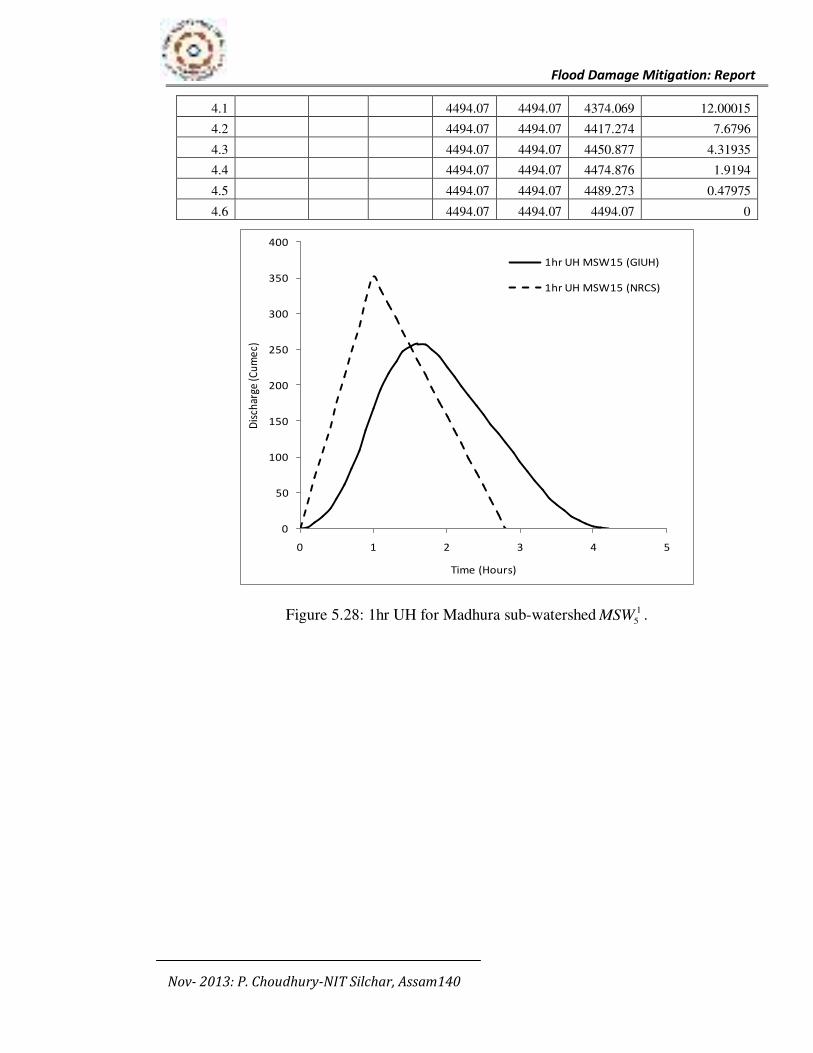
Flood Damage Mitigation: Report
Nov- 2013: P. Choudhury-NIT Silchar, Assam140
4.1
4494.07 4494.07 4374.069 12.00015
4.2
4494.07 4494.07 4417.274 7.6796
4.3
4494.07 4494.07 4450.877 4.31935
4.4
4494.07 4494.07 4474.876 1.9194
4.5
4494.07 4494.07 4489.273 0.47975
4.6
4494.07 4494.07 4494.07 0
Figure 5.28: 1hr UH for Madhura sub-watershed 1
5MSW .
0
50
100
150
200
250
300
350
400
0 1 2 3 4 5
Dis
char
ge (C
um
ec)
Time (Hours)
1hr UH MSW15 (GIUH)
1hr UH MSW15 (NRCS)
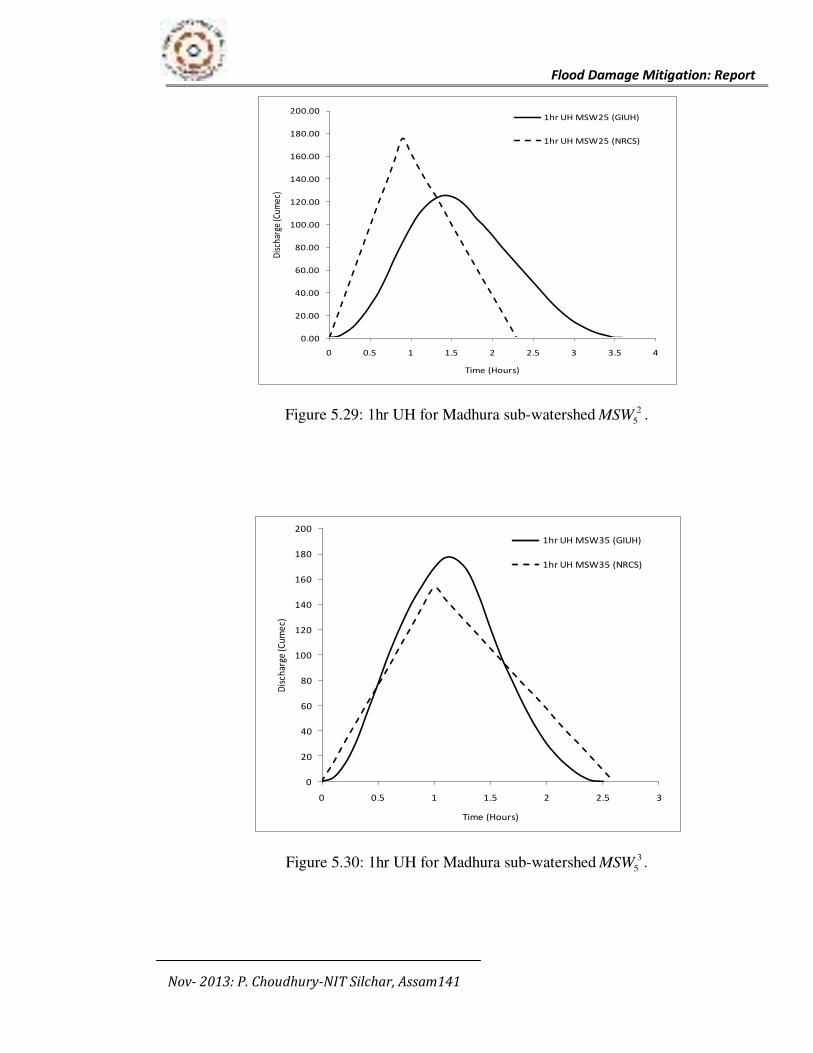
Flood Damage Mitigation: Report
Nov- 2013: P. Choudhury-NIT Silchar, Assam141
Figure 5.29: 1hr UH for Madhura sub-watershed 2
5MSW .
Figure 5.30: 1hr UH for Madhura sub-watershed 3
5MSW .
0.00
20.00
40.00
60.00
80.00
100.00
120.00
140.00
160.00
180.00
200.00
0 0.5 1 1.5 2 2.5 3 3.5 4
Dis
char
ge (C
umec
)
Time (Hours)
1hr UH MSW25 (GIUH)
1hr UH MSW25 (NRCS)
0
20
40
60
80
100
120
140
160
180
200
0 0.5 1 1.5 2 2.5 3
Dis
char
ge (C
um
ec)
Time (Hours)
1hr UH MSW35 (GIUH)
1hr UH MSW35 (NRCS)
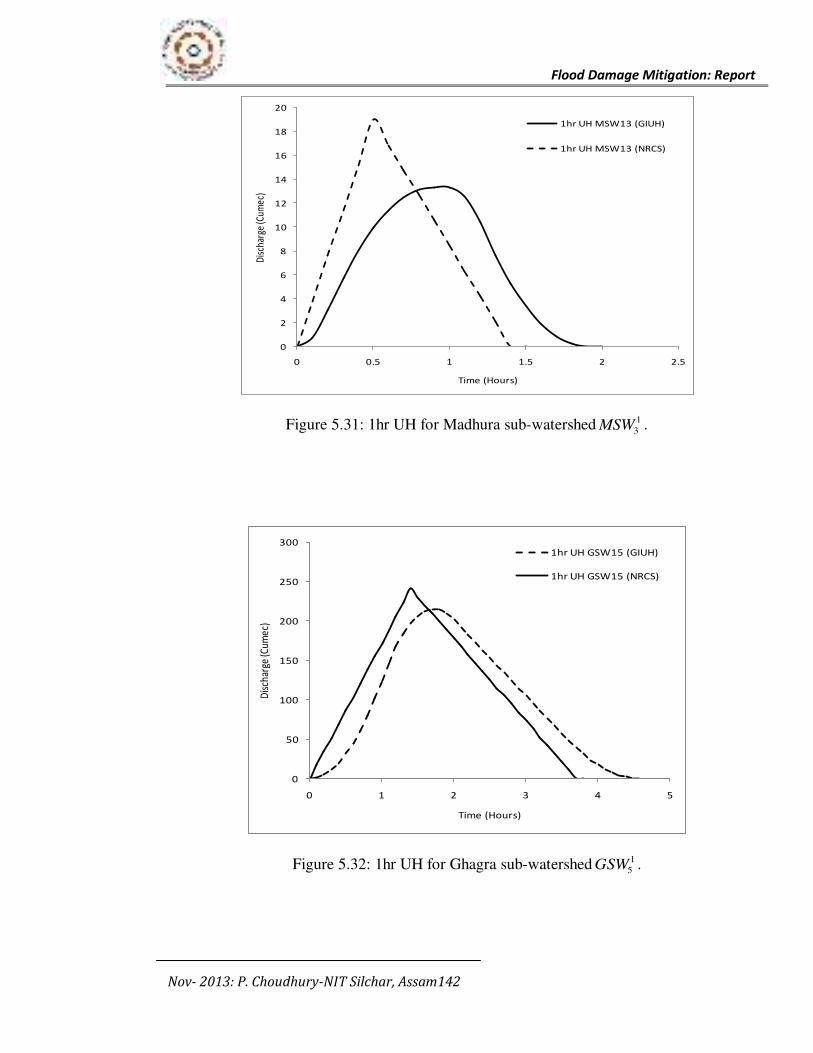
Flood Damage Mitigation: Report
Nov- 2013: P. Choudhury-NIT Silchar, Assam142
Figure 5.31: 1hr UH for Madhura sub-watershed 1
3MSW .
Figure 5.32: 1hr UH for Ghagra sub-watershed 1
5GSW .
0
2
4
6
8
10
12
14
16
18
20
0 0.5 1 1.5 2 2.5
Dis
char
ge (C
umec
)
Time (Hours)
1hr UH MSW13 (GIUH)
1hr UH MSW13 (NRCS)
0
50
100
150
200
250
300
0 1 2 3 4 5
Dis
char
ge (C
umec
)
Time (Hours)
1hr UH GSW15 (GIUH)
1hr UH GSW15 (NRCS)
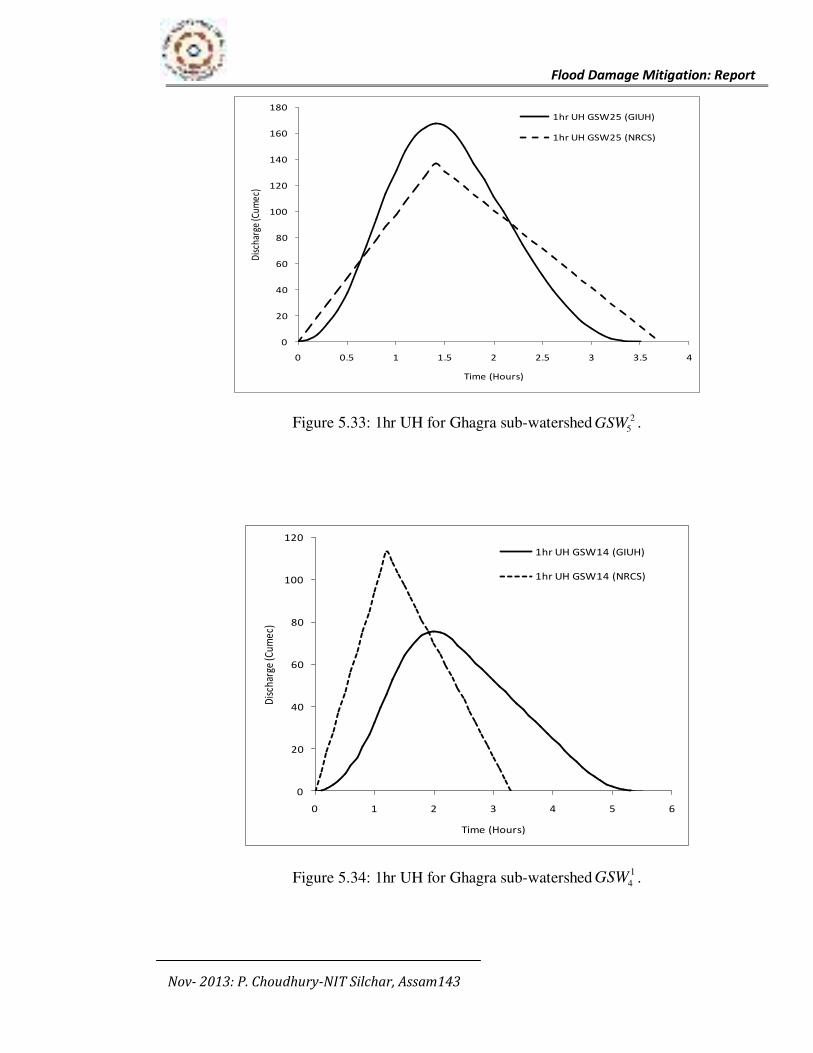
Flood Damage Mitigation: Report
Nov- 2013: P. Choudhury-NIT Silchar, Assam143
Figure 5.33: 1hr UH for Ghagra sub-watershed 2
5GSW .
Figure 5.34: 1hr UH for Ghagra sub-watershed1
4GSW .
0
20
40
60
80
100
120
140
160
180
0 0.5 1 1.5 2 2.5 3 3.5 4
Dis
char
ge (C
umec
)
Time (Hours)
1hr UH GSW25 (GIUH)
1hr UH GSW25 (NRCS)
0
20
40
60
80
100
120
0 1 2 3 4 5 6
Dis
char
ge (C
um
ec)
Time (Hours)
1hr UH GSW14 (GIUH)
1hr UH GSW14 (NRCS)
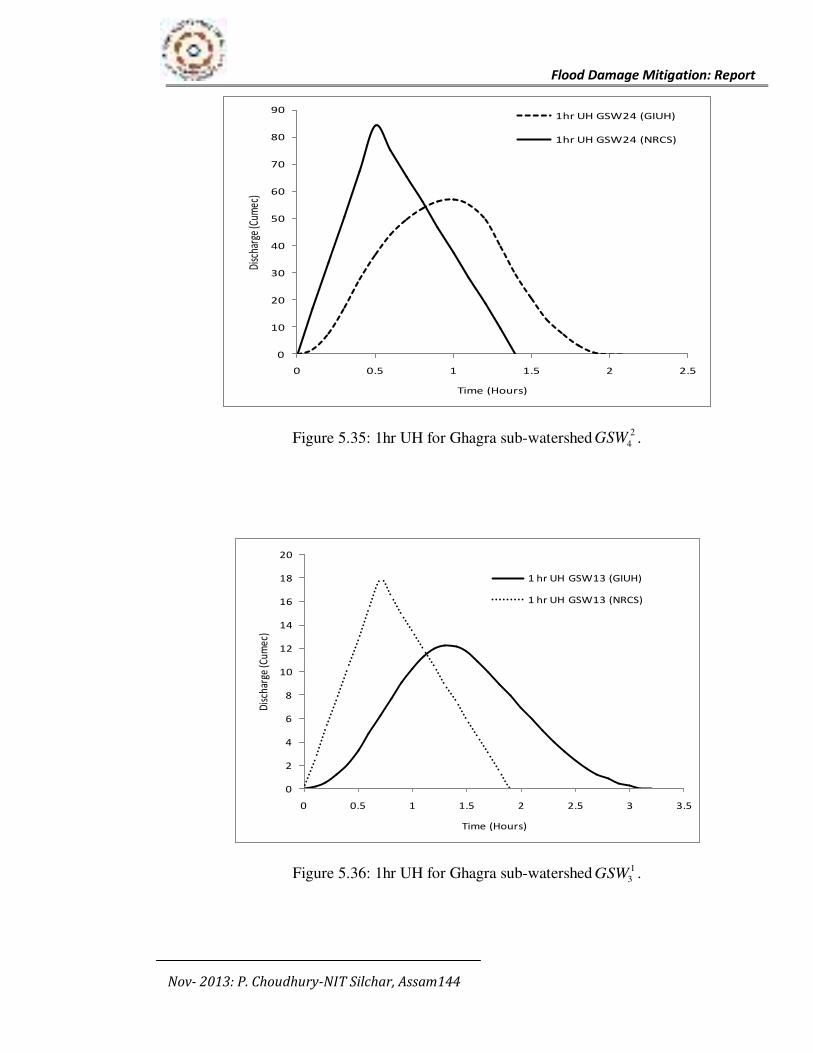
Flood Damage Mitigation: Report
Nov- 2013: P. Choudhury-NIT Silchar, Assam144
Figure 5.35: 1hr UH for Ghagra sub-watershed2
4GSW .
Figure 5.36: 1hr UH for Ghagra sub-watershed 1
3GSW .
0
10
20
30
40
50
60
70
80
90
0 0.5 1 1.5 2 2.5
Disc
harg
e (C
umec
)
Time (Hours)
1hr UH GSW24 (GIUH)
1hr UH GSW24 (NRCS)
0
2
4
6
8
10
12
14
16
18
20
0 0.5 1 1.5 2 2.5 3 3.5
Dis
char
ge (C
umec
)
Time (Hours)
1 hr UH GSW13 (GIUH)
1 hr UH GSW13 (NRCS)
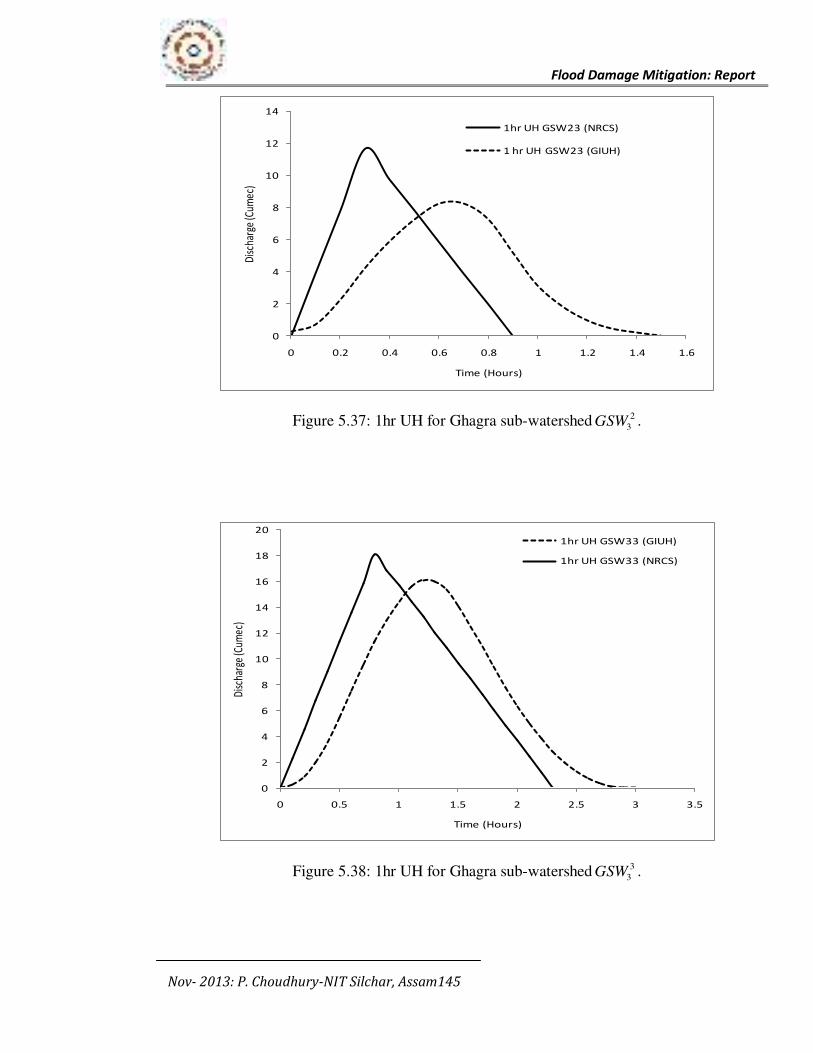
Flood Damage Mitigation: Report
Nov- 2013: P. Choudhury-NIT Silchar, Assam145
Figure 5.37: 1hr UH for Ghagra sub-watershed 2
3GSW .
Figure 5.38: 1hr UH for Ghagra sub-watershed 3
3GSW .
0
2
4
6
8
10
12
14
0 0.2 0.4 0.6 0.8 1 1.2 1.4 1.6
Dis
char
ge (C
umec
)
Time (Hours)
1hr UH GSW23 (NRCS)
1 hr UH GSW23 (GIUH)
0
2
4
6
8
10
12
14
16
18
20
0 0.5 1 1.5 2 2.5 3 3.5
Dis
char
ge (C
umec
)
Time (Hours)
1hr UH GSW33 (GIUH)
1hr UH GSW33 (NRCS)
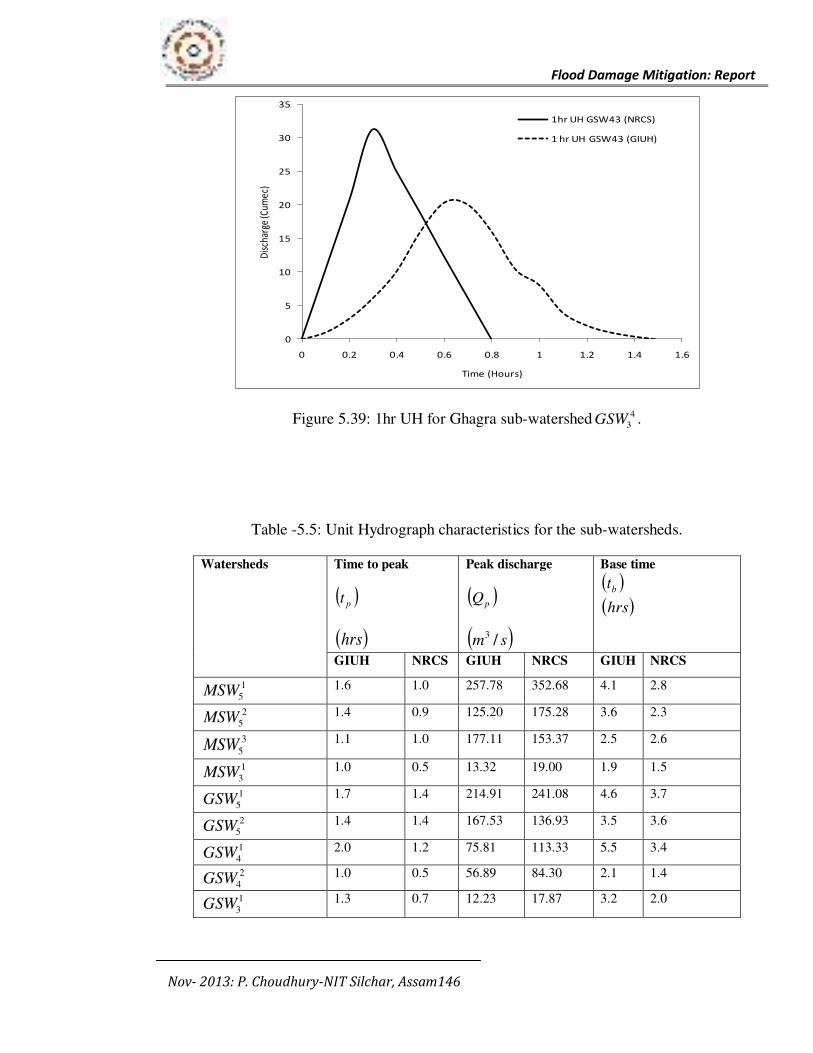
Flood Damage Mitigation: Report
Nov- 2013: P. Choudhury-NIT Silchar, Assam146
Figure 5.39: 1hr UH for Ghagra sub-watershed 4
3GSW .
Table -5.5: Unit Hydrograph characteristics for the sub-watersheds.
Watersheds Time to peak
pt
hrs
Peak discharge
pQ
sm /3
Base time
bt
hrs
GIUH NRCS GIUH NRCS GIUH NRCS
1
5MSW 1.6 1.0 257.78 352.68 4.1 2.8
2
5MSW 1.4 0.9 125.20 175.28 3.6 2.3
3
5MSW 1.1 1.0 177.11 153.37 2.5 2.6
1
3MSW 1.0 0.5 13.32 19.00 1.9 1.5
1
5GSW 1.7 1.4 214.91 241.08 4.6 3.7
2
5GSW 1.4 1.4 167.53 136.93 3.5 3.6
1
4GSW 2.0 1.2 75.81 113.33 5.5 3.4
2
4GSW 1.0 0.5 56.89 84.30 2.1 1.4
1
3GSW 1.3 0.7 12.23 17.87 3.2 2.0
0
5
10
15
20
25
30
35
0 0.2 0.4 0.6 0.8 1 1.2 1.4 1.6
Dis
char
ge (C
umec
)
Time (Hours)
1hr UH GSW43 (NRCS)
1 hr UH GSW43 (GIUH)
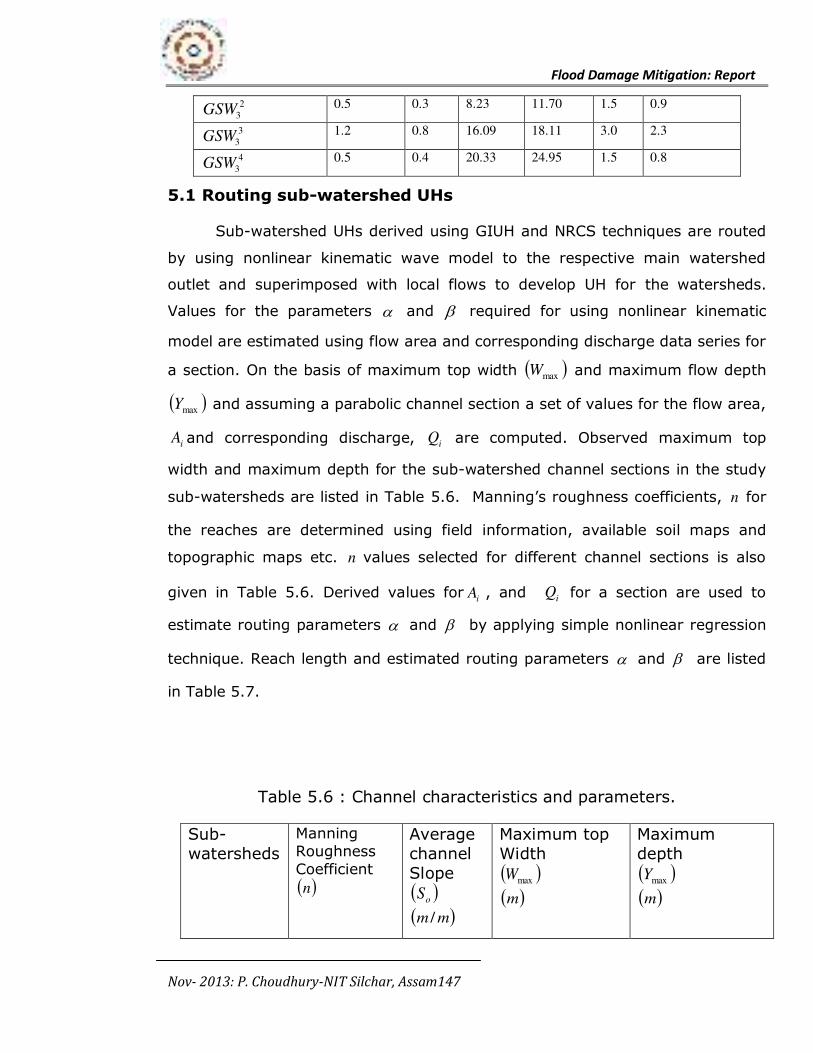
Flood Damage Mitigation: Report
Nov- 2013: P. Choudhury-NIT Silchar, Assam147
2
3GSW 0.5 0.3 8.23 11.70 1.5 0.9
3
3GSW 1.2 0.8 16.09 18.11 3.0 2.3
4
3GSW 0.5 0.4 20.33 24.95 1.5 0.8
5.1 Routing sub-watershed UHs
Sub-watershed UHs derived using GIUH and NRCS techniques are routed
by using nonlinear kinematic wave model to the respective main watershed
outlet and superimposed with local flows to develop UH for the watersheds.
Values for the parameters and required for using nonlinear kinematic
model are estimated using flow area and corresponding discharge data series for
a section. On the basis of maximum top width maxW and maximum flow depth
maxY and assuming a parabolic channel section a set of values for the flow area,
iA and corresponding discharge, iQ are computed. Observed maximum top
width and maximum depth for the sub-watershed channel sections in the study
sub-watersheds are listed in Table 5.6. Manning’s roughness coefficients, n for
the reaches are determined using field information, available soil maps and
topographic maps etc. n values selected for different channel sections is also
given in Table 5.6. Derived values for iA , and iQ for a section are used to
estimate routing parameters and by applying simple nonlinear regression
technique. Reach length and estimated routing parameters and are listed
in Table 5.7.
Table 5.6 : Channel characteristics and parameters.
Sub-
watersheds
Manning
Roughness
Coefficient
n
Average
channel
Slope
oS
mm /
Maximum top
Width
maxW
m
Maximum
depth
maxY
m
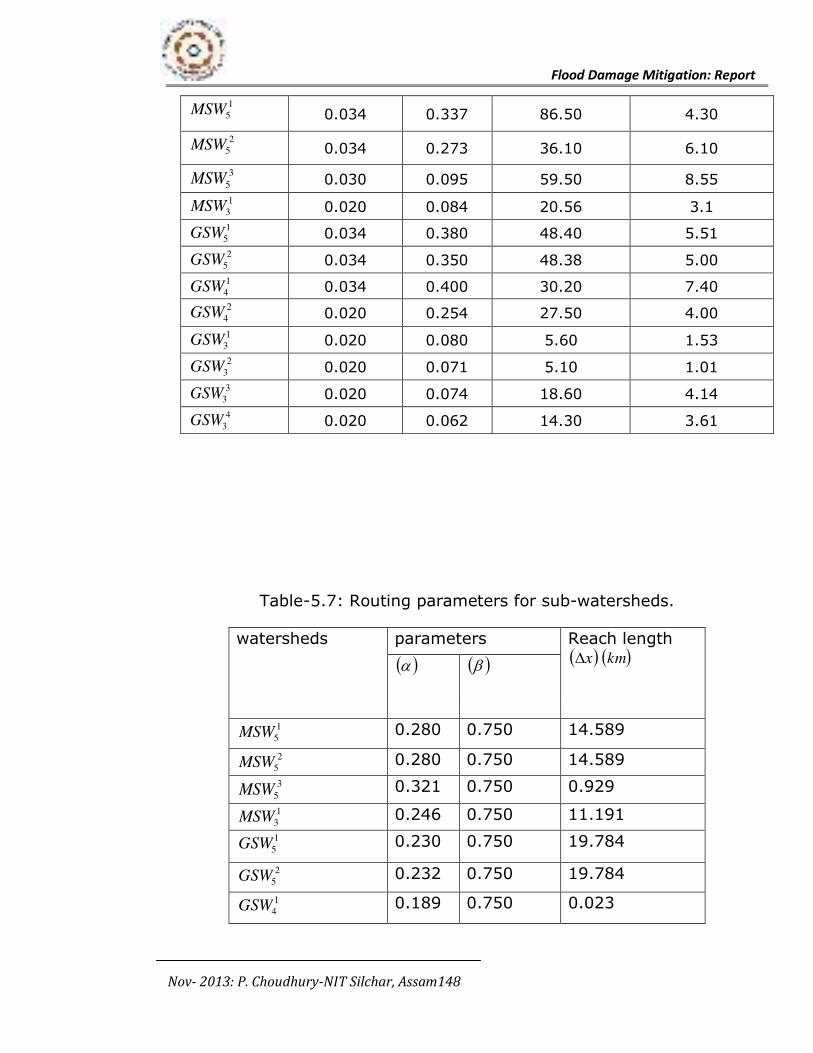
Flood Damage Mitigation: Report
Nov- 2013: P. Choudhury-NIT Silchar, Assam148
1
5MSW 0.034 0.337 86.50 4.30
2
5MSW 0.034 0.273 36.10 6.10
3
5MSW 0.030 0.095 59.50 8.55
1
3MSW 0.020 0.084 20.56 3.1
1
5GSW 0.034 0.380 48.40 5.51
2
5GSW 0.034 0.350 48.38 5.00
1
4GSW 0.034 0.400 30.20 7.40
2
4GSW 0.020 0.254 27.50 4.00
1
3GSW 0.020 0.080 5.60 1.53
2
3GSW 0.020 0.071 5.10 1.01
3
3GSW 0.020 0.074 18.60 4.14
4
3GSW 0.020 0.062 14.30 3.61
Table-5.7: Routing parameters for sub-watersheds.
watersheds parameters Reach length x km
1
5MSW 0.280 0.750 14.589
2
5MSW 0.280 0.750 14.589
3
5MSW 0.321 0.750 0.929
1
3MSW 0.246 0.750 11.191
1
5GSW 0.230 0.750 19.784
2
5GSW 0.232 0.750 19.784
1
4GSW 0.189 0.750 0.023
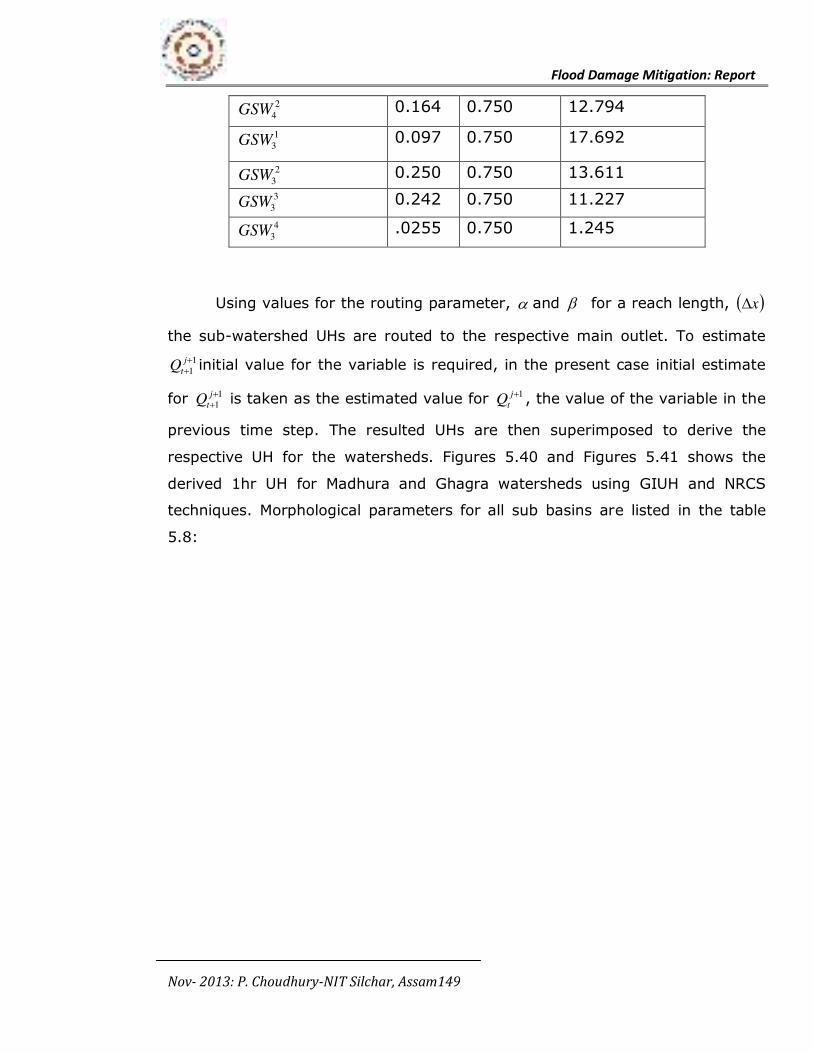
Flood Damage Mitigation: Report
Nov- 2013: P. Choudhury-NIT Silchar, Assam149
2
4GSW 0.164 0.750 12.794
1
3GSW 0.097 0.750 17.692
2
3GSW 0.250 0.750 13.611
3
3GSW 0.242 0.750 11.227
4
3GSW .0255 0.750 1.245
Using values for the routing parameter, and for a reach length, x
the sub-watershed UHs are routed to the respective main outlet. To estimate
1
1
j
tQ initial value for the variable is required, in the present case initial estimate
for 1
1
j
tQ is taken as the estimated value for 1jtQ , the value of the variable in the
previous time step. The resulted UHs are then superimposed to derive the
respective UH for the watersheds. Figures 5.40 and Figures 5.41 shows the
derived 1hr UH for Madhura and Ghagra watersheds using GIUH and NRCS
techniques. Morphological parameters for all sub basins are listed in the table
5.8:
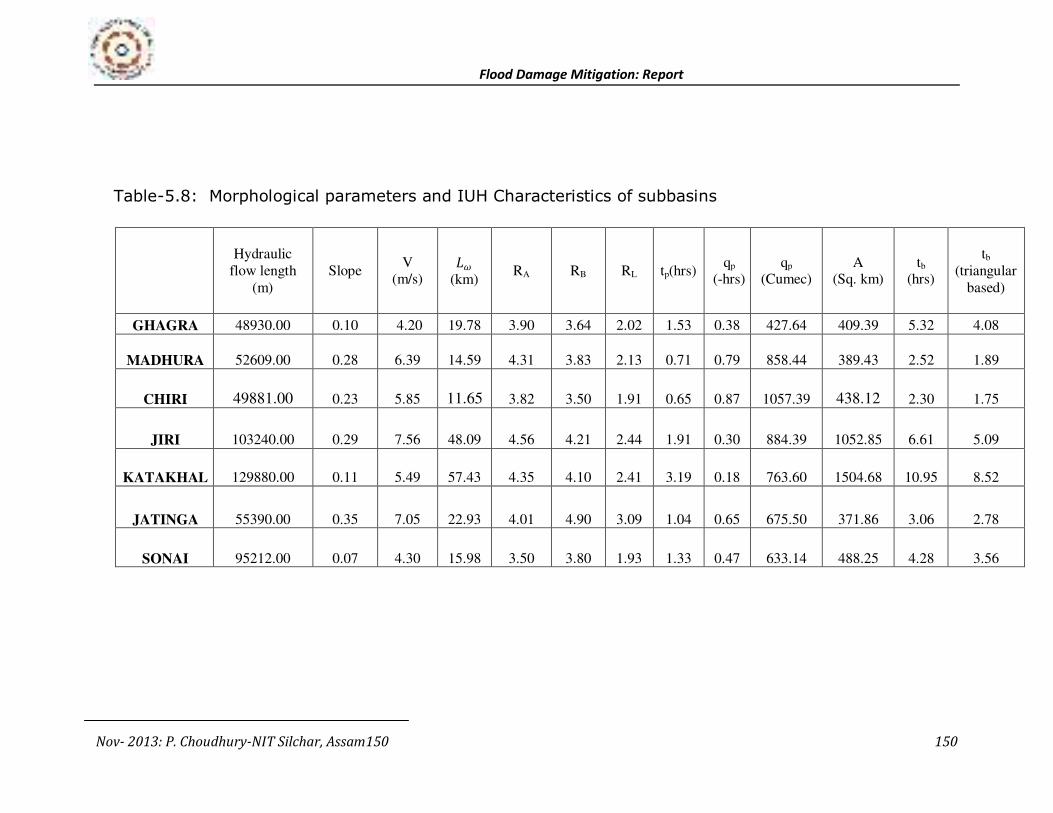
Flood Damage Mitigation: Report
Nov- 2013: P. Choudhury-NIT Silchar, Assam150 150
Table-5.8: Morphological parameters and IUH Characteristics of subbasins
Hydraulic
flow length
(m)
Slope V
(m/s) 𝐿𝜔
(km) RA RB RL tp(hrs)
qp
(-hrs) qp
(Cumec) A
(Sq. km) tb
(hrs)
tb
(triangular
based)
GHAGRA 48930.00 0.10 4.20 19.78 3.90 3.64 2.02 1.53 0.38 427.64 409.39 5.32 4.08
MADHURA 52609.00 0.28 6.39 14.59 4.31 3.83 2.13 0.71 0.79 858.44 389.43 2.52 1.89
CHIRI 49881.00 0.23 5.85 11.65 3.82 3.50 1.91 0.65 0.87 1057.39 438.12 2.30 1.75
JIRI 103240.00 0.29 7.56 48.09 4.56 4.21 2.44 1.91 0.30 884.39 1052.85 6.61 5.09
KATAKHAL 129880.00 0.11 5.49 57.43 4.35 4.10 2.41 3.19 0.18 763.60 1504.68 10.95 8.52
JATINGA 55390.00 0.35 7.05 22.93 4.01 4.90 3.09 1.04 0.65 675.50 371.86 3.06 2.78
SONAI 95212.00 0.07 4.30 15.98 3.50 3.80 1.93 1.33 0.47 633.14 488.25 4.28 3.56
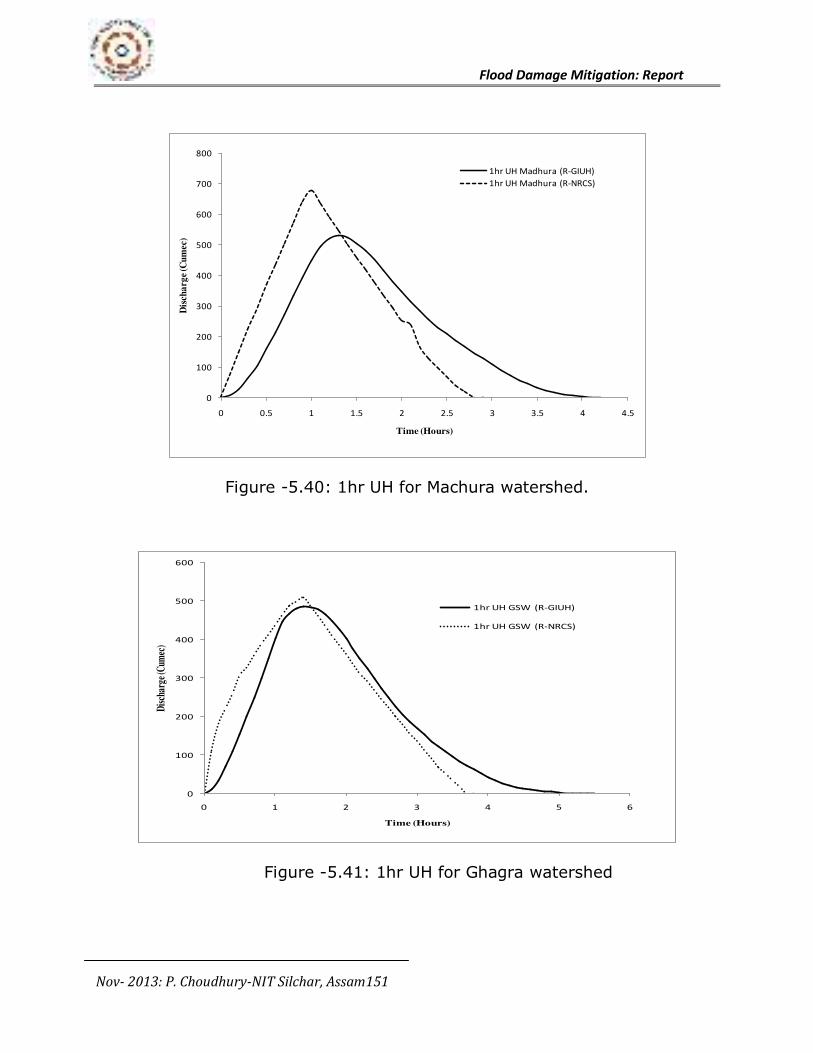
Flood Damage Mitigation: Report
Nov- 2013: P. Choudhury-NIT Silchar, Assam151
Figure -5.40: 1hr UH for Machura watershed.
Figure -5.41: 1hr UH for Ghagra watershed
0
100
200
300
400
500
600
700
800
0 0.5 1 1.5 2 2.5 3 3.5 4 4.5
Dis
cha
rge
(Cu
mec
)
Time (Hours)
1hr UH Madhura (R-GIUH)
1hr UH Madhura (R-NRCS)
0
100
200
300
400
500
600
0 1 2 3 4 5 6
Dis
char
ge (C
umec
)
Time (Hours)
1hr UH GSW (R-GIUH)
1hr UH GSW (R-NRCS)
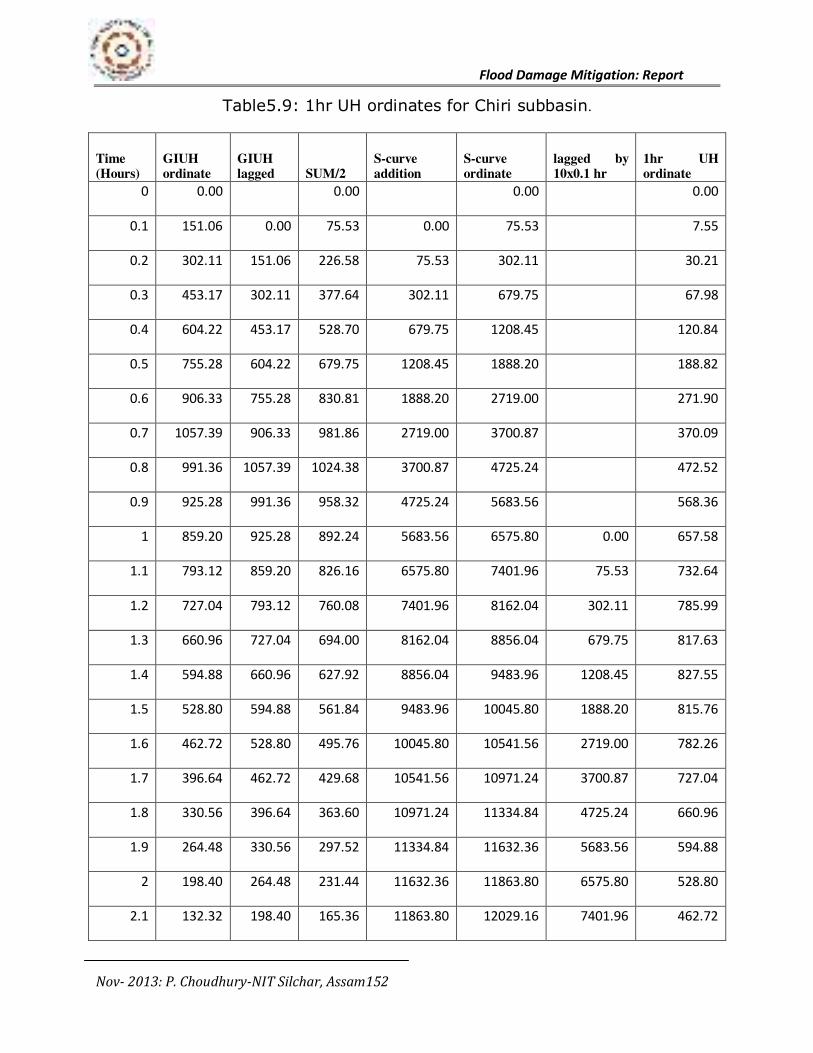
Flood Damage Mitigation: Report
Nov- 2013: P. Choudhury-NIT Silchar, Assam152
Table5.9: 1hr UH ordinates for Chiri subbasin.
Time (Hours)
GIUH ordinate
GIUH lagged SUM/2
S-curve addition
S-curve ordinate
lagged by 10x0.1 hr
1hr UH ordinate
0 0.00
0.00
0.00
0.00
0.1 151.06 0.00 75.53 0.00 75.53
7.55
0.2 302.11 151.06 226.58 75.53 302.11
30.21
0.3 453.17 302.11 377.64 302.11 679.75
67.98
0.4 604.22 453.17 528.70 679.75 1208.45
120.84
0.5 755.28 604.22 679.75 1208.45 1888.20
188.82
0.6 906.33 755.28 830.81 1888.20 2719.00
271.90
0.7 1057.39 906.33 981.86 2719.00 3700.87
370.09
0.8 991.36 1057.39 1024.38 3700.87 4725.24
472.52
0.9 925.28 991.36 958.32 4725.24 5683.56
568.36
1 859.20 925.28 892.24 5683.56 6575.80 0.00 657.58
1.1 793.12 859.20 826.16 6575.80 7401.96 75.53 732.64
1.2 727.04 793.12 760.08 7401.96 8162.04 302.11 785.99
1.3 660.96 727.04 694.00 8162.04 8856.04 679.75 817.63
1.4 594.88 660.96 627.92 8856.04 9483.96 1208.45 827.55
1.5 528.80 594.88 561.84 9483.96 10045.80 1888.20 815.76
1.6 462.72 528.80 495.76 10045.80 10541.56 2719.00 782.26
1.7 396.64 462.72 429.68 10541.56 10971.24 3700.87 727.04
1.8 330.56 396.64 363.60 10971.24 11334.84 4725.24 660.96
1.9 264.48 330.56 297.52 11334.84 11632.36 5683.56 594.88
2 198.40 264.48 231.44 11632.36 11863.80 6575.80 528.80
2.1 132.32 198.40 165.36 11863.80 12029.16 7401.96 462.72
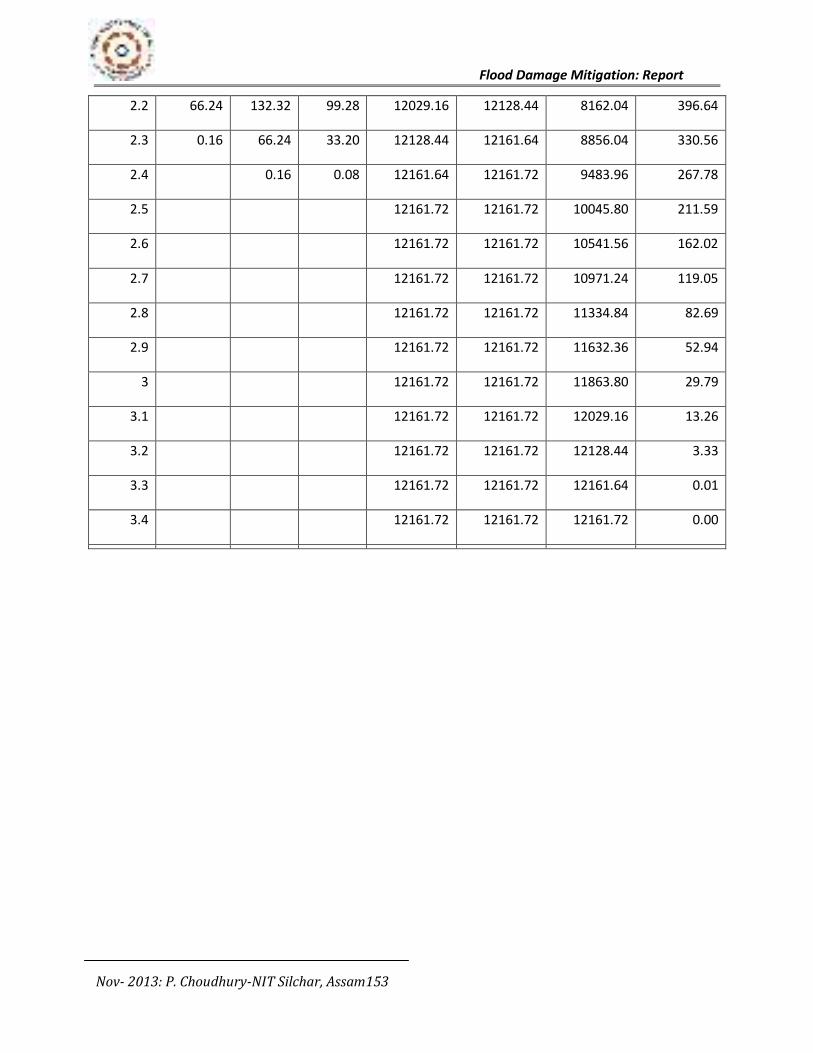
Flood Damage Mitigation: Report
Nov- 2013: P. Choudhury-NIT Silchar, Assam153
2.2 66.24 132.32 99.28 12029.16 12128.44 8162.04 396.64
2.3 0.16 66.24 33.20 12128.44 12161.64 8856.04 330.56
2.4
0.16 0.08 12161.64 12161.72 9483.96 267.78
2.5
12161.72 12161.72 10045.80 211.59
2.6
12161.72 12161.72 10541.56 162.02
2.7
12161.72 12161.72 10971.24 119.05
2.8
12161.72 12161.72 11334.84 82.69
2.9
12161.72 12161.72 11632.36 52.94
3
12161.72 12161.72 11863.80 29.79
3.1
12161.72 12161.72 12029.16 13.26
3.2
12161.72 12161.72 12128.44 3.33
3.3
12161.72 12161.72 12161.64 0.01
3.4
12161.72 12161.72 12161.72 0.00
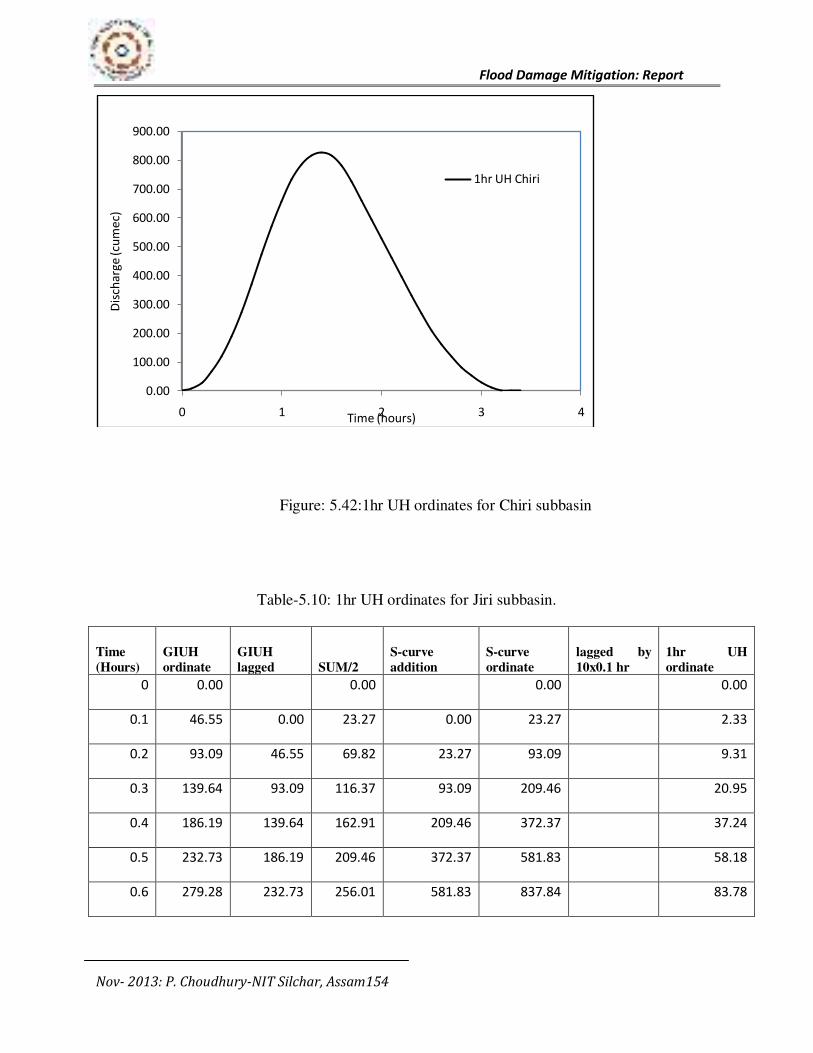
Flood Damage Mitigation: Report
Nov- 2013: P. Choudhury-NIT Silchar, Assam154
Figure: 5.42:1hr UH ordinates for Chiri subbasin
Table-5.10: 1hr UH ordinates for Jiri subbasin.
Time
(Hours)
GIUH
ordinate
GIUH
lagged SUM/2
S-curve
addition
S-curve
ordinate
lagged by
10x0.1 hr
1hr UH
ordinate
0 0.00
0.00
0.00
0.00
0.1 46.55 0.00 23.27 0.00 23.27
2.33
0.2 93.09 46.55 69.82 23.27 93.09
9.31
0.3 139.64 93.09 116.37 93.09 209.46
20.95
0.4 186.19 139.64 162.91 209.46 372.37
37.24
0.5 232.73 186.19 209.46 372.37 581.83
58.18
0.6 279.28 232.73 256.01 581.83 837.84
83.78
0.00
100.00
200.00
300.00
400.00
500.00
600.00
700.00
800.00
900.00
0 1 2 3 4
Dis
cha
rge
(cu
me
c)
Time (hours)
1hr UH Chiri
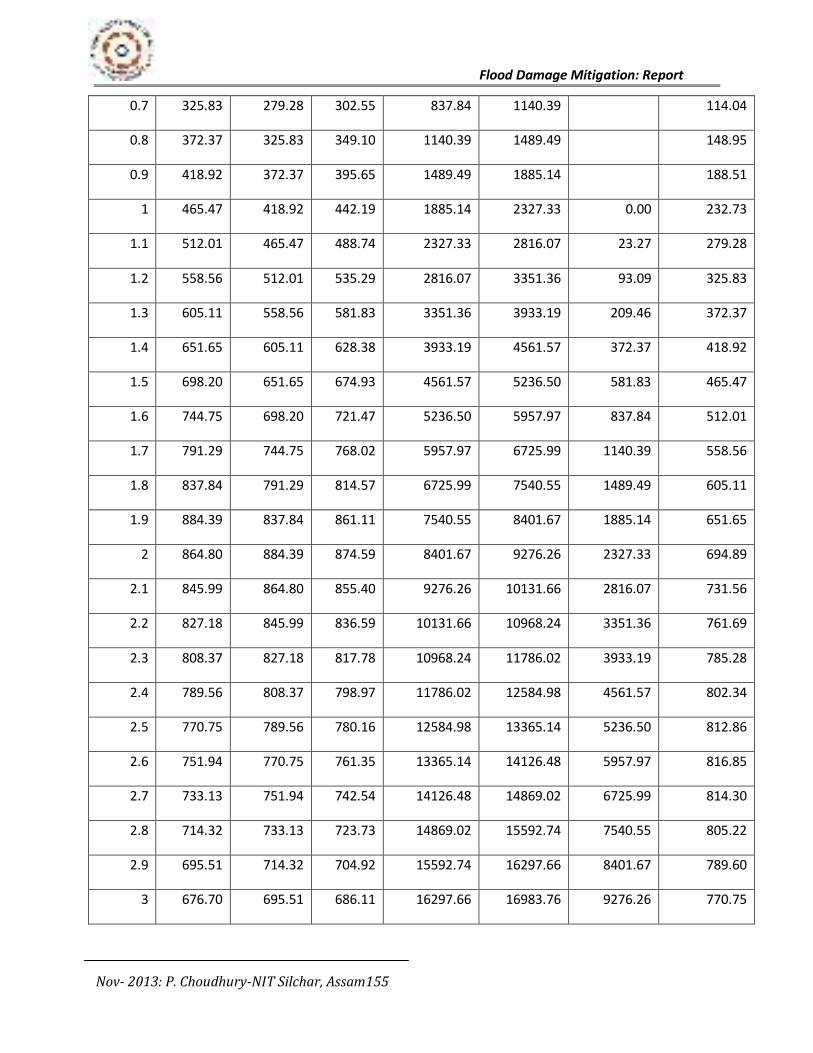
Flood Damage Mitigation: Report
Nov- 2013: P. Choudhury-NIT Silchar, Assam155
0.7 325.83 279.28 302.55 837.84 1140.39
114.04
0.8 372.37 325.83 349.10 1140.39 1489.49
148.95
0.9 418.92 372.37 395.65 1489.49 1885.14
188.51
1 465.47 418.92 442.19 1885.14 2327.33 0.00 232.73
1.1 512.01 465.47 488.74 2327.33 2816.07 23.27 279.28
1.2 558.56 512.01 535.29 2816.07 3351.36 93.09 325.83
1.3 605.11 558.56 581.83 3351.36 3933.19 209.46 372.37
1.4 651.65 605.11 628.38 3933.19 4561.57 372.37 418.92
1.5 698.20 651.65 674.93 4561.57 5236.50 581.83 465.47
1.6 744.75 698.20 721.47 5236.50 5957.97 837.84 512.01
1.7 791.29 744.75 768.02 5957.97 6725.99 1140.39 558.56
1.8 837.84 791.29 814.57 6725.99 7540.55 1489.49 605.11
1.9 884.39 837.84 861.11 7540.55 8401.67 1885.14 651.65
2 864.80 884.39 874.59 8401.67 9276.26 2327.33 694.89
2.1 845.99 864.80 855.40 9276.26 10131.66 2816.07 731.56
2.2 827.18 845.99 836.59 10131.66 10968.24 3351.36 761.69
2.3 808.37 827.18 817.78 10968.24 11786.02 3933.19 785.28
2.4 789.56 808.37 798.97 11786.02 12584.98 4561.57 802.34
2.5 770.75 789.56 780.16 12584.98 13365.14 5236.50 812.86
2.6 751.94 770.75 761.35 13365.14 14126.48 5957.97 816.85
2.7 733.13 751.94 742.54 14126.48 14869.02 6725.99 814.30
2.8 714.32 733.13 723.73 14869.02 15592.74 7540.55 805.22
2.9 695.51 714.32 704.92 15592.74 16297.66 8401.67 789.60
3 676.70 695.51 686.11 16297.66 16983.76 9276.26 770.75
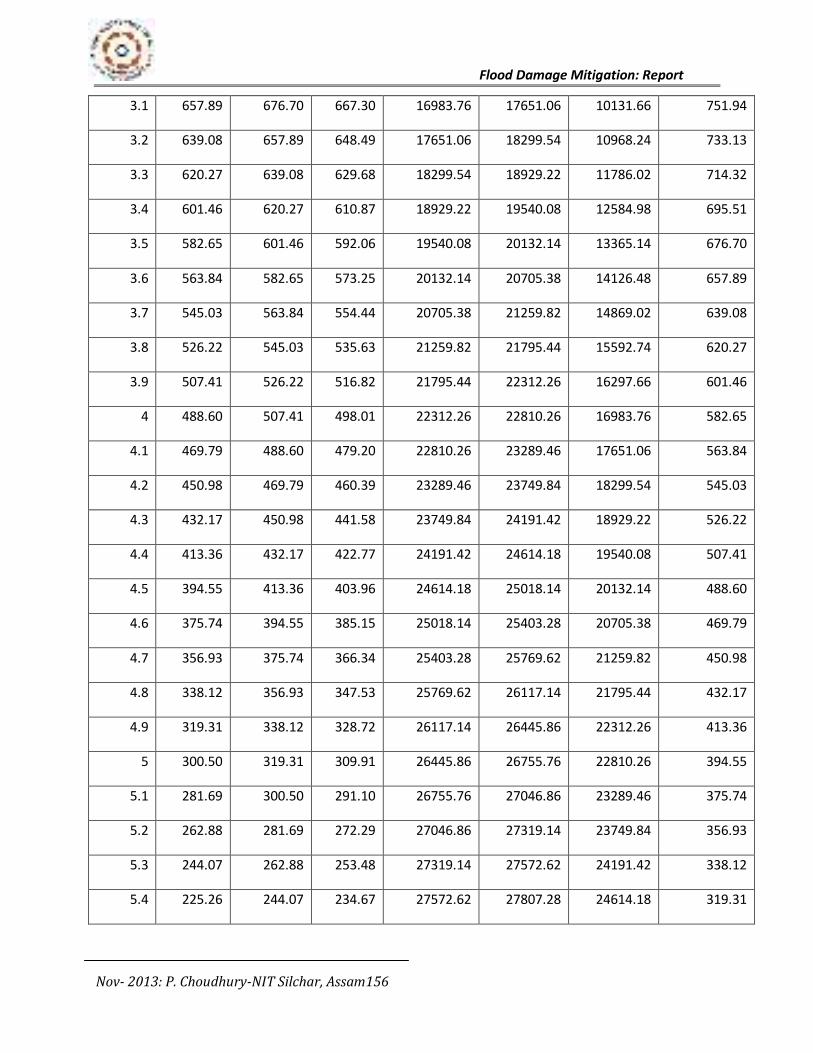
Flood Damage Mitigation: Report
Nov- 2013: P. Choudhury-NIT Silchar, Assam156
3.1 657.89 676.70 667.30 16983.76 17651.06 10131.66 751.94
3.2 639.08 657.89 648.49 17651.06 18299.54 10968.24 733.13
3.3 620.27 639.08 629.68 18299.54 18929.22 11786.02 714.32
3.4 601.46 620.27 610.87 18929.22 19540.08 12584.98 695.51
3.5 582.65 601.46 592.06 19540.08 20132.14 13365.14 676.70
3.6 563.84 582.65 573.25 20132.14 20705.38 14126.48 657.89
3.7 545.03 563.84 554.44 20705.38 21259.82 14869.02 639.08
3.8 526.22 545.03 535.63 21259.82 21795.44 15592.74 620.27
3.9 507.41 526.22 516.82 21795.44 22312.26 16297.66 601.46
4 488.60 507.41 498.01 22312.26 22810.26 16983.76 582.65
4.1 469.79 488.60 479.20 22810.26 23289.46 17651.06 563.84
4.2 450.98 469.79 460.39 23289.46 23749.84 18299.54 545.03
4.3 432.17 450.98 441.58 23749.84 24191.42 18929.22 526.22
4.4 413.36 432.17 422.77 24191.42 24614.18 19540.08 507.41
4.5 394.55 413.36 403.96 24614.18 25018.14 20132.14 488.60
4.6 375.74 394.55 385.15 25018.14 25403.28 20705.38 469.79
4.7 356.93 375.74 366.34 25403.28 25769.62 21259.82 450.98
4.8 338.12 356.93 347.53 25769.62 26117.14 21795.44 432.17
4.9 319.31 338.12 328.72 26117.14 26445.86 22312.26 413.36
5 300.50 319.31 309.91 26445.86 26755.76 22810.26 394.55
5.1 281.69 300.50 291.10 26755.76 27046.86 23289.46 375.74
5.2 262.88 281.69 272.29 27046.86 27319.14 23749.84 356.93
5.3 244.07 262.88 253.48 27319.14 27572.62 24191.42 338.12
5.4 225.26 244.07 234.67 27572.62 27807.28 24614.18 319.31
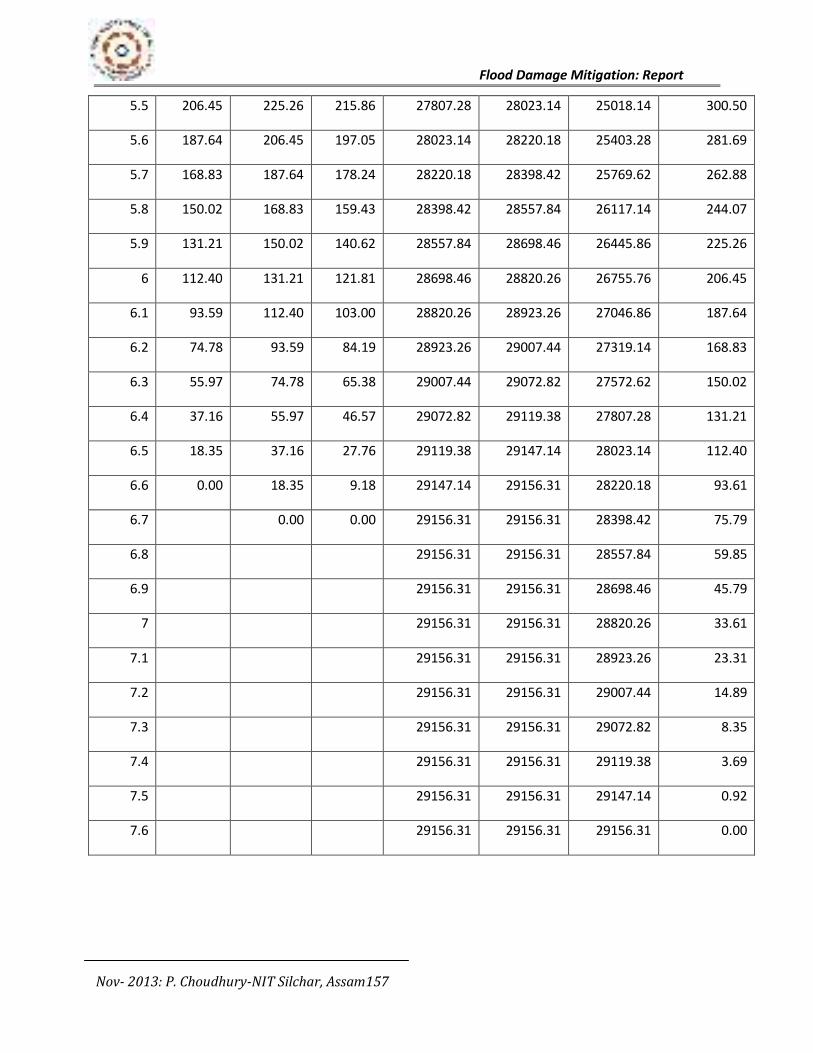
Flood Damage Mitigation: Report
Nov- 2013: P. Choudhury-NIT Silchar, Assam157
5.5 206.45 225.26 215.86 27807.28 28023.14 25018.14 300.50
5.6 187.64 206.45 197.05 28023.14 28220.18 25403.28 281.69
5.7 168.83 187.64 178.24 28220.18 28398.42 25769.62 262.88
5.8 150.02 168.83 159.43 28398.42 28557.84 26117.14 244.07
5.9 131.21 150.02 140.62 28557.84 28698.46 26445.86 225.26
6 112.40 131.21 121.81 28698.46 28820.26 26755.76 206.45
6.1 93.59 112.40 103.00 28820.26 28923.26 27046.86 187.64
6.2 74.78 93.59 84.19 28923.26 29007.44 27319.14 168.83
6.3 55.97 74.78 65.38 29007.44 29072.82 27572.62 150.02
6.4 37.16 55.97 46.57 29072.82 29119.38 27807.28 131.21
6.5 18.35 37.16 27.76 29119.38 29147.14 28023.14 112.40
6.6 0.00 18.35 9.18 29147.14 29156.31 28220.18 93.61
6.7
0.00 0.00 29156.31 29156.31 28398.42 75.79
6.8
29156.31 29156.31 28557.84 59.85
6.9
29156.31 29156.31 28698.46 45.79
7
29156.31 29156.31 28820.26 33.61
7.1
29156.31 29156.31 28923.26 23.31
7.2
29156.31 29156.31 29007.44 14.89
7.3
29156.31 29156.31 29072.82 8.35
7.4
29156.31 29156.31 29119.38 3.69
7.5
29156.31 29156.31 29147.14 0.92
7.6
29156.31 29156.31 29156.31 0.00
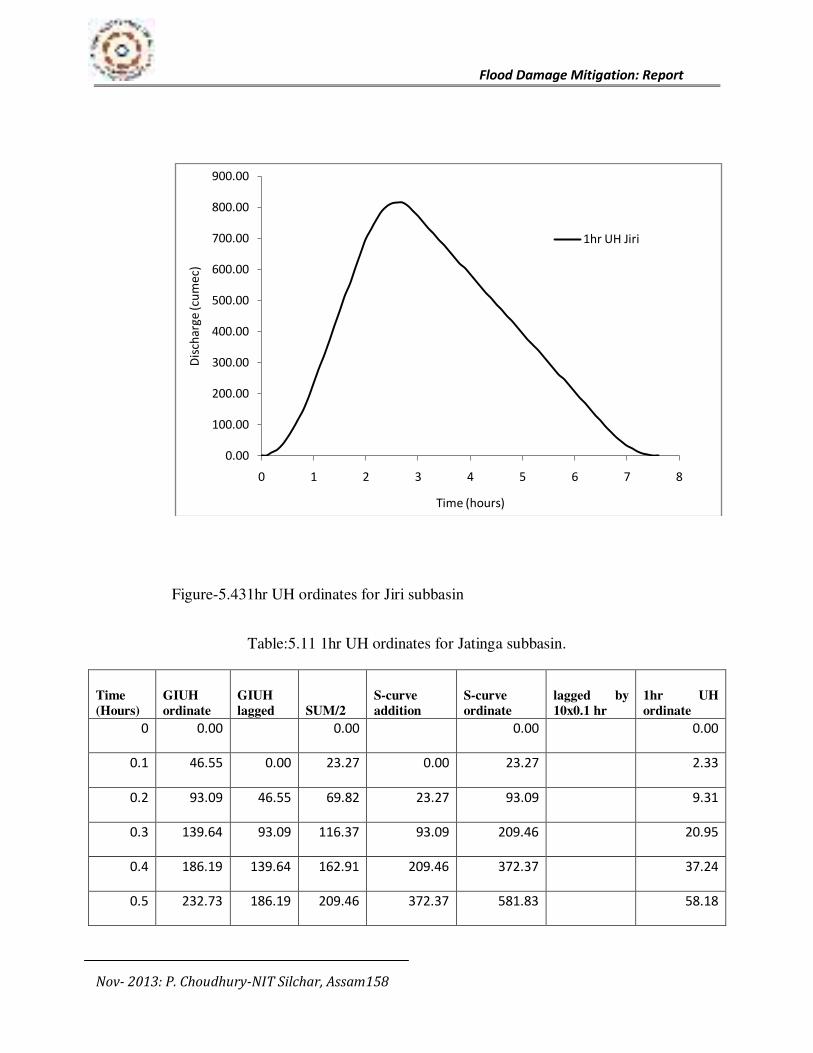
Flood Damage Mitigation: Report
Nov- 2013: P. Choudhury-NIT Silchar, Assam158
Figure-5.431hr UH ordinates for Jiri subbasin
Table:5.11 1hr UH ordinates for Jatinga subbasin.
Time
(Hours)
GIUH
ordinate
GIUH
lagged SUM/2
S-curve
addition
S-curve
ordinate
lagged by
10x0.1 hr
1hr UH
ordinate
0 0.00
0.00
0.00
0.00
0.1 46.55 0.00 23.27 0.00 23.27
2.33
0.2 93.09 46.55 69.82 23.27 93.09
9.31
0.3 139.64 93.09 116.37 93.09 209.46
20.95
0.4 186.19 139.64 162.91 209.46 372.37
37.24
0.5 232.73 186.19 209.46 372.37 581.83
58.18
0.00
100.00
200.00
300.00
400.00
500.00
600.00
700.00
800.00
900.00
0 1 2 3 4 5 6 7 8
Dis
cha
rge
(cu
me
c)
Time (hours)
1hr UH Jiri
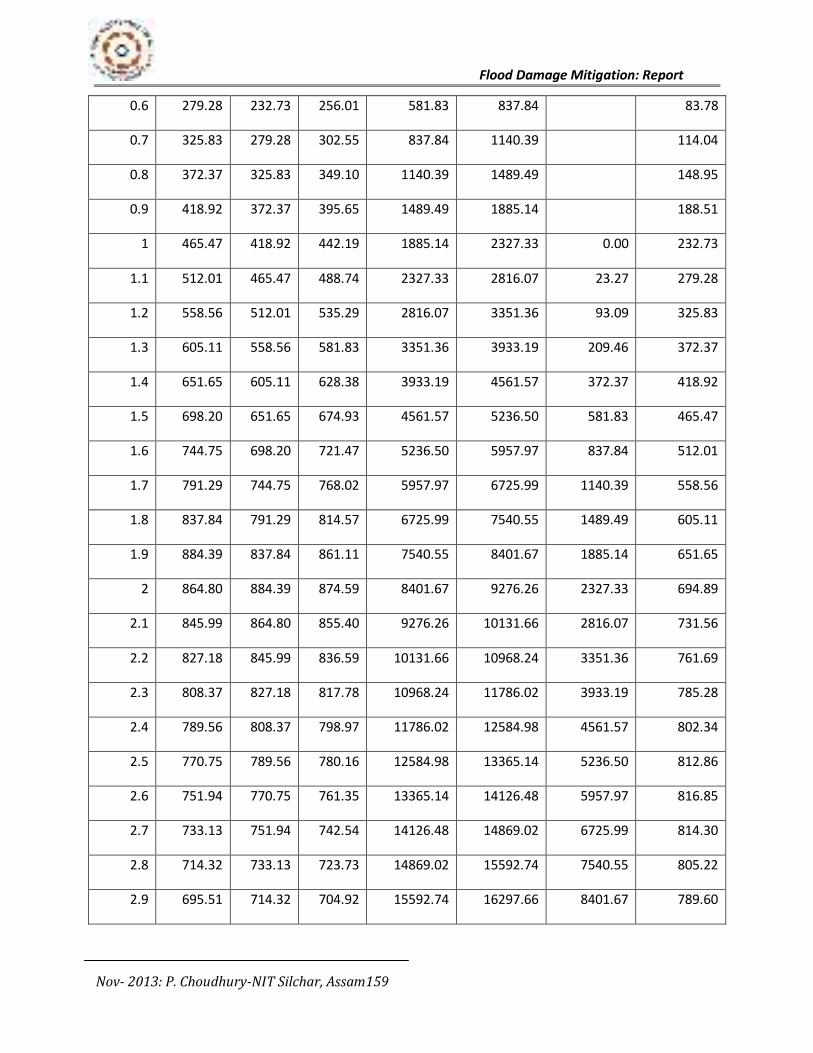
Flood Damage Mitigation: Report
Nov- 2013: P. Choudhury-NIT Silchar, Assam159
0.6 279.28 232.73 256.01 581.83 837.84
83.78
0.7 325.83 279.28 302.55 837.84 1140.39
114.04
0.8 372.37 325.83 349.10 1140.39 1489.49
148.95
0.9 418.92 372.37 395.65 1489.49 1885.14
188.51
1 465.47 418.92 442.19 1885.14 2327.33 0.00 232.73
1.1 512.01 465.47 488.74 2327.33 2816.07 23.27 279.28
1.2 558.56 512.01 535.29 2816.07 3351.36 93.09 325.83
1.3 605.11 558.56 581.83 3351.36 3933.19 209.46 372.37
1.4 651.65 605.11 628.38 3933.19 4561.57 372.37 418.92
1.5 698.20 651.65 674.93 4561.57 5236.50 581.83 465.47
1.6 744.75 698.20 721.47 5236.50 5957.97 837.84 512.01
1.7 791.29 744.75 768.02 5957.97 6725.99 1140.39 558.56
1.8 837.84 791.29 814.57 6725.99 7540.55 1489.49 605.11
1.9 884.39 837.84 861.11 7540.55 8401.67 1885.14 651.65
2 864.80 884.39 874.59 8401.67 9276.26 2327.33 694.89
2.1 845.99 864.80 855.40 9276.26 10131.66 2816.07 731.56
2.2 827.18 845.99 836.59 10131.66 10968.24 3351.36 761.69
2.3 808.37 827.18 817.78 10968.24 11786.02 3933.19 785.28
2.4 789.56 808.37 798.97 11786.02 12584.98 4561.57 802.34
2.5 770.75 789.56 780.16 12584.98 13365.14 5236.50 812.86
2.6 751.94 770.75 761.35 13365.14 14126.48 5957.97 816.85
2.7 733.13 751.94 742.54 14126.48 14869.02 6725.99 814.30
2.8 714.32 733.13 723.73 14869.02 15592.74 7540.55 805.22
2.9 695.51 714.32 704.92 15592.74 16297.66 8401.67 789.60
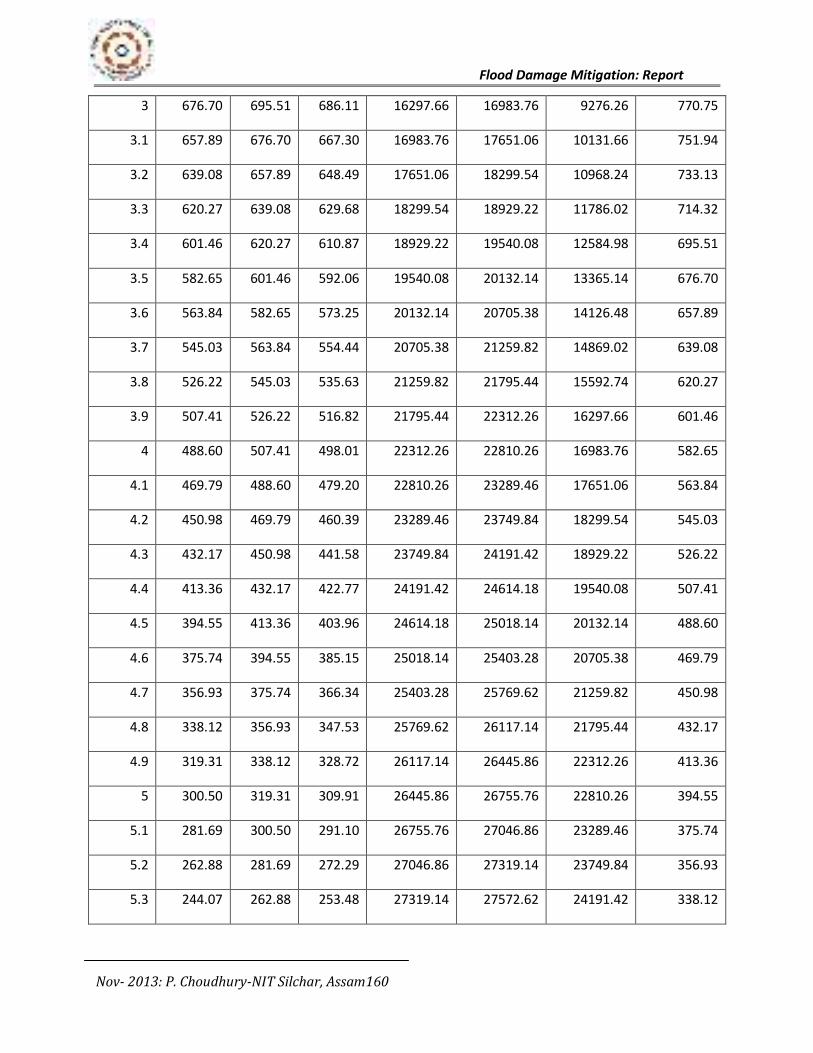
Flood Damage Mitigation: Report
Nov- 2013: P. Choudhury-NIT Silchar, Assam160
3 676.70 695.51 686.11 16297.66 16983.76 9276.26 770.75
3.1 657.89 676.70 667.30 16983.76 17651.06 10131.66 751.94
3.2 639.08 657.89 648.49 17651.06 18299.54 10968.24 733.13
3.3 620.27 639.08 629.68 18299.54 18929.22 11786.02 714.32
3.4 601.46 620.27 610.87 18929.22 19540.08 12584.98 695.51
3.5 582.65 601.46 592.06 19540.08 20132.14 13365.14 676.70
3.6 563.84 582.65 573.25 20132.14 20705.38 14126.48 657.89
3.7 545.03 563.84 554.44 20705.38 21259.82 14869.02 639.08
3.8 526.22 545.03 535.63 21259.82 21795.44 15592.74 620.27
3.9 507.41 526.22 516.82 21795.44 22312.26 16297.66 601.46
4 488.60 507.41 498.01 22312.26 22810.26 16983.76 582.65
4.1 469.79 488.60 479.20 22810.26 23289.46 17651.06 563.84
4.2 450.98 469.79 460.39 23289.46 23749.84 18299.54 545.03
4.3 432.17 450.98 441.58 23749.84 24191.42 18929.22 526.22
4.4 413.36 432.17 422.77 24191.42 24614.18 19540.08 507.41
4.5 394.55 413.36 403.96 24614.18 25018.14 20132.14 488.60
4.6 375.74 394.55 385.15 25018.14 25403.28 20705.38 469.79
4.7 356.93 375.74 366.34 25403.28 25769.62 21259.82 450.98
4.8 338.12 356.93 347.53 25769.62 26117.14 21795.44 432.17
4.9 319.31 338.12 328.72 26117.14 26445.86 22312.26 413.36
5 300.50 319.31 309.91 26445.86 26755.76 22810.26 394.55
5.1 281.69 300.50 291.10 26755.76 27046.86 23289.46 375.74
5.2 262.88 281.69 272.29 27046.86 27319.14 23749.84 356.93
5.3 244.07 262.88 253.48 27319.14 27572.62 24191.42 338.12
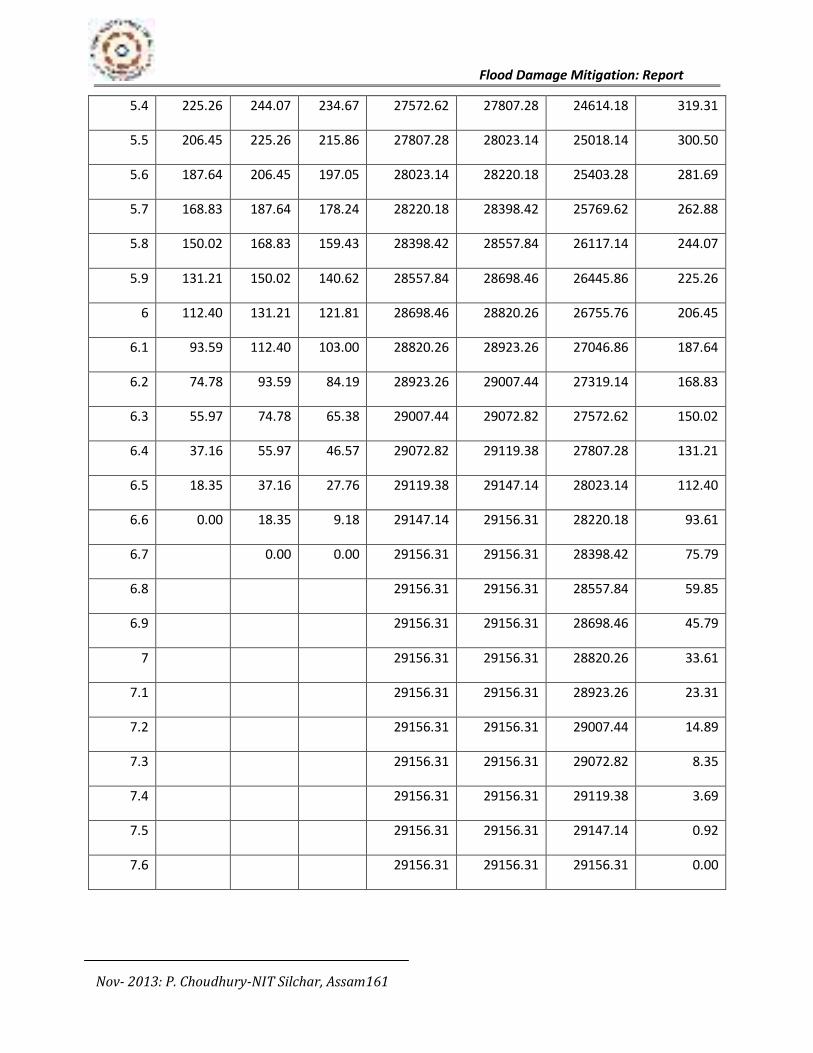
Flood Damage Mitigation: Report
Nov- 2013: P. Choudhury-NIT Silchar, Assam161
5.4 225.26 244.07 234.67 27572.62 27807.28 24614.18 319.31
5.5 206.45 225.26 215.86 27807.28 28023.14 25018.14 300.50
5.6 187.64 206.45 197.05 28023.14 28220.18 25403.28 281.69
5.7 168.83 187.64 178.24 28220.18 28398.42 25769.62 262.88
5.8 150.02 168.83 159.43 28398.42 28557.84 26117.14 244.07
5.9 131.21 150.02 140.62 28557.84 28698.46 26445.86 225.26
6 112.40 131.21 121.81 28698.46 28820.26 26755.76 206.45
6.1 93.59 112.40 103.00 28820.26 28923.26 27046.86 187.64
6.2 74.78 93.59 84.19 28923.26 29007.44 27319.14 168.83
6.3 55.97 74.78 65.38 29007.44 29072.82 27572.62 150.02
6.4 37.16 55.97 46.57 29072.82 29119.38 27807.28 131.21
6.5 18.35 37.16 27.76 29119.38 29147.14 28023.14 112.40
6.6 0.00 18.35 9.18 29147.14 29156.31 28220.18 93.61
6.7
0.00 0.00 29156.31 29156.31 28398.42 75.79
6.8
29156.31 29156.31 28557.84 59.85
6.9
29156.31 29156.31 28698.46 45.79
7
29156.31 29156.31 28820.26 33.61
7.1
29156.31 29156.31 28923.26 23.31
7.2
29156.31 29156.31 29007.44 14.89
7.3
29156.31 29156.31 29072.82 8.35
7.4
29156.31 29156.31 29119.38 3.69
7.5
29156.31 29156.31 29147.14 0.92
7.6
29156.31 29156.31 29156.31 0.00
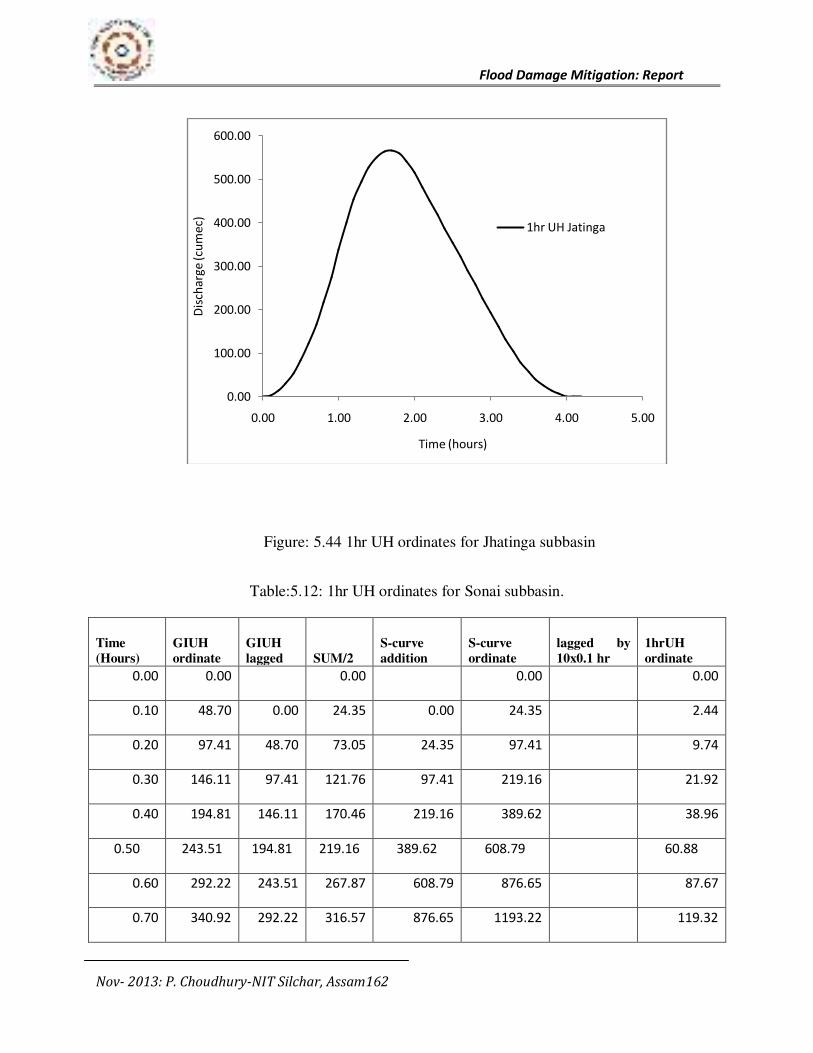
Flood Damage Mitigation: Report
Nov- 2013: P. Choudhury-NIT Silchar, Assam162
Figure: 5.44 1hr UH ordinates for Jhatinga subbasin
Table:5.12: 1hr UH ordinates for Sonai subbasin.
Time
(Hours)
GIUH
ordinate
GIUH
lagged SUM/2
S-curve
addition
S-curve
ordinate
lagged by
10x0.1 hr
1hrUH
ordinate
0.00 0.00
0.00
0.00
0.00
0.10 48.70 0.00 24.35 0.00 24.35
2.44
0.20 97.41 48.70 73.05 24.35 97.41
9.74
0.30 146.11 97.41 121.76 97.41 219.16
21.92
0.40 194.81 146.11 170.46 219.16 389.62
38.96
0.50 243.51 194.81 219.16 389.62 608.79 60.88
0.60 292.22 243.51 267.87 608.79 876.65
87.67
0.70 340.92 292.22 316.57 876.65 1193.22
119.32
0.00
100.00
200.00
300.00
400.00
500.00
600.00
0.00 1.00 2.00 3.00 4.00 5.00
Dis
cha
rge
(cu
me
c)
Time (hours)
1hr UH Jatinga
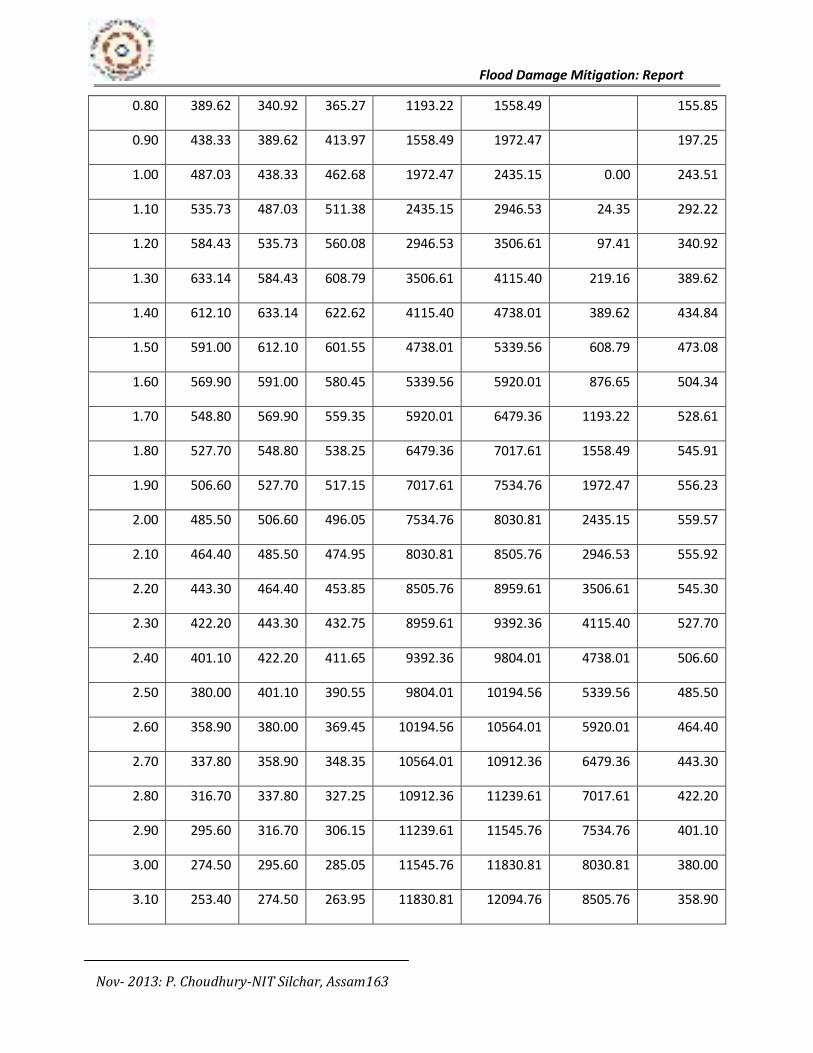
Flood Damage Mitigation: Report
Nov- 2013: P. Choudhury-NIT Silchar, Assam163
0.80 389.62 340.92 365.27 1193.22 1558.49
155.85
0.90 438.33 389.62 413.97 1558.49 1972.47
197.25
1.00 487.03 438.33 462.68 1972.47 2435.15 0.00 243.51
1.10 535.73 487.03 511.38 2435.15 2946.53 24.35 292.22
1.20 584.43 535.73 560.08 2946.53 3506.61 97.41 340.92
1.30 633.14 584.43 608.79 3506.61 4115.40 219.16 389.62
1.40 612.10 633.14 622.62 4115.40 4738.01 389.62 434.84
1.50 591.00 612.10 601.55 4738.01 5339.56 608.79 473.08
1.60 569.90 591.00 580.45 5339.56 5920.01 876.65 504.34
1.70 548.80 569.90 559.35 5920.01 6479.36 1193.22 528.61
1.80 527.70 548.80 538.25 6479.36 7017.61 1558.49 545.91
1.90 506.60 527.70 517.15 7017.61 7534.76 1972.47 556.23
2.00 485.50 506.60 496.05 7534.76 8030.81 2435.15 559.57
2.10 464.40 485.50 474.95 8030.81 8505.76 2946.53 555.92
2.20 443.30 464.40 453.85 8505.76 8959.61 3506.61 545.30
2.30 422.20 443.30 432.75 8959.61 9392.36 4115.40 527.70
2.40 401.10 422.20 411.65 9392.36 9804.01 4738.01 506.60
2.50 380.00 401.10 390.55 9804.01 10194.56 5339.56 485.50
2.60 358.90 380.00 369.45 10194.56 10564.01 5920.01 464.40
2.70 337.80 358.90 348.35 10564.01 10912.36 6479.36 443.30
2.80 316.70 337.80 327.25 10912.36 11239.61 7017.61 422.20
2.90 295.60 316.70 306.15 11239.61 11545.76 7534.76 401.10
3.00 274.50 295.60 285.05 11545.76 11830.81 8030.81 380.00
3.10 253.40 274.50 263.95 11830.81 12094.76 8505.76 358.90
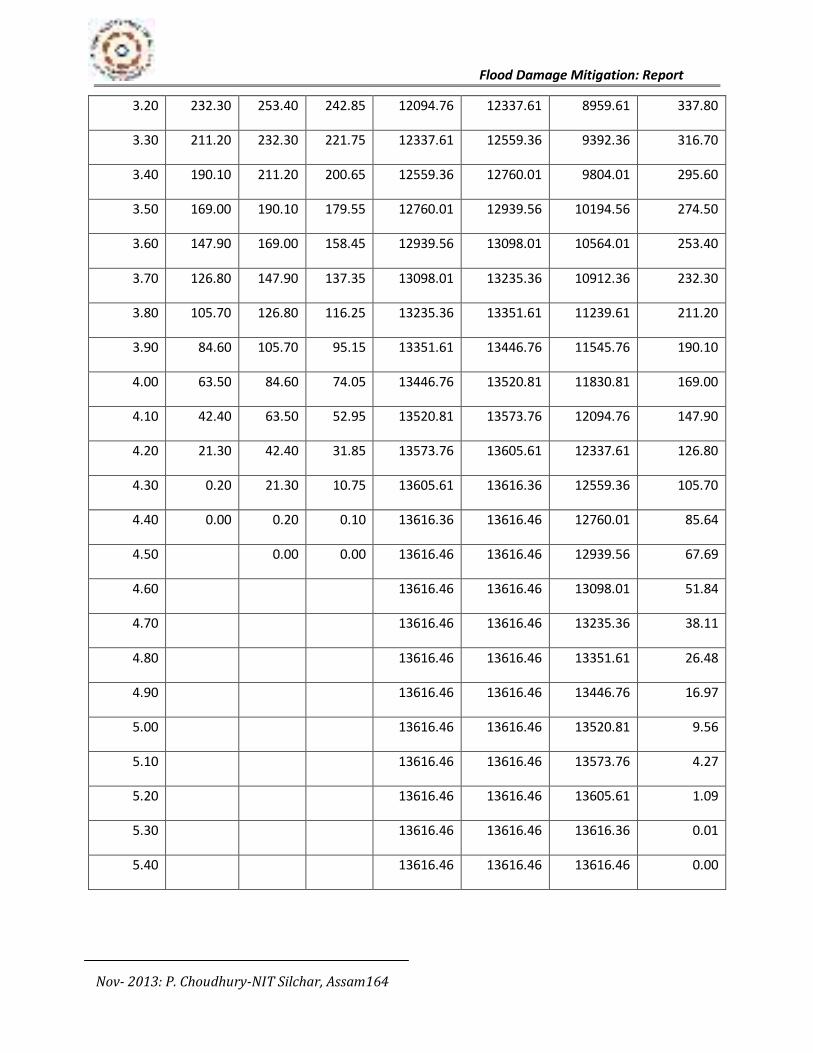
Flood Damage Mitigation: Report
Nov- 2013: P. Choudhury-NIT Silchar, Assam164
3.20 232.30 253.40 242.85 12094.76 12337.61 8959.61 337.80
3.30 211.20 232.30 221.75 12337.61 12559.36 9392.36 316.70
3.40 190.10 211.20 200.65 12559.36 12760.01 9804.01 295.60
3.50 169.00 190.10 179.55 12760.01 12939.56 10194.56 274.50
3.60 147.90 169.00 158.45 12939.56 13098.01 10564.01 253.40
3.70 126.80 147.90 137.35 13098.01 13235.36 10912.36 232.30
3.80 105.70 126.80 116.25 13235.36 13351.61 11239.61 211.20
3.90 84.60 105.70 95.15 13351.61 13446.76 11545.76 190.10
4.00 63.50 84.60 74.05 13446.76 13520.81 11830.81 169.00
4.10 42.40 63.50 52.95 13520.81 13573.76 12094.76 147.90
4.20 21.30 42.40 31.85 13573.76 13605.61 12337.61 126.80
4.30 0.20 21.30 10.75 13605.61 13616.36 12559.36 105.70
4.40 0.00 0.20 0.10 13616.36 13616.46 12760.01 85.64
4.50
0.00 0.00 13616.46 13616.46 12939.56 67.69
4.60
13616.46 13616.46 13098.01 51.84
4.70
13616.46 13616.46 13235.36 38.11
4.80
13616.46 13616.46 13351.61 26.48
4.90
13616.46 13616.46 13446.76 16.97
5.00
13616.46 13616.46 13520.81 9.56
5.10
13616.46 13616.46 13573.76 4.27
5.20
13616.46 13616.46 13605.61 1.09
5.30
13616.46 13616.46 13616.36 0.01
5.40
13616.46 13616.46 13616.46 0.00
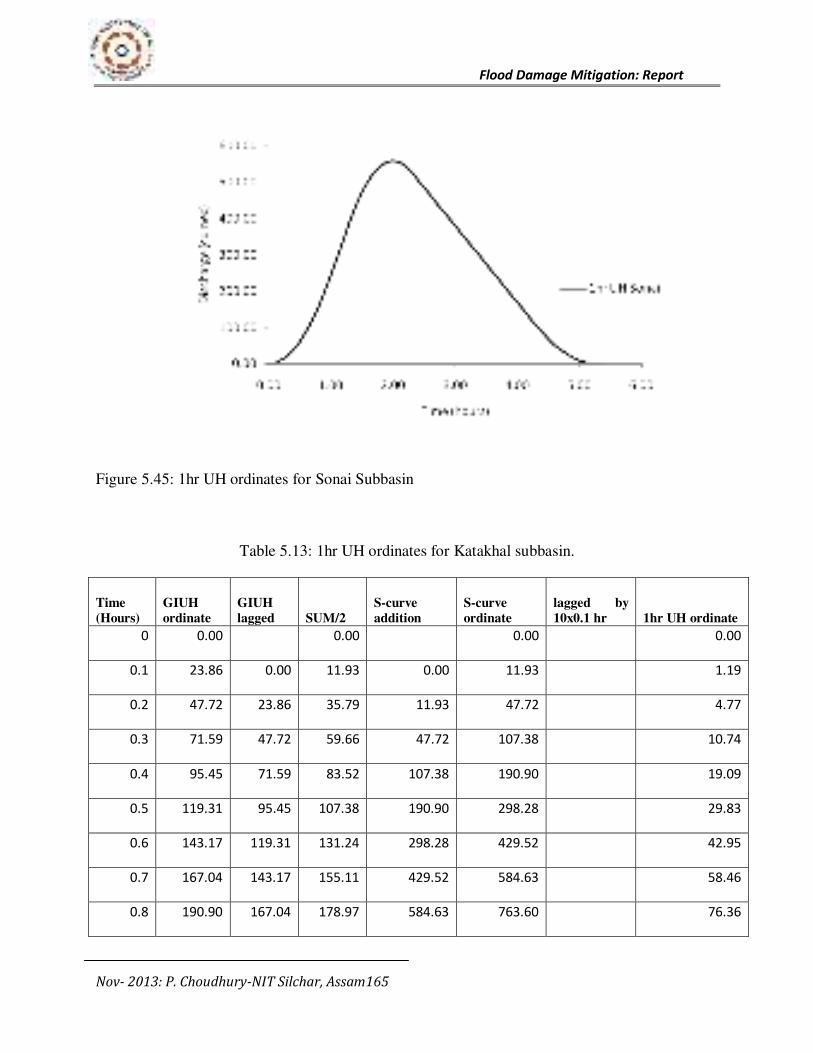
Flood Damage Mitigation: Report
Nov- 2013: P. Choudhury-NIT Silchar, Assam165
Figure 5.45: 1hr UH ordinates for Sonai Subbasin
Table 5.13: 1hr UH ordinates for Katakhal subbasin.
Time
(Hours)
GIUH
ordinate
GIUH
lagged SUM/2
S-curve
addition
S-curve
ordinate
lagged by
10x0.1 hr 1hr UH ordinate
0 0.00
0.00
0.00
0.00
0.1 23.86 0.00 11.93 0.00 11.93
1.19
0.2 47.72 23.86 35.79 11.93 47.72
4.77
0.3 71.59 47.72 59.66 47.72 107.38
10.74
0.4 95.45 71.59 83.52 107.38 190.90
19.09
0.5 119.31 95.45 107.38 190.90 298.28
29.83
0.6 143.17 119.31 131.24 298.28 429.52
42.95
0.7 167.04 143.17 155.11 429.52 584.63
58.46
0.8 190.90 167.04 178.97 584.63 763.60
76.36
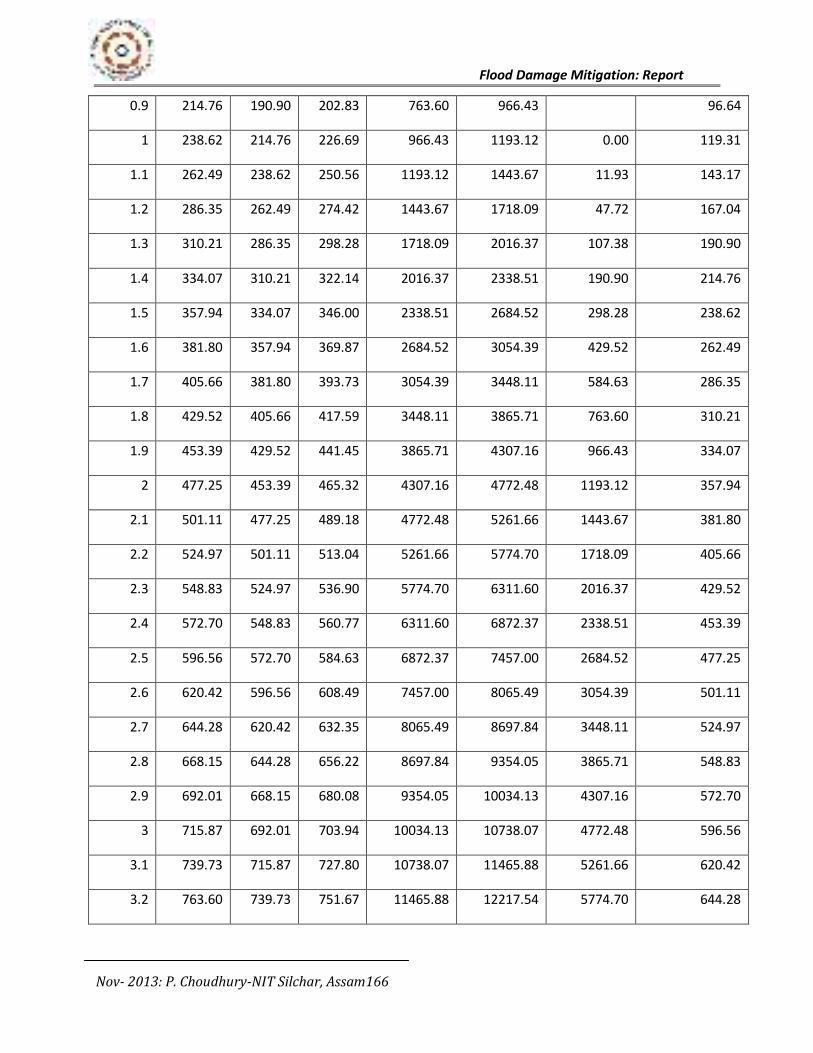
Flood Damage Mitigation: Report
Nov- 2013: P. Choudhury-NIT Silchar, Assam166
0.9 214.76 190.90 202.83 763.60 966.43
96.64
1 238.62 214.76 226.69 966.43 1193.12 0.00 119.31
1.1 262.49 238.62 250.56 1193.12 1443.67 11.93 143.17
1.2 286.35 262.49 274.42 1443.67 1718.09 47.72 167.04
1.3 310.21 286.35 298.28 1718.09 2016.37 107.38 190.90
1.4 334.07 310.21 322.14 2016.37 2338.51 190.90 214.76
1.5 357.94 334.07 346.00 2338.51 2684.52 298.28 238.62
1.6 381.80 357.94 369.87 2684.52 3054.39 429.52 262.49
1.7 405.66 381.80 393.73 3054.39 3448.11 584.63 286.35
1.8 429.52 405.66 417.59 3448.11 3865.71 763.60 310.21
1.9 453.39 429.52 441.45 3865.71 4307.16 966.43 334.07
2 477.25 453.39 465.32 4307.16 4772.48 1193.12 357.94
2.1 501.11 477.25 489.18 4772.48 5261.66 1443.67 381.80
2.2 524.97 501.11 513.04 5261.66 5774.70 1718.09 405.66
2.3 548.83 524.97 536.90 5774.70 6311.60 2016.37 429.52
2.4 572.70 548.83 560.77 6311.60 6872.37 2338.51 453.39
2.5 596.56 572.70 584.63 6872.37 7457.00 2684.52 477.25
2.6 620.42 596.56 608.49 7457.00 8065.49 3054.39 501.11
2.7 644.28 620.42 632.35 8065.49 8697.84 3448.11 524.97
2.8 668.15 644.28 656.22 8697.84 9354.05 3865.71 548.83
2.9 692.01 668.15 680.08 9354.05 10034.13 4307.16 572.70
3 715.87 692.01 703.94 10034.13 10738.07 4772.48 596.56
3.1 739.73 715.87 727.80 10738.07 11465.88 5261.66 620.42
3.2 763.60 739.73 751.67 11465.88 12217.54 5774.70 644.28
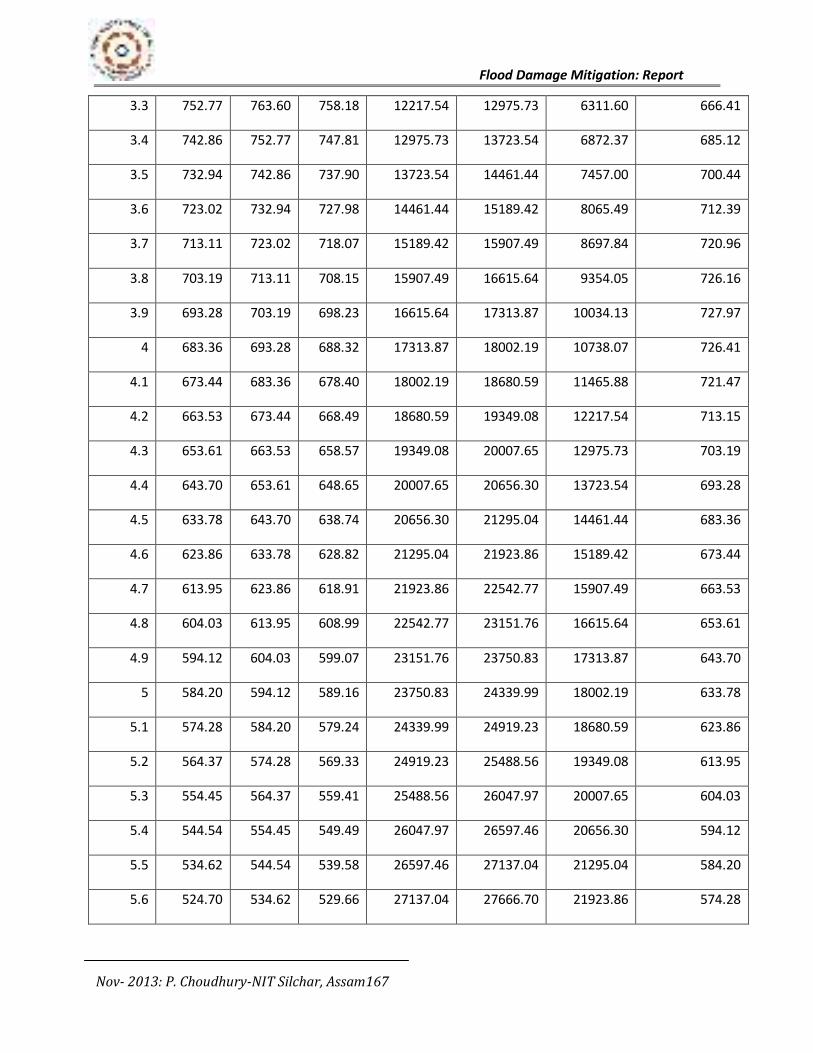
Flood Damage Mitigation: Report
Nov- 2013: P. Choudhury-NIT Silchar, Assam167
3.3 752.77 763.60 758.18 12217.54 12975.73 6311.60 666.41
3.4 742.86 752.77 747.81 12975.73 13723.54 6872.37 685.12
3.5 732.94 742.86 737.90 13723.54 14461.44 7457.00 700.44
3.6 723.02 732.94 727.98 14461.44 15189.42 8065.49 712.39
3.7 713.11 723.02 718.07 15189.42 15907.49 8697.84 720.96
3.8 703.19 713.11 708.15 15907.49 16615.64 9354.05 726.16
3.9 693.28 703.19 698.23 16615.64 17313.87 10034.13 727.97
4 683.36 693.28 688.32 17313.87 18002.19 10738.07 726.41
4.1 673.44 683.36 678.40 18002.19 18680.59 11465.88 721.47
4.2 663.53 673.44 668.49 18680.59 19349.08 12217.54 713.15
4.3 653.61 663.53 658.57 19349.08 20007.65 12975.73 703.19
4.4 643.70 653.61 648.65 20007.65 20656.30 13723.54 693.28
4.5 633.78 643.70 638.74 20656.30 21295.04 14461.44 683.36
4.6 623.86 633.78 628.82 21295.04 21923.86 15189.42 673.44
4.7 613.95 623.86 618.91 21923.86 22542.77 15907.49 663.53
4.8 604.03 613.95 608.99 22542.77 23151.76 16615.64 653.61
4.9 594.12 604.03 599.07 23151.76 23750.83 17313.87 643.70
5 584.20 594.12 589.16 23750.83 24339.99 18002.19 633.78
5.1 574.28 584.20 579.24 24339.99 24919.23 18680.59 623.86
5.2 564.37 574.28 569.33 24919.23 25488.56 19349.08 613.95
5.3 554.45 564.37 559.41 25488.56 26047.97 20007.65 604.03
5.4 544.54 554.45 549.49 26047.97 26597.46 20656.30 594.12
5.5 534.62 544.54 539.58 26597.46 27137.04 21295.04 584.20
5.6 524.70 534.62 529.66 27137.04 27666.70 21923.86 574.28
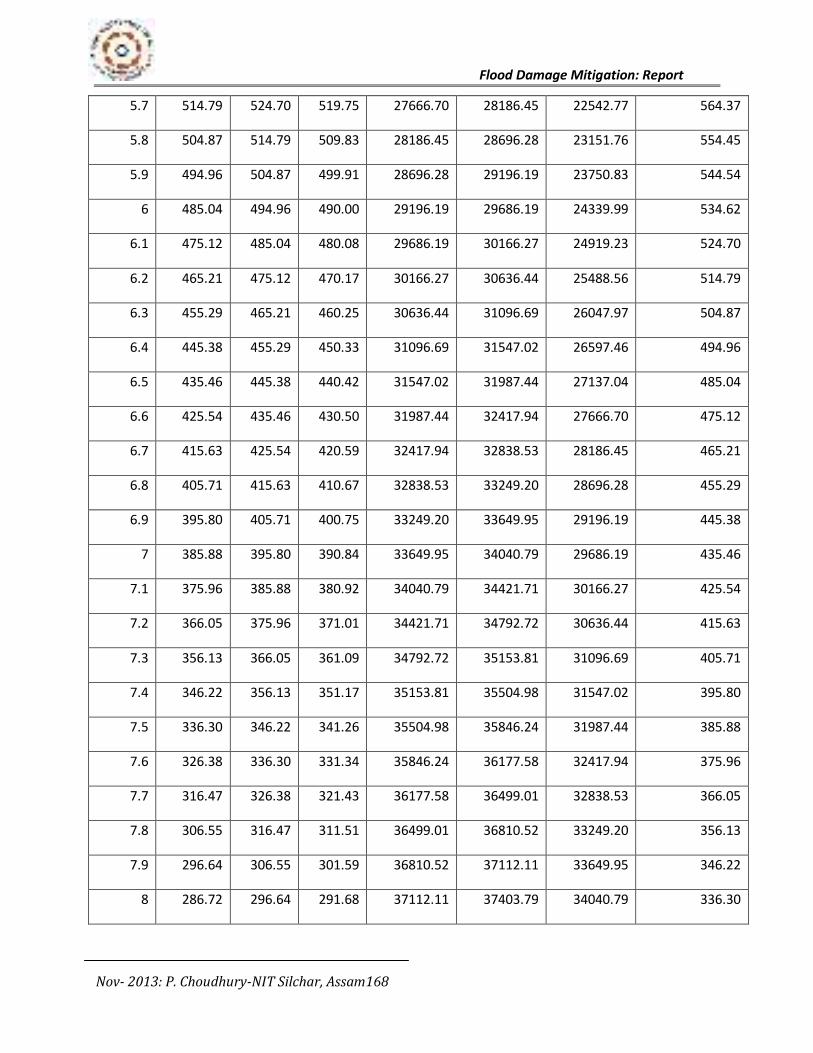
Flood Damage Mitigation: Report
Nov- 2013: P. Choudhury-NIT Silchar, Assam168
5.7 514.79 524.70 519.75 27666.70 28186.45 22542.77 564.37
5.8 504.87 514.79 509.83 28186.45 28696.28 23151.76 554.45
5.9 494.96 504.87 499.91 28696.28 29196.19 23750.83 544.54
6 485.04 494.96 490.00 29196.19 29686.19 24339.99 534.62
6.1 475.12 485.04 480.08 29686.19 30166.27 24919.23 524.70
6.2 465.21 475.12 470.17 30166.27 30636.44 25488.56 514.79
6.3 455.29 465.21 460.25 30636.44 31096.69 26047.97 504.87
6.4 445.38 455.29 450.33 31096.69 31547.02 26597.46 494.96
6.5 435.46 445.38 440.42 31547.02 31987.44 27137.04 485.04
6.6 425.54 435.46 430.50 31987.44 32417.94 27666.70 475.12
6.7 415.63 425.54 420.59 32417.94 32838.53 28186.45 465.21
6.8 405.71 415.63 410.67 32838.53 33249.20 28696.28 455.29
6.9 395.80 405.71 400.75 33249.20 33649.95 29196.19 445.38
7 385.88 395.80 390.84 33649.95 34040.79 29686.19 435.46
7.1 375.96 385.88 380.92 34040.79 34421.71 30166.27 425.54
7.2 366.05 375.96 371.01 34421.71 34792.72 30636.44 415.63
7.3 356.13 366.05 361.09 34792.72 35153.81 31096.69 405.71
7.4 346.22 356.13 351.17 35153.81 35504.98 31547.02 395.80
7.5 336.30 346.22 341.26 35504.98 35846.24 31987.44 385.88
7.6 326.38 336.30 331.34 35846.24 36177.58 32417.94 375.96
7.7 316.47 326.38 321.43 36177.58 36499.01 32838.53 366.05
7.8 306.55 316.47 311.51 36499.01 36810.52 33249.20 356.13
7.9 296.64 306.55 301.59 36810.52 37112.11 33649.95 346.22
8 286.72 296.64 291.68 37112.11 37403.79 34040.79 336.30
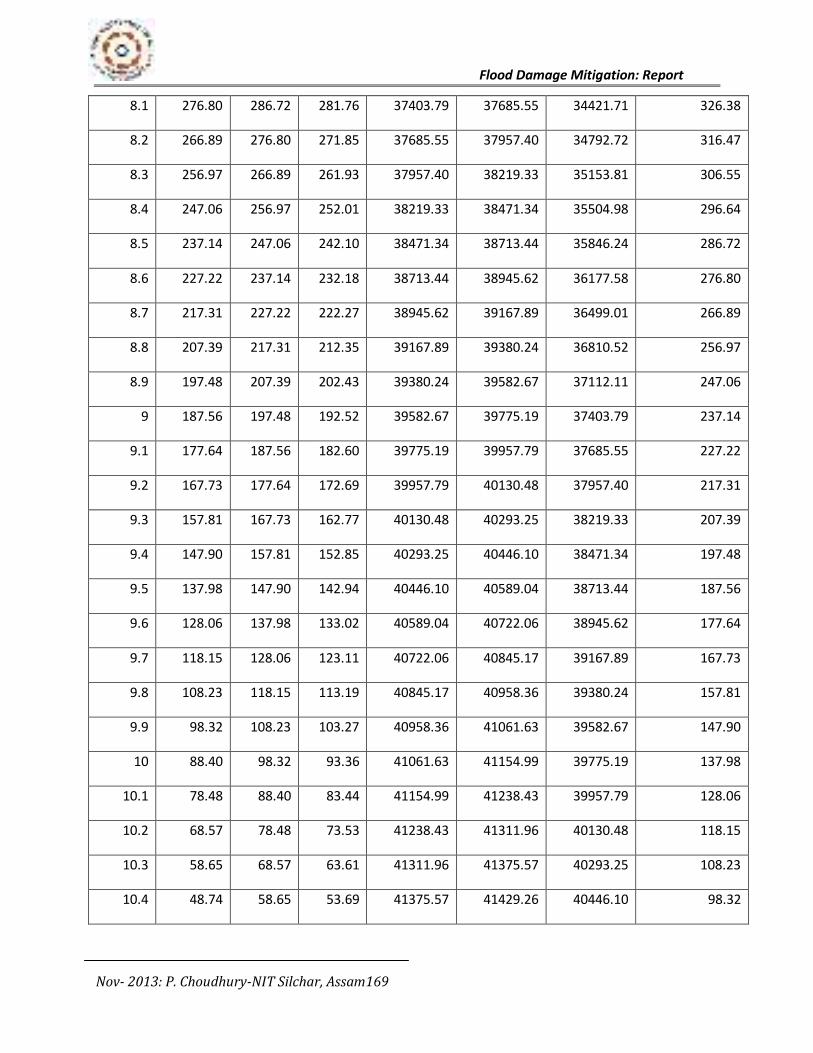
Flood Damage Mitigation: Report
Nov- 2013: P. Choudhury-NIT Silchar, Assam169
8.1 276.80 286.72 281.76 37403.79 37685.55 34421.71 326.38
8.2 266.89 276.80 271.85 37685.55 37957.40 34792.72 316.47
8.3 256.97 266.89 261.93 37957.40 38219.33 35153.81 306.55
8.4 247.06 256.97 252.01 38219.33 38471.34 35504.98 296.64
8.5 237.14 247.06 242.10 38471.34 38713.44 35846.24 286.72
8.6 227.22 237.14 232.18 38713.44 38945.62 36177.58 276.80
8.7 217.31 227.22 222.27 38945.62 39167.89 36499.01 266.89
8.8 207.39 217.31 212.35 39167.89 39380.24 36810.52 256.97
8.9 197.48 207.39 202.43 39380.24 39582.67 37112.11 247.06
9 187.56 197.48 192.52 39582.67 39775.19 37403.79 237.14
9.1 177.64 187.56 182.60 39775.19 39957.79 37685.55 227.22
9.2 167.73 177.64 172.69 39957.79 40130.48 37957.40 217.31
9.3 157.81 167.73 162.77 40130.48 40293.25 38219.33 207.39
9.4 147.90 157.81 152.85 40293.25 40446.10 38471.34 197.48
9.5 137.98 147.90 142.94 40446.10 40589.04 38713.44 187.56
9.6 128.06 137.98 133.02 40589.04 40722.06 38945.62 177.64
9.7 118.15 128.06 123.11 40722.06 40845.17 39167.89 167.73
9.8 108.23 118.15 113.19 40845.17 40958.36 39380.24 157.81
9.9 98.32 108.23 103.27 40958.36 41061.63 39582.67 147.90
10 88.40 98.32 93.36 41061.63 41154.99 39775.19 137.98
10.1 78.48 88.40 83.44 41154.99 41238.43 39957.79 128.06
10.2 68.57 78.48 73.53 41238.43 41311.96 40130.48 118.15
10.3 58.65 68.57 63.61 41311.96 41375.57 40293.25 108.23
10.4 48.74 58.65 53.69 41375.57 41429.26 40446.10 98.32
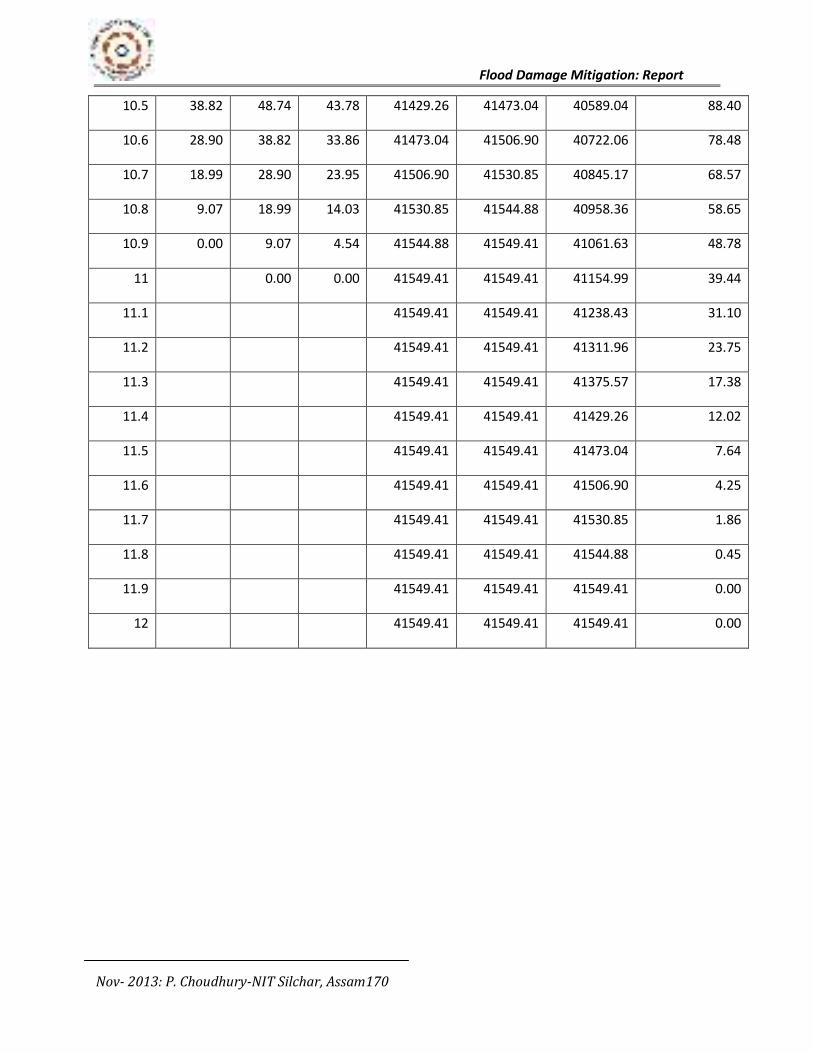
Flood Damage Mitigation: Report
Nov- 2013: P. Choudhury-NIT Silchar, Assam170
10.5 38.82 48.74 43.78 41429.26 41473.04 40589.04 88.40
10.6 28.90 38.82 33.86 41473.04 41506.90 40722.06 78.48
10.7 18.99 28.90 23.95 41506.90 41530.85 40845.17 68.57
10.8 9.07 18.99 14.03 41530.85 41544.88 40958.36 58.65
10.9 0.00 9.07 4.54 41544.88 41549.41 41061.63 48.78
11
0.00 0.00 41549.41 41549.41 41154.99 39.44
11.1
41549.41 41549.41 41238.43 31.10
11.2
41549.41 41549.41 41311.96 23.75
11.3
41549.41 41549.41 41375.57 17.38
11.4
41549.41 41549.41 41429.26 12.02
11.5
41549.41 41549.41 41473.04 7.64
11.6
41549.41 41549.41 41506.90 4.25
11.7
41549.41 41549.41 41530.85 1.86
11.8
41549.41 41549.41 41544.88 0.45
11.9
41549.41 41549.41 41549.41 0.00
12
41549.41 41549.41 41549.41 0.00
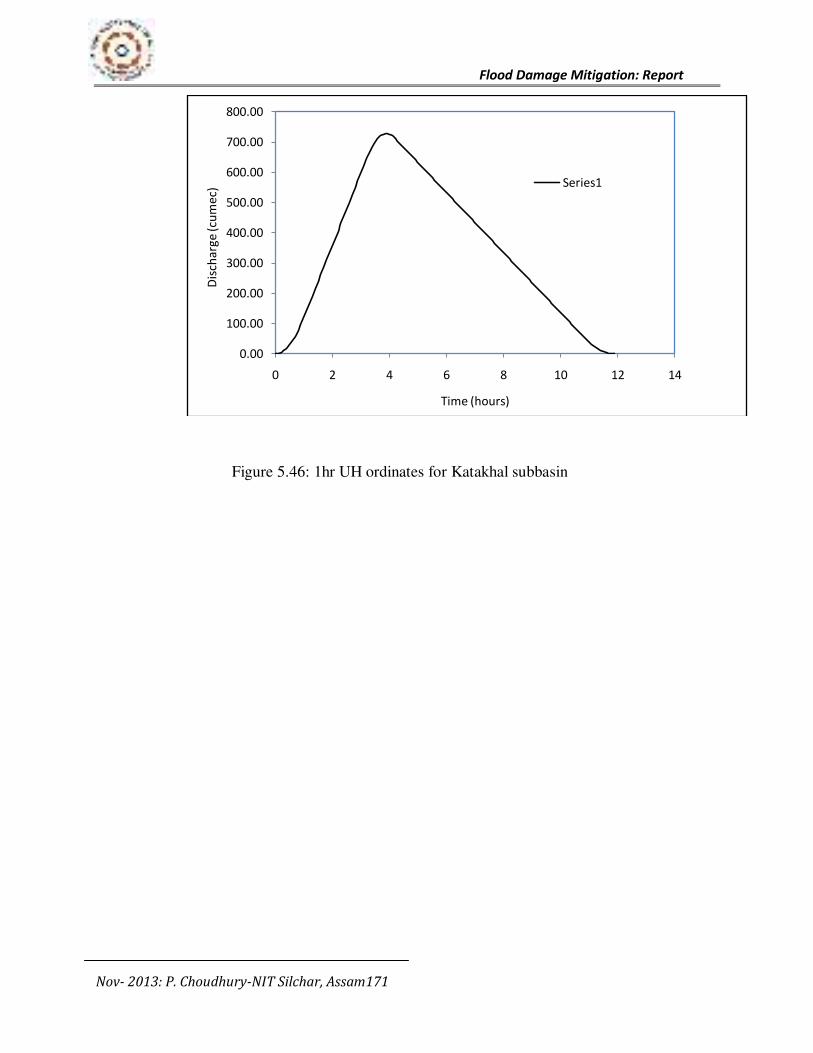
Flood Damage Mitigation: Report
Nov- 2013: P. Choudhury-NIT Silchar, Assam171
Figure 5.46: 1hr UH ordinates for Katakhal subbasin
0.00
100.00
200.00
300.00
400.00
500.00
600.00
700.00
800.00
0 2 4 6 8 10 12 14
Dis
cha
rge
(cu
me
c)
Time (hours)
Series1