Embed Size (px)
Citation preview

WORKING DRAFT
Last Modified 19.05.2011 10:06:16 W. Europe Standard Time
Printed 18.05.2011 17:17:00 W. Europe Standard Time
VGI-AAA123-20101217-
May 19th, 2011
CONFIDENTIAL AND PROPRIETARY
Any use of this material without specific permission of McKinsey & Company is strictly prohibited
EyeForTransport
2nd horizontal collaboration
in the supply chain summit
Conference

McKinsey & Company
This presentation aims to inform individual decisions Disclaimer
SOURCE: McKinsey
▪ This presentation aims to provide an objective framework for assessing
horizontal collaboration opportunities in logistics. The outlined ideas for a
formal collaboration of industry players are preliminary. They are based
on the hypothesis such collaboration would enhance overall market
efficiency and benefit consumers/counterparties
▪ Companies and decision-makers need to assess the validity of the
frameworks and arguments individually and take business decisions
individually as appropriate in the specific business context
▪ Such collaboration would very likely have significant legal implications,
e.g., with regards to anti-trust conformity. Companies should assess such
implications individually and take appropriate steps to ensure company
action is in line with the relevant legal framework and regulations
▪ Any use of this material without specific permission of McKinsey &
Company is strictly prohibited

McKinsey & Company
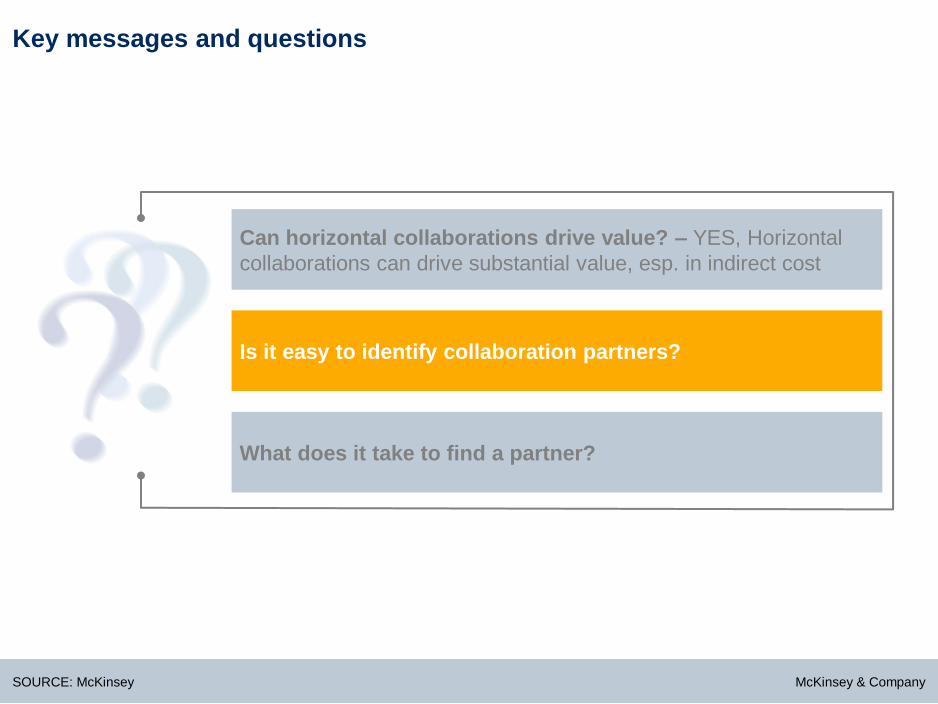
Key messages and questions
Is it easy to identify collaboration partners?
Can horizontal collaborations drive value?
What does it take to find a partner?
SOURCE: McKinsey
McKinsey & Company
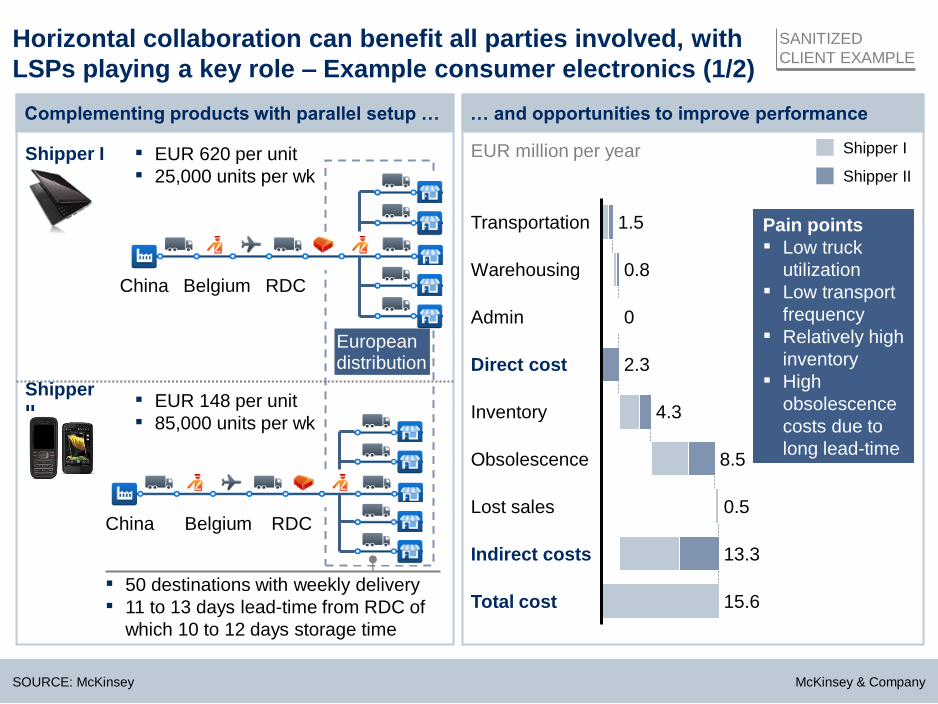
Horizontal collaboration can benefit all parties involved, with
LSPs playing a key role – Example consumer electronics (1/2)
Shipper I
Complementing products with parallel setup … … and opportunities to improve performance
▪ EUR 620 per unit
▪ 25,000 units per wk
China Belgium RDC
Total cost 15.6
Indirect costs 13.3
Lost sales 0.5
Obsolescence 8.5
Inventory 4.3
Direct cost 2.3
Admin 0
Warehousing 0.8
Transportation 1.5
Shipper I
Shipper II
EUR million per year
Shipper
II ▪ EUR 148 per unit
▪ 85,000 units per wk
China Belgium RDC
European distribution
▪ 50 destinations with weekly delivery
▪ 11 to 13 days lead-time from RDC of
which 10 to 12 days storage time
Pain points
▪ Low truck
utilization
▪ Low transport
frequency
▪ Relatively high
inventory
▪ High
obsolescence
costs due to
long lead-time
SANITIZED
CLIENT EXAMPLE
SOURCE: McKinsey

McKinsey & Company
Horizontal collaboration can benefit all parties involved, with
LSPs playing a key role – Example consumer electronics (2/2)
LSP serves Shipper I and II
Total cost 4.5
Indirect costs 4.1
Lost sales 0.3
Obsolescence 2.3
Inventory 1.5
Direct cost 0.4
Admin 0
Warehousing 0
Transportation 0.4
Savings
Shipper I: 30%
Shipper II: 22%
Collaborative set-up improves service level performance resulting in major savings for both parties
Shipper I Shipper II
▪ Lower transport costs due
to higher truck utilization
▪ Double delivery frequency
enabling decrease of
storage time and costs
▪ Optimize inventory levels
enabled by increased
delivery frequency
▪ Reduce obsolescence by
speeding up supply chain
(decrease storage time)
▪ Avoid lost-sales where
possible
Savings
EUR million per year
SANITIZED
CLIENT EXAMPLE
SOURCE: McKinsey
McKinsey & Company
Key messages and questions
Is it easy to identify collaboration partners?
Can horizontal collaborations drive value? – YES, Horizontal
collaborations can drive substantial value, esp. in indirect cost
What does it take to find a partner?
SOURCE: McKinsey

McKinsey & Company
A structured approach can help to maximize the chances
of finding the right collaboration opportunity and partner
Key barriers to horizontal
collaboration
Lack of widespread acceptance
Difficulty to
establish
trust-based
relationships
Difficulty to
finding appro-
priate partner
Fear of information disclosure
No IT
infrastructure/
support
Lack of clarity
who in charge
Designing the solution Building the case Implementation
What could the optimal solution look like?
How best to practically implement?
How best to maintain col-laboration?
I II III
A B A B A B
Typical implementation and
maintenance challenges
mentioned by less than 25%
of respondents
2 - 3 weeks 6 - 8 weeks 12+ weeks Continuous
What is the baseline and the size of the opportunity?
What is your horizontal collaboration model/thrust?
Who are the best partners?
Focus of today’s
discussion
SOURCE: McKinsey

McKinsey & Company
For shippers – 3 major options for collaboration models and
roles within
SOURCE: McKinsey
Convened
collaboration
"Primus inter
pares"
collaboration
"Inter pares"
collaboration
31% of shippers
without own
capabilities to
orchestrate
Critical
mass/
capability
already
reached
Want to
drive
collabora-
tion
Own
ability to
orchestrate
collabora-
tion
Yes Yes
No
No
No
Yes ▪ 23% of shippers who
would act as organiser
High-level decision logic
▪ Envirotainer
▪ Chep
▪ Credit cards
▪ Tall-EX
▪ Cat
Logistics
▪ Carrefour
Example Characteristics
▪ Industry platforms
mostly organized by
neutral party outside
core activity, e.g.,
3PL
▪ Large player with
sufficient critical
scale offer existing
network to smaller
competitors or
complementary
product shippers
▪ Group of players
with subcritical but
typically similar
sized operations
consolidate exist-
ing or set-up new
joined activities
▪ Pharma
Log

McKinsey & Company
Who participated in the survey?
38
25
36
Other
LSP
Shipper
What best describes your current business model?
SOURCE: McKinsey, EFT 2010/2011
28
25
47
2010 survey 2011 survey

McKinsey & Company
2010 survey 2011 survey
The preferred collaboration model changed from inter-pares in 2010 to
convened collaboration in 2011 What best describes in general your preferred collaboration model?, in %
31
16
11
11
18
13
Inter-pares collaboration –
initiator
Inter-pares collaboration –
member
Primus inter-pares
collaboration – primus
Primus-inter-pares
collaboration –member
Convened collaboration –
convener
Convened collaboration –
member
19
6
19
3
25
28
SOURCE: McKinsey, EFT 2010/2011

McKinsey & Company
Especially for inter-pares collaboration agreeing on the collaboration
depth is important
SOURCE: McKinsey
Joint distributor
▪ Owning inventory
▪ Comprehensive logistics
management
Low
Coverage of logistics value chain
High
Low
Inte
nsit
y/n
on
-reve
rsib
ilit
y o
f
co
llab
ora
tio
n c
om
mit
men
t
High
JV/Carve-out into own
logistics service operator
▪ Own assets
▪ Shared information services
(esp. Order management,
forecasting, demand planning)
Joint logistics management
▪ Transport management
▪ Warehouse management
Joint procurement of
commodity services
▪ Esp. Transport
▪ Warehousing

McKinsey & Company
We learned that most participants are interested in joint logistics
management
13
21
48
18
Joint distributor, i.e., owning
inventory, owning operations, …
JV/Carve-out into own
logistics service operator
with own services, shared
information, …
Joint logistics management
(e.g., transport management,
warehouse management, …)
Joint procurement of single
commodity services (esp.
Trucking, warehousing, …)
What best describes your preferred depth of collaboration?, in
%
6
9
53
31
2010 survey 2011 survey
SOURCE: McKinsey, EFT 2010/2011

McKinsey & Company
Identification of partners requires screening from different lenses
SOURCE: McKinsey
Commonality of supply chain lenses (assessing potential for scale advantages
and a positive business case)
Other lenses
Supply chain segment lense ▪ What part of the supply
chain needs to be covered, e.g., inbound, outbound, distribution, reverse?
Geographic overlap lense ▪ What distribution/
warehousing footprint? ▪ What trade-lane set-up?
Supply chain needs lense ▪ What requirements in
terms of speed, reliability and flexibility?
Product characteristics lense ▪ What special handling
requirements? ▪ What licensing/
auditing needs?
Objective lenses ▪ What benefits/
capabilities needs the partner to bring, e.g., volume, skill, market access, financing clout, ..?
Industry conduct lense ▪ Possibility/feasibi-
lity to collaborate with competitors?
KPI lense ▪ Shared success
measures across financial, operational, and consumer-based dimensions?
People lense ▪ Common agenda and
joint willingness to make it happen?
▪ Mutual trust?

McKinsey & Company
2011 survey
The biggest opportunities on inbound lanes are expected from China into
Europe…
…Eastern Europe and Russia
…Africa
…India
…South East Asia (incl. Australia)
… Japan/Korea
… China
…North America
…South America
For which of the following inbound lanes would you expect the best collaboration opportunities, in %
SOURCE: McKinsey, EFT 2011
Into Europe from…
3
3
34
3
6
3
6
42

McKinsey & Company
…and on outbound lanes from Europe into Eastern Europe and Russia For which of the following outbound lanes would you expect the best collaboration opportunities, in %
SOURCE: McKinsey, EFT 2010/2011
2010 survey 2011 survey
2
15
46
15
0
6
2
13
…South America
…North America
…Eastern Europe and Russia
…Africa
…India
…South East Asia (incl. Australia)
… Japan/Korea
… China
From Europe into…
13
25
50
6
0
0
0
6

McKinsey & Company
2010 survey 2011 survey
Overall, best collaboration opportunities in distribution are expected for
Benelux
29
10
10
16
17
3
14
Eastern Europe (Poland,
Czech Rep., …)
South Eastern Europe
(Italy, Greece, Croatia, …)
South-Western Europe
(France, Iberia)
Central (Germany,
Austria, Switzerland)
Benelux
Nordics
UK/Ireland
For which of the following distribution regions would you expect the best collaboration opportunities?, in %
SOURCE: McKinsey, EFT 2010/2011
16
13
22
16
28
0
6
McKinsey & Company
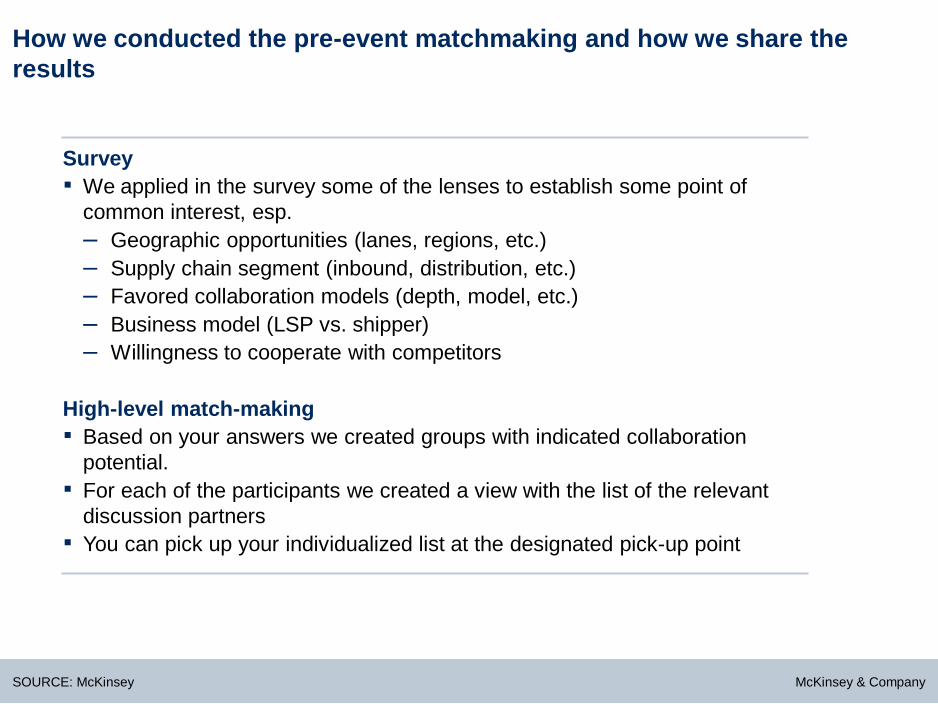
How we conducted the pre-event matchmaking and how we share the
results
SOURCE: McKinsey
Survey
▪ We applied in the survey some of the lenses to establish some point of
common interest, esp.
– Geographic opportunities (lanes, regions, etc.)
– Supply chain segment (inbound, distribution, etc.)
– Favored collaboration models (depth, model, etc.)
– Business model (LSP vs. shipper)
– Willingness to cooperate with competitors
High-level match-making
▪ Based on your answers we created groups with indicated collaboration
potential.
▪ For each of the participants we created a view with the list of the relevant
discussion partners
▪ You can pick up your individualized list at the designated pick-up point

McKinsey & Company
Key messages and questions
Is it easy to identify collaboration partners? – NO, but with a
fact-based systematic approach it can be done with limited effort
Can horizontal collaborations drive value? – YES, Horizontal
collaborations can drive substantial value, esp. in indirect cost
What does it take to find a partner – WELL, Let's find out!
SOURCE: McKinsey
EXAMPLES

McKinsey & Company
The case comprises a setup of shippers and LSPs being active in three
regions with two products
SOURCE: McKinsey
Region North Region South Region West
Case description
▪ The market consists of 3
regions and 2 products
▪ There are 3 shippers active
in this market
▪ 2 LSPs are offering
services in this market
Product A
Product B
1 2 3
1 2
LSP 1
LSP 2
LSP 1
LSP 2
LSP 2 Shipper 1
Shipper 2
LSP 1 Shipper 1
Shipper 1
Shipper 1
Shipper 2
Shipper 3 LSP 1
LSP 2
LSP 1
LSP 2 Shipper 1
Shipper 3
Shipper 1
McKinsey & Company
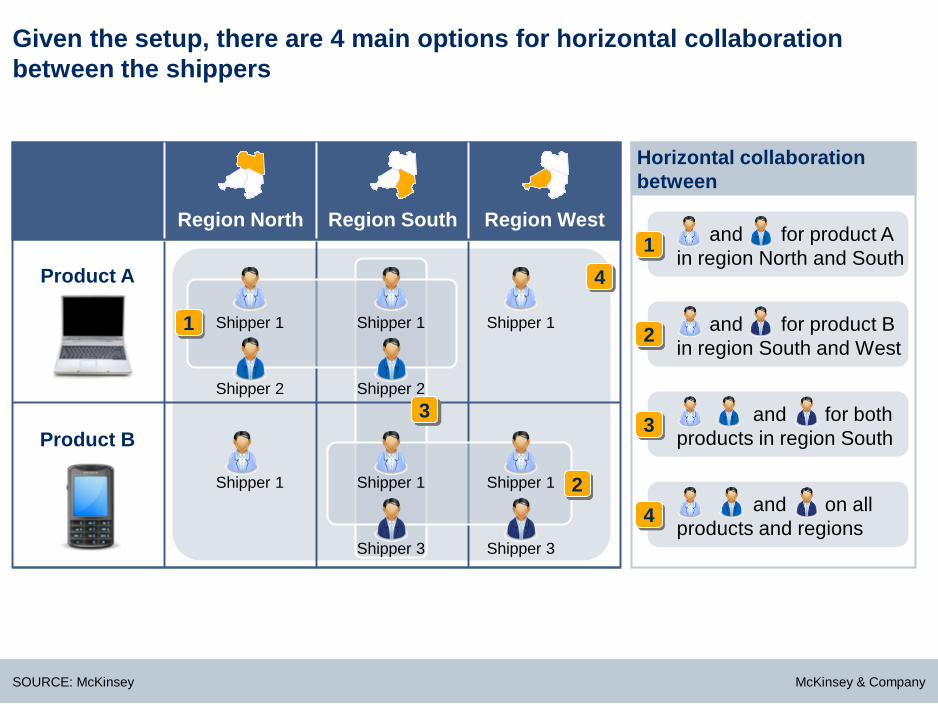
Region North Region South Region West
Given the setup, there are 4 main options for horizontal collaboration
between the shippers
SOURCE: McKinsey
Horizontal collaboration
between
for product A
in region North and South
and 1
for product B
in region South and West
and 2
for both
products in region South
and 3
on all
products and regions
and 4
Product A 4
1
Product B
2
3
Shipper 1
Shipper 2
Shipper 1
Shipper 2
Shipper 1
Shipper 1 Shipper 1
Shipper 3
Shipper 1
Shipper 3

McKinsey & Company
It is your task now to find the collaboration model which creates the
most value
SOURCE: McKinsey
1. Please gather in groups of 5
Each group will receive an envelope with a role
card for each of the players, i.e. three shippers and
two LSPs
Each briefing note contains a negotiation mandate
from your board and some additional information
You have 20 minutes to sign a final agreement
Once you are done, please let us know your results
and place the contracts back into the team
envelope
5.
4.
2.
3.

McKinsey & Company
Collaboration
option
Gain share
for LSP
Contract template horizontal collaboration
SOURCE: McKinsey
LSP partner LSP 1 LSP 2
No Yes – 5%
Gain share
for shipper Equal By volume
Signature
shipper 1
Signature
shipper 2
Signature
shipper 3
Signature
LSP 1
Signature
LSP 2

McKinsey & Company
Contract template price discount
SOURCE: McKinsey
Signature
shipper 1
Signature
shipper 2
Signature
shipper 3
Signature
LSP 1
Signature
LSP 2
Region North Region South Region West
Product A
Product B
Shipper 1
Shipper 2
Shipper 3
Shipper 1
V:
P:
V:
P:
V:
P:
–
V:
P:
V:
P:
V:
P:
V:
P:
V:
P:
–
V:
P:
V:
P:
Fill the results for volume and price1 negotiations and sign the contract V = Volume in units/week
P = Price in USD
1 Current price laptop: USD 0,77; current price mobile phones: USD 0,30

McKinsey & Company
Let‘s see, what you settled for?
SOURCE: McKinsey
Group 1-
Only volume
information
Group 2-
LSP 1
advantage
Group 3-
Full
transparency
Shipper 1 Shipper 2 Shipper 3 LSP 2 LSP 1
Business
case for
shippers
and own
Business
case for
shippers
and own
Own
business
case
Own
business
case
Own
business
case
Business
case for
all
Business
case for
all
Business
case for
all
Own
Business
case
Own
volumes
and costs
Own
volumes
and costs
Own
volumes
and costs

McKinsey & Company
Collaboration amongst all players drives the highest savings
400
300
500
1,000
Total logistics costs savings in USD thsd
SOURCE: McKinsey

McKinsey & Company
All parties involved benefit from horizontal collaboration
Horizontal collaboration model
Transportation 160
196
Admin 1
Warehousing 35
Total cost 1,027
Indirect costs 831
Lost sales 1
Obsolescence 385
Inventory 445
Direct cost
Savings
Shipper I: 45%
Shipper II: 47%
Shipper III: 43%
Collaborative set-up improves service level performance resulting in major savings for all parties
▪ Lower transport costs due
to higher truck utilization
▪ Double delivery frequency
enabling decrease of
storage time and costs
▪ Optimize inventory levels
enabled by increased
delivery frequency
▪ Reduce obsolescence by
speeding up supply chain
(decrease storage time)
▪ Avoid lost-sales where
possible
Savings
EUR thousand per year OPTION 4
Shipper 1
Shipper 2
Shipper 3
SOURCE: McKinsey
McKinsey & Company
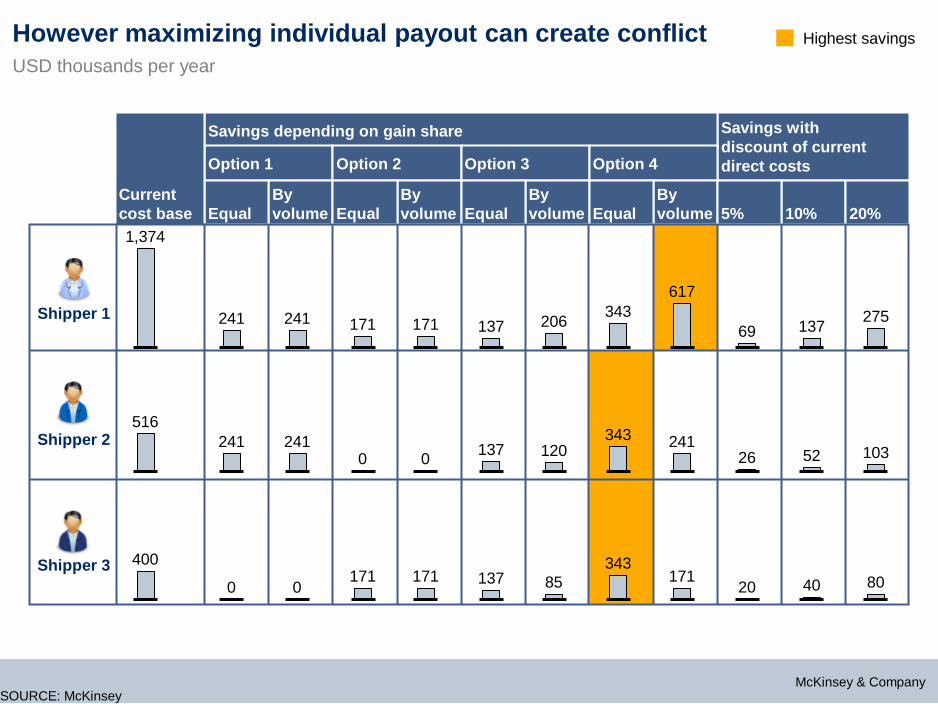
Option 2 Option 3 Option 1 Option 4
Savings with
discount of current
direct costs
Savings depending on gain share
Equal
By
volume Equal
By
volume Equal
By
volume Equal
By
volume 5% 10% 20%
Current
cost base
However maximizing individual payout can create conflict
SOURCE: McKinsey
Shipper 1
USD thousands per year
Highest savings
Shipper 2
Shipper 3
1,374
400
516
241
0
241
241
0
241
171
171
0
171
171
0
137
137
137
206
85
120
343
343
343
617
171
241
69
20
26
137
40
52
275
80
103

McKinsey & Company
LSPs need to win collaborations and ideally participate in gain share,
otherwise substantial profit erosion
SOURCE: McKinsey
Profit in USD thousands per year1 Highest savings
Horizontal collaboration
Option 1 Option 2 Option 3 Option 4
Lose
business
Win
horizontal
collaboration
Propose
horizontal
collaboration
12
17
65
8
18
59
10
18
59
0
20
123
Discount on
contract:
15
14
13
5%
10%
15%
1 Current profit USD 16k

McKinsey & Company
Your collaborations
SOURCE: EFT horizontal collaboration survey January 2010; McKinsey analysis
Group 1-
Only volume
information
Value of 500k
Group 2- Only
own savings
potential
Group 3-
Full business
cases
Value of 300k Value of 400k Value of 1000k
1
1
1
1
1
1
1
1
1
1
1
1
1
1
1
1
1
1
1
1
1
1
1
1
w/ LSP 1
w/ LSP 2

McKinsey & Company
PharmLog is a successful industry platform joint venture
SOURCE: PharmLog Web site; McKinsey
Business model
Joint distribution
system of different
pharma companies
1 Low revenue as medication is not owned by Pharmlog; pure logistics revenue
2 Umsatzrendite
3 Depending on collaboration partner (statement PharmLog)
Collaboration partners
▪ Boehringer
Ingelheim
▪ Merck
▪ Novartis
▪ Schering
▪ SmithKline
Beecham
▪ Viatris
▪ Novartis
▪ AWD Pharma
▪ Novo Nordisk
▪ Others (6)
Further users
▪ EUR 30.4 m1
Key data
(2008)
▪ 0.13%2
Profitability
▪ 236
Employees
▪ 4.75 bn
Packages
▪ 20 - 30%3
Savings
6 collaboration
partners and 9
further users
1 distribution
center – up to 1
million packaging
units per day
Revenues

McKinsey & Company
5
20
12
21
13
46
100
54
29
Total cost
Indirect costs
Obsolescence
Inventory
Lost sales
Direct cost
Administration
Warehousing
Transportation
Value creation goes beyond simple direct cost and efficiency gains
SOURCE: McKinsey
Cost items impacted by horizontal
collaboration
Percent of total value (PC hardware example)
Savings
potential Value levers
▪ Merge truckloads
▪ Redesign network
▪ Decrease storage
▪ Increase capacity utilization
▪ Share information
▪ Optimize demand planning
Reduce stock-outs by
increased frequencies
Optimize by higher frequency
and quicker supply chain
Reduce by quicker supply
chain
Additional benefits
▪ Higher revenues through possibility to
service far flung places
▪ Substantially reduced CO2 emissions

McKinsey & Company
Volume information
SOURCE: McKinsey
GROUP 1+2+3
Shippers and LSPs
Average shipment units/week
Product A
Product B
Region South Region West Region North
1,000
5,000
5,000
1,000
1,000
5,000
1,000
1,000
5,000
5,000
Shipper 1
Shipper 2
Shipper 3
Shipper 1
LSP 1
LSP 2
LSP 1
LSP 2
LSP 2
LSP 1 LSP 2 LSP 2
LSP 1 LSP 1

McKinsey & Company
For shippers – Evaluation of collaboration models
SOURCE: McKinsey
Convened
collaboration
▪ Potentially limited transparency on
direct cost efficiency gains (closed
book)
▪ Additional financing of 3PL margin
▪ Little opportunity to influence the
collaboration model/governance
▪ No disclosure of confidential
information to competitors (3PL acts
as neutral intermediary)
▪ Less effort for shipper in organizing
and carrying out collaboration (clear
governance of convener)
▪ No laborious partner search
Co
llab
ora
tive c
om
ple
xit
y
Pros Cons
"Primus inter
pares"
collaboration
▪ Clear alignment on who is in charge
to make collaboration successful
(Primus inter pares)
▪ Potentially large gains for smaller
shippers due to already existent
scale
▪ Little opportunity for smaller shippers
to influence the collaboration model
▪ Potentially limited transparency on
improvements and no guarantee for
"small" shipper to capture the full benefit
▪ High dependency on "primus" for all
smaller shippers to make collaboration
work
▪ Full transparency on cost
improvements
▪ Opportunity to draft fair gain sharing
model providing the full collaboration
benefit to each participant
▪ Disclosure of potentially confident
information to partners
▪ Calls for relatively high expertise on
orchestration and implementation of
collaborations
▪ Buildup of proper governance requires
substantial resources
"Inter pares"
collaboration