Embed Size (px)
Citation preview
WORKING CAPITAL MANAGEMENT PRACTICES AND FINANCIAL
PERFORMANCE OF SUGAR CANE OUTGROWER COMPANIES IN
KENYA
KIRUI GIDEON KIPROTICH
D61/69211/2011
MANAGEMENT PROJECT REPORT SUBMITTED IN PARTIAL
FULFILLMENT OF THE REQUIREMENT FOR THE AWARD OF DEGREE
OF MASTER OF BUSINESS ADMINISTRATION, SCHOOL OF BUSINESS
OF THE UNIVERSITY OF NAIROBI
NOVEMBER 2013

ii
DECLARATION
This research project report is my original work and has not been presented for an award in
any university.
Sign:……………………………………………. Date:…………………………………..
Kirui Gideon Kiprotich
D61/69211/2011
I confirm that this research report was prepared and presented to the University of Nairobi for
examination by the student under my supervision.
Sign:……………………………………………. Date:……………………………………
Dr. Joshua Wanjare
University of Nairobi

iii
DEDICATION
This academic research project is dedicated to my wife Angeline and our children Allan,
Daisy and Diana for their love and for allowing me to spend precious family time pursuing
further education.

iv
ACKNOWLEDGEMENT
My deepest appreciation and thanks go to my supervisor, Dr. Joshua Wanjare, for his
constructive suggestions, right criticisms and guidance that helped me stay on course and to
finish this scholarly work.
I am also deeply indebted to my friends and course colleagues for their contributions in
various ways towards the completion of this work.
I extend my deepest gratitude to the management and staff of the sugarcane out-growers who
helped me to administer questionnaires, and to all the respondents who patiently bore the
displeasures of completing the questionnaires.
The moral support offered by my parents and my family went a long way in sustaining my
enthusiasm in this work.
I finally give thanks to the almighty God for granting me great guidance, energy, wisdom and
academic intellect which enabled me to accomplish this work.
v
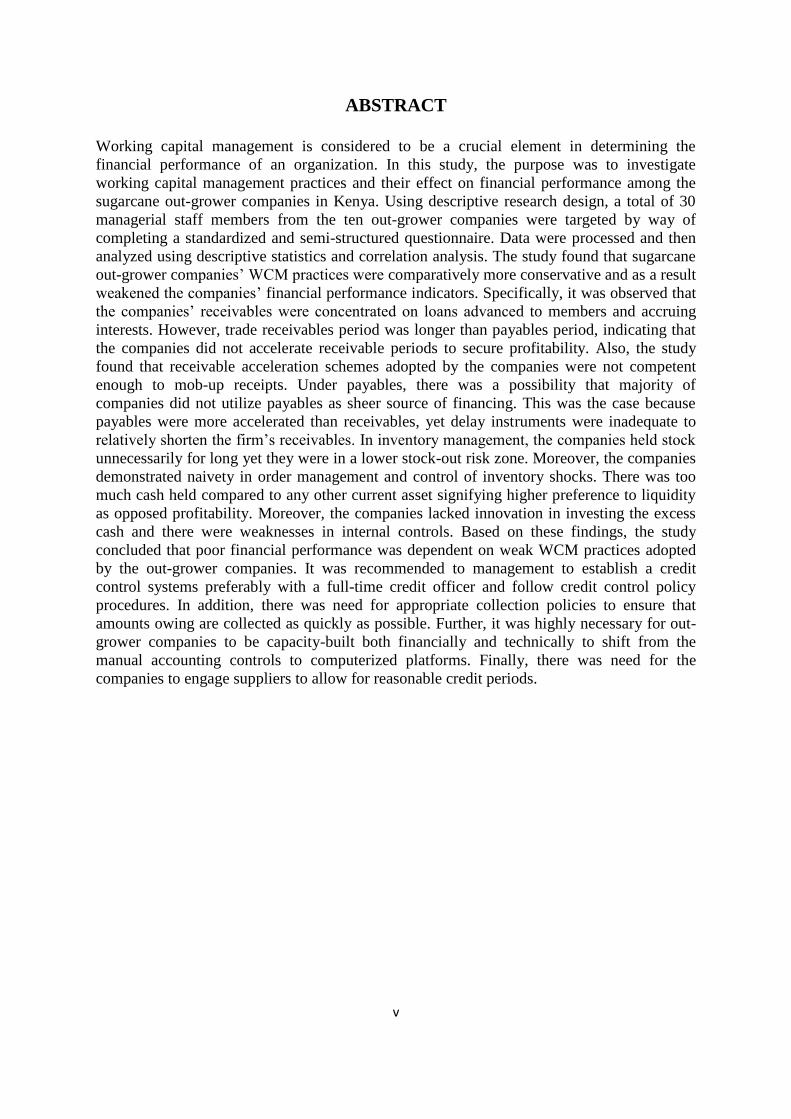
ABSTRACT
Working capital management is considered to be a crucial element in determining the
financial performance of an organization. In this study, the purpose was to investigate
working capital management practices and their effect on financial performance among the
sugarcane out-grower companies in Kenya. Using descriptive research design, a total of 30
managerial staff members from the ten out-grower companies were targeted by way of
completing a standardized and semi-structured questionnaire. Data were processed and then
analyzed using descriptive statistics and correlation analysis. The study found that sugarcane
out-grower companies’ WCM practices were comparatively more conservative and as a result
weakened the companies’ financial performance indicators. Specifically, it was observed that
the companies’ receivables were concentrated on loans advanced to members and accruing
interests. However, trade receivables period was longer than payables period, indicating that
the companies did not accelerate receivable periods to secure profitability. Also, the study
found that receivable acceleration schemes adopted by the companies were not competent
enough to mob-up receipts. Under payables, there was a possibility that majority of
companies did not utilize payables as sheer source of financing. This was the case because
payables were more accelerated than receivables, yet delay instruments were inadequate to
relatively shorten the firm’s receivables. In inventory management, the companies held stock
unnecessarily for long yet they were in a lower stock-out risk zone. Moreover, the companies
demonstrated naivety in order management and control of inventory shocks. There was too
much cash held compared to any other current asset signifying higher preference to liquidity
as opposed profitability. Moreover, the companies lacked innovation in investing the excess
cash and there were weaknesses in internal controls. Based on these findings, the study
concluded that poor financial performance was dependent on weak WCM practices adopted
by the out-grower companies. It was recommended to management to establish a credit
control systems preferably with a full-time credit officer and follow credit control policy
procedures. In addition, there was need for appropriate collection policies to ensure that
amounts owing are collected as quickly as possible. Further, it was highly necessary for out-
grower companies to be capacity-built both financially and technically to shift from the
manual accounting controls to computerized platforms. Finally, there was need for the
companies to engage suppliers to allow for reasonable credit periods.
vi
TABLE OF CONTENTS
DECLARATION ............................................................................................................................... II
DEDICATION ................................................................................................................................. III
ACKNOWLEDGEMENT .............................................................................................................. IV
ABSTRACT ........................................................................................................................................ V
LIST OF TABLES ........................................................................................................................ VIII
ABBREVIATION AND ACRONYMS ....................................................................................... IX
CHAPTER ONE: INTRODUCTION ......................................................................................... 1
1.1 Background of the Study ................................................................................................ 1
1.1.1 Working Capital Management Practices ..................................................................... 2
1.1.2 Financial Performance................................................................................................. 4
1.1.3 Kenya Sugar Industry .................................................................................................. 5
1.1.4 Sugarcane Outgrower Companies in Kenya ............................................................... 6
1.2 Research Problem ........................................................................................................... 7
1.3 Research Objectives ........................................................................................................ 9
1.4 Value of the Study .......................................................................................................... 9
CHAPTER TWO: LITERATURE REVIEW ......................................................................... 11
2.1 Introduction ................................................................................................................... 11
2.2 Theoretical Foundation of the Study: Trade-off Theory............................................... 11
2.3 Working Capital Management Practices ...................................................................... 12
2.3.1 Cash Management Practices...................................................................................... 14
2.3.2 Inventory Management Practices .............................................................................. 15
2.3.3 Receivables Management Practices .......................................................................... 16
2.3 Working Capital Management Practices and Financial Performance .......................... 17
2.5 Empirical Literature Review ......................................................................................... 19
CHAPTER THREE: RESEARCH METHODOLOGY ....................................................... 21
3.1 Introduction ................................................................................................................... 21
3.2 Research design ............................................................................................................ 21
3.3 Population of Study....................................................................................................... 21

vii
3.4 Data collection .............................................................................................................. 22
3.5 Data Analysis ................................................................................................................ 23
CHAPPTER FOUR: DATA ANALYSIS AND DISCUSSION OF FINDINGS ............. 24
4.1 Introduction ................................................................................................................... 24
4.2 Response Rate ............................................................................................................... 24
4.3 Financial Performance of Out-Grower Companies ...................................................... 25
4.4 Working Capital Management Practices ...................................................................... 28
4.4.1 Receivables Management Practices .......................................................................... 28
4.4.2 Payables Management Practices ............................................................................... 32
4.3.3 Inventory Management Practices .............................................................................. 35
4.3.4 Cash Management Practices...................................................................................... 37
4.4 Discussion of Findings .................................................................................................. 39
CHAPTER FIVE: SUMMARY OF FINDINGS, CONCLUSION AND
RECOMMENDATIONS ............................................................................................................... 43
5.1 Introduction ................................................................................................................... 43
5.2 Summary of Findings .................................................................................................... 43
5.3 Conclusion of the Study ................................................................................................ 47
5.4 Recommendations of the Study .................................................................................... 48
5.5 Limitations of the Study................................................................................................ 49
5.6 Suggestions for Further Studies .................................................................................... 50
REFERENCES ................................................................................................................................ 51
APPENDIX I: QUESTIONNAIRE ............................................................................................. 55
APPENDIX II: LIST OF OUTGROWER COMPANIES .................................................... 60
viii
LIST OF TABLES
Table 4.1: Work Experience in the Out-Grower Companies………………………………...24
Table 4.2: Correlation between Assets and Membership…………………………………….26
Table 4.3: Net Profit Trend between 2008 – 2010…………………………………………...27
Table 4.4: Sources of Receivables…………………………………………………………...29
Table 4.5: Trade Receivable Period………………………………………………………….30
Table 4.6: Accelerating Receipt of Receivables……………………………………………..31
Table 4.7: Level of Company Indebtedness …………………………………………………32
Table 4.8: Payable Period…………………………………………………………………….33
Table 4.9: Correlation between Receivable and Payable Periods……………………………34
Table 4.10: Delaying Payables……………………………………………………………….34
Table 4.11: Considerations for Inventory Quantities………………………………………...35
Table 4.12: Inventory Control Techniques…………………………………………………...36
Table 4.13: Proportions held in Cash and Short Term Securities…………………………....37
Table 4.14: Optimal Cash Management……………………………………………………...38
ix
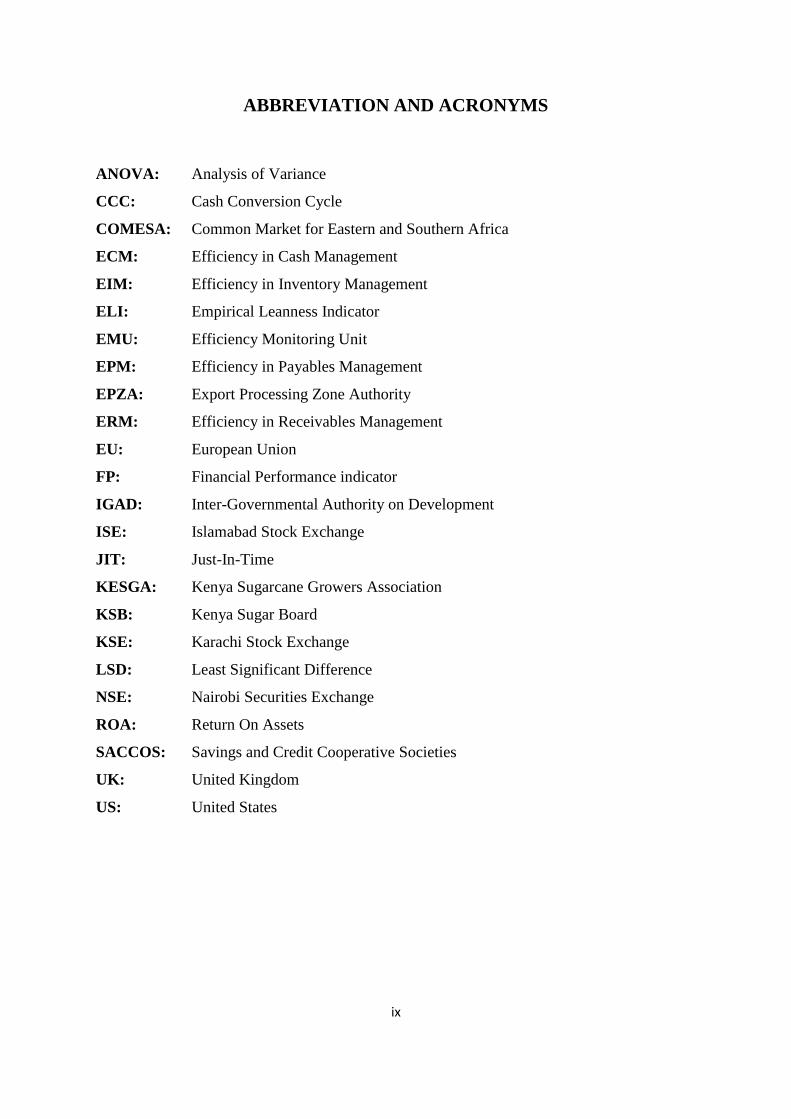
ABBREVIATION AND ACRONYMS
ANOVA: Analysis of Variance
CCC: Cash Conversion Cycle
COMESA: Common Market for Eastern and Southern Africa
ECM: Efficiency in Cash Management
EIM: Efficiency in Inventory Management
ELI: Empirical Leanness Indicator
EMU: Efficiency Monitoring Unit
EPM: Efficiency in Payables Management
EPZA: Export Processing Zone Authority
ERM: Efficiency in Receivables Management
EU: European Union
FP: Financial Performance indicator
IGAD: Inter-Governmental Authority on Development
ISE: Islamabad Stock Exchange
JIT: Just-In-Time
KESGA: Kenya Sugarcane Growers Association
KSB: Kenya Sugar Board
KSE: Karachi Stock Exchange
LSD: Least Significant Difference
NSE: Nairobi Securities Exchange
ROA: Return On Assets
SACCOS: Savings and Credit Cooperative Societies
UK: United Kingdom
US: United States

1
CHAPTER ONE: INTRODUCTION
1.1 Background of the Study
Business entities exist for purposes of enhancing owners’ investment value. Realization of
this objective requires finesse in financial strategy and entrenchment of responsive adoption
systems. As a result, a firm is required to maintain a balance between liquidity and
profitability while conducting its day to day operations. Liquidity is a precondition to ensure
that a firm is able to meet its short-term obligations and its continued flow can be
guaranteed from a profitable venture (Gitman, 2005).
The relationship between working capital management and financial performance may be
seen through the liquidity-profitability trade-off theory. This theory proposes that there is a
trade-off between liquidity and profitability; gaining more of one means giving up some of
the other. At one end of the spectrum there are highly liquid firms which are not very
profitable while at the other end are firms which are highly profitable but are not very
liquid. The basic challenge is therefore to determine where in the middle ground the firm
should reside (Bhattacharya, 2001).
The theory of working capital management describes how working capital should be
managed and demonstrates the benefits in terms of liquidity, solvency, efficiency,
profitability, and shareholder wealth maximization which accrue to the company from
appropriately managing working capital. Declining levels of liquidity, unless remedied, may
result in insolvency and eventually bankruptcy as the business's liabilities exceed its assets
(Brigham, et al., 2009).

2
Kenya is well suited for sugarcane development particularly in the lowlands around Lake
Victoria in the western part of the country as well as in the coastal area on the south eastern
part of Kenya. According to Karekezi and Kimani (2010), in spite of the significant
potential for sugarcane development, the country is yet to realize its full potential. This is
partly due to over-reliance on rain-fed cultivation of sugarcane. In addition, the
mismanagement of state-owned sugar factories has discouraged small holder farmers from
expanding sugarcane farming. Pegged on challenges associated with sugar industry,
sugarcane-farmers are organized in outgrower companies spread across the sugar-belt region
to mitigate risks collectively. Currently, there are 10 outgrower companies with regionally-
defined membership. These organizations are understood within the broadest framework of
cooperative movements in Kenya with the enactment of Cooperative Societies Act of 1966
(Karekezi and Kimani, 2010).
1.1.1 Working Capital Management Practices
Management of working capital is a fundamental part of the overall corporate strategy to
create value and is an important source of competitive advantage in businesses (Deloof,
2003). In practice, it has become one of the most important issues in organizations with
many financial executives struggling to identify the basic working capital drivers and the
appropriate level of working capital to hold so as to minimize risk, effectively prepare for
uncertainty, and improve the overall performance of their businesses (Lamberson, 2005).
By definition, working capital is current assets less current liabilities. The major elements of
current assets are inventories, accounts receivables and cash (in hand and at bank) while that
of current liabilities are accounts payable and bank overdrafts. According to Atrill (2006),
working capital represents a net investment in short term assets. These assets are continually

3
flowing or circulating into and out of the business and are essential for day-to-day
operations. Van Horne and Wachowicz (2004) argue that the various elements of working
capital are interrelated, and can be seen as part of a cycle called the cash conversion cycle.
The working capital management practices adopted by a firm determine the length of time a
particular element of working capital takes in the cycle.
Van Horne and Wachowicz (2004) provide that companies seek to minimize risk and
improve the overall performance by understanding the role and drivers of working capital
management. Consequently, a firm may adopt an aggressive working capital management
policy with a low level of current assets as percentage of total assets or it may also be used
for the financing decisions of the firm in the form of high level of current liabilities as
percentage of total liabilities. Excessive levels of current assets may have a negative effect
on the firm’s profitability whereas a low level of current assets may lead to lower level of
liquidity and stock-outs resulting in difficulties in maintaining smooth operations. They
conclude by emphasizing that the main objective of working capital management practices
is to maintain an optimal balance between each of the working capital components. On their
part, Filbeck and Krueger (2005) infer that business success heavily depends on the ability
of financial executives to effectively manage receivables, inventory, and payables. Kwame
(2007) retorts that the existence of efficient working capital management practices can make
a substantial difference between the success and failure of an enterprise and it is of
particular importance to the managers, because it is they who strive for finances and the
opportunity cost of finances; for them is usually on the higher side.
4
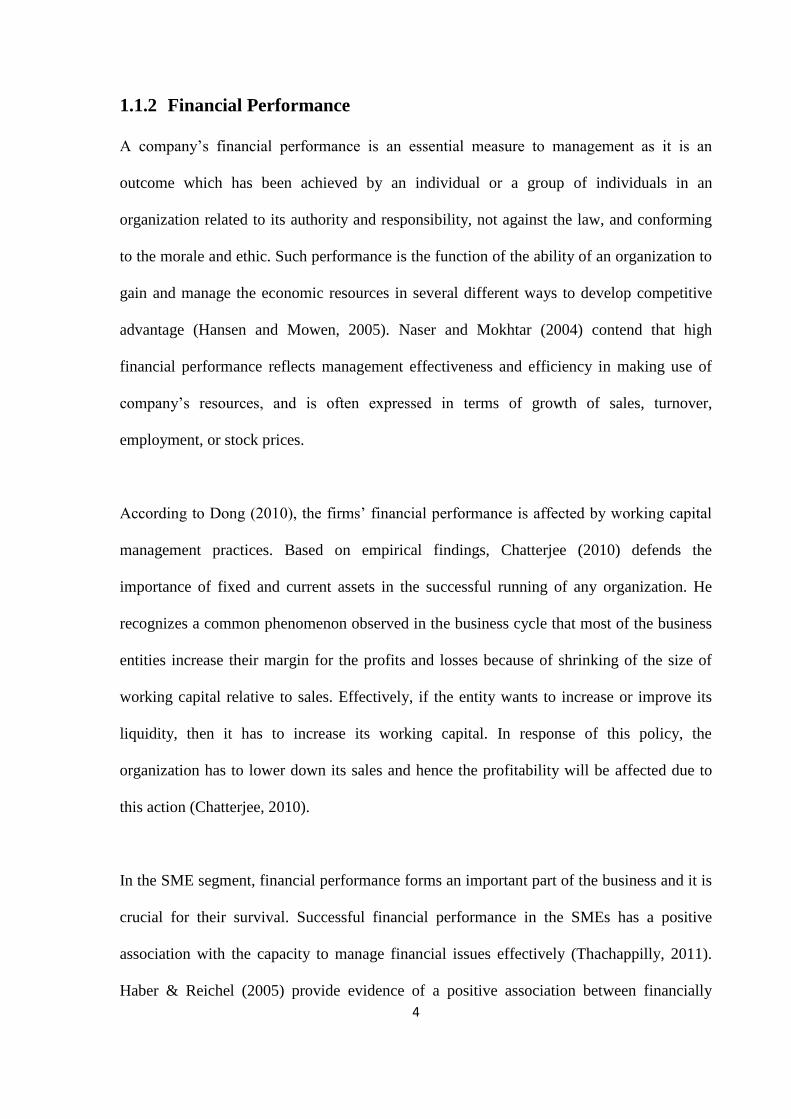
1.1.2 Financial Performance
A company’s financial performance is an essential measure to management as it is an
outcome which has been achieved by an individual or a group of individuals in an
organization related to its authority and responsibility, not against the law, and conforming
to the morale and ethic. Such performance is the function of the ability of an organization to
gain and manage the economic resources in several different ways to develop competitive
advantage (Hansen and Mowen, 2005). Naser and Mokhtar (2004) contend that high
financial performance reflects management effectiveness and efficiency in making use of
company’s resources, and is often expressed in terms of growth of sales, turnover,
employment, or stock prices.
According to Dong (2010), the firms’ financial performance is affected by working capital
management practices. Based on empirical findings, Chatterjee (2010) defends the
importance of fixed and current assets in the successful running of any organization. He
recognizes a common phenomenon observed in the business cycle that most of the business
entities increase their margin for the profits and losses because of shrinking of the size of
working capital relative to sales. Effectively, if the entity wants to increase or improve its
liquidity, then it has to increase its working capital. In response of this policy, the
organization has to lower down its sales and hence the profitability will be affected due to
this action (Chatterjee, 2010).
In the SME segment, financial performance forms an important part of the business and it is
crucial for their survival. Successful financial performance in the SMEs has a positive
association with the capacity to manage financial issues effectively (Thachappilly, 2011).
Haber & Reichel (2005) provide evidence of a positive association between financially
5
related activities (such as planning and financial control) and the successful financial
performance of an SME. Further, Haber & Reichel (2005) argue that financial performance
can be one of the biggest challenges faced by businesses in the SME sector, especially with
regard to their survival, if management is not trained on how to manage finance and
measure performance. Mbonyane (2006) sees financial performance as the life blood of
small-scale organizations, since without them, no growth decisions can be made. And,
according to Mutezo (2005), small businesses fail because more often than not, cash flow is
not properly managed.
1.1.3 Kenya Sugar Industry
Kenya is well suited for sugarcane development particularly in the lowlands around Lake
Victoria in the western part of the country as well as in the coastal area on the south eastern
part of Kenya. The western part of the country is comprised of three sugarcane growing sub-
regions, namely: Nyando Sugar Belt, Western Sugar Belt and South Nyanza Sugar Belt
(Kenya Sugar Board, 2010). In Kenya, the competitiveness of the sugar sector is affected
more by the comparatively high degree of state involvement in the sector than by the
practices of private firms. In 2010, out of 8 sugar companies, all except one had some
degree of state ownership. The company with the biggest market share, and most efficient
production, is the one with the least degree of state ownership (20% ownership) compared
with the others (with the exception one new but small, fully private mill) (Kegode, 2010).
There is a continuing decline in productivity of the industry because the production
technology used is becoming increasingly obsolete. At the mill level, crushing of cane into
sugar is inefficient due to out of date technology and frequent breakdowns. At the farm
level, cane yields are low because smallholder farmers have little incentive to increase their
6
output (such as by using faster ripening seed varieties) as it would require higher
maintenance, and they would not be able to sell their extra produce in any case, due to
limited milling capacity. In addition, mills often owe money to farmers, who cannot be sure
if or when they will receive payment. As a result, farmers often fail to repay loans made to
them by their out-grower associations. Furthermore, farmers are generally paid for the
amount of sugarcane they deliver to the mills in terms of weight, rather than sucrose
content. This does not incentivize farmers to improve the quality of the cane they produce,
which in turn reduces the efficiency of the mills (Ellis, Singh and Ong’olo, 2010).
Kegode (2010) points out that the Kenyan sugar industry has been revolving around
shortages, inefficiencies, inability to compete with imported sugar, perennial losses and
political interferences which cumulatively have a negative bearing on industry’s financial
performance. Despite huge stakeholder investments, self sufficiency in sugar has remained
elusive over the years as consumption continues to outstrip supply (Kegode, 2010).
1.1.4 Sugarcane Outgrower Companies in Kenya
According to Karekezi and Kimani (2010), in spite of the significant potential for sugarcane
development, the country is yet to realize its full potential. This is partly due to over-
reliance on rain-fed cultivation of sugarcane. In addition, the mismanagement of state-
owned sugar factories has discouraged small holder farmers from expanding sugarcane
farming. Pegged on challenges associated with sugar industry, sugarcane-farmers are
organized in outgrower companies spread across the sugar-belt region to mitigate risks
collectively. Currently, there are 10 outgrower companies with regionally-defined
membership (Masayi and Netondo, 2012).
7
Outgrower companies are understood within the broadest framework of cooperative
movements in Kenya with the enactment of Cooperative Societies Act of 1966. Underlying
the enactment of this legislation was the perception by the Kenyan policymakers that such
movements could provide viable instruments for integrating smallholders with the modern
economy. In this role, the companies would offer a service network in rural areas, which
combined input provision, credit and agency services (Kegode, 2010
1.2 Research Problem
According to Padachi (2006), a well designed and implemented working capital
management contributes positively to the creation of a firm’s value. This is supported by
Peel and Wilson (2006) who assert that management of working capital is important to the
financial health of businesses of all sizes. Since the amounts invested in working capital are
often high in proportion to the total assets employed, it is vital that these amounts are used
in an efficient and effective way. Deloof (2003) acknowledges that smaller firms should
adopt formal working capital management routines in order to reduce the probability of
business closure, as well as to enhance business performance. However, there is evidence
that small businesses are not very good at managing their working capital. Given that many
small businesses suffer from under capitalization, the importance of exerting tight control
over working capital investment is difficult to overstate (Peel and Wilson, 2006).
According to Kegode (2010), the Kenya sugar industry is an important component of the
national economy, sustaining the livelihoods of millions and contributing significantly to the
gross domestic product. However, the sector has remained hostage to different debilitating
conflicts, pitting in some cases companies against out-growers, investors against
communities, and business rivals against each other. At the same time, lack of clear and

8
effective regulations and policy guidelines has made it difficult to resolve some of these
issues. Despite all these, there is an increasing demand in sugar consumption coupled with
rapid increase in population and diversifying export potential, which calls for advanced
intents to strengthening of key industry institutions. Consequently, the significance of
individual farmers cannot be overemphasized since they supply over 90% of the required
cane for processing. Hence, efforts to stabilizing their respective outgrower companies are
socio-economically rational.
Various studies had been done relating to WCM. Nyabwanga et al. (2011) studied on effects
of WCM on financial performance but targeting SMEs in Kisii South, while Kotut (2003)
focused on WCM and performance on listed firms in Nairobi. Waswa et al. (2011) argue
that the outgrower companies have not performed to the expectations of farmers. There are
many reasons for this state of affairs. First, is the deliberate misuse of funds by the officials
who use the organizations as a platform to further their individual objectives. More often
than not they are guided by their personal interests disregarding what is best for the
organization. This is exacerbated by illiteracy among the officials which breeds
incompetence and poor bookkeeping, the effect being apathy among the members. Another
factor tends to accentuate the inefficiency of these organizations is the nature of the peasant
society itself (Waswa et al., 2011). Masayi and Netondo (2012) inferred that the reason for
out-grower companies’ failure is not clear but there is a question of how they manage their
finances. Notably, however, there were no empirically documented findings and
recommendations on WCM practices and their specific influence on financial performance;
a gap this study sought to address. Specifically, the question guiding this study was “what
working capital management practices are adopted by sugarcane outgrower companies in
Kenya and what influence these practices have on their financial performance?”
9
1.3 Research Objectives
The general objective of the study was to investigate the effect of working capital
management practices on financial performance of Sugarcane Out-grower Companies in
Kenya.
The study was guided by the following specific objectives:
i. To establish the working capital management practices of sugarcane out-grower
companies in Kenya.
ii. To establish the influence of working capital management practices on the financial
performance of sugarcane out-grower companies in Kenya.
1.4 Value of the Study
The sugar sub-sector played a major role in the Kenyan economy and was a source of
livelihood for millions. Therefore, pegged on the sub-sector’s irreplaceable indispensability,
stable synergy was of essence to strengthening and harnessing stakeholders’ collective
contributions. The study’s findings were anticipated to contribute in solidifying scholarly
contributions towards establishing an ideal working capital practice in the context of
outgrower/other related companies serving vast interests.
In addition, it was imperative that stakeholders were consistently updated and made to
understand institutional weaknesses in order to factually design a responsive policy. An
output of this study was therefore important to players both in the industry and outside
especially government agencies (Kenya Sugar Board, Vision 2030, and EMU), other
10
industry institutions, individual farmers, out-grower companies, and researchers in
advocating and adopting policy guidelines aimed at protecting sugarcane farmers.
Finally, the study recommendations focused on institutional weaknesses on working capital
management to trigger managerial refocusing of their practices and work towards
investment value creation. This did not only benefit the companies in terms of sustainability
but also individual farmers who resorted to borrowing in boosting their produce. The
anticipated improvements in sugarcane produce would to a large extent enhance industry
performance which in turn would enrich the economy’s performance.
11
CHAPTER TWO: LITERATURE REVIEW
2.1 Introduction
This chapter discusses both the theoretical and empirical literature on the study’s thematic
areas. These areas include concept of working capital, working capital practices, influence
of working capital on firm performance, and performance of the Kenyan sugar industry.
2.2 Theoretical Foundation of the Study: Trade-off Theory
Under perfect capital market assumptions, holding cash neither creates nor destroys value.
The firm can always raise funds from capital markets when funds are needed, there are no
transaction costs in raising these funds, and the funds can always be raised at a fair price
because the capital markets are assumed to be fully informed about the prospects of the firm
(Myers, 2003). The trade-off theory suggests that firms target an optimal level of liquidity to
balance the benefit and cost of holding cash. Eljelly (2004) adds that firms save transaction
costs to raise funds and do not need to liquidate assets to make payments. Moreover, the
firm can use liquid assets to finance its activities and investment if other sources of funding
are not available or are extremely expensive.
According to Eljelly (2004), the concern of business owners and managers all over the
world is to devise a strategy of managing their day to day operations in order to meet their
obligations as they fall due and increase profitability and shareholder’s wealth. The
importance of liquidity management as it affects corporate profitability in today’s business
cannot be over emphasis. The crucial part in managing working capital is required
maintaining its liquidity in day-to-day operation to ensure its smooth running and meets its
obligation (Eljelly, 2004). Liquidity plays a significant role in the successful functioning of
12
a business firm. A firm should ensure that it does not suffer from lack-of or excess liquidity
to meet its short-term compulsions (Bhunia, 2010). The dilemma in liquidity management is
to achieve desired trade-off between liquidity and profitability (Raheman and Nasr, 2007).
According to Charitou et al. (2010), management of current assets and current liabilities is
important in creating value for shareholders. If a firm can minimize its investment tied up in
current assets, the resulting funds can be invested in value-creating projects, thereby
increasing the firm’s growth opportunities and shareholders’ return. Filbeck and Krueger
(2005) point out that the ability of financial managers to effectively manage receivables,
inventories, and payables has a significant impact on the success of the business. If capital
invested in cash, trade receivables, or inventories is not sufficient, the firm may have
difficulty in carrying out its daily business operations. Charitou et al. (2010) emphasize the
trade-off between liquidity and profitability when they argue that working capital
management can play an essential role not only in a firm’s profitability and risk, but also in
its value.
2.3 Working Capital Management Practices
According to Smith and Sell (2008) wide range of surveys have been used to study working
capital policies overall and the practices to manage different components of net working
capital separately. Cash and marketable securities, accounts receivable, inventories,
accounts payable and short-term loans have been studied. These surveys show that most of
the companies have informal policies for working capital management. The most important
action in working capital management is the collection of accounts receivable followed by
efficient inventory management.
13
Belt and Smith (2001) argue that institutional differences such as the banking system cause
some variation to working capital management policies. International working capital
management has been studied by Ricci and Morrison (2006) concentrating on international
cash management operations, financing vehicles of international sales and foreign exchange
activities. They conclude that companies prefer reliable and least-risky vehicles in their
foreign exchange and vehicles such as factoring, currency swaps, leading, lagging and
futures. Howorth and Westhead (2003) studied the working capital management practices of
small firms in the UK. They found four types of firms: companies which concentrate on
cash management routines; companies concentrating on inventory management routines;
companies emphasizing revenue management routines; and firms which are less likely to
utilize any working capital management routines.
Meszek and Polewski (2006) identify three working capital management strategies, which
determine the structure of working capital, the way it is financed, and the length of the CCC.
Aggressive working capital management strategy is based on a high level of current
liabilities and a low level of current assets. Conservative strategy is the opposite with low
level of current liabilities and high level of current assets. The third moderate strategy
positions itself between the aggressive and the conservative strategies. Further, Meszek and
Polewski (2006) argue that working capital management requires controlling mechanisms.
As working capital is a complex issue, it requires other perspectives to be taken into account
than just financial, such as investment process, production process and logistics.
14
2.3.1 Cash Management Practices
Davidson (2002) defined cash management as a term which refers to the collection,
concentration and disbursement of cash. It encompasses a company’s level of liquidity,
management of cash balance and short term strategies. Pindado (2004) also defines cash
management as part of working capital that makes up the optimal level needed by a
company. Bort (2004) noted that, cash management is of importance for both new and
growing businesses. Companies may suffer from cash flow problems because of lack of
margin of safety in case of anticipated expenses such that they experience problems in
finding the funds for innovation or expansion. Further Bort (2004), alludes that effective
cash management is the fundamental starting point to ensure that the company’s finances
are in strong position.
According to Bort (2004) cash is the lifeblood of the business. The key to successful cash
management lies in tabulating realistic projections, monitoring collections and
disbursements, establishing effective billing and collection measures, and adhering to
budgetary parameters because cash flow can be a problem to the business organization.
Gitman (2008) offers theoretical positions drawn from observations and consulting
experience on the fact that a firm can improve its cash management efficiency by collecting
accounts receivable as soon as possible. The most obvious way of bringing forward cash
inflows, would be to press debtors for earlier payment although this policy will result in
goodwill and problems with customers.
Gitman (2008) advocates for cash budget as another cash management tool. It is used by the
firm to estimate its short term requirement with particular attention being paid to planning
for surplus cash or for cash shortages. Kirkman (2006) arrived at the same idea by
15
highlighting that as a component of implementing an effective cash management program, a
cash flow statement called a cash budget may be prepared. Chastain (2008) asserts that
budgets are the financial road map companies’ use, when planning business expenses and
tracking the cash flow throughout the business year.
2.3.2 Inventory Management Practices
Managers act rationally in managing their inventory efficiently if they are convinced that the
practice enhances firm performance. Traditionally, inventories of raw materials, work-in-
progress components, and finished goods were kept as a buffer against the possibility of
running out of needed items. However, large buffer inventories consume valuable resources
and generate hidden costs. Inventory management leading to inventory reduction has
become the primary target, as is often the case in just-in-time (JIT) systems, where raw
materials and parts are purchased or produced just in time to be used at each stage of the
production process. This approach to inventory management brings considerable cost
savings from reduced inventory levels. As a result, inventories have been decreasing in
many firms (Chen et al., 2005).
According to Chen et al. (2005), firms with abnormally high inventories have abnormally
poor stock returns. On the other hand, firms with abnormally low inventories have ordinary
stock returns. In addition, firms with slightly lower than average inventories perform best
over time. Inventory management leads to inventory reduction, as is often the case in JIT.
Fullerton et al. (2003) give support that firms that implement higher degrees of JIT
manufacturing practices should outperform competitors who do not; it was also found that a
positive relationship exists between firm profitability and the degree to which waste-
reducing production practices, such as reduced set-up times, preventive maintenance
16
programs and uniform workloads are implemented. Eroglu and Hofer (2011) argue that
inventory leanness is the best inventory management tool. Lean production itself considers
inventory as a form of waste that should be minimized and it has become synonymous with
good inventory management
Cannon (2008) introduces contradictory perspective that inventory performance should not
be measured as a robust indicator of overall performance. Cannon (2008) indicates that
when the effects of time are taken into account, turnover improvement on average has a
slightly negative effect on ROA. Additionally, turnover improvement exhibits a prominent
random effect. Consistent with Cannon (2008), another Kolias et al. (2011) present that
inventory turnover ratio (as a measurement of inventory management), is negatively
correlated with gross margin. Moreover, there exists a negative relationship between gross
margin and inventory turnover. This implies that retailers’ trade off gross margin for
inventory turns to achieve similar return on inventory investment since, if inventory
turnover ratio is lower than targeted given the level of gross margin, then management
should be alarmed with this inefficiency.
2.3.3 Receivables Management Practices
Provision of trade credit is normally used by businesses as a marketing strategy to expand or
maintain sales (Pandey, 2004). Efficient receivables management augmented by a shortened
creditor’s collection period, low levels of bad debts and a sound credit policy often
improves the businesses’ ability to attract new customers and accordingly increase financial
performance hence the need for a sound credit policy that will ensure that value is optimized
(Lazaridis and Dimitrios, 2005). Costs of cash discounts and costs of managing credit and
17
credit collections constitute the carrying costs associated with granting a credit which
increase when the amount of receivables granted are increased. Lost sales resulting from not
granting credit constitute the opportunity cost which decrease when the amounts of
receivables are increased (Lazaridis and Dimitrios, 2005).
Michalski (2007) provides that an increase in the level of accounts receivables in a firm
increases both the net working capital and the costs of holding and managing accounts
receivables and both lead to a decrease in the value of the firm. Lazaridis and Dimitrios
(2005) argue that firms who pursue increase in their accounts receivables to an optimal level
increase their profitability resulting from increase sales and market share. Juan and Martinez
(2002) emphasize that firms can create value by reducing their number of days of accounts
receivable, while Deloof (2003) writes that the length of receivables collection period has a
negative effect on a firm’s performance. Sushma and Bhupesh (2007) also affirm that,
putting in place a sound credit policy ensures proper debt collection procedures and is
pivotal in improving efficiency in receivables management hence the performance of firms.
2.3 Working Capital Management Practices and Financial Performance
Efficient management of working capital is a fundamental part of the overall corporate
strategy in creating the shareholders’ value (Deloof, 2003), and firms try to keep an optimal
level of working capital that maximizes their value (Afza and Nazir, 2007). According to
Eljelly (2004), financial performance of corporate organizations is a major source
of concern to the financial manager, entire management, as well as the shareholders. This is
more so as it is expected that every corporate organization of any kind should make a fair
return to justify its existence. Deloof (2003) argues that the requirement that organizations
realize reasonable financial performance calls for proper management of working capital

18
which has a significant impact on corporate continuity, while Pandey (2004) agrees that
there is a significant impact of working capital management policies on organizational
financial stability.
Aminu (2003) alludes that working capital management is an essential tool in the success
story of any firm in terms of profitability. A good or positive working capital enables a firm
to access finance from short-term creditors and even long term creditors. In the long-run,
creditors seek firms with a positive working capital since it serves as an assurance of loan
repayment. The issue of a positive working capital calls for working capital management
which, according to Pandey (2004), is the administration of all components of working
capital-cash, marketable securities, debtors (receivables) and stock (inventories) and
creditors (payables). Further, Pandey (2004) states that the financial manager must
determine levels and composition of current assets by determining the right source to
finance current assets and that current liabilities are paid in time. Smith and Sell (2008)
contends that the goal of working capital management is to ensure that the firm is able to
continue its operation and that it has sufficient cash flows to satisfy both maturing short-
term debt and upcoming operational expenses. This will obviously have significant effect on
the firm’s financial performance (Smith and Sell, 2008).
For small and growing businesses, an efficient working capital management is a vital
component of success and survival in terms of both profitability and liquidity (Howorth and
Westhead, 2003). Howorth and Westhead (2003) further suggest that the small firms need to
focus on some areas of working capital management where they can expect to improve
marginal returns. Ideally, therefore, they need to adopt formal working capital management
routines in order to reduce the probability of business closure, as well as to enhance business
19
performance. Grablowsky (2006) portrays a significant relationship between various success
measures and the employment of formal working capital policies and procedures. Managing
cash flow and cash conversion cycle is a critical component of overall financial management
for all firms, especially those who are capital constrained and more reliant on short-term
sources of finance (Grablowsky, 2006).
2.5 Empirical Literature Review
Melita, Maria and Petros (2010) empirically investigated the effect of working capital
management on firm’s financial performance in an emerging market. Their data set
consisted of firms listed on the Cyprus Stock Exchange for the period of 1998 - 2007. Using
multivariate regression analysis, their results specifically indicate that the cash conversion
cycle and all its major components namely - days in inventory, days’ sales outstanding and
creditors’ payment period – are associated with the firm’s profitability. Vida, Seyed, and
Rezvan (2011) studied the relationship between working capital management and corporate
profitability of 101 listed companies on Tehran Stock Exchange (TSE) during the period of
2004-2008. Multivariate regression and Pearson correlation were used to test hypotheses.
Findings revealed that cash conversion cycle, a key measure of working capital
management, has a relationship with corporate profitability. Findings also show that a
positive significant relationship exists between logarithm of sales and profitability, and a
negative significant relationship exists between financial debt ratio and profitability.
In the Kenyan context, Bowen, Morara and Mureithi (2009) carried out a study on
management of business challenges among small and micro enterprises in Nairobi. It dwelt
on amongst other challenges faced by small and medium enterprises, the challenge of
working capital management and took a sample of small and micro enterprises in Nairobi.
20
The study found that working capital management is one of the serious challenges facing
these enterprises. Kotut (2003) carried out a study on WCM practices by Kenyan firms
using listed firms in Nairobi. It adopted a stratified sampling of the firms listed in the NSE
under different sectors. The study concluded that working capital management practices
influenced corporate profitability in variant proportions dependent on the sector the firms
operated as well their sizes.
21
CHAPTER THREE: RESEARCH METHODOLOGY
3.1 Introduction
This chapter presents the study methodology followed towards attainment of the objectives.
Specifically, it outlines the research design, population, data collection, research validity
and reliability, and data analysis.
3.2 Research design
The study adopted a descriptive cross-sectional survey research design. According to Polit
and Beck (2010), this design necessitates a more economical collection of data at one point
in time and is fundamental in objective analysis due to timing similarity. Further
justification for its adoption was based on Oso and Onen (2005) that the design provides a
quick, efficient and accurate means of accessing information about the population and it is
more appropriate where there is a gap of secondary data.
This design was considered appropriate because this study focused on the data relating to
working capital management practices at the time of the study for all the entities being
studied. The data collected also provided descriptive information about the study subjects
and were sourced from a mix of primary and secondary sources.
3.3 Population of Study
The study targeted obtaining research data from the only 10 sugar out-grower companies in
Kenya (see appendix II). These companies were concentrated in the western part which was
the main sugarcane growing area in the country. In total, there were three sugar belts,
namely the Nyando, the western sugar belt and the south Nyanza sugar zone. Aggregately,
22
the area under cane was estimated at 123,622 hectares of which 111,189 hectares were
farmed by smallholders and 12,433 under nucleus estates. This provided a strong foundation
to existence of out-grower companies in all the 10 sugar companies.
3.4 Data collection
To ensure comprehensive examination and inter-firm comparison, both secondary and
primary sources of data were adopted. The secondary data were ascertained from financial
statements and inventory records with the aid of predesigned desk review checklist. On the
other hand, primary data collection was accomplished by use of a semi-structured and self-
administered questionnaire. According to Burns and Grove (2005), a questionnaire is well
thought-out tool designed to elicit information that can be obtained through written
responses from the study subjects.
Dillman (2005) also supports use of questionnaire as it is made to accomplish a wide range
of feedbacks because each respondent is asked to respond to the same set of questions. The
questionnaire was given to respondents drawn from representatives of top management,
finance and procurement sections. Hence, there were three inclusions from each company
with top management represented by managing directors, finance by head of accounts, and
procurement by head of supply chain sections.
Primary instrument validity was gained through scholarly critique and professional input
from one financial manager/practitioner and two research experts. Moreover, the instrument
was triangulated to ensure collection of both in-depth and closed feedbacks. In addition to
these, using both secondary and primary data sources was helpful in enhancing reliability of
findings due to minimal inconsistencies from the respondents. The researcher’s availability
23
during data collection also ensured that respondents were assisted in completions by way of
giving guided clarifications.
3.5 Data Analysis
The researcher examined the collected quantitative data to make inferences through a series
of operations involving editing to eliminate inconsistencies, classification on the basis of
similarity and tabulation to relate variables. Subsequently, the refined data were analyzed
using descriptive statistics such as percentages, measures of central tendency, and measures
of dispersion. Textual data portions were analyzed by content analysis.
24
CHAPPTER FOUR: DATA ANALYSIS AND DISCUSSION OF
FINDINGS
4.1 Introduction
This chapter presents outputs of data analysis and discussions thereof. The statistical
analyses are based on the study’s thematic areas which include working capital management
practices, and the effects of WCM practices on financial performance.
4.2 Response Rate
The study sought to obtain data from a total of 30 management representatives comprising
of managing directors, finance officers and procurement managers from the ten targeted out-
grower companies in the three sugar-belt regions of Western Kenya. By the end of the study
period, however, 28 questionnaires were completed and returned. This translated to a
response rate of 93%.
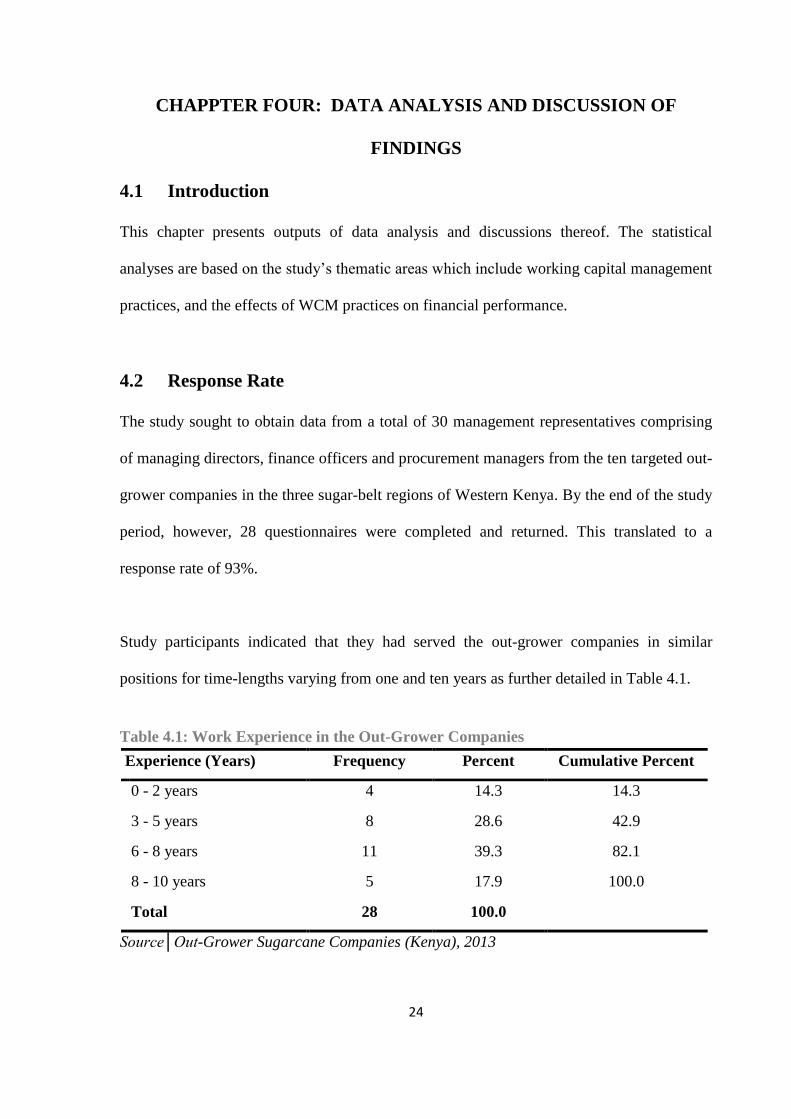
Study participants indicated that they had served the out-grower companies in similar
positions for time-lengths varying from one and ten years as further detailed in Table 4.1.
Table 4.1: Work Experience in the Out-Grower Companies
Experience (Years) Frequency Percent Cumulative Percent
0 - 2 years 4 14.3 14.3
3 - 5 years 8 28.6 42.9
6 - 8 years 11 39.3 82.1
8 - 10 years 5 17.9 100.0
Total 28 100.0
Source│Out-Grower Sugarcane Companies (Kenya), 2013
25
Table 4.1 illustrates that majority of the companies’ managers had accumulated between 6 –
8 years of experience (39.3%) in the top level. Yet another cluster of managers (28.6%) had
a non-disrupted working stint ranging between 3 to 5 years. There were also 17.9% of the
managers who had stayed longest between 8 – 10 years while those with the least work-life
durations, less than 2 years, constituted a response portion of 14.3%. Averagely, the work-
life experience in the units of analysis was found to be 7.6 years and this was considered
sufficient to enable quality dissemination and informed topical opinions.
4.3 Financial Performance of Out-Grower Companies
According to Panwala (2009), the object of WCM is to maximize the owners’ wealth which
is measured in terms of profitability. Effectively, therefore, a firm in losses does not answer
to the business intent of the owners. In this study, financial performance of the out-grower
companies was measured on the basis of their asset accumulation, membership and net
profits realized.
Under asset accumulation, the study established that the smallest out-grower company had
an asset base of Sh.48 million while an equivalent in the biggest company was Sh.180
million. The mean asset value was found to be Sh.111.29, with a standard deviation of
Sh.36.49 million. This showed inherent resource-base dissimilarities among the sugarcane
out-grower companies, signaling to a justifiable basis for application of various approaches
in their WCM.
The companies’ membership was constituted by small scale sugarcane farmers affiliated to
respective sugarcane companies. In this study, it was established that the smallest company
had registered a total of 560 full-subscription members while the largest membership size
26
was 3,021. This variation gave a membership range of 2,461 which again hinted to wider
dispersions in financial performance among the firms. Given that out-grower companies
depended almost entirely on proceeds from their listed members, it was observed that
smaller companies had liquidity and profitability challenges which would only be mitigated
by adoption of responsive WCM practices.
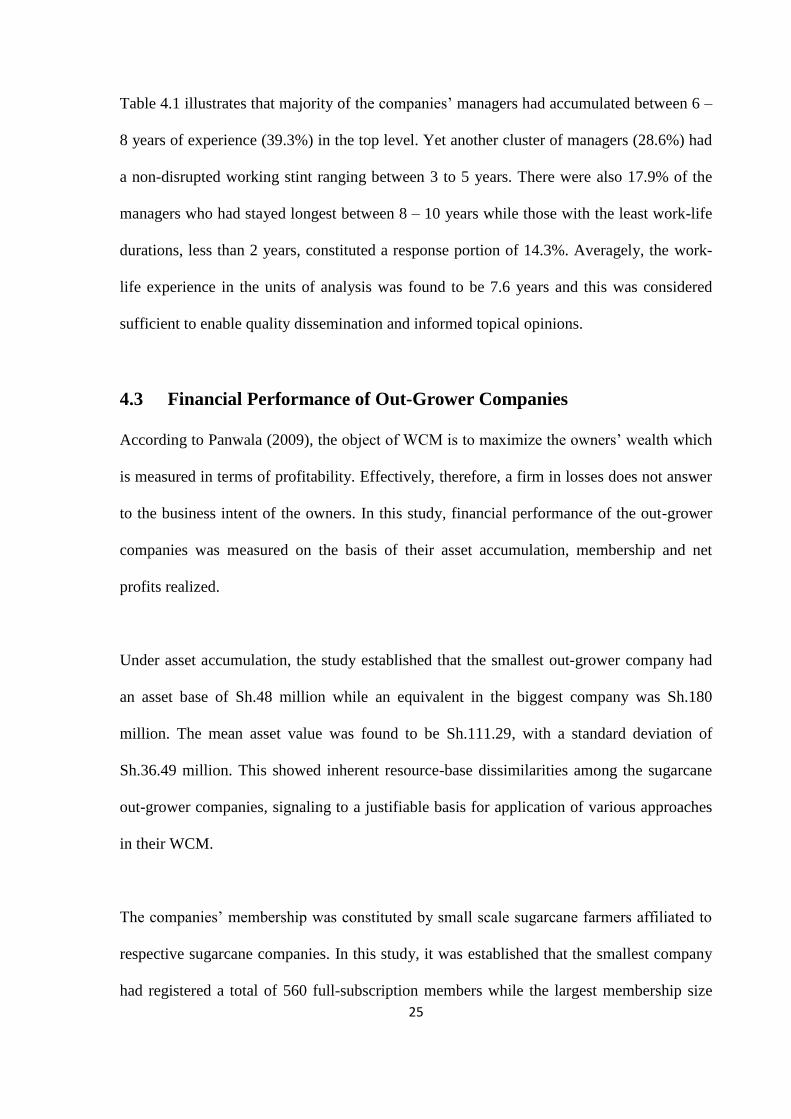
Based on the companies’ estimated assets and membership, a correlation analysis confirmed
that asset appreciation was predominantly dependent on the number of members subscribing
to a company. Table 4.2 illustrates the correlation between company assets and membership.
Table 4.2: Correlation between Assets and Membership
Company Asset Base
(KSh.’000,000’)
Company
Membership
Company Asset Base
(Millions)
Pearson Correlation 1 .887**
Sig. (2-tailed) .000
N 28 28
Company Membership
Pearson Correlation .887**
1
Sig. (2-tailed) .000
N 28 28
**. Correlation is significant at the 0.01 level (2-tailed).
Source│Out-Grower Sugarcane Companies (Kenya), 2013
The Karl Pearson’s Correlation Coefficient between company assets and membership was
found to be 0.887, implying existence of a significant direct relationship between the two
variables. Further, this illustrated that membership size was a significant predictor of
company profitability. Hence, profits earned were not entirely dependent on the companies’
WCM approach.
27
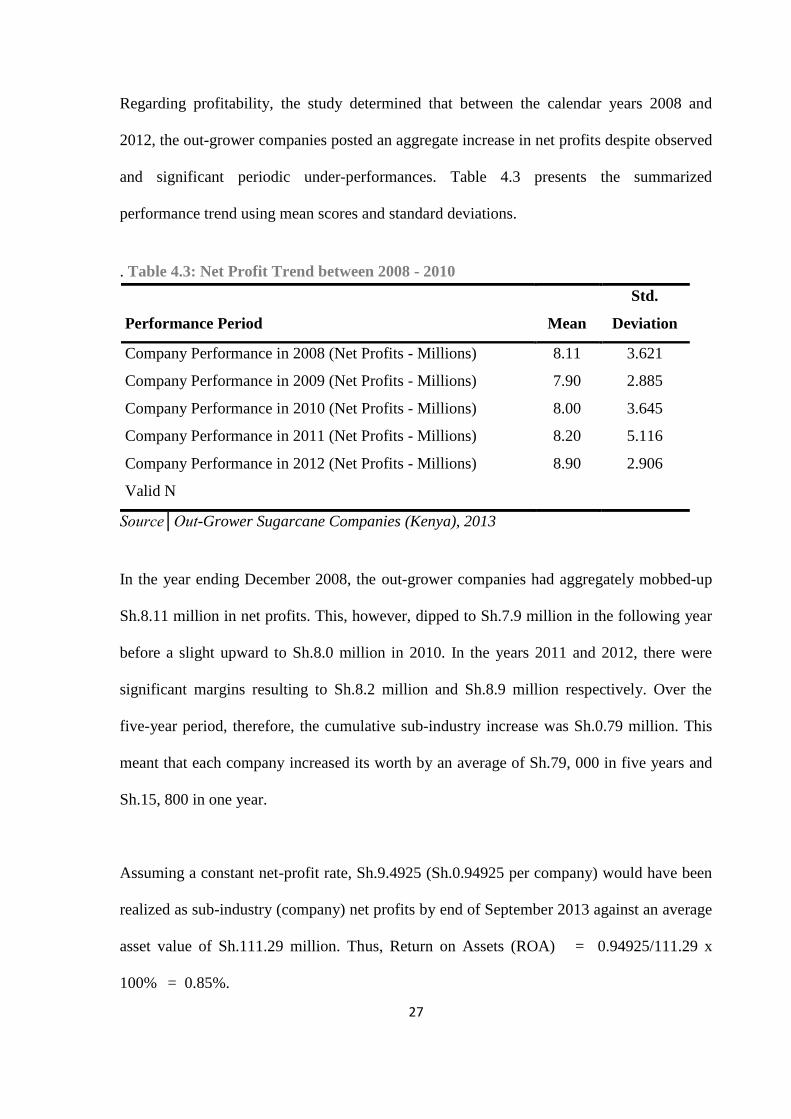
Regarding profitability, the study determined that between the calendar years 2008 and
2012, the out-grower companies posted an aggregate increase in net profits despite observed
and significant periodic under-performances. Table 4.3 presents the summarized
performance trend using mean scores and standard deviations.
. Table 4.3: Net Profit Trend between 2008 - 2010
Performance Period
Mean
Std.
Deviation
Company Performance in 2008 (Net Profits - Millions) 8.11 3.621
Company Performance in 2009 (Net Profits - Millions) 7.90 2.885
Company Performance in 2010 (Net Profits - Millions) 8.00 3.645
Company Performance in 2011 (Net Profits - Millions) 8.20 5.116
Company Performance in 2012 (Net Profits - Millions) 8.90 2.906
Valid N
Source│Out-Grower Sugarcane Companies (Kenya), 2013
In the year ending December 2008, the out-grower companies had aggregately mobbed-up
Sh.8.11 million in net profits. This, however, dipped to Sh.7.9 million in the following year
before a slight upward to Sh.8.0 million in 2010. In the years 2011 and 2012, there were
significant margins resulting to Sh.8.2 million and Sh.8.9 million respectively. Over the
five-year period, therefore, the cumulative sub-industry increase was Sh.0.79 million. This
meant that each company increased its worth by an average of Sh.79, 000 in five years and
Sh.15, 800 in one year.
Assuming a constant net-profit rate, Sh.9.4925 (Sh.0.94925 per company) would have been
realized as sub-industry (company) net profits by end of September 2013 against an average
asset value of Sh.111.29 million. Thus, Return on Assets (ROA) = 0.94925/111.29 x
100% = 0.85%.
28
The calculated ROA was less than 1% which illustrated poor utilization of company assets
in quest of maximizing return. Specifically, this was a sufficient pointer that WCM practices
were not optimally utilized to enable the out-grower companies stabilize their financial
performance pillars.
Further information obtained from the companies’ financial statements showed that six out
of ten made consecutive losses between 2009 and 2012. In addition, 70% of the firms had
liabilities surpassing their equity levels. These findings led to conclusion that the out-grower
companies were financially under-performing. Partly, this was attributed to uncontrolled
gearing levels, limited investment options, and dismal membership.
4.4 Working Capital Management Practices
The working capital management practices were investigated under each of the WCM
components: receivables, payables, inventory, and cash.
4.4.1 Receivables Management Practices
Under this objective area, the study’s purpose was to determine the existence and
effectiveness of the companies’ credit policy and its application in maximization of value of
the firm. The indicators used included payable sources, duration till actual receipts, and
receipt acceleration approaches.
The out-grower companies had options of generating receivables from distinct transactions
involving their members. Table 4.4 illustrates the four identified options at the companies’
disposal.
29
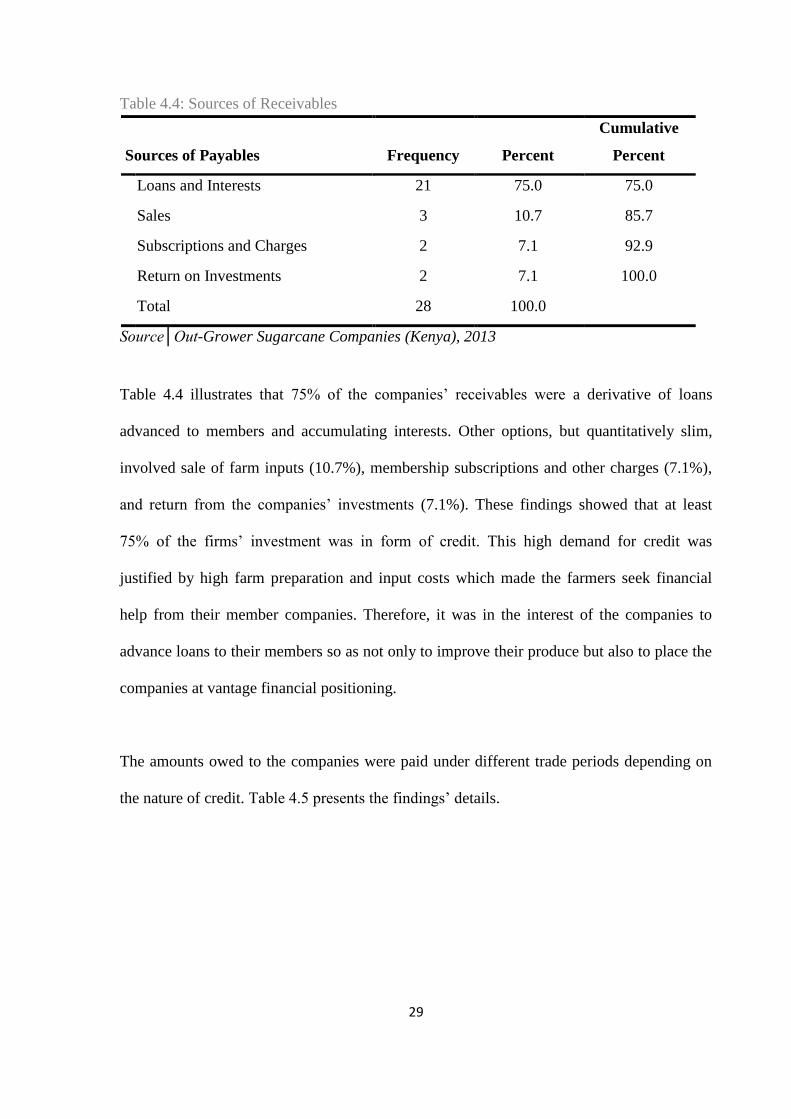
Table 4.4: Sources of Receivables
Sources of Payables
Frequency
Percent
Cumulative
Percent
Loans and Interests 21 75.0 75.0
Sales 3 10.7 85.7
Subscriptions and Charges 2 7.1 92.9
Return on Investments 2 7.1 100.0
Total 28 100.0
Source│Out-Grower Sugarcane Companies (Kenya), 2013
Table 4.4 illustrates that 75% of the companies’ receivables were a derivative of loans
advanced to members and accumulating interests. Other options, but quantitatively slim,
involved sale of farm inputs (10.7%), membership subscriptions and other charges (7.1%),
and return from the companies’ investments (7.1%). These findings showed that at least
75% of the firms’ investment was in form of credit. This high demand for credit was
justified by high farm preparation and input costs which made the farmers seek financial
help from their member companies. Therefore, it was in the interest of the companies to
advance loans to their members so as not only to improve their produce but also to place the
companies at vantage financial positioning.
The amounts owed to the companies were paid under different trade periods depending on
the nature of credit. Table 4.5 presents the findings’ details.

30
Table 4.5: Trade Receivable Period
Duration Frequency Percent Cumulative Percent
0 - 15 days 2 7.1 7.1
15 - 30 days 2 7.1 14.3
30 - 45 days 3 10.7 25.0
45 - 60 days 3 10.7 35.7
More than 60 days 18 64.3 100.0
Total 28 100.0
Source│Out-Grower Sugarcane Companies (Kenya), 2013
Table 4.5 illustrates that company debtors met their payments obligations within varying
durations ranging from zero to more than 60 days. At the high end, company management
allowed 64.3% of the receivables to be effected after a period of 60 days or more from
transaction date. This category was predominated by loans advances to members which
were recoverable after cane harvests. The cumulative 35.7% of the receipts were remitted to
the companies within 60 days. Notable, only 7.1% receivables were actualized in less than
15 days. The study, therefore, established that a higher proportion of receivables to the out-
grower companies were long term. This was attributed to the long wait prior to receipts of
cane proceeds which took a minimum of 18 months.
On an ascending scale of 1 – 3 points, respondents were asked to rate the companies’
approaches in accelerating receipt of receivables. The various approaches adopted and
extents of preference were found as presented in Table 4.6.
31
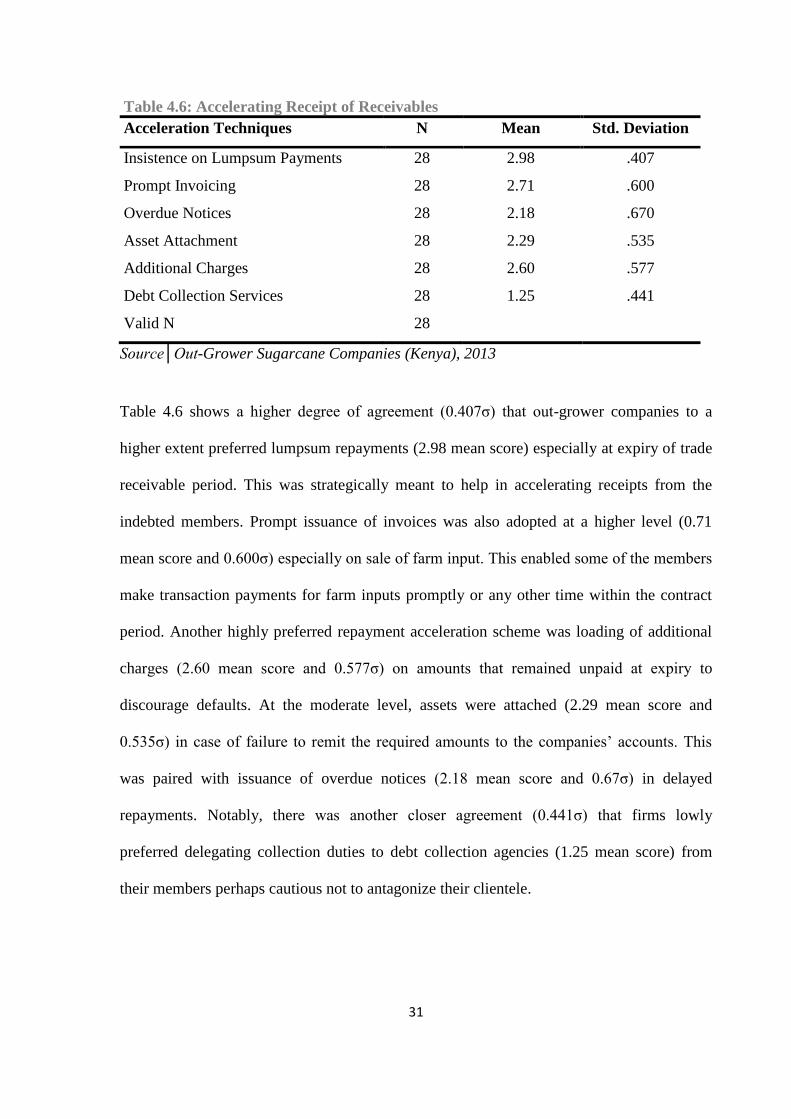
Table 4.6: Accelerating Receipt of Receivables
Acceleration Techniques N Mean Std. Deviation
Insistence on Lumpsum Payments 28 2.98 .407
Prompt Invoicing 28 2.71 .600
Overdue Notices 28 2.18 .670
Asset Attachment 28 2.29 .535
Additional Charges 28 2.60 .577
Debt Collection Services 28 1.25 .441
Valid N 28
Source│Out-Grower Sugarcane Companies (Kenya), 2013
Table 4.6 shows a higher degree of agreement (0.407σ) that out-grower companies to a
higher extent preferred lumpsum repayments (2.98 mean score) especially at expiry of trade
receivable period. This was strategically meant to help in accelerating receipts from the
indebted members. Prompt issuance of invoices was also adopted at a higher level (0.71
mean score and 0.600σ) especially on sale of farm input. This enabled some of the members
make transaction payments for farm inputs promptly or any other time within the contract
period. Another highly preferred repayment acceleration scheme was loading of additional
charges (2.60 mean score and 0.577σ) on amounts that remained unpaid at expiry to
discourage defaults. At the moderate level, assets were attached (2.29 mean score and
0.535σ) in case of failure to remit the required amounts to the companies’ accounts. This
was paired with issuance of overdue notices (2.18 mean score and 0.67σ) in delayed
repayments. Notably, there was another closer agreement (0.441σ) that firms lowly
preferred delegating collection duties to debt collection agencies (1.25 mean score) from
their members perhaps cautious not to antagonize their clientele.
32
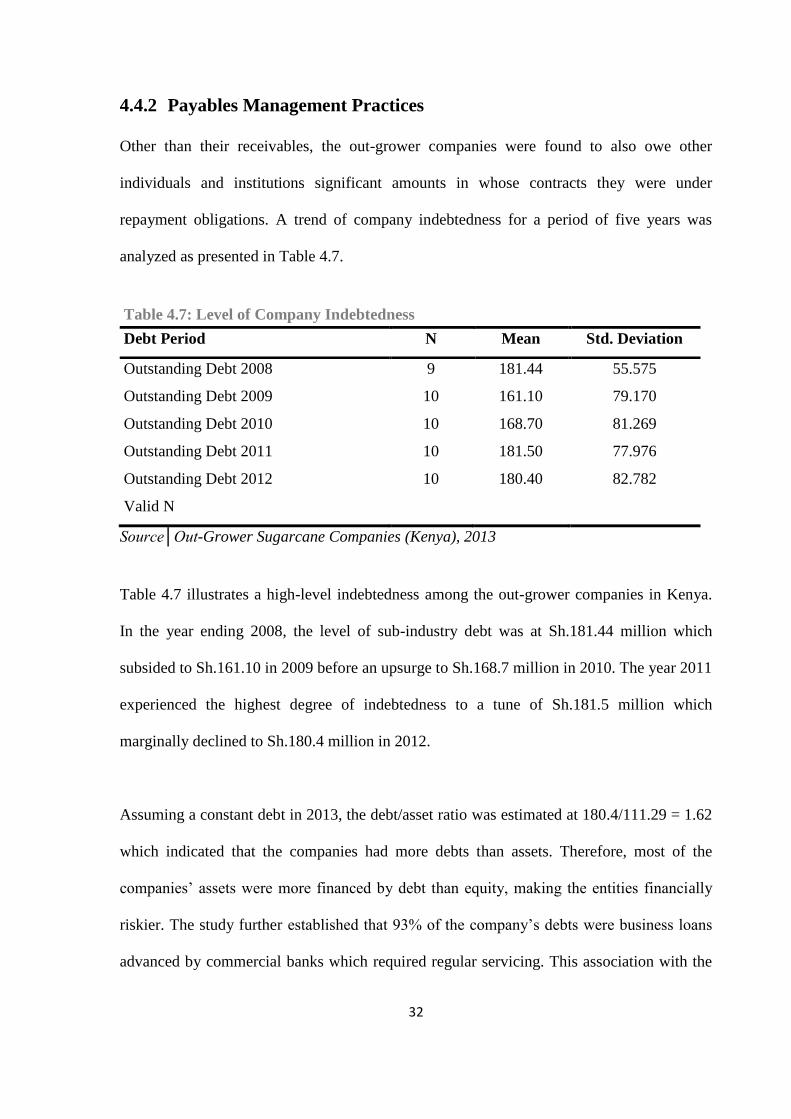
4.4.2 Payables Management Practices
Other than their receivables, the out-grower companies were found to also owe other
individuals and institutions significant amounts in whose contracts they were under
repayment obligations. A trend of company indebtedness for a period of five years was
analyzed as presented in Table 4.7.
Table 4.7: Level of Company Indebtedness
Debt Period N Mean Std. Deviation
Outstanding Debt 2008 9 181.44 55.575
Outstanding Debt 2009 10 161.10 79.170
Outstanding Debt 2010 10 168.70 81.269
Outstanding Debt 2011 10 181.50 77.976
Outstanding Debt 2012 10 180.40 82.782
Valid N
Source│Out-Grower Sugarcane Companies (Kenya), 2013
Table 4.7 illustrates a high-level indebtedness among the out-grower companies in Kenya.
In the year ending 2008, the level of sub-industry debt was at Sh.181.44 million which
subsided to Sh.161.10 in 2009 before an upsurge to Sh.168.7 million in 2010. The year 2011
experienced the highest degree of indebtedness to a tune of Sh.181.5 million which
marginally declined to Sh.180.4 million in 2012.
Assuming a constant debt in 2013, the debt/asset ratio was estimated at 180.4/111.29 = 1.62
which indicated that the companies had more debts than assets. Therefore, most of the
companies’ assets were more financed by debt than equity, making the entities financially
riskier. The study further established that 93% of the company’s debts were business loans
advanced by commercial banks which required regular servicing. This association with the
33
lending institutions would require that companies retained sufficient liquidity to meet the
monthly repayment obligations.
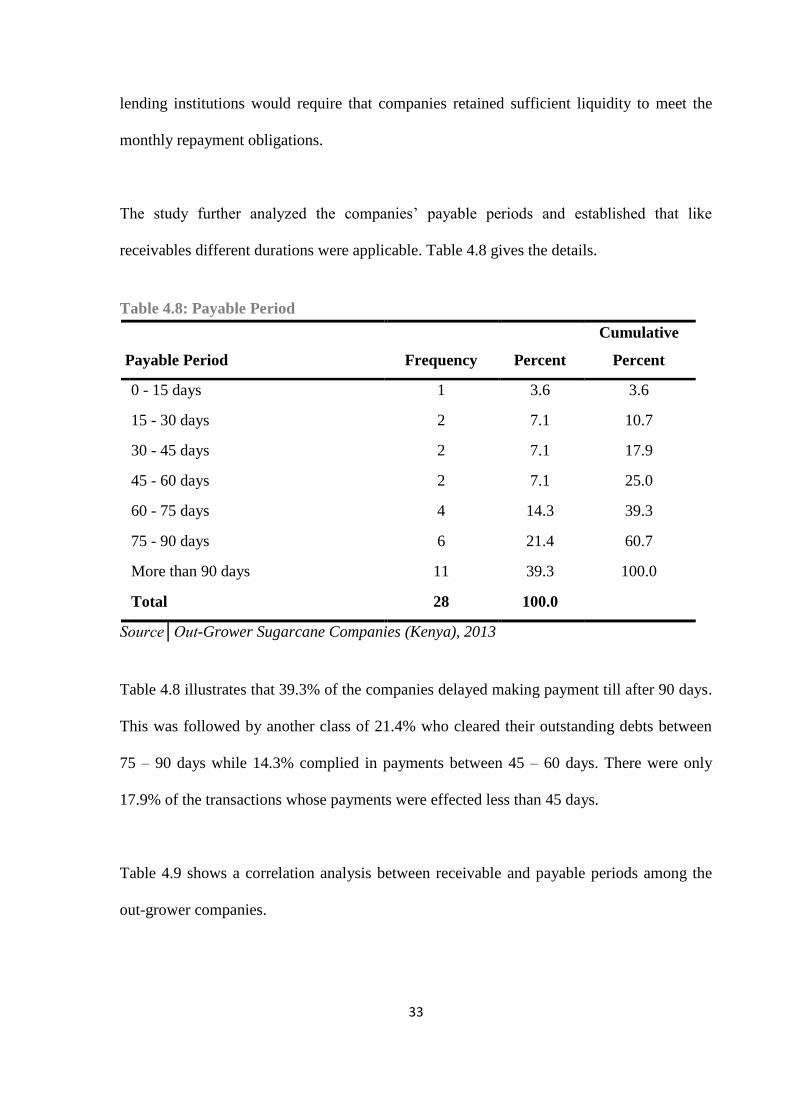
The study further analyzed the companies’ payable periods and established that like
receivables different durations were applicable. Table 4.8 gives the details.
Table 4.8: Payable Period
Payable Period
Frequency
Percent
Cumulative
Percent
0 - 15 days 1 3.6 3.6
15 - 30 days 2 7.1 10.7
30 - 45 days 2 7.1 17.9
45 - 60 days 2 7.1 25.0
60 - 75 days 4 14.3 39.3
75 - 90 days 6 21.4 60.7
More than 90 days 11 39.3 100.0
Total 28 100.0
Source│Out-Grower Sugarcane Companies (Kenya), 2013
Table 4.8 illustrates that 39.3% of the companies delayed making payment till after 90 days.
This was followed by another class of 21.4% who cleared their outstanding debts between
75 – 90 days while 14.3% complied in payments between 45 – 60 days. There were only
17.9% of the transactions whose payments were effected less than 45 days.
Table 4.9 shows a correlation analysis between receivable and payable periods among the
out-grower companies.
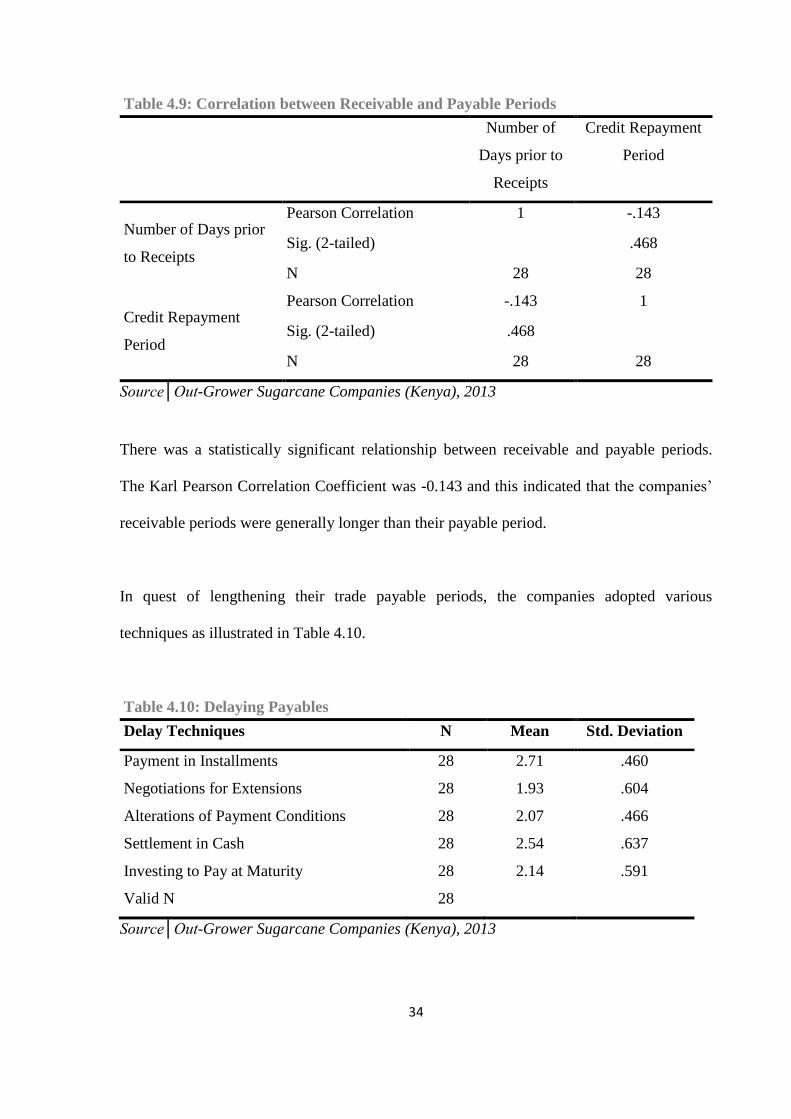
34
Table 4.9: Correlation between Receivable and Payable Periods
Number of
Days prior to
Receipts
Credit Repayment
Period
Number of Days prior
to Receipts
Pearson Correlation 1 -.143
Sig. (2-tailed) .468
N 28 28
Credit Repayment
Period
Pearson Correlation -.143 1
Sig. (2-tailed) .468
N 28 28
Source│Out-Grower Sugarcane Companies (Kenya), 2013
There was a statistically significant relationship between receivable and payable periods.
The Karl Pearson Correlation Coefficient was -0.143 and this indicated that the companies’
receivable periods were generally longer than their payable period.
In quest of lengthening their trade payable periods, the companies adopted various
techniques as illustrated in Table 4.10.
Table 4.10: Delaying Payables
Delay Techniques N Mean Std. Deviation
Payment in Installments 28 2.71 .460
Negotiations for Extensions 28 1.93 .604
Alterations of Payment Conditions 28 2.07 .466
Settlement in Cash 28 2.54 .637
Investing to Pay at Maturity 28 2.14 .591
Valid N 28
Source│Out-Grower Sugarcane Companies (Kenya), 2013
35
Table 4.10 illustrates a closer agreement (0.46σ) that out-grower companies delayed making
payments to their creditors by engaging in installment arrangements (2.71 mean score).
Nevertheless, settlement in cash (2.54 mean score) was also applied to derail any liability
accumulation to the companies. At a moderate extent, companies invested available funds
(2.14 mean score and 0.591σ) prior to expiry of payables period in addition to seeking
alterations to repayment conditions (2.07 mean score and 0.466σ). There was also
negotiation for repayment extensions (1.93 mean score and 0.604σ) which was slightly
below the moderate application extent.
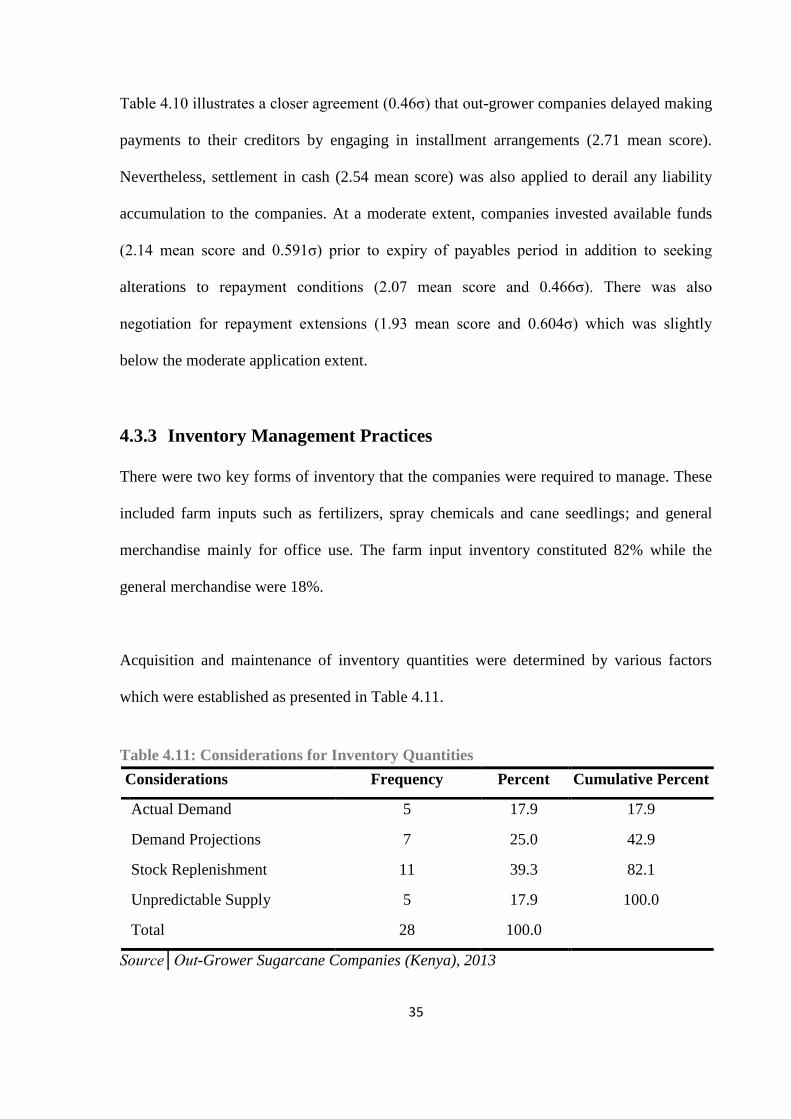
4.3.3 Inventory Management Practices
There were two key forms of inventory that the companies were required to manage. These
included farm inputs such as fertilizers, spray chemicals and cane seedlings; and general
merchandise mainly for office use. The farm input inventory constituted 82% while the
general merchandise were 18%.
Acquisition and maintenance of inventory quantities were determined by various factors
which were established as presented in Table 4.11.
Table 4.11: Considerations for Inventory Quantities
Considerations Frequency Percent Cumulative Percent
Actual Demand 5 17.9 17.9
Demand Projections 7 25.0 42.9
Stock Replenishment 11 39.3 82.1
Unpredictable Supply 5 17.9 100.0
Total 28 100.0
Source│Out-Grower Sugarcane Companies (Kenya), 2013

36
The highest push for inventory variation was the need for replenishment (39.3%) followed
by the companies’ demand projections (25%). The other factors considered were actual
demand (17.9%) and provision for unpredictable demand (17.9%). The inventory orders
were received within an average of 22 days but the average time taken to issue them was 61
days. This implied that other than carrying costs, companies had to meet the holding costs in
form of storage and insurance for a length of 39 days. This also meant that out-grower
companies experienced longer inventory conversion cycles. The respondents further opined
that they did not have standard minimum and maximum inventories as the cases were most
often than not demand-driven.
Still inventory, respondents were asked to rate on an ascending scale of 1 – 5 the extents of
inventory control measures. Responses were as presented in table 4.12.
Table 4.12: Inventory Control Techniques
Inventory Controls N Mean Std. Deviation
Extent of Stock-Outs 28 3.39 .786
Extent of Inventory Surpluses 28 3.37 .917
Extent of Emergency Ordering 28 1.57 .634
Extent of Supply Stoppage 28 1.82 .670
Valid N 28
Source│Out-Grower Sugarcane Companies (Kenya), 2013
The Table shows that despite the long inventory holding period that companies experienced,
there was a closer agreement (0.786σ) pointing to stock-out tendencies (3.39 mean score)
and some other times inventory surpluses (3.37 mean score). Emergency ordering and
supply stoppages were experienced at low levels of 1.57 and 1.82 mean scores respectively.
37
This implied that out-grower companies lacked adequate knowledge and skill on inventory
optimization.
4.3.4 Cash Management Practices
The availability of cash balances was regarded a key determinant of the companies’
competitive ability because it would provide the means to invest in people, technology, and
other assets. Efficient cash management was therefore indispensable to the out-grower
companies. This study investigated cash management practices on the basis of cash
proportions held, conversion to marketable securities, and company alternatives to cash
optimization.
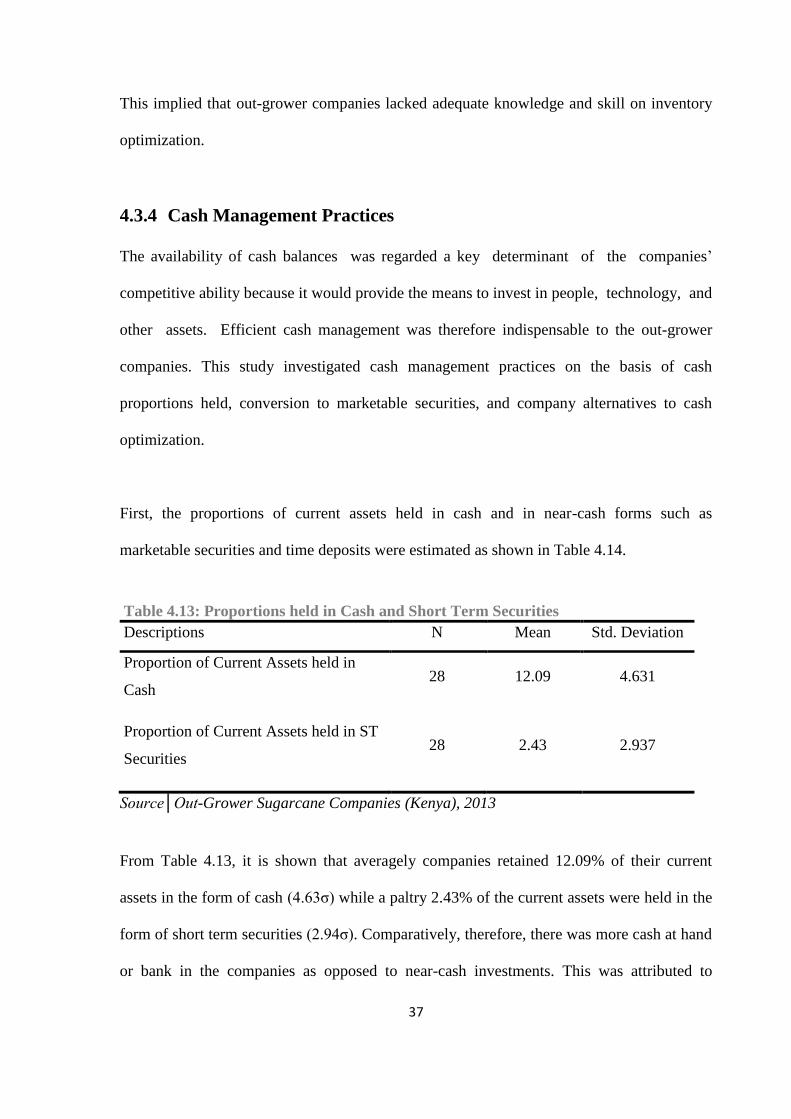
First, the proportions of current assets held in cash and in near-cash forms such as
marketable securities and time deposits were estimated as shown in Table 4.14.
Table 4.13: Proportions held in Cash and Short Term Securities
Descriptions N Mean Std. Deviation
Proportion of Current Assets held in
Cash 28 12.09 4.631
Proportion of Current Assets held in ST
Securities 28
2.43
2.937
Source│Out-Grower Sugarcane Companies (Kenya), 2013
From Table 4.13, it is shown that averagely companies retained 12.09% of their current
assets in the form of cash (4.63σ) while a paltry 2.43% of the current assets were held in the
form of short term securities (2.94σ). Comparatively, therefore, there was more cash at hand
or bank in the companies as opposed to near-cash investments. This was attributed to
38
limited investment vehicles available to the companies whose markets were constrained by
the number of members they served. Holding of too much cash indicated that the out-grower
companies preferred liquidity to profitability, and pointed to a more conservative practice in
managing the companies’ cash flows.
The study further observed that all out-grower companies experience a near-similar cash
conversion cycle of 18 months. This meant that monetary advances to farmers could only
become available to the company after the 18-month cane-maturation wait, assuming no
damages. This was longer than an accounting period and a prelude to making companies
inflexible to reinvestments.
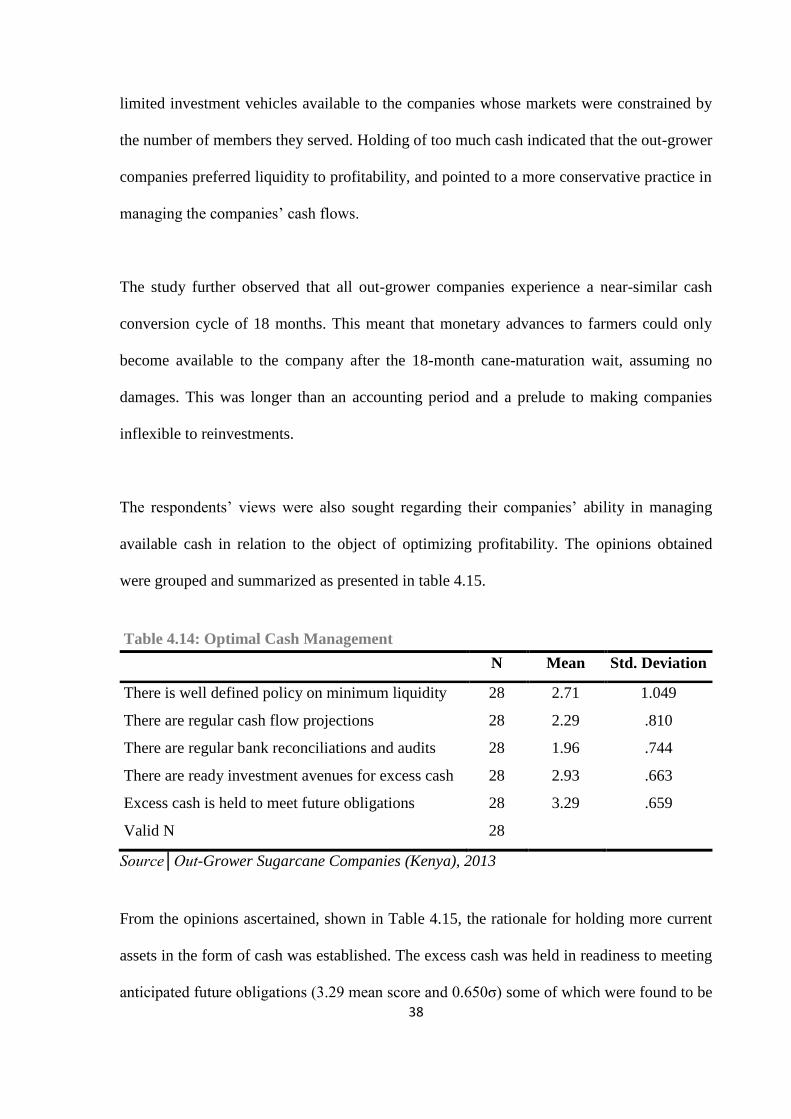
The respondents’ views were also sought regarding their companies’ ability in managing
available cash in relation to the object of optimizing profitability. The opinions obtained
were grouped and summarized as presented in table 4.15.
Table 4.14: Optimal Cash Management
N Mean Std. Deviation
There is well defined policy on minimum liquidity 28 2.71 1.049
There are regular cash flow projections 28 2.29 .810
There are regular bank reconciliations and audits 28 1.96 .744
There are ready investment avenues for excess cash 28 2.93 .663
Excess cash is held to meet future obligations 28 3.29 .659
Valid N 28
Source│Out-Grower Sugarcane Companies (Kenya), 2013
From the opinions ascertained, shown in Table 4.15, the rationale for holding more current
assets in the form of cash was established. The excess cash was held in readiness to meeting
anticipated future obligations (3.29 mean score and 0.650σ) some of which were found to be
39
more erratic in nature. In addition, the respondents decried lack of adequate investment
avenues for the excess cash (2.93 mean score and 0.663σ). This was particularly a serious
challenge during bumper harvests when majority of farmers received their proceeds from
the sugarcane companies, leading to massive loan repayments. The study also established
ineffectiveness of minimum liquidity policies (2.71 mean score and 1.049σ) in the
companies which showed a major concern. There were not proper references regarding the
minimum and maximum liquidity standards, making the companies seem partly misguided
on how much cash to retain or convert in assets. It was evident also that the companies did
not have appropriate tools to enable them project with precision their future cash demands
(2.29 mean score and 0.810σ). Their vulnerability was further precipitated by their low level
bank reconciliations and audits to ensure cash safety (1.96 mean score and 0.744σ).
4.4 Discussion of Findings
Working capital is considered an essential input towards realization of company
profitability. Padachi (2006) examined the trends in working capital management and its
impact on firm’s performance for 58 Mauritian small manufacturing firms during 1998 to
2003. He explained that a well designed and implemented working capital management is
expected to contribute positively to the creation of firm’s value. This idealism contrasted the
case of out-grower companies in Kenya. The companies’ misguided working capital
management practices which were more conservative had a significant bearing on the
dismal financial performance post by the candidate companies. According to Barrow
(2001), there is enough evidence which point to small and medium enterprises being
inefficient users of working capital. As he puts it, “the smaller they are, the less efficient
they tend to be’’ (119). The argument is strengthened by Atrill (2006) arguing that there is
evidence that many SMEs are not very good at managing their working capital and this has

40
been cited as a major cause of their high failure rate compared with that of large businesses.
Atrill (2006) asserts that small and medium enterprises often lack the resources to manage
their trade debtors (receivables) effectively
The study found that out-grower companies’ receivable periods were longer than the
payables period. This partly meant that the companies’ acceleration techniques were
deficient in mobbing-up receivables to the required profitability levels. Atrill (2006)
attributes low receivable collection potential among the SMES to lack of proper debt
collection procedures such as prompt invoicing and sending out regular statements. This
causes the increase risk of late payment and defaulting debtors. Deloof (2003) also found
that firms can increase their profitability by reducing the debtors’ collection period.
Christopher (2009) asserts that the longer the accounts payables period the more
advantageous for the firm as such fund can be put to other uses. However, longer accounts
holding period can erode a firm’s credit worthiness. In this study, the trade payables period
was found to be substantially shorter than the receivables period. This meant that the out-
grower companies were accelerating their payables more than their receivables. Atrill
(2006) found that less than half of small business (SME) owner-managers surveyed view
accounts payable as a source of finance for their businesses. Hence, the time for repayment
was insignificant to them. Davidson (2002) found a positive relationship between payable
period and firm profitability. Deloof (2003) also reported an unanticipated negative impact
associated with the number of days for accounts payable. He further found that poorer firms
prolonged the time to pay their debts.
41
This study found that out-grower companies held inventory longer; it took an average of 22
days to receive orders but more than 61 days to effect issuance and collection of payments.
Moreover, the companies did not have a defined inventory model but relied on demand
projections, actual demand estimation, unpredictable supply, and need for replenishments.
Resultant inventory decisions were proven defective in the face of stock-outs and surpluses.
Longer holding of inventory was conservative and was an additional cost centre to the
companies. In Padachi (2006) examination of trends in working capital management and its
impact on firm’s performance, results proved that a high investment in inventories is
associated with lower profitability. Further, he showed that inventory holding period had a
negative relation with profitability. Deloof (2003) also analyzed a sample of Belgian firms
and found that firms can raise their performance by shortening the periods for inventory
conversion.
The out-grower companies demonstrated preference to holding more current assets in cash
than in any other forms such as marketable securities. Comparatively, 12.09% of the current
assets were held in cash while only 2.43% was in the form of near-cash instruments.
Moreover, the cash conversion cycle for a typical out-grower company was to a large extent
at least 18 months which was more than a conventional accounting period of one year. It
was also observed that companies held more cash due to limited investment vehicles,
payable anticipations, lack of cash management policies, and dearth of bank reconciliations
and audits. Cumulatively, these served to deny the companies essential resources through
reinvestment, hence there was a higher probability to diminished profitability. Deloof
(2003) investigated the relationship between working capital management and firm
profitability by using Cash Conversion Cycle (CCC) as a measure of working capital
management. He found a negative relation between gross operating income and receivables

42
collection period, inventory turnover period and creditors’ payment all of which influenced
the CCC.
Mathuva (2009) also conducted a study on impact of working capital on productivity using
firms listed in NSE using data between 1993 and 2008. The study found a negative
relationship between the time when the cash is collected from the customers and the firm’s
productivity. This depicted that firms that are more profitable enjoy less time period for the
collection of cash from the customers as compare to ones which are less profitable. Thus,
when CCC is shorter, firm’s profitability is most likely to be higher. Deductively, therefore,
the out-grower companies had to shorten their CCC and reduce the proportion of cash held
to consolidate a basis for profitability.

43
CHAPTER FIVE: SUMMARY OF FINDINGS, CONCLUSION AND
RECOMMENDATIONS
5.1 Introduction
The chapter presents summary of the study’s findings, conclusion, policy recommendations,
limitations and suggestions for further studies.
5.2 Summary of Findings
The study sought to establish the various WCM practices adopted by out-grower companies
in Kenya and how they affected their financial performance. First, the companies’ financial
performance was established using the indicators of asset accumulation, membership and
net profits. It was found that the smallest out-grower company had an asset base of Sh.48
million while the biggest company prided of Sh.180 million asset value. The mean asset
value was found to be Sh.111.29, with a standard deviation of Sh.36.49 million. Moreover,
it was found that the smallest of companies had enrolled a total of 560 members while the
largest had member population of 3,021. Based on the companies’ estimated assets and
memberships, a Karl Pearson’s Correlation Coefficient of 0.887 was obtained, implying
existence of a significant direct relationship. Thus, membership predicted company
profitability.
Between the calendar years 2008 and 2012, the companies posted an aggregate increase in
net profits despite significance annual underperformances. In 2008, the companies had
aggregately mobilized Sh.8.11 million in net profits. This, however, declined to Sh.7.9
million in the following year before a slight upward to Sh.8.0 million in 2010. In the years
2011 and 2012, there were significant margins resulting to Sh.8.2 million and Sh.8.9 million

44
respectively. Over the five-year period, the cumulative sub-industry increase was Sh.0.79
million. This meant that each company increased its worth by an average of Sh.79, 000 in
five years and Sh.15, 800 per year. Assuming a constant net-profit rate, Return on Assets
(ROA) was found to be 0.85% which was far insignificant. This illustrated poor utilization
of company assets to maximize return.
The second part involved investigating the working capital management practices under
receivables, payables, inventory, and cash. Under receivables, payable sources, duration till
actual receipts, and receipt acceleration approaches were used as indicators. It was found
that the out-grower companies had options of generating receivables from distinct
transactions involving their members. At least 75% of the companies’ receivables were a
derivative of loans advanced to members and accumulating interests. Other options involved
sale of farm inputs (10.7%), membership subscriptions and other charges (7.1%), and return
from the companies’ investments (7.1%). The amounts owed to the companies were paid
under different trade periods depending on the nature of credit. Company management
allowed 64.3% of the receivables to be effected after a period of 60 days or more from the
transaction date. This category was predominated by loans advances to members which
were recoverable after cane harvests. The cumulative 35.7% of the receipts were on the
other hand remitted to the companies within 60 days. There was only 7.1% receivables
actualized in less than 15 days.
There was a higher degree of agreement (0.407σ) that the out-grower companies to a higher
extent preferred lumpsum repayments (2.98 mean score) especially at expiry of trade
receivable period. This was strategically meant to help in accelerating receipts from the
indebted members. Prompt issuance of invoices was also adopted at a higher level (0.71
45
mean score and 0.600σ) especially on sale of farm input. This enabled some of the members
make transaction payments for farm inputs promptly or any other time within the contract
period. Another highly preferred repayment acceleration scheme was loading of additional
charges (2.60 mean score and 0.577σ) on amounts that remained unpaid at expiry to
discourage defaults. At the moderate level, assets were attached (2.29 mean score and
0.535σ) in case of failure to remit the required amounts to the companies’ accounts. This
was paired with issuance of overdue notices (2.18 mean score and 0.67σ) in delayed
repayments. Moreover, there was another closer agreement (0.441σ) that firms lowly
preferred delegating collection duties to debt collection agencies (1.25 mean score) from
their members.
Other than their receivables, the out-grower companies also owed individuals and
institutions significant amounts in whose contracts they were under repayment obligations.
In the year ending 2008, the level of sub-industry debt was at Sh.181.44 million which
subsided to Sh.161.10 in 2009 before an upsurge to Sh.168.7 million in 2010. The year 2011
experienced the highest degree of Sh.181.5 million which marginally declined to Sh.180.4
million in 2012. This gave a debt ratio of 1.62, which indicated that the companies had more
debts than assets. The study further established that 93% of the company’s debts were
business loans advanced by commercial banks which required regular servicing.
Further findings showed that 39.3% of the companies delayed making payment till after 90
days. This was followed by another class of 21.4% who cleared their outstanding debts
between 75 – 90 days while 14.3% complied in payments between 45 – 60 days. There were
only 17.9% of the transactions whose payments were effected less than 45 days. The
research found a statistically significant relationship between receivables and payables
46
payments by way of regression yielding a correlation coefficient of -0.143, and indicating
that the companies’ receivables periods were generally longer than their payables period.
In quest of lengthening their trade payables period, the companies adopted various
techniques. There was a closer agreement (0.46σ) that out-grower companies delayed
making payments to their creditors by engaging in installment arrangements (2.71 mean
score). Nevertheless, settlement in cash (2.54 mean score) was also applied to derail any
liability accumulation to the companies. At a moderate extent, companies invested available
funds (2.14 mean score and 0.591σ) prior to expiry of payables period in addition to seeking
alterations to repayment conditions (2.07 mean score and 0.466σ). There was also
negotiation for repayment extensions (1.93 mean score and 0.604σ) which was slightly
below the moderate application extent.
The study established two key forms of inventory that the companies were required to
manage. These included farm inputs such as fertilizers, spray chemicals and cane seedlings;
and general merchandise mainly for office use. The farm input inventory constituted 82%
while the general merchandise were 18%. Acquisition and maintenance of inventory
quantities were determined by various factors. The highest push for inventory variation was
the need for replenishment (39.3%) followed by the companies’ demand projections (25%).
The other factors considered were actual demand (17.9%) and provision for unpredictable
demand (17.9%). The inventory orders were received within an average of 22 days but the
average time taken to issue them was 61 days. This implied that other than carrying costs,
companies had to meet the holding costs in form of storage and insurance for a length of 39
days. Despite the long inventory holding period that companies experienced, there was a
closer agreement (0.786σ) pointing to stock-out tendencies (3.39 mean score) and some

47
other times inventory surpluses (3.37 mean score). Emergency ordering and supply
stoppages were experienced at low levels of 1.57 and 1.82 mean scores respectively.
Finally, the study investigated cash management practices on the basis of cash proportions
held, conversion to marketable securities, and company alternatives to cash optimization.
The study found that averagely companies retained 12.09% of their current assets in the
form of cash (4.63σ) while a paltry 2.43% of the current assets were held in the form of
short term securities (2.94σ). Comparatively, therefore, there was more cash at hand or bank
in the companies as opposed to near-cash investments. This was attributed to limited
investment vehicles available to the companies whose markets were constrained by the
number of members they served. Moreover, the rationale for holding more current assets in
the form of cash was corroborated by opinions that excess cash was held in readiness to
meeting anticipated future obligations (3.29 mean score and 0.650σ). In addition, the
respondents decried lack of adequate investment avenues for the excess cash (2.93 mean
score and 0.663σ). The study also established ineffectiveness of minimum liquidity policies
(2.71 mean score and 1.049σ) in the companies which showed a major concern. It was
evident also that the companies did not have appropriate tools to enable them project with
precision their future cash demands (2.29 mean score and 0.810σ). Their vulnerability was
further precipitated by their low level bank reconciliations and audits to ensure cash safety.
5.3 Conclusion of the Study
Based on the obtained findings, the study concluded that sugarcane out-grower companies’
WCM practices were more conservative than aggressive. The study established that the
companies’ receivables were concentrated on loans advanced to members and accruing
interests. However, trade receivables period was longer than payables period, indicating that
48
some companies did not conveniently link receivables to profitability. It was also observed
that receivable acceleration schemes adopted by the companies were not competent enough
to mob-up receipts.
Regarding payables, there was also a possibility that majority of companies did not utilize
payables as sheer source of financing. This was the case because payables were more
accelerated than receivables, yet delay instruments were not adequate enough to relatively
shorten the firm’s receivables. In inventory management, the companies held stock
unnecessarily for long yet they were in a lower stock-out risk zone. Also, the companies
demonstrated naivety in order management and control of inventory shocks. Finally, too
much cash was held compared to any other current asset signifying higher preference to
liquidity as opposed profitability. Moreover, the companies lack innovation in investing the
excess cash and were weak in cash pilferage controls. In aggregate, therefore, the weaker
financial performance of the out-grower companies was dependent on the poor and
misguided WCM practices adopted by the out-grower companies.
5.4 Recommendations of the Study
Poor management of working capital means that funds are unnecessarily tied up in idle
assets hence reducing liquidity and also reducing the ability to invest in productive assets
such as plant and machinery, so affecting profitability. In order to improve on the working
capital management practices of sugarcane out-grower companies, it is recommended that
management should establish a credit control systems preferably with a full-time credit
officer and follow credit control policy procedures. Also, the companies must have
collection policies to ensure that amounts owing are collected as quickly as possible.
49
Sugarcane out-grower companies did not have proper systems in managing their working
capital. This disabled their abilities in specifically pursuing a definite WCM policy or
practice. This was not satisfactory especially in today’s computer age where managerial
decision making is vastly aided by customized software systems. It is thus recommended
that out-grower companies are capacity built both financially and technically towards
ushering in a paradigm shift from the manual accounting controls to computerized
platforms.
The inventor management at the studied companies was inadequate in terms of inventory
conversion cycle, order management, and inventory shocks. Based on this, the study
recommends that there should be a proper inventory management system to avoid over-
stock and stock-outs. Also, there is need to have a defined model on whose basis orders,
buffer stocks, and reorder levels are determined. Also, companies should engage in
relationship with those suppliers who allow long credit time period and those customers
who allow short payment period.
5.5 Limitations of the Study
The study was conducted among the sugarcane out-grower companies in Kenya but was
largely delimited to views and opinions of the Managing Directors, Finance Officers and
Procurement Managers. These participation options effectively locked out indispensable
contributions from other primary stakeholders such as the small scale farmers and Board of
Directors. There was also a possibility that their views could be more inclined to portraying
themselves and their entities as financially and technically sound.

50
Further, owing to seasonal variations rampant in the sugar industry, obtained data sets were
prone to changes and possibly misrepresentations if dissimilar seasons are considered.
Therefore, application of these findings would only be applied with caution and within
similar study situations.
Lastly, the indicator options adopted under each objective area to measure the companies’
WCM practices may not be exhaustive. There is thus a propensity of the not measuring
variables under study with precision.
5.6 Suggestions for Further Studies
Suggestions for future research are made based on the inherent limitations of this study.
First, it is suggested that a more detailed study targeting all the primary stakeholders is made
to derive a comprehensive models explaining the quantitative relationship between financial
performance of out-grower or related companies and their respective WCM practices.
Second, a full seasonal cycle study is suggested to fit the various short-term variations into
the model. This will be of help in developing an all-time WCM surveillance tool to aid
farmers and other stakeholders in measuring their investments’ net worth and subsequently
making financially sound decisions.
Last, future researchers are advised to adopt other sets of WCM indicators to test how
respective practices influence the companies’ financial performance. This will significantly
make contributions towards establishing a comprehensive scholarly opinion relating to
corporate finances and WCM modifications.
51
REFERENCES
Afza, T. and Nazir, M. S. (2007), Working Capital Management Practices of Firms:
Empirical Evidence from Pakistan, 9th South Asian Management Forum (SAMF)
held on February 24-25, pp. 334-343, North South University, Dhaka, Bangladesh
Atrill P (2006). Financial management for decision makers, (4th Ed). Prentice Hall.
Belt, B. and Smith, K.V. (2001). Comparisons of working capital management practices
in Australia and the United States’, Global Finance Journal, 2, pp. 27-54.
Bhattacharya, H. (2001). Total Management by Ratios, Sage Publication India Pvt. Ltd.
New Dehli.
Bhunia, A. (2010). A trend analysis of liquidity management efficiency in selected
private sector Indian steel industry, International Journal of Research in
Commerce and Management, Vol-1, 5, pp 213.
Bort, R. (2004). Corporate cash management hand book, 2nd edition, Warren Gorman
and Larmont RIA Group, New York.
Bowen M, Morara M, Mureithi S (2009). Management of business challenges among
small and micro enterprises in Nairobi-Kenya, Retrieved from
http://www.kcajournals.com. Accessed on 2nd
April 2013.
Brigham, E. F. and Ehrhardt, M. C. (2009). Financial Management: Theory and Practice
(11th Edition). New York: South-Western College Publishers.
Burns, N. and Grove, S. (2005). The Practice of Nursing Research: Conduct, Critique and
Utilization. 6rd edn., Philadelphia: WB Saunders Company
Cannon, A. R. (2008). Inventory Improvement and Financial Performance. International
Journal of Production Economics 115, 581–593.
Charitou, M., M. Elfani, and Lois, P. (2010). The Effect of Working Capital Management
On Firm’s Profitability: Empirical Evidence From An Emerging Market, Journal
of Business & Economics Research, vol. 8, No. 12, pp. 63-68, Dec 2010.
Chastain, C. E. (2008). Integration of cash management: Journal of Finance. 29(6): 79-
84.
Chen, H., Frank, M. Z. and Wu, Q.W. (2005). What Actually Happened to the Inventories
of American Companies between 1981 and 2000? Management Science 51(7).
Christopher, G. G. (2009). The Cash Conversion Cycle; White paper. Available on
www.BluePointStrategies.com. Accessed 27/07/2013.
Davidson, E. R. (2002). Cash Traps, 3rd edition New York, Prentice Hall.
52
Deloof, M. (2003). Does Working Capital Management Affect Profitability of Belgian
Firms? Journal of Business Finance Accounting, 30(314): 573-587.
Dilliman, D.A. (2005). Mail and Internet Surveys: The Total Design Method, 3rd
ed,
Chichester: John Wiley, New York.
Eljelly, A. (2004). Liquidity-Profitability Tradeoff: An empirical Investigation in An
Emerging Market, International Journal of Commerce & Management, 14(2). 48
– 61.
Ellis, K., Singh, R. and Ong’olo, D. (2010). Assessing the economic impact of
competition: findings from Kenya, London, Overseas Development Institute.
Eroglu, C. and Hofer, C. (2011). Lean, Leaner, Too Lean? The Inventory-Performance
Link Revisited. Journal of Operations Management 29, 356–369.
Filbeck, G. and Krueger, T. (2005). Industry Related Differences in Working Capital
Management, Mid-American Journal of Business, vol. 20, No. 2, pp. 11-18, 2005.
Fullerton, R. R., McWatters, C.S. and Fawson, C. (2003). Examination of Relationship
between JIT and Financial Performance. Journal of Operations Management 21.
Gitman, L. J. (2008). Principles of Managerial Finance, 5th edition, Harper and Raw
publishers, United Kingdom.
Grablowsky, B. J. (2006). Mismanagement of Accounts Receivable by Small Business,
Journal of Small Business, 14, pp.23-28.
Haber, S. & Reichel, A. (2005). Identifying performance measures of small ventures- the
case of the tourism industry. Journal of Small Business Management, 43(3), 260.
Howorth, C. and Westhead, P. (2003). The focus of working capital management in UK
small firms, Management Accounting Research, Vol. 14 No. 2, pp. 94-111.
Jose, M. L., Lancaster, C. and Stevens, J. L. (2006). Corporate Returns and Cash
Conversion Cycle, Journal of Economics and Finance, Vol. 20, No. 1, pp. 33-46.
Juan, P. G and Martinez, S. (2002). Effects of working capital management on SME
profitability, Journal of Business Finance Accounting, 30(3–4): 1-14.
Karekezi, S. and Kimani, J. (2010). Status of Bioenergy Development in Kenya: The
Case of Bagasse-based Cogeneration. Nairobi. August 2010.
Kegode, P. (2010). Economic Governance Reform in the Sugar Sub-sector, Paper
submitted to Center for Governance and Development.
Kirkman, P. (2006). Morden Credit Management, George Allen and Unwin, London.
53
Kolias, G.D., Dimelis, S.P. and Filios, V.P. (2011). An Empirical Analysis of Inventory
Turnover: 2000-2005. International Journal of Production Economics 133(1).
Kotut PK (2003). Working capital management practices by Kenyan firms: A case study
of firms listed in the NSE. Unpublished MBA project. Egerton University.
KSB, (2010). Kenya Sugar Board. Kenya Sugar Industry Strategic plan 2010-2014:
Enhancing industry Competitiveness. Nairobi.
Kwame K (2007). Working capital management practices of small firms in the Ashanti
region of Ghana. Available from http://www. ssrn.com. Accessed on 23rd
January
2013.
Lazaridis, I. and Dimitrios, T (2005). The relationship between working capital
management and profitability of listed companies in the Athens Stock Exchange.
Retrieved from http://ssrn.com/ on 13th
April 2013.
Marfo-Yiadom, J.S. (2006). Towards a Theory of Small Firm Performance: A Conceptual
Model, American Journal of Small Business, pp.41-58.
Masayi, N. and Netondo, G. W. (2012). Effects of sugarcane farming on diversity of
vegetable crops in Mumias Division, Western Kenya, International Journal of
Biodiversity and Conservation, Vol. 4(13), pp.515-524, October 2012.
Mbonyane, B.L. (2006). An exploration of factors that lead to failure of small businesses
in the Kagiso township. M. Tech. Business Administration thesis, University of
South Africa, Pretoria.
Meszek, L.J. and Polewski, L.A. (2006). Optimal working capital policies, Journal of
Financial and Quantitative Analysis, 7(1), pp. 47.
Michalski, G. M. (2007). Small and Medium Enterprises Accounts Receivable
Management. Available at http://ssrn.com. Accessed on 12th
May 2013.
Moyer R. C., Mcguigan J. R. and Kretlow W. J. (2001). Contemporary Financial
Management, West Publishing Co, Cincinati, Ohio.
Myers, S. C. (2003). Corporate financing and investment decisions when firms have
information that investors do not have. Journal of Financial Economics, Vol. 13,
187- 221.
Mathuva D.M. (2009). The Influence of Working Capital Management Components on
Corporate Profitability: A Survey on Kenyan Listed Firms, Research Journal of
Business Management, 14(3): 34 – 89.
Mutezo, A.T. (2005). Obstacles in the access to SMME finance: an empirical perspective
on Tshwane. Master of Commerce thesis, University of South Africa, Pretoria.
54
Oso, W. Y. and Onen, D. (2005). A general guide to writing research proposal and
reports.. Makerere University Press. Kampala, Uganda.
Padachi, K. (2006). Trends in Working Capital Management and its Impact on Firms’
Performance: International Review of Business Research Papers. 2(2), 45 - 58.
Pandey, I. M. (2004). Financial Management, 9th ed, Vikas Publishing House PVT Ltd.
Peel, M. and Wilson, N. (2006). Working capital and financial management practices in
the small firm sector, International Small Business Journal, 14, pp. 52-68.
Pindado, M. C. (2004). Cash Management Corporate Strategies, 5th
ed. Wiley Inter-
Science, New York.
Polit D.F. and Beck C.T. (2010). Essentials of Nursing Research, 7th
ed. Wolters Kluwer
Health Lippincott Williams & Wilkins, Philadelphia.
Raheman, A. & Nasr, M. (2007). Working Capital Management and Profitability: Case of
Pakistani Firms, International Review of Business Research Papers, Vol.3,No 1,
PP279- 300
Ricci, M.J. and Morrison, N. (2006), Working capital and financial management practices
in the small firm sector, International Small Business Journal, 14(2), pp. 52-68.
Smith M B and Sell E (2008), Measuring Association between WC and ROI, South Africa
Journal of Business Management, Vol. 28, No. 1, pp. 1-5.
Sushma, V. and Bhupesh, S. (2007). Effect of Working Capital Management Policies on
Corporate Performance. Global Business Review, pp. 8-267.
Thachappilly, G. (2011). Business Management. Available on:
http://www.suite101.com/businessmanagement (accessed 26 February 2013).
Van Horne, J. C. and Wachowicz, J. M. (2004). Fundamentals of Financial Management,
11th Ed. Prentice Hall Inc.
Vanhorne, J. C. (2001). Principles of Financial Management, 5th edition, McGraw
publishers, United Kingdom.
Waswa, F., Netondo, G. W., Maina, L. M. and Naisiko, T. (2011). Commercial sugarcane
farming in the Lake Victoria basin: A quandary of opportunities, Kampala, FP.
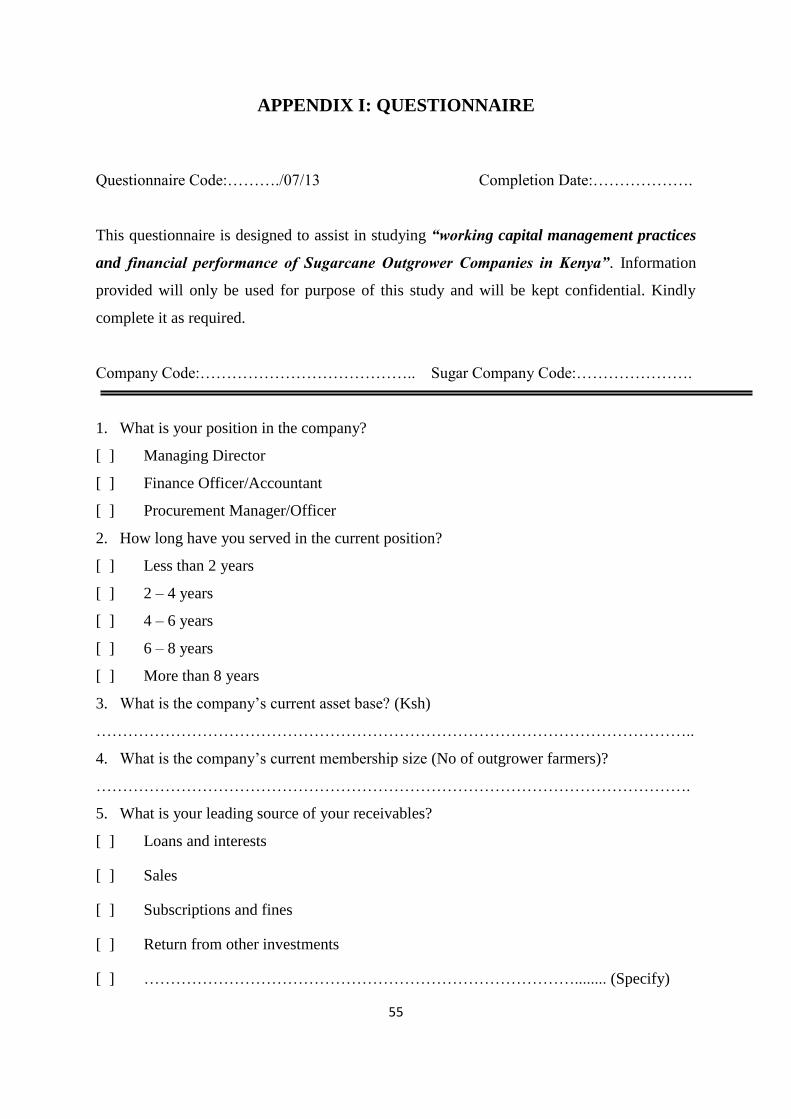
55
APPENDIX I: QUESTIONNAIRE
Questionnaire Code:………./07/13 Completion Date:……………….
This questionnaire is designed to assist in studying “working capital management practices
and financial performance of Sugarcane Outgrower Companies in Kenya”. Information
provided will only be used for purpose of this study and will be kept confidential. Kindly
complete it as required.
Company Code:………………………………….. Sugar Company Code:………………….
1. What is your position in the company?
[ ] Managing Director
[ ] Finance Officer/Accountant
[ ] Procurement Manager/Officer
2. How long have you served in the current position?
[ ] Less than 2 years
[ ] 2 – 4 years
[ ] 4 – 6 years
[ ] 6 – 8 years
[ ] More than 8 years
3. What is the company’s current asset base? (Ksh)
…………………………………………………………………………………………………..
4. What is the company’s current membership size (No of outgrower farmers)?
………………………………………………………………………………………………….
5. What is your leading source of your receivables?
[ ] Loans and interests
[ ] Sales
[ ] Subscriptions and fines
[ ] Return from other investments
[ ] ………………………………………………………………………........ (Specify)
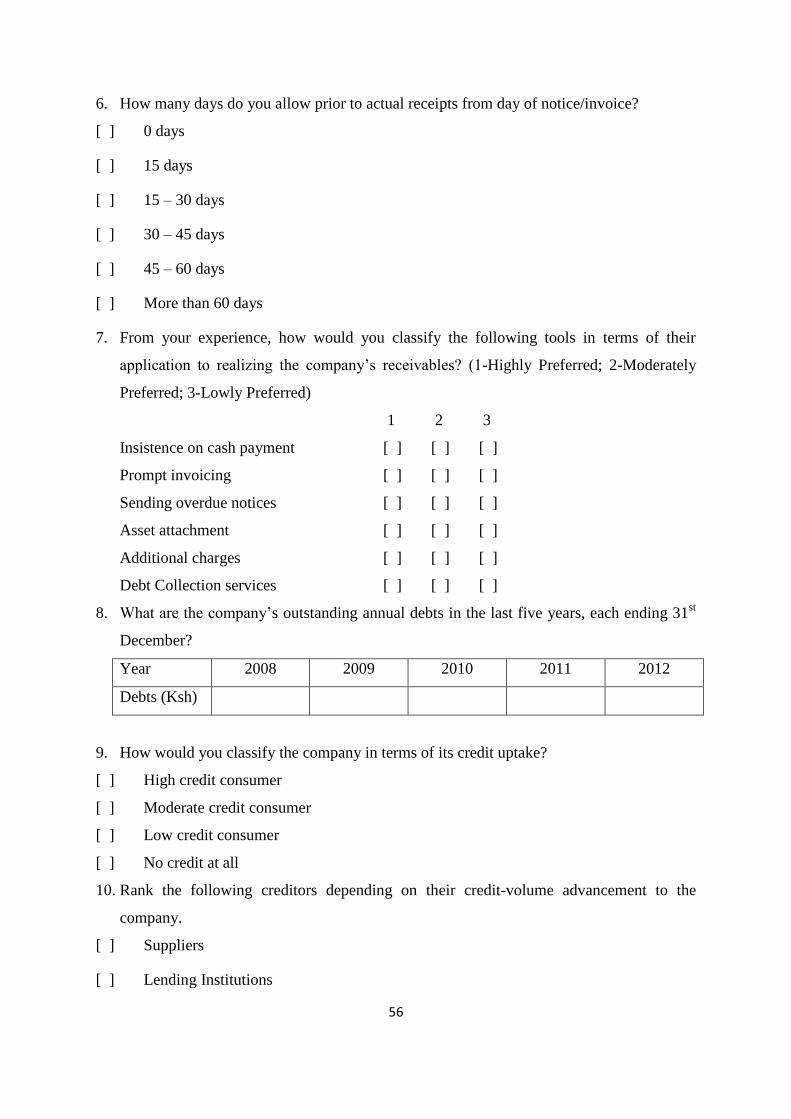
56
6. How many days do you allow prior to actual receipts from day of notice/invoice?
[ ] 0 days
[ ] 15 days
[ ] 15 – 30 days
[ ] 30 – 45 days
[ ] 45 – 60 days
[ ] More than 60 days
7. From your experience, how would you classify the following tools in terms of their
application to realizing the company’s receivables? (1-Highly Preferred; 2-Moderately
Preferred; 3-Lowly Preferred)
1 2 3
Insistence on cash payment [ ] [ ] [ ]
Prompt invoicing [ ] [ ] [ ]
Sending overdue notices [ ] [ ] [ ]
Asset attachment [ ] [ ] [ ]
Additional charges [ ] [ ] [ ]
Debt Collection services [ ] [ ] [ ]
8. What are the company’s outstanding annual debts in the last five years, each ending 31st
December?
Year 2008 2009 2010 2011 2012
Debts (Ksh)
9. How would you classify the company in terms of its credit uptake?
[ ] High credit consumer
[ ] Moderate credit consumer
[ ] Low credit consumer
[ ] No credit at all
10. Rank the following creditors depending on their credit-volume advancement to the
company.
[ ] Suppliers
[ ] Lending Institutions
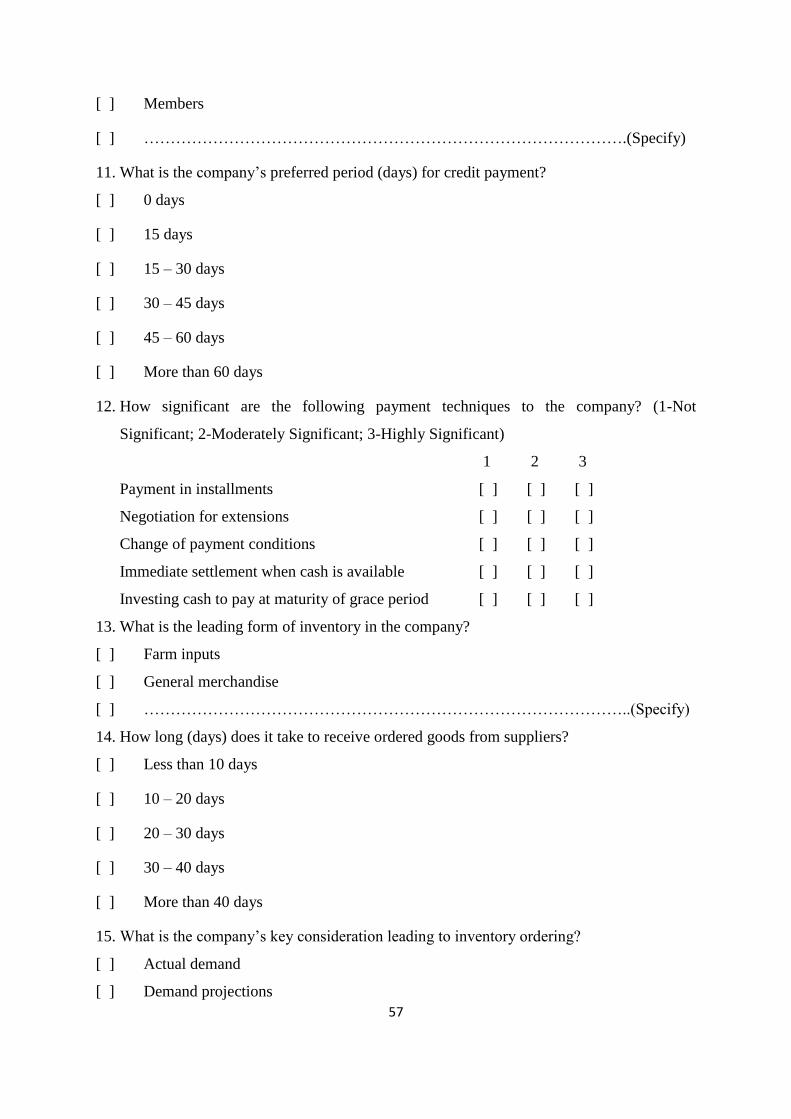
57
[ ] Members
[ ] ……………………………………………………………………………….(Specify)
11. What is the company’s preferred period (days) for credit payment?
[ ] 0 days
[ ] 15 days
[ ] 15 – 30 days
[ ] 30 – 45 days
[ ] 45 – 60 days
[ ] More than 60 days
12. How significant are the following payment techniques to the company? (1-Not
Significant; 2-Moderately Significant; 3-Highly Significant)
1 2 3
Payment in installments [ ] [ ] [ ]
Negotiation for extensions [ ] [ ] [ ]
Change of payment conditions [ ] [ ] [ ]
Immediate settlement when cash is available [ ] [ ] [ ]
Investing cash to pay at maturity of grace period [ ] [ ] [ ]
13. What is the leading form of inventory in the company?
[ ] Farm inputs
[ ] General merchandise
[ ] ………………………………………………………………………………..(Specify)
14. How long (days) does it take to receive ordered goods from suppliers?
[ ] Less than 10 days
[ ] 10 – 20 days
[ ] 20 – 30 days
[ ] 30 – 40 days
[ ] More than 40 days
15. What is the company’s key consideration leading to inventory ordering?
[ ] Actual demand
[ ] Demand projections
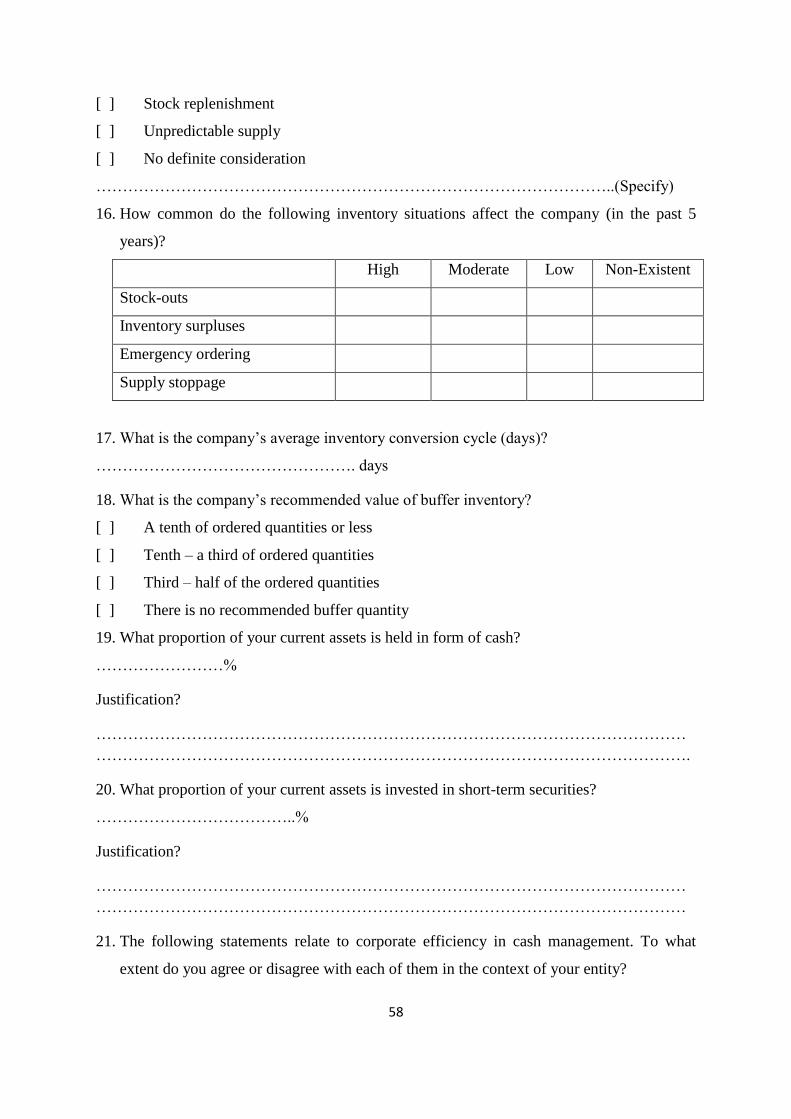
58
[ ] Stock replenishment
[ ] Unpredictable supply
[ ] No definite consideration
……………………………………………………………………………………..(Specify)
16. How common do the following inventory situations affect the company (in the past 5
years)?
High Moderate Low Non-Existent
Stock-outs
Inventory surpluses
Emergency ordering
Supply stoppage
17. What is the company’s average inventory conversion cycle (days)?
…………………………………………. days
18. What is the company’s recommended value of buffer inventory?
[ ] A tenth of ordered quantities or less
[ ] Tenth – a third of ordered quantities
[ ] Third – half of the ordered quantities
[ ] There is no recommended buffer quantity
19. What proportion of your current assets is held in form of cash?
……………………%
Justification?
…………………………………………………………………………………………………
………………………………………………………………………………………………….
20. What proportion of your current assets is invested in short-term securities?
………………………………..%
Justification?
…………………………………………………………………………………………………
…………………………………………………………………………………………………
21. The following statements relate to corporate efficiency in cash management. To what
extent do you agree or disagree with each of them in the context of your entity?
59
1 2 3 4 5
There is a well-defined policy on minimum liquidity [ ] [ ] [ ] [ ] [ ]
There are regular cash flow projections [ ] [ ] [ ] [ ] [ ]
There are regular bank reconciliations and audits [ ] [ ] [ ] [ ] [ ]
There are ready investment avenues for excess cash [ ] [ ] [ ] [ ] [ ]
Excess cash is held to meet future obligations [ ] [ ] [ ] [ ] [ ]
22. How has the company performed in the last five years on net profits and total assets?
(Complete the table below)
Year 2008 2009 2010 2011 2012
Net Profit (Ksh)
Total Assets (Ksh)
23. From your experience, what hinders Sugarcane Outgrower Companies from optimizing
their returns through management of their working capital?
…………………………………………………………………………………………………
…………………………………………………………………………………………………
…………………………………………………………………………………………………
24. What would be your advice to finance practitioners in the industry regarding working
capital management?
…………………………………………………………………………………………………
…………………………………………………………………………………………………
………………………………………………………………………………………………..
End
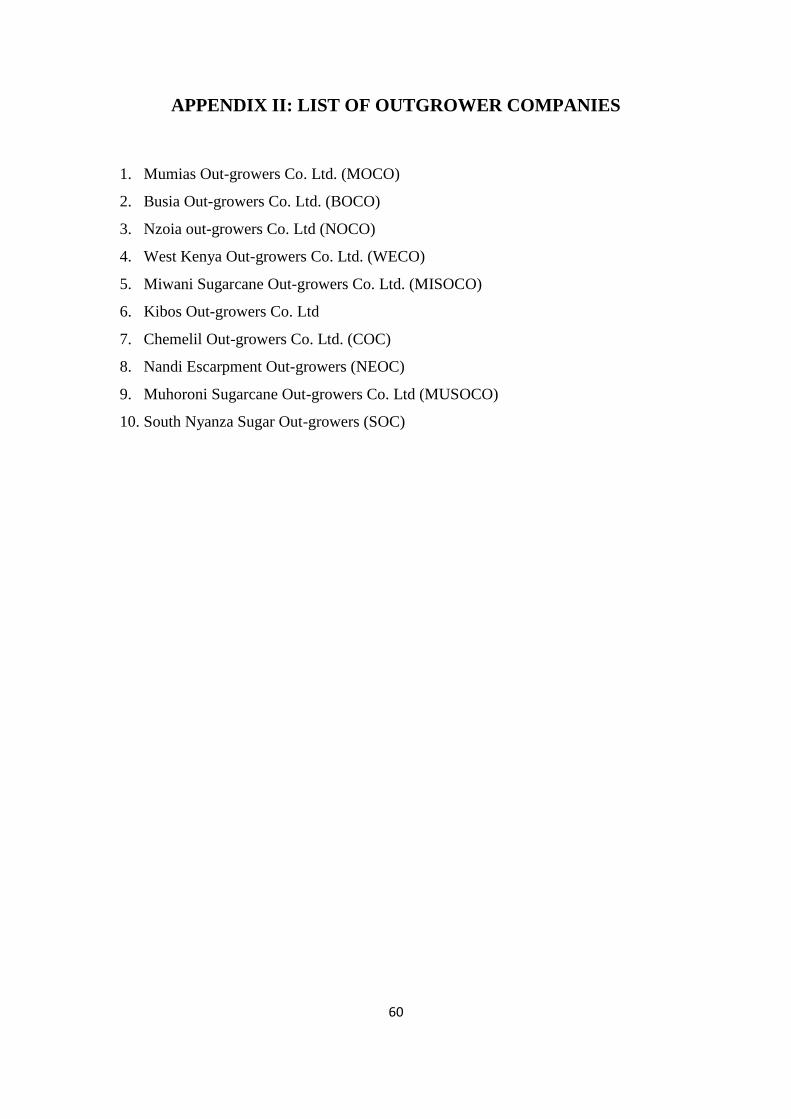
60
APPENDIX II: LIST OF OUTGROWER COMPANIES
1. Mumias Out-growers Co. Ltd. (MOCO)
2. Busia Out-growers Co. Ltd. (BOCO)
3. Nzoia out-growers Co. Ltd (NOCO)
4. West Kenya Out-growers Co. Ltd. (WECO)
5. Miwani Sugarcane Out-growers Co. Ltd. (MISOCO)
6. Kibos Out-growers Co. Ltd
7. Chemelil Out-growers Co. Ltd. (COC)
8. Nandi Escarpment Out-growers (NEOC)
9. Muhoroni Sugarcane Out-growers Co. Ltd (MUSOCO)
10. South Nyanza Sugar Out-growers (SOC)