Embed Size (px)
Citation preview
WORKING CAPITAL MANAGEMENT EFFICIENCY OF SUGAR
FACTORIES IN ANDHRA PRADESH: A CASE STUDY OF SELECT
SUGAR FACTORIES IN CHITTOOR DISTRICT
*Dr .D.VENKATESH
Assistant Professor, Department of Commerce,
Besant Theosophical College, Madanapalle.
**Prof. M.VENKATESWARLU
Professor, Dept. of Commerce, S V University, Tirupati.
ABSTRACT
Sugar cane is an important commercial crop in India. More than 45 million sugar-cane
farmers and large mass of agricultural laborers involved in sugar-cane cultivation and harvesting
are dependent on the performance of sugar industry in India. Management of working capital
performs a very vital part in the performance of firms in sugar industry. Working capital is the
foundation stone of the business. When a business is started, the owners and investors contribute
this capital. The ultimate objective of any firm is to optimize, if not maximize, the wealth of the
shareholders. In order to do this, a firm should earn a suitable return from its operations. In order
to earn sufficient returns, the firm should be able to generate sufficient sales. This requires
adequate investment in current assets because all the sales do not get converted into cash
immediately. The researcher has made an attempt to examine this study focus on working
capital management efficiency of select sugar factories in Chittoor district.
Key Words: Sugar cane, Working Capital, Sufficient Returns and Sugar Factory.
Introduction
Working capital is the foundation stone of the business. When a business is started, the
owners and investors contribute this capital. This capital is then invested in the long term assets
such as land, building, plant and machinery. These fixed assets are of no use unless they are put
to use. The capital, it makes the fixed assets work, is called the working capital. Fixed assets are
like computer hardware, whereas working capital is like computer software. Hardware is dead
without the software; similarly, long-term assets of the business are of no use if there is no
working capital. Working capital is that minimum amount which is always there in a business,
International Journal of Research
Volume VIII, Issue VI, JUNE/2019
ISSN NO:2236-6124
Page No:3599
that is used to meet payments as and when they become due, and is used to avoid technical
insolvency arising out of non-payment of routine bills1.
The ultimate objective of any firm is to optimize, if not maximize, the wealth of the
shareholders. In order to do this, a firm should earn a suitable return from its operations. In order
to earn sufficient returns, the firm should be able to generate sufficient sales. This requires
adequate investment in current assets because all the sales do not get converted into cash
immediately2. The need for working capital arises due to time gap between production and
realization of cash from sales. There is an operating cycle involved in sales and realisation of
cash. There are time gaps in purchase of raw materials and production, production and sales, and
sales and realization of cash.
Objective:
The present study aims to appraise the working capital management efficiency of the
select sugar factories in Chittoor District.
Review of Literature
Dr.R.Gowri (2015), in her article “A Study on Impact of Working Capital Management
on Profitability with Reference to Sugar Companies in Tamil Nadu” analysed that sugar
companies are facing many financial problems. Most of the sugar companies are operationally
viable but are suffering from lack of proper management of working capital. Hence, it is the need
to analyse the impact of working capital management on profitability and improve its firm’s
growth opportunities and return to shareholders. Therefore, the study was made as an attempt to
analyse the impact of WCM on profitability of sugar companies in Tamil Nadu3.
Praveena. S and Mahendran. K. (2013), in their article “Working Capital Management
Efficiency of Sugar Sector in India” found that efficient working capital management was
important for the corporate strategy. Firms try to keep the average level of working capital that
maximizes their value. This study attempted to evaluate the efficiency of working capital
management of sugar sector in India for the period 2007-2012. Instead of employing the
financial ratios, working capital efficiency had been measured in terms of utilization index,
performance index and total efficiency index. Findings of the study indicate that the sugar sector
as a whole was performing well during the study period4.
International Journal of Research
Volume VIII, Issue VI, JUNE/2019
ISSN NO:2236-6124
Page No:3600
Ramachandran and Gopinathan (2012), analysed the relationship between, "Working
Capital Management and Profitability of Sugar Industry in India". There was a significant
positive co-efficient between current ratio and Return on Investment (5.263), Inventory Turnover
Ratio and Return on Investment (1.110) at 5 per cent level. Also there was a significant negative
co-efficient between Quick ratio and Return on Investment (-10.582), Working Capital Turnover
Ratio and Return on Investment (-0.036) at 5 per cent level. Debtors Turnover Ratio recorded
highly significant negative co-efficient (-0.020) at 1 per cent level with Return on Investment.
Creditors Turnover Ratio registered insignificant positive co-efficient 0.014 with profitability.
The overall regression model fit, which was represented by R2, was above 50 per cent (0.51)
which indicated that the sugar industry in India was poised to reap a rich harvest in the season
beginning from October, 2010. The Sugar Corporate firms are over-burdened with surplus
inventories that most of them do not have adequate storage facilities, capacities and cash flow
which have led them to resort to distress sale of sugar which brought down the prices5.
SAMPLE DESIGN
The present study is confined to the study of working capital management efficiency of
select sugar factories in Chittoor district. There are 6 sugar factories in Chittoor district. Out of
these, two factories are in co-operative sector, and four factories are in private sector. Out of
these six sugar factories, three sugar factories are not working i.e., one in private sector and two
in co-operative sector. The researcher has adopted census method and chosen three sugar
factories namely, Prudential Sugar Corporation Limited, Nindra, SNJ Sugars and Products
Limited, S.R.Puram and Suddalagunta Sugars Limited, B.N.Kandriga and all belong to private
sector
Scope and Limitation of the Study
The present study is confined to the working capital management efficiency of select
sugar factories in Chittoor district only. The present study may not be free from limitations. The
figures taken from the annual reports have been rounded off to two decimals of rupees in lakh.
The accuracy of the data depends on the accuracy of the data available in the balance sheet of the
company
International Journal of Research
Volume VIII, Issue VI, JUNE/2019
ISSN NO:2236-6124
Page No:3601
Source of Data Collection
The study is based on the data collected from secondary source only. Both qualitative
and quantitative data relating to the working of sugar factories, cost of production, financial
performance and other related aspects are collected from individual sugar industries, and
regarding their capacity and production etc., the data was collected from journals, annual survey
of the industry and the annual reports of the select sugar factories.
Period of Study
The study is confined to the evaluation of working capital management efficiency of
select sugar factories in Chittoor district only. In the opinion of the researcher, a time span of 10
years is quite reasonable to assess the trend and growth in the effective utilization of resources
and efficiency of financial performance. To exclude abnormalities, the period is fixed for 10
years i.e., from 2006-07 to 2015-16.
Working Capital Analysis
The working capital management efficiency is done with the help of following ratios lime
liquidity and turnover ratios.
Liquidity Ratios:
Liquidity means how quickly you can get your hands on your cash. In simpler terms,
liquidity is to get your money whenever you need it. Liquidity refers to the ability of the firm to
meet the current financial obligations in the short run, usually one year. A firm should ensure
that it does not suffer from lack of liquidity and also it does not carry too much liquidity as this
hampers profitability.
The liquidity ratios measure the ability of a firm to meet its short-term obligations and
reflect the short-term financial strength of a firm. To measure the liquidity of the firm, the
following ratios are commonly used:
Current Ratio
Quick Ratio
Current Ratio
Current ratio represents the relationship between current assets and current liabilities. It
attempts to measure the ability of a firm to meet its current obligations. The standard norm of
International Journal of Research
Volume VIII, Issue VI, JUNE/2019
ISSN NO:2236-6124
Page No:3602
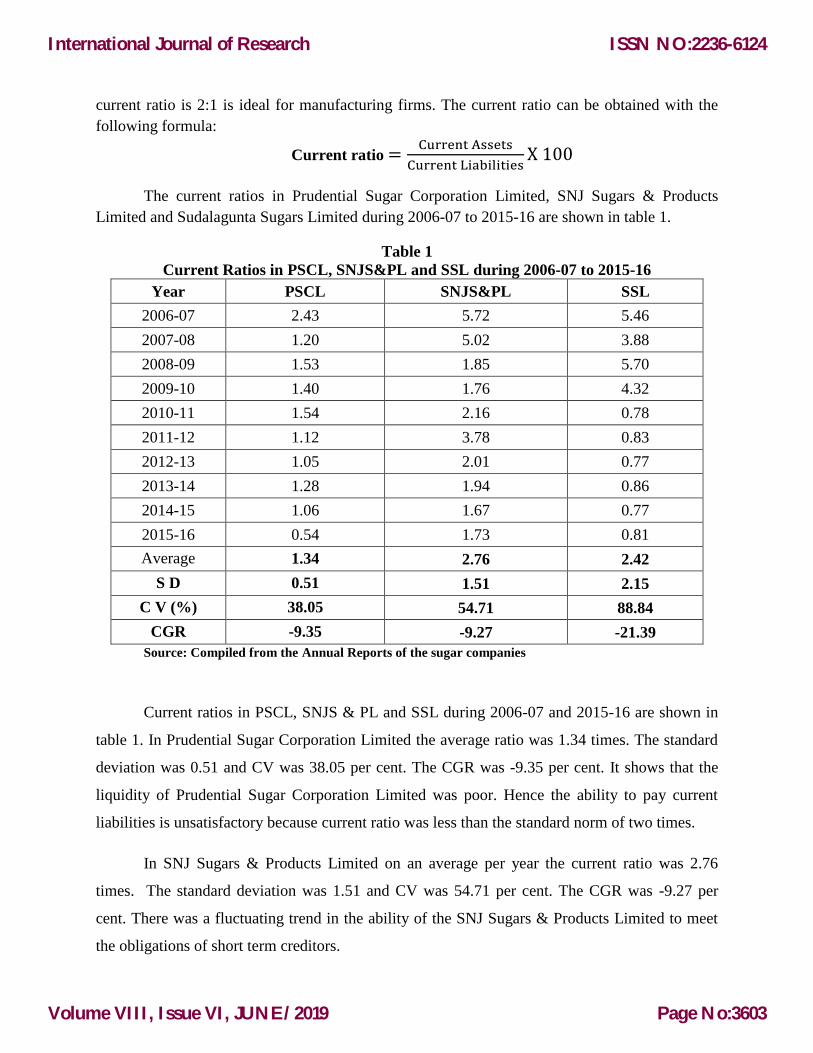
current ratio is 2:1 is ideal for manufacturing firms. The current ratio can be obtained with the
following formula:
Current ratio =Current Assets
Current LiabilitiesX 100
The current ratios in Prudential Sugar Corporation Limited, SNJ Sugars & Products
Limited and Sudalagunta Sugars Limited during 2006-07 to 2015-16 are shown in table 1.
Table 1
Current Ratios in PSCL, SNJS&PL and SSL during 2006-07 to 2015-16
Year PSCL SNJS&PL SSL
2006-07 2.43 5.72 5.46
2007-08 1.20 5.02 3.88
2008-09 1.53 1.85 5.70
2009-10 1.40 1.76 4.32
2010-11 1.54 2.16 0.78
2011-12 1.12 3.78 0.83
2012-13 1.05 2.01 0.77
2013-14 1.28 1.94 0.86
2014-15 1.06 1.67 0.77
2015-16 0.54 1.73 0.81
Average 1.34 2.76 2.42
S D 0.51 1.51 2.15
C V (%) 38.05 54.71 88.84
CGR -9.35 -9.27 -21.39
Source: Compiled from the Annual Reports of the sugar companies
Current ratios in PSCL, SNJS & PL and SSL during 2006-07 and 2015-16 are shown in
table 1. In Prudential Sugar Corporation Limited the average ratio was 1.34 times. The standard
deviation was 0.51 and CV was 38.05 per cent. The CGR was -9.35 per cent. It shows that the
liquidity of Prudential Sugar Corporation Limited was poor. Hence the ability to pay current
liabilities is unsatisfactory because current ratio was less than the standard norm of two times.
In SNJ Sugars & Products Limited on an average per year the current ratio was 2.76
times. The standard deviation was 1.51 and CV was 54.71 per cent. The CGR was -9.27 per
cent. There was a fluctuating trend in the ability of the SNJ Sugars & Products Limited to meet
the obligations of short term creditors.
International Journal of Research
Volume VIII, Issue VI, JUNE/2019
ISSN NO:2236-6124
Page No:3603
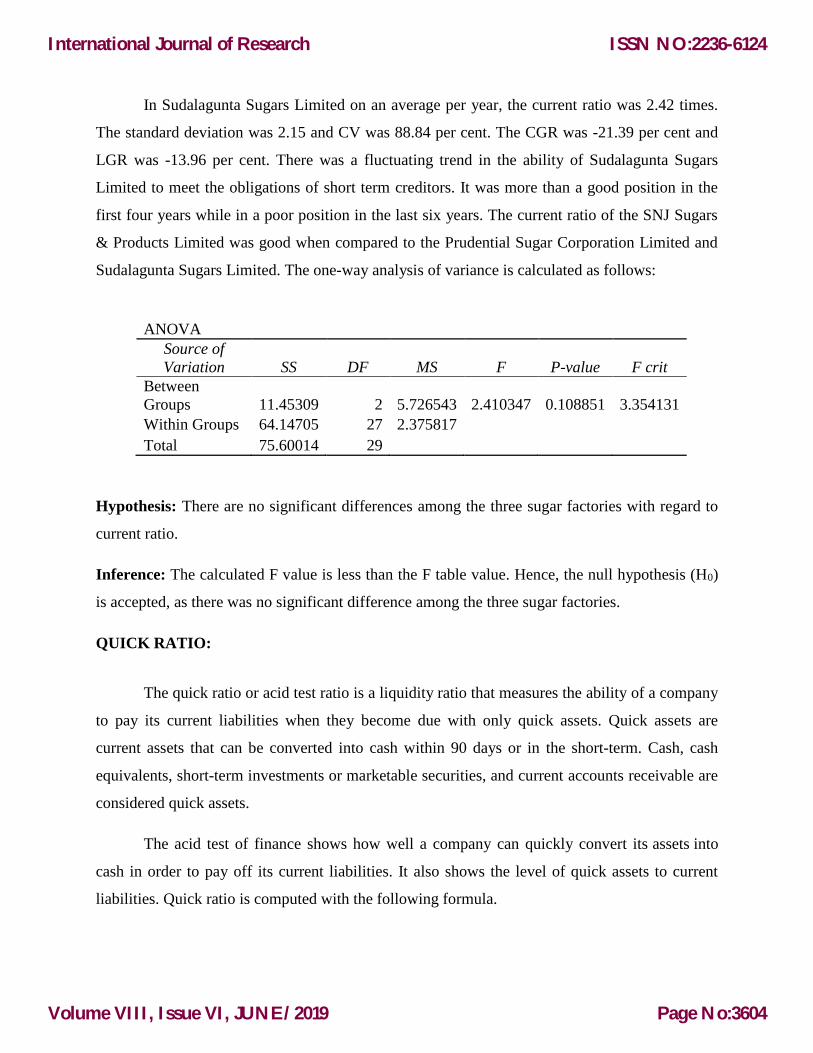
In Sudalagunta Sugars Limited on an average per year, the current ratio was 2.42 times.
The standard deviation was 2.15 and CV was 88.84 per cent. The CGR was -21.39 per cent and
LGR was -13.96 per cent. There was a fluctuating trend in the ability of Sudalagunta Sugars
Limited to meet the obligations of short term creditors. It was more than a good position in the
first four years while in a poor position in the last six years. The current ratio of the SNJ Sugars
& Products Limited was good when compared to the Prudential Sugar Corporation Limited and
Sudalagunta Sugars Limited. The one-way analysis of variance is calculated as follows:
ANOVA
Source of
Variation SS DF MS F P-value F crit
Between
Groups 11.45309 2 5.726543 2.410347 0.108851 3.354131
Within Groups 64.14705 27 2.375817
Total 75.60014 29
Hypothesis: There are no significant differences among the three sugar factories with regard to
current ratio.
Inference: The calculated F value is less than the F table value. Hence, the null hypothesis (H0)
is accepted, as there was no significant difference among the three sugar factories.
QUICK RATIO:
The quick ratio or acid test ratio is a liquidity ratio that measures the ability of a company
to pay its current liabilities when they become due with only quick assets. Quick assets are
current assets that can be converted into cash within 90 days or in the short-term. Cash, cash
equivalents, short-term investments or marketable securities, and current accounts receivable are
considered quick assets.
The acid test of finance shows how well a company can quickly convert its assets into
cash in order to pay off its current liabilities. It also shows the level of quick assets to current
liabilities. Quick ratio is computed with the following formula.
International Journal of Research
Volume VIII, Issue VI, JUNE/2019
ISSN NO:2236-6124
Page No:3604
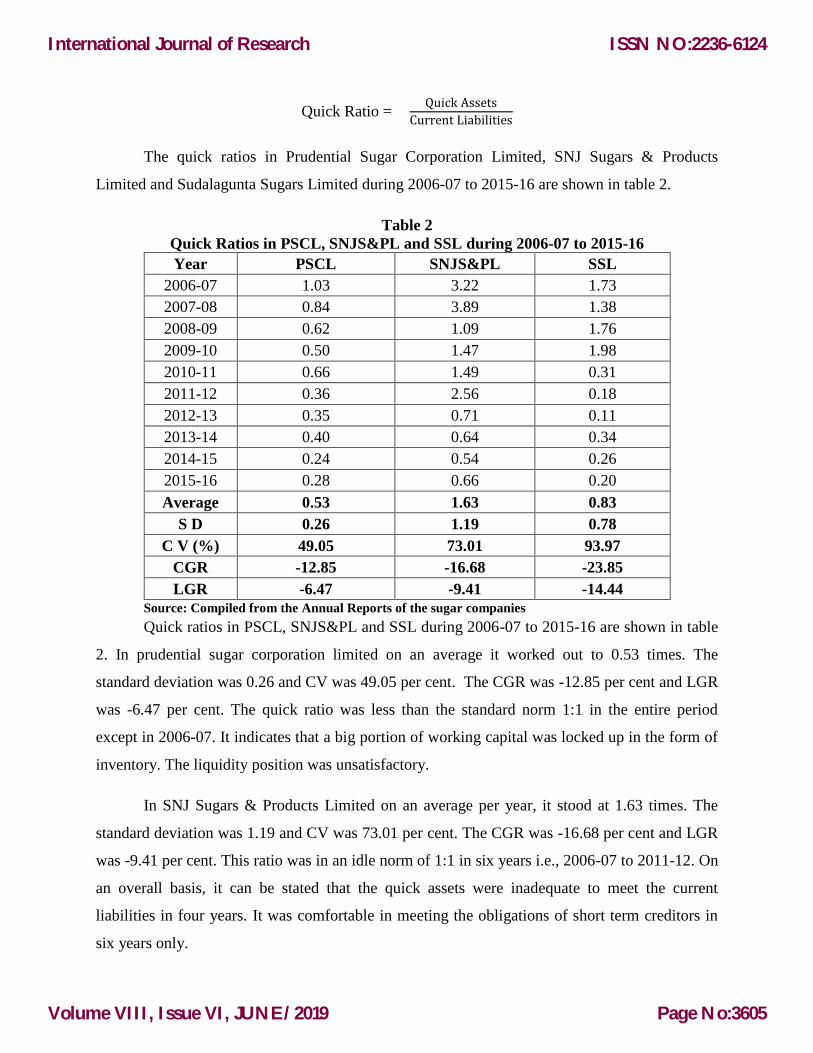
Quick Ratio = Quick Assets
Current Liabilities
The quick ratios in Prudential Sugar Corporation Limited, SNJ Sugars & Products
Limited and Sudalagunta Sugars Limited during 2006-07 to 2015-16 are shown in table 2.
Table 2
Quick Ratios in PSCL, SNJS&PL and SSL during 2006-07 to 2015-16
Year PSCL SNJS&PL SSL
2006-07 1.03 3.22 1.73
2007-08 0.84 3.89 1.38
2008-09 0.62 1.09 1.76
2009-10 0.50 1.47 1.98
2010-11 0.66 1.49 0.31
2011-12 0.36 2.56 0.18
2012-13 0.35 0.71 0.11
2013-14 0.40 0.64 0.34
2014-15 0.24 0.54 0.26
2015-16 0.28 0.66 0.20
Average 0.53 1.63 0.83
S D 0.26 1.19 0.78
C V (%) 49.05 73.01 93.97
CGR -12.85 -16.68 -23.85
LGR -6.47 -9.41 -14.44
Source: Compiled from the Annual Reports of the sugar companies
Quick ratios in PSCL, SNJS&PL and SSL during 2006-07 to 2015-16 are shown in table
2. In prudential sugar corporation limited on an average it worked out to 0.53 times. The
standard deviation was 0.26 and CV was 49.05 per cent. The CGR was -12.85 per cent and LGR
was -6.47 per cent. The quick ratio was less than the standard norm 1:1 in the entire period
except in 2006-07. It indicates that a big portion of working capital was locked up in the form of
inventory. The liquidity position was unsatisfactory.
In SNJ Sugars & Products Limited on an average per year, it stood at 1.63 times. The
standard deviation was 1.19 and CV was 73.01 per cent. The CGR was -16.68 per cent and LGR
was -9.41 per cent. This ratio was in an idle norm of 1:1 in six years i.e., 2006-07 to 2011-12. On
an overall basis, it can be stated that the quick assets were inadequate to meet the current
liabilities in four years. It was comfortable in meeting the obligations of short term creditors in
six years only.
International Journal of Research
Volume VIII, Issue VI, JUNE/2019
ISSN NO:2236-6124
Page No:3605
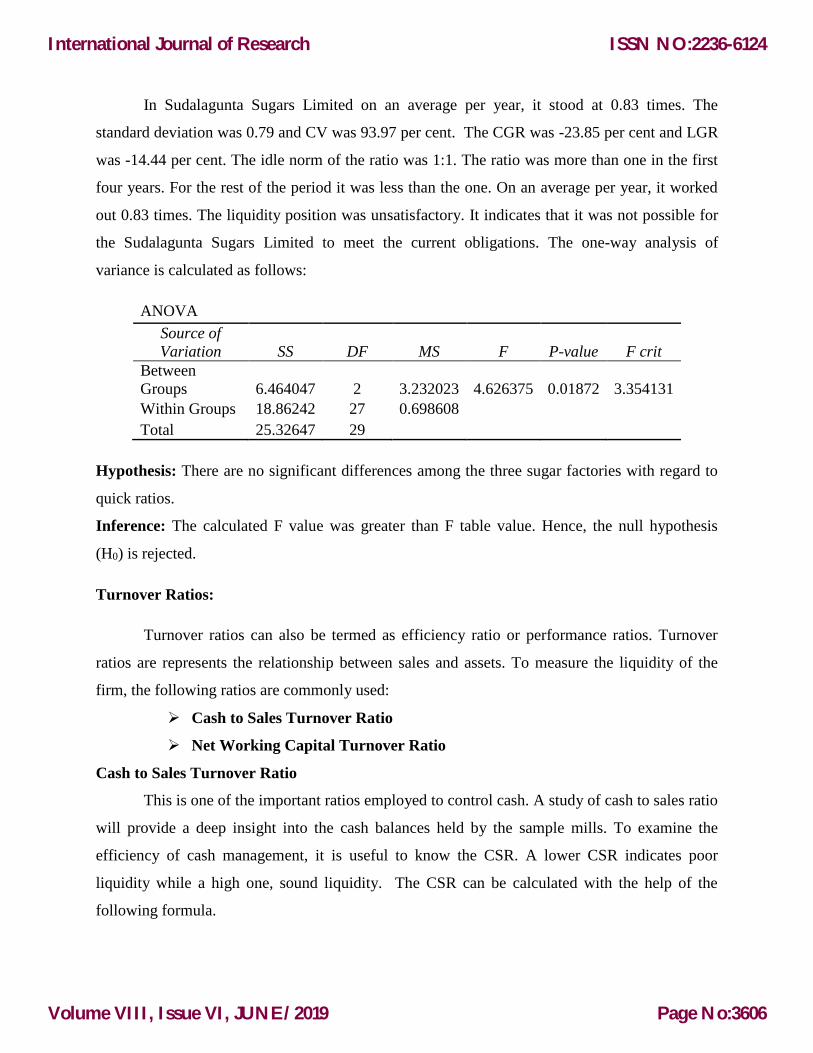
In Sudalagunta Sugars Limited on an average per year, it stood at 0.83 times. The
standard deviation was 0.79 and CV was 93.97 per cent. The CGR was -23.85 per cent and LGR
was -14.44 per cent. The idle norm of the ratio was 1:1. The ratio was more than one in the first
four years. For the rest of the period it was less than the one. On an average per year, it worked
out 0.83 times. The liquidity position was unsatisfactory. It indicates that it was not possible for
the Sudalagunta Sugars Limited to meet the current obligations. The one-way analysis of
variance is calculated as follows:
ANOVA
Source of
Variation SS DF MS F P-value F crit
Between
Groups 6.464047 2 3.232023 4.626375 0.01872 3.354131
Within Groups 18.86242 27 0.698608
Total 25.32647 29
Hypothesis: There are no significant differences among the three sugar factories with regard to
quick ratios.
Inference: The calculated F value was greater than F table value. Hence, the null hypothesis
(H0) is rejected.
Turnover Ratios:
Turnover ratios can also be termed as efficiency ratio or performance ratios. Turnover
ratios are represents the relationship between sales and assets. To measure the liquidity of the
firm, the following ratios are commonly used:
Cash to Sales Turnover Ratio
Net Working Capital Turnover Ratio
Cash to Sales Turnover Ratio
This is one of the important ratios employed to control cash. A study of cash to sales ratio
will provide a deep insight into the cash balances held by the sample mills. To examine the
efficiency of cash management, it is useful to know the CSR. A lower CSR indicates poor
liquidity while a high one, sound liquidity. The CSR can be calculated with the help of the
following formula.
International Journal of Research
Volume VIII, Issue VI, JUNE/2019
ISSN NO:2236-6124
Page No:3606
100Cash
Cashto sales ratio XSales
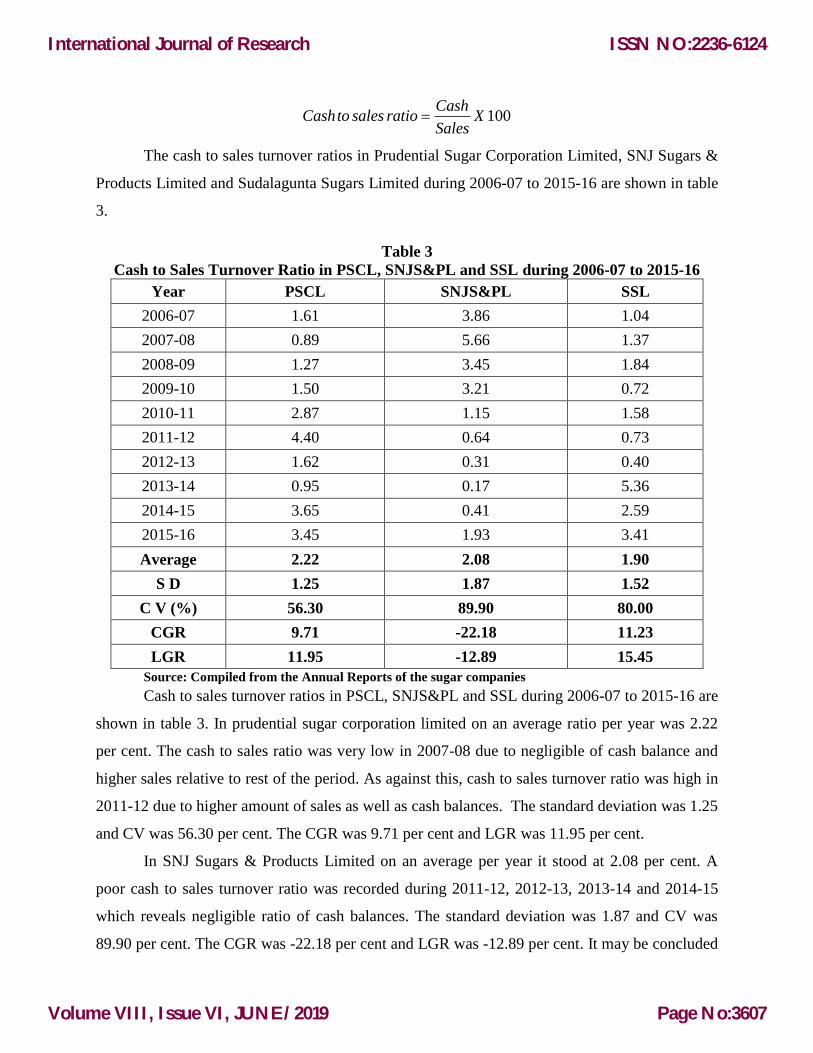
The cash to sales turnover ratios in Prudential Sugar Corporation Limited, SNJ Sugars &
Products Limited and Sudalagunta Sugars Limited during 2006-07 to 2015-16 are shown in table
3.
Table 3
Cash to Sales Turnover Ratio in PSCL, SNJS&PL and SSL during 2006-07 to 2015-16
Year PSCL SNJS&PL SSL
2006-07 1.61 3.86 1.04
2007-08 0.89 5.66 1.37
2008-09 1.27 3.45 1.84
2009-10 1.50 3.21 0.72
2010-11 2.87 1.15 1.58
2011-12 4.40 0.64 0.73
2012-13 1.62 0.31 0.40
2013-14 0.95 0.17 5.36
2014-15 3.65 0.41 2.59
2015-16 3.45 1.93 3.41
Average 2.22 2.08 1.90
S D 1.25 1.87 1.52
C V (%) 56.30 89.90 80.00
CGR 9.71 -22.18 11.23
LGR 11.95 -12.89 15.45
Source: Compiled from the Annual Reports of the sugar companies
Cash to sales turnover ratios in PSCL, SNJS&PL and SSL during 2006-07 to 2015-16 are
shown in table 3. In prudential sugar corporation limited on an average ratio per year was 2.22
per cent. The cash to sales ratio was very low in 2007-08 due to negligible of cash balance and
higher sales relative to rest of the period. As against this, cash to sales turnover ratio was high in
2011-12 due to higher amount of sales as well as cash balances. The standard deviation was 1.25
and CV was 56.30 per cent. The CGR was 9.71 per cent and LGR was 11.95 per cent.
In SNJ Sugars & Products Limited on an average per year it stood at 2.08 per cent. A
poor cash to sales turnover ratio was recorded during 2011-12, 2012-13, 2013-14 and 2014-15
which reveals negligible ratio of cash balances. The standard deviation was 1.87 and CV was
89.90 per cent. The CGR was -22.18 per cent and LGR was -12.89 per cent. It may be concluded
International Journal of Research
Volume VIII, Issue VI, JUNE/2019
ISSN NO:2236-6124
Page No:3607
that the cash to sales turnover ratio was not satisfactory in SNJ Sugars & Products Limited
during the study period.
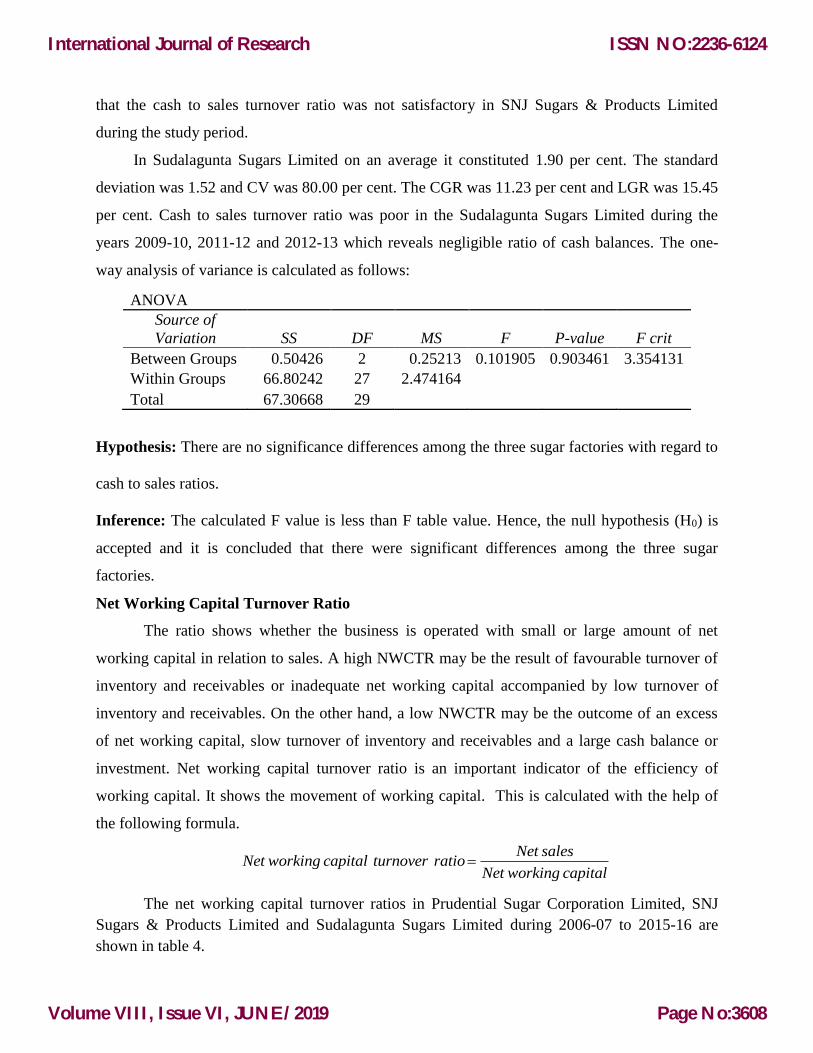
In Sudalagunta Sugars Limited on an average it constituted 1.90 per cent. The standard
deviation was 1.52 and CV was 80.00 per cent. The CGR was 11.23 per cent and LGR was 15.45
per cent. Cash to sales turnover ratio was poor in the Sudalagunta Sugars Limited during the
years 2009-10, 2011-12 and 2012-13 which reveals negligible ratio of cash balances. The one-
way analysis of variance is calculated as follows:
ANOVA
Source of
Variation SS DF MS F P-value F crit
Between Groups 0.50426 2 0.25213 0.101905 0.903461 3.354131
Within Groups 66.80242 27 2.474164
Total 67.30668 29
Hypothesis: There are no significance differences among the three sugar factories with regard to
cash to sales ratios.
Inference: The calculated F value is less than F table value. Hence, the null hypothesis (H0) is
accepted and it is concluded that there were significant differences among the three sugar
factories.
Net Working Capital Turnover Ratio
The ratio shows whether the business is operated with small or large amount of net
working capital in relation to sales. A high NWCTR may be the result of favourable turnover of
inventory and receivables or inadequate net working capital accompanied by low turnover of
inventory and receivables. On the other hand, a low NWCTR may be the outcome of an excess
of net working capital, slow turnover of inventory and receivables and a large cash balance or
investment. Net working capital turnover ratio is an important indicator of the efficiency of
working capital. It shows the movement of working capital. This is calculated with the help of
the following formula.
Net salesNet working capital turnover ratio
Net working capital
The net working capital turnover ratios in Prudential Sugar Corporation Limited, SNJ
Sugars & Products Limited and Sudalagunta Sugars Limited during 2006-07 to 2015-16 are
shown in table 4.
International Journal of Research
Volume VIII, Issue VI, JUNE/2019
ISSN NO:2236-6124
Page No:3608
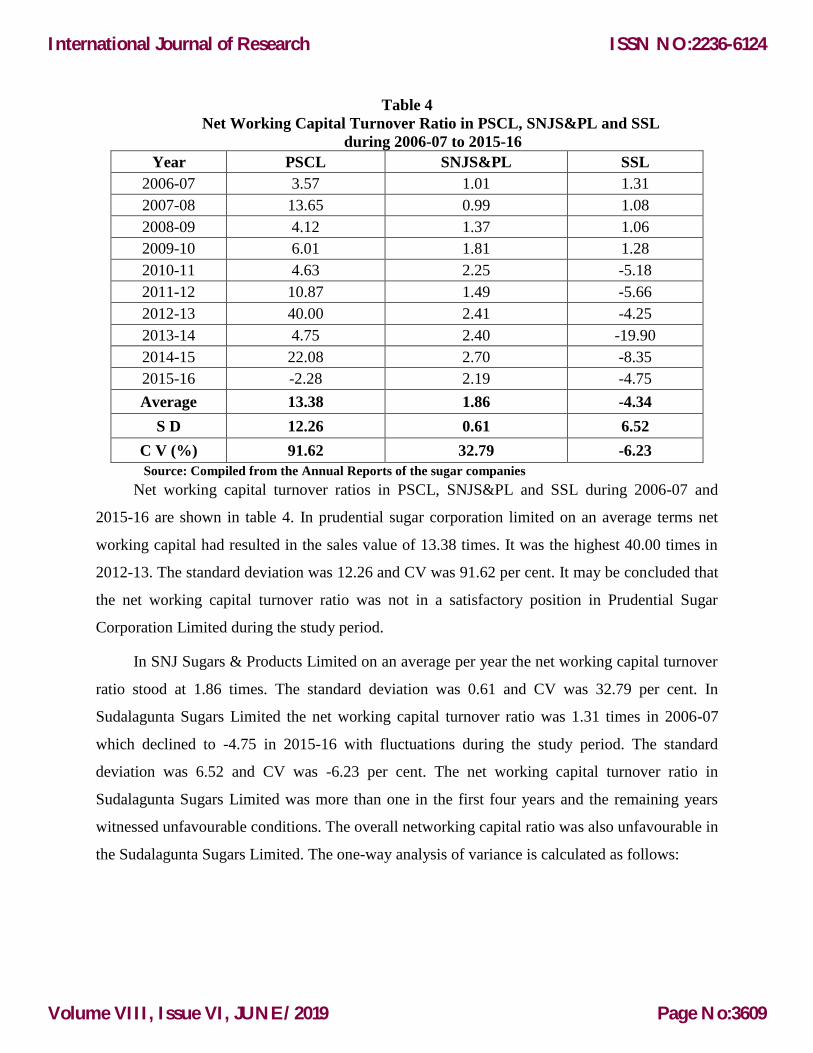
Table 4
Net Working Capital Turnover Ratio in PSCL, SNJS&PL and SSL
during 2006-07 to 2015-16
Year PSCL SNJS&PL SSL
2006-07 3.57 1.01 1.31
2007-08 13.65 0.99 1.08
2008-09 4.12 1.37 1.06
2009-10 6.01 1.81 1.28
2010-11 4.63 2.25 -5.18
2011-12 10.87 1.49 -5.66
2012-13 40.00 2.41 -4.25
2013-14 4.75 2.40 -19.90
2014-15 22.08 2.70 -8.35
2015-16 -2.28 2.19 -4.75
Average 13.38 1.86 -4.34
S D 12.26 0.61 6.52
C V (%) 91.62 32.79 -6.23
Source: Compiled from the Annual Reports of the sugar companies
Net working capital turnover ratios in PSCL, SNJS&PL and SSL during 2006-07 and
2015-16 are shown in table 4. In prudential sugar corporation limited on an average terms net
working capital had resulted in the sales value of 13.38 times. It was the highest 40.00 times in
2012-13. The standard deviation was 12.26 and CV was 91.62 per cent. It may be concluded that
the net working capital turnover ratio was not in a satisfactory position in Prudential Sugar
Corporation Limited during the study period.
In SNJ Sugars & Products Limited on an average per year the net working capital turnover
ratio stood at 1.86 times. The standard deviation was 0.61 and CV was 32.79 per cent. In
Sudalagunta Sugars Limited the net working capital turnover ratio was 1.31 times in 2006-07
which declined to -4.75 in 2015-16 with fluctuations during the study period. The standard
deviation was 6.52 and CV was -6.23 per cent. The net working capital turnover ratio in
Sudalagunta Sugars Limited was more than one in the first four years and the remaining years
witnessed unfavourable conditions. The overall networking capital ratio was also unfavourable in
the Sudalagunta Sugars Limited. The one-way analysis of variance is calculated as follows:
International Journal of Research
Volume VIII, Issue VI, JUNE/2019
ISSN NO:2236-6124
Page No:3609
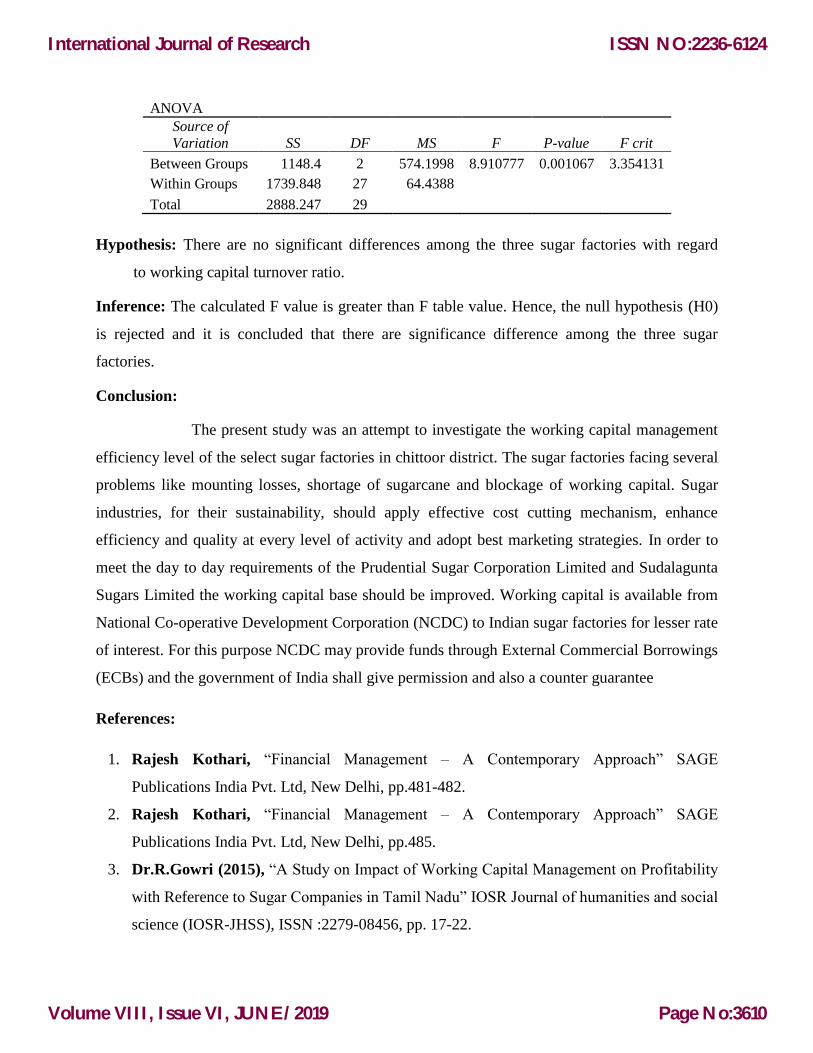
ANOVA
Source of
Variation SS DF MS F P-value F crit
Between Groups 1148.4 2 574.1998 8.910777 0.001067 3.354131
Within Groups 1739.848 27 64.4388
Total 2888.247 29
Hypothesis: There are no significant differences among the three sugar factories with regard
to working capital turnover ratio.
Inference: The calculated F value is greater than F table value. Hence, the null hypothesis (H0)
is rejected and it is concluded that there are significance difference among the three sugar
factories.
Conclusion:
The present study was an attempt to investigate the working capital management
efficiency level of the select sugar factories in chittoor district. The sugar factories facing several
problems like mounting losses, shortage of sugarcane and blockage of working capital. Sugar
industries, for their sustainability, should apply effective cost cutting mechanism, enhance
efficiency and quality at every level of activity and adopt best marketing strategies. In order to
meet the day to day requirements of the Prudential Sugar Corporation Limited and Sudalagunta
Sugars Limited the working capital base should be improved. Working capital is available from
National Co-operative Development Corporation (NCDC) to Indian sugar factories for lesser rate
of interest. For this purpose NCDC may provide funds through External Commercial Borrowings
(ECBs) and the government of India shall give permission and also a counter guarantee
References:
1. Rajesh Kothari, “Financial Management – A Contemporary Approach” SAGE
Publications India Pvt. Ltd, New Delhi, pp.481-482.
2. Rajesh Kothari, “Financial Management – A Contemporary Approach” SAGE
Publications India Pvt. Ltd, New Delhi, pp.485.
3. Dr.R.Gowri (2015), “A Study on Impact of Working Capital Management on Profitability
with Reference to Sugar Companies in Tamil Nadu” IOSR Journal of humanities and social
science (IOSR-JHSS), ISSN :2279-08456, pp. 17-22.
International Journal of Research
Volume VIII, Issue VI, JUNE/2019
ISSN NO:2236-6124
Page No:3610
4. Praveena. S and Mahendran. K. (2013), “Working capital management efficiency of
sugar sector in India”. Agriculture update, Volume 8, issue (3): 425-432.
5. Ramachandran and Gopinathan Radhika, (2012), “Working Capital Management and
Profitability of Sugar Industry in India”, Smart Journal of Business Management, July-
Dec., Vol.8, No.2, 2012, pp.54-55.
International Journal of Research
Volume VIII, Issue VI, JUNE/2019
ISSN NO:2236-6124
Page No:3611