Embed Size (px)
Citation preview
workforce planning2013-17
April 2013Blacksmith working - Ken Turnidge
workforce planning2013-17
April 2013Blacksmith working - Ken Turnidge
P2P2
Workforce Planning ContentsIntroduction and Strategic Context ....................................................................................................................... 3
W1. Workforce Plan ................................................................................................................................................ 4
W1.1 Background and Environmental Factors ........................................................................................................4
W1.2 Integrated Planning and Reporting ................................................................................................................5
W1.3 Impact of the Organisational Cultural Development Program on Workforce Planning ..................................5
W2. Current Workforce Structure and Staff Establishment ................................................................................ 6
W3. Workforce Analysis ......................................................................................................................................... 7
W3.1 Overview ......................................................................................................................................................7
W3.2 Workforce Statistics and Trends ....................................................................................................................7
Gender distribution .......................................................................................................................................................... 7
Age/generation distribution ............................................................................................................................................. 8
Length of service distribution ......................................................................................................................................... 8
Turnover and Recruitment (last 12 months) .................................................................................................................... 9
W3.3 Workforce Diversity and Representation ..................................................................................................... 9
Country of origin ........................................................................................................................................................... 10
Indigenous Persons Profile ........................................................................................................................................... 10
Gender ratio .................................................................................................................................................................. 10
Age distribution ..............................................................................................................................................................11
Occupation Breakdown .................................................................................................................................................11
W4. Employment costs ....................................................................................................................................... 12
W4.1 Current four year Delivery Plan Salaries and Wages budgets .....................................................................12
W4.2 Other Employee Costs ............................................................................................................................... 12
W4.3 Superannuation .......................................................................................................................................... 13
W4.4 Workers Compensation ............................................................................................................................. 13
W4.5 Learning and Development ........................................................................................................................ 13
W4.6 Employee Leave Entitlements Liability ...................................................................................................... 14
W5. Workforce Needs 2013-17 ............................................................................................................................ 14
W5.1 General Workforce Trends 2013-17 ............................................................................................................ 15
Globalisation .................................................................................................................................................................. 15
Technological Advancement .......................................................................................................................................... 15
Diversity in all its forms ................................................................................................................................................. 15
Emergence of the orange collar workforce ................................................................................................................... 16
W5.2 Current Delivery Program needs ............................................................................................................... 16
Asset Management Framework .................................................................................................................................... 16
Major projects ............................................................................................................................................................... 16
Service delivery ............................................................................................................................................................. 17
W6. Workforce Planning Summary and Key Challenges .................................................................................. 18
SECTIONABOUT THE RESOURCING STRATEGY
HORNSBY SHIRE COUNCIL RESOURCING STRATEGY 2013
P3SECTIONWORKFORCE PLANNING 2013-17
HORNSBY SHIRE COUNCIL RESOURCING STRATEGY 2013
P3
Introduction and Strategic ContextAs required by the Integrated Planning and Reporting Framework, Hornsby Shire Council (HSC) has developed a Resourcing Strategy (Workforce Planning, Asset Management Framework and Long Term Financial Plan) to meet the needs of the four year Delivery Program. This document details the various elements of Workforce Planning and where appropriate, demonstrates its relationships to both former and proposed workforce/HR strategic plans and actions.
The elements of this Plan include:
� influential environmental factors
� an analysis of the current and former workforce statistics
� consideration of the current and future organisational structures
� workforce diversity and community representation
� workforce turnover and movement
� consideration of employment costs
� determination of Delivery Program needs
� consideration of general workforce trends.
Key inputs into this Plan are HSC’s:
� EEO Management Plan
� Human Resources Strategic Plan 2008-12
� Asset Management Framework
� Long Term Financial Plan.
In particular, the Long Term Financial Plan is linked with Workforce Planning to ensure the availability of human, material and capital resources in order to plan and implement the actions needed to achieve the outcomes within the Community Strategic Plan. This is accomplished by developing staff who, through their leadership and competency, will demonstrate best practice in all areas.
P4P4
W1. Workforce PlanW1.1 Background and Environmental FactorsWorkforce Planning 2013-17 has been prepared for the whole organisation using a consultative process that began in 2008 with the implementation of the Human Resources Strategic Plan 2008-12.
In 2008, a workforce profile was completed for the organisation. This profile assessed Council’s current workforce capacity, identified risks and detailed a plan to ensure human resources were available and competent to meet the ongoing Community Strategic Plan outcomes.
A strategic plan for human resources was developed. This strategic and action plan ‘Managing our people needs and the needs of our people into a sustainable future” was adopted by Council on 12 November 2008.
The strategic plan supported long term workforce strength with annual actions surrounding the identified key themes:
� Leadership
� Employee relations
� Employee competency and performance
� Employee health and wellbeing
� Employee attraction and retention
� Workforce forecasting
� Human resource support and services.
Since this period, achievements from the Human Resources Strategic Plan 2008-12 have been reviewed annually through the Council’s corporate reporting program and adjusted to meet changing needs.
Not only has the development of this Workforce Plan been influenced by past plans, it is also influenced by current actions, future plans and broader environmental factors. The current NSW Government for instance, has commenced a process of industry and community dialogue through the Destination 2036 initiative. This process may well see overarching change in the structure and nature of local government in our region, however, for the purposes of this Plan, it will be assumed that current structures and arrangements will continue.
The Australian economy also seems to be performing reasonably well in an otherwise shaky world economy, with unemployment hovering just over 5%, albeit influenced by a declining participation rate. The employment market is relatively resilient, but is impacted by a degree of uncertainty due to global market conditions. There is a significant concern about job security in the overall labour market over the next 12 months, but this is tempered by many believing that job opportunities within their sector will stabilise during the same period (source: Michael Page Employee Intentions Report 2013). Just how this plays out in the NSW local government sector is difficult to predict, but it will be necessary to effectively manage existing talent as well as make the sector attractive to newcomers.
2011 and 2012 also saw many governance changes at HSC with a new General Manager commencing in October 2011 and a new Council elected in September 2012. Internal and External Reviews were also undertaken during this period, culminating in an organisational restructure in June 2012 that saw a reduction in around 60 staff establishment positions. Moving on from the introduction of the new organisation structure, the new General Manager has also instigated an Organisational Cultural Development Program that is expected to heavily influence this Plan as it develops further in mid 2013 and beyond.
The newly elected Council saw six out of 10 new Councillors, including a change in the popularly elected Mayor. Council is expected to strengthen its strategic position during the remainder of its term and its decisions may influence this Plan into the future.
SECTIONABOUT THE RESOURCING STRATEGY
HORNSBY SHIRE COUNCIL RESOURCING STRATEGY 2013
P5SECTIONWORKFORCE PLANNING 2013-17
HORNSBY SHIRE COUNCIL RESOURCING STRATEGY 2013
P5
W1. Workforce PlanW1.2 Integrated Planning and ReportingWorkforce Planning is one part of the overarching Resourcing Strategy that includes the Asset Management Framework and Long Term Financial Plan. The goal of the three interlinked resourcing plans is to support the organisation by ensuring resources are available to achieve outcomes in the Community Strategic Plan and four year Delivery Program.
Council’s Community Strategic Plan, first published in 2010, is a strategic document that reflects the community’s priorities and aspirations. The community plan guides and coordinates the Council’s activities over a 10 year period.
The latest Community Strategic Plan - Your Community Plan 2013-2023 - is based on four broad inter-related themes encapsulating the community’s Vision:
� my environment
� my community
� my lifestyle
� my council.
The ‘my council’ theme has a goal of “Accountable corporate management” to make Council's role more explicit in ensuring a well governed and sustainable organisation that is well positioned to deliver the commitments outlined in the Your Community Plan.
Your Community Plan 2013-2023 aligns with Council's 2013-17 Delivery Program.
W1.3 Impact of the Organisational Cultural Development Program on Workforce Planning
In November 2012, HSC began a program of cultural development for the organisation utilising the Human Synergistics Model and a qualified external consultant. Commencing with the broader leadership group and an initial 360 degree feedback process in late 2012/early 2013, the program will measure the organisation’s culture through a number of staff surveys, debrief sessions and facilitated workshops in mid 2013.
It is expected that in mid to late 2013, following the program’s diagnostic phase, an Action Plan will be developed to provide a road map for the organisation to move towards a desired culture. This plan will entail a range of intervention projects and initiatives and will become the framework for a new Human Resources Strategic Plan for the 2013 to 2017 period.
This current Workforce Planning 2013-17 is not expected to be impacted by the above program. For all intents and purposes, 2013 will be a year of diagnosis and development as HSC transitions from the influences of the 2008-12 Human Resources Strategic Plan to a new 2013-17 plan. Development of future workforce plans may also be impacted by the strategic decisions of the elected Council as these develop in 2013 and beyond.
P6P6
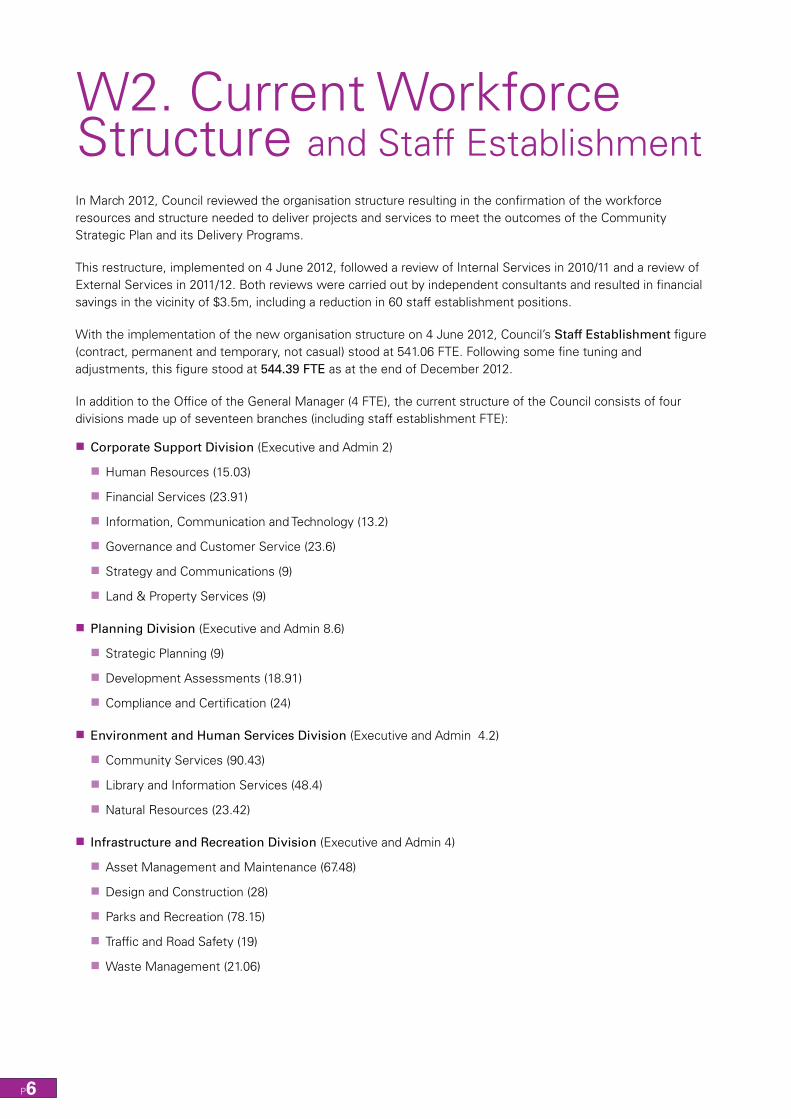
W2. Current Workforce Structure and Staff EstablishmentIn March 2012, Council reviewed the organisation structure resulting in the confirmation of the workforce resources and structure needed to deliver projects and services to meet the outcomes of the Community Strategic Plan and its Delivery Programs.
This restructure, implemented on 4 June 2012, followed a review of Internal Services in 2010/11 and a review of External Services in 2011/12. Both reviews were carried out by independent consultants and resulted in financial savings in the vicinity of $3.5m, including a reduction in 60 staff establishment positions.
With the implementation of the new organisation structure on 4 June 2012, Council’s Staff Establishment figure (contract, permanent and temporary, not casual) stood at 541.06 FTE. Following some fine tuning and adjustments, this figure stood at 544.39 FTE as at the end of December 2012.
In addition to the Office of the General Manager (4 FTE), the current structure of the Council consists of four divisions made up of seventeen branches (including staff establishment FTE):
� Corporate Support Division (Executive and Admin 2)
� Human Resources (15.03)
� Financial Services (23.91)
� Information, Communication and Technology (13.2)
� Governance and Customer Service (23.6)
� Strategy and Communications (9)
� Land & Property Services (9)
� Planning Division (Executive and Admin 8.6)
� Strategic Planning (9)
� Development Assessments (18.91)
� Compliance and Certification (24)
� Environment and Human Services Division (Executive and Admin 4.2)
� Community Services (90.43)
� Library and Information Services (48.4)
� Natural Resources (23.42)
� Infrastructure and Recreation Division (Executive and Admin 4)
� Asset Management and Maintenance (67.48)
� Design and Construction (28)
� Parks and Recreation (78.15)
� Traffic and Road Safety (19)
� Waste Management (21.06)
SECTIONABOUT THE RESOURCING STRATEGY
HORNSBY SHIRE COUNCIL RESOURCING STRATEGY 2013
P7SECTIONWORKFORCE PLANNING 2013-17
HORNSBY SHIRE COUNCIL RESOURCING STRATEGY 2013
P7
W3. Workforce AnalysisW3.1 OverviewFollowing an organisational wide Employee Opinion Survey (EOS) in late 2007, workforce profiles were completed for the organisation in 2008 and again in 2010 and 2012. The EOS and 2008 profile assessed the council’s then current workforce capacity, identified risks and detailed a plan to ensure human resources were available and competent to meet the ongoing Community Strategic Plan outcomes.
Together with this profile, an analysis of the organisational performance regarding projects and services of the then Management Plan Key Measures and Targets was completed. The 2008-12 Human Resources Strategic Plan was developed using this data. This strategic and action plan with the theme, ‘Managing our people needs and the needs of our people into a sustainable future’, was adopted by the Council on 12 November 2008.
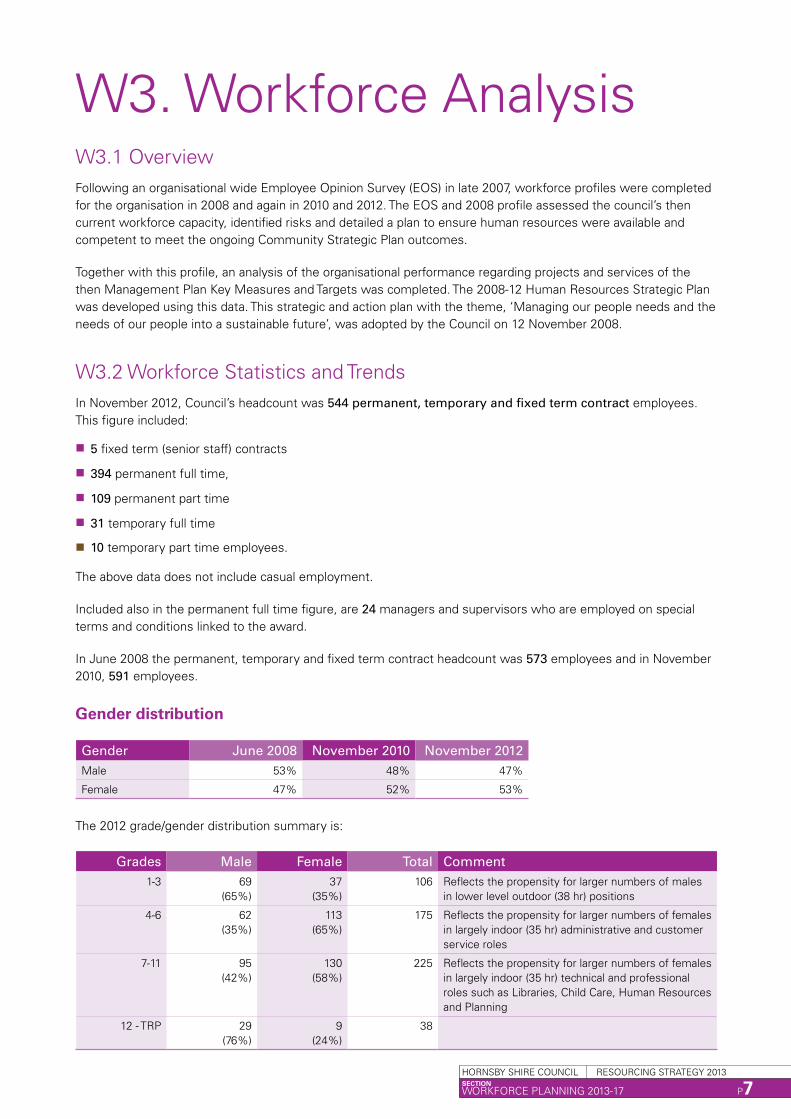
W3.2 Workforce Statistics and TrendsIn November 2012, Council’s headcount was 544 permanent, temporary and fixed term contract employees. This figure included:
� 5 fixed term (senior staff) contracts
� 394 permanent full time,
� 109 permanent part time
� 31 temporary full time
� 10 temporary part time employees.
The above data does not include casual employment.
Included also in the permanent full time figure, are 24 managers and supervisors who are employed on special terms and conditions linked to the award.
In June 2008 the permanent, temporary and fixed term contract headcount was 573 employees and in November 2010, 591 employees.
Gender distribution
Gender June 2008 November 2010 November 2012Male 53% 48% 47%
Female 47% 52% 53%
The 2012 grade/gender distribution summary is:
Grades Male Female Total Comment1-3 69
(65%)37
(35%)106 Reflects the propensity for larger numbers of males
in lower level outdoor (38 hr) positions
4-6 62 (35%)
113 (65%)
175 Reflects the propensity for larger numbers of females in largely indoor (35 hr) administrative and customer service roles
7-11 95 (42%)
130 (58%)
225 Reflects the propensity for larger numbers of females in largely indoor (35 hr) technical and professional roles such as Libraries, Child Care, Human Resources and Planning
12 - TRP 29 (76%)
9 (24%)
38
P8P8
Whilst the overall staff gender distribution has trended downwards for males and upwards for females over the last four years, the representation of females in senior officer and management roles remains low. Council’s EEO Management Plan recognises this and advocates the training and support of women in supervisory and management skills in order to provide upward career and retention paths.
The larger numbers of females in professional levels has also seen an anecdotal increase in employees proceeding on Parental/Maternity Leave. This has implications both when staff proceed on leave (up to 2 years) as well as when they return to work. Family friendly flexible work provisions contained in both the Award and in Council’s policies mean that most return on part-time arrangements, which can raise serious challenges for areas such as Planning and Children’s Services striving to meet both legislative requirements and business needs.
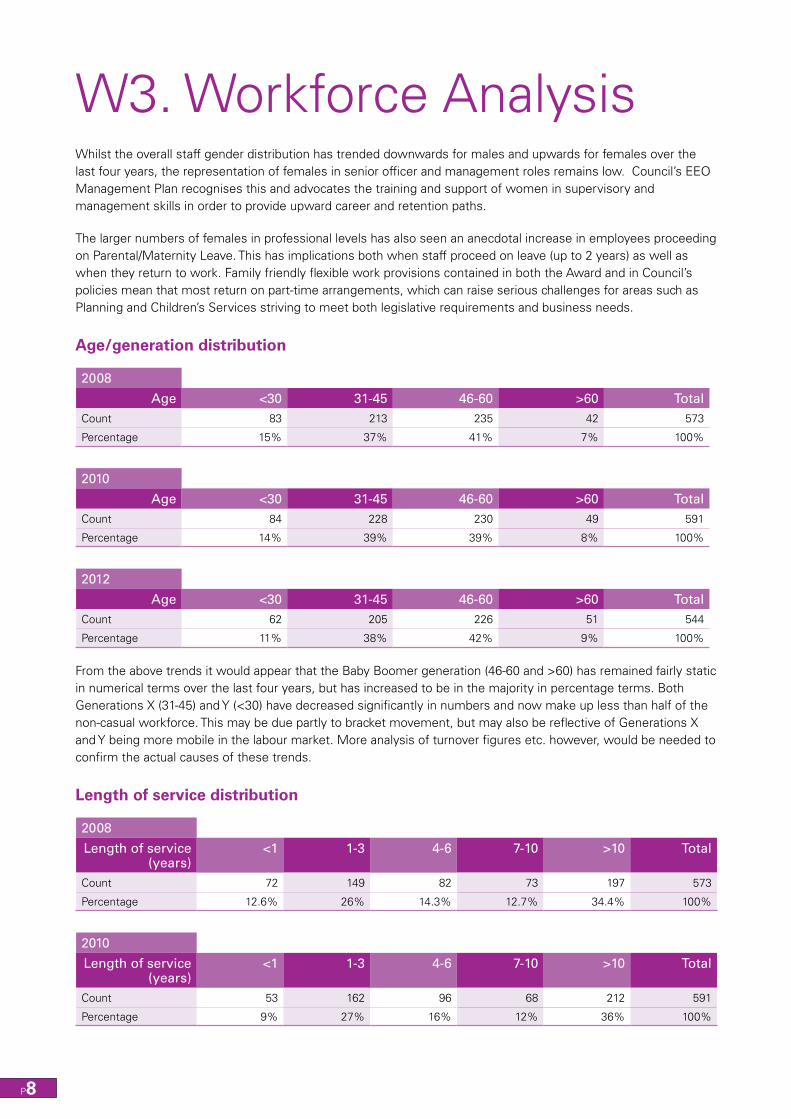
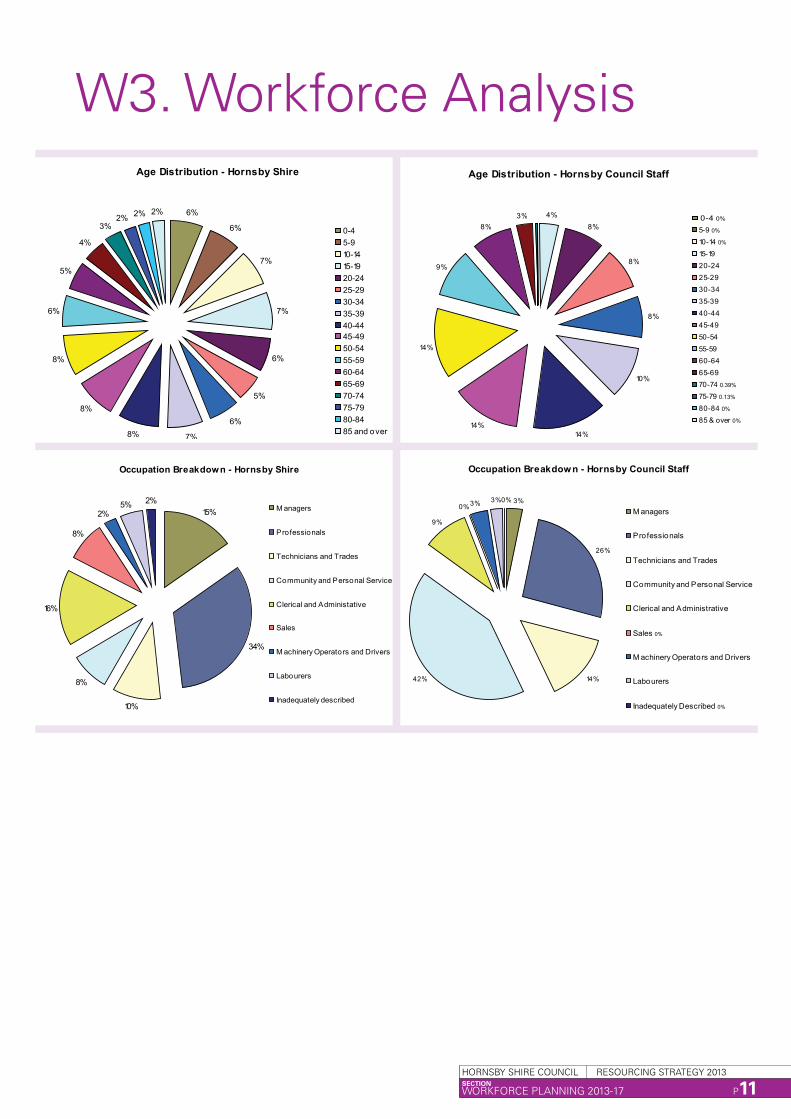
Age/generation distribution
2008
Age <30 31-45 46-60 >60 TotalCount 83 213 235 42 573
Percentage 15% 37% 41% 7% 100%
2010
Age <30 31-45 46-60 >60 TotalCount 84 228 230 49 591
Percentage 14% 39% 39% 8% 100%
2012
Age <30 31-45 46-60 >60 TotalCount 62 205 226 51 544
Percentage 11% 38% 42% 9% 100%
From the above trends it would appear that the Baby Boomer generation (46-60 and >60) has remained fairly static in numerical terms over the last four years, but has increased to be in the majority in percentage terms. Both Generations X (31-45) and Y (<30) have decreased significantly in numbers and now make up less than half of the non-casual workforce. This may be due partly to bracket movement, but may also be reflective of Generations X and Y being more mobile in the labour market. More analysis of turnover figures etc. however, would be needed to confirm the actual causes of these trends.
Length of service distribution
2008
Length of service (years)
<1 1-3 4-6 7-10 >10 Total
Count 72 149 82 73 197 573
Percentage 12.6% 26% 14.3% 12.7% 34.4% 100%
2010
Length of service (years)
<1 1-3 4-6 7-10 >10 Total
Count 53 162 96 68 212 591
Percentage 9% 27% 16% 12% 36% 100%
W3. Workforce Analysis
SECTIONABOUT THE RESOURCING STRATEGY
HORNSBY SHIRE COUNCIL RESOURCING STRATEGY 2013
P9SECTIONWORKFORCE PLANNING 2013-17
HORNSBY SHIRE COUNCIL RESOURCING STRATEGY 2013
P9
2012
Length of service (years)
<1 1-3 4-6 7-10 >10 Total
Count 42 85 117 103 197 544
Percentage 8% 16% 21% 19% 36% 100%
The interesting trend in these figures is that short term (i.e. < 3 years) staff numbers have fallen from 39% in 2008 to 24% at the end of 2012, indicating that staff are staying longer with Council. Long term (>10 years) staff numbers are however stable in percentage terms, but medium term staff (4-10 years) have increased significantly. The impact of the Global Financial Crisis, which reduced turnover significantly, is the most likely cause of this shift.
Turnover and Recruitment (last 12 months)
Over the 2012 year there were 52 employee initiated terminations, giving a 9.4% turnover rate (down from 11% in 2010. Of these 52, only 10 indicated that they were moving to another council and 7 indicated they were retiring from the workforce.
In the last 12 months Council actively recruited to fill 98 permanent and temporary appointments. Of the 98 appointments:
� 65% (64 people) were recruited from positions external to Council
� 35% (34 people) were recruited from within Council.
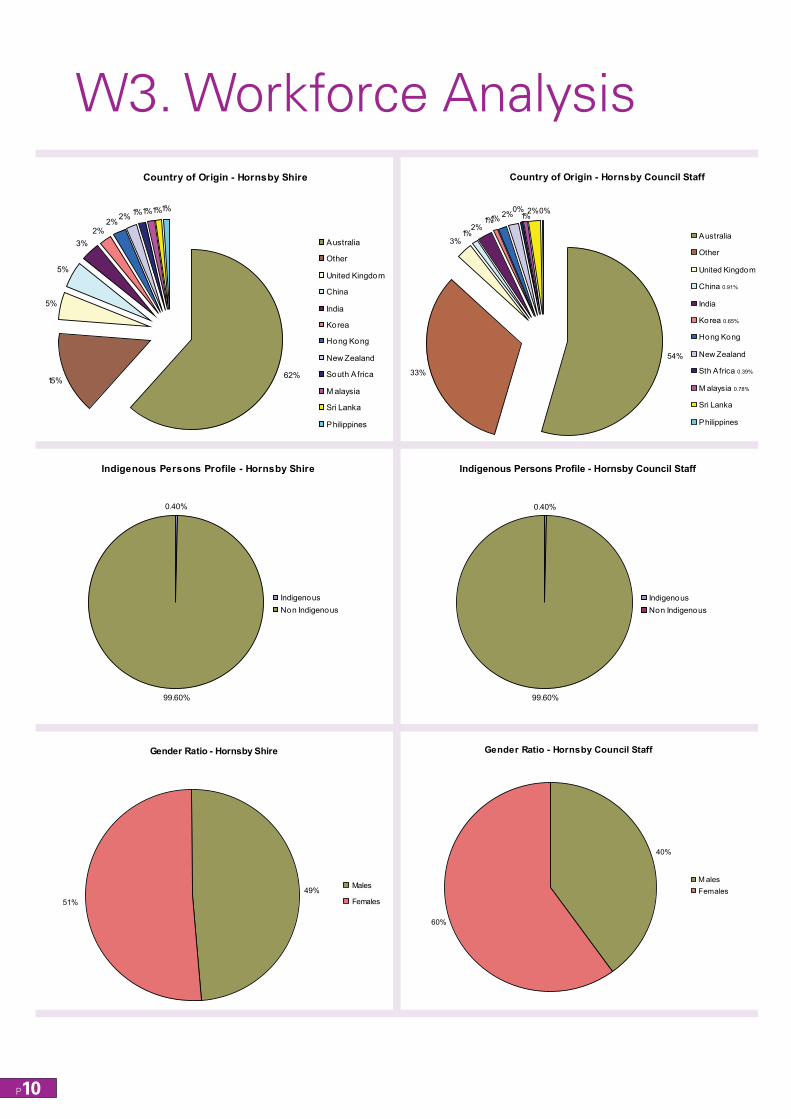
W3.3 Workforce Diversity and RepresentationCouncil employs a very diverse workforce and practises being a responsible Equal Employment Opportunity (EEO) employer. As required by the Local Government Act 1993, Council has an EEO Management Plan which is reviewed annually for the General Manager by an EEO Advisory Committee comprised of an EEO Coordinator (from HR Branch), an executive management representative, and several staff representatives from across the organisation.
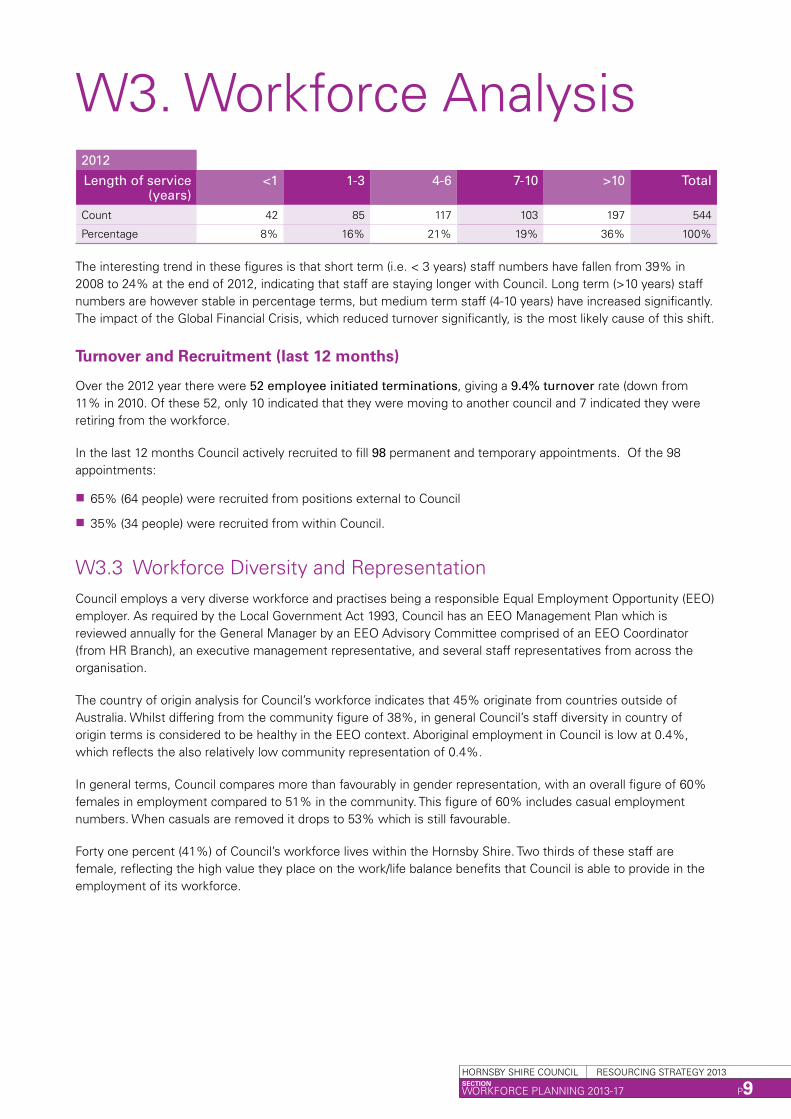
The country of origin analysis for Council’s workforce indicates that 45% originate from countries outside of Australia. Whilst differing from the community figure of 38%, in general Council’s staff diversity in country of origin terms is considered to be healthy in the EEO context. Aboriginal employment in Council is low at 0.4%, which reflects the also relatively low community representation of 0.4%.
In general terms, Council compares more than favourably in gender representation, with an overall figure of 60% females in employment compared to 51% in the community. This figure of 60% includes casual employment numbers. When casuals are removed it drops to 53% which is still favourable.
Forty one percent (41%) of Council’s workforce lives within the Hornsby Shire. Two thirds of these staff are female, reflecting the high value they place on the work/life balance benefits that Council is able to provide in the employment of its workforce.
W3. Workforce Analysis
P10P10
W3. Workforce AnalysisCountry of Origin - Hornsby Shire
62%15%
5%
5%
3%2%
2%2% 1%1%1%1%
Australia
Other
United Kingdom
China
India
Korea
Hong Kong
New Zealand
South Africa
M alaysia
Sri Lanka
Philippines
Country of Origin - Hornsby Council Staff
54%
33%
3%1%
2%1%1% 2%0%
1%2%0%
Australia
Other
United Kingdom
China 0.91%
India
Korea 0.65%
Hong Kong
New Zealand
Sth Africa 0.39%
M alaysia 0.78%
Sri Lanka
Philippines
Indigenous Persons Profile - Hornsby Shire
0.40%
99.60%
Indigenous Non Indigenous
0.40%
99.60%
Indigenous Non Indigenous
Indigenous Persons Profile - Hornsby Council Staff
Gender Ratio - Hornsby Shire
49%51%
Males
Females
Gender Ratio - Hornsby Council Staff
40%
60%
M alesFemales
SECTIONABOUT THE RESOURCING STRATEGY
HORNSBY SHIRE COUNCIL RESOURCING STRATEGY 2013
P11SECTIONWORKFORCE PLANNING 2013-17
HORNSBY SHIRE COUNCIL RESOURCING STRATEGY 2013
P11
W3. Workforce AnalysisAge Distribution - Hornsby Shire
6%
6%
7%
7%
6%
5%
6%
7%8%
8%
8%
6%
5%
4%
3%2% 2% 2%
0-45-910-1415-1920-2425-2930-3435-3940-4445-4950-5455-5960-6465-6970-7475-7980-8485 and over
Age Distribution - Hornsby Council Staff
4%8%
8%
8%
10%
14%14%
14%
9%
8%3% 0-4 0%
5-9 0%
10-14 0%
15-1920-2425-2930-3435-3940-4445-4950-5455-5960-6465-6970-74 0.39%
75-79 0.13%
80-84 0%
85 & over 0%
Occupation Breakdown - Hornsby Shire
15%
34%
10%
8%
16%
8%
2%5% 2%
M anagers
Professionals
Technicians and Trades
Community and Personal Service
Clerical and Administative
Sales
M achinery Operators and Drivers
Labourers
Inadequately described
Occupation Breakdown - Hornsby Council Staff
3%
26%
14%42%
9%
0%3% 3%0%
M anagers
Professionals
Technicians and Trades
Community and Personal Service
Clerical and Administrative
Sales 0%
M achinery Operators and Drivers
Labourers
Inadequately Described 0%
P12P12
W4. Employment costsWorkforce Planning integrates with the Long Term Financial Plan (LTFP) ensuring funds are available to employ adequate human resources throughout the four year Delivery Program.
Employment costs also rely on data from the Asset Management Framework and the Delivery Program. The LTFP uses this information together with Workforce Planning to forecast planned increases in employment costs that include annual award increases.
Increases in employee salary and wages costs consist of two components – the award increases and movements within the grading system as part of the annual performance review process.
Employee costs include salaries, wages, superannuation, leave entitlements, training, workers compensation premiums and other employee related expenses.
Employee costs over the period of the Plan have had applied the index advised by the NSW Treasury (T-Corp) in their recent analysis of Council’s finances.
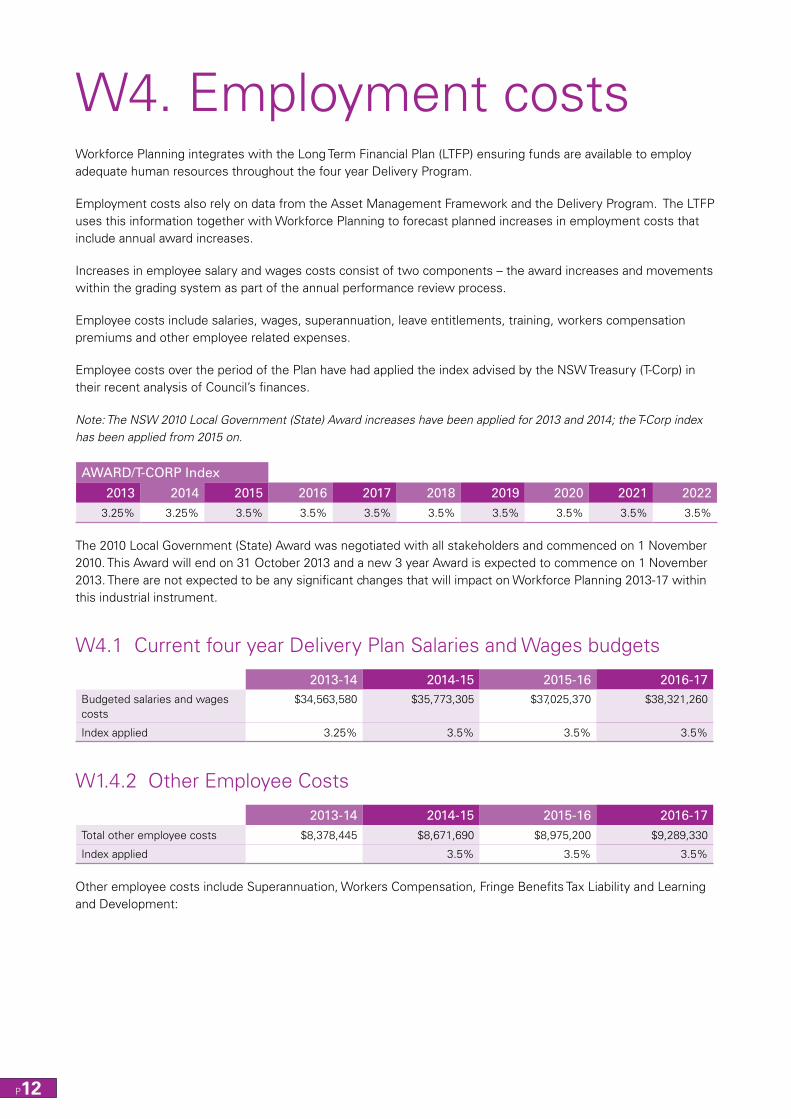
Note: The NSW 2010 Local Government (State) Award increases have been applied for 2013 and 2014; the T-Corp index has been applied from 2015 on.
AWARD/T-CORP Index
2013 2014 2015 2016 2017 2018 2019 2020 2021 20223.25% 3.25% 3.5% 3.5% 3.5% 3.5% 3.5% 3.5% 3.5% 3.5%
The 2010 Local Government (State) Award was negotiated with all stakeholders and commenced on 1 November 2010. This Award will end on 31 October 2013 and a new 3 year Award is expected to commence on 1 November 2013. There are not expected to be any significant changes that will impact on Workforce Planning 2013-17 within this industrial instrument.
W4.1 Current four year Delivery Plan Salaries and Wages budgets
2013-14 2014-15 2015-16 2016-17Budgeted salaries and wages costs
$34,563,580 $35,773,305 $37,025,370 $38,321,260
Index applied 3.25% 3.5% 3.5% 3.5%
W1.4.2 Other Employee Costs
2013-14 2014-15 2015-16 2016-17Total other employee costs $8,378,445 $8,671,690 $8,975,200 $9,289,330
Index applied 3.5% 3.5% 3.5%
Other employee costs include Superannuation, Workers Compensation, Fringe Benefits Tax Liability and Learning and Development:
SECTIONABOUT THE RESOURCING STRATEGY
HORNSBY SHIRE COUNCIL RESOURCING STRATEGY 2013
P13SECTIONWORKFORCE PLANNING 2013-17
HORNSBY SHIRE COUNCIL RESOURCING STRATEGY 2013
P13
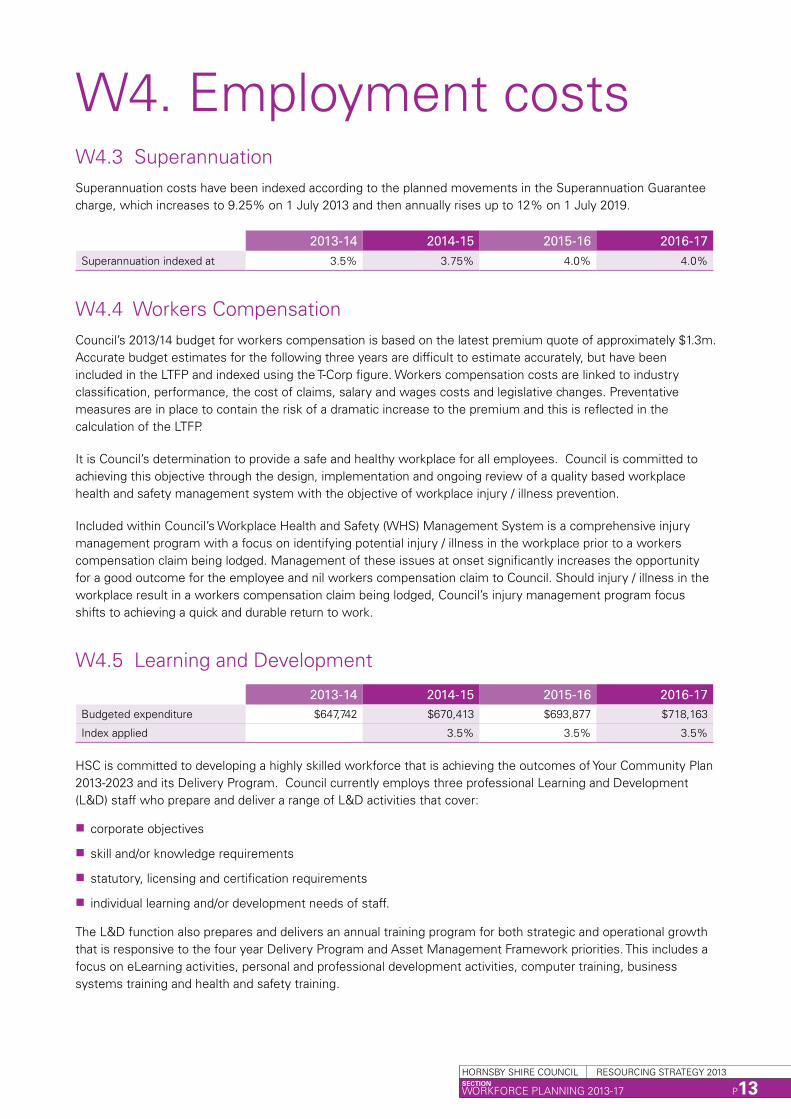
W4.3 SuperannuationSuperannuation costs have been indexed according to the planned movements in the Superannuation Guarantee charge, which increases to 9.25% on 1 July 2013 and then annually rises up to 12% on 1 July 2019.
2013-14 2014-15 2015-16 2016-17Superannuation indexed at 3.5% 3.75% 4.0% 4.0%
W4.4 Workers CompensationCouncil’s 2013/14 budget for workers compensation is based on the latest premium quote of approximately $1.3m. Accurate budget estimates for the following three years are difficult to estimate accurately, but have been included in the LTFP and indexed using the T-Corp figure. Workers compensation costs are linked to industry classification, performance, the cost of claims, salary and wages costs and legislative changes. Preventative measures are in place to contain the risk of a dramatic increase to the premium and this is reflected in the calculation of the LTFP.
It is Council’s determination to provide a safe and healthy workplace for all employees. Council is committed to achieving this objective through the design, implementation and ongoing review of a quality based workplace health and safety management system with the objective of workplace injury / illness prevention.
Included within Council’s Workplace Health and Safety (WHS) Management System is a comprehensive injury management program with a focus on identifying potential injury / illness in the workplace prior to a workers compensation claim being lodged. Management of these issues at onset significantly increases the opportunity for a good outcome for the employee and nil workers compensation claim to Council. Should injury / illness in the workplace result in a workers compensation claim being lodged, Council’s injury management program focus shifts to achieving a quick and durable return to work.
W4.5 Learning and Development
2013-14 2014-15 2015-16 2016-17Budgeted expenditure $647,742 $670,413 $693,877 $718,163
Index applied 3.5% 3.5% 3.5%
HSC is committed to developing a highly skilled workforce that is achieving the outcomes of Your Community Plan 2013-2023 and its Delivery Program. Council currently employs three professional Learning and Development (L&D) staff who prepare and deliver a range of L&D activities that cover:
� corporate objectives
� skill and/or knowledge requirements
� statutory, licensing and certification requirements
� individual learning and/or development needs of staff.
The L&D function also prepares and delivers an annual training program for both strategic and operational growth that is responsive to the four year Delivery Program and Asset Management Framework priorities. This includes a focus on eLearning activities, personal and professional development activities, computer training, business systems training and health and safety training.
W4. Employment costs
P14P14
W4. Employment costsW4.6 Employee Leave Entitlements Liability
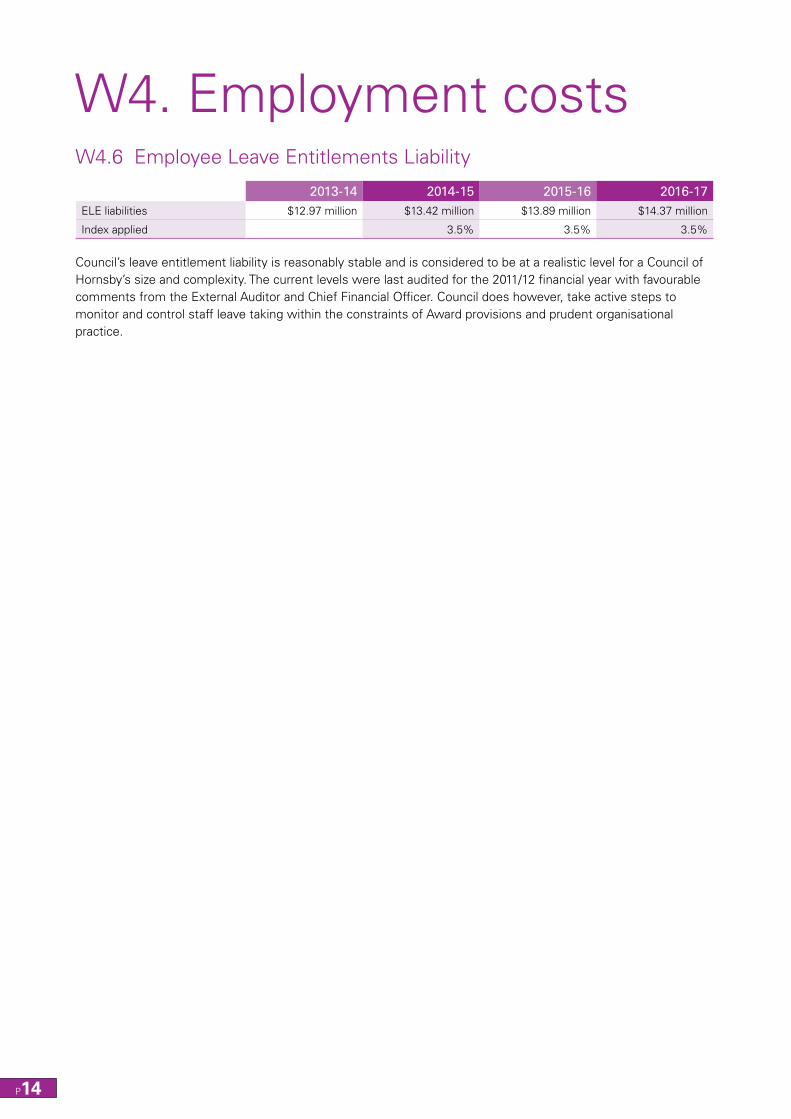
2013-14 2014-15 2015-16 2016-17ELE liabilities $12.97 million $13.42 million $13.89 million $14.37 million
Index applied 3.5% 3.5% 3.5%
Council’s leave entitlement liability is reasonably stable and is considered to be at a realistic level for a Council of Hornsby’s size and complexity. The current levels were last audited for the 2011/12 financial year with favourable comments from the External Auditor and Chief Financial Officer. Council does however, take active steps to monitor and control staff leave taking within the constraints of Award provisions and prudent organisational practice.
SECTIONABOUT THE RESOURCING STRATEGY
HORNSBY SHIRE COUNCIL RESOURCING STRATEGY 2013
P15SECTIONWORKFORCE PLANNING 2013-17
HORNSBY SHIRE COUNCIL RESOURCING STRATEGY 2013
P15
W5. Workforce needs W5.1 General Workforce Trends 2013-17What will be the characteristics of the HSC workforce over the next four years? How might it be different to how we have worked over the last four years and what can we do to manage those differences?
To help answer those questions and explore some general trends in the workforce, the 2012 Hays white paper “Tomorrow’s Workforce - leverage emerging trends to future proof your workforce”, provides some insights. The paper presents a view that there are four major issues that will impact on workforces between now and 2030. These issues are: Globalisation; Technological Advancement; Diversity in all its forms; and the emergence of the “Orange collar” worker. This latter term “orange collar” refers to the broader workforce involved in Australia’s mining and resource boom.
Globalisation
Research by PricewaterhouseCoopers has shown that the number of people working outside their home country will increase by 50% between 2010 and 2020. Whilst multi national companies have an advantage in managing a global workforce, domestic organisations like local councils can still develop strategies to leverage off this increase in global mobility. Competition for skilled professionals will be strong, especially in the developed world and we are already seeing an increase in skilled migrant visas. The challenge however, will be in maintaining a balance, with many skilled Australian professionals also being attracted to overseas opportunities.
Technological Advancement
A significant challenge for managing tomorrow’s workforce will be in finding ways to integrate technological advancements in areas such as talent attraction, recruitment and employee engagement. The proliferation of social media tools such as Facebook, LinkedIn and Twitter has exploded and their use in work settings is expected to increasingly become an expectation within many sectors of the future workforce.
Technology will be used increasingly in future recruitment process, not only with the use of social media, but with the use of automated recruitment software, Skype/video conferencing technology in interviews, and background checking using tools such as LinkedIn. The practice of Teleworking will become more commonplace and the use of mobile devices such as smartphones and tablets will be the norm. These changes are already starting to occur and have already started to blur the work/life relationship for some parts of the workforce.
Diversity in all its forms
Over the next four years Generation Z (born 1996 to 2011) will start to enter the workforce, whilst many Baby Boomers (born 1946 to 1964) will extend their working life, often moving to part-time or mentoring type roles. This will mean organisations will have to manage all four generations and their various specific characteristics. Generation Z have had lifelong exposure to the internet, can multitask and will find traditional methods of communications such as telephone or face to face much more challenging. When coupled with Generation Y (born 1982 to 1995), who have similar characteristics, they will continue to present some significant challenges for both Baby Boomer and Generation X managers and supervisors.
Whilst accommodating younger generations will be important, so too will be managing the ageing of the workforce. Extending the work life of mature-age workers in physical jobs for example, will present a different set of issues to that of those in non-physical roles. Skills and knowledge transfer as Baby Boomers eventually leave or reduce their time in the workforce will also be paramount.
It is also expected that Gender diversity will continue to be a key issue in many sectors. Increasing the numbers of women in some sectors may be seen as being an opportunity to overcome skills shortages and the issue of quotas to combat lower management representation is expected to be relevant, but perhaps still controversial.
P16P16
Emergence of the Orange Collar workforce
The impact of the “orange collar” worker on the workforce cannot be underestimated. They possess highly technical and specialist skills and are often attracted from other sectors by high salaries. The lifestyle is not for everyone, but many sectors are expected to feel the skills drain, especially if the mining boom gathers more momentum over the next few years. The mining industry will no doubt continue to seek to operate in the global marketplace for its workforce, but will still have a significant impact locally for some time to come.
W5.2 Current Delivery Program needsThe primary purpose of Workforce Planning 2013-17 is to meet the needs of the four year Delivery Program projects and actions. The details of the services, projects and outcomes contained in the Delivery Program will also inform Workforce Planning and determine Council’s human resource needs over the next four years.
While the actions in the current Human Resources Strategic Plan 2008-12 and the proposed 2013-17 Plan will provide for ongoing sustainability, the Workforce Plan is flexible and responsive to meet the needs of current and future Council four year Delivery Programs.
Asset Management Framework
Council’s Asset Management Framework will impact on the current Delivery Program in respect of its infrastructure assets, including road pavements, parks and reserves, footpaths, buildings, kerb and gutter and drainage. The Asset Management Framework lists the assets we manage, how they are managed over their life and the required funding to provide the set levels of service for the assets.
The Asset Management Framework and supporting plans are developed, maintained and implemented by several Branches within the Infrastructure and Recreation Division. For new work or renewal, the detailed design is undertaken both in-house and by consultants. Council has a tendered panel of professional consultancies that provides expertise and the flexibility to increase or decrease resourcing for design work. The external consultancy resources are factored in the pricing of works in the Asset Management Framework. This is factored into resourcing needs in Workforce Planning.
The renewal or maintenance of infrastructure works is undertaken by both day labour and contractors. When undertaken by contractors, this work is primarily carried out within a schedule of rates tender. Contractors are supervised by Council Project Managers. This structure allows flexibility in staffing levels to cater for the varying workloads throughout the year and from year to year. Special projects of significant scope and nature are tendered separately. The cost for these projects is factored into the project costs.
Existing staffing levels will continue to carry out the planning and supervision responsibilities required when implementing the Asset Management Framework and four year Delivery Program.
Major Projects
Over the next four years Council’s Delivery Program includes several major projects and/or initiatives that may impact on general workforce needs:
Hornsby Aquatic Centre
This major project is currently under construction by external contract and is due for completion in early 2014. Council will be conducting a competitive tender process for the management of the rebuilt facility, as well as its existing aquatic facilities at Galston and Epping which are currently managed by Council. An internal Council team will be submitting a tender. Currently there are 4 permanent and 1 temporary supervisory and operational staff
W5. Workforce needs
SECTIONABOUT THE RESOURCING STRATEGY
HORNSBY SHIRE COUNCIL RESOURCING STRATEGY 2013
P17SECTIONWORKFORCE PLANNING 2013-17
HORNSBY SHIRE COUNCIL RESOURCING STRATEGY 2013
P17
employed to manage the Aquatic Centres together with a fluctuating number of casual staff employed seasonally. Staff numbers will be affected dependent on the outcome of the tender process.
Storey Park Community Centre and Childcare Centre
This project is expected to commence in 2016/17 and is not expected to require additional staffing. Childcare staff from the existing Hornsby and Asquith centres will be redeployed following the rationalisation of four centres down to three.
Hornsby Station Footbridge
Construction of this project is expected to be undertaken by contract with supervision by existing Council staff. No impact on staff levels is expected.
Service Delivery
In addition to asset/infrastructure management, the Delivery Program also overviews the remaining services that Council will provide to the community over the next four years. External services are delivered by the Planning, Environment & Human Services and Infrastructure & Recreation Divisions, all of which are supported by the internal services supplied by the Corporate Support Division.
Workforce levels in all four Divisions have undergone rigorous external scrutiny over 2011 and 2012. The Internal and External Service Reviews, along with a major organisation restructure in mid 2012, have seen an overall reduction in 60 staff establishment positions and an improvement in the structural efficiency of Council’s organisation. Several improvement and cost efficiency initiatives are also planned over the ensuing medium and long term.
The Planning Division will also have a number of external factors that may impact on their staffing levels over the next four years. The NSW Government released and exhibited a White Paper on the Planning System in NSW in mid 2013. This Paper may have an effect on workforce requirements in the medium to longer term. Likewise, recent legislative changes to the Swimming Pools Act will take effect in late 2013 and, depending on the implementation strategies Council adopts, will impact on the number of compliance officers (e.g. Building Surveyors) required in the short to medium term.
With the exception of possible staffing needs for Council’s Aquatic facilities, the Planning issues outlined above, and fixed term Grant funded roles, the HSC workforce requirement (staff establishment) to meet the 2013-17 Delivery Program, is expected to remain stable over the next four years. Minor increases in workforce needs will be met as required through the engagement of temporary staff, agency hire or contractors. Control measures have also been implemented to ensure staff establishment levels and/or changes have adequate approvals through the Divisional Heads, General Manager and the Manager, Human Resources.
W5. Workforce needs
P18P18
W6. Key ChallengesWorkforce Planning Summary and Key ChallengesCouncil’s overall workforce needs across the 2013-17 period are expected to be relatively stable, with notable exceptions being the possible staffing requirements for Council’s Aquatic Centres and the extra staff needed to resource compliance with the amended Swimming Pools Act. Two Service Reviews across 2011 and 2012, along with a new organisational structure in 2012, have contributed to Council more effectively rightsizing the workforce and aligning the key elements of services, capital, structure and staffing.
Of concern however, is the trending towards an older workforce and a tendency for staff to stay longer. Whilst turnover has come down to healthy levels of around 10%, and retention of good staff is valued, Council still needs to develop a capacity to manage its good talent more effectively. In some parts of Council’s workforce, key staff are over 60 and some may retire or seek to reduce their work hours within the next four years. Development of a Talent Management Model, encompassing elements such as succession planning, secondments and mentoring, is planned for implementation within the timeframe of this Plan.
Council’s EEO strategies are generally sound, with employee diversity being reasonably in step with the community. A significant number of the workforce (41%) live within the Hornsby Shire, with two thirds of these being female. Gender diversity is also largely acceptable, with an overall M:F ratio of 47:53 (40:60 when Casuals are included), most of which arises from the higher female numbers in professional and administrative/customer service roles. Female representation in lower level trades/outdoor roles, however, is understandably low, whilst the number of females in management and supervisory positions is also poor. With respect to the latter issue, Council’s EEO Management Plan supports several initiatives to encourage females to develop towards, and potentially be in contention for, those higher level roles.
Skills and knowledge development will also be high on the Council agenda over the next four years, as changing customer expectations, improving technologies and changing legislative/regulatory environments make an impact on Council’s operations. Communication and information systems in particular are changing rapidly and are making a significant impact on operational processes, leading potentially to increased efficiencies. Council’s Training Program is updated annually, and sits within a flexible learning and development framework that can customise training and/or development activities to meet particular needs as required.
Employee costs as outlined in the LTFP are generally seen as being sustainable and manageable over the planning timeframes. Appropriate indexation has been applied to budget estimates and key employment related liabilities such as Employee Leave Entitlements are within prudent audit limits.
Over the next four years Council’s Delivery Program and Operational Plan include several planned major projects/activities that will contribute to this Workforce Plan. The development and implementation of an Organisational Cultural Development Program has already commenced and a Talent Management Model will be developed along with additional initiatives such as reform of Council’s Performance and Salary Systems, development of a Health and Wellbeing Program, and continuing the rollout of a comprehensive WH&S Audit Program. These initiatives will add strongly to Council’s workforce being in a position to effectively deliver services to the Hornsby community.
Delivering the elements of this Workforce Plan, along with management of Council’s diverse workforce in general, will not be without a number of challenges. Key amongst these challenges will be:
To keep Staff Turnover at around 10% or just below
A healthy level of voluntary turnover amongst staff brings in new ideas and allows career progression. Service longevity is still valued and internal career progression should still be available. Council’s broader attraction and retention activities, along with sound leadership and a maintaining a positive culture, will be the key to success.
SECTIONABOUT THE RESOURCING STRATEGY
HORNSBY SHIRE COUNCIL RESOURCING STRATEGY 2013
P19SECTIONWORKFORCE PLANNING 2013-17
HORNSBY SHIRE COUNCIL RESOURCING STRATEGY 2013
P19
To adequately resource legislative obligations, such as those arising from changes to the Swimming Pools Act
Depending on the approach Council takes, Council may be in the market for an increased number of compliance professionals such as Building Surveyors. Given that this legislation affects all NSW Councils, the demand on people with these skills within the labour market will increase significantly. An attraction and retention strategy will need to be developed in 2013 to ensure Council can employ the necessary staff to meet its obligations.
To retain key knowledge
The corporate knowledge and experience of Baby Boomer (BB) workers planning to retire, in particular, needs to be gathered and managed. Recent Award and Superannuation changes make it easier to transition towards retirement and Council will need to develop policies and practices that enable knowledge transfer to younger workers.
To train BB & Generation X managers and supervisors in new technologies and in managing the technology savvy Gen Y/Zs
The pace of introduction of new mobile device technologies such as iPads and smartphones has the potential to radically shift how Council operates. Already, in areas such as customer communication, social media applications such as Twitter and Facebook are much more commonplace. Outdoor crews are also investigating the use of iPads and GPS technologies to manage their workloads. Younger workers with differing attitudes to work have grown up with this technology and expect it to be in use.
To attract Generation Y/Z into local government and HSC in particular
Whilst attraction to local government requires industry wide effort, there is much an individual council can contribute. Whilst we are already active in this regard, the provision of further opportunities for school / TAFE work experience, apprenticeships, traineeships, internships etc. should be investigated by HSC.
To embed new cultural values and attitudes
The Organisational Culture Development Program that commenced in 2012/13 will develop further in 2013/14 and beyond. An action plan will be developed in early 2013/14 and a variety of change interventions are expected to roll out into 2014/15. It is expected that most staff will embrace the cultural changes, but as with any change program, some will be challenged and will put up a degree of resistance. Solid leadership and skills in change management will be paramount.
Finally, the content of this Workforce Plan makes the assumption of there being no changes to Council’s operating environment. It has been prepared at a time when there is a significant degree of uncertainty in NSW local government and 2013/14 is expected to bring the announcement of some possible structural changes, which could include amalgamations, boundary changes, or shared service arrangements.
W6. Key Challenges