Embed Size (px)
Citation preview
WORKFORCE INVESTMENTACT TITLE 1-B
ANNUAL REPORT • 2012
DIVISION OF WORKFORCE DEVELOPMENT AND ADULT LEARNING

this page is intentionally blank
MARYLAND ANNUAL REPORTWorkforce Investment Act Title 1-B
Program Year 2012
Martin O’MalleyGovernor
Anthony G. BrownLt. Governor
November 15, 2013
Julie SquireAssistant Secretary
Department of Labor, Licensing and RegulationDivision of Workforce Development and Adult Learning
Mission stateMent
The Department of Labor, Licensing and Regulation’s mission is to safeguard and protect Marylanders and support the economic
stability of the state by providing businesses, workforce, and consumers with high-quality, customer-focused regulatory
employment and training services. DLLR oversees and coordinates the state’s workforce development programs
including the new industry-lead Employment Advancement Right Now or EARN program. DLLR also oversees adult learning
initiatives including correctional education; administers the unemployment insurance program; regulates
financial institutions; licenses and regulates 24 occupations, professions, and trades; enforces occupational safety and health laws;
and regulates the racing industry.

MESSAGE from SECRETARY HOWIE
On behalf of Governor Martin O’Malley, it is my pleasure to present the Program Year 2012 Workforce Investment Act (WIA) Title 1-B Annual Report. This publication illustrates our successful job training activities for the year and details required financial and performance information for the reporting period of July 1, 2012, through June 30, 2013.
The implementation of the Workforce Investment Act and this Annual Report are the products of collaborative work and vision of the Department of Labor, Licensing and Regulation’s (DLLR) many partners and staff members. Governor O’Malley recognizes that
better choices lead to better results. Over the past year, DLLR’s Division of Workforce Development and Adult Learning (DWDAL) has implemented several initiatives to further adult education and workforce development resulting in a well-educated, highly-skilled workforce prepared to compete in an ever-changing 21st century economy.
One such initiative is the DWDAL Branding, Communications, and Outreach initiative (BCO). Funded by the U.S. Department of Labor, the BCO initiative is a collaborative process between state and local workforce investment system stakeholders to develop strategies and tools helping all stakeholders position the importance of the work accomplished collectively every day in Maryland’s 12 local workforce investment areas.
Another successful DWDAL initiative is the launching of the Laurel Regional Workforce Center (LRWC), the first of its kind that offers comprehensive workforce development programs, services and solutions for job seekers and the regional business community in one location for four counties – Anne Arundel, Howard, Montgomery, and Prince George’s. The LRWC co-locates and integrates employment, training, and education services for job seekers, workers, and employers. It also brings to fruition the State and Federal strategic regional workforce initiative of cross-planning between programs -- resulting in increased efficiencies, improved program alignment, seamless comprehensive services and ultimately better customer outcomes.
These are just a few examples of DWDAL’s successful job initiatives. DLLR is committed to the success of our workforce development as we continue to establish new partnerships and strengthen existing relationships. Thank you for reading this report and for your interest in growing Maryland’s New Economy.
Sincerely,
Leonard J. Howie IIISecretaryMaryland Department of Labor, Licensing and Regulation
DLLR • DWDAL WIA ANNUAL REPORT PY 2012 • 5
DWDAL Overview ������������������������������������������������������������������������������������������������������������������������ 7DWDAL Programs ������������������������������������������������������������������������������������������������������������������������� 8
Office of Workforce Development Program Overview .......................................................................................... 8Veterans’ Services ................................................................................................................................................... 8Maryland Re-entry Initiative Program ..................................................................................................................10
Dislocated Services Unit �������������������������������������������������������������������������������������������������������������������������������������������������11Rapid Response Activities ..................................................................................................................................... 11The Trade Adjustment Assistance Program ..........................................................................................................12The Early Intervention Program ...........................................................................................................................13Professional Outplacement Assistance Center .......................................................................................................13
Services to New Americans ������������������������������������������������������������������������������������������������������������������������������������������13Business Services Team ��������������������������������������������������������������������������������������������������������������������������������������������������14
Tax Credit Programs ............................................................................................................................................15Federal | Work Opportunity Tax Credit ...............................................................................................................16State | Maryland Enterprise Zone Tax Credit .......................................................................................................16Maryland Disability Employment Tax Credit .......................................................................................................17
Adult Learning ��������������������������������������������������������������������������������������������������������������������������������������������������������������������17Adult Education and Literacy Services ...................................................................................................................17GED® Testing ........................................................................................................................................................18iPathways ..............................................................................................................................................................19Career Pathways Programming .............................................................................................................................19
Correctional Education ���������������������������������������������������������������������������������������������������������������������������������������������������19Program Highlights and Partnerships ���������������������������������������������������������������������������������������21
Career Pathways ...................................................................................................................................................21Approach to Highway and Mass Transit Construction ........................................................................................21Maryland Transit Administration ........................................................................................................................ 22Department of Juvenile Services .......................................................................................................................... 22GED® Computer-Based Testing Implementation ................................................................................................ 23
Discretionary Grants �������������������������������������������������������������������������������������������������������������������������������������������������������24Maryland Energy Sector Partnership Grant ......................................................................................................... 24The Base Realignment and Closure National Emergency Grant .......................................................................... 24ReEmployment and Eligibility Program .............................................................................................................. 25RG Steel National Emergency Grant ................................................................................................................... 26
Innovations and Looking Forward �������������������������������������������������������������������������������������������27Maryland Jobs Now ............................................................................................................................................. 27Correctional Education ....................................................................................................................................... 27Construction-Related Careers .............................................................................................................................. 28Outreach for “Hard to Reach” Populations ......................................................................................................... 28Business Services ................................................................................................................................................. 29Enhanced Dislocated Worker Strategies ............................................................................................................... 29Layoff Aversion .................................................................................................................................................... 29Targeted Reemployment Projects ........................................................................................................................ 30
TABLE OF CONTENTS
6 • DLLR • DWDAL WIA ANNUAL REPORT PY 2012
TABLE OF CONTENTS
Governor’s Workforce Investment Board �����������������������������������������������������������������������������31Highlights of 2012 Activities ................................................................................................................................. 32
Success Stories �������������������������������������������������������������������������������������������������������������������������������33Adults ................................................................................................................................................................... 33Dislocated Workers .............................................................................................................................................. 34Youth ................................................................................................................................................................... 36Re-Entry ............................................................................................................................................................... 36Academic Program Spotlight ................................................................................................................................ 37Veterans ............................................................................................................................................................... 38
Waivers �������������������������������������������������������������������������������������������������������������������������������������������39Job Market Analysis ����������������������������������������������������������������������������������������������������������������������41
Maryland Employment and Wage Trends ............................................................................................................. 42Employment and Wage Trends by Workforce Area ............................................................................................... 46Maryland Labor Force and Unemployment Trends ............................................................................................... 49Local Area Labor Force and Unemployment Trends .............................................................................................. 50Unemployment Insurance Claims and Layoff Activities ......................................................................................... 53Job Market 2013: Trends and Outlook .................................................................................................................. 53Sources ................................................................................................................................................................. 56
WIA Financial Statement ������������������������������������������������������������������������������������������������������������57Economic and Fiscal Contribution ��������������������������������������������������������������������������������������������58
Maryland Economic and Workforce Trends .......................................................................................................... 59Economic Contribution of DLLR Workforce Programs ........................................................................................ 62Benefit-Cost Ratio Analysis ................................................................................................................................... 65
WIA Performance ������������������������������������������������������������������������������������������������������������������������67Common Measures ............................................................................................................................................... 67WIA Negotiated Performance Targets and Results ............................................................................................... 67WIA Assurance Statement .................................................................................................................................... 67WIA Adult Program Highlights ............................................................................................................................ 69WIA Dislocated Worker Program Highlights ....................................................................................................... 70WIA Youth Program Highlights ............................................................................................................................71
Statewide Evaluation Activities ��������������������������������������������������������������������������������������������������72WIA Local Performance Tables ������������������������������������������������������������������������������������������������80Unemployment Insurance Trust Fund �������������������������������������������������������������������������������������98

DLLR • DWDAL WIA ANNUAL REPORT PY 2012 • 7
DIvISION OF WORkFORCE DEvELOPMENT AND ADULT LEARNINGGeneral Information
The Division of Workforce Development and Adult Learning (DWDAL) coordinates the State’s workforce programs to ensure
businesses have the skilled workforce needed to be competitive and Marylanders have access to employment and training
resources and services. Adult education, literacy, and correctional education programs in collaboration with workforce develop-
ment programs, ensure a comprehensive system of workforce creation. The One Stop Career Center System, a partnership among
thirty-four (34) One Stop Career Centers and twelve (12) Workforce Investment Boards, is part of Maryland Jobs Now, a network
of high-performing, results-oriented workforce organizations investing in employment and training strategies, services, and initiatives.
This workforce system serves as the primary vehicle for both adults and dislocated workers to access core, intensive, and training
services. DWDAL maintains and develops Maryland’s dynamic workforce by training, assisting in job searches, reporting the needs
and demands of the labor market, and connecting businesses with employees. Eligible veterans and spouses are entitled to Priority
of Service. Adult Education and Literacy Services provide leadership for the establishment of adult education goals, oversight for
implementation of the federal Adult Education State Plan, and administration of the statewide GED® testing program with twenty
(20) testing sites and thirty-one (31) Adult Education Programs located throughout Maryland. Correctional Education, working with
their partners, provides academic, special education, occupational, English as a Second Language, college, library, and transitional
programs for approximately 3,000 students per day. The CE program provides incarcerated individuals with high quality services
facilitating successful re-entry into our communities. Marylanders seamlessly access a broad array of educational, job training, and
career services, providing enhanced opportunities to become self-sufficient
and improve their lives.
8 • DLLR • DWDAL WIA ANNUAL REPORT PY 2012
DWDAL PROGRAMS
WORkFORCEOffice of Workforce Development – Program Overview
The Office of Workforce Development coordinates the state partnership with the One Stop Career Centers located across Maryland. These thirty-four (34) Centers provide comprehensive services to both job seekers and businesses. A wide range of adult and dislocated worker employment and training services is provided to job seekers through core, intensive, and training assistance. Core services are provided primarily by Wagner-Peyser, federally-funded staff, providing a personal element to the Maryland Workforce Exchange Virtual One Stop and job search in general. Examples of core services include outreach, intake, assessment, orientation, eligibility determination, job placement assistance, career guidance, partner referral, follow-up, labor market information, and information on training provider service and performance. The One Stop Career Center System is also the primary vehicle for both adults and dislocated workers to access intensive and training services. Intensive services are provided to unemployed or underemployed individuals experiencing difficulty securing appropriate employment through core services. Intensive services include but are not limited to the following: comprehensive and specialized evaluation, individual employment plan development, group and individual counseling, career planning, case management, and short-term pre-vocational services. Additional intensive services may include out-of-area job search, relocation assistance, literacy readiness, internships, and work experience.
The Local Workforce Investment Boards in Maryland develop job training programs for implementation in their respective Workforce Investment Areas (WIAs), manage the operation of those programs, and determine which companies, educational institutions, and community organizations will receive funding for program operation. The WIA partners with local employers and governments to create the workforce development programs most beneficial to the region and tailor programs to meet the local employment training needs. The State One Stop Operations Manager oversees the monitoring responsibilities of Adult, Youth, and Dislocated Worker program, including NEG and Trade. This monitoring is conducted annually or more frequently as needed through OWD.
PROGRAMSvETERANS’ SERvICESU.S. DOL Funding for Veterans
Through funds from U.S. DOL’s non-competitive Jobs for Veterans State Grants Program (JVSG), DLLR’s One Stop Career Center staff assist veterans as they seek employment, training, and placement services under qualified job training programs. Veterans are referred on a Priority of Service basis – veterans and eligible spouses are identified at all access and entry points at the Career Centers and receive priority referral to services over non-veterans. Statewide, 16.5 Local Veterans Employment Representatives (LVERs) and 25 Disabled Veterans Outreach Program (DVOP) specialists, plus one State Administrator, are available providing services to all veterans who Title 38 indicates are eligible for services.
Focus on Veteran Job Seekers and Businesses
For veterans, securing employment can be an even greater challenge because of the complexities that come with the transition from military to civilian life. Job seeking veterans must acknowledge the importance of discussing specific military skills which can translate into civilian skills, such as: discipline, teamwork, problem-solving, and working under pressure. Veterans being taught to avoid military jargon and explain their strengths effectively will make all the difference in an interview.
DLLR • DWDAL WIA ANNUAL REPORT PY 2012 • 9
DWDAL PROGRAMS
As a result of DLLRs work for veterans, job seekers have experienced the following benefits:
• In PY2012, Maryland’s workforce system has served approximately 14,338 veterans, referred 522 veterans for training, 3,427 for employment services, and has assisted 5,950 veterans in successfully obtaining employment
• Veteran job seekers are better able to discuss and match skill sets to those for which businesses need - they are able to fully explain their skills and talents on a résumé, have employers understand their experience, and better apply their military skills to a non-military setting
Business have experienced the following benefits:• Cultural differences being addressed• Veterans and businesses are “speaking the same language”• High caliber, well-qualified and hard-working veteran job seekers fulfilling needs
Through the assistance of the One Stop Career Centers, veterans are enrolled in the Maryland Workforce Exchange Virtual One Stop (MWE-VOS) and are referred to a veteran staff person for initial assessment, information dissemination, and refer-ral to other services as needed. If the veteran is determined to have significant barriers to employment, he or she will be offered intensive services such as case management. Veterans not needing intensive service can be assisted by other Career Center Staff. Veterans can take advantage of the full array of services available at the One Stop Career Center, including: job search assistance workshops, résumé assistance, labor market information, career counseling, job referral, and referrals to other train-ing and supportive resources, such as housing, food, and mental health services.
The One Stop Center management team and veteran staff monitor Title 38 U.S.C. Veterans, post 9/11 Gold Card job seekers, ensuring they receive priority in accordance with applicable laws.
Veterans Full Employment Act
Maryland’s Veterans Full Employment Act of 2013 is designed to assist veterans, current service members, and military spouses to obtain occupational and professional licenses. Its core features require state agencies to do the following:
• Give credit for relevant military training, education, and experience
• Expedite licensing procedures for veterans, service members, and military spouses actively licensed and relocated to Maryland
Staff Development and Training
During PY2012, conferences and course offerings were developed responding to the increased demand for quality employ-ment and training services available to veterans and returning service members. For example, a Technical Assistance Confer-ence provided leadership and staff development services promoting quality and excellence in service delivery to Veteran Rep-resentatives, fine-tuning their customer-focused skills, better preparing veterans for job opportunities in the regional economy.
Course offerings for veteran staff expanded, as intensive professional development conferences enabled staff to be qualified in the following areas:
• Labor Employment Specialist• Case Management/Advanced Case Management• Military-to-Civilian Transition Job Coaching• Promoting Partnerships for Employment• Microsoft, Word, Excel, and Outlook
Conferences and Technical Assistance Trainings will continue to expand and evolve in PY2013.
10 • DLLR • DWDAL WIA ANNUAL REPORT PY 2012
DWDAL PROGRAMS
Maryland Re-entry Initiative
Maryland Re-entry Initiative is a statewide initiative increasing the employability of Maryland citizens with criminal back-grounds. The program provides technical assistance to jobseekers; One Stop Career Centers; other state, local, and federal agencies’ staffs; community/faith-based organizations; and employers. MRI administers the Federal Bonding Program through Local Bonding Coordinators located in One Stop Career Centers where jobseekers enroll in the program.
MRI maximizes resources and coordinates services through intra-agency and inter-agency collaborative partnerships developed to achieve statewide re-entry goals:
• Increased employability skills and employment for individuals with criminal history through occupational skills training, education, and On-the-Job Training workshops regarding online applications and assessments, detailing criminal records and understanding the employers’ expectations (Work Ethics, Attitude, and Aptitude)
• Professional standards for all Maryland staff working with and on behalf of individuals with criminal backgrounds via regional professional development training (Offender Employment Specialist training) as well as National Certification Training for Offender Workforce Development Specialists
• Staff development (21st Century Employment Readiness Standards, Understanding the Collateral Consequences of Having a Criminal Record, Effectiveness of Collaboration: Intra-agency and Inter-agency, and Federal Bonding-How It Works!)
• Increasing capacity and effectiveness of local programs by coordinating regional re-entry workgroups comprised of One Stop Career Center Re-entry Specialists, Career Facilitators, and local community partners who provide services to incarcerated and formerly incarcerated individuals
• Developing and implementing informational training tools to help employers, staff, and jobseekers access the resources and services available to assist re-entry for jobseekers
MRI works internally with the DLLR Correctional Education Division, Business Services, and Professional Outplacement Assistance Center. It works externally with partner agencies such as the DPSCS (Community Supervision), State and County Correctional Facilities, local WIA/DLLR One Stop Career Centers, the Federal Office of Parole and Probation, and Re-entry Programs (i.e. Center for Urban Families, America Works, Associated Catholic Charities, Goodwill, Episcopal Community Services of Maryland, the National Women’s Prison Project, Alternative Directions, Maryland New Directions), the Job Opportunities Task Force (JOTF), and the Office of the Public Defender throughout the State.
In PY2012, MRI reported 6,864 job seekers with criminal backgrounds received services through the Maryland One Stop Career Centers.
MRI staff provided assistance to 200 job seekers participating in DPSCS Community Supervision’s Annual Resource Aware-ness Fair and 300 job seekers at the Office of Public Defenders’ Back to the Neighborhood - How to Succeed with a Criminal Background Event. 138 of the 300 individuals were provided Federal Bonding Letters of Eligibility and were registered in the Maryland Workforce Exchange.
A total of 1,265 incarcerated individuals were provided workshops and information sessions at Baltimore City and Baltimore County Detention Centers, State Correctional Facilities, and Federal Correctional Facilities.
Offender Employment Specialist (OES) regional training was provided to Mid-Maryland and Western Maryland (Frederick, Washington, Alleghany, and Garrett counties). Participants included One Stop Career Centers and their local partner agencies, Correctional Education staff, and DPSCS Case Managers and Community Supervision staff.
DLLR • DWDAL WIA ANNUAL REPORT PY 2012 • 11
DWDAL PROGRAMS
Dislocated Services Unit
Any individual who loses a job or has received notice that he/she will lose his/her job as part of a facility closure or layoff is considered to be a “dislocated worker.” Title I of the Federal Workforce Investment Act extends a wide range of services to dislocated workers.
In Maryland, an extensive network of service providers is in place to assist the dislocated worker during his or her transition. Maryland’s DSU works closely with this network including One Stop Career Centers operating through a partnership of the Division of Workforce Development and Adult Learning in the Department of Labor, Licensing and Regulation with local Workforce Investment Boards in Maryland’s twelve (12) Workforce Investment Areas.
The DSU provides early intervention on behalf of the worker. In an ideal situation, service provision is initiated before the employee’s last day of work. Orientation sessions are held on-site or at a local Career Center informing workers of the range of services as well as where, when, and how to access those services.
The DSU is responsible for the oversight and administration of the State’s Rapid Response, Trade, and Early Intervention Program activities. Each of these programs are designed to facilitate the efficient re-employment of dislocated workers while leveraging existing resources as well as state and local investments designed to aid individuals and their families through this transition.
Rapid Response Activities
Authorized under the Workforce Investment Act, Rapid Response is an early intervention strategy designed to provide and inform individuals of services supporting them during the transition between positions. Rapid Response is also designed to shorten or even eliminate the time between employment opportunities for the individual, thus reducing or eliminating the time an individual would receive Unemployment Insurance. Services are provided to businesses faced with reducing their workforce regardless of the reason(s) for the reductions.
Led by the Office of Workforce Development, Dislocated Services Unit, a Rapid Response team consisting of a State repre-sentative and a local WIA representative, meet with companies in confidence on short notice to assess potential layoffs and closings and work collaboratively planning the most appropriate response meeting workers’ needs. Depending on the needs of the impacted workers, coordination with other partners may be necessary, such as the Division of Unemployment Insur-ance, Veterans Services, and the Division of Rehabilitative Services.
In PY2012, DSU responded to 34 WARN notices impacting 3,709 workers and supported 72 Rapid Responses. As a result of these efforts, job seekers experienced a greater understanding of services available to them, including contact information and resources, and felt empowered over their path to reemployment. Enrollment in unemployment insurance increased anecdotally, as workers were given detailed written and verbal instructions regarding how to file for UI as well as what to expect from their benefits.
Businesses likewise benefited from Rapid Responses, as they felt as if they were helping to the best of their ability impacted workers, who were more willing to work to the last day of employment as they knew what next steps to take. The company truly showed the employee that it cared and was looking out for the workers.

12 • DLLR • DWDAL WIA ANNUAL REPORT PY 2012
DWDAL PROGRAMS
The Trade Adjustment Assistance Program
In order for a reduction in the workforce to be determined eligible under the Trade Act, a petition must be filed with the U.S. Department of Labor. A petition can be filed by the employer, a Union, or three (3) or more impacted workers or a representative from the State. Members of the DSU are available to provide information and assistance on filing a trade petition.
The Trade Adjustment Assistance program is a federal entitlement program established under the Trade Act of 1974, as amended by the Trade Adjustment Assistance Reform Act of 2002. The TAA Program provides aid to workers who lose their jobs or whose hours of work and wages are reduced as a result of increased imports.
In order for the U.S. Department of Labor to issue a Certification Regarding Eligibility to Apply for Worker Adjustment Assistance, the following requirements must be met:
1� Workers have been totally or partially laid-off2� Sales or productions have declined3� Increased imports have contributed importantly to worker layoffs
Once the U.S. Department of Labor issues a Certification Regarding Eligibility, trade affected workers may apply for benefits under the TAA program.
If an event is deemed Trade-eligible, the following additional benefits are available:• Longer timeframes in which to receive cash benefits• Increased training opportunities• Greater length of time for retraining or skills upgrades• Assistance with paying for COBRA or other qualified health plans – 72.5%• Financial assistance with out-of-area job interviews (limits apply)• Financial assistance with relocating for employment (limits apply)• Income supplements for older workers who qualify
During the most recent federal program changes, the DSU has been ready to serve individuals under different sets of guide-lines. The DSU is prepared to provide guidance to frontline staff as well as approved individuals under the Trade program and approved businesses inquiring about Trade regulation and benefits under the three (3) different sets of regulations. The major challenge during PY2012 was serving over 2,000 workers impacted by the closing of the RG Steel plant in Baltimore County. Multiple outreach events were held to provide information about the benefits in place assisting former workers and those eligible for services.
Overall, in PY2012 these successful Trade programs for displaced work-ers boasted
• 1,179 people attending training programs• 297 participants completing training programs• 71% of exiters employed within one quarter after exiting program
Anne Arundel County 277 Baltimore City 1803 Baltimore County 609 Frederick County 210 Lower Shore 152 Mid Maryland 216 Prince George’s County 2823 Southern Maryland 172 Susquehanna 145 Upper Shore 186 Western Maryland 271
LOCATION #s REPORTED
DLLR • DWDAL WIA ANNUAL REPORT PY 2012 • 13
DWDAL PROGRAMS
The Early Intervention Program
The Early Intervention Program in Maryland assists those Unemployment Insurance (UI) Claimants identified as most likely to exhaust benefits before securing employment. In PY2012, 194,946 candidates were identified. Those individuals who reported totaled 95,536. Additionally, of the 39,929 who completed services, more than 74,001 were referred to employment that were either program completers or profiled, but not served.
The EI Workshop includes topics that range from finding job openings in today’s market to fine-tuning the details of accepting a job, such as interviewing skills, salary negotiations, using social media and ways to help reduce the impact of the points on which they were profiled.
Program participants are encouraged and provided guidance in using the information learned in the workshops as a foundation upon which employment readiness skills can be built coupled with more in-depth services offered at the One Stop Career Centers to improve opportunities for employment. Overall, during the past year, the response to this highly interactive work-shop has been incredibly positive and enabled some local areas to increase their workshop offerings.
Professional Outplacement Assistance Center
The Professional Outplacement Assistance Center is a service offered by DLLR’s Division of Workforce Development and Adult Learning. POAC provides assistance to individuals in the professional, executive, technical, managerial, and/or scientific occupations. In PY2012, POAC staff advised more than 8,000 people at 26 job and career fairs throughout Maryland. POAC programs reach an average of 2,500-3,000 people using services each year assisting them in returning to their senior-level positions.
The centerpiece of the POAC program is the staff’s unique combination of skills, experiences, and backgrounds. Job seekers are provided with a level of support only available through few private outplacement services costing thousands of dollars. POAC, as with all the services of DLLR, provides high-quality services that are free-of-cost to Maryland residents.
Job seekers benefit from leading-edge knowledge of trends in the following areas:• Social Media• Career and Workforce Development• Federal Employment
Businesses benefit from job seekers who have a “marketing plan” reflected in their résumés, cover letters, and interview skills. Their skills in the social media arena are well-honed. Additionally, those customers looking for employment in the federal sector are preparing materials concise and on-point. They have a better concept of how to translate government applications into language which is readily understandable.
Services to New Americans
DWDAL, through its various units, provides a wide range of services and programs for New Americans and residents who are Limited English Proficient (LEP). DWDAL collaborates with other Agencies to host training and informational sessions, offering resources and valuable information to staff who daily assist New Americans.
Immigrants accounted for nearly all of Maryland’s labor force growth (96 percent) during the last decade—among the highest in the country. Maryland’s immigrant workers are more likely to have college degrees than their native counterparts (43 to 36 percent). Twenty-seven (27) percent of scientists, 21 percent of healthcare workers, and 19 percent of computer specialists were foreign-born. In blue collar jobs, immigrants are a third of the State’s maintenance workers and approximately a quarter of construction, agricultural, food and healthcare support workers.
14 • DLLR • DWDAL WIA ANNUAL REPORT PY 2012
DWDAL PROGRAMS
Concurrently, 26 percent of high-skilled recent immigrants work in unskilled jobs, and 40 percent of immigrant adults are Limited English Proficient, resulting in lower wages and unutilized skills. Unlocking the tremendous potential of these workers is among Maryland’s highest priorities.
These populations, including Migrant Seasonal Farmworkers, are provided with formal complaint agency referral, information on English and heritage proficiency classes, and employment resources. In PY 2012, the One Stop System provided a variety of core, intensive, and training services to LEP customers. Some specific examples of services provided are as follows:
• In-house translation and editing of DLLR brochures in French and Spanish, enabling LEP workers to understand and navigate the DLLR system for One Stop Career Center locations and job search services, apprenticeship and training programs, and professional licensing; on-going updates and translations of outreach and marketing informational flyers and brochures
• Regional trainings addressing the responsibilities of servicing the LEP populations, crossing the language and cultural barriers, and emphasizing the value and utility of New Americans
• Dedicating three (3) DLLR staff persons, 12 One Stop Career Centers with Spanish speakers on-site, three Career Centers with multilingual staff, and seven Career Centers that offer on-site free English classes
• Making outreach contacts to Migrant Seasonal Farmworkers & Community Based Organizations & immigrants groups and service centers
• Releasing the Bi-Annual DWDAL-New American Thumbnail Report in 2011, communicating information specific about New Americans & LEP immigrants, sharing demographic data, and serving as an educational tool for local One Stop Career Center staff
• Creating the DWDAL-New American’s webpage in 2013 – an ongoing process – with a hyperlink under Quick Links leading to web-links for English as a Second Language courses, professional training & jobs, information about workers’ rights, and various services offered in the community
• In June 2013, changes were implemented in MWE-VOS to capture educational/professional data on foreign born residents
Business Services Unit
In PY2012, DLLR’s State Business Services Unit was established and charged with promoting Maryland’s “workforce brand.” DLLR applied for and received a $70,000 grant from USDOL to enhance efforts for expanding business engage-ment and employment outcomes for job seekers. The strategic goals and objectives detailed in this grant align with the overarching goals of the Governor’s office and the Governor’s Workforce Investment Board (GWIB) in improving access and usability of the workforce system by businesses and economic development partners.
Expanding Business Engagement Project Planning Goals:
1� Form a state level workgroup for coordinating initiatives to improve Business Outreach and Job Referrals. The state workgroup will include representatives of state and local partners, and will be responsible for: interagen-cy coordination; sharing best practices; developing a comprehensive list of state resources that are useful for business outreach; and, tracking performance of this unit
2� Develop and expand State partnerships for business services and assist LWIAs create sub-workgroups. Develop a new policy on Statewide coordinated business services
3� Improve MWE-VOS Products Integrate upgrades that will allow for improved customer relationship manage-ment tracking for business service representatives
DLLR • DWDAL WIA ANNUAL REPORT PY 2012 • 15
DWDAL PROGRAMS
4� Incorporate “Brand” into activities using implementation plan for Brand throughout the State
5� Develop technical assistance and training modules for Business Services Representatives (State & Local) on “Promising Practices” in Workforce Development services to employers; and, Develop standard “Outreach” strategies, techniques, and templates for materials to be made available in FMIS internal order system
6� Work with Director, One Stop Operations Manager, Veteran Services Programs Manager, and Special Projects Programs Manager to develop specialized technical assistance for “promoting Veteran Services to employers,” Tax Credits, and other incentives. Delivering training to LVERs and Business Services Representatives (State/Local); to include written scripts on Tax Credits, strategies and techniques for serving Business
7� Create a uniform terminology for the Business Services staff, and those associated so that a consistent industry vernacular is shared by all involved
8� Create a Business Services Advisory Team comprised of strategic representatives from the business community that can help inform, and direct the efforts of the workgroup
9� Utilizing sector strategies to make training and career pathways more transparent to practitioners, businesses and ultimately to job and training seekers
The grant has allowed DWDAL to expand and plan training for its field Business Services staff composed of 57 Business Resource Representative out-stationed around Maryland. The Business Services Program Management staff and administration had the terrific opportunity to work with the U.S. Department of Labor grant specialists and immediately initiated two focus groups centered on business services.
To further support these efforts the state is working on identifying “capacity” which is a significant priority. By convening functional best practices work groups regionally, across career centers and across state and local agencies we will continue to work to ensure that all partners have state of the art information and are developing and sharing practices that benefit job seeker, business, partners and community customers of our systems. Currently the state convenes all career center business services staff quarterly.
During PY2012, the Statewide Business Services Program unit supported numerous business outreach activities such as:
� Participating in numerous job fairs and recruitment events � Providing professional development and training for one stop center staff � Assisting in the branding efforts of the new Maryland Jobs Now campaign � Assisting DLLR’s Communication Office to script and produce a new Business Services Video � Supporting the development of the State’s Layoff Aversion planning strategies.
From July 2012-June 2013, Maryland’s Business Services Teams assisted in serving 4,901 businesses and received a total of 45,852 job orders. Staff referred job seekers to a total of 184,402 job openings (21,762 personally-referred, 162,640 internet-referred), resulting in 85,740 confirmed job placements.
Tax Credit Programs
The tax credit programs are specifically designed to serve as an incentive to employers to hire individuals from targeted groups who historically have barriers to employment. The credits are both federal and State and can be taken concurrently.
16 • DLLR • DWDAL WIA ANNUAL REPORT PY 2012
DWDAL PROGRAMS
FEDERAL |Work Opportunity Tax Credit
The following groups render employers eligible under WOTC:
� Summer Youth (16-17 years of age) � Designated Community Residents (18-39 years of age) � Veterans who are members of household receiving SNAP (Food Stamp) Benefits � Veterans with a service-related disability � Unemployed Veterans �Welfare-to-Work (Long-Term TANF Recipients) � Qualified TANF Recipient � Vocational Rehabilitation Referrals � Snap (Food Stamp) Recipients, 18-39 years of age � Ex-Felons � Supplemental Security Income (SSI) recipients
Each of these twelve (12) groups have differing additional criteria, such as timeframes for having received benefits, living in certain areas, terms of service, etc.
For most target groups, the WOTC can be as much as $2,400. It is based on qualified wages paid to the new hire for the first year of employment. Generally, qualified wages are capped at $6,000. The credit is 25% of qualified first year wages for those employed at least 120 hours, and 40% for those employed 400 hours or more.
For Disabled Veterans, the WOTC can be as much as $4,800 with qualified wages capped at $12,000. For long-term TANF recipients, the tax credit can be as much as $9,000, with qualified wages capped at $10,000 for a combined two-year period. For Summer Youth, the WOTC can be as much as $750 during the 90-day period of employment, with wages capped at $3,000.
Some employees that do not qualify for the WOTC are as follows: � Relatives or Dependents � Former Employees � Majority Owners of the employer
In PY 2012, 12,602 individuals qualified for WOTC.
STATE | Maryland Enterprise Zone Tax Credit
Businesses located in a Maryland designated enterprise zone and certified by the local enterprise zone administrator may be entitled to a tax credit for wages paid to newly-hired employees. For businesses located in a focus area, an area within an enterprise zone that is especially in need, the credit amounts are greater.
The business must hire at least one (1) employee who embodies any of the following: � Is a new employee or an employee rehired after being laid off for more than one (1) year �Worked for business for at least 35 hours per week for six (6) months or more � Earns at least 150% of the federal minimum wage � Spends at least 50% of the workday in the zone or on activities of the business resulting from its location in the zone or focus area

DLLR • DWDAL WIA ANNUAL REPORT PY 2012 • 17
DWDAL PROGRAMS
� Is hired after the date of the enterprise zone or focus area was created or the date the business established itself in the enterprise zone or focus area– whichever is later � Is not hired to replace an individual employed by the business within the last four (4) years
If the individual is economically disadvantaged, the business must obtain certification from DLLR.
For non-economically disadvantaged hires, the credit is a one-time $1,000 credit for the first year of employment in the zone or $1,500 for the first year of employment in the focus area.
For economically-disadvantaged hires, there is a three-year credit of the following:$3,000 – 1st Year$2,000 – 2nd Year (Enterprise Zone)$1,000 – 3rd Year
Focus Area Employees within the Enterprise Zone:$4,500 – 1st Year$3,000 – 2nd Year (Focus Area)$1,500 – 3rd Year
A total of thirteen (13) businesses benefitted from the EZ Tax Credit in PY2012, and a total of 923 businesses have received credits since its inception in PY2009.
Maryland Disability Employment Tax Credit Businesses may claim credit for hiring individuals with disabilities after receiving certification from the Department of Labor, Licensing and Regulation. Under MDETC, employers can also benefit from a tax credit for work-related child care or transportation expenses paid by the employer.
The credit allowed under MDETC is 30% of up to $6,000 ($1,800) during the first year of employment and 20% of up to $6,000 ($1,200) during the second year of employment. The credit for transportation or child care expenses is up to $600 the first year and up to $500 the second year.
ADULT LEARNING
Adult Learning Programs – Adult Education and Literacy Services and Correctional Education programs – in conjunction with the workforce development programs ensure a comprehensive and collaborative system of workforce creation that better aligns State education systems with workforce needs.
ProgramsAdult Education and Literacy Services
The Adult Education and Literacy Services unit oversees instructional and assessment programs designed for Maryland’s adults who wish to complete a high-school level of education, improve their basic reading, writing and mathematics skills, or acquire English Language skills. GED® testing and the National External Diploma Program offer an opportunity for adults and out-of-school youth to complete their high school education.
18 • DLLR • DWDAL WIA ANNUAL REPORT PY 2012
DWDAL PROGRAMS
Adults enrolling in instructional programs may also receive assistance with career exploration, job training, parenting, and various life skill needs.
Instructional programming for adults with less than a high school education is offered throughout the State in every juris-diction by 27 grantee organizations, which includes Community Colleges, Local Public School Systems, Community-Based Organizations, Public Libraries, and the State Correctional Education program. Many of the instructional grantees provide programming in conjunction with partner agencies to include career pathways instruction/training, family literacy, and instruction for locally incarcerated individuals. In PY2012, the grantee organizations collectively offered services to 38,826 adults across the State.
Adults who need to improve their basic reading, writing and mathematics skills can enroll in classes delivered in their communities. Small classes characteristic of this program offer the best opportunity for low-skilled adults to increase their educational functioning levels. Instruction is contextualized within life skills (e.g., Financial/Health/Family Literacy and Career Exploration), and thus offers practical support for everyday situations while engaging the specific learning style of the individual. Adults completing this level of instruction will advance to diploma preparation programs or may qualify for job training or employment.
Adults with high-school level skills are placed in Adult Secondary Education instructional programs. Instruction at this level focuses on the skills necessary to succeed in earning a Maryland High School Diploma via the GED® or National External Diploma Program assessments. Similar to the Adult Basic Skills instruction, the lessons are delivered within a context of relevance to the individual’s goals, whether they are employment, post-secondary education, job training, or personal.
Additionally, Maryland offers standards-based English literacy and civics education classes to help prepare Adult Limited English speakers for success in their personal as well as their family lives, in the workplace, as members of the community, and in their academic pursuits.
GED® Testing
GED® testing in Maryland is offered only in official testing centers approved by the DLLR GED® Testing Office, in accor-dance with the policies and procedures of the National GED® Testing Service.
Historically, all testing has been administered via a paper testing format. While this procedure remained in place through-out the year in Maryland, intensive planning was taking place for upcoming changes. The National GED® Testing Service will issue a new version of the test in January 2014, which will only be available in computer delivery. In preparation for this event, states have been approved for early launches of computer tests utilizing the current 2002 series GED® tests.
Throughout 2012, testing in Maryland continued to be administered in the paper and pencil modality in 24 testing centers open to the general public, along with State correctional facilities, local detention centers, and other residential institutions.The GED® Testing Office scheduled 11,773 applications for testing and administered tests to 10,071 individuals. Maryland High School Diplomas were issued to 4,682 individuals who passed the GED® tests.
The GED® testing program serves as a nationally recognized high school equivalency program, measuring high school level academic knowledge and skills in five (5) content areas: Language Arts, Reading; Language Arts, Writing; Mathematics; Science; and Social Studies. The test requires just over seven (7) hours to complete the entire battery, and sets a rigorous standard that only 60% of graduating high school seniors would pass on the first attempt.
DLLR • DWDAL WIA ANNUAL REPORT PY 2012 • 19
DWDAL PROGRAMS
Coming in January 2014, the GED® 21st Century Initiative will offer not only a measure of high school equivalency, but also will set a higher scoring standard for career and college readiness. Both scoring benchmarks will be set using empirical data from a sample of 11,000 recent high school graduates during the summer of 2013. DLLR plans to include computer-based GED® testing at a number of sites around the State, while continuing to offer the paper and pencil tests at currently approved testing centers through 2013.
DLLR believes the changes to the delivery system of the GED® tests implemented by the State in preparation for the 2014 se-ries of GED® tests will benefit constituents by offering a more efficient system of registering for the tests and receiving results.
i-Pathwaysi-Pathways is a unique online instructional program to prepare qualifying students to pass the GED® tests. In order to qualify for enrollment, adults or out-of-school youth must demonstrate academic and computer skills at a level where success is a reasonable expectation in mastering the skills required for the GED® tests. Once enrolled, students participate in a class that is conducted virtually, interacting regularly with an experienced instructor on an individual basis. It is anticipated that this curriculum will grow to offer career and college readiness level instruction, in line with changes to the GED® tests.
Career Pathways Programming
Career Pathways programming integrates adult education instruction with career training opportunities. Any of the adult instructional services listed below may be integrated with specific job training/credentialing programs that place the student on a career pathway, or in many cases provide a re-entry to a pathway. This important innovation within adult education services offers opportunities beyond the terminal goal of a high school diploma, which is widely considered an insufficient credential for success in today’s economy. Career Pathways programs are designed around specific industry needs for trained employees at various levels. For adult education students, the focus is on entry level jobs with future potential and the avail-ability of appropriate training opportunities. Maryland has three (3) years of successful implementation of MI-BEST, the State-specific replica of the highly successful Washington state Integrated Basic Education and Skills Training (I-BEST) Initiative. These carefully planned programs involve integration of local Workforce Investment Boards and employers, continuing education/training programs and Consolidated Adult Education and Family Literacy grantees.
Correctional Education
The Office of Correctional Education provides academic, library, occupational, and transitional services to incarcerated students in State correctional institutions. The academic program includes Adult Basic Education, GED® Preparation, Special Education, English for Speakers of Other Languages, and college classes. The Library Program provides recreational, informational, and research services. Currently there are twenty-two (22) occupational programs with ten (10) nationally recognized certifications. Transitional classes include Life Skills, Financial Literacy, Employment Readiness, Introduction to Computers, and Career Exploration. Correctional Education assists incarcerated students in preparing to become responsible members of their communities.
From July 2012– June 2013, Correctional Education served approximately 13,000 students — 6,878 in academic classes; 1,492 in occupational programs; and 4103 in transitional programs. There were 692 students who earned a GED® and 875 students who completed an occupational program. To improve workforce outcomes, Correctional Education’s priorities include the following:
• Enhancement of the “behind the fence” employment services by continuing a partnership with the Department of Public Safety and Correctional Services (DPSCS) to implement limited internet access for job search training purposes. Limited internet lines are now available at 22 facilities. Correctional Education staff supports and supervises inmate usage at 14 facilities. Between January and May 2013, the
20 • DLLR • DWDAL WIA ANNUAL REPORT PY 2012
Correctional Education staff has worked with 1,573 inmates as they learned to utilize and navigate three (3) websites including the Maryland Workforce Exchange Virtual One Stop (MWE-VOS), the Maryland Community Services Locator, and America’s Job Exchange
• Continuation of Offender Employment Specialist Training Workshops. During 2012 – 2013, one (1) workshop was offered at the Allegany County One Stop Career Center. Participants from DLLR’s Work-force Development, Department of Public Safety and Correctional Services, Correctional Educational, and Community Partners completed the one-day training
• Provision of updated DLLR Division of Workforce Development and Adult Learning print information to CE transition and library programs that serve students soon to be released
• Workshops on up-to-date workforce development topics such as the MWE, online employment assess-ments and online job applications are provided to CE transition staff annually
• Development of a new course, “Success at Work.” This course focuses on the development and review of skills necessary to retain employment including basic work ethics, work habits, professionalism, commu-nication, and employer expectations
• Development of Joint Skills Training Partnerships programs with DPSCS Food Service and Maintenance staff
• Partnering with DPSCS to provide Automotive Service Excellence internet certification testing so that students in five “Automotive Maintenance and Inspection” programs can acquire national certification
• Assessment of occupational training programs by employers
• Development of student assessment survey instruments completed by graduates and then used by principals and instructors alike to highlight the strengths and needs in their respective programs
• Alignment of National Center for Construction, Education and Research occupational programs with Pre-Apprenticeship standards
• Continuation of the Second Chance Career Technology discretionary grant awarded that was awarded in FY 12. Released graduates of the Desktop User Specialist program are eligible to participate in a six-month paid internship with a business partner in the Baltimore area
English as a Second Language instruction is provided to incarcerated students in State correctional institutions as needed. This program assists students in becoming more successful and confident in verbal and written communication with others in their personal lives, workplace, and respective communities. Currently, ESL services are provided to inmates at the following locations:
� Two (2) ESL classes meet per day – morning and afternoon – in the Jessup and Hagerstown institutions. � Forty-eight (48) students are served per day.
DWDAL PROGRAMS
DLLR • DWDAL WIA ANNUAL REPORT PY 2012 • 21
PROGRAM HIGHLIGHTS AND PARTNERSHIPS
PROGRAM HIGHLIGHTS AND PARTNERSHIPS
Career Pathways
The Workforce Investment Act (WIA) of 1998 visualized the type of integrated adult education/workforce systems found in a Career Pathways model. DWDAL considers this systems approach to be critical to the delivery of adult education and workforce development programming, with a proven capacity for raising skill levels and increasing industry-recognized credential attainment. Additionally, this Career Pathways systems approach is imperative to full implementation of Governor O’Malley’s Skills2Compete initiative. By definition, Career Pathways are aligned with high-demand industry needs and employer-identified skill requirements. Career Pathways provide an effective approach to meet business needs for a skilled workforce and build a truly integrated workforce development system.
Maryland was one of nine (9) states and two (2) tribal areas asked by the US Department of Labor to participate in a Career Pathways Local Implementation Planning Grant. This one (1) year planning grant was for a total of $60,000 with the grant period to begin July 1, 2010, but was extended to September 30, 2011. DWDAL was asked to identify one (1) local Workforce Investment Board Area to design a plan and implementation strategy for Career Pathways, and The Upper Shore WIB was selected for the following reasons: 1) their history of innovation; 2) the rural nature of the region; 3) Chesapeake College recently became the grant recipient for all adult education programs in all five counties the College serves; and 4) the unique partnership between the WIB and the College.
With the no cost extension of the Career Pathways Local Implementation Planning Grant, DWDAL was able to host the Maryland Career Pathways Summit on September 23, 2011. The Summit was attended by 250 people representing adult education providers, community college representatives, local Workforce Investment Board Directors and Chairs, local Department of Social Services Directors, and others within the workforce system from across the state.
The purpose of the Summit was to create statewide awareness of the National Career Pathways movement and an understanding of the six (6) key elements in the development of Career Pathways in Maryland; describe critical components and required partnerships to the implementation of the Career Pathways approach; discuss Best Practices, and provide an opportunity for discussion on the challenges and benefits of the implementation of Career Pathways.
In August 2012, DLLR hosted a two-day Maryland’s Career Pathways Institute. Eight (8) local workforce investment areas were selected to attend through a competitive application process: Anne Arundel Co., Baltimore City/Baltimore Co., Upper Shore, Lower Shore, Montgomery Co., Prince George’s Co., Southern Maryland, and Susquehanna regions. Over 100 attendees were represented including national and local Subject Matter Experts and 86 local team members.
MARYLAND’S CAREER PATHWAYS Approach to Highway and Mass Transit Construction
DLLR is currently in discussions with the Maryland Department of Transportation’s State Highway Administration (SHA) regarding the potential use of Career Pathways approach for the development of a Highway/Mass Transition Construction Career Pathway. Over the past year, DLLR has been working with SHA on the development and implementation of SHA’s BuildUP program at the request of the Governor’s Office. These collaborative efforts continue to progress, and to date, approximately 100 people have been trained in transportation and construction-related fields. These jobs provide opportunities for all citizens of Maryland, but particularly for hard-to-serve citizens not interested or suitable for jobs in health care, cyber security, or manufacturing.
22 • DLLR • DWDAL WIA ANNUAL REPORT PY 2012
Recognizing DLLR’s leadership and expertise to operate workforce development program through an interagency agreement, DLLR in November 2012, became the administrator and fiscal agent for the implementation of the BuildUP program. SHA and DWDAL partner when possible, and DLLR provides regularly reporting of program progress to SHA. DLLR’s plan is to run this program as a regional Career Pathways model. DLLR will determine whether this initiative will be managed at the state level or at a local/regional level. DLLR and SHA are currently in the process of reviewing labor market data and hope to convene an employer focus group fall 2013. In early CY2013, the Maryland Legislature passed House Bill 457 requiring Maryland Department of Transportation to use federal highway funds for construction training and supportive services, including skill improvement programs in collaboration with the Governor’s Workforce Investment Board. The Board must submit regular reports to a committee of the General Assembly relating to the use of federal highway funds. DLLR shall administer the training programs and ensure training and supportive services are available in each relevant WIA area. The passage of this legislation further strengthens the need to use the Career Pathways approach.
Maryland Transportation Administration
Building on the capacity and success of the SHA partnership, DLLR’s Division of Workforce Development and Adult Learning is engaged in the collaboration of workforce preparation and training implementation with the Maryland Transportation Administration (MTA).
MTA is in the planning and engineering stages of the deployment of the new Red and Purple Line mass transit light rail systems in the Baltimore Metro area. These projects will collectively result in the availability of nearly 2,000 jobs over the next five years. These jobs range from entry-level to highly-skilled and provide career pathway opportunities throughout the MTA organization. Our work to-date has included the identification of occupational and skills certification needs; project implementation timelines and the projected labor force needs during that continuum; the development of an outreach and communication strategy; and the identification of key partners, including the LWIAs, community and faith based organizations. MTA’s project includes a targeted inclusionary strategy that seeks to provide targeted employment outreach to hard-to-serve populations including minorities, individuals with disabilities, low-income, ex-offender, low literacy and unemployed persons. Intentionally, but not exclusively, MTA seeks to employ individuals whose place of residence is in and around the Baltimore Metro area corridor in which these projects will be initiated. A formal inter-agency agreement was developed between DLLR and MTA outlining the commitment to work together, which includes: the hiring of a full-time workforce program coordinator at MTA to coordinate efforts with DLLR; joint applications for competitive funding; sharing of data and labor market information, and ongoing collaborative discussions and planning.
This partnership supports recovering of jobs and increasing career readiness.
Department of Juvenile Services
With the support of the Governor’s Office and USDOL, DLLR and the Department of Juvenile Services (DJS) has initiated a collaborative partnership to better serve the incarcerated youth populations receiving services through DJS’s CORPS initiative. The CORPS Initiative is designed to serve 670 Baltimore City youth, 14 years and older, who are returning from placement and placed on probation. Additionally, services include educational placement, workforce development, community services, and mentoring.
PROGRAM HIGHLIGHTS AND PARTNERSHIPS
DLLR • DWDAL WIA ANNUAL REPORT PY 2012 • 23
Leveraging the capacity and experience at DLLR in the management of workforce development programs, DJS and DLLR have initiated an MOU that will:
• Provide technical assistance
• Designate and staff Liaison to assist DJS in the coordinated access to resources and services available through-out DWDAL for youth enrolled in CORPS
• Participate in grant management meetings
• Facilitate access to One Stop Career Center services in Baltimore City
• Provide technical assistance and training to DJS staff and partners regarding the utilization of the Maryland Workforce Exchange Virtual One Stop, workforce services and resources of the State’s One Stop Career Center system and Workforce Investment Act youth programs
• Facilitate Data match
• Conduct quarterly wage records match for all youth enrolled in CORPS registered in MWE-VOS
• Develop monthly reports of CORPS youth enrolled in WIA program
• Assist in the identification of existing adult education providers that can accommodate the classroom training needs for DJS CORPS youth and/or establish a new adult education class that meets the needs of CORPS youth
• Facilitate access to GED® testing services for CORPS youth career planning and job readiness services
• Facilitate collaboration with LWIA One Stop services in Baltimore City and Western Maryland and
• Provide DJS staff training and account access to the workforce systems’ online youth mentoring and career development portal
This partnership supports the Governor’s goal of improving student achievement and career readiness.
GED® Computer-Based Testing Implementation
DLLR continues to increase the quantity of computer-based test sites around Maryland – eight sites as of September 20, 2013. DLLR will continue to offer paper and pencil tests at currently approved testing centers through the end of 2013.
Coming in January 2014, the GED® 21st Century Initiative will offer not only a measure of high school equivalency, but also will set a higher scoring standard for career and college readiness. Both scoring benchmarks will be set using empirical data from a sample of 11,000 recent high school graduates during the summer of 2013.
DLLR believes the changes to the delivery system of the GED® tests that will be implemented by the State in preparation for the 2014 series of GED® tests will benefit constituents by offering a more efficient system of registering for the tests and receiving results.
PROGRAM HIGHLIGHTS AND PARTNERSHIPS
24 • DLLR • DWDAL WIA ANNUAL REPORT PY 2012
PROGRAM HIGHLIGHTS AND PARTNERSHIPS
DWDAL and its local workforce system partners continue to initiate and design strategies focusing on more effective and enhanced service delivery, especially in the areas of dislocated worker, re-employment, transitional employment for ex-offenders, employer-driven training, and UI/workforce system connectivity and integration strategies targeting increasing the number of program participants and veterans engaging in One Stop Career Center services. We strive to continue improving training and employment opportunities for Marylanders.
DISCRETIONARY GRANTSMaryland Energy Sector Partnership Grant
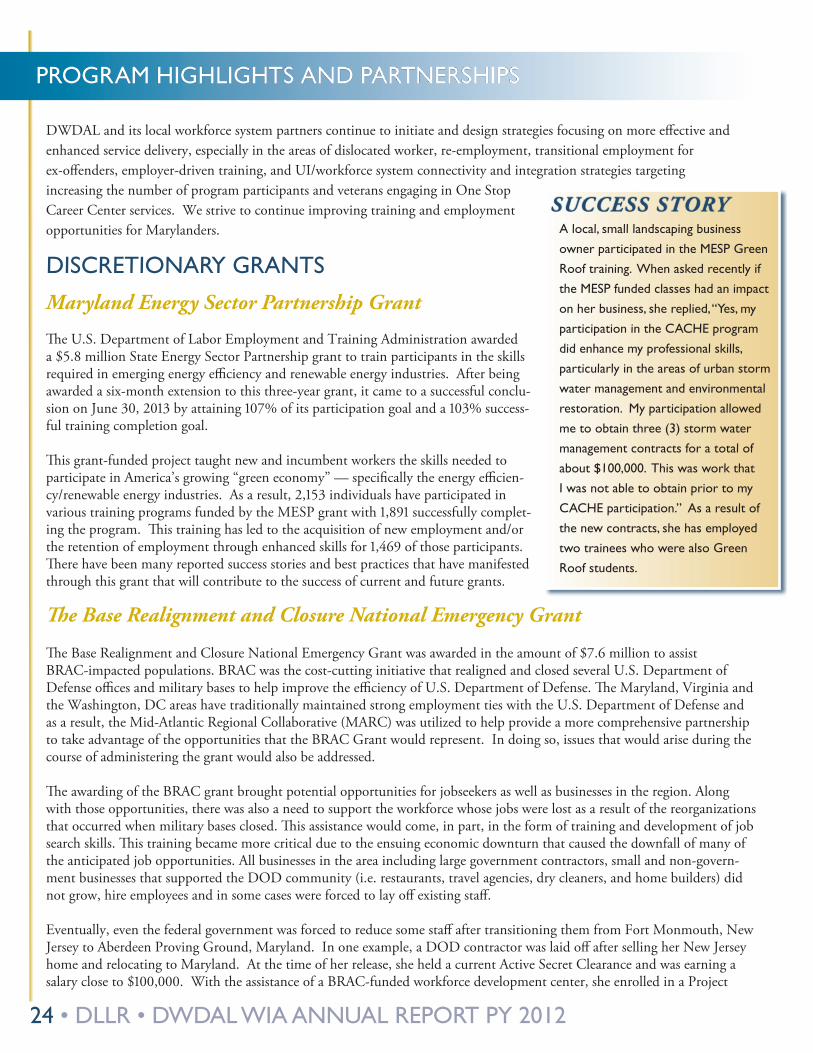
The U.S. Department of Labor Employment and Training Administration awarded a $5.8 million State Energy Sector Partnership grant to train participants in the skills required in emerging energy efficiency and renewable energy industries. After being awarded a six-month extension to this three-year grant, it came to a successful conclu-sion on June 30, 2013 by attaining 107% of its participation goal and a 103% success-ful training completion goal.
This grant-funded project taught new and incumbent workers the skills needed to participate in America’s growing “green economy” — specifically the energy efficien-cy/renewable energy industries. As a result, 2,153 individuals have participated in various training programs funded by the MESP grant with 1,891 successfully complet-ing the program. This training has led to the acquisition of new employment and/or the retention of employment through enhanced skills for 1,469 of those participants. There have been many reported success stories and best practices that have manifested through this grant that will contribute to the success of current and future grants.
The Base Realignment and Closure National Emergency Grant
The Base Realignment and Closure National Emergency Grant was awarded in the amount of $7.6 million to assist BRAC-impacted populations. BRAC was the cost-cutting initiative that realigned and closed several U.S. Department of Defense offices and military bases to help improve the efficiency of U.S. Department of Defense. The Maryland, Virginia and the Washington, DC areas have traditionally maintained strong employment ties with the U.S. Department of Defense and as a result, the Mid-Atlantic Regional Collaborative (MARC) was utilized to help provide a more comprehensive partnership to take advantage of the opportunities that the BRAC Grant would represent. In doing so, issues that would arise during the course of administering the grant would also be addressed.
The awarding of the BRAC grant brought potential opportunities for jobseekers as well as businesses in the region. Along with those opportunities, there was also a need to support the workforce whose jobs were lost as a result of the reorganizations that occurred when military bases closed. This assistance would come, in part, in the form of training and development of job search skills. This training became more critical due to the ensuing economic downturn that caused the downfall of many of the anticipated job opportunities. All businesses in the area including large government contractors, small and non-govern-ment businesses that supported the DOD community (i.e. restaurants, travel agencies, dry cleaners, and home builders) did not grow, hire employees and in some cases were forced to lay off existing staff.
Eventually, even the federal government was forced to reduce some staff after transitioning them from Fort Monmouth, New Jersey to Aberdeen Proving Ground, Maryland. In one example, a DOD contractor was laid off after selling her New Jersey home and relocating to Maryland. At the time of her release, she held a current Active Secret Clearance and was earning a salary close to $100,000. With the assistance of a BRAC-funded workforce development center, she enrolled in a Project
A local, small landscaping business owner participated in the MESP Green Roof training� When asked recently if the MESP funded classes had an impact on her business, she replied, “Yes, my participation in the CACHE program did enhance my professional skills, particularly in the areas of urban storm water management and environmental restoration� My participation allowed me to obtain three (3) storm water management contracts for a total of about $100,000� This was work that I was not able to obtain prior to my CACHE participation�” As a result of the new contracts, she has employed two trainees who were also Green Roof students�
SUCCESS STORY
DLLR • DWDAL WIA ANNUAL REPORT PY 2012 • 25
PROGRAM HIGHLIGHTS AND PARTNERSHIPS
Management Certification program at Towson University that leveraged her previous training and experience helping her to enhance her professional resume. As a result of the support of the BRAC NEG, the training and her new certificate, she was able to find a new job as Program Analyst with CACI.
Jobseekers were matched by their interests and skills with training programs such as CISSP, HR Management, PMP, A+/Network/CCNA, skills helpful for private sector employment in addition to government jobs. The Local Workforce Investment Areas (LWIAs) were creative in working with local businesses, large government contractors, local Economic Development Offices, schools and other organizations in forming partnerships to assist jobseekers.
Activities included the following: � Job fairs with a focus on the BRAC businesses � Training programs targeted to preparing jobseekers for BRAC positions �Weekly federal job search classes �Workshops on obtainig security clearances �Workshops teaching the jobseekers to “brand” themselves, including a professional portrait for use on the social networking website, LinkedIn
Outreach by Business Service Representatives, such as attendance at Howard County’s Business to Business events, the development of working relationships with organizations such as Women in Defense and the Government Contractors Guild. Through the positive partnerships and networking, Business Service Representatives were able to introduce jobseekers to the hiring managers at job fairs. In one instance, three (3) jobseekers were hired immediately at the job fair and ten (10) more received interviews for open positions with area businesses.
Although faced with additional challenges as a result of the economic downturn and a decline in jobseeker morale when sequestration reduced the number of jobs listed on the Federal website of current job openings USAJobs, the creative use of resources and strong public/private partnerships, 2,151 individuals received assistance under the grant.
Reemployment and Eligibility Program
The Reemployment and Eligibility Assessment Program (REA) debuted in the Maryland in December 2010. Developed as an evaluation project, the REA Program was designed to offer concentrated assessment services to individuals receiving unemployment insurance benefits and to encourage their use of services through one (1) of fifteen (15) One Stop Career Centers. Services are reserved for those claimants who are at most risk of exhausting benefits.
This fiscal year was a period of significant growth for the REA Program. Once based in nine (9) offices throughout Baltimore City, Prince George’s, Montgomery and the Upper Shore Counties, the program has now expanded operations to four additional sites in Baltimore and Harford Counties. A total of twelve (12) Career Coaches implement the REA Program with the additional support of an REA Program Coordinator and the REA Program Manager. During PY 2012, ending on March 31, 2013, REA staff worked to engage more than 5,000 UI claimants in the process of identifying valuable transferrable job skills, new potential career industries, employment opportunities and One Stop Career Center programs and services. REA staff also met and exceeded a program year target of 10,000 scheduled REA appointments and completed this period at 11,174 scheduled REA sessions.
Thank you for the one-on-one meeting I had with you today
with regards to my REA program. I so much benefited from every bit of the meeting. Indeed, I gained more insight into what employers are looking for in a resume, the opportunities available to me as an unemployed in Maryland, and how to go about an effective job search. You made the meeting interest-ing and I felt strongly empowered as I was leaving the venue. Thanks for your concern and advice.
26 • DLLR • DWDAL WIA ANNUAL REPORT PY 2012
PROGRAM HIGHLIGHTS AND PARTNERSHIPS
RG STEEL - National Emergency Grant
The RG Steel National Emergency Grant was launched June 2012 and will continue for two (2) years thereafter. The former Bethlehem Steel Mill in Sparrows Point became RG Steel in March of 2011 and fell into bankruptcy in May 2012. This bankruptcy resulted in the loss of 2,300 jobs for employees of RG Steel as well as small companies associated with and dependent upon RG Steel for their business. As a result of this bankruptcy, the $3 million National Emergency Grant (NEG) was established to assist the former workers of RG Steel and the impacted companies that were subsequently certified for Trade eligibility. With the Trade program covering expenses related to retraining or education for a new field of work, the NEG provided much needed supportive services that allowed many to take the opportunity to utilize the Trade benefits. For example, the NEG may provide assistance with dependant care and mileage to make seeking a college degree affordable.
DLLR worked with the Local Workforce Investment Areas (LWIAs) to understand the needs of the participants and successfully developed job fairs that were geared toward the affected employees of the former steel mill and smaller impacted companies. These job fairs, along with individual counseling from the LWIAs, were developed to meet the needs of long-time steelworkers who needed to reinvent themselves and be trained for a modern job market. Additionally, there was a pilot program created to provide assistance to the participants to help with transitioning their skills and work history into state certification/licensing. An example of this is the program to help former RG Steel electricians gain state certification and attain a Master Electrician License. Both DLLR and the LWIAs hired staff to directly interface and assist the participants of the shutdown due to the large number of participants eligible for this grant. All of these events and actions have strongly increased the number enrolled in classes taking workshops on job hunting skills, and helping them to learn and understand the job hunting process while, most importantly, finding jobs.
A former steel employee worked diligently with his counselor in order to improve his resume, learn better job search skills, keep abreast of current employment opportuni-ties, and to develop a training and job search plan� While currently enrolled in a HvAC program utilizing Trade Adjustment Assistance (TAA) grants, he found employment with a federal government contractor on Aberdeen Proving Ground as a Maintenance Technician working in the HVAC field. He will continue his training utilizing his TAA benefits while he is still eligible�
SUCCESS STORY
DLLR • DWDAL WIA ANNUAL REPORT PY 2012 • 27
MARYLAND JOBS NOWA proud partner of the networks
INNOvATIONS AND LOOkING FORWARD
INNOvATIONS AND LOOkING FORWARDMaryland Jobs Now, A Proud Partner of the American Job Center Networks- Maryland Jobs Now (MJN) Branding Initiative, a culmination of over a year’s efforts, was born out of the realization that a statewide, coordinated and unified
workforce investment system had not been fully realized in Maryland. Local boards developed their unique local system brands with separate communication and outreach strategies. These local identification and outreach methods had not facilitated recognition of the local system as being part of a statewide workforce investment system. Coinciding with the Maryland branding effort was DOL’s branding initiative and the issuance of TEGL 36-11, Announcement of American Job Center Network, in which ETA strongly encourages states and local workforce investment areas to implement the American Job Center brand in accordance with state plans. DWDAL chose to co-brand virtual and in-person resources: Maryland Jobs Now, a proud partner of the American Job Center networks, is Maryland’s centralized brand and referral effort featur-ing a website www.MDJobsNow.com in which DLLR, local WIAs, businesses, community-based organizations, educational institutions, and organized labor collaborate house current information in one location. One Stop Career Centers are now additionally a part of the larger Maryland network of workforce organizations – Maryland Jobs Now, a proud partner of the American Job Center networks.
The MJN logo and information has been added to the website as well as all DWDAL publications and resources, including topic-specific videos. Success stories, testimonials, innovations, and industry partnerships can now be found on the Maryland Workforce Investment Works (WIW) website – which houses a myriad of valuable resources to both employers and jobseekers in one location.
Correctional Education
With the leadership and support of the Education and Workforce Training Coordinating Council for Correctional Institu-tion’s “Employer Engagement Subcommittee,” Correctional Education is assessing the quality of each of its programs and updating programs as needed to meet the standards of the business community.
In this program year, the Correctional Education Program started four (4) new occupational programs at the Western Correctional Institution (WCI) in Cumberland. The WCI’s Cabinetry Occupational Program’s Toy Project provides the students with the opportunity to improve their cabinetry skills by making toys for several charitable organizations. These organizations include Toys for Happiness, Toys for Tots, the Garrett County Mentors’ Program and various Fire Depart-ments programs. In 2012, 1,200 toys were made in the cabinetry shop.
During the second and third quarters of PY12, Transition Program staff designed and developed a new class offering for the Transition. Success at Work focuses on the development and review of skills necessary to retain a job once hired. The applied skills taught in this course include basic work habits and behaviors, work attitudes and values, communication and interpersonal skills, problem solving, teamwork, employer expectations, and professionalism on the job. The course is designed to be interactive in and uses scenarios from institutional work assignments and private sector employment. The development of these basic work skills will assist both men and women to be successful in the working world. This class is now offered at four (4) transitional and pre-release institutions.
The professional development phase for GED® 2014 computer-based testing for the Correctional Education Program instructional staff began in November 2012. In order to have internet access, meetings were held at various libraries across the state and at The Maryland Correctional Training Center. During these workshops, teachers and principals examined the GED® testing service website, completed the sampler questions, analyzed the assessment guides, and participated in the professional development webinars. Attendees were given time to explore educational websites for resources, classes for teachers and students, and instructional materials. Common Core Standards and Webb’s Depth of Knowledge have been studied extensively. Professional development will continue as we move into the implementation stage of GED® 2014.

28 • DLLR • DWDAL WIA ANNUAL REPORT PY 2012
INNOvATIONS AND LOOkING FORWARD
Construction-Related Careers
Maryland Center for Construction Education and Innovation Public-Private PartnershipThe MCCEI was established at Towson University as a public-private partnership comprised of State government, universi-ties, community colleges, and secondary schools. The Center promotes the economic vitality of construction in Maryland, serves as resource for industry, educational institutions, and government in order to position construction as a career of choice for tomorrow’s workforce. DLLR and the GWIB will actively engage in implementing recommendations from the Center’s recent report on the future of the industry, including: (1) Create or expand construction education programs at Maryland four-year institutions to meet the demands of Maryland construction companies; (2) better align K-12, high school Career and Technical Education (CTE), community college, and apprenticeship programs with new construction skill requirements; (3) create or strengthen articulations between high schools, CTE programs, apprenticeships, community colleges, and universities to define educational pathways for a career in construction; (4) create a public image campaign to highlight attractive construction-related career options; and (5) create a strategy to include demographic groups that have not historically participated in the industry’s workforce.
This initiative supports construction-related careers. Although it is not one of the top three focused sectors for Maryland, construction provides many opportunities for individuals who are in target populations that may not be interested in or appropriate for work in Cyber Security, Health Care, or Manufacturing. It supports the Governor’s goals of recovering jobs, improving student achievement and career readiness, and increasing the number of Marylanders who receive at least two years of post-secondary education and skills training.
Outreach for “Hard to Reach” Populations
Partnership with the Maryland Public Library AssociationIn order to grasp “hard to reach” populations, the DLLR signed a formal agreement with the Maryland Library Association to collaborate and expand the outreach of existing workforce and adult education delivery systems. Individuals with disabilities are a key focus with this initiative supporting the labor market statistics that identifies one out of every 10 Marylanders as having a disability. Maryland has a national reputation as a leader in supporting and ensuring career opportunities for persons with disabilities. DWDAL has designated a Disability & Youth Services Coordinator. The Coordinator provides technical assistance, guidance, training and partnership development to the local areas upon request or if a specific need arises. The coordinator facilitates a relationship between the Business Services Team at DWDAL and the Division of Rehabilitation Services to find funding for businesses and to create partnerships with businesses interested in hiring persons with disabilities.
The Governor is also focused on providing previously incarcerated citizens opportunities to training and jobs. As part of this endeavor, Maryland’s Adult and Correctional Education workforce programs are integrated with those of DWDAL. One Stop Career Center staff provide outreach to correctional facilities via seminars and workshops for inmates and staff on opportunities “behind the wall.”
This initiative supports the Governor’s goals of recovering jobs, improving student achievement and career readiness, and increasing the number of Marylanders who receive at least two (2) years of post-secondary education and skills training. It is of particular importance due to the nature of its work with citizens who need targeted help.
DLLR • DWDAL WIA ANNUAL REPORT PY 2012 • 29
INNOvATIONS AND LOOkING FORWARD
Business Services
Expanding Business EngagementThe purpose and plan of the EBE initiative is implementing and developing of a full complement of employer services, staff training, and technical assistance as it relates to the delivery of services to employers, the development of business service strategies, partnership development, training of business services representatives statewide, and the establishment and promoting of business as the primary customer of workforce development. This plan focuses on the following:
• Expanding coordination to include a collaborative effort of state and local partners; • Increased sharing and use of “promising practices” • Applying new strategies and techniques to match employer skill needs and job seeker skills
Goals to be accomplished are as follows:• Develop statewide business engagement strategies to help more unemployed Marylanders connect to
employment opportunities• Engage businesses in a coordinated, strategic approach increasing hiring by improving methods workforce
development and related programs offer to employers• Connect employers who have open positions with skilled job seekers who meet the needs of employers
Enhanced Dislocated Worker Strategies
Unemployment Insurance ModernizationDLLR’s Division of Unemployment Insurance is undergoing an expansive UI modernization project involving the develop-ment of a new IT reporting system. DWDAL’s role in supporting this effort is critical to the combined reporting and data sharing necessary to improve the coordination of services to dislocated worker populations. The timeline for the implementa-tion and completion of the project is 2012 – 2017.
Layoff Aversion
Maryland has a need to design a solution that can aid the workforce system in more effectively and proactively responding to the needs of employers and job seekers to avert or minimize the impact of planned layoffs. DWDAL is taking the lead in initiating collaborative efforts, under the joint leadership of state economic development and workforce development, to identify and retain companies, save existing jobs, and create new jobs by:
• Reaching out to identify companies at risk using an early warning check list and assessment • Providing layoff aversion assistance to businesses to retain jobs before they are forced to layoff • Giving early notice referrals of potential non-WARN and WARN companies for assistance
In order to address the needs of businesses experiencing these indicators, DWDAL is working to identify and develop strate-gies addressing the most critical needs and build a delivery mechanism to provide technical assistance and consulting in key business areas: Business outreach, new market development, sales and marketing; financial management, accounting, cash flow, and database management; strategic planning, leadership, supervisory skills; process improvement, quality control, and new product design or improvement; and worker skills training and funding.
This process will also require a closer working relationship between DLLR and Maryland’s Department of Business & Economic Development (DBED) as these activities are germane to DBED’s mission. DBED brings other assets to the partnership including relationships with business consultants, a history of managing loan programs, and relationships with lenders and field staff with extensive experience in working with local businesses to improve their bottom line.
30 • DLLR • DWDAL WIA ANNUAL REPORT PY 2012
INNOvATIONS AND LOOkING FORWARD
DLLR will convene a strategic workgroup to develop the unified plan for the delivery of layoff aversion services; ensure the full engagement of DLLR, DBED and other strategic partners, i.e. lenders, consultants and leverage the resources and funding of each. Local area staff for DBED and DLLR will be cross trained in the delivery of these services. The workgroup will begin June 2013 and will be charged with creating the unified plan for layoff aversion. Key benefits to a more unified and strategic approach to lay off aversion are as follows:
• Creates a statewide, unified early warning network • Increases the number of “eyes on the street” to identify potentially at-risk businesses • Allows for earlier engagement of at-risk companies providing increased time (and opportunity) to turn
them around • Enables development of toolkits, dashboards and an overarching methodology to provide the effective
technical assistance possible to address the most critical business needs
Targeted Re-Employment Projects
Maryland has found success in the delivery of targeted re-employment projects that focus either on the particular industry, occupations, or populations that have been affected by layoff. The implementation of programs like POAC (Professional Outplacement Assistance Center) and the Job Match Re-employment initiative focus both on mid-high level professionals affected by layoff and those individuals affected by certain industry related layoffs.
The Professional Outplacement Assistance Center (POAC) provides assistance to individuals who are in the professional, executive, technical, managerial, or scientific occupations. POAC operated from a facility in Columbia, MD, that featured a state-of-the-art computer lab with internet access, a variety of written publications and resource materials, individualized career guidance, an audio-visual library, free faxing, copying, and telephone services in a modern office building.
DLLR • DWDAL WIA ANNUAL REPORT PY 2012 • 31
The Governor’s Workforce Investment Board (GWIB), as the State Workforce Board, is Governor O’Malley’s chief policy-making body for workforce development in Maryland. The GWIB is responsible for providing oversight of the State’s workforce system and for developing policies and strategies to meet the Governor’s vision ~ preparing the workforce to meet the current and future demand of Maryland employers, while simultaneously equipping workers with the skills they need to succeed and compete in the workforce.
This workforce vision is also embedded in the principle that Maryland’s economic prosperity is directly tied to the education and skill level of the State’s workforce. Job creation and skills attainment are critical to the O’Malley-Brown Administration and fall squarely within its four (4) top priorities — Opportunity, Security, Sustainability and Health.
Governor O’Malley’s strategic “Opportunity” priority is measured by the following key goals:
Jobs: Recover 100% of the jobs lost during the Great Recession by the end of FY 2014
Education: Improve student achievement as well as school, college and career readiness in Maryland by 25 percent by the end of FY 2015
By reinforcing its efforts to support job growth, to better position the State to compete in the emerging economy, and stimulate economic prosperity, the Administration set a third “Opportunity” goal of increasing the number of Marylanders who received at least two (2) years of post-secondary education and skills training by 20 percent by 2018.
The Governor’s umbrella initiative designed to drive success of that 20 percent by 2018 goal is the Skills2Compete (S2C) Maryland initiative — initially launched in 2010 to meet the increased demand for workers in the middle skills economy. S2C demonstrates a significant shift toward a more integrated, training-focused, and data-driven system. Specifically, S2C Maryland defines a single measurable statewide post-secondary goal for skills attainment as publicly articulated by the Governor; provides a platform for cross-agency alignment and accountability for the Governor’s goal across a full range of the State human capital programs; counts a diversity of skills outcomes as potential markers of success — not just degree completion, but also attainment of other post-secondary industry-recognized certificates; and includes a system of cross-agency data collection and reporting that allows the Governor to monitor (in real time) the Administration’s progress toward his 20 percent by 2018 goal.
The 20 percent by 2018 is an extension of the original S2C goal, which measured partners’ agency success in increasing the number of Marylanders who received at least two (2) years of post-secondary education and skills training by 20 percent by December 2012. Outcomes from this goal highlight that Maryland has increased the number of skills completers by 24.5 percent over the baseline year of 2009 — exceeding the 20 percent goal.
In addition to extending the skills goal to 2018, Governor O’Malley charged Maryland Department of Labor, Licensing and Regulation, the Division of Workforce Development and Adult Learning, in collaboration with the Governor’s Workforce Investment Board, with developing a more robust workforce development strategy for moving forward. The creation of this strategy and accompanying new skills goal will center on the strategic targeting of industries with identified skills gaps includ-ing Advanced Manufacturing, Construction, Cybersecurity, and Healthcare. The basis of the strategy will be the Maryland Employment Advancement Right Now Program.
Maryland EARN marks the next step in furtherance of the S2C skills goal. For the past five (5) years, the work of the GWIB has created sound policy for EARN through its Center for Industry Initiatives, fueled by a $1M United States Department of Labor Employment and Training Administration grant. Funds from this grant were used to develop a sector-driven approach to assess workforce demand in the following four (4) critical industries: 1) Advanced Manufacturing, 2) Construction, 3) Cybersecurity, and 4) HealthCare. As a culmination of this work during the September 2012 Quarterly Board meeting, the GWIB formally endorsed a motion to ask the Governor for $2.5 million of the FY14 budget to fund a sector strategies training program — now Maryland EARN.
GOvERNOR’S WORkFORCE INvESTMENT BOARD
32 • DLLR • DWDAL WIA ANNUAL REPORT PY 2012
GOvERNOR’S WORkFORCE INvESTMENT BOARD
Maryland EARN (HB 227/SB278), provides funding through a competitive grant process managed by DWDAL, for workforce training collaborations between local government, business, education, and the non-profit community. EARN’s biggest innovation capitalizes on the Center for Industry Initiative foundation by mandating strategic industry-led partner-ships and collaborative training strategies in sectors of the economy where data-identified skills gaps are inhibiting economic growth. While four (4) discreet industry sectors have been identified as EARN focus areas, there is a recognition of the unique regional differences within the State and as such, DLLR expects to invest in training strategies that support labor market and business demand outside of the four (4) target industries.
EARN is also distinct from other S2C initiatives because an additional component targets Maryland’s harder-to-serve, lower-income / lower-skilled individuals, with the goal of providing the skills needed by the State’s employers. EARN will encour-age mobility for these most vulnerable jobseekers in overcoming barriers to employment through job-readiness training that includes Occupational Skills Training Development, GED® Preparation, Literacy Advancement, Transportation and Childcare. The foundation for work performed under DWDAL’s Career Pathways initiative, which recognizes the churn of jobseekers within the workforce system, as well as flexible, innovative training approaches are needed to “meet jobseekers where they are” and ultimately enhance their chances of success.
Highlights of 2012 Activities• The GWIB partnered with key healthcare, business and education stakeholders — the Council for Adult and
Experiential Learning, Adventist HealthCare, Anne Arundel Community College, LifeBridge Health, Maryland Hospital Association, Montgomery College, Synergy Consulting, and the University of Maryland School of Nursing to sponsor the “Developing Innvovative Paths Into the Nursing Profession” Forum, held at Anne Arundel Community College
• The GWIB partnered with the Community College of Baltimore County to host a symposium on “The Future of Eldercare: Alternatives in Culture and Care”
• GWIB Board Chair, William G. “Bill” Robertson facilitated the Local Workforce Investment Board Workforce Stakeholders Meeting
• GWIB Executive Director, Lynn M. Reed, emceed the Annual 2012 Maryland State Department of Education Career and Technical Education Awards of Excellence
• The GWIB partnered with Senator Ben Cardin’s office in support of the Health Care Career Expo held at Hagerstown Community College
• The GWIB recommended that Governor O’Malley grant full recertification of the Montgomery County Workforce Investment Board for the period July 1, 2012 thru June 30, 2013
• The GWIB published the report to the General Assembly — HOUSE BILL 757, Taskforce on Development of Educational Programs to Aid Unemployed State Residents
• The GWIB published the report to the General Assembly — HOUSE BILL 758, Taskforce on Funding a Green, Technology, Life Science and Health Information Technology Loan Assistance Repayment Program
• The GWIB celebrated the first graduation class of the Aviation Maintenance Technician Program at the Pittsburgh Institute of Aeronautics at Hagerstown Regional Airport, in Hagerstown, Maryland
• The GWIB passed a motion during the September Board Meeting to adopt Maryland EARN — the promotion of strategic industry partnerships as an industry-driven, workforce / economic development strategy for bridging the skills gap in key targeted industry sectors in Maryland
• The GWIB partnered with the Maryland Center for Construction Education and Innovation to host the “THE CRITICAL PATH: Positioning Maryland as an Innovation Leader in the Global Construction Industry” forum
DLLR • DWDAL WIA ANNUAL REPORT PY 2012 • 33
SUCCESS STORIES
Maryland Workforce System staff are honored and privileged to provide commendable services to jobseekers and employers. Therefore, the following success stories have been shared across Maryland and aptly illustrate the stellar work accomplished each and every day at the One Stop Career Centers.
Adults
LEANNE T� Leanne T. had not worked in corporate America for years. Like many people, she decided that caring for her aging parents was more important. However, circumstances soon changed and Leanne T. needed to find work. With the help of Maryland’s One Stop Career Centers, Leanne T. was able to find employment.
Leanne T. tried for an entire year on her own to find employment, but she never heard back from any employers. Unemployed and frustrated, Leanne T. started to lose her confidence. Luckily, things were about to change. She was watching the news on WBAL-TV and saw an interview with Mayor Stephanie Rawlings-Blake about Baltimore City’s new Community Job Hubs. She remembered the Mayor saying that the City’s One Stop Career Centers were reaching out to partner with local communities to help residents get connected to employment services in their own neighborhoods. The next day, she researched the closest Career Center to her home. She went to the Govans Ecumenical Development Corpora-tion (GEDCO) in Northeast Baltimore.
When she arrived, Technology Trainer Carolyn Watford from the Mayor’s Office of Employment Development (MOED) was able to help Leanne become better prepared for the 21st century workplace. “They revamped my resume and cover letter. They trained me in Word, PowerPoint, and Excel. They worked with me [to prepare for interviews] and were just so kind and compassionate and very, very patient with me.” Leanne said.
In December 2012, she started sending out her new resume to companies and continued taking technology classes. In February 2013, Leanne became employed as Community Ice Company’s Office Assistant. Her duties include clerical and accounting work, and closing payroll.
Leanne stated, “By coming to the Community Job Hub and working with a professional staff, I was able to gain my confidence back. One great thing about the Community Job Hub is that I did not have to actually go into the Hub every day. I could complete some of my assignments from my home computer and if I had questions or concerns…I was always able to communicate with instructors online.”
Leanne believes in the program so much that she has sent two of her friends to the Community Job Hub to learn the latest computer programs and to find employment.
ROXANNE M� Roxanne M. had been unemployed for nearly nine (9) months when she began using the One Stop Career Center Services. After a brief volunteer stint with the Anne Arundel Workforce Development Corporation (AAWDC), her luck began to change…
Roxanne M. first experienced the services offered at the Anne Arundel Workforce Development Corporation (AAWDC) in January 2011, after becoming unemployed. She attended several orientations and workshops before finally scheduling an appointment to meet with a Career Advisor.
34 • DLLR • DWDAL WIA ANNUAL REPORT PY 2012
SUCCESS STORIES
She was empowered and educated in many areas including the resume writing process, interviewing skills, and Microsoft Office. Soon her calendar was filled with AAWDC workshops and charges for new tasks with which she was unfamiliar. The informational interview was not only an eye-opener but a rather significant job seeking tool. From that point forward, each and every challenge placed before Roxanne by her Career Advisor was met with newfound excitement. One such charge was to secure a volunteer assignment. Because Roxanne was SO impressed with the experience and services received from AAWDC at the time, she sought a volunteer position with them!
Ultimately, Roxanne was offered a volunteer opportunity with the Program Director for the Senior Community Service Employment Program providing services to mature workers, 55 and older. As a SCSEP volunteer, Roxanne conducted site visits, helped with community events, assisted with administrative tasks, and aided in resume preparation. This volunteer opportunity opened the door to a host of other opportunities.
Several weeks later, she was hired as a Client Service Representative with AAWDC at the Arundel Mills location. After learning of a DLLR-produced video in-the-works regarding general Career Center services, Roxanne’s supervisor recommended that she be featured in the video to tell her story. The video, entitled Moving Maryland Forward – We’re in This Together, may be viewed on the DLLR website at http://www.dllr.maryland.gov/employment/wdvideos.shtml.Two (2) months later, Roxanne was promoted to the BRAC position responsible for assisting and preparing clients for Federal government employment. As the sunset of the BRAC Program approached on June 30, 2013, the opportunity to continue with AAWDC was presented. Subsequently, Roxanne assumed the position of Career Advisor — the very same position of her first contact with AAWDC. Alas…her journey had come full circle!
During this ride, Roxanne has been privileged to train in the following areas: Case Notes Management, Maryland Workforce Exchange Virtual One Stop, Mental Health, and she has earned a certification as an International Protean Career Coach. She is currently scheduled to begin certification training as a Global Career Development Facilitator and is proof positive that the process/system works. All-in-all, Roxanne states that working for AAWDC has proved to be rewarding, challenging, and an honor as she is serving those whose shoes she was once in not long ago.
Roxanne adds, “AAWDC is an asset to the community and I look forward to my next challenge, my next opportunity, and my next Success Story.”
Dislocated Workers
CHRISTINA A� After enrolling in training with Baltimore County Division of Workforce Development, dislocated worker Christine A. secured a job in her field.
Holding a Master’s degree in Biotechnology, Christina A. was employed as a bioanalytical chemist and worked in the pharmaceutical market for the last ten (10) years. She wished to remain in that field but realized during her job search that she lacked pertinent knowledge about drug regulatory requirements, formulations, therapeutic drugs, and current laws in relation to HIPPA. Enrolling in Pharmacy Tech training would bridge the skills gap and allow Christina to be a multi-functional pharmaceutical chemist. With the help of BCDWD, Christina took advantage of the following workforce services: Early Intervention, Informal Assessment, Individual Counseling, Individual Employment Planning, and finally, Pharmacy Tech training.
After receiving the training and services with BCDWD, she was able to get a part-time position with Giant Pharmacy as outlined in her Individual Employment Plan. Christina has a new position with the Federal Drug Administration as a Chemist in the Office of Compliance.
DLLR • DWDAL WIA ANNUAL REPORT PY 2012 • 35
SUCCESS STORIES
RATISH S�With the help from the WISH program, Ratish S. was able to gain employment through a government contractor as a full-time Human Resources Technician with the Department of the Navy.
Temporary Cash Assistance customers referred to the WISH program engage in a variety of activities tailored to support customer transition from TANF to self-sufficiency. Work-based training activities are provided through a mix of WISH project, WIA, DLLR, the Howard County Community College, and local Department of Social Services staff. Cooperative relationships with County, State, and other community agencies are used to address the individualized needs of TCA recipients. Prior to participation in the WISH proposed activities, customers will have participated in DSS/HCC-mandated activities. Ratish is a single unemployed father of two (2) children under the age of six. After being displaced in Atlanta, Georgia, Ratish relocated to Maryland in hopes of finding work. He was very optimistic that by utilizing the workforce system’s resources, his opportunities to secure work would surely increase. In the interim, Ratish was placed as the first candidate in HCC’s Work Experience program through a newly-formed partnership with Ft. Meade’s incoming Commander, Colonel Edward Rothstein. During Ratish’s tenure, he worked in several departments and used every opportunity afforded him to network for available positions seeming to be a good fit for his skill sets. One of those opportunities resulted in a full-time HR Technician position with the Department of Navy through a government contractor.
When Ratish first came to WISH, he struggled with confidence and suffered from depression. Now that he is gainfully employed, his outlook on life has greatly improved. He expressed gratitude to the workforce system for assisting in his efforts to secure work and ultimately providing him a vehicle to support his family. His starting salary was $18.63 an hour. This program gave Ratish a strong work ethic and intense productivity. It has already been communicated by Ratish’s manage-ment that if he continues display those positive work attributes — promotion is on the horizon.
kAYCE W� After enrolling in the BRAC NEG Program in the Calvert County DLLR office, Kayce W. was quickly able to find, apply for, interview for and accept a position with the Tri-County Council of Southern Maryland as a Job Developer and Business Services Representative (BSR).
Kayce W. holds a Bachelor’s Degree in Criminology and Social Deviance. She had previously been a Placement Manager in Baltimore City for the Catholic Charities’ “Our Daily Bread” Employment Center where she worked with clients to gain full-time employment, while overcoming challenges including addiction, homelessness and re-entry into the workforce after incarceration. Kayce also worked as a Workforce Training Assistant with the College of Southern Maryland where she facilitated classes for clients as well as serving as the liaison between the clients, instructors, and Business Developers. She was laid off and was ready to get back into the labor force where she could again assist in workforce development. With the help of her case manager and trainers, Kayce was able to obtain assistance with her resume and cover letter and take “Ten Steps to Federal Job Search” provided by the program. She was also groomed for the position at Tri-County Council for Southern Maryland and was prepped with appropriate mock interview questions.
With the services and training received, coupled with her previous experience, Kayce gained employment within one (1) week of entering the BRAC NEG program! She has been successful in the Job Developer/BSR position, aiding in job placement for at least five (5) other people who are currently employed, but have made good contacts with defense contrac-tors willing to hire some of our customers. She has elevated the BRAC Job Club to a new level by bringing in employers and community partners to speak with the participants. As a direct result, several participants have made viable employment contacts in the community and are waiting to hear the status about possible employment.
36 • DLLR • DWDAL WIA ANNUAL REPORT PY 2012
SUCCESS STORIES
Youth
RAHUL C�After enrolling in the Summer Jobs Program, Rahul was able to gain working knowledge and provided experience for his future.
Rahul C. had a very positive and enriching job experience working for the Air Force Medical Logistics Operation at Fort Detrick, Maryland through the Frederick County Workforce Services Summer Jobs Program.
The Summer Jobs Program provided Rahul the opportunity to work in a professional work environment by closely matching his education, knowledge and skills with the needs of an employer. He felt as if the Frederick County Workforce Services staff was phenomenal to work with and made the registration, interviewing, and hiring process seem effortless for him, especially since this was his very first job with no previous employment experience. The Workforce Services staff was easy to contact and were always available to answer any questions or concerns regarding the employment process. The orientation process conducted by the Workforce Services staff on the first day of employment provided Rahul with necessary information regard-ing employment criteria, policies and procedures, as well as job performance expectations, proving immensely helpful. At Ft. Detrick, Rahul was able to capitalize on his knowledge of Microsoft Office —particularly Excel — as well as his other skills in assisting AFMLO with their job functions. Upon completion of his summer employment, Rahul’s employer gave him an outstanding evaluation and awarded him a Certificate of Appreciation for exemplary support to the AFMLO.
The Frederick County Workforce Services Summer Jobs Program is an invaluable program that coordinating with schools, colleges, public and private businesses, the Department of Social Services and the Maryland Department of Education’s Division of Rehabilitation Services to provide youth of diverse backgrounds with both employment experience and practical job training. This training gives youth such as Rahul the confidence to feel good and gain valuable work experience through participation in this program. Re-entry
Special Education Program SpotlightRecently DLLR Secretary Leonard J. Howie III received a letter from a parent of a special education student in the Correctional Education Program. An excerpt from that letter is shared below. “It is with great gratitude and humility that I write in appreciation of your Educational Program at the Maryland Correctional Training Center in Hagerstown, Maryland. As the parent of an inmate who just received his GED certificate, there are no words to express my gratitude for the interest you’ve taken in his personal and intellectual well-being. I take seriously the mandate given to my son by an award of this caliber. To me, your professionalism represents much more than just doing your jobs, it represents a belief in the promise of equal opportunity. By providing resources to inmates who need and deserve it most, you are helping to ensure that one’s economic situation is not a barrier to intellectual growth. Moreover, you’ve shown through your willingness to uphold excellence that you believe in the power of education and its ability to better both the world and the individual.”
DLLR • DWDAL WIA ANNUAL REPORT PY 2012 • 37
SUCCESS STORIES
Academic Program Spotlight
BRIAN k�Despite incarceration, Brian meets his educational goals.
If there were one word to describe Brian’s educational journey during his incarceration, it would be perseverance. His formal education stopped at age 11 when his grandmother, his main caregiver and supporter, passed away. He remarked that this was the beginning of a downward spiral that led him to give up on school and follow his peers into the “street life.” Brian returned briefly to school at 14, while residing in a group home, but without the ability to read. Needless to say, with a lack of school records for three (3) years, he didn’t last long in the educational system. By 17, Brian found himself in prison with a 25-year sentence.
He continued to be under the influence of peer pressure at the start of his incarceration. Many of his friends told Brian not to waste time attempting to obtain his GED® certification because he had “plenty of time” to do that. In the back of his mind however, Brian understood the importance of getting his high school diploma and knew that he should focus on his education. Over the last ten (10) years, Brian has done just that by devoting his time to overcoming his academic deficits and ultimately getting his high school diploma. After many attempts, Brian met his educational goal earlier this year when his Maryland High School Diploma was earned.
He credits his success to a team of positive supporters who encouraged him to stay on course, including his teachers, other professionals that work with him and even fellow inmates. Brian says, “They believed in me. I didn’t want to let them down.” Brian also reflects that he has learned that the responsibility for his education rests with him. “It ultimately came down to me. I had to believe in myself. I knew I could do it. I’m just sad it took this long for me to realize it.”
Meeting his educational goal has not made Brian complacent; it has motivated him to set even more goals. He plans on taking college courses in business as well as getting experience in landscaping. His ultimate goal after release is to own a landscaping company. The dedication and determination demonstrated in pursuit of his high school diploma will surely assist in fulfilling Brian’s future aspirations.
SAM M� Sam finds work after his release with the assistance of the Occupational Skills Training Center.
Sam M. graduated from the Printing and Graphics program at the Occupational Skills Training Center in 2005. After his release and with assistance from his Printing and Graphics Instructors, Sam was employed at a local graphics company where he started as a “catcher.” This proved to be more than just a job for Sam. He knew that he wanted a career as a pressman and that this was the first step on his career ladder. Sam’s eagerness to learn and his good work ethics gained him the admiration of his supervisor who quickly promoted him. In September 2012, Sam accepted a position at Uptown Press where he continues to grow in the field learning new presses and printing techniques. Sam states that his training at the Occupational Skills Training Center gave him the foundation for understanding the principles of printing — making it possible for him to learn new presses and finishing techniques.
38 • DLLR • DWDAL WIA ANNUAL REPORT PY 2012
SUCCESS STORIES
Veterans
JOSEPH B� Dislocated Veteran, 51, received training at Hagerstown Community College to start a new career.
The Veteran, Wagner-Peyser, WIA Adult, and Dislocated Worker Programs as well as the Veterans Workforce Investment Program, combined adeptly to assist Joseph B. in his search for skills training and employment. Joseph was 51 years old, married, and had one teenage child. He had earned his Bachelor’s Degree in History and boasted solid work experience including construction sales and substitute teaching. After meeting with a Job Specialist at Frederick County Workforce Services, Joe was assessed and encouraged to participate in seminars. He struggled to decide between the IT industries (Cyber), employment in the federal arena, or obtain his CDL A license. Utilizing Veteran, Wagner-Peyser, WIA, and VWIP programs, a training plan was developed. Funded through WIA, the CDL A training program took place at Hagerstown Community College. After completing his training, Joseph passed his tests and obtained employment driving trucks with J. J. Taylor, Inc. in Alexandria, Virginia.
OPERATION HOMEFRONTOn February 20, 2013, the MontgomeryWorks Veterans’ Staff began serving wounded warriors and their spouses at Operation HOMEFRONT Village in Gaithersburg, Maryland on a quarterly basis under the direction of the Executive Director. Operation HOMEFRONT is a national non-profit organization supporting military families and wounded warriors undergoing rehabilitation at the Walter Reed National Military Medical Center, Bethesda, Maryland. The Gaithersburg Village provides transitional housing for wounded warriors leaving the military due to their injuries and their families.
The purpose of the staff’s visit was to educate the wounded warriors and their families about nationwide One Stop Career Center services available upon relocation to their permanent addresses. MontgomeryWorks Veterans staff provided information on the assistance available to wounded warriors with resume preparation, job search activities, and partner/service referrals while residing in Montgomery County. During the February meeting, MontgomeryWorks Veterans staff provided personalized information to six (6) spouses and three (3) wounded warriors. In following up with the Executive Director, staff was able to provide resume assistance, One Stop Career Center locations, and the names and addresses of the Local Veterans Employment Specialists and the Disabled Veterans Outreach Program to two (2) families preparing to relocate. MontgomeryWorks staff is very proud and honored to have been considered by Operation HOMEFRONT staff to provide services to these outstanding heroes and their families and will continue serving during the next Quarter.
DLLR • DWDAL WIA ANNUAL REPORT PY 2012 • 39
WAIvERS
WAIvER 1Waiver of the required 50% employer contribution for customized training at WIA Section 101 (8)(C) & (31)(B).
This Waiver is a contribution on a sliding scale, ranging from 10-50%, based on the guidance in TEGL 13-06 (Increased Use of Flexibility Provisions in WIA).
Waiver 1 allows greater flexibility in use of customized training, though the use is still relatively scarce across the State. It also provides flexibility in the process of selling customized training to businesses and allows better access to smaller businesses with the lower match percentage; an increased flexibility at the local level to service business in a demand-driven approach; and an improved the ability of the Local Workforce Investment Boards (LWIBs) to respond to industry changing needs more expediently and impactfully.
WAIvER 2 Waiver of requirement that businesses receiving On-the-Job Training (OJT) Services under WIA Section 101 (31) (B) and 20 CFR 663.700(a), 663.710(b).
This Waiver requires that businesses receiving On-the-Job Training (OJT) services under WIA receive a maximum reimbursement of 50% of the newly hired employee’s wages during OJT. Maryland was previously granted a waiver to permit an increase in employer reimbursement for on-the-job training through a sliding scale based on the size of the business. The waiver would allow for reimbursements as follows: 1) up to 90 % of the participant’s wage for employers with 50 or fewer employees; 2) up to 75% of the participant’s wage for employers with more than 51-250 employees; and 3) the current statutory requirements of 50% of the participant’s wage for employers with 250 or more employees.
Waiver 2 allows for more businesses to participate in the OJT program and provided opportunities for customers who did not meet the eligibility requirements of the OJT grant. This provided an opportunity for those individuals to partici-pate in OJT. This waiver, which creates a financial incentive to hire individuals, is used more widely than customized training. This has a direct effect on local area performance as individuals enter employment with the employer after the OJT. As the economy was rebounding from the recession, employers could not find specific-skilled applicants and this waiver provided businesses the option to train individuals on the skills gap.
WAIvER 3Waiver of WIA Section 133 (b)(4) to increase the allowable transfer amount between Adult and Dislocated Worker funding streams allocated to a local area.
This Waiver was previously granted to Maryland and permitted an increase in the amount a state is allowed to transfer between the Adult and Dislocated Worker funding streams; transfer authority is limited to 50%.
Waiver 3 is the most popular and most widely-used Waiver that allows for increased flexibility of local areas to use training funds to react to local employment and business conditions in real-time. This Waiver takes into consideration the local economic conditions and ultimate WIA service needs of those personally impacted. Local areas are able to support the increased demands of dislocated workers due to poor economic conditions over the past year. This Waiver enhanced the local areas’ ability to address the workforce needs of those workers. Adult funds are transferred to Dislocated Worker funds due to a lack of participants and a greater need for Dislocated Workers which creates greater flexibility.
The local WIAs are utilizing the expenditure transfer option to meet demands and balance local budgets. In PY12, the local WIAs requested and were approved for the following expenditure transfers:
742,037 from the WIA Adult to the WIA Dislocated Worker budget0 from the WIA Dislocated Worker budget to the WIA Adult budget
40 • DLLR • DWDAL WIA ANNUAL REPORT PY 2012
WAIvERS
The approved transfers from the WIA Adult to the WIA Dislocated Worker budgets are the following:
Baltimore County - $250,000Frederick - $151,585Lower Shore - $85,452Mid-Maryland - $100,000Western Maryland - $155,000
WAIvER 4Waiver to permit the State to replace the performance measures at WIA Section 136 (b) with the Common Measures.
This Waiver was previously granted to Maryland and allows the State to replace the seventeen (17) performance measures under WIA Section 136 (b) with the common measures.
Waiver 4 common measures have simplified State reporting on workforce outcomes and have allowed the State to focus program resources to target a single set of goals. This has also provided a simplified and streamlined performance manage-ment system. Less data, which must be tracked, creates a climate for better and more accurate reporting. This request supports the Maryland State’s Strategic Plan to align strategy, services to customers and accountability across the workforce investment system and programs administered by DLLR/DWDAL.
WAIvER 5Waiver of the provision WIA Section 122(c)(5) and WIA Regulations 20 CFR 663.530 that prescribes a time limit on the period of initial eligibility for training providers.
This Waiver requests an extension of the initial eligibility period, deferring the implementation of the subsequent eligibility process. Additionally, the Waiver provides an opportunity for training providers to re-enroll as initial eligible providers.
Waiver 5 allows WIA-eligible customers to be positively impacted by giving them a choice in selecting their training providers. Employers will continue to have a steady flow of skilled workers entering the job market and training providers will be able to continue serving present and new customers.
WAIvER 6Waiver of the Prohibition at WIA Regulation 20 CFR 664.510 on the use of Individual Training Accounts for older and out-of-school youth.
This Waiver was previously granted to Maryland and is a waiver of the prohibition at 20 CFR 664.510 on the use of Individual Training Accounts (ITAs) for older and out-of-school youth program participants.
Waiver 6 allows the local workforce investment areas the flexibility to design and deliver programs based on the needs of their customers — rather than restrictions based solely on age. Without this Waiver, the workforce system would have no alternative, but to co-enroll older youth in the Adult program to provide training opportunities through the use of ITAs. This Waiver permits greater flexibility in service delivery for older youth and provides a greater selection of training services. Performance is enhanced as the mix of services provided better meets the needs of the individual.
DLLR • DWDAL WIA ANNUAL REPORT PY 2012 • 41
JOB MARkET ANALYSIS
BACkGROUND AND OvERvIEW
The year 2012 was a period of modest growth for the U.S. economy, as it continued to recover from the Great Recession of December 2007 to June 2009. Sixteen (16) consecutive quarters (through 2013Q2) of GDP growth, have gradually added jobs and reduced the nation’s jobless ranks. Nonfarm payroll employment, which had fallen by more than 8.7 million jobs as a result of the contraction, had regained 75% of the loss by June 2013—a positive development, but a rather constrained expansion, coming four years after the recession’s trough. Unemployment, which had reached a peak rate of 10% (season-ally adjusted) in October 2010, had declined to 7.6% in June 2013. U.S. annual average unemployment fell from 8.9% in 2011 to 8.1% in 2012. The number of unemployed declined from 13,747,000 to 12,506,000—an improvement, but still high by historic standards. Job growth has not been solid enough to lower unemployment to pre-recession levels. Maryland continued its recovery as well. Typically, the state weathers economic downturns better than much of the nation and is generally more favorably positioned to recover. State unemployment consistently falls below the U.S. average, both during recessions as well as economic expansion. A number of elements serve to provide stability in Maryland—both seasonally and cyclically—including the state’s services-dominated job market, its sizable professional/technical workforce, a well-educated labor force, and a strong federal government presence. The steep decline in payroll employment and rapid climb in joblessness brought on by the Great Recession took its toll. Recovery has been deliberate and sometimes unsteady, though Maryland remains in a better economic situation than the nation as a whole.
Maryland concluded 2012 with its second consecutive year of growth in payroll employment. Total jobs increased by 1.4%, and private sector employment was up 1.7%. Unemployment declined from 7.3% in 2011 to 6.8% in 2012.
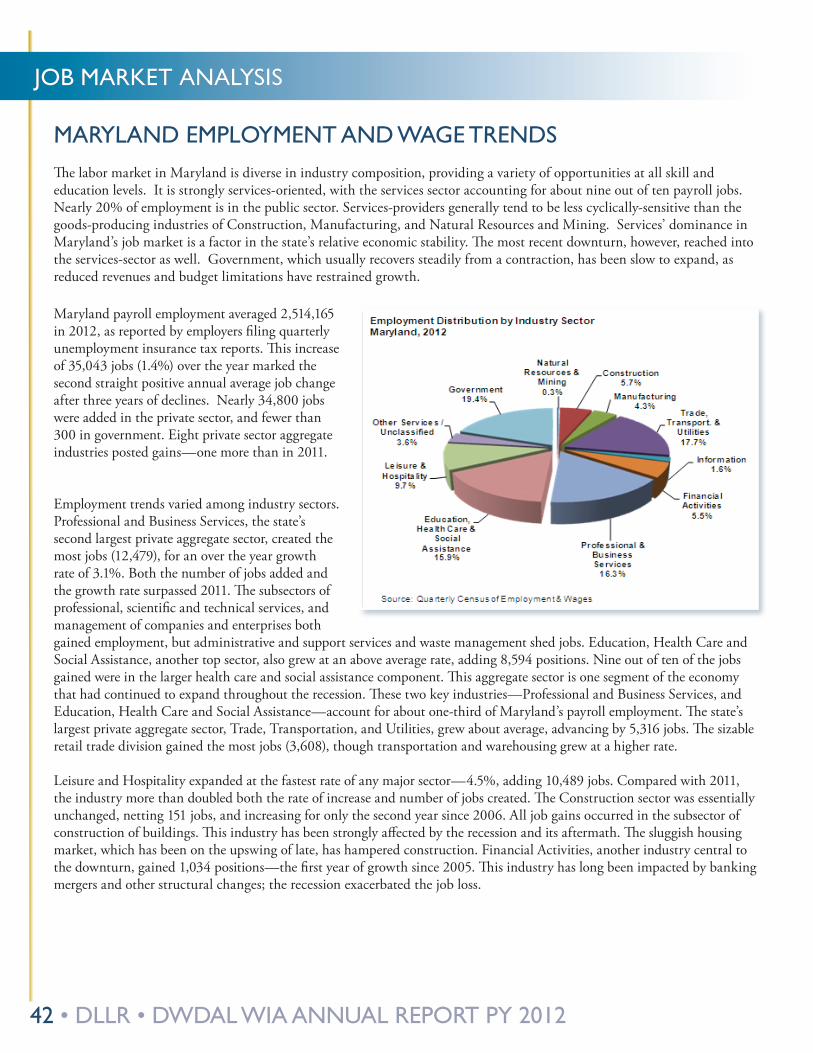
42 • DLLR • DWDAL WIA ANNUAL REPORT PY 2012
JOB MARkET ANALYSIS
MARYLAND EMPLOYMENT AND WAGE TRENDSThe labor market in Maryland is diverse in industry composition, providing a variety of opportunities at all skill and education levels. It is strongly services-oriented, with the services sector accounting for about nine out of ten payroll jobs. Nearly 20% of employment is in the public sector. Services-providers generally tend to be less cyclically-sensitive than the goods-producing industries of Construction, Manufacturing, and Natural Resources and Mining. Services’ dominance in Maryland’s job market is a factor in the state’s relative economic stability. The most recent downturn, however, reached into the services-sector as well. Government, which usually recovers steadily from a contraction, has been slow to expand, as reduced revenues and budget limitations have restrained growth.
Maryland payroll employment averaged 2,514,165 in 2012, as reported by employers filing quarterly unemployment insurance tax reports. This increase of 35,043 jobs (1.4%) over the year marked the second straight positive annual average job change after three years of declines. Nearly 34,800 jobs were added in the private sector, and fewer than 300 in government. Eight private sector aggregate industries posted gains—one more than in 2011.
Employment trends varied among industry sectors. Professional and Business Services, the state’s second largest private aggregate sector, created the most jobs (12,479), for an over the year growth rate of 3.1%. Both the number of jobs added and the growth rate surpassed 2011. The subsectors of professional, scientific and technical services, and management of companies and enterprises both gained employment, but administrative and support services and waste management shed jobs. Education, Health Care and Social Assistance, another top sector, also grew at an above average rate, adding 8,594 positions. Nine out of ten of the jobs gained were in the larger health care and social assistance component. This aggregate sector is one segment of the economy that had continued to expand throughout the recession. These two key industries—Professional and Business Services, and Education, Health Care and Social Assistance—account for about one-third of Maryland’s payroll employment. The state’s largest private aggregate sector, Trade, Transportation, and Utilities, grew about average, advancing by 5,316 jobs. The sizable retail trade division gained the most jobs (3,608), though transportation and warehousing grew at a higher rate.
Leisure and Hospitality expanded at the fastest rate of any major sector—4.5%, adding 10,489 jobs. Compared with 2011, the industry more than doubled both the rate of increase and number of jobs created. The Construction sector was essentially unchanged, netting 151 jobs, and increasing for only the second year since 2006. All job gains occurred in the subsector of construction of buildings. This industry has been strongly affected by the recession and its aftermath. The sluggish housing market, which has been on the upswing of late, has hampered construction. Financial Activities, another industry central to the downturn, gained 1,034 positions—the first year of growth since 2005. This industry has long been impacted by banking mergers and other structural changes; the recession exacerbated the job loss.
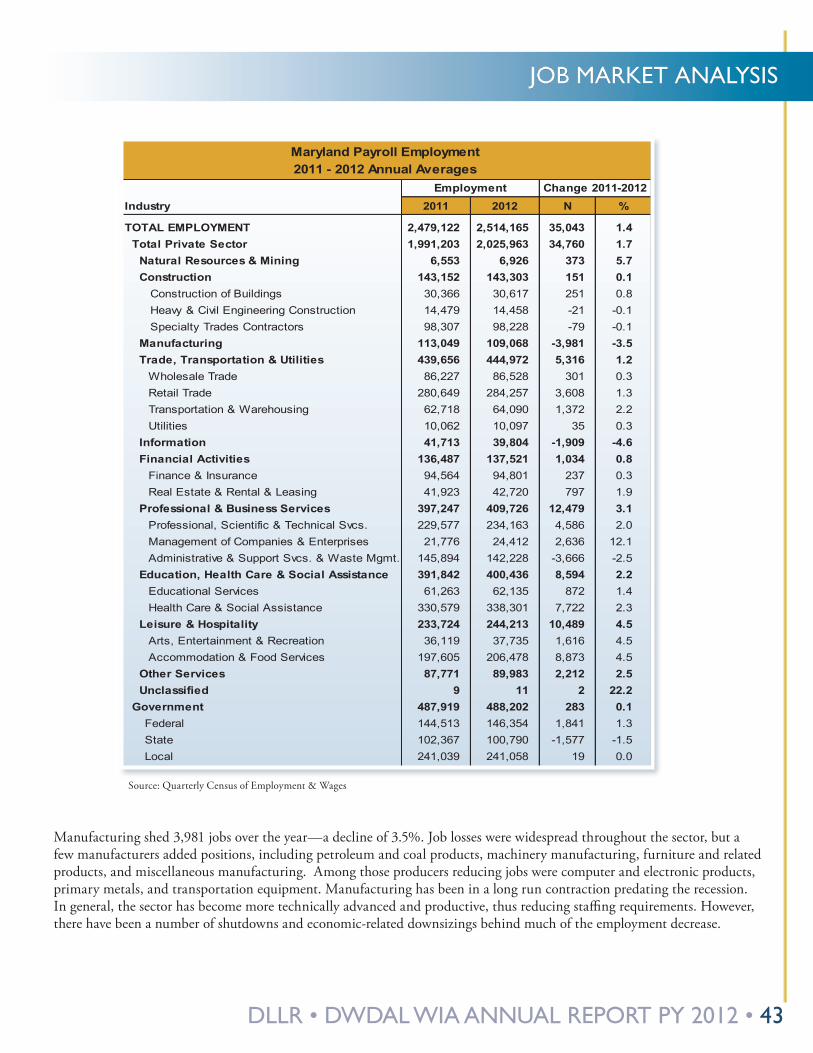
DLLR • DWDAL WIA ANNUAL REPORT PY 2012 • 43
JOB MARkET ANALYSIS
Manufacturing shed 3,981 jobs over the year—a decline of 3.5%. Job losses were widespread throughout the sector, but a few manufacturers added positions, including petroleum and coal products, machinery manufacturing, furniture and related products, and miscellaneous manufacturing. Among those producers reducing jobs were computer and electronic products, primary metals, and transportation equipment. Manufacturing has been in a long run contraction predating the recession. In general, the sector has become more technically advanced and productive, thus reducing staffing requirements. However, there have been a number of shutdowns and economic-related downsizings behind much of the employment decrease.
Source: Quarterly Census of Employment & Wages
Industry 2011 2012 N %
TOTAL EMPLOYMENT 2,479,122 2,514,165 35,043 1.4 Total Private Sector 1,991,203 2,025,963 34,760 1.7 Natural Resources & Mining 6,553 6,926 373 5.7 Construction 143,152 143,303 151 0.1 Construction of Buildings 30,366 30,617 251 0.8 Heavy & Civil Engineering Construction 14,479 14,458 -21 -0.1 Specialty Trades Contractors 98,307 98,228 -79 -0.1 Manufacturing 113,049 109,068 -3,981 -3.5 Trade, Transportation & Utilities 439,656 444,972 5,316 1.2
Wholesale Trade 86,227 86,528 301 0.3 Retail Trade 280,649 284,257 3,608 1.3 Transportation & Warehousing 62,718 64,090 1,372 2.2 Utilities 10,062 10,097 35 0.3
Information 41,713 39,804 -1,909 -4.6 Financial Activities 136,487 137,521 1,034 0.8
Finance & Insurance 94,564 94,801 237 0.3 Real Estate & Rental & Leasing 41,923 42,720 797 1.9
Professional & Business Services 397,247 409,726 12,479 3.1 Professional, Scientific & Technical Svcs. 229,577 234,163 4,586 2.0 Management of Companies & Enterprises 21,776 24,412 2,636 12.1 Administrative & Support Svcs. & Waste Mgmt. 145,894 142,228 -3,666 -2.5
Education, Health Care & Social Assistance 391,842 400,436 8,594 2.2 Educational Services 61,263 62,135 872 1.4 Health Care & Social Assistance 330,579 338,301 7,722 2.3
Leisure & Hospitality 233,724 244,213 10,489 4.5 Arts, Entertainment & Recreation 36,119 37,735 1,616 4.5 Accommodation & Food Services 197,605 206,478 8,873 4.5
Other Services 87,771 89,983 2,212 2.5 Unclassified 9 11 2 22.2 Government 487,919 488,202 283 0.1
Federal 144,513 146,354 1,841 1.3 State 102,367 100,790 -1,577 -1.5 Local 241,039 241,058 19 0.0
Source: Quarterly Census of Employment & Wages
Maryland Payroll Employment2011 - 2012 Annual Averages
Employment Change 2011-2012
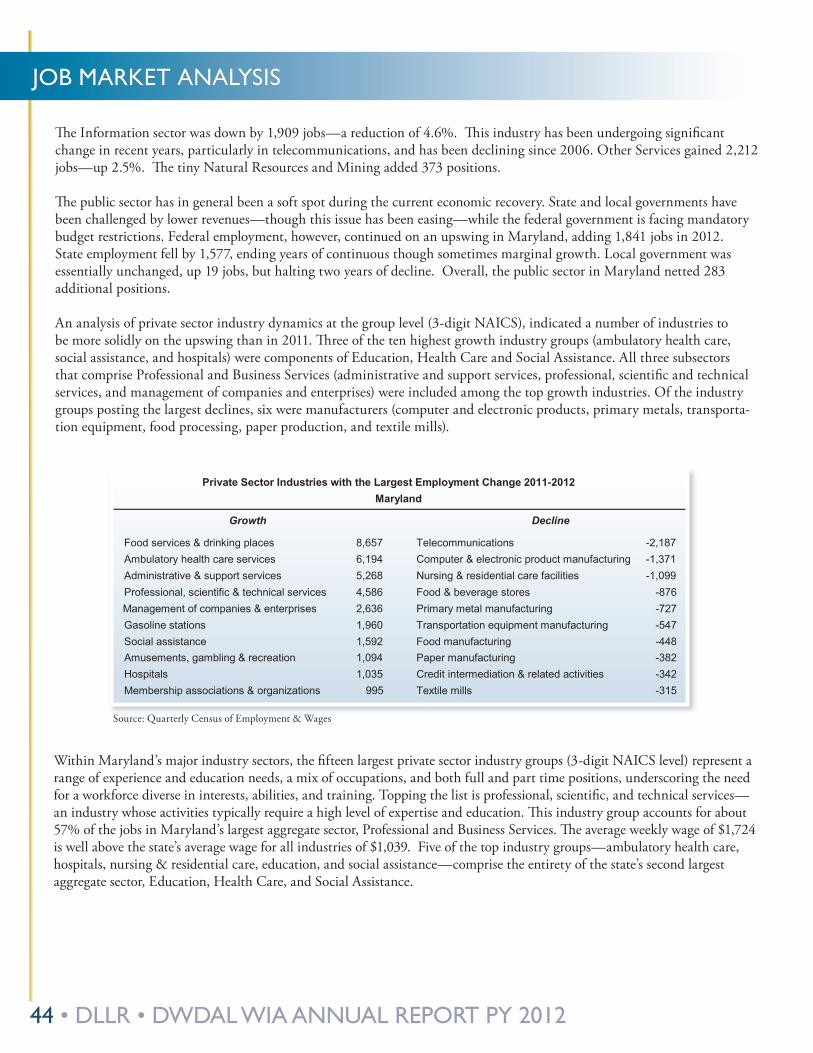
44 • DLLR • DWDAL WIA ANNUAL REPORT PY 2012
JOB MARkET ANALYSIS
The Information sector was down by 1,909 jobs—a reduction of 4.6%. This industry has been undergoing significant change in recent years, particularly in telecommunications, and has been declining since 2006. Other Services gained 2,212 jobs—up 2.5%. The tiny Natural Resources and Mining added 373 positions.
The public sector has in general been a soft spot during the current economic recovery. State and local governments have been challenged by lower revenues—though this issue has been easing—while the federal government is facing mandatory budget restrictions. Federal employment, however, continued on an upswing in Maryland, adding 1,841 jobs in 2012. State employment fell by 1,577, ending years of continuous though sometimes marginal growth. Local government was essentially unchanged, up 19 jobs, but halting two years of decline. Overall, the public sector in Maryland netted 283 additional positions.
An analysis of private sector industry dynamics at the group level (3-digit NAICS), indicated a number of industries to be more solidly on the upswing than in 2011. Three of the ten highest growth industry groups (ambulatory health care, social assistance, and hospitals) were components of Education, Health Care and Social Assistance. All three subsectors that comprise Professional and Business Services (administrative and support services, professional, scientific and technical services, and management of companies and enterprises) were included among the top growth industries. Of the industry groups posting the largest declines, six were manufacturers (computer and electronic products, primary metals, transporta-tion equipment, food processing, paper production, and textile mills).
Source: Quarterly Census of Employment & Wages
Growth Decline Food services & drinking places 8,657 Telecommunications -2,187 Ambulatory health care services 6,194 Computer & electronic product manufacturing -1,371 Administrative & support services 5,268 Nursing & residential care facilities -1,099 Professional, scientific & technical services 4,586 Food & beverage stores -876
Management of companies & enterprises 2,636 Primary metal manufacturing -727 Gasoline stations 1,960 Transportation equipment manufacturing -547 Social assistance 1,592 Food manufacturing -448 Amusements, gambling & recreation 1,094 Paper manufacturing -382 Hospitals 1,035 Credit intermediation & related activities -342 Membership associations & organizations 995 Textile mills -315
Source: Quarterly Census of Employment & Wages
Private Sector Industries with the Largest Employment Change 2011-2012 Maryland
Within Maryland’s major industry sectors, the fifteen largest private sector industry groups (3-digit NAICS level) represent a range of experience and education needs, a mix of occupations, and both full and part time positions, underscoring the need for a workforce diverse in interests, abilities, and training. Topping the list is professional, scientific, and technical services—an industry whose activities typically require a high level of expertise and education. This industry group accounts for about 57% of the jobs in Maryland’s largest aggregate sector, Professional and Business Services. The average weekly wage of $1,724 is well above the state’s average wage for all industries of $1,039. Five of the top industry groups—ambulatory health care, hospitals, nursing & residential care, education, and social assistance—comprise the entirety of the state’s second largest aggregate sector, Education, Health Care, and Social Assistance.
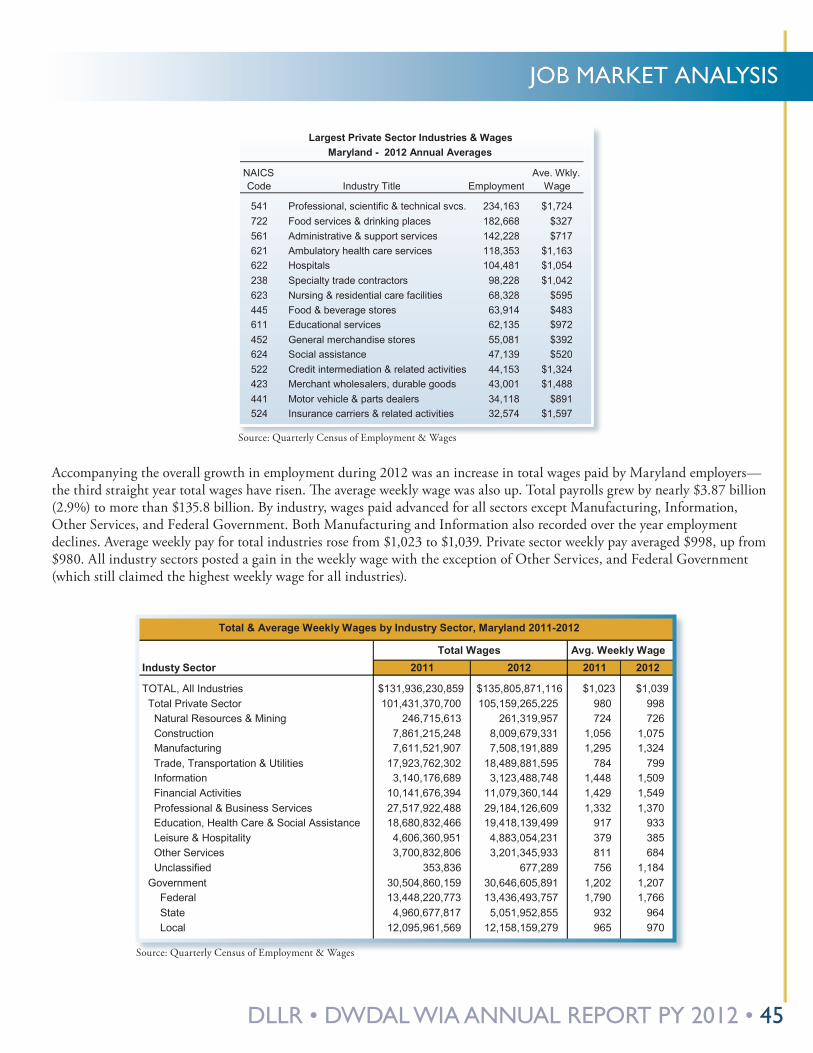
DLLR • DWDAL WIA ANNUAL REPORT PY 2012 • 45
JOB MARkET ANALYSIS
Accompanying the overall growth in employment during 2012 was an increase in total wages paid by Maryland employers—the third straight year total wages have risen. The average weekly wage was also up. Total payrolls grew by nearly $3.87 billion (2.9%) to more than $135.8 billion. By industry, wages paid advanced for all sectors except Manufacturing, Information, Other Services, and Federal Government. Both Manufacturing and Information also recorded over the year employment declines. Average weekly pay for total industries rose from $1,023 to $1,039. Private sector weekly pay averaged $998, up from $980. All industry sectors posted a gain in the weekly wage with the exception of Other Services, and Federal Government (which still claimed the highest weekly wage for all industries).
NAICS Code Industry Title Employment
Ave. Wkly. Wage
541 Professional, scientific & technical svcs. 234,163 $1,724 722 Food services & drinking places 182,668 $327 561 Administrative & support services 142,228 $717 621 Ambulatory health care services 118,353 $1,163 622 Hospitals 104,481 $1,054 238 Specialty trade contractors 98,228 $1,042 623 Nursing & residential care facilities 68,328 $595 445 Food & beverage stores 63,914 $483 611 Educational services 62,135 $972 452 General merchandise stores 55,081 $392 624 Social assistance 47,139 $520 522 Credit intermediation & related activities 44,153 $1,324 423 Merchant wholesalers, durable goods 43,001 $1,488 441 Motor vehicle & parts dealers 34,118 $891 524 Insurance carriers & related activities 32,574 $1,597
Source: Quarterly Census of Employment & Wages
Largest Private Sector Industries & Wages Maryland - 2012 Annual Averages
Source: Quarterly Census of Employment & Wages
Source: Quarterly Census of Employment & Wages
Industy Sector 2011 2012 2011 2012 TOTAL, All Industries $131,936,230,859 $135,805,871,116 $1,023 $1,039
Total Private Sector 101,431,370,700 105,159,265,225 980 998 Natural Resources & Mining 246,715,613 261,319,957 724 726 Construction 7,861,215,248 8,009,679,331 1,056 1,075 Manufacturing 7,611,521,907 7,508,191,889 1,295 1,324 Trade, Transportation & Utilities 17,923,762,302 18,489,881,595 784 799 Information 3,140,176,689 3,123,488,748 1,448 1,509 Financial Activities 10,141,676,394 11,079,360,144 1,429 1,549 Professional & Business Services 27,517,922,488 29,184,126,609 1,332 1,370 Education, Health Care & Social Assistance 18,680,832,466 19,418,139,499 917 933 Leisure & Hospitality 4,606,360,951 4,883,054,231 379 385 Other Services 3,700,832,806 3,201,345,933 811 684 Unclassified 353,836 677,289 756 1,184
Government 30,504,860,159 30,646,605,891 1,202 1,207 Federal 13,448,220,773 13,436,493,757 1,790 1,766 State 4,960,677,817 5,051,952,855 932 964 Local 12,095,961,569 12,158,159,279 965 970
Source: Quarterly Census of Employment & Wages
Total & Average Weekly Wages by Industry Sector, Maryland 2011-2012 Total Wages Avg. Weekly Wage
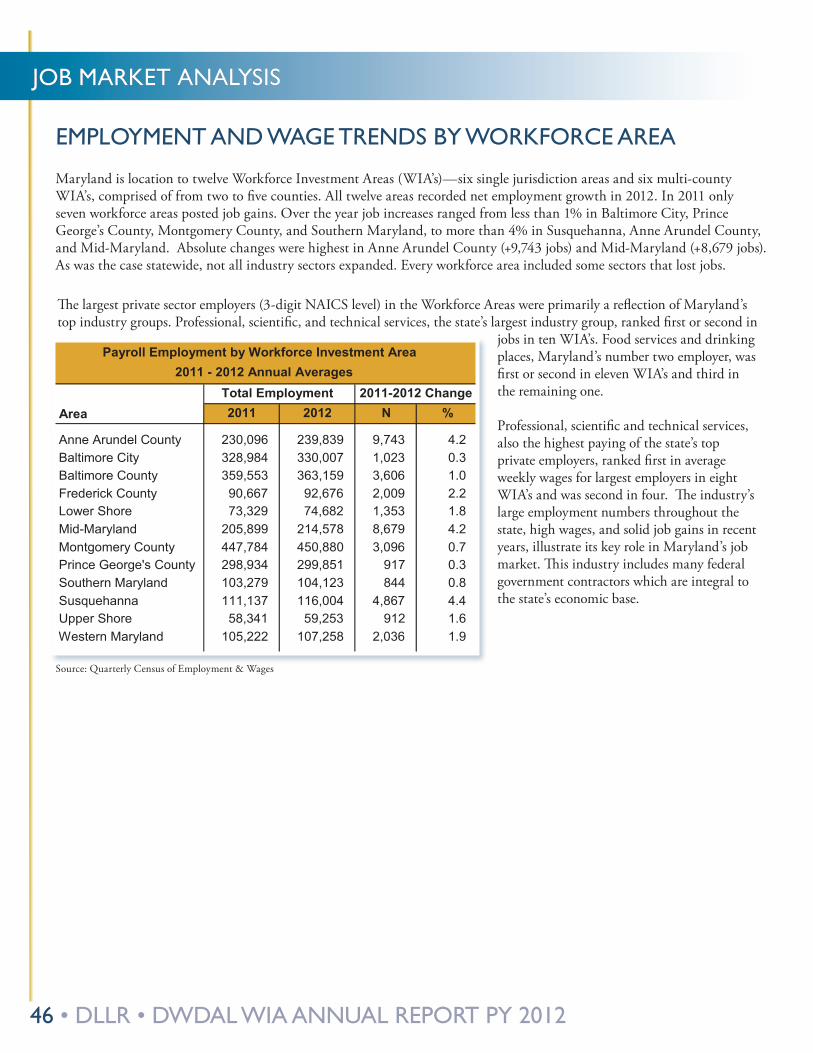
46 • DLLR • DWDAL WIA ANNUAL REPORT PY 2012
JOB MARkET ANALYSIS
EMPLOYMENT AND WAGE TRENDS BY WORkFORCE AREA
Maryland is location to twelve Workforce Investment Areas (WIA’s)—six single jurisdiction areas and six multi-county WIA’s, comprised of from two to five counties. All twelve areas recorded net employment growth in 2012. In 2011 only seven workforce areas posted job gains. Over the year job increases ranged from less than 1% in Baltimore City, Prince George’s County, Montgomery County, and Southern Maryland, to more than 4% in Susquehanna, Anne Arundel County, and Mid-Maryland. Absolute changes were highest in Anne Arundel County (+9,743 jobs) and Mid-Maryland (+8,679 jobs). As was the case statewide, not all industry sectors expanded. Every workforce area included some sectors that lost jobs.
Area 2011 2012 N %
Anne Arundel County 230,096 239,839 9,743 4.2 Baltimore City 328,984 330,007 1,023 0.3 Baltimore County 359,553 363,159 3,606 1.0
Frederick County 90,667 92,676 2,009 2.2 Lower Shore 73,329 74,682 1,353 1.8 Mid-Maryland 205,899 214,578 8,679 4.2 Montgomery County 447,784 450,880 3,096 0.7 Prince George's County 298,934 299,851 917 0.3 Southern Maryland 103,279 104,123 844 0.8 Susquehanna 111,137 116,004 4,867 4.4 Upper Shore 58,341 59,253 912 1.6 Western Maryland 105,222 107,258 2,036 1.9
Source: Quarterly Census of Employment & Wages
Payroll Employment by Workforce Investment Area
2011 - 2012 Annual Averages
Total Employment 2011-2012 Change
The largest private sector employers (3-digit NAICS level) in the Workforce Areas were primarily a reflection of Maryland’s top industry groups. Professional, scientific, and technical services, the state’s largest industry group, ranked first or second in
jobs in ten WIA’s. Food services and drinking places, Maryland’s number two employer, was first or second in eleven WIA’s and third in the remaining one.
Professional, scientific and technical services, also the highest paying of the state’s top private employers, ranked first in average weekly wages for largest employers in eight WIA’s and was second in four. The industry’s large employment numbers throughout the state, high wages, and solid job gains in recent years, illustrate its key role in Maryland’s job market. This industry includes many federal government contractors which are integral to the state’s economic base.
Source: Quarterly Census of Employment & Wages
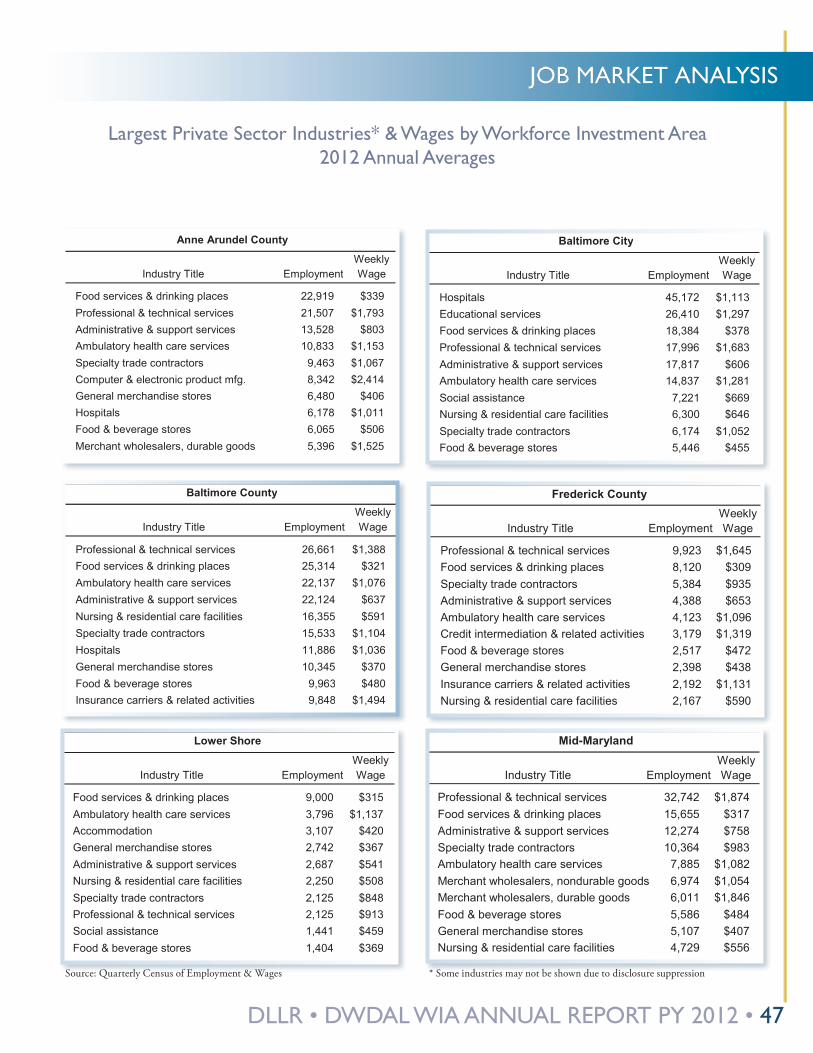
DLLR • DWDAL WIA ANNUAL REPORT PY 2012 • 47
JOB MARkET ANALYSIS
Largest Private Sector Industries* & Wages by Workforce Investment Area 2012 Annual Averages
Industry Title Employment
Food services & drinking places 22,919 $339 Professional & technical services 21,507 $1,793 Administrative & support services 13,528 $803 Ambulatory health care services 10,833 $1,153 Specialty trade contractors 9,463 $1,067 Computer & electronic product mfg. 8,342 $2,414 General merchandise stores 6,480 $406 Hospitals 6,178 $1,011 Food & beverage stores 6,065 $506 Merchant wholesalers, durable goods 5,396 $1,525
Anne Arundel County
Weekly Wage
Industry Title Employment
Professional & technical services 26,661 $1,388 Food services & drinking places 25,314 $321 Ambulatory health care services 22,137 $1,076 Administrative & support services 22,124 $637 Nursing & residential care facilities 16,355 $591 Specialty trade contractors 15,533 $1,104 Hospitals 11,886 $1,036 General merchandise stores 10,345 $370 Food & beverage stores 9,963 $480 Insurance carriers & related activities 9,848 $1,494
Baltimore County
Weekly Wage
Industry Title Employment
Food services & drinking places 9,000 $315 Ambulatory health care services 3,796 $1,137 Accommodation 3,107 $420 General merchandise stores 2,742 $367 Administrative & support services 2,687 $541 Nursing & residential care facilities 2,250 $508 Specialty trade contractors 2,125 $848 Professional & technical services 2,125 $913 Social assistance 1,441 $459 Food & beverage stores 1,404 $369
Lower Shore Weekly Wage
Industry Title Employment
Professional & technical services 9,923 $1,645 Food services & drinking places 8,120 $309 Specialty trade contractors 5,384 $935 Administrative & support services 4,388 $653 Ambulatory health care services 4,123 $1,096 Credit intermediation & related activities 3,179 $1,319 Food & beverage stores 2,517 $472 General merchandise stores 2,398 $438 Insurance carriers & related activities 2,192 $1,131 Nursing & residential care facilities 2,167 $590
Frederick County Weekly Wage
Industry Title Employment Professional & technical services 32,742 $1,874 Food services & drinking places 15,655 $317 Administrative & support services 12,274 $758 Specialty trade contractors 10,364 $983 Ambulatory health care services 7,885 $1,082 Merchant wholesalers, nondurable goods 6,974 $1,054 Merchant wholesalers, durable goods 6,011 $1,846 Food & beverage stores 5,586 $484 General merchandise stores 5,107 $407 Nursing & residential care facilities 4,729 $556
Mid-Maryland Weekly Wage
Industry Title Employment
Hospitals 45,172 $1,113 Educational services 26,410 $1,297 Food services & drinking places 18,384 $378 Professional & technical services 17,996 $1,683 Administrative & support services 17,817 $606 Ambulatory health care services 14,837 $1,281 Social assistance 7,221 $669 Nursing & residential care facilities 6,300 $646 Specialty trade contractors 6,174 $1,052 Food & beverage stores 5,446 $455
Baltimore City
Weekly Wage
* Some industries may not be shown due to disclosure suppressionSource: Quarterly Census of Employment & Wages
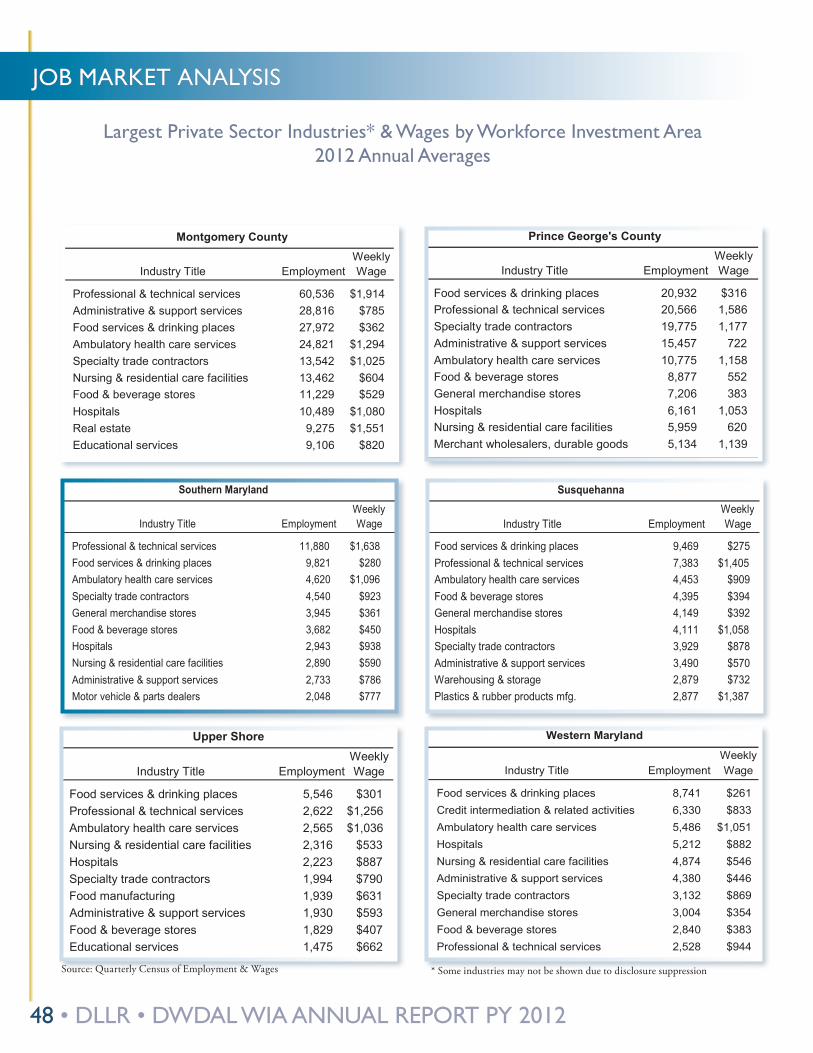
48 • DLLR • DWDAL WIA ANNUAL REPORT PY 2012
JOB MARkET ANALYSIS
Largest Private Sector Industries* & Wages by Workforce Investment Area 2012 Annual Averages
Industry Title Employment
Professional & technical services 60,536 $1,914 Administrative & support services 28,816 $785 Food services & drinking places 27,972 $362 Ambulatory health care services 24,821 $1,294 Specialty trade contractors 13,542 $1,025 Nursing & residential care facilities 13,462 $604 Food & beverage stores 11,229 $529 Hospitals 10,489 $1,080 Real estate 9,275 $1,551 Educational services 9,106 $820
Montgomery County Weekly Wage
Industry Title Employment
Professional & technical services 11,880 $1,638 Food services & drinking places 9,821 $280 Ambulatory health care services 4,620 $1,096 Specialty trade contractors 4,540 $923 General merchandise stores 3,945 $361 Food & beverage stores 3,682 $450 Hospitals 2,943 $938 Nursing & residential care facilities 2,890 $590 Administrative & support services 2,733 $786 Motor vehicle & parts dealers 2,048 $777
Southern Maryland Weekly Wage
Industry Title Employment
Food services & drinking places 5,546 $301 Professional & technical services 2,622 $1,256 Ambulatory health care services 2,565 $1,036 Nursing & residential care facilities 2,316 $533 Hospitals 2,223 $887 Specialty trade contractors 1,994 $790 Food manufacturing 1,939 $631 Administrative & support services 1,930 $593 Food & beverage stores 1,829 $407Educational services 1,475 $662
Upper Shore
Weekly Wage
Industry Title Employment
Food services & drinking places 9,469 $275Professional & technical services 7,383 $1,405Ambulatory health care services 4,453 $909Food & beverage stores 4,395 $394General merchandise stores 4,149 $392Hospitals 4,111 $1,058Specialty trade contractors 3,929 $878Administrative & support services 3,490 $570Warehousing & storage 2,879 $732Plastics & rubber products mfg. 2,877 $1,387
Susquehanna Weekly Wage
Industry Title Employment
Food services & drinking places 8,741 $261 Credit intermediation & related activities 6,330 $833 Ambulatory health care services 5,486 $1,051 Hospitals 5,212 $882Nursing & residential care facilities 4,874 $546Administrative & support services 4,380 $446Specialty trade contractors 3,132 $869General merchandise stores 3,004 $354Food & beverage stores 2,840 $383Professional & technical services 2,528 $944
Western Maryland
Weekly Wage
Industry Title Employment
Food services & drinking places 20,932 $316 Professional & technical services 20,566 1,586 Specialty trade contractors 19,775 1,177 Administrative & support services 15,457 722 Ambulatory health care services 10,775 1,158 Food & beverage stores 8,877 552 General merchandise stores 7,206 383 Hospitals 6,161 1,053 Nursing & residential care facilities 5,959 620 Merchant wholesalers, durable goods 5,134 1,139
Prince George's County Weekly Wage
* Some industries may not be shown due to disclosure suppressionSource: Quarterly Census of Employment & Wages
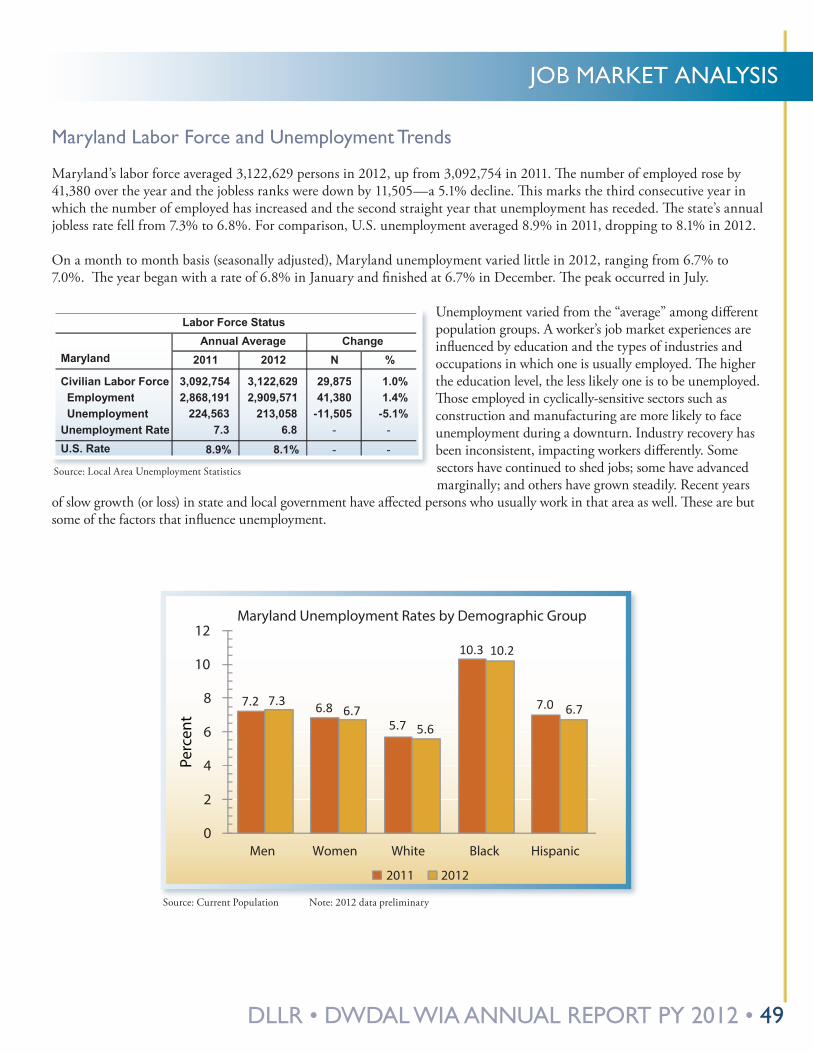
DLLR • DWDAL WIA ANNUAL REPORT PY 2012 • 49
JOB MARkET ANALYSIS
Maryland Labor Force and Unemployment Trends
Maryland’s labor force averaged 3,122,629 persons in 2012, up from 3,092,754 in 2011. The number of employed rose by 41,380 over the year and the jobless ranks were down by 11,505—a 5.1% decline. This marks the third consecutive year in which the number of employed has increased and the second straight year that unemployment has receded. The state’s annual jobless rate fell from 7.3% to 6.8%. For comparison, U.S. unemployment averaged 8.9% in 2011, dropping to 8.1% in 2012.
On a month to month basis (seasonally adjusted), Maryland unemployment varied little in 2012, ranging from 6.7% to 7.0%. The year began with a rate of 6.8% in January and finished at 6.7% in December. The peak occurred in July.
Maryland 2011 2012 N %
Civilian Labor Force 3,092,754 3,122,629 29,875 1.0% Employment 2,868,191 2,909,571 41,380 1.4% Unemployment 224,563 213,058 -11,505 -5.1% Unemployment Rate 7.3 6.8 - - U.S. Rate 8.9% 8.1% - -
Source: Local Area Unemployment Statistics & Current Population Survey
Labor Force Status
Annual Average Change
Unemployment varied from the “average” among different population groups. A worker’s job market experiences are influenced by education and the types of industries and occupations in which one is usually employed. The higher the education level, the less likely one is to be unemployed. Those employed in cyclically-sensitive sectors such as construction and manufacturing are more likely to face unemployment during a downturn. Industry recovery has been inconsistent, impacting workers differently. Some sectors have continued to shed jobs; some have advanced marginally; and others have grown steadily. Recent years
of slow growth (or loss) in state and local government have affected persons who usually work in that area as well. These are but some of the factors that influence unemployment.
Source: Local Area Unemployment Statistics
Source: Current Population Note: 2012 data preliminary
7.2 6.8 5.7
10.3
7.0 7.3 6.7
5.6
10.2
6.7
0
2
4
6
8
10
12
Men Women White Black Hispanic
Maryland Unemployment Rates by Demographic Group
2011 2012
Source: Current Population Survey Note: 2012 data preliminary
Perc
ent
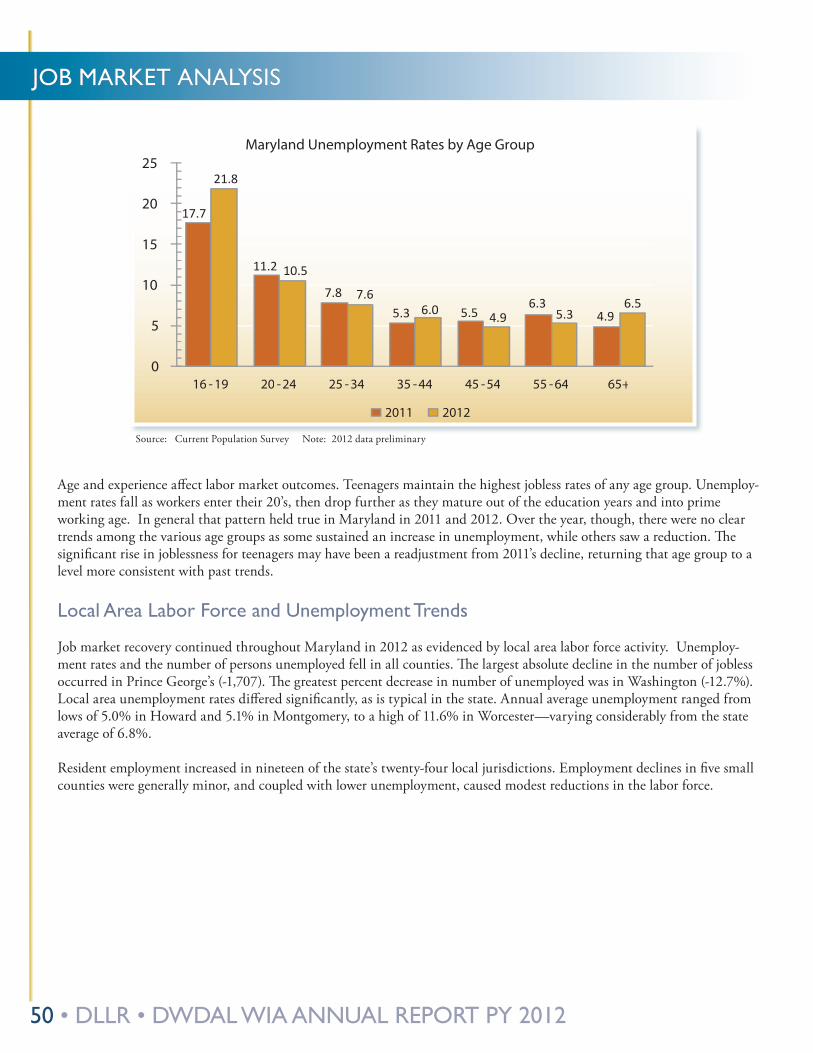
50 • DLLR • DWDAL WIA ANNUAL REPORT PY 2012
JOB MARkET ANALYSIS
Age and experience affect labor market outcomes. Teenagers maintain the highest jobless rates of any age group. Unemploy-ment rates fall as workers enter their 20’s, then drop further as they mature out of the education years and into prime working age. In general that pattern held true in Maryland in 2011 and 2012. Over the year, though, there were no clear trends among the various age groups as some sustained an increase in unemployment, while others saw a reduction. The significant rise in joblessness for teenagers may have been a readjustment from 2011’s decline, returning that age group to a level more consistent with past trends.
Local Area Labor Force and Unemployment Trends
Job market recovery continued throughout Maryland in 2012 as evidenced by local area labor force activity. Unemploy-ment rates and the number of persons unemployed fell in all counties. The largest absolute decline in the number of jobless occurred in Prince George’s (-1,707). The greatest percent decrease in number of unemployed was in Washington (-12.7%). Local area unemployment rates differed significantly, as is typical in the state. Annual average unemployment ranged from lows of 5.0% in Howard and 5.1% in Montgomery, to a high of 11.6% in Worcester—varying considerably from the state average of 6.8%.
Resident employment increased in nineteen of the state’s twenty-four local jurisdictions. Employment declines in five small counties were generally minor, and coupled with lower unemployment, caused modest reductions in the labor force.
17.7
11.2
7.8 5.3 5.5 6.3
4.9
21.8
10.5 7.6
6.0 4.9 5.3 6.5
0
5
10
15
20
25
16 - 19 20 - 24 25 - 34 35 - 44 45 - 54 55 - 64 65+
Maryland Unemployment Rates by Age Group
2011 2012 Source: Current Population Survey Note: 2012 data preliminary Source: Current Population Survey Note: 2012 data preliminary
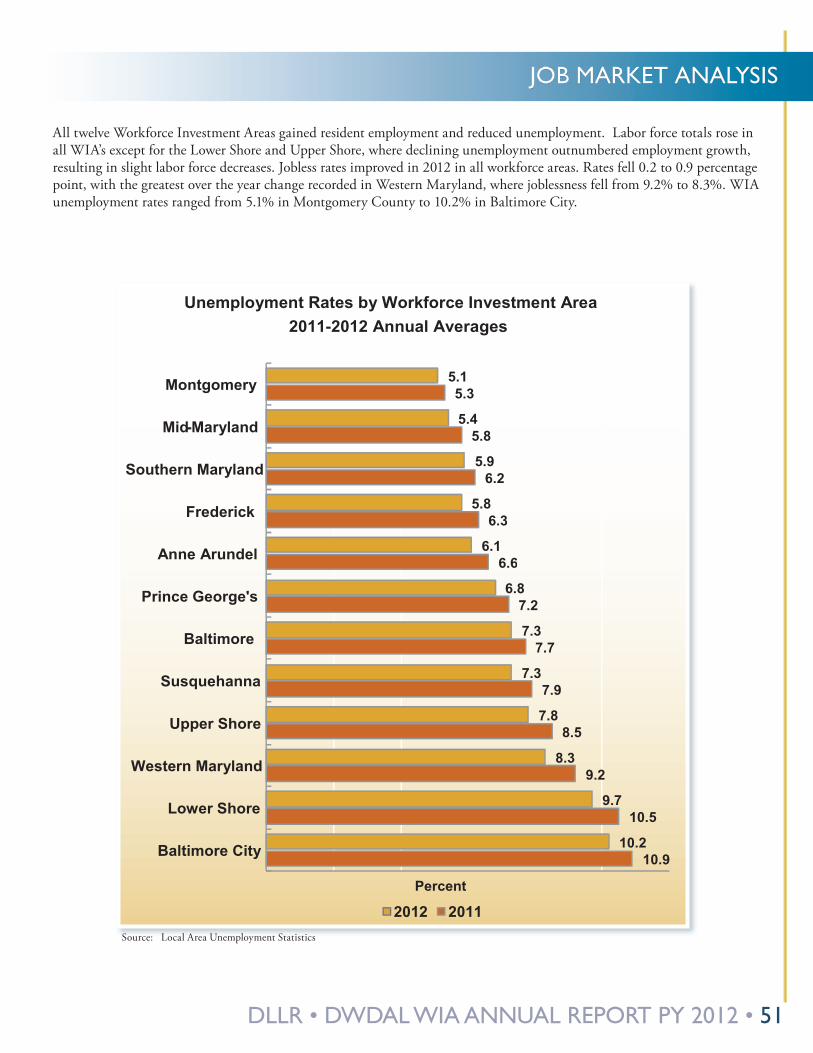
DLLR • DWDAL WIA ANNUAL REPORT PY 2012 • 51
JOB MARkET ANALYSIS
All twelve Workforce Investment Areas gained resident employment and reduced unemployment. Labor force totals rose in all WIA’s except for the Lower Shore and Upper Shore, where declining unemployment outnumbered employment growth, resulting in slight labor force decreases. Jobless rates improved in 2012 in all workforce areas. Rates fell 0.2 to 0.9 percentage point, with the greatest over the year change recorded in Western Maryland, where joblessness fell from 9.2% to 8.3%. WIA unemployment rates ranged from 5.1% in Montgomery County to 10.2% in Baltimore City.
10.9
10.5
9.2
8.5
7.9
7.7
7.2
6.6
6.3
6.2
5.8
5.3
10.2
9.7
8.3
7.8
7.3
7.3
6.8
6.1
5.8
5.9
5.4
5.1
Baltimore City
Lower Shore
Western Maryland
Upper Shore
Susquehanna
Baltimore
Prince George's
Anne Arundel
Frederick
Southern Maryland
Mid - Maryland
Montgomery
Percent
Unemployment Rates by Workforce Investment Area 2011-2012 Annual Averages
2012 2011
Source: Local Area Unemployment Statistics Source: Local Area Unemployment Statistics
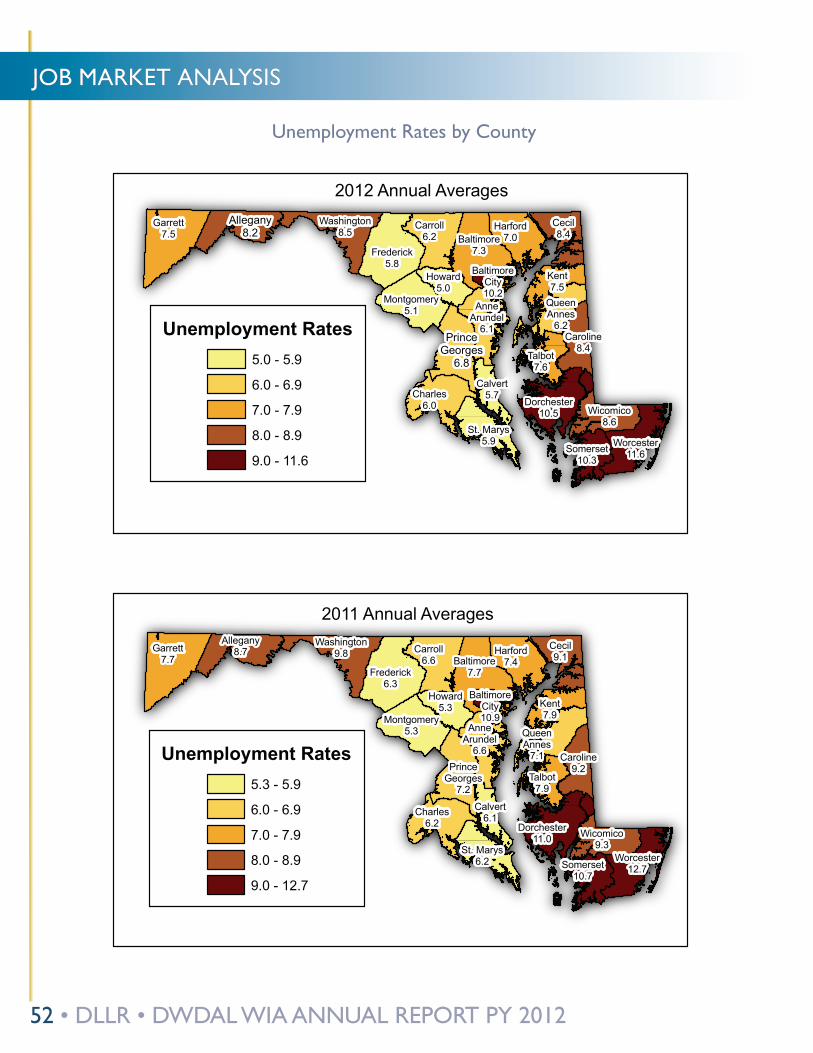
52 • DLLR • DWDAL WIA ANNUAL REPORT PY 2012
JOB MARkET ANALYSIS
2012 Annual AveragesAllegany
8.2
AnneArundel
6.1
BaltimoreCity10.2
Baltimore7.3
Calvert5.7
Caroline8.4
Carroll6.2
Cecil8.4
Charles6.0 Dorchester
10.5
Frederick5.8
Garrett7.5
Harford7.0
Howard5.0
Kent7.5
Montgomery5.1
PrinceGeorges
6.8
QueenAnnes
6.2
Somerset10.3
St. Marys5.9
Talbot7.6
Washington8.5
Wicomico8.6
Worcester11.6
2011 Annual AveragesAllegany
8.7
AnneArundel
6.6
BaltimoreCity10.9
Baltimore7.7
Calvert6.1
Caroline9.2
Carroll6.6
Cecil9.1
Charles6.2 Dorchester
11.0
Frederick6.3
Garrett7.7
Harford7.4
Howard5.3 Kent
7.9Montgomery5.3
PrinceGeorges
7.2
QueenAnnes
7.1
Somerset10.7
St. Marys6.2
Talbot7.9
Washington9.8
Wicomico9.3
Worcester12.7
Unemployment Rates5.0 - 5.9
6.0 - 6.9
7.0 - 7.9
8.0 - 8.9
9.0 - 11.6
Unemployment Rates5.3 - 5.9
6.0 - 6.9
7.0 - 7.9
8.0 - 8.9
9.0 - 12.7
Unemployment Rates by County
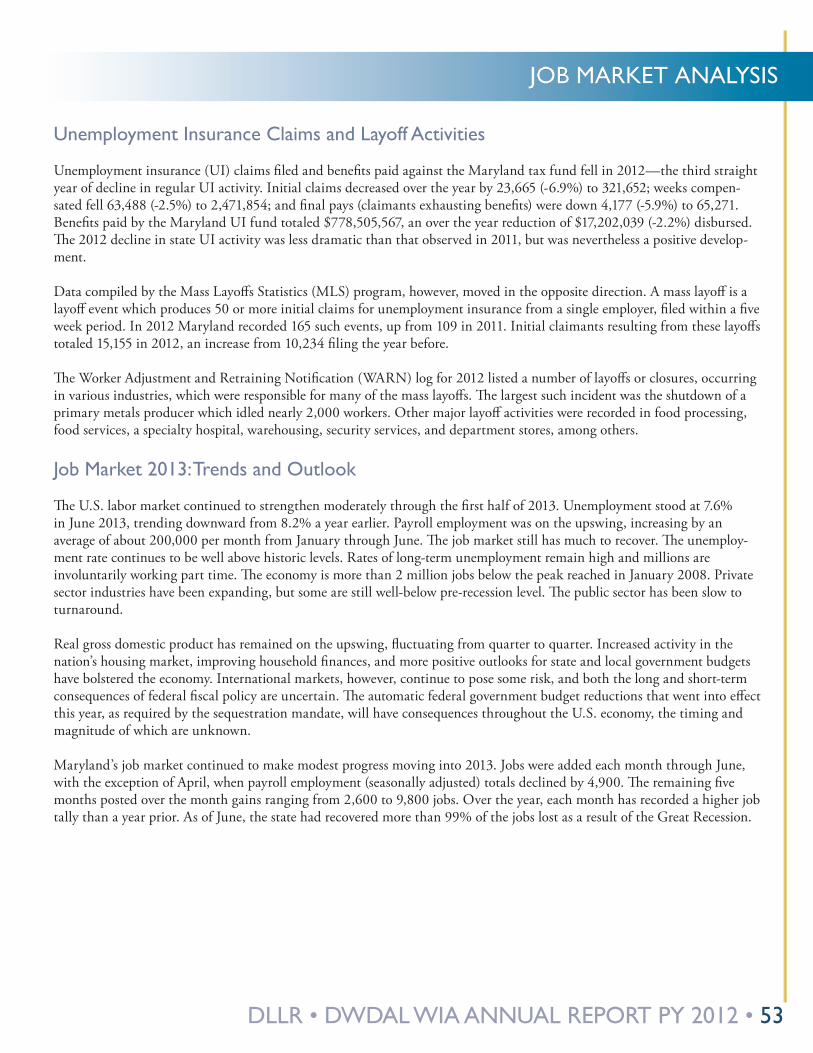
DLLR • DWDAL WIA ANNUAL REPORT PY 2012 • 53
JOB MARkET ANALYSIS
Unemployment Insurance Claims and Layoff Activities
Unemployment insurance (UI) claims filed and benefits paid against the Maryland tax fund fell in 2012—the third straight year of decline in regular UI activity. Initial claims decreased over the year by 23,665 (-6.9%) to 321,652; weeks compen-sated fell 63,488 (-2.5%) to 2,471,854; and final pays (claimants exhausting benefits) were down 4,177 (-5.9%) to 65,271. Benefits paid by the Maryland UI fund totaled $778,505,567, an over the year reduction of $17,202,039 (-2.2%) disbursed. The 2012 decline in state UI activity was less dramatic than that observed in 2011, but was nevertheless a positive develop-ment.
Data compiled by the Mass Layoffs Statistics (MLS) program, however, moved in the opposite direction. A mass layoff is a layoff event which produces 50 or more initial claims for unemployment insurance from a single employer, filed within a five week period. In 2012 Maryland recorded 165 such events, up from 109 in 2011. Initial claimants resulting from these layoffs totaled 15,155 in 2012, an increase from 10,234 filing the year before.
The Worker Adjustment and Retraining Notification (WARN) log for 2012 listed a number of layoffs or closures, occurring in various industries, which were responsible for many of the mass layoffs. The largest such incident was the shutdown of a primary metals producer which idled nearly 2,000 workers. Other major layoff activities were recorded in food processing, food services, a specialty hospital, warehousing, security services, and department stores, among others.
Job Market 2013: Trends and Outlook
The U.S. labor market continued to strengthen moderately through the first half of 2013. Unemployment stood at 7.6% in June 2013, trending downward from 8.2% a year earlier. Payroll employment was on the upswing, increasing by an average of about 200,000 per month from January through June. The job market still has much to recover. The unemploy-ment rate continues to be well above historic levels. Rates of long-term unemployment remain high and millions are involuntarily working part time. The economy is more than 2 million jobs below the peak reached in January 2008. Private sector industries have been expanding, but some are still well-below pre-recession level. The public sector has been slow to turnaround.
Real gross domestic product has remained on the upswing, fluctuating from quarter to quarter. Increased activity in the nation’s housing market, improving household finances, and more positive outlooks for state and local government budgets have bolstered the economy. International markets, however, continue to pose some risk, and both the long and short-term consequences of federal fiscal policy are uncertain. The automatic federal government budget reductions that went into effect this year, as required by the sequestration mandate, will have consequences throughout the U.S. economy, the timing and magnitude of which are unknown.
Maryland’s job market continued to make modest progress moving into 2013. Jobs were added each month through June, with the exception of April, when payroll employment (seasonally adjusted) totals declined by 4,900. The remaining five months posted over the month gains ranging from 2,600 to 9,800 jobs. Over the year, each month has recorded a higher job tally than a year prior. As of June, the state had recovered more than 99% of the jobs lost as a result of the Great Recession.
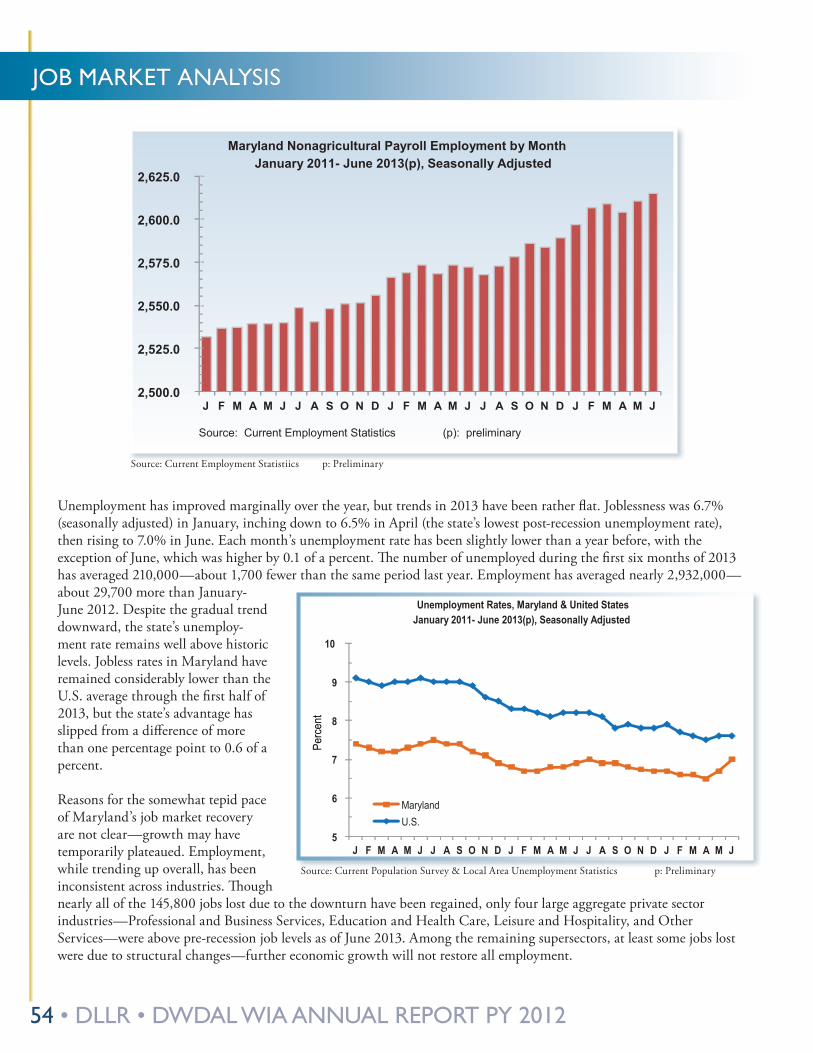
54 • DLLR • DWDAL WIA ANNUAL REPORT PY 2012
JOB MARkET ANALYSIS
Unemployment has improved marginally over the year, but trends in 2013 have been rather flat. Joblessness was 6.7% (seasonally adjusted) in January, inching down to 6.5% in April (the state’s lowest post-recession unemployment rate), then rising to 7.0% in June. Each month’s unemployment rate has been slightly lower than a year before, with the exception of June, which was higher by 0.1 of a percent. The number of unemployed during the first six months of 2013 has averaged 210,000—about 1,700 fewer than the same period last year. Employment has averaged nearly 2,932,000—about 29,700 more than January-June 2012. Despite the gradual trend downward, the state’s unemploy-ment rate remains well above historic levels. Jobless rates in Maryland have remained considerably lower than the U.S. average through the first half of 2013, but the state’s advantage has slipped from a difference of more than one percentage point to 0.6 of a percent.
Reasons for the somewhat tepid pace of Maryland’s job market recovery are not clear—growth may have temporarily plateaued. Employment, while trending up overall, has been inconsistent across industries. Though nearly all of the 145,800 jobs lost due to the downturn have been regained, only four large aggregate private sector industries—Professional and Business Services, Education and Health Care, Leisure and Hospitality, and Other Services—were above pre-recession job levels as of June 2013. Among the remaining supersectors, at least some jobs lost were due to structural changes—further economic growth will not restore all employment.
2,500.0
2,525.0
2,550.0
2,575.0
2,600.0
2,625.0
J F M A M J J A S O N D J F M A M J J A S O N D J F M A M J
Maryland Nonagricultural Payroll Employment by Month January 2011- June 2013(p), Seasonally Adjusted
Source: Current Employment Statistics (p): preliminary
Source: Current Employment Statistiics p: Preliminary
Source: Current Population Survey & Local Area Unemployment Statistics p: Preliminary
5
6
7
8
9
10
J F M A M J J A S O N D J F M A M J J A S O N D J F M A M J
Unemployment Rates, Maryland & United States January 2011- June 2013(p), Seasonally Adjusted
Maryland U.S.
Perc
ent
Source: Current Popluation Survey & Local Area Unemployment Statistics (p): preliminary
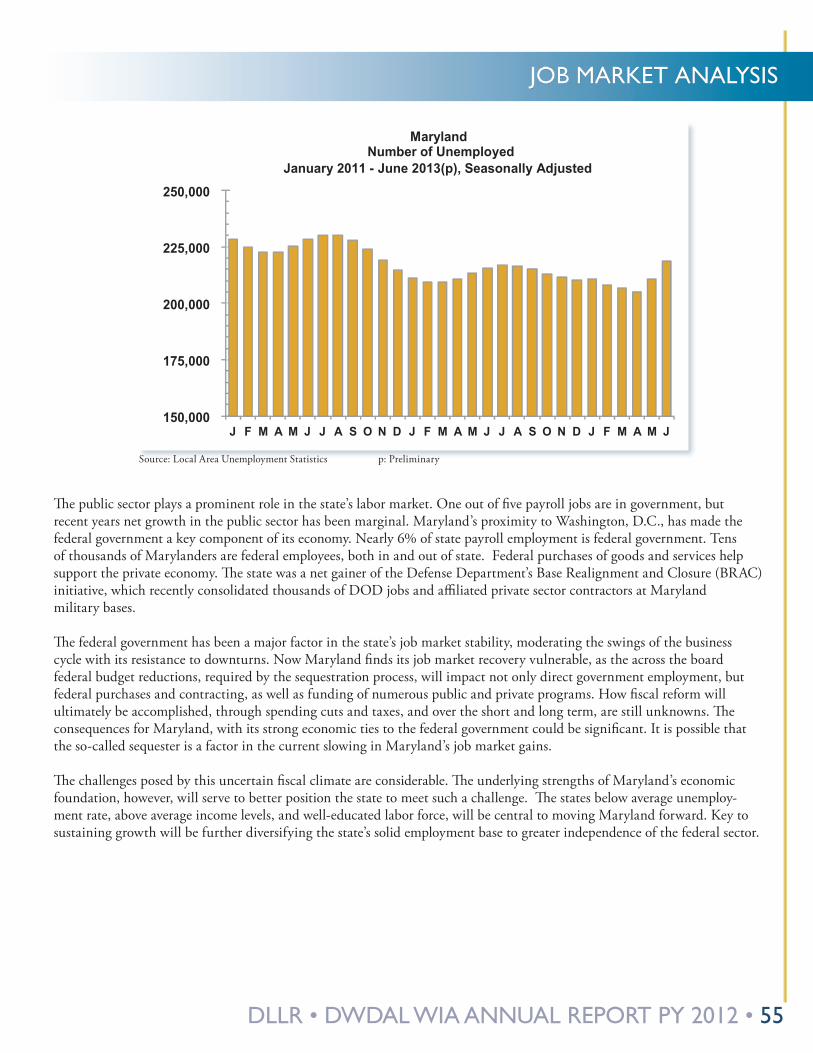
DLLR • DWDAL WIA ANNUAL REPORT PY 2012 • 55
JOB MARkET ANALYSIS
Source: Local Area Unemployment Statistics p: Preliminary
The public sector plays a prominent role in the state’s labor market. One out of five payroll jobs are in government, but recent years net growth in the public sector has been marginal. Maryland’s proximity to Washington, D.C., has made the federal government a key component of its economy. Nearly 6% of state payroll employment is federal government. Tens of thousands of Marylanders are federal employees, both in and out of state. Federal purchases of goods and services help support the private economy. The state was a net gainer of the Defense Department’s Base Realignment and Closure (BRAC) initiative, which recently consolidated thousands of DOD jobs and affiliated private sector contractors at Maryland military bases.
The federal government has been a major factor in the state’s job market stability, moderating the swings of the business cycle with its resistance to downturns. Now Maryland finds its job market recovery vulnerable, as the across the board federal budget reductions, required by the sequestration process, will impact not only direct government employment, but federal purchases and contracting, as well as funding of numerous public and private programs. How fiscal reform will ultimately be accomplished, through spending cuts and taxes, and over the short and long term, are still unknowns. The consequences for Maryland, with its strong economic ties to the federal government could be significant. It is possible that the so-called sequester is a factor in the current slowing in Maryland’s job market gains.
The challenges posed by this uncertain fiscal climate are considerable. The underlying strengths of Maryland’s economic foundation, however, will serve to better position the state to meet such a challenge. The states below average unemploy-ment rate, above average income levels, and well-educated labor force, will be central to moving Maryland forward. Key to sustaining growth will be further diversifying the state’s solid employment base to greater independence of the federal sector.
150,000
175,000
200,000
225,000
250,000
J F M A M J J A S O N D J F M A M J J A S O N D J F M A M J
Maryland Number of Unemployed
January 2011 - June 2013(p), Seasonally Adjusted
Source: Local Area Unemployment Statistics (p): preliminary
56 • DLLR • DWDAL WIA ANNUAL REPORT PY 2012
JOB MARkET ANALYSIS
SourceS:
Council of Economic Advisors, 2013 Economic Report of the President, March 2013�
Federal Reserve Board of Governors, http://www�federalreserve�gov, Statement by Ben S� Bernanke, Chairman, before the Joint Economic Committee, U�S� Congress, May 22, 2013�
Maryland Department of Labor, Licensing & Regulation, Division of Workforce Development & Adult Learning, http://www�dllr�state�md�us/employment, “Worker Adjustment and Retraining Notification Log”, calendar year 2012, calendar year 2013�
Maryland Department of Labor, Licensing & Regulation, Office of Workforce Information & Performance, http://www�dllr�state�md�us/lmi, Current Employment Statistics; Local Area Unemployment Statistics; Quarterly Census of Employment & Wages�
Maryland Department of State Planning, State Data Center, http://www�mdp�state�md�us/msdc, Maryland Statistical Handbook, May 2012, “Federal Government Expenditures and Obligations”; hwww.mdp.state.us/msdc/American Community Survey/2009-2011ACS, American Community Survey 2009-2011, U�S� Department of Commerce, Census Bureau�
National Bureau of Economic Research, http://www�nbr�org, U�S� Business Cycle Expansions and Contractions�Puglia, Sutton E� and Parth A� Tikiwala, “Slow and Steady: Payroll Employment Grew Moderately in 2012”, Monthly Labor Review, March 2013, U�S� Department of Labor, Bureau of Labor Statistics�
U�S� Department of Commerce, Bureau of Economic Analysis, http://www�bea�gov, National Economic Accounts, Gross Domestic Product Percent Change from Preceding Period� U�S� Department of Labor, Bureau of Labor Statistics, Current Employment Statistics (Maryland and U�S�); Current Population Survey; Geographic Profile of Employment & Unemployment (Maryland); Local Area Unemployment Statistics; Maryland mass layoff statistics�
U�S� Department of Labor, Employment and Training Administration, http://www�workforcesecurity�doleta�gov, Maryland unemployment insurance program statistics
Williamson, Lisa, “U�S� Labor Market Continued to Improve in 2012”, Monthly Labor Review, March 2013, U�S� Department of Labor, Bureau of Labor Statistics�
DLLR • DWDAL WIA ANNUAL REPORT PY 2012 • 57
FINANCIAL STATEMENT AND PERFORMANCE INFORMATION
WIA FINANCIAL STATEMENT AND PERFORMANCE INFORMATION
a. WIA Financial Statement – See separate excel document – please insert
b. Table N – Cost of Program Activities – See separate excel document – please insert
c. Financial Narrative
Program Year Expenditures by Funding Stream:
The expenditures for each funding stream include PY 12 WIA funds and Carry-In funds from the prior year.
The expenditures are: Adult $9,557,238, Dislocated Workers $10,509,577 and Youth $9,697,551.
Cost per Participant:
DWDAL chose “Cost per Participant” to present the required Efficiency Measure information. We chose this method since it provides a comprehensive view by including all enrolled customers and all costs.
The cost per Participant is calculated for each funding stream by dividing the total expenditures by the number of partici-pants for the program year. The resulting number is the cost per participant for the program year. Using this method, the cost per participant by funding stream for the program year is estimated as follows:
Adults $2,442 (not including self-service participants)
Dislocated Workers $1,828
Youth $3,749
The cost of workforce investment activities relative to the effect of the activities on the performance of participants:
The available WIA funds for PY 2012 were $44,972,724, as shown in the table below. Out of this total, $38,316,532 were distributed to Local WIA Areas by formula.
At the end of the fiscal year, 85% of available funds were obligated. The remaining funds were carried forward into the current fiscal year.
The breakout by funding stream at the local level: Charts provided by OWIP
The following three charts illustrate the correlation between funding and participants served, by funding stream and local LWIA. Please note that these numbers are affected by the local utilization of the waiver to transfer expenditures between Adult and Dislocated Worker funding streams.
Charts provided by OWIP
58 • DLLR • DWDAL WIA ANNUAL REPORT PY 2012
ECONOMIC AND FISCAL CONTRIBUTION
ECONOMIC AND FISCAL CONTRIBUTION OF WORkFORCE SERvICES PY2011 DLLR commissioned the Jacob France Institute (JFI) to analyze the economic and fiscal contribution of its workforce development programs. This study for PY2011 (most recent PY) uses the standard regional economics modeling method of input/output analysis to quantify the direct and indirect (multiplier) impacts of DLLR workforce development programs in terms of the earnings of persons placed in employment after receiving DLLR services. Two (2) key findings of this analysis for Program Year 2011 are as follows:
1. The depth and breadth of the current recession has made the workforce development services provided by DLLR critical to efforts in reducing and ameliorating the impacts of unemployment:
• While the unemployment rate has fallen from peak recessionary levels, the number of unemployed persons in Maryland remained consistently over 200,000 throughout 2012 and ended the year above December 2011 levels; and
• In FY2011, a total of 64,282 previously unemployed persons entered employment after receiving at least some level of assistance or services from DLLR.
2. The workforce development services provided by DLLR make an important economic and fiscal contribution1 to the State of Maryland:
• The average annual salary for the 64,282 previously unemployed persons that entered employment in FY2011 after receiving at least some level of services from DLLR is almost $31,000; and
• The 3,151 previously unemployed persons placed in or entering employment after receiving WIA services
1. Had estimated annual incomes of $103.8 million;2. Support $112.9 million in economic activity in Maryland and support an additional 879 jobs in the State with an associated $40 million in labor income; and3. Generate an estimated $4.1 million in State tax revenues.
• The 61,131 previously unemployed persons placed in or entering employment after receiving Wagner-Peyser Act services
1. Had estimated annual incomes of nearly $1.9 billion;2. Support over $2 billion in economic activity in Maryland and support an additional 15,782 jobs
in the State with an associated $720.8 million in labor income; and3. Generate an estimated $71.9 million in State tax revenue.
• The 64,282 previously unemployed persons receiving either WIA or Wagner-Peyser Act program services1. Had combined estimated annual incomes of nearly $2.0 billion;2. Support $2.2 billion in economic activity in Maryland and support an additional 16,661 jobs
in the State with an associated $760.9 million in labor income; and3. Generate an estimated $75.9 million in State tax revenues and $69.2 million in local tax
revenues, an amount that exceeds the $46.3 million in workforce program expenditures.
1. It is important to note that this report analyzes the earnings of persons receiving DLLR workforce development services during PY2011 without adjusting for the potential that these jobs could have potentially been filled by other Maryland residents or what the earnings of these persons would have been had alternative employment been secured. This analysis therefore, is not a traditional economic impact analysis citing the net new and incremental impacts of an activity, but rather an analysis of the linkages between the incomes of the persons receiving services and the larger Maryland economy.
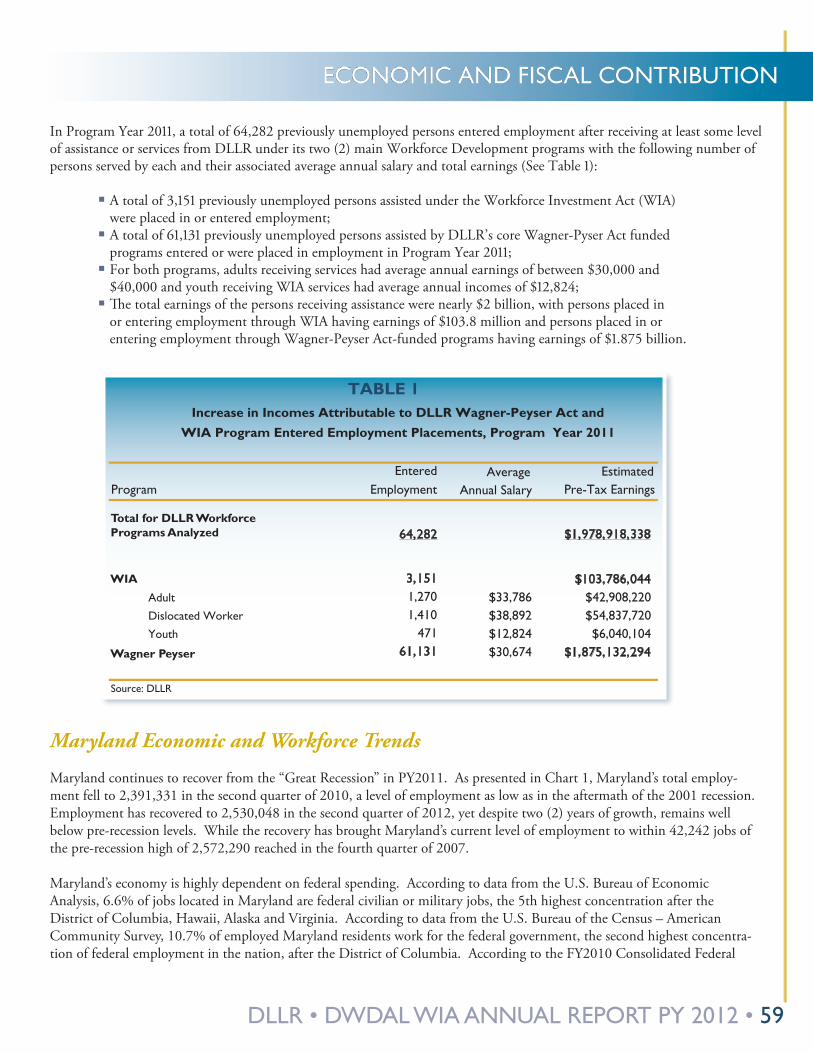
DLLR • DWDAL WIA ANNUAL REPORT PY 2012 • 59
ECONOMIC AND FISCAL CONTRIBUTION
In Program Year 2011, a total of 64,282 previously unemployed persons entered employment after receiving at least some level of assistance or services from DLLR under its two (2) main Workforce Development programs with the following number of persons served by each and their associated average annual salary and total earnings (See Table 1):
� A total of 3,151 previously unemployed persons assisted under the Workforce Investment Act (WIA) were placed in or entered employment; � A total of 61,131 previously unemployed persons assisted by DLLR’s core Wagner-Pyser Act funded programs entered or were placed in employment in Program Year 2011; � For both programs, adults receiving services had average annual earnings of between $30,000 and $40,000 and youth receiving WIA services had average annual incomes of $12,824; � The total earnings of the persons receiving assistance were nearly $2 billion, with persons placed in or entering employment through WIA having earnings of $103.8 million and persons placed in or entering employment through Wagner-Peyser Act-funded programs having earnings of $1.875 billion.
Maryland Economic and Workforce Trends
Maryland continues to recover from the “Great Recession” in PY2011. As presented in Chart 1, Maryland’s total employ-ment fell to 2,391,331 in the second quarter of 2010, a level of employment as low as in the aftermath of the 2001 recession. Employment has recovered to 2,530,048 in the second quarter of 2012, yet despite two (2) years of growth, remains well below pre-recession levels. While the recovery has brought Maryland’s current level of employment to within 42,242 jobs of the pre-recession high of 2,572,290 reached in the fourth quarter of 2007. Maryland’s economy is highly dependent on federal spending. According to data from the U.S. Bureau of Economic Analysis, 6.6% of jobs located in Maryland are federal civilian or military jobs, the 5th highest concentration after the District of Columbia, Hawaii, Alaska and Virginia. According to data from the U.S. Bureau of the Census – American Community Survey, 10.7% of employed Maryland residents work for the federal government, the second highest concentra-tion of federal employment in the nation, after the District of Columbia. According to the FY2010 Consolidated Federal
Average EstimatedAnnual Salary Pre-Tax Earnings
64,282 $1,978,918,338
$103,786,044Adult $33,786 $42,908,220Dislocated Worker $38,892 $54,837,720Youth $12,824 $6,040,104
$30,674 $1,875,132,294
Source: DLLR
1,2701,410
47161,131
3,151
TABLE 1Increase in Incomes Attributable to DLLR Wagner-Peyser Act and
WIA Program Entered Employment Placements, Program Year 2011
EnteredProgram Employment
Total for DLLR Workforce Programs Analyzed
WIA
Wagner Peyser
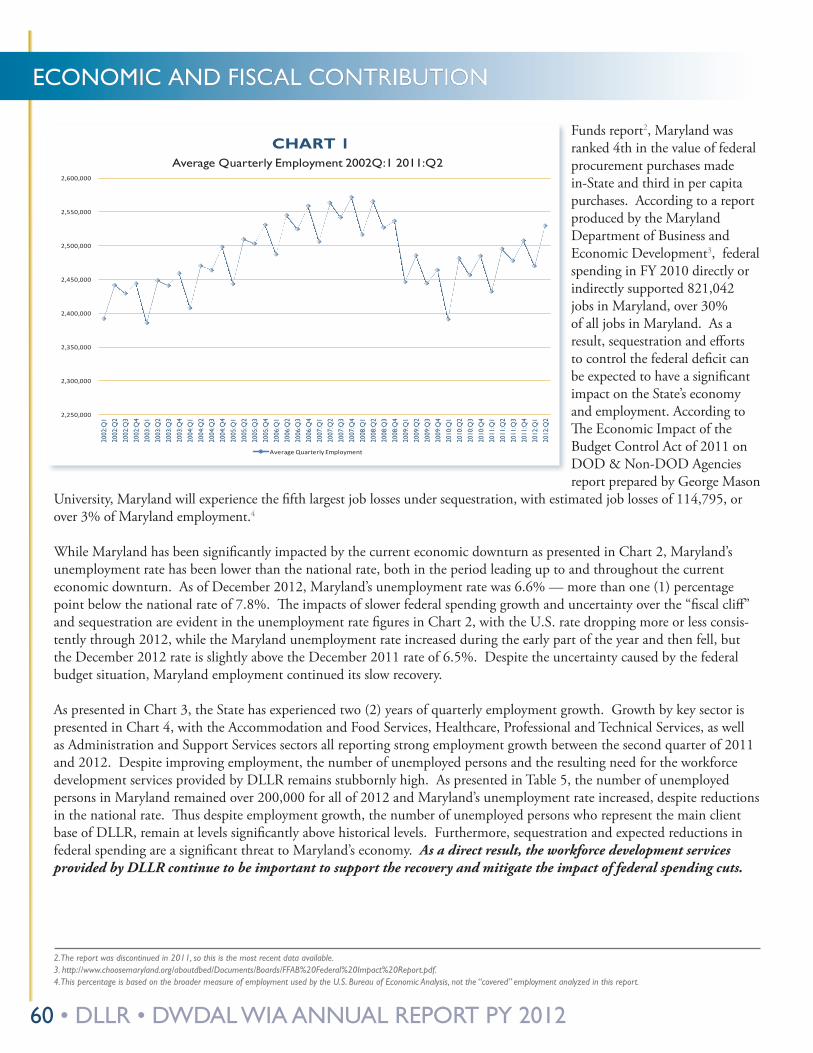
60 • DLLR • DWDAL WIA ANNUAL REPORT PY 2012
ECONOMIC AND FISCAL CONTRIBUTION
Funds report2, Maryland was ranked 4th in the value of federal procurement purchases made in-State and third in per capita purchases. According to a report produced by the Maryland Department of Business and Economic Development3, federal spending in FY 2010 directly or indirectly supported 821,042 jobs in Maryland, over 30% of all jobs in Maryland. As a result, sequestration and efforts to control the federal deficit can be expected to have a significant impact on the State’s economy and employment. According to The Economic Impact of the Budget Control Act of 2011 on DOD & Non-DOD Agencies report prepared by George Mason
University, Maryland will experience the fifth largest job losses under sequestration, with estimated job losses of 114,795, or over 3% of Maryland employment.4
While Maryland has been significantly impacted by the current economic downturn as presented in Chart 2, Maryland’s unemployment rate has been lower than the national rate, both in the period leading up to and throughout the current economic downturn. As of December 2012, Maryland’s unemployment rate was 6.6% — more than one (1) percentage point below the national rate of 7.8%. The impacts of slower federal spending growth and uncertainty over the “fiscal cliff” and sequestration are evident in the unemployment rate figures in Chart 2, with the U.S. rate dropping more or less consis-tently through 2012, while the Maryland unemployment rate increased during the early part of the year and then fell, but the December 2012 rate is slightly above the December 2011 rate of 6.5%. Despite the uncertainty caused by the federal budget situation, Maryland employment continued its slow recovery.
As presented in Chart 3, the State has experienced two (2) years of quarterly employment growth. Growth by key sector is presented in Chart 4, with the Accommodation and Food Services, Healthcare, Professional and Technical Services, as well as Administration and Support Services sectors all reporting strong employment growth between the second quarter of 2011 and 2012. Despite improving employment, the number of unemployed persons and the resulting need for the workforce development services provided by DLLR remains stubbornly high. As presented in Table 5, the number of unemployed persons in Maryland remained over 200,000 for all of 2012 and Maryland’s unemployment rate increased, despite reductions in the national rate. Thus despite employment growth, the number of unemployed persons who represent the main client base of DLLR, remain at levels significantly above historical levels. Furthermore, sequestration and expected reductions in federal spending are a significant threat to Maryland’s economy. As a direct result, the workforce development services provided by DLLR continue to be important to support the recovery and mitigate the impact of federal spending cuts.
2,250,000
2,300,000
2,350,000
2,400,000
2,450,000
2,500,000
2,550,000
2,600,000
2002
:Q1
2002
:Q2
2002
:Q3
2002
:Q4
2003
:Q1
2003
:Q2
2003
:Q3
2003
:Q4
2004
:Q1
2004
:Q2
2004
:Q3
2004
:Q4
2005
:Q1
2005
:Q2
2005
:Q3
2005
:Q4
2006
:Q1
2006
:Q2
2006
:Q3
2006
:Q4
2007
:Q1
2007
:Q2
2007
:Q3
2007
:Q4
2008
:Q1
2008
:Q2
2008
:Q3
2008
:Q4
2009
:Q1
2009
:Q2
2009
:Q3
2009
:Q4
2010
:Q1
2010
:Q2
2010
:Q3
2010
:Q4
2011
:Q1
2011
:Q2
2011
:Q3
2011
:Q4
2012
:Q1
2012
:Q2
CHART 1Average Quarterly Employment 2002Q:1 2011:Q2
Average Quarterly Employment
2. The report was discontinued in 2011, so this is the most recent data available.3. http://www.choosemaryland.org/aboutdbed/Documents/Boards/FFAB%20Federal%20Impact%20Report.pdf. 4. This percentage is based on the broader measure of employment used by the U.S. Bureau of Economic Analysis, not the “covered” employment analyzed in this report.
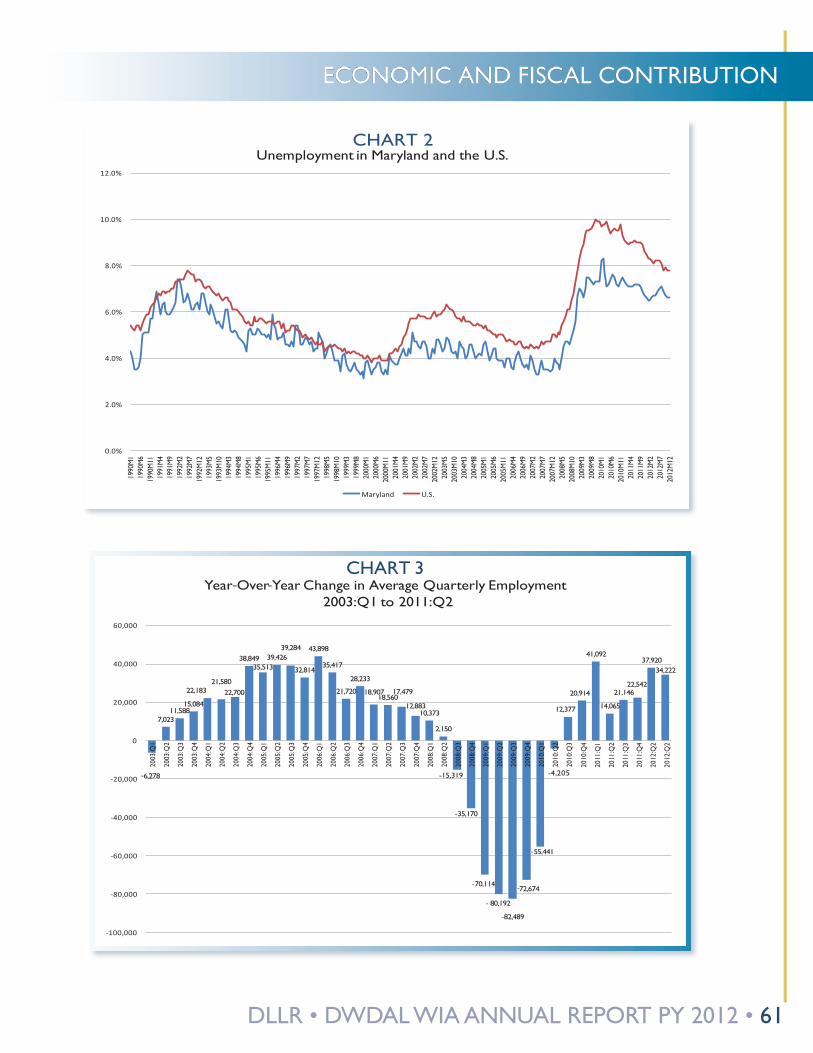
DLLR • DWDAL WIA ANNUAL REPORT PY 2012 • 61
ECONOMIC AND FISCAL CONTRIBUTION
0.0%
2.0%
4.0%
6.0%
8.0%
10.0%
12.0%
1990
M1
1990
M6
1990
M11
1991
M4
1991
M9
1992
M2
1992
M7
1992
M12
1993
M5
1993
M10
1994
M3
1994
M8
1995
M1
1995
M6
1995
M11
1996
M4
1996
M9
1997
M2
1997
M7
1997
M12
1998
M5
1998
M10
1999
M3
1999
M8
2000
M1
2000
M6
2000
M11
2001
M4
2001
M9
2002
M2
2002
M7
2002
M12
2003
M5
2003
M10
2004
M3
2004
M8
2005
M1
2005
M6
2005
M11
2006
M4
2006
M9
2007
M2
2007
M7
2007
M12
2008
M5
2008
M10
2009
M3
2009
M8
2010
M1
2010
M6
2010
M11
2011
M4
2011
M9
2012
M2
2012
M7
2012
M12
Unemployment in Maryland and the U.S.
Maryland U.S.
CHART 2
-6,278
7,02311,588
15,084
22,18321,580
22,700
38,84935,513
39,42639,284
32,814
43,898
35,417
21,720
28,233
18,90718,560
17,479
12,88310,373
2,150
-15,319
-35,170
-70,114
- 80,192
-82,489
-72,674
-55,441
-4,205
12,377
20,914
41,092
14,065
21,14622,542
37,92034,222
-100,000
-80,000
-60,000
-40,000
-20,000
0
20,000
40,000
60,000
2003
:Q1
2003
:Q2
2003
:Q3
2003
:Q4
2004
:Q1
2004
:Q2
2004
:Q3
2004
:Q4
2005
:Q1
2005
:Q2
2005
:Q3
2005
:Q4
2006
:Q1
2006
:Q2
2006
:Q3
2006
:Q4
2007
:Q1
2007
:Q2
2007
:Q3
2007
:Q4
2008
:Q1
2008
:Q2
2008
:Q3
2008
:Q4
2009
:Q1
2009
:Q2
2009
:Q3
2009
:Q4
2010
:Q1
2010
:Q2
2010
:Q3
2010
:Q4
2011
:Q1
2011
:Q2
2011
:Q3
2011
:Q4
2012
:Q2
2012
:Q2
CHART 3Year-Over-Year Change in Average Quarterly Employment
2003:Q1 to 2011:Q2
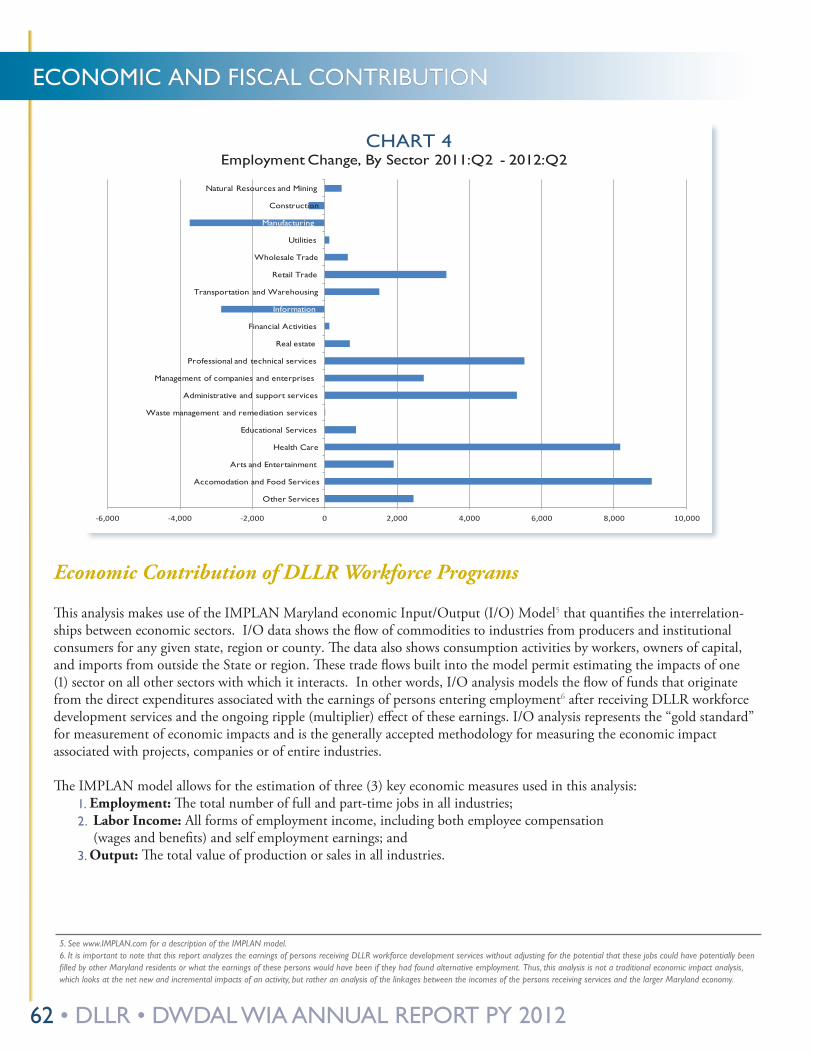
62 • DLLR • DWDAL WIA ANNUAL REPORT PY 2012
ECONOMIC AND FISCAL CONTRIBUTION
-6,000 -4,000 -2,000 0 2,000 4,000 6,000 8,000 10,000
Other Services
Accomodation and Food Services
Arts and Entertainment
Health Care
Educational Services
Waste management and remediation services
Administrative and support services
Management of companies and enterprises
Professional and technical services
Real estate
Financial Activities
Information
Transportation and Warehousing
Retail Trade
Wholesale Trade
Utilities
Manufacturing
Construction
Natural Resources and Mining
Employment Change, By Sector 2011:Q2 - 2012:Q2CHART 4
Economic Contribution of DLLR Workforce Programs
This analysis makes use of the IMPLAN Maryland economic Input/Output (I/O) Model5 that quantifies the interrelation-ships between economic sectors. I/O data shows the flow of commodities to industries from producers and institutional consumers for any given state, region or county. The data also shows consumption activities by workers, owners of capital, and imports from outside the State or region. These trade flows built into the model permit estimating the impacts of one (1) sector on all other sectors with which it interacts. In other words, I/O analysis models the flow of funds that originate from the direct expenditures associated with the earnings of persons entering employment6 after receiving DLLR workforce development services and the ongoing ripple (multiplier) effect of these earnings. I/O analysis represents the “gold standard” for measurement of economic impacts and is the generally accepted methodology for measuring the economic impact associated with projects, companies or of entire industries.
The IMPLAN model allows for the estimation of three (3) key economic measures used in this analysis:1� Employment: The total number of full and part-time jobs in all industries;2� Labor Income: All forms of employment income, including both employee compensation
(wages and benefits) and self employment earnings; and3� Output: The total value of production or sales in all industries.
5. See www.IMPLAN.com for a description of the IMPLAN model.6. It is important to note that this report analyzes the earnings of persons receiving DLLR workforce development services without adjusting for the potential that these jobs could have potentially been filled by other Maryland residents or what the earnings of these persons would have been if they had found alternative employment. Thus, this analysis is not a traditional economic impact analysis, which looks at the net new and incremental impacts of an activity, but rather an analysis of the linkages between the incomes of the persons receiving services and the larger Maryland economy.
DLLR • DWDAL WIA ANNUAL REPORT PY 2012 • 63
ECONOMIC AND FISCAL CONTRIBUTION
Economic impact analyses begin with quantifying the direct effect of an activity. In the case of this analysis, the direct effect being modeled is the earnings of previously unemployed persons placed in or entering employment after receiving DLLR workforce development services. As described above, the JFI obtained data on the number of previously unemployed persons that were placed or entered into employment and their associated average annual earnings for Program Year 2011 from DLLR. For this analysis, the contribution of DLLR’s WIA and Wagner-Peyser Act workforce development programs is considered to be the earnings of the previously unemployed persons receiving services under both programs. These earnings impact the Maryland economy as they are spent on purchases of goods, services, housing and other activities.
As presented in Table 1 (above), there is a total of almost $2 billion in earnings associated with the 64,282 previously unemployed persons placed in or entering employment after receiving services from DLLR’s WIA and Wagner-Peyser Act funded programs. The 3,151 previously unemployed persons placed in or entering employment after receiving WIA services had estimated annual incomes of $103.8 million and the 61,131previously unemployed persons placed in or entering employment after receiving Wagner-Peyser Act services had estimated annual incomes of nearly $1.9 billion.
The earnings of the previously unemployed persons receiving services from WIA and Wagner-Peyser Act funded programs is one measure of DLLR’s contribution to the State of Maryland. Simply counting these earnings as the economic contribution of the program; however, undercounts the actual contribution of the program. These earnings also support other economic activity in the State as the incomes of these previously unemployed persons are spent and become income for businesses and other individuals in the State. This additional spending can be measured through the use of economic modeling, which estimated the “multiplier” effects of the additional rounds of spending associated with an activity.
The results of the IMPLAN economic contribution analysis are presented in Table 2. As presented in this table:
• The $103.8 million in post placement earnings for the 3,151 previously unemployed persons placed in or entering employment after receiving WIA services supports $112.9 million in economic activity in Maryland, supports 879 jobs earning $40 million in labor income, and generates $7.8 million in estimated combined State and local tax revenues;
• The $1.9 billion in post placement earnings for the 61,131 previously unemployed persons placed in or entering employment after receiving Wagner-Peyser services supports over $2 billion in econom-ic activity in Maryland, supports 15,782 jobs earning $720.8 million in labor income, and generates $137.3 million in estimated combined State and local tax revenues; and
• The $2 billion in post placement earnings for the 64,282 previously unemployed persons placed in or entering employment after receiving either WIA or Wagner-Peyser services supports $2.2 billion in economic activity in Maryland, supports 16,661 jobs earning $760.9 million in labor income, and generates $145.1 million in estimated combined State and local tax revenues.
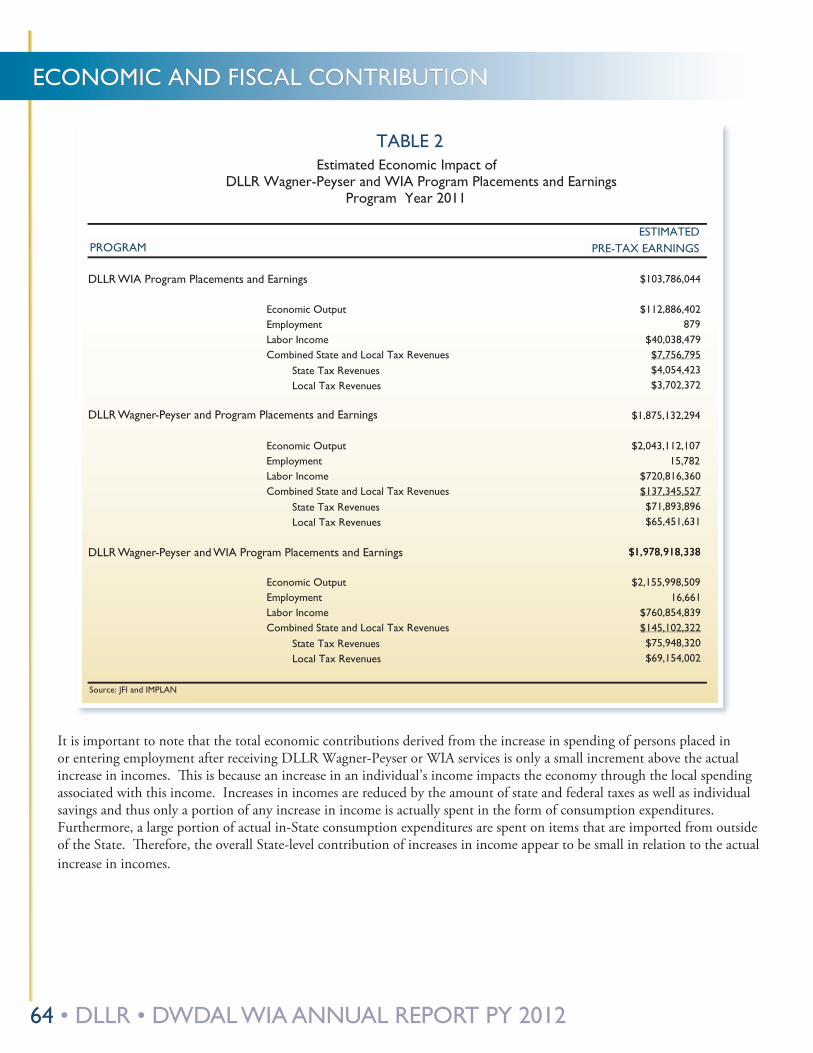
64 • DLLR • DWDAL WIA ANNUAL REPORT PY 2012
ECONOMIC AND FISCAL CONTRIBUTION
State Tax RevenuesLocal Tax Revenues
State Tax RevenuesLocal Tax Revenues
$$11,,997788,,991188,,333388
State Tax RevenuesLocal Tax Revenues
TABLE 2Estimated Economic Impact of
DLLR Wagner-Peyser and WIA Program Placements and EarningsProgram Year 2011
ESTIMATEDPROGRAM PRE-TAX EARNINGS
$103,786,044
$1,875,132,294
Economic Output $112,886,402Employment 879Labor Income $40,038,479Combined State and Local Tax Revenues $7,756,795
$4,054,423$3,702,372
Economic Output $2,043,112,107Employment 15,782Labor Income $720,816,360Combined State and Local Tax Revenues $137,345,527
$71,893,896$65,451,631
Source: JFI and IMPLAN
Economic Output $2,155,998,509Employment 16,661Labor Income $760,854,839Combined State and Local Tax Revenues $145,102,322
$75,948,320$69,154,002
DLLR Wagner-Peyser and WIA Program Placements and Earnings
DLLR Wagner-Peyser and Program Placements and Earnings
DLLR WIA Program Placements and Earnings
It is important to note that the total economic contributions derived from the increase in spending of persons placed in or entering employment after receiving DLLR Wagner-Peyser or WIA services is only a small increment above the actual increase in incomes. This is because an increase in an individual’s income impacts the economy through the local spending associated with this income. Increases in incomes are reduced by the amount of state and federal taxes as well as individual savings and thus only a portion of any increase in income is actually spent in the form of consumption expenditures. Furthermore, a large portion of actual in-State consumption expenditures are spent on items that are imported from outside of the State. Therefore, the overall State-level contribution of increases in income appear to be small in relation to the actual increase in incomes.
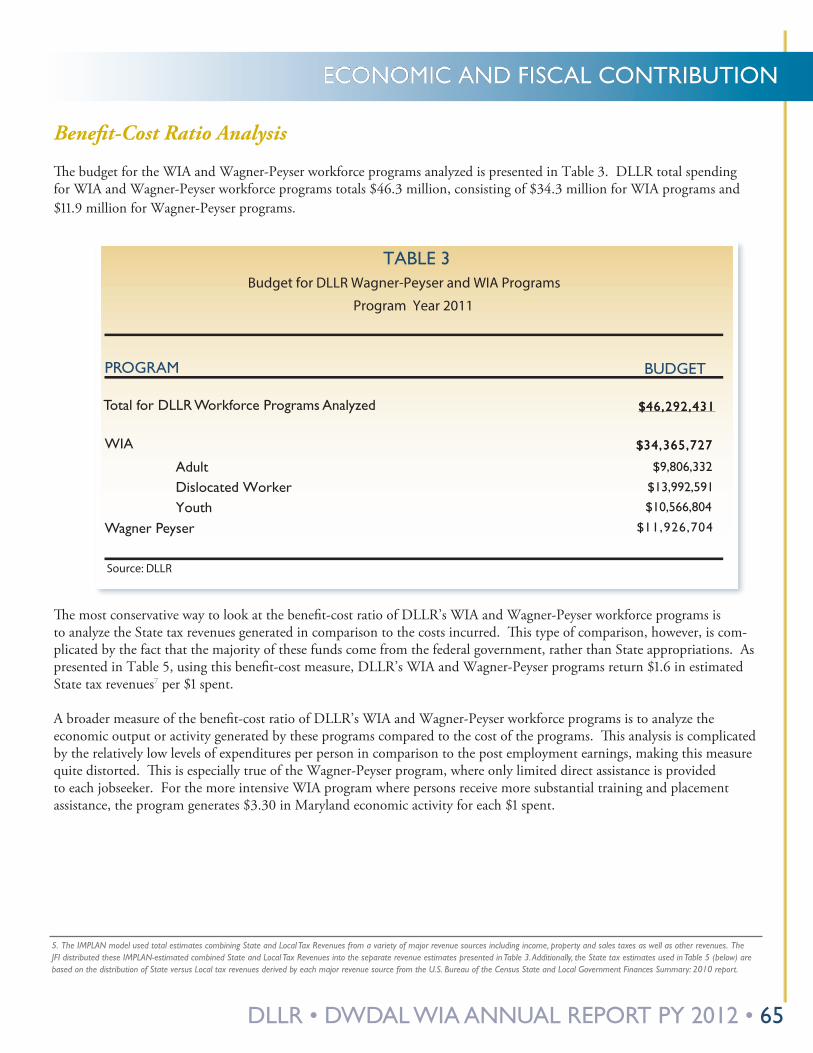
DLLR • DWDAL WIA ANNUAL REPORT PY 2012 • 65
ECONOMIC AND FISCAL CONTRIBUTION
$$4466,,229922,,443311
AdultDislocated WorkerYouth
Source: DLLR
$9,806,332
$13,992,591$10,566,804
$11,926,704
$$3344,,336655,,772277
TABLE 3Budget for DLLR Wagner-Peyser and WIA Programs
Program Year 2011
PROGRAM BUDGET
Total for DLLR Workforce Programs Analyzed
WIA
Wagner Peyser
Benefit-Cost Ratio Analysis
The budget for the WIA and Wagner-Peyser workforce programs analyzed is presented in Table 3. DLLR total spending for WIA and Wagner-Peyser workforce programs totals $46.3 million, consisting of $34.3 million for WIA programs and $11.9 million for Wagner-Peyser programs.
5. The IMPLAN model used total estimates combining State and Local Tax Revenues from a variety of major revenue sources including income, property and sales taxes as well as other revenues. The JFI distributed these IMPLAN-estimated combined State and Local Tax Revenues into the separate revenue estimates presented in Table 3. Additionally, the State tax estimates used in Table 5 (below) are based on the distribution of State versus Local tax revenues derived by each major revenue source from the U.S. Bureau of the Census State and Local Government Finances Summary: 2010 report.
The most conservative way to look at the benefit-cost ratio of DLLR’s WIA and Wagner-Peyser workforce programs is to analyze the State tax revenues generated in comparison to the costs incurred. This type of comparison, however, is com-plicated by the fact that the majority of these funds come from the federal government, rather than State appropriations. As presented in Table 5, using this benefit-cost measure, DLLR’s WIA and Wagner-Peyser programs return $1.6 in estimated State tax revenues7 per $1 spent.
A broader measure of the benefit-cost ratio of DLLR’s WIA and Wagner-Peyser workforce programs is to analyze the economic output or activity generated by these programs compared to the cost of the programs. This analysis is complicated by the relatively low levels of expenditures per person in comparison to the post employment earnings, making this measure quite distorted. This is especially true of the Wagner-Peyser program, where only limited direct assistance is provided to each jobseeker. For the more intensive WIA program where persons receive more substantial training and placement assistance, the program generates $3.30 in Maryland economic activity for each $1 spent.
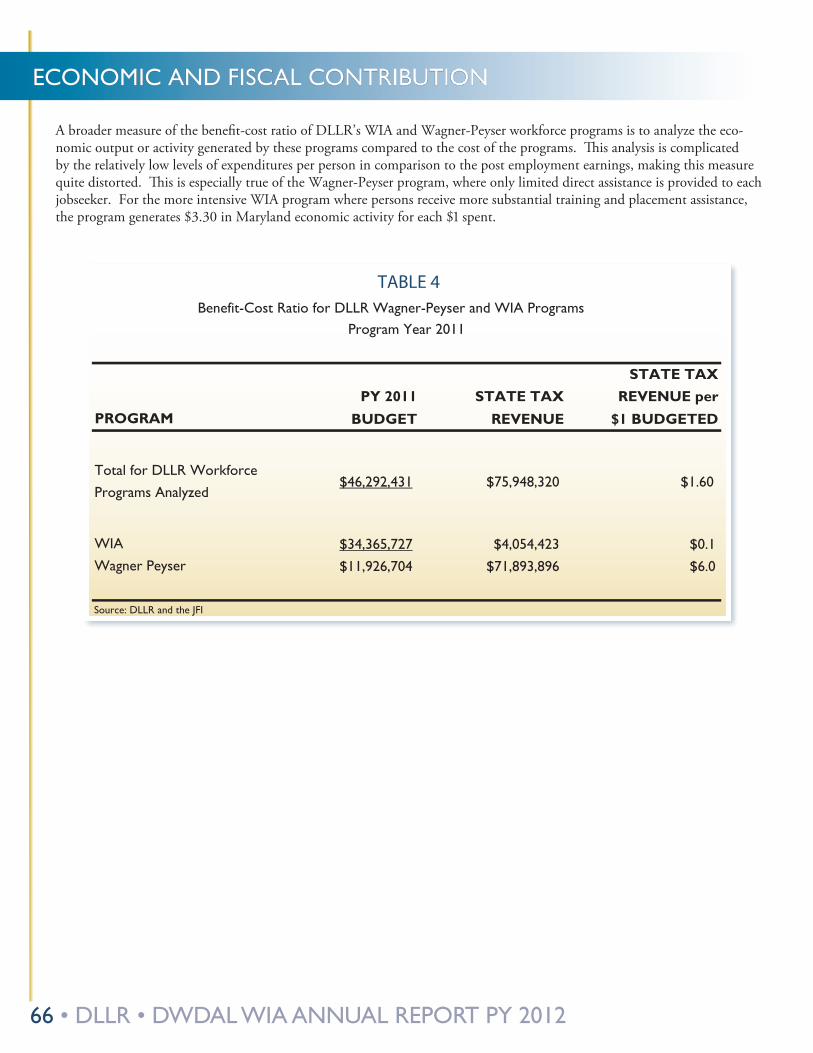
66 • DLLR • DWDAL WIA ANNUAL REPORT PY 2012
ECONOMIC AND FISCAL CONTRIBUTION
STATE TAXPY 2011 STATE TAX REVENUE per
BUDGET REVENUE $1 BUDGETED
$46,292,431 $75,948,320 $1.60
$34,365,727 $4,054,423 $0.1
$11,926,704 $71,893,896 $6.0 Wagner Peyser
Source: DLLR and the JFI
TABLE 4Benefit-Cost Ratio for DLLR Wagner-Peyser and WIA Programs
Program Year 2011
PROGRAM
Total for DLLR Workforce Programs Analyzed
WIA
A broader measure of the benefit-cost ratio of DLLR’s WIA and Wagner-Peyser workforce programs is to analyze the eco-nomic output or activity generated by these programs compared to the cost of the programs. This analysis is complicated by the relatively low levels of expenditures per person in comparison to the post employment earnings, making this measure quite distorted. This is especially true of the Wagner-Peyser program, where only limited direct assistance is provided to each jobseeker. For the more intensive WIA program where persons receive more substantial training and placement assistance, the program generates $3.30 in Maryland economic activity for each $1 spent.
DLLR • DWDAL WIA ANNUAL REPORT PY 2012 • 67
WIA PERFORMANCE
MARYLAND’S WORkFORCE INvESTMENT ACT PERFORMANCE PY2012The Workforce Investment Act (WIA) Program provides employment, job training, and education services to eligible adults, dislocated workers, and youth. The WIA Program increases the employment, employment retention, and earnings of adults, dislocated workers, and young workers (ages 14-21). Through the WIA Program, participants receive job search and placement assistance, access to labor market information, comprehensive skills assessments, counseling and career planning, as well as basic skills and occupational training.
Common Measures
The State of Maryland was granted continuation of the waiver to allow the State to replace the 17 WIA Title I Performance Measures (fifteen (15) Core and two (2) Customer Satisfaction) with the Common Measures as outlined and clarified in TEGL 17-05. With the approval, Maryland is allowed to continue to report outcomes solely under the nine (9) Common Measures for all required federal reports for the current program year and beyond. This allows Maryland to continue to report the Common Measures for programs under the Workforce Investment Act, the Wagner-Peyser Act, the Jobs for Veterans Act, and Trade Adjustment Assistance (TAA) programs. These nine (9) Common Measures as outlined in the TEGL are as follows: Entered Employment, Employment Retention, Average Earnings, Youth Placement in Employment or Education, Youth Attainment of a Degree or Certificate, and Youth Literacy and Numeracy Gains.
Maryland strives to simplify and streamline the performance accountability system for all stakeholders, and focus on work-force development. This focus results in job attainment, and retention, as well as reduced time and energy spent managing performance outcomes. This waiver supports Maryland’s initiative to expand, attract and retain workers to meet the current and emerging needs of business. Maryland has moved from individual Program Measures to integrated services, and utilizes the simplified reporting of only Common Measures as the method of accomplishing the integration.
With approval of the waiver, the State is not required to, and has not negotiated performance level for, the following WIA Core Measures: WIA Adult and Dislocated Worker Employment and Credential Rates, participant and employer customer satisfaction; older youth measures, and younger youth measures.
WIA Negotiated Performance Targets and Results
In PY 2012, the State exceeded all negotiated outcomes relating to Adult employment retention, and average earnings among dislocated workers. Maryland met within the 80% - 100% threshold negotiated outcomes relating to Entered Employment Rate for Adults and Dislocated Workers, Dislocated Workers Retention Rate and Average Earnings for Adults. Maryland exceeded all youth negotiated outcomes, as reflected below. The State exceeded five (5) of its nine (9) negotiated performance targets.
WIA Assurance Statement
The state of Maryland assures the U.S. Department of Labor that all required elements of the PY 2012 WIA Annual Report have been reported accurately and uniformly to permit state-by-state comparisons across WIA programs. The state assures DOL that the WIA Annual Report complies with the act and federal regulations.
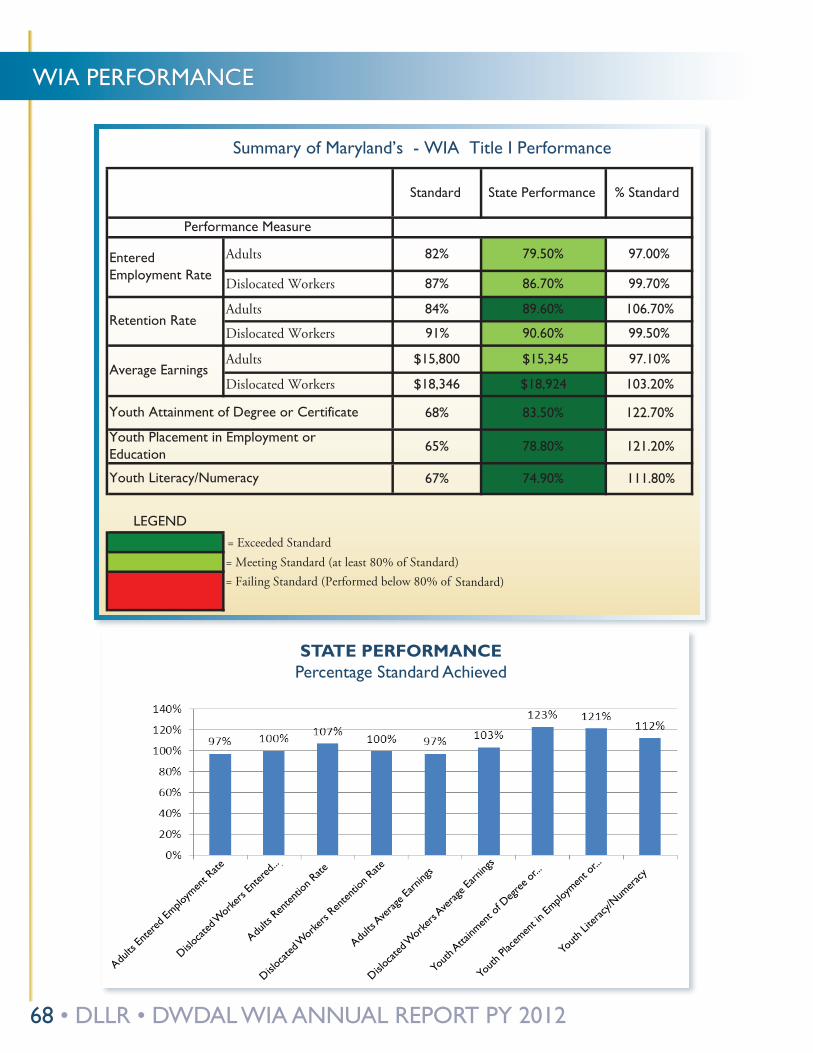
68 • DLLR • DWDAL WIA ANNUAL REPORT PY 2012
WIA PERFORMANCE
STATE PERFORMANCEPercentage Standard Achieved
Dislocat
ed W
orke
rs En
tered
...
Adults
Enter
ed Em
ploym
ent R
ate
Adults
Ren
tentio
n Rate
Dislocat
ed W
orke
rs Ren
tentio
n Rate
Adults
Averag
e Earn
ings
Youth
Attainm
ent o
f Deg
ree or
...
Dislocat
ed W
orke
rs Ave
rage E
arning
s
Youth
Place
ment in
Emplo
ymen
t or...
Youth
Liter
acy/N
umer
acy
Standard State Performance % Standard
Adults 82% 79.50% 97.00%
Dislocated Workers 87% 86.70% 99.70%
Adults 84% 89.60% 106.70%
Dislocated Workers 91% 90.60% 99.50%
Adults $15,800 $15,345 97.10%
Dislocated Workers $18,346 $18,924 103.20%
68% 83.50% 122.70%
65% 78.80% 121.20%
67% 74.90% 111.80%
LEGEND= Exceeded Standard= Meeting Standard (at least 80% of Standard)= Failing Standard (Performed below 80% of Standard)
Entered Employment Rate
Retention Rate
Average Earnings
Youth Attainment of Degree or Certificate
Youth Placement in Employment or Education
Youth Literacy/Numeracy
Summary of Maryland’s - WIA Title I Performance
Performance Measure
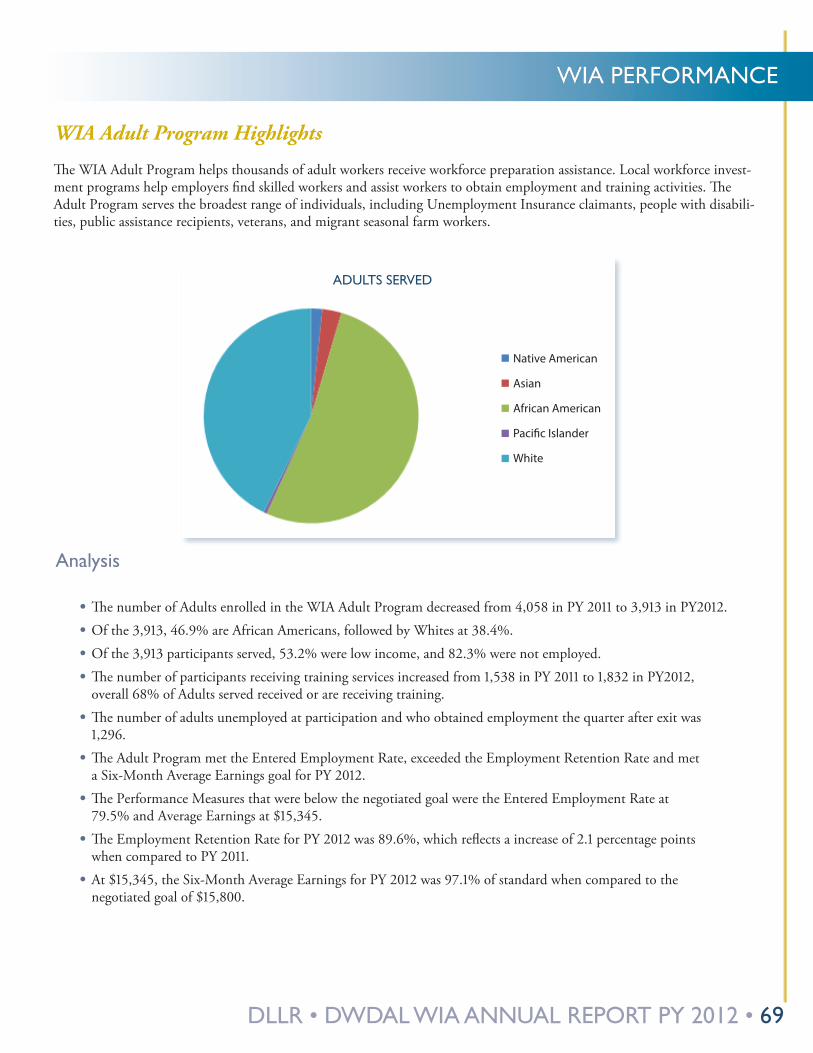
DLLR • DWDAL WIA ANNUAL REPORT PY 2012 • 69
WIA PERFORMANCE
WIA Adult Program Highlights
The WIA Adult Program helps thousands of adult workers receive workforce preparation assistance. Local workforce invest-ment programs help employers find skilled workers and assist workers to obtain employment and training activities. The Adult Program serves the broadest range of individuals, including Unemployment Insurance claimants, people with disabili-ties, public assistance recipients, veterans, and migrant seasonal farm workers.
Native American
Asian
African American
Paci�c Islander
White
ADULTS SERVED
Analysis
• The number of Adults enrolled in the WIA Adult Program decreased from 4,058 in PY 2011 to 3,913 in PY2012.
• Of the 3,913, 46.9% are African Americans, followed by Whites at 38.4%.
• Of the 3,913 participants served, 53.2% were low income, and 82.3% were not employed.
• The number of participants receiving training services increased from 1,538 in PY 2011 to 1,832 in PY2012, overall 68% of Adults served received or are receiving training.
• The number of adults unemployed at participation and who obtained employment the quarter after exit was 1,296.
• The Adult Program met the Entered Employment Rate, exceeded the Employment Retention Rate and met a Six-Month Average Earnings goal for PY 2012.
• The Performance Measures that were below the negotiated goal were the Entered Employment Rate at 79.5% and Average Earnings at $15,345.
• The Employment Retention Rate for PY 2012 was 89.6%, which reflects a increase of 2.1 percentage points when compared to PY 2011.
• At $15,345, the Six-Month Average Earnings for PY 2012 was 97.1% of standard when compared to the negotiated goal of $15,800.
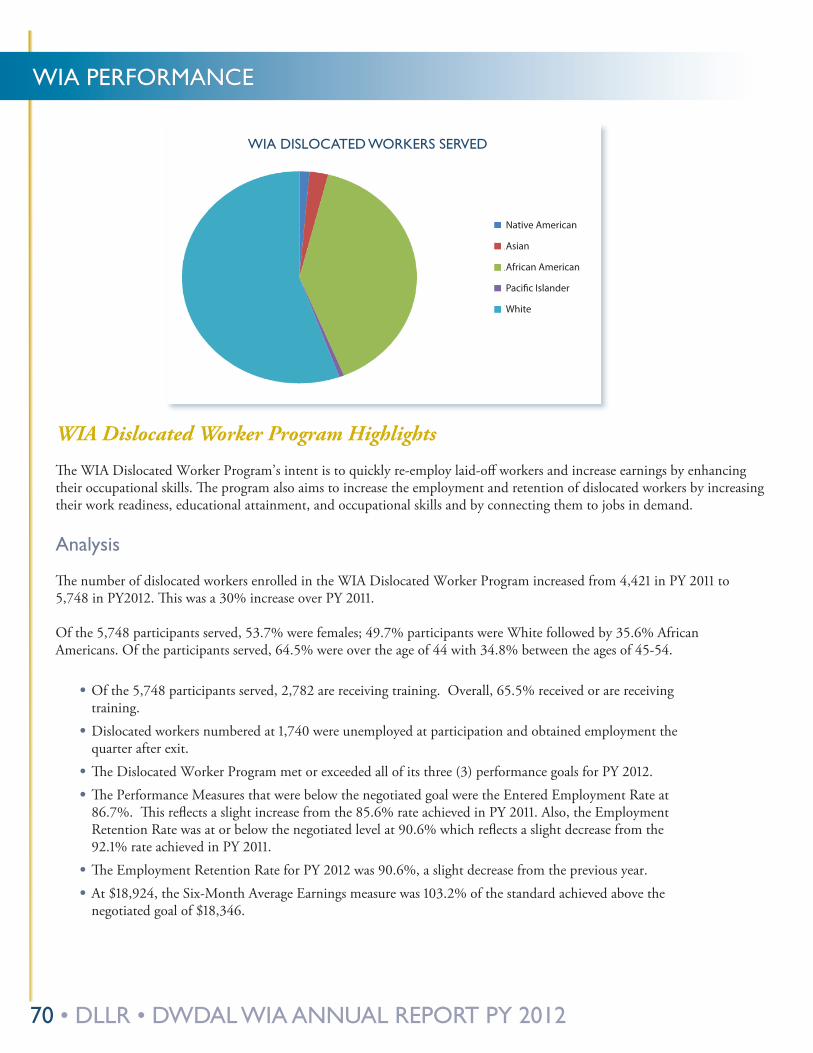
70 • DLLR • DWDAL WIA ANNUAL REPORT PY 2012
WIA PERFORMANCE
WIA Dislocated Worker Program Highlights
The WIA Dislocated Worker Program’s intent is to quickly re-employ laid-off workers and increase earnings by enhancing their occupational skills. The program also aims to increase the employment and retention of dislocated workers by increasing their work readiness, educational attainment, and occupational skills and by connecting them to jobs in demand.
Analysis
The number of dislocated workers enrolled in the WIA Dislocated Worker Program increased from 4,421 in PY 2011 to 5,748 in PY2012. This was a 30% increase over PY 2011.
Of the 5,748 participants served, 53.7% were females; 49.7% participants were White followed by 35.6% African Americans. Of the participants served, 64.5% were over the age of 44 with 34.8% between the ages of 45-54.
• Of the 5,748 participants served, 2,782 are receiving training. Overall, 65.5% received or are receiving training.
• Dislocated workers numbered at 1,740 were unemployed at participation and obtained employment the quarter after exit.
• The Dislocated Worker Program met or exceeded all of its three (3) performance goals for PY 2012.
• The Performance Measures that were below the negotiated goal were the Entered Employment Rate at 86.7%. This reflects a slight increase from the 85.6% rate achieved in PY 2011. Also, the Employment Retention Rate was at or below the negotiated level at 90.6% which reflects a slight decrease from the 92.1% rate achieved in PY 2011.
• The Employment Retention Rate for PY 2012 was 90.6%, a slight decrease from the previous year.
• At $18,924, the Six-Month Average Earnings measure was 103.2% of the standard achieved above the negotiated goal of $18,346.
WIA DISLOCATED WORKERS SERVED
Native American
Asian
African American
Paci�c Islander
White
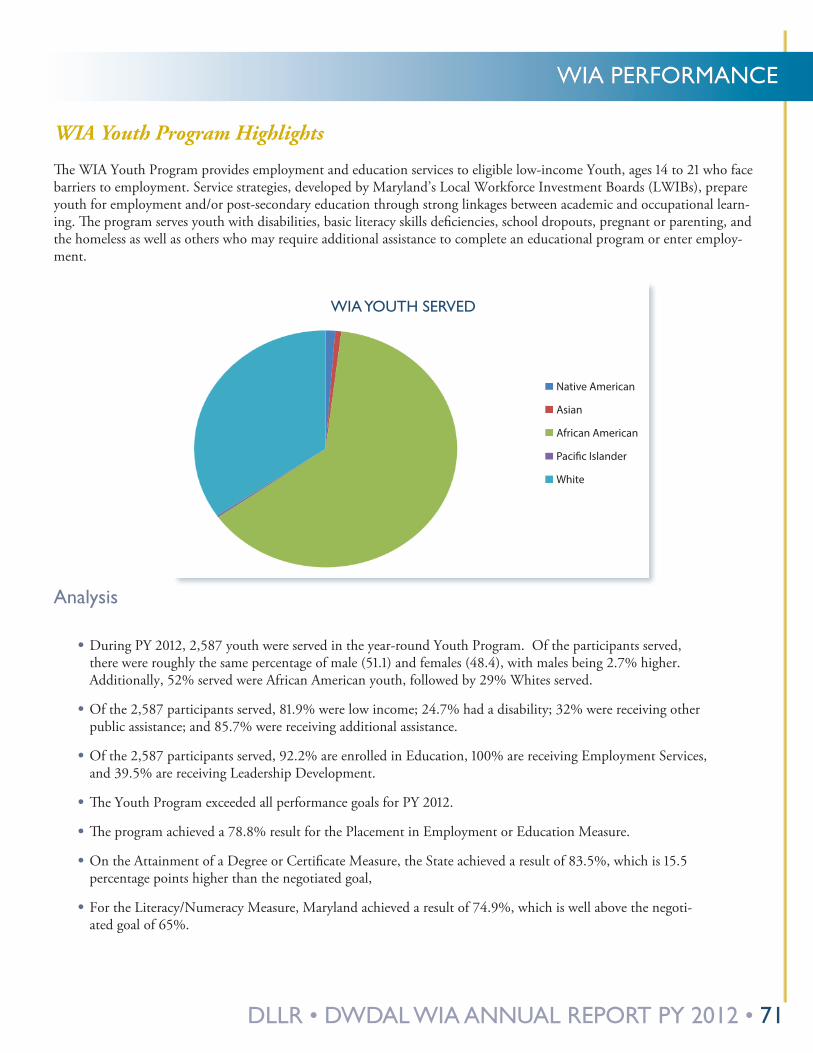
DLLR • DWDAL WIA ANNUAL REPORT PY 2012 • 71
WIA PERFORMANCE
Native American
Asian
African American
Paci�c Islander
White
WIA YOUTH SERVED
WIA Youth Program Highlights
The WIA Youth Program provides employment and education services to eligible low-income Youth, ages 14 to 21 who face barriers to employment. Service strategies, developed by Maryland’s Local Workforce Investment Boards (LWIBs), prepare youth for employment and/or post-secondary education through strong linkages between academic and occupational learn-ing. The program serves youth with disabilities, basic literacy skills deficiencies, school dropouts, pregnant or parenting, and the homeless as well as others who may require additional assistance to complete an educational program or enter employ-ment.
Analysis
• During PY 2012, 2,587 youth were served in the year-round Youth Program. Of the participants served, there were roughly the same percentage of male (51.1) and females (48.4), with males being 2.7% higher. Additionally, 52% served were African American youth, followed by 29% Whites served.
• Of the 2,587 participants served, 81.9% were low income; 24.7% had a disability; 32% were receiving other public assistance; and 85.7% were receiving additional assistance.
• Of the 2,587 participants served, 92.2% are enrolled in Education, 100% are receiving Employment Services, and 39.5% are receiving Leadership Development.
• The Youth Program exceeded all performance goals for PY 2012.
• The program achieved a 78.8% result for the Placement in Employment or Education Measure.
• On the Attainment of a Degree or Certificate Measure, the State achieved a result of 83.5%, which is 15.5 percentage points higher than the negotiated goal,
• For the Literacy/Numeracy Measure, Maryland achieved a result of 74.9%, which is well above the negoti-ated goal of 65%.
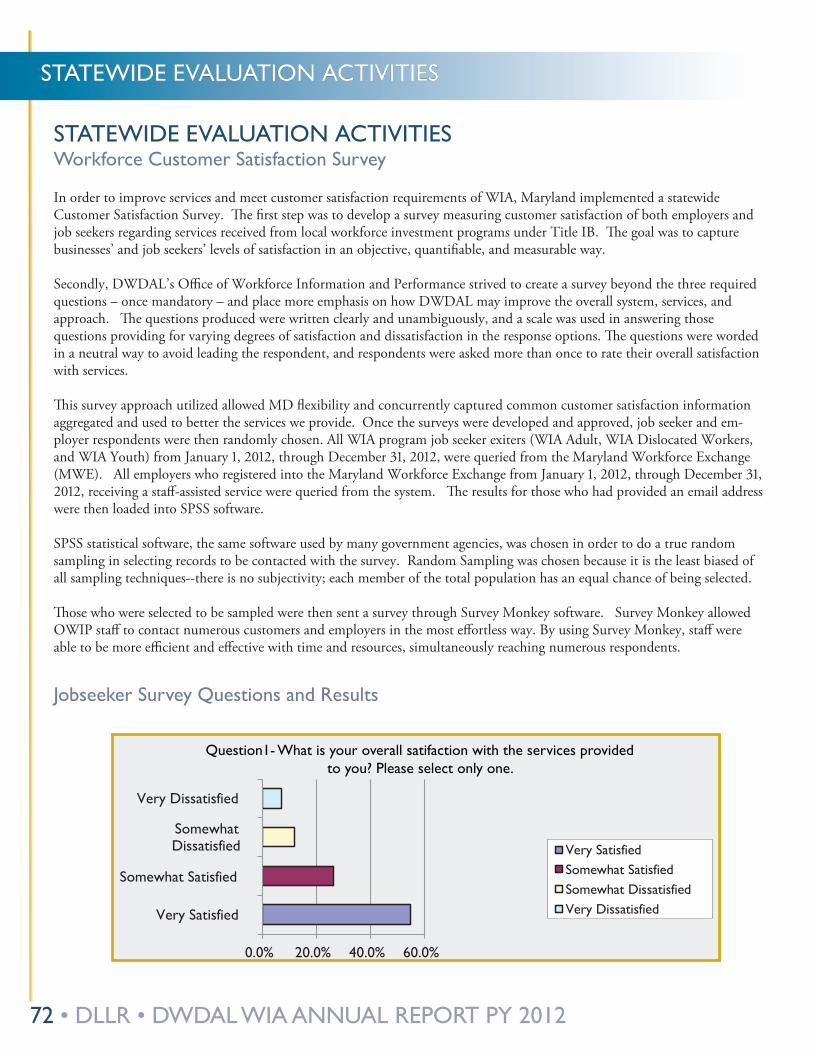
72 • DLLR • DWDAL WIA ANNUAL REPORT PY 2012
STATEWIDE EvALUATION ACTIvITIES
STATEWIDE EvALUATION ACTIvITIESWorkforce Customer Satisfaction Survey
In order to improve services and meet customer satisfaction requirements of WIA, Maryland implemented a statewide Customer Satisfaction Survey. The first step was to develop a survey measuring customer satisfaction of both employers and job seekers regarding services received from local workforce investment programs under Title IB. The goal was to capture businesses’ and job seekers’ levels of satisfaction in an objective, quantifiable, and measurable way.
Secondly, DWDAL’s Office of Workforce Information and Performance strived to create a survey beyond the three required questions – once mandatory – and place more emphasis on how DWDAL may improve the overall system, services, and approach. The questions produced were written clearly and unambiguously, and a scale was used in answering those questions providing for varying degrees of satisfaction and dissatisfaction in the response options. The questions were worded in a neutral way to avoid leading the respondent, and respondents were asked more than once to rate their overall satisfaction with services.
This survey approach utilized allowed MD flexibility and concurrently captured common customer satisfaction information aggregated and used to better the services we provide. Once the surveys were developed and approved, job seeker and em-ployer respondents were then randomly chosen. All WIA program job seeker exiters (WIA Adult, WIA Dislocated Workers, and WIA Youth) from January 1, 2012, through December 31, 2012, were queried from the Maryland Workforce Exchange (MWE). All employers who registered into the Maryland Workforce Exchange from January 1, 2012, through December 31, 2012, receiving a staff-assisted service were queried from the system. The results for those who had provided an email address were then loaded into SPSS software.
SPSS statistical software, the same software used by many government agencies, was chosen in order to do a true random sampling in selecting records to be contacted with the survey. Random Sampling was chosen because it is the least biased of all sampling techniques--there is no subjectivity; each member of the total population has an equal chance of being selected.
Those who were selected to be sampled were then sent a survey through Survey Monkey software. Survey Monkey allowed OWIP staff to contact numerous customers and employers in the most effortless way. By using Survey Monkey, staff were able to be more efficient and effective with time and resources, simultaneously reaching numerous respondents.
Very Satisfied
Somewhat Satisfied
SomewhatDissatisfied
Very Dissatisfied
0.0% 20.0% 40.0% 60.0%
Very SatisfiedSomewhat SatisfiedSomewhat DissatisfiedVery Dissatisfied
Question1- What is your overall satifaction with the services provided to you? Please select only one.
Jobseeker Survey Questions and Results
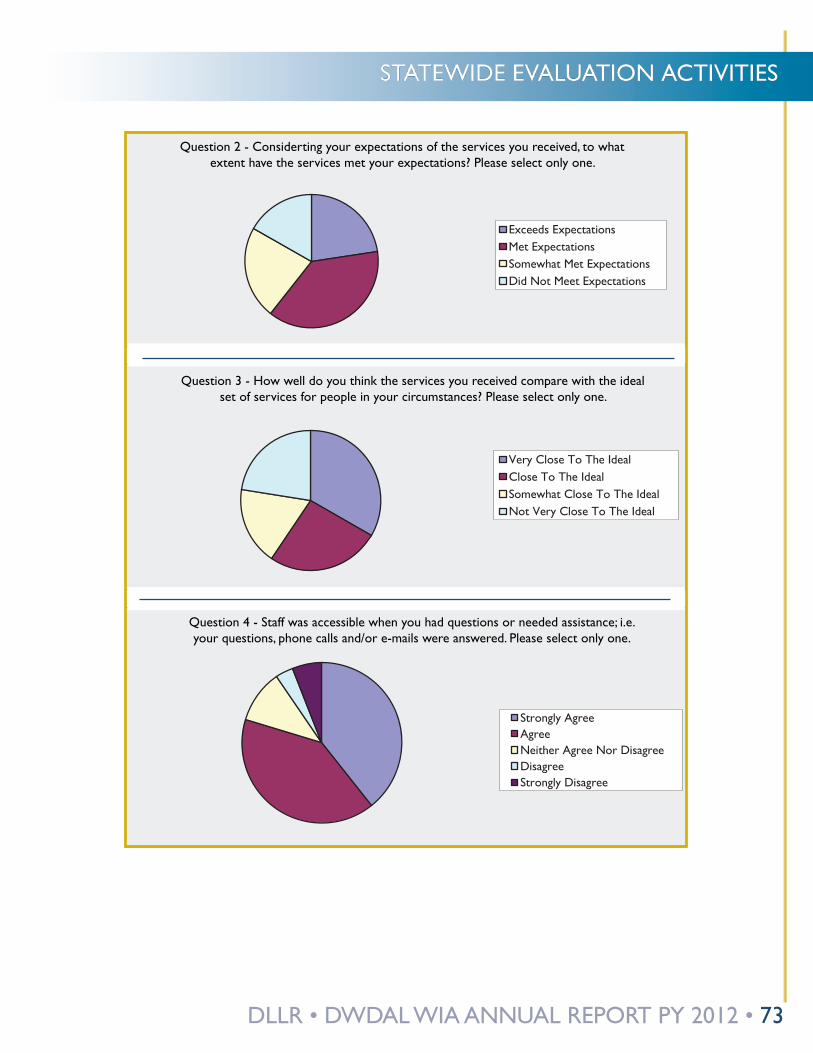
DLLR • DWDAL WIA ANNUAL REPORT PY 2012 • 73
STATEWIDE EvALUATION ACTIvITIES
Exceeds ExpectationsMet ExpectationsSomewhat Met ExpectationsDid Not Meet Expectations
Very Close To The IdealClose To The IdealSomewhat Close To The IdealNot Very Close To The Ideal
Strongly AgreeAgreeNeither Agree Nor DisagreeDisagreeStrongly Disagree
Question 2 - Considerting your expectations of the services you received, to what extent have the services met your expectations? Please select only one.
Question 3 - How well do you think the services you received compare with the ideal set of services for people in your circumstances? Please select only one.
Question 4 - Staff was accessible when you had questions or needed assistance; i.e. your questions, phone calls and/or e-mails were answered. Please select only one.
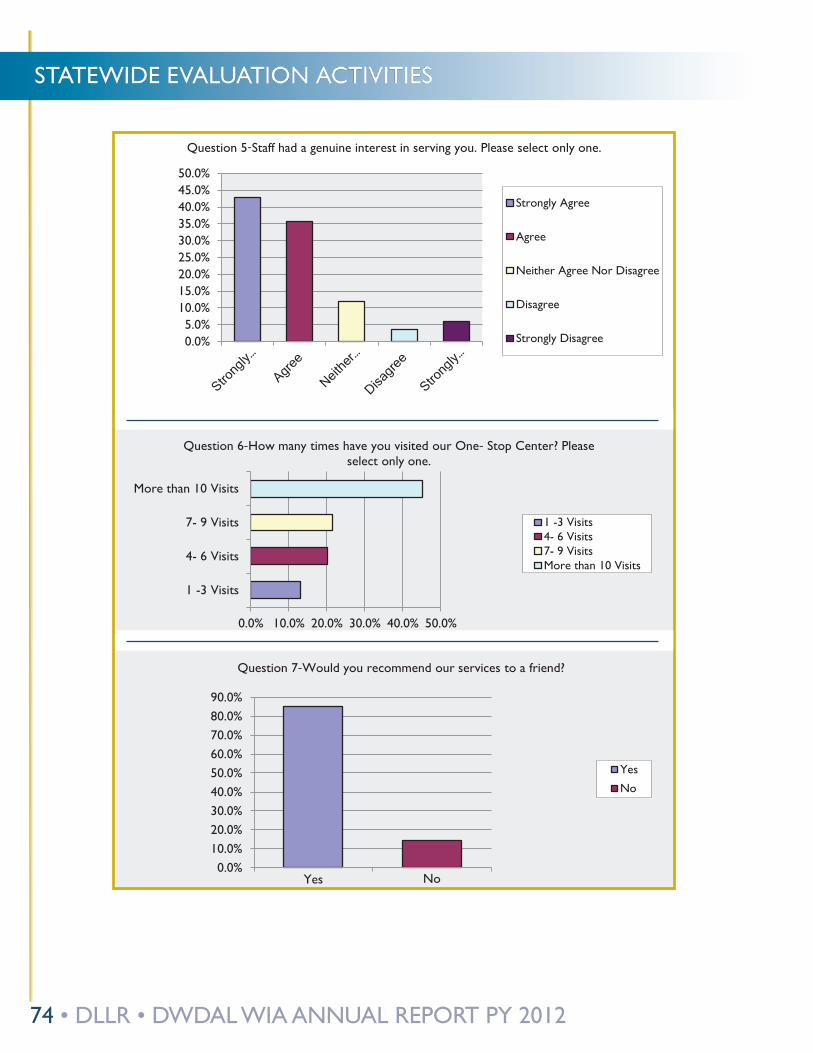
74 • DLLR • DWDAL WIA ANNUAL REPORT PY 2012
STATEWIDE EvALUATION ACTIvITIES
0.0%5.0%
10.0%15.0%20.0%25.0%30.0%35.0%40.0%45.0%50.0%
Question 5-Staff had a genuine interest in serving you. Please select only one.
Strongly Agree
Agree
Neither Agree Nor Disagree
Disagree
Strongly Disagree
1 -3 Visits
4- 6 Visits
7- 9 Visits
More than 10 Visits
0.0% 10.0% 20.0% 30.0% 40.0% 50.0%
Question 6-How many times have you visited our One- Stop Center? Please select only one.
1 -3 Visits4- 6 Visits7- 9 VisitsMore than 10 Visits
Yes No0.0%
10.0%20.0%30.0%40.0%50.0%60.0%70.0%80.0%90.0%
Question 7-Would you recommend our services to a friend?
Yes
No
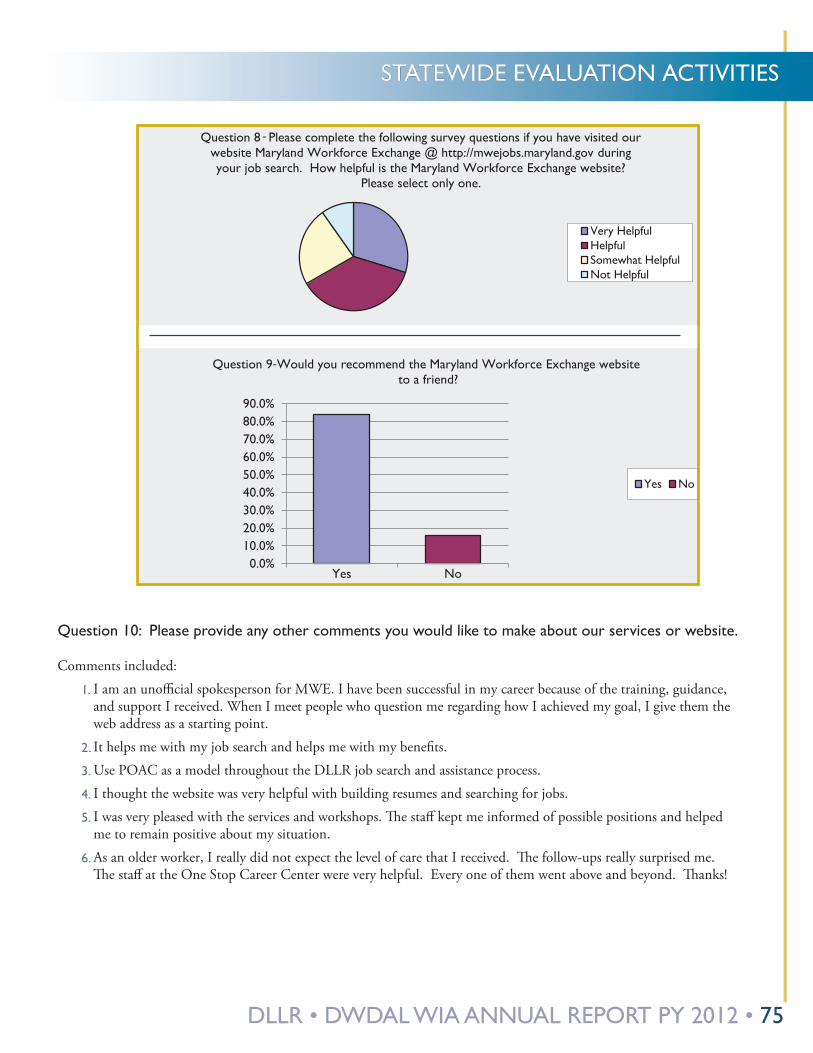
DLLR • DWDAL WIA ANNUAL REPORT PY 2012 • 75
Question 8 - Please complete the following survey questions if you have visited our website Maryland Workforce Exchange @ http://mwejobs.maryland.gov during your job search. How helpful is the Maryland Workforce Exchange website?
Please select only one.
Very HelpfulHelpfulSomewhat HelpfulNot Helpful
Yes No0.0%
10.0%20.0%30.0%40.0%50.0%60.0%70.0%80.0%90.0%
Question 9-Would you recommend the Maryland Workforce Exchange website to a friend?
Yes No
Question 10: Please provide any other comments you would like to make about our services or website�
Comments included:
1� I am an unofficial spokesperson for MWE. I have been successful in my career because of the training, guidance, and support I received. When I meet people who question me regarding how I achieved my goal, I give them the web address as a starting point.
2� It helps me with my job search and helps me with my benefits.
3� Use POAC as a model throughout the DLLR job search and assistance process.
4� I thought the website was very helpful with building resumes and searching for jobs.
5� I was very pleased with the services and workshops. The staff kept me informed of possible positions and helped me to remain positive about my situation.
6� As an older worker, I really did not expect the level of care that I received. The follow-ups really surprised me. The staff at the One Stop Career Center were very helpful. Every one of them went above and beyond. Thanks!
STATEWIDE EvALUATION ACTIvITIES
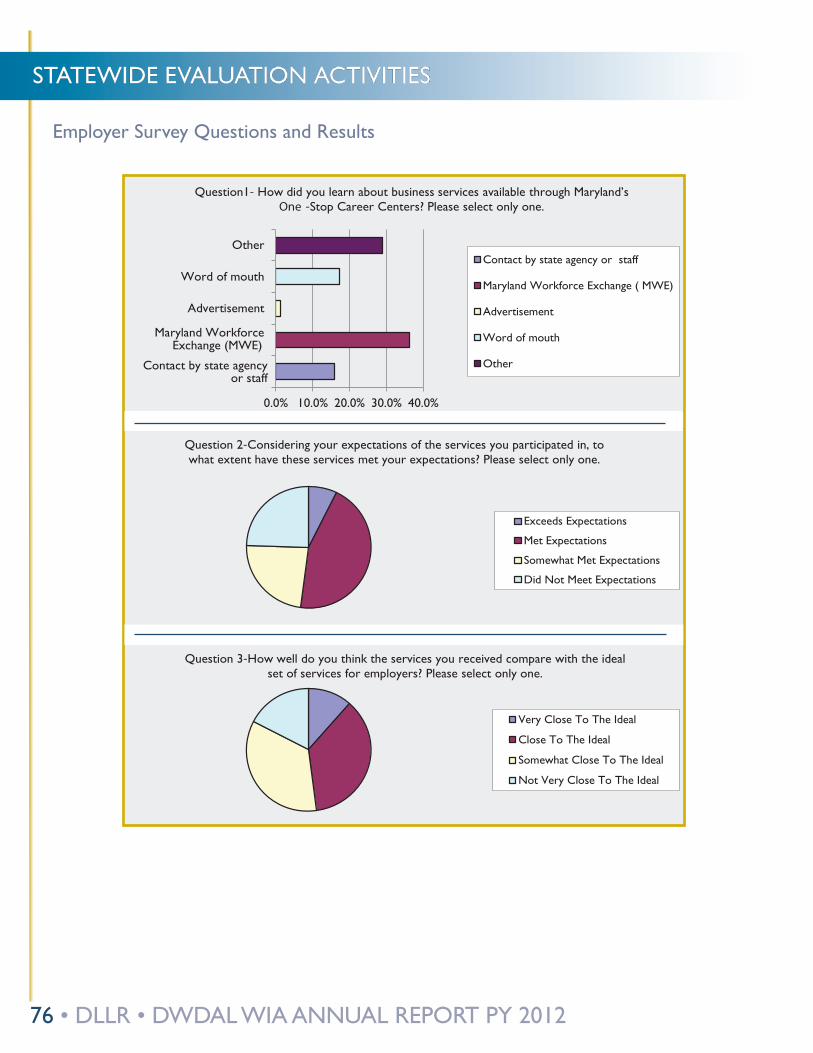
76 • DLLR • DWDAL WIA ANNUAL REPORT PY 2012
STATEWIDE EvALUATION ACTIvITIES
Employer Survey Questions and Results
Contact by state agencyor staff
Maryland WorkforceExchange (MWE)
Advertisement
Word of mouth
Other
0.0% 10.0% 20.0% 30.0% 40.0%
Question1- How did you learn about business services available through Maryland’s One -Stop Career Centers? Please select only one.
Contact by state agency or staff
Maryland Workforce Exchange ( MWE)
Advertisement
Word of mouth
Other
Question 2-Considering your expectations of the services you participated in, to what extent have these services met your expectations? Please select only one.
Exceeds Expectations
Met Expectations
Somewhat Met Expectations
Did Not Meet Expectations
Question 3-How well do you think the services you received compare with the ideal set of services for employers? Please select only one.
Very Close To The Ideal
Close To The Ideal
Somewhat Close To The Ideal
Not Very Close To The Ideal
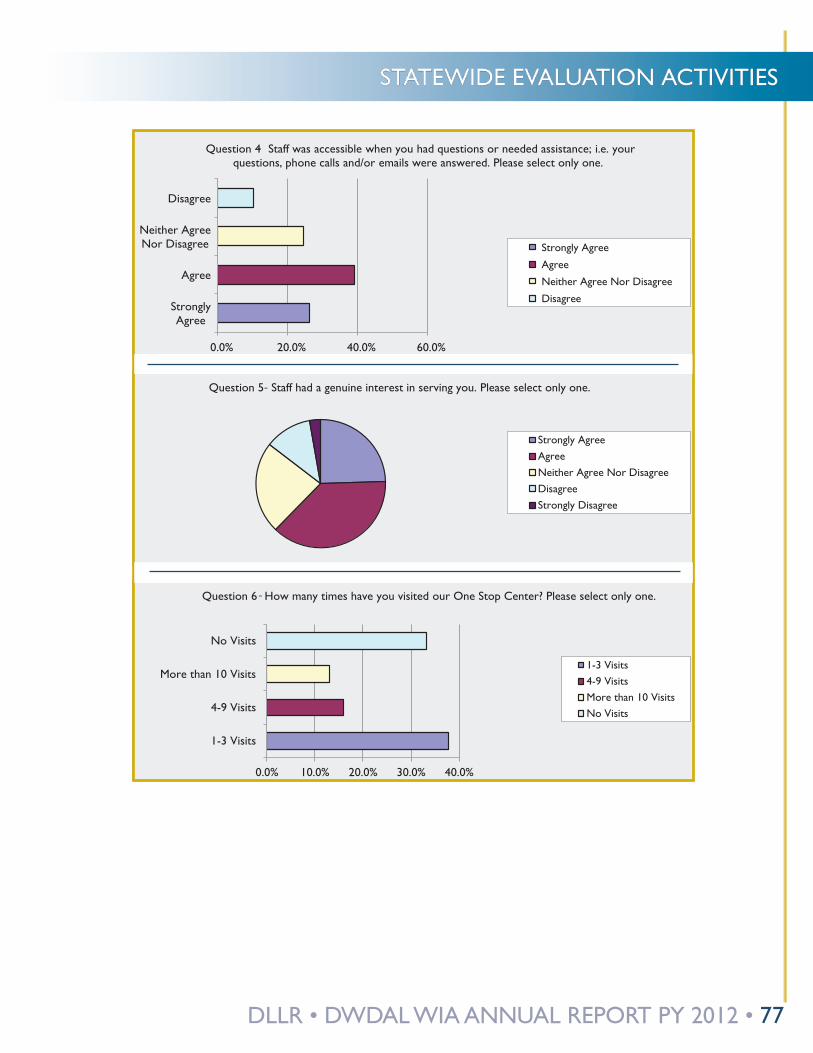
DLLR • DWDAL WIA ANNUAL REPORT PY 2012 • 77
STATEWIDE EvALUATION ACTIvITIES
StronglyAgree
Agree
Neither AgreeNor Disagree
Disagree
0.0% 20.0% 40.0% 60.0%
Question 4- Staff was accessible when you had questions or needed assistance; i.e. your questions, phone calls and/or emails were answered. Please select only one.
Strongly Agree
Agree
Neither Agree Nor Disagree
Disagree
Question 5- Staff had a genuine interest in serving you. Please select only one.
Strongly AgreeAgreeNeither Agree Nor DisagreeDisagreeStrongly Disagree
1-3 Visits
4-9 Visits
More than 10 Visits
No Visits
0.0% 10.0% 20.0% 30.0% 40.0%
Question 6 - How many times have you visited our One Stop Center? Please select only one.
1-3 Visits4-9 VisitsMore than 10 VisitsNo Visits
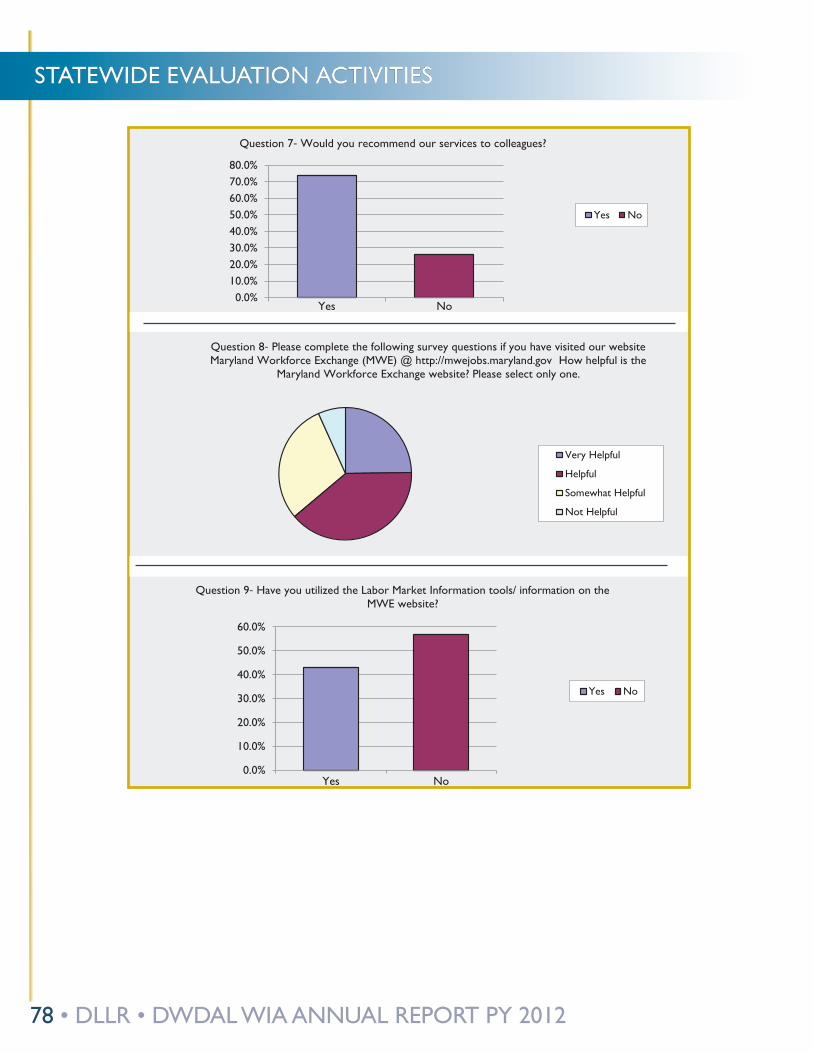
78 • DLLR • DWDAL WIA ANNUAL REPORT PY 2012
STATEWIDE EvALUATION ACTIvITIES
Yes No0.0%
10.0%20.0%30.0%40.0%50.0%60.0%70.0%80.0%
Question 7- Would you recommend our services to colleagues?
Yes No
Question 8- Please complete the following survey questions if you have visited our website Maryland Workforce Exchange (MWE) @ http://mwejobs.maryland.gov How helpful is the
Maryland Workforce Exchange website? Please select only one.
Very Helpful
Helpful
Somewhat Helpful
Not Helpful
Yes No0.0%
10.0%
20.0%
30.0%
40.0%
50.0%
60.0%
Question 9- Have you utilized the Labor Market Information tools/ information on the MWE website?
Yes No
DLLR • DWDAL WIA ANNUAL REPORT PY 2012 • 79
STATEWIDE EvALUATION ACTIvITIES
Question 10: Please provide any other comments you would like to make about our services or web site�
Comments included:
1� Very user-friendly site, easily navigated by employers and job seekers.
2� I have had interaction with our local office in order to post job openings for our nonprofit local organization. They were very helpful. The website was not very user friendly for posting new positions. I don’t remember what the issue was that I had, but emailing our local office with the posting was much easier.
3� The one problem that we have had when posting a job is that most of the responses we receive are from people that are not qualified for the positions posted even though the posting contained what skill sets were required. I believe we posted an ad a couple of years ago for skilled carpenters and most of the responses we got were from individuals that that had no background in carpentry at all. The same has happened in a couple of other postings we made.
4� Pre-screening of candidates and resumes to ensure to correctly represent themselves and MWE.
5� Well done.
Conclusions
Jobseekers: 80% are somewhat or very satisfied with the services we provided. Over 60% felt the services they received met or exceeded their expectations. Almost 60% felt the services they received were ideal for individuals in their circumstances. Over 79% felt staff were accessible and reachable, and 78.6% trusted staff had a real interest in serving them. 85.4% would recommend our services. Of those who visited the MWE, 66% found the site helpful or very helpful. Of those who visited the MWE, 84% would recommend it to a friend. Overall, the majority of customers who utilized our services found them useful and helpful in supporting their needs.
employers: 52.1% felt the services they received met and exceeded their expectations. About 48% felt the services they received were ideal for employers in their circumstances. A majority of employers surveyed (36%) were introduced to our American One Stop Centers through the MWE. Over 65% felt staff was accessible and reachable, and 62% of employers trusted staff had a real interest in serving them. 74% of would recommend our services to colleagues. Of employers who used MWE, 64% found the site helpful or very helpful. Overall, the survey results show there are areas that may require some growth and improvement. For example, less than half of the employers surveyed felt the services they received were ideal and slightly over one-half felt services met or exceeded their expectations. These surveys proved to be a starting point to determine where, if any, issues may exist. Once all areas are fully examined, and issues determined, a resolution can later be implemented. What stands out in these surveys results is that our staff, our system, and the services provided were beneficial and a valuable asset to our Job Seekers and Employers alike.
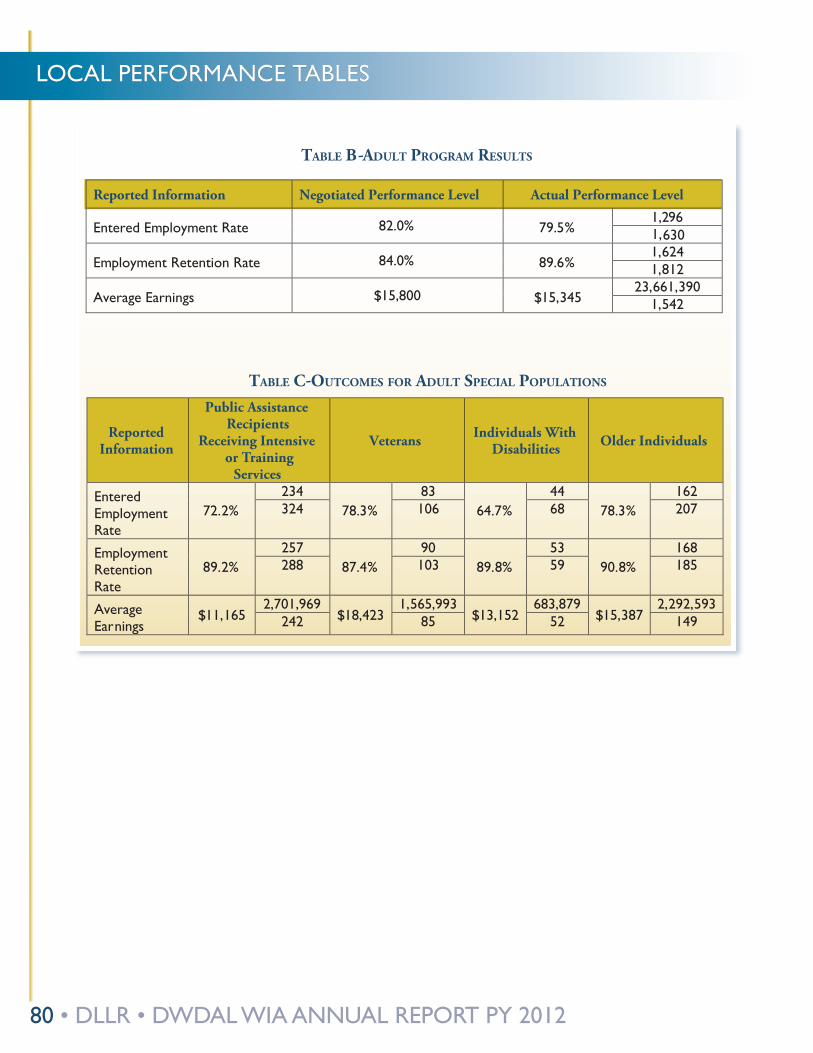
80 • DLLR • DWDAL WIA ANNUAL REPORT PY 2012
LOCAL PERFORMANCE TABLES
TABLE B - ADULT PROGRAM RESULTS
Reported Information Negotiated Performance Level Actual Performance Level
Entered Employment Rate 82.0% 79.5% 1,296 1,630
Employment Retention Rate 84.0% 89.6% 1,624 1,812
Average Earnings $15,800 $15,345 23,661,390
1,542
TABLE C - OUTCOMES FOR ADULT SPECIAL POPULATIONS
Reported Information
Public Assistance Recipients
Receiving Intensive or Training
Services
Veterans Individuals With Disabilities Older Individuals
Entered Employment Rate
72.2% 234
78.3% 83
64.7% 44
78.3% 162
324 106 68 207
Employment Retention Rate
89.2% 257
87.4% 90
89.8% 53
90.8% 168
288 103 59 185
Average Earnings
$11,165 2,701,969
$18,423 1,565,993
$13,152 683,879
$15,387 2,292,593
242 85 52 149
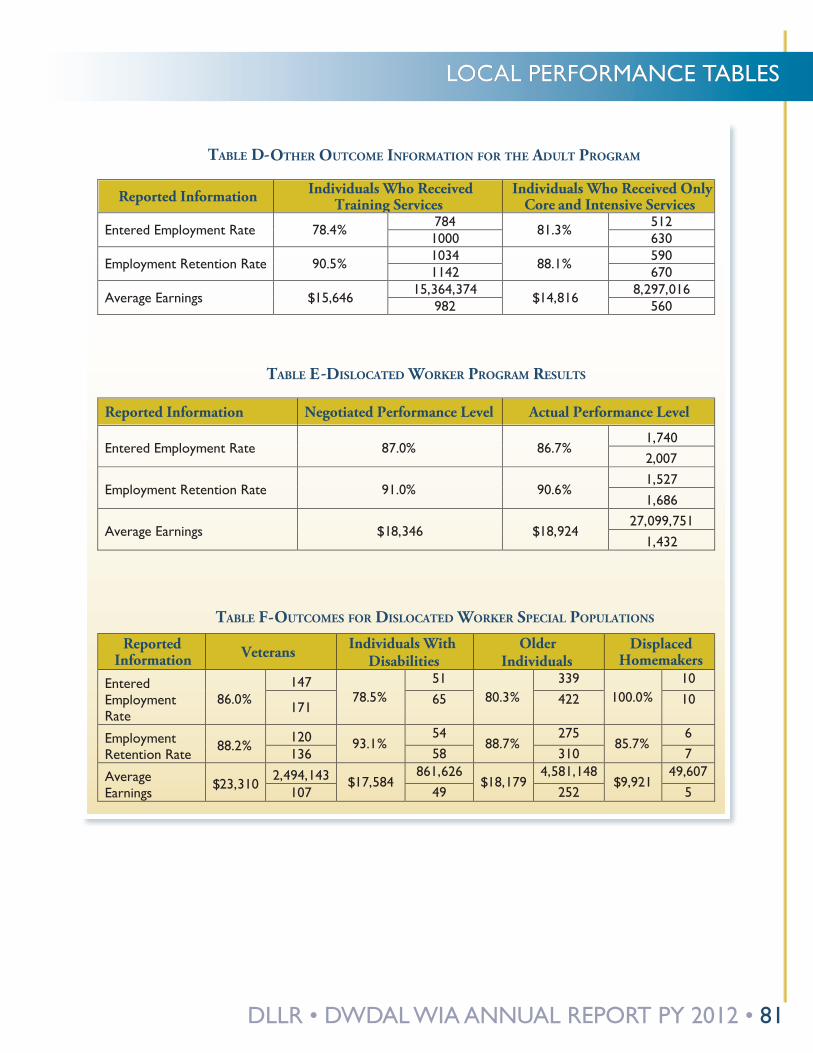
DLLR • DWDAL WIA ANNUAL REPORT PY 2012 • 81
LOCAL PERFORMANCE TABLES
TABLE D -OTHER OUTCOME INFORMATION FOR THE ADULT PROGRAM
Reported Information Individuals Who Received Training Services
Individuals Who Received Only Core and Intensive Services
Entered Employment Rate 78.4% 784 81.3% 512 1000 630
Employment Retention Rate 90.5% 1034 88.1% 590 1142 670
Average Earnings $15,646 15,364,374
$14,816 8,297,016
982 560
TABLE E - DISLOCATED WORKER PROGRAM RESULTS
Reported Information Negotiated Performance Level Actual Performance Level
Entered Employment Rate 87.0% 86.7% 1,740 2,007
Employment Retention Rate 91.0% 90.6% 1,527 1,686
Average Earnings $18,346 $18,924 27,099,751
1,432
TABLE F -OUTCOMES FOR DISLOCATED WORKER SPECIAL POPULATIONS Reported
Information Veterans Individuals With Disabilities
Older Individuals
Displaced Homemakers
Entered Employment Rate
86.0% 147
78.5% 51
80.3% 339
100.0% 10
171 65 422 10
Employment Retention Rate 88.2% 120 93.1%
54 88.7%
275 85.7%
6 136 58 310 7
Average Earnings
$23,310 2,494,143 $17,584
861,626 $18,179
4,581,148 $9,921
49,607 107 49 252 5
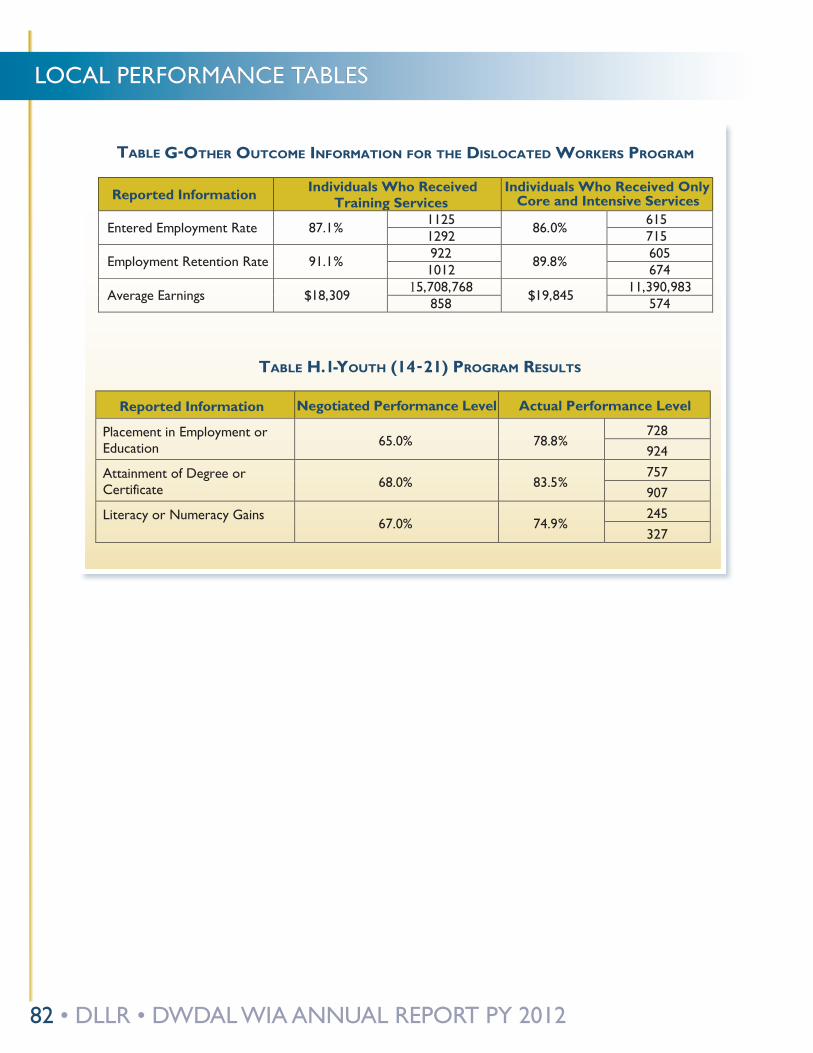
82 • DLLR • DWDAL WIA ANNUAL REPORT PY 2012
LOCAL PERFORMANCE TABLES
TABLE G-OTHER OUTCOME INFORMATION FOR THE DISLOCATED WORKERS PROGRAM
Reported Information Individuals Who Received Training Services
Individuals Who Received Only Core and Intensive Services
Entered Employment Rate 87.1% 1125 86.0% 615 1292 715
Employment Retention Rate 91.1% 922 89.8% 605 1012 674
Average Earnings $18,309 15,708,768 $19,845
11,390,983 858 574
TABLE H.1 - YOUTH (14 -21) PROGRAM RESULTS
Reported Information Negotiated Performance Level Actual Performance Level
Placement in Employment or Education 65.0% 78.8%
728 924
Attainment of Degree or Certificate 68.0% 83.5%
757 907
Literacy or Numeracy Gains 67.0% 74.9%
245 327
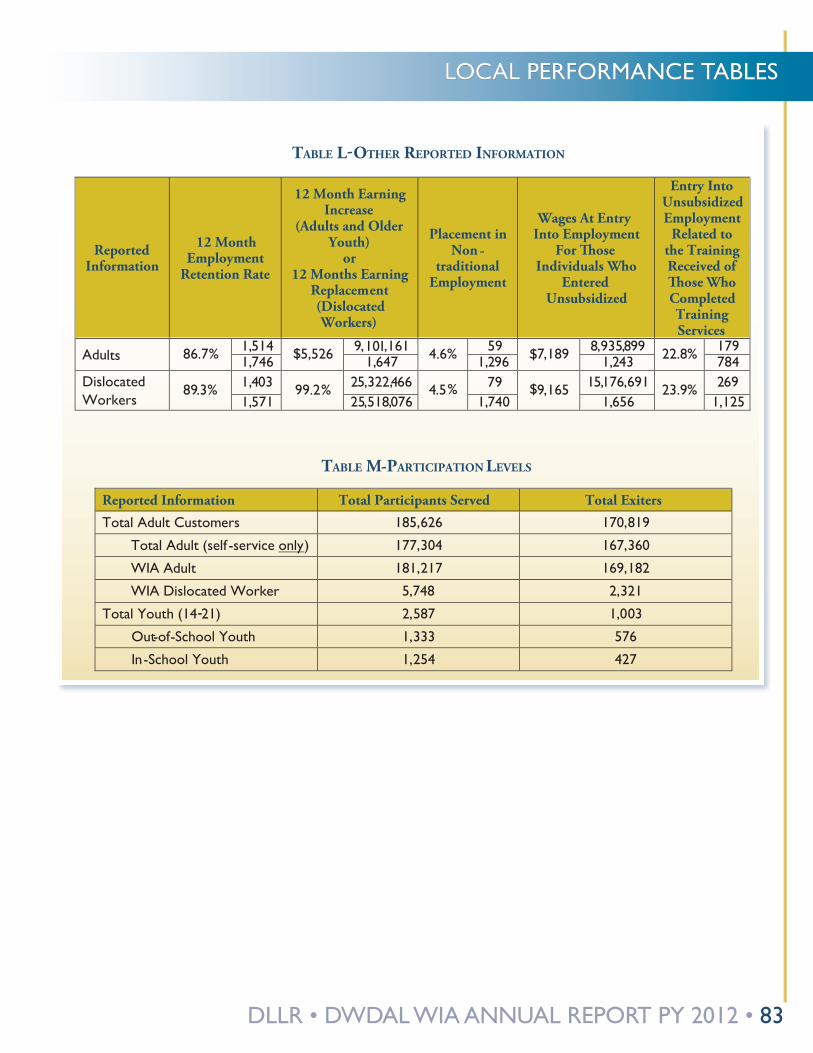
DLLR • DWDAL WIA ANNUAL REPORT PY 2012 • 83
LOCAL PERFORMANCE TABLES
TABLE L - OTHER REPORTED INFORMATION
Reported Information
12 Month Employment
Retention Rate
12 Month Earning Increase
(Adults and Older Youth)
or 12 Months Earning
Replacement (Dislocated Workers)
Placement in Non -
traditional Employment
Wages At Entry Into Employment
For �ose Individuals Who
Entered Unsubsidized
Entry Into Unsubsidized Employment
Related to the Training Received of �ose Who Completed Training Services
Adults 86.7% 1,514 $5,526 9,101,161 4.6% 59 $7,189 8,935,899 22.8% 179 1,746 1,647 1,296 1,243 784
Dislocated Workers
89.3% 1,403 99.2% 25,322,466 4.5% 79 $9,165 15,176,691 23.9% 269 1,571 25,518,076 1,740 1,656 1,125
TABLE M -PARTICIPATION LEVELS
Reported Information Total Participants Served Total Exiters
Total Adult Customers 185,626 170,819 Total Adult (self -service only) 177,304 167,360
WIA Adult 181,217 169,182
WIA Dislocated Worker 5,748 2,321
Total Youth (14-21) 2,587 1,003
Out-of-School Youth 1,333 576
In-School Youth 1,254 427
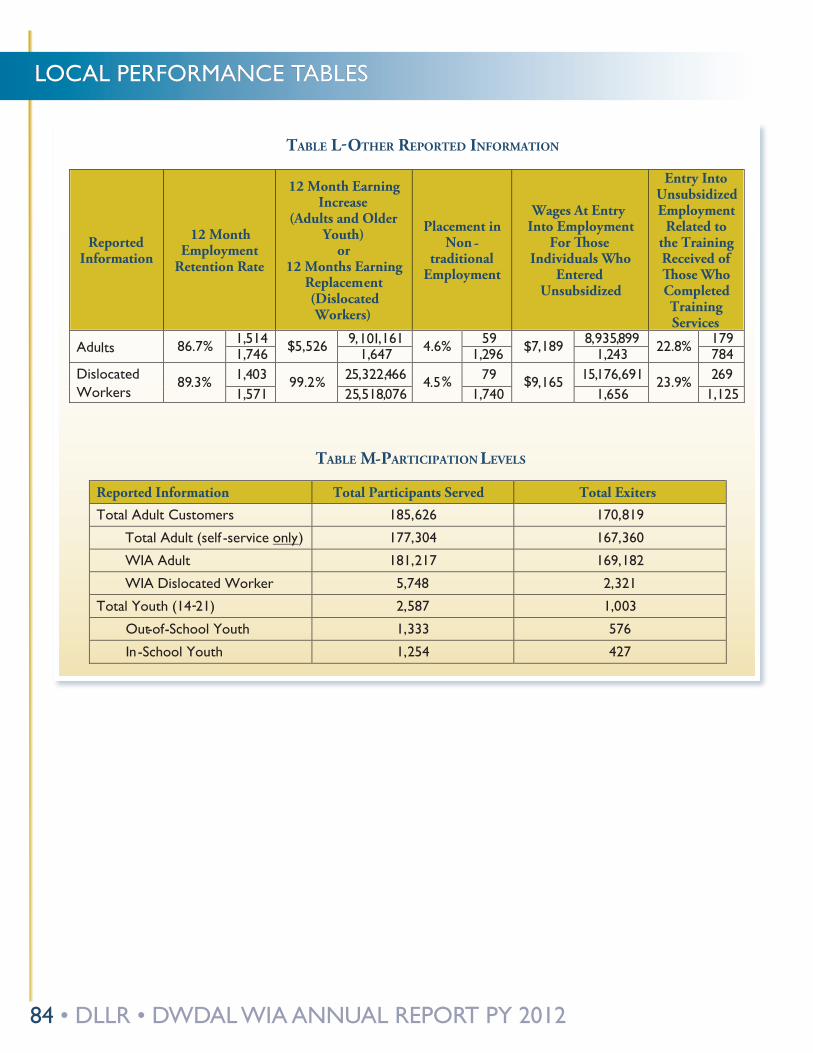
84 • DLLR • DWDAL WIA ANNUAL REPORT PY 2012
LOCAL PERFORMANCE TABLES
TABLE L - OTHER REPORTED INFORMATION
Reported Information
12 Month Employment
Retention Rate
12 Month Earning Increase
(Adults and Older Youth)
or 12 Months Earning
Replacement (Dislocated Workers)
Placement in Non -
traditional Employment
Wages At Entry Into Employment
For �ose Individuals Who
Entered Unsubsidized
Entry Into Unsubsidized Employment
Related to the Training Received of �ose Who Completed Training Services
Adults 86.7% 1,514 $5,526 9,101,161 4.6% 59 $7,189 8,935,899 22.8% 179 1,746 1,647 1,296 1,243 784
Dislocated Workers
89.3% 1,403 99.2% 25,322,466 4.5% 79 $9,165 15,176,691 23.9% 269 1,571 25,518,076 1,740 1,656 1,125
TABLE M -PARTICIPATION LEVELS
Reported Information Total Participants Served Total Exiters
Total Adult Customers 185,626 170,819 Total Adult (self -service only) 177,304 167,360
WIA Adult 181,217 169,182
WIA Dislocated Worker 5,748 2,321
Total Youth (14-21) 2,587 1,003
Out-of-School Youth 1,333 576
In-School Youth 1,254 427
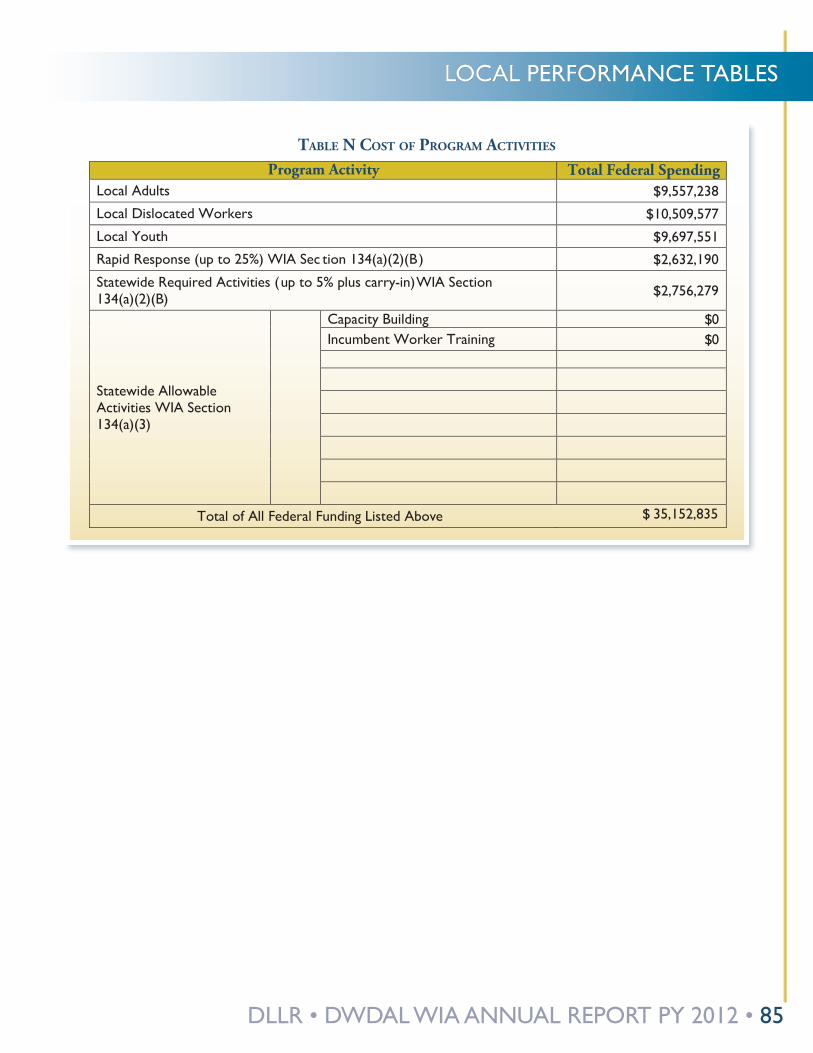
DLLR • DWDAL WIA ANNUAL REPORT PY 2012 • 85
LOCAL PERFORMANCE TABLES
TABLE N COST OF PROGRAM ACTIVITIES
Program Activity Total Federal Spending Local Adults $9,557,238 Local Dislocated Workers $10,509,577 Local Youth $9,697,551 Rapid Response (up to 25%) WIA Sec tion 134(a)(2)(B) $2,632,190 Statewide Required Activities (up to 5% plus carry-in)WIA Section 134(a)(2)(B) $2,756,279
Statewide Allowable Activities WIA Section 134(a)(3)
Capacity Building $0 Incumbent Worker Training $0
Total of All Federal Funding Listed Above $ 35,152,835
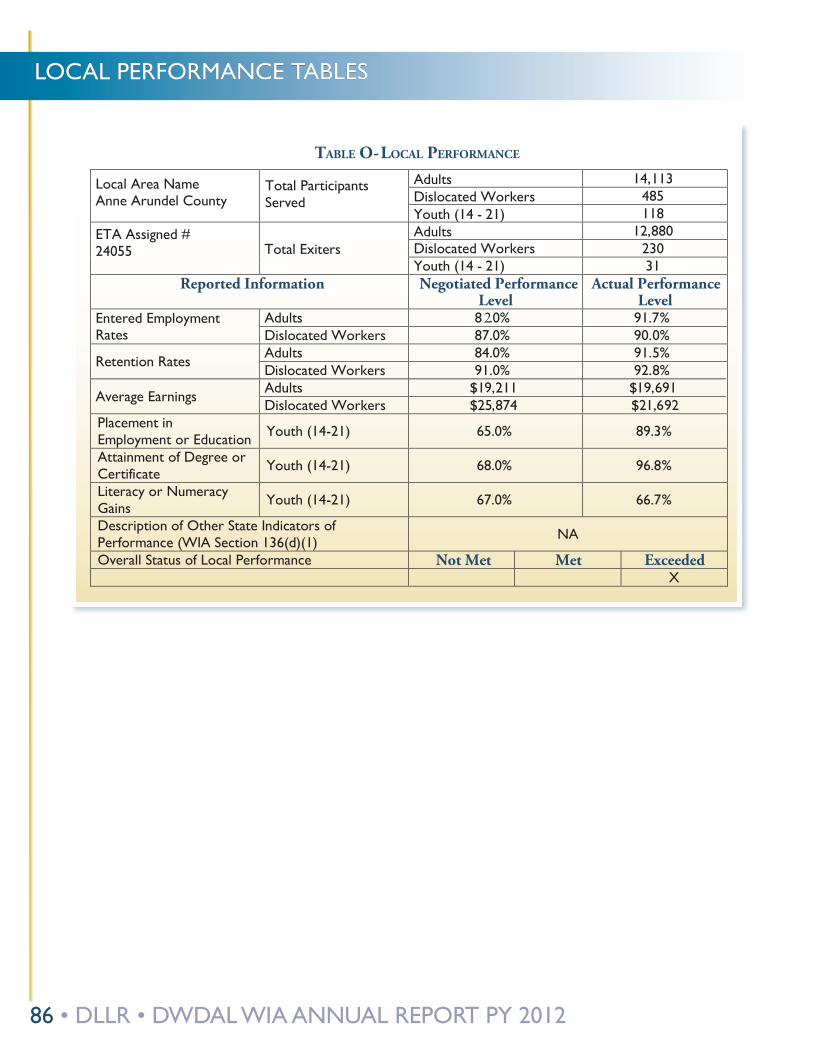
86 • DLLR • DWDAL WIA ANNUAL REPORT PY 2012
LOCAL PERFORMANCE TABLES
TABLE O -LOCAL PERFORMANCE
Local Area Name Anne Arundel County
Total Participants Served
Adults 14,113 Dislocated Workers 485 Youth (14 - 21) 118
ETA Assigned # 24055 Total Exiters
Adults 12,880 Dislocated Workers 230 Youth (14 - 21) 31
Reported Information Negotiated Performance Level
Actual Performance Level
Entered Employment Rates
Adults 8 2.0% 91.7% Dislocated Workers 87.0% 90.0%
Retention Rates Adults 84.0% 91.5% Dislocated Workers 91.0% 92.8%
Average Earnings Adults $19,211 $19,691 Dislocated Workers $25,874 $21,692
Placement in Employment or Education Youth (14-21) 65.0% 89.3%
Attainment of Degree or Certificate Youth (14-21) 68.0% 96.8%
Literacy or Numeracy Gains Youth (14-21) 67.0% 66.7%
Description of Other State Indicators of Performance (WIA Section 136(d)(1) NA
Overall Status of Local Performance Not Met Met Exceeded X
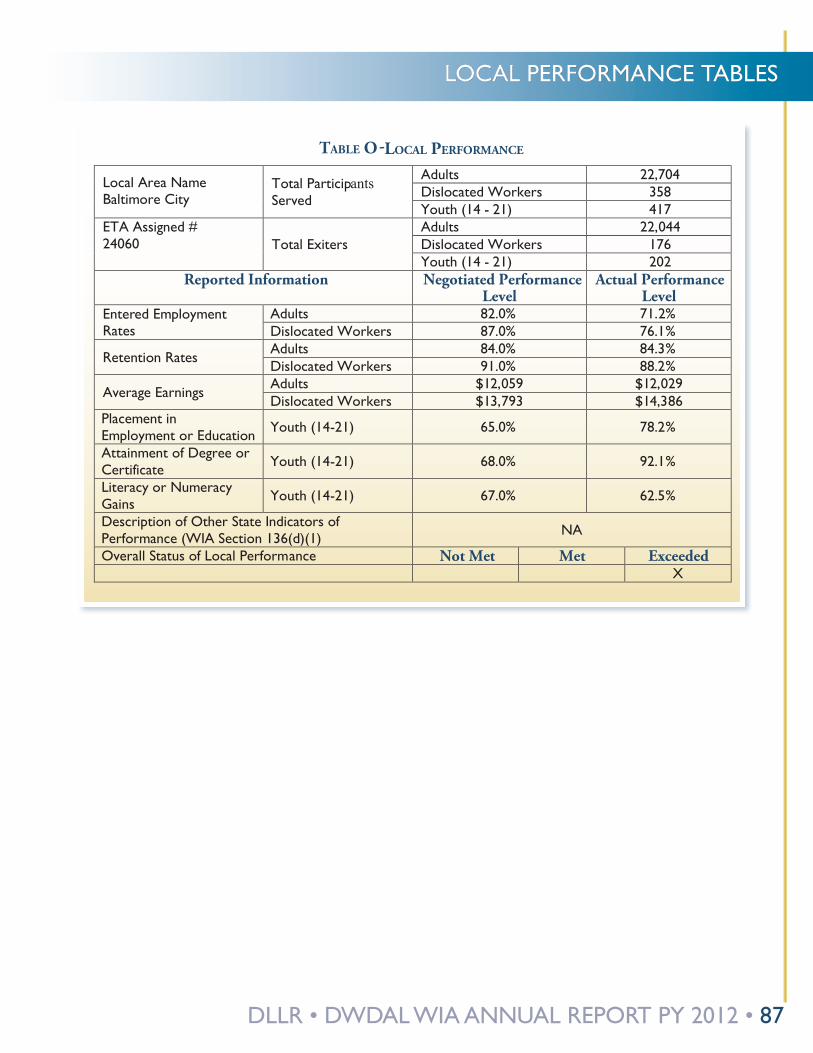
DLLR • DWDAL WIA ANNUAL REPORT PY 2012 • 87
LOCAL PERFORMANCE TABLES
TABLE O - LOCAL PERFORMANCE
Local Area Name
Baltimore City Total Participants Served
Adults 22,704 Dislocated Workers 358 Youth (14 - 21) 417
ETA Assigned # 24060 Total Exiters
Adults 22,044 Dislocated Workers 176 Youth (14 - 21) 202
Reported Information Negotiated Performance Level
Actual Performance Level
Entered Employment Rates
Adults 82.0% 71.2% Dislocated Workers 87.0% 76.1%
Retention Rates Adults 84.0% 84.3% Dislocated Workers 91.0% 88.2%
Average Earnings Adults $12,059 $12,029 Dislocated Workers $13,793 $14,386
Placement in Employment or Education Youth (14-21) 65.0% 78.2%
Attainment of Degree or Certificate Youth (14-21) 68.0% 92.1% Literacy or Numeracy Gains Youth (14-21) 67.0% 62.5%
Description of Other State Indicators of Performance (WIA Section 136(d)(1) NA
Overall Status of Local Performance Not Met Met Exceeded X
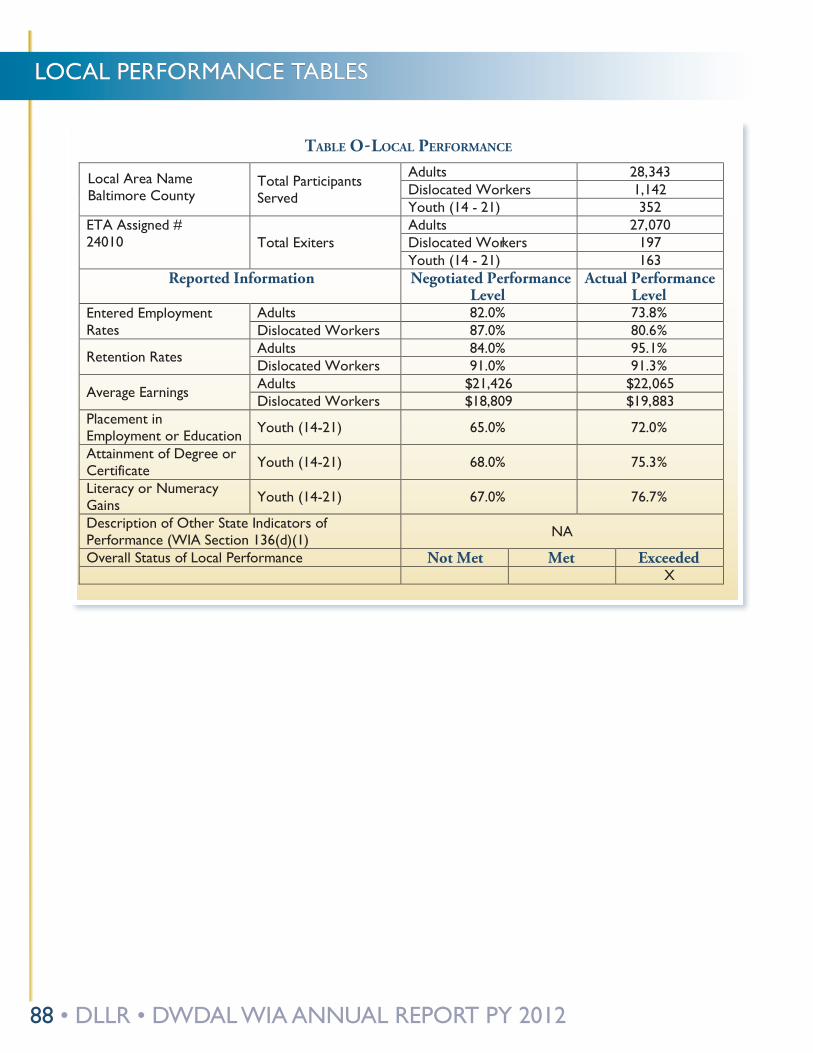
88 • DLLR • DWDAL WIA ANNUAL REPORT PY 2012
LOCAL PERFORMANCE TABLES
Local Area Name Baltimore County
Total Participants Served
Adults 28,343 Dislocated Workers 1,142 Youth (14 - 21) 352
ETA Assigned # 24010 Total Exiters
Adults 27,070 Dislocated Workers 197 Youth (14 - 21) 163
Entered Employment Rates
Adults 82.0% 73.8% Dislocated Workers 87.0% 80.6%
Retention Rates Adults 84.0% 95.1% Dislocated Workers 91.0% 91.3%
Average Earnings Adults $21,426 $22,065 Dislocated Workers $18,809 $19,883
Placement in Employment or Education Youth (14-21) 65.0% 72.0%
Attainment of Degree or Certificate Youth (14-21) 68.0% 75.3%
Literacy or Numeracy Gains Youth (14-21) 67.0% 76.7%
Description of Other State Indicators of Performance (WIA Section 136(d)(1) NA
Overall Status of Local Performance X
TABLE O -LOCAL PERFORMANCE
Reported Information Negotiated Performance Level
Actual Performance Level
Not Met Met Exceeded
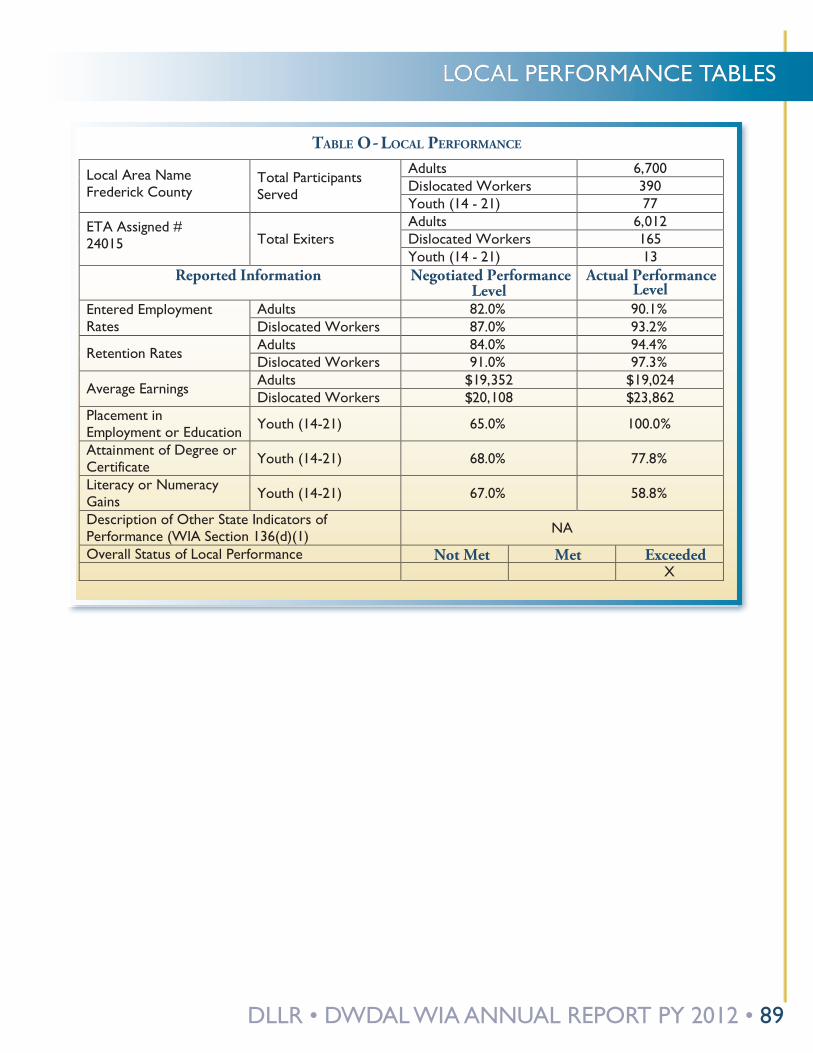
DLLR • DWDAL WIA ANNUAL REPORT PY 2012 • 89
LOCAL PERFORMANCE TABLES
TABLE O -LOCAL PERFORMANCE
Local Area Name Anne Arundel County
Total Participants Served
Adults 14,113 Dislocated Workers 485 Youth (14 - 21) 118
ETA Assigned # 24055 Total Exiters
Adults 12,880 Dislocated Workers 230 Youth (14 - 21) 31
Reported Information Negotiated Performance Level
Actual Performance Level
Entered Employment Rates
Adults 8 2.0% 91.7% Dislocated Workers 87.0% 90.0%
Retention Rates Adults 84.0% 91.5% Dislocated Workers 91.0% 92.8%
Average Earnings Adults $19,211 $19,691 Dislocated Workers $25,874 $21,692
Placement in Employment or Education Youth (14-21) 65.0% 89.3%
Attainment of Degree or Certificate Youth (14-21) 68.0% 96.8%
Literacy or Numeracy Gains Youth (14-21) 67.0% 66.7%
Description of Other State Indicators of Performance (WIA Section 136(d)(1) NA
Overall Status of Local Performance Not Met Met Exceeded X
Local Area Name
Frederick County Total Participants Served
Adults 6,700 Dislocated Workers 390 Youth (14 - 21) 77
ETA Assigned #
24015 Total Exiters Adults 6,012 Dislocated Workers 165 Youth (14 - 21) 13
Entered Employment Rates
Adults 82.0% 90.1% Dislocated Workers 87.0% 93.2%
Retention Rates Adults 84.0% 94.4% Dislocated Workers 91.0% 97.3%
Average Earnings Adults $19,352 $19,024 Dislocated Workers $20,108 $23,862
Placement in Employment or Education Youth (14-21) 65.0% 100.0%
Attainment of Degree or Certificate Youth (14-21) 68.0% 77.8%
Literacy or Numeracy Gains Youth (14-21) 67.0% 58.8%
Description of Other State Indicators of Performance (WIA Section 136(d)(1) NA
Overall Status of Local Performance X
TABLE O - LOCAL PERFORMANCE
Reported Information Negotiated Performance Level
Actual Performance Level
Not Met Met Exceeded

90 • DLLR • DWDAL WIA ANNUAL REPORT PY 2012
LOCAL PERFORMANCE TABLES
Local Area Name
Lower Shore Consortium Total Participants Served
Adults 9,859 Dislocated Workers 37 Youth (14 - 21) 189
ETA Assigned # 24035 Total Exiters
Adults 8,689 Dislocated Workers 31 Youth (14 - 21) 83
Entered Employment Rates
Adults 82.0% 67.6% Dislocated Workers 87.0% 70.4%
Retention Rates Adults 84.0% 93.4% Dislocated Workers 91.0% 93.8%
Average Earnings Adults $9,949 $10,098 Dislocated Workers $13,783 $23,215
Placement in Employment or Education Youth (14-21) 65.0% 65.4%
Attainment of Degree or Certificate Youth (14-21) 68.0% 79.5%
Literacy or Numeracy Gains Youth (14-21) 67.0% 100.0%
Description of Other State Indicators of Performance (WIA Section 136(d)(1) NA
Overall Status of Local Performance X
TABLE O - LOCAL PERFORMANCE
Reported Information Negotiated Performance Level
Actual Performance Level
Not Met Met Exceeded
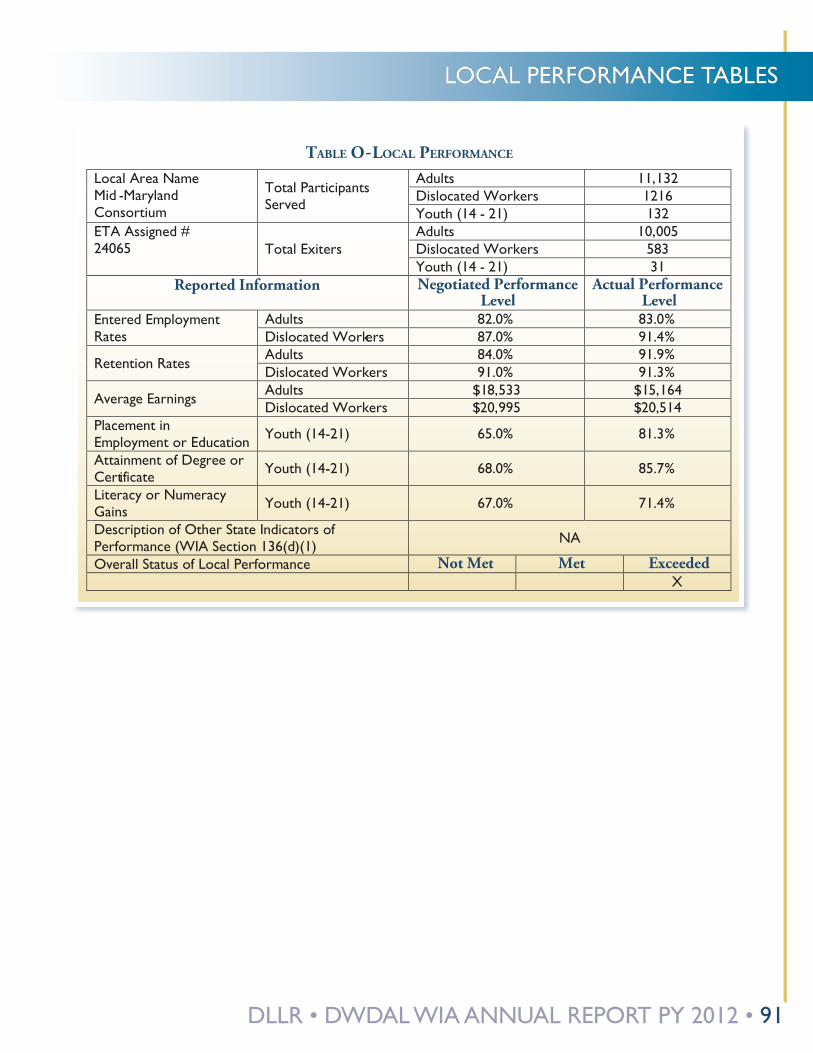
DLLR • DWDAL WIA ANNUAL REPORT PY 2012 • 91
LOCAL PERFORMANCE TABLES
Local Area Name Mid -Maryland Consortium
Total Participants Served
Adults 11,132 Dislocated Workers 1216 Youth (14 - 21) 132
ETA Assigned # 24065 Total Exiters
Adults 10,005 Dislocated Workers 583 Youth (14 - 21) 31
Entered Employment Rates
Adults 82.0% 83.0% Dislocated Workers 87.0% 91.4%
Retention Rates Adults 84.0% 91.9% Dislocated Workers 91.0% 91.3%
Average Earnings Adults $18,533 $15,164 Dislocated Workers $20,995 $20,514
Placement in Employment or Education Youth (14-21) 65.0% 81.3%
Attainment of Degree or Certificate Youth (14-21) 68.0% 85.7%
Literacy or Numeracy Gains Youth (14-21) 67.0% 71.4%
Description of Other State Indicators of Performance (WIA Section 136(d)(1) NA
Overall Status of Local Performance X
TABLE O -LOCAL PERFORMANCE
Reported Information Negotiated Performance Level
Actual Performance Level
Not Met Met Exceeded
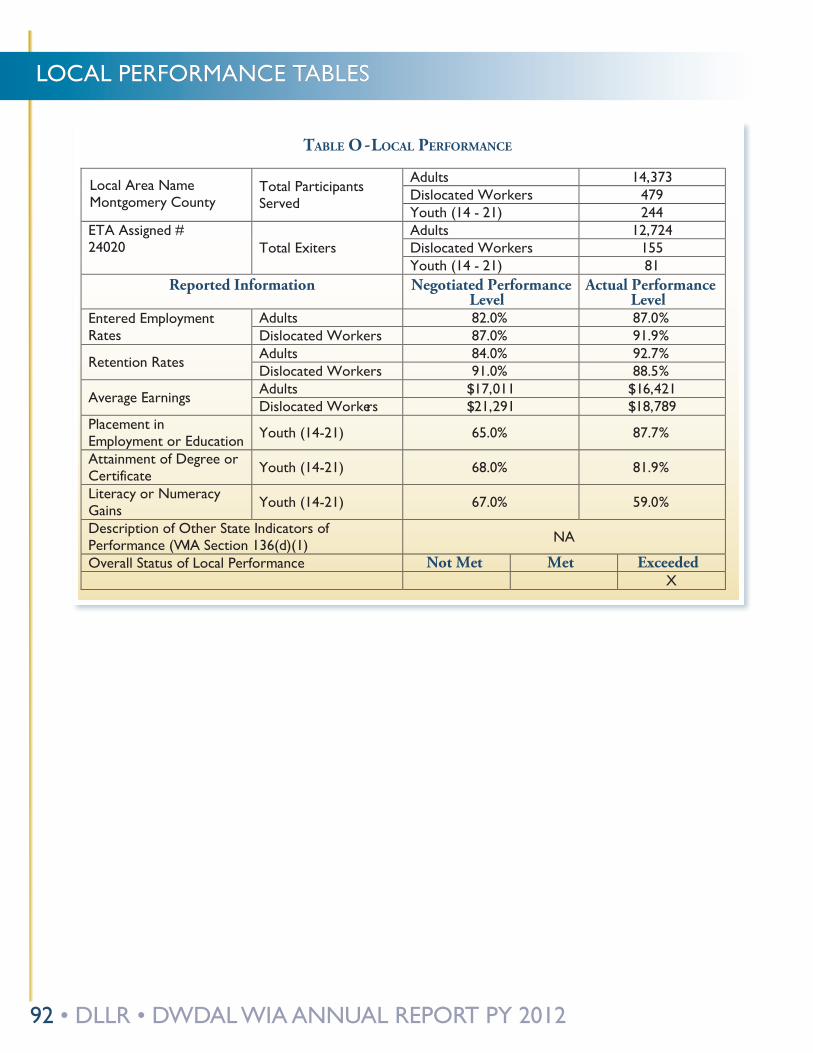
92 • DLLR • DWDAL WIA ANNUAL REPORT PY 2012
LOCAL PERFORMANCE TABLES
Local Area Name Montgomery County
Total Participants Served
Adults 14,373 Dislocated Workers 479 Youth (14 - 21) 244
ETA Assigned # 24020 Total Exiters
Adults 12,724 Dislocated Workers 155 Youth (14 - 21) 81
Entered Employment Rates
Adults 82.0% 87.0% Dislocated Workers 87.0% 91.9%
Retention Rates Adults 84.0% 92.7% Dislocated Workers 91.0% 88.5%
Average Earnings Adults $17,011 $16,421 Dislocated Workers $21,291 $18,789
Placement in Employment or Education Youth (14-21) 65.0% 87.7%
Attainment of Degree or Certificate Youth (14-21) 68.0% 81.9%
Literacy or Numeracy Gains Youth (14-21) 67.0% 59.0%
Description of Other State Indicators of Performance (WIA Section 136(d)(1) NA
Overall Status of Local Performance X
TABLE O -LOCAL PERFORMANCE
Reported Information Negotiated Performance Level
Actual Performance Level
Not Met Met Exceeded
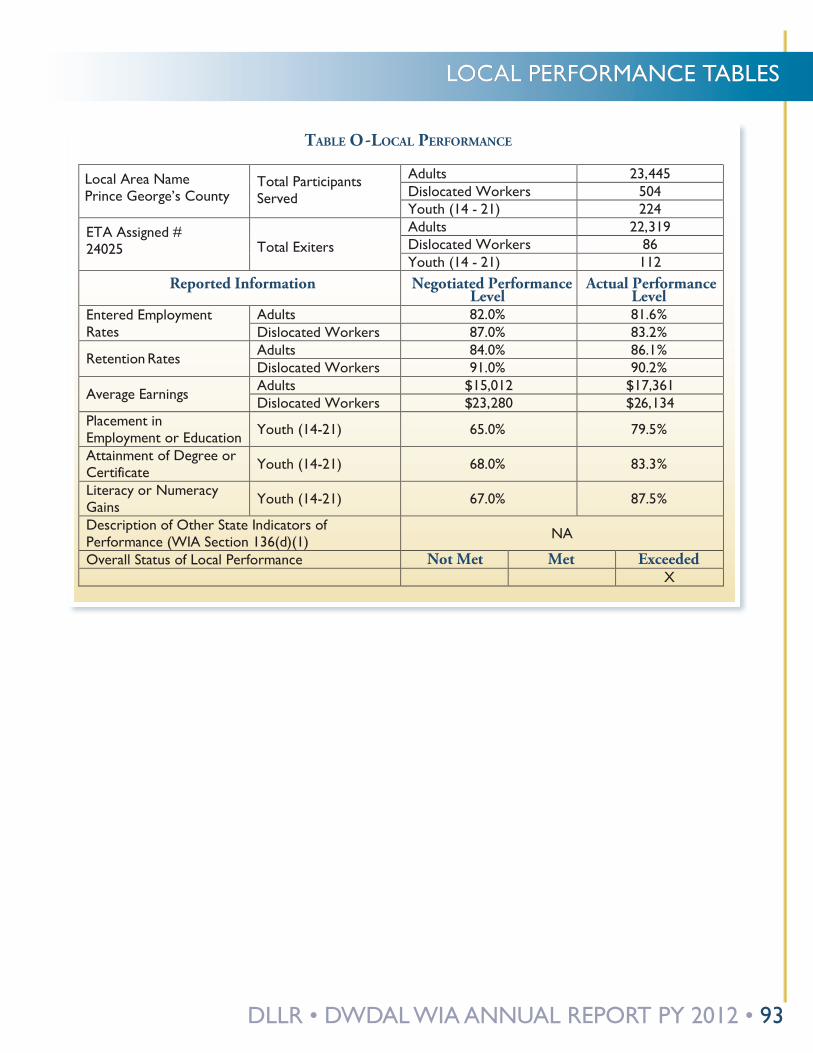
DLLR • DWDAL WIA ANNUAL REPORT PY 2012 • 93
LOCAL PERFORMANCE TABLES
Local Area Name
Prince George’s County Total Participants Served
Adults 23,445 Dislocated Workers 504 Youth (14 - 21) 224
ETA Assigned #
24025 Total Exiters Adults 22,319 Dislocated Workers 86 Youth (14 - 21) 112
Entered Employment Rates
Adults 82.0% 81.6% Dislocated Workers 87.0% 83.2%
Retention Rates Adults 84.0% 86.1% Dislocated Workers 91.0% 90.2%
Average Earnings Adults $15,012 $17,361 Dislocated Workers $23,280 $26,134
Placement in Employment or Education Youth (14-21) 65.0% 79.5%
Attainment of Degree or Certificate Youth (14-21) 68.0% 83.3%
Literacy or Numeracy Gains Youth (14-21) 67.0% 87.5%
Description of Other State Indicators of Performance (WIA Section 136(d)(1) NA
Overall Status of Local Performance X
TABLE O - LOCAL PERFORMANCE
Reported Information Negotiated Performance Level
Actual Performance Level
Not Met Met Exceeded
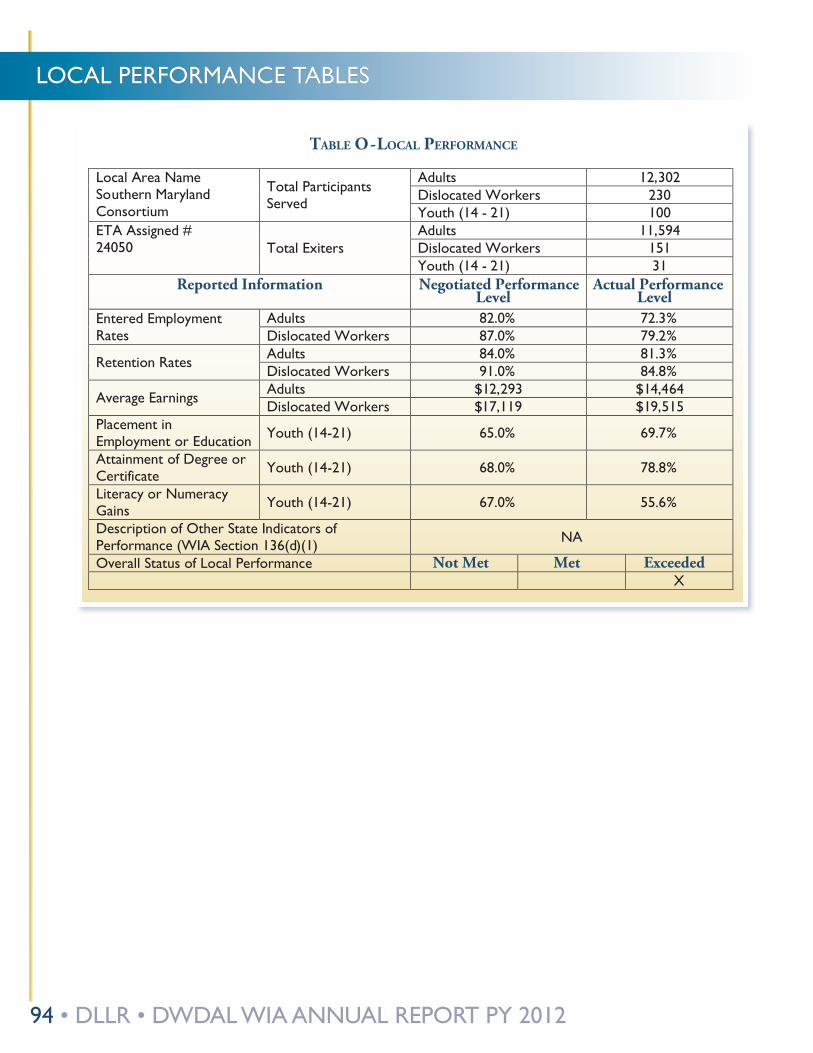
94 • DLLR • DWDAL WIA ANNUAL REPORT PY 2012
LOCAL PERFORMANCE TABLES
Local Area Name Southern Maryland Consortium
Total Participants Served
Adults 12,302 Dislocated Workers 230 Youth (14 - 21) 100
ETA Assigned # 24050 Total Exiters
Adults 11,594 Dislocated Workers 151 Youth (14 - 21) 31
Entered Employment Rates
Adults 82.0% 72.3% Dislocated Workers 87.0% 79.2%
Retention Rates Adults 84.0% 81.3% Dislocated Workers 91.0% 84.8%
Average Earnings Adults $12,293 $14,464 Dislocated Workers $17,119 $19,515
Placement in Employment or Education Youth (14-21) 65.0% 69.7%
Attainment of Degree or Certificate Youth (14-21) 68.0% 78.8%
Literacy or Numeracy Gains Youth (14-21) 67.0% 55.6%
Description of Other State Indicators of Performance (WIA Section 136(d)(1) NA
Overall Status of Local Performance X
TABLE O - LOCAL PERFORMANCE
Reported Information Negotiated Performance Level
Actual Performance Level
Not Met Met Exceeded
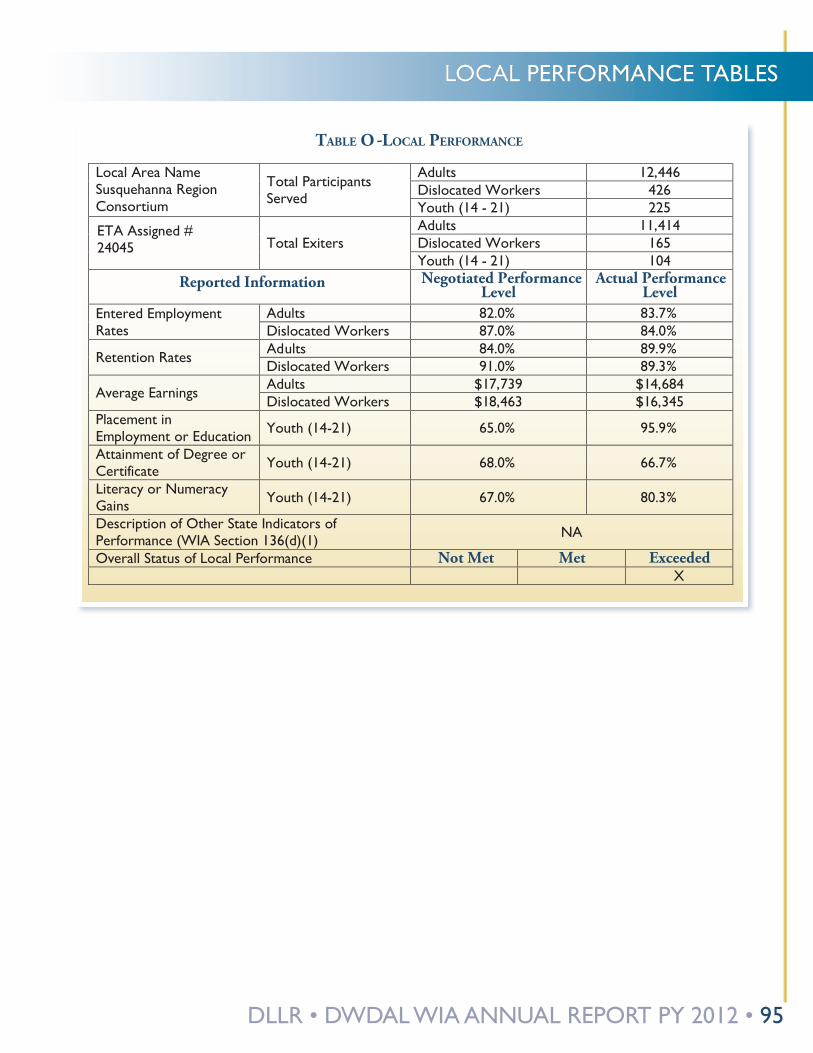
DLLR • DWDAL WIA ANNUAL REPORT PY 2012 • 95
LOCAL PERFORMANCE TABLES
Local Area Name Susquehanna Region Consortium
Total Participants Served
Adults 12,446 Dislocated Workers 426 Youth (14 - 21) 225
ETA Assigned #
24045 Total Exiters Adults 11,414 Dislocated Workers 165 Youth (14 - 21) 104
Entered Employment Rates
Adults 82.0% 83.7% Dislocated Workers 87.0% 84.0%
Retention Rates Adults 84.0% 89.9% Dislocated Workers 91.0% 89.3%
Average Earnings Adults $17,739 $14,684 Dislocated Workers $18,463 $16,345
Placement in Employment or Education Youth (14-21) 65.0% 95.9%
Attainment of Degree or Certificate Youth (14-21) 68.0% 66.7%
Literacy or Numeracy Gains Youth (14-21) 67.0% 80.3%
Description of Other State Indicators of Performance (WIA Section 136(d)(1) NA
Overall Status of Local Performance X
TABLE O - LOCAL PERFORMANCE
Reported Information Negotiated Performance Level
Actual Performance Level
Not Met Met Exceeded
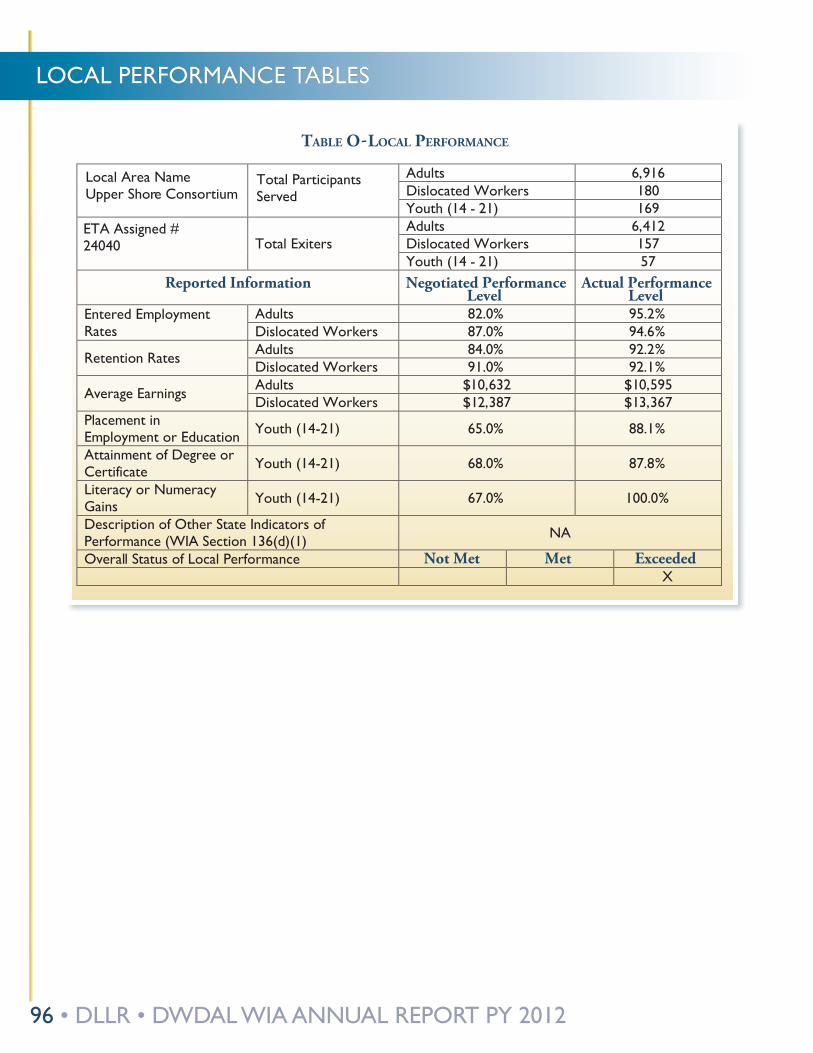
96 • DLLR • DWDAL WIA ANNUAL REPORT PY 2012
LOCAL PERFORMANCE TABLES
Local Area Name Upper Shore Consortium
Total Participants Served
Adults 6,916 Dislocated Workers 180 Youth (14 - 21) 169
ETA Assigned # 24040 Total Exiters
Adults 6,412 Dislocated Workers 157 Youth (14 - 21) 57
Entered Employment Rates
Adults 82.0% 95.2% Dislocated Workers 87.0% 94.6%
Retention Rates Adults 84.0% 92.2% Dislocated Workers 91.0% 92.1%
Average Earnings Adults $10,632 $10,595 Dislocated Workers $12,387 $13,367
Placement in Employment or Education Youth (14-21) 65.0% 88.1%
Attainment of Degree or Certificate Youth (14-21) 68.0% 87.8%
Literacy or Numeracy Gains Youth (14-21) 67.0% 100.0%
Description of Other State Indicators of Performance (WIA Section 136(d)(1) NA
Overall Status of Local Performance X
TABLE O -LOCAL PERFORMANCE
Reported Information Negotiated Performance Level
Actual Performance Level
Not Met Met Exceeded
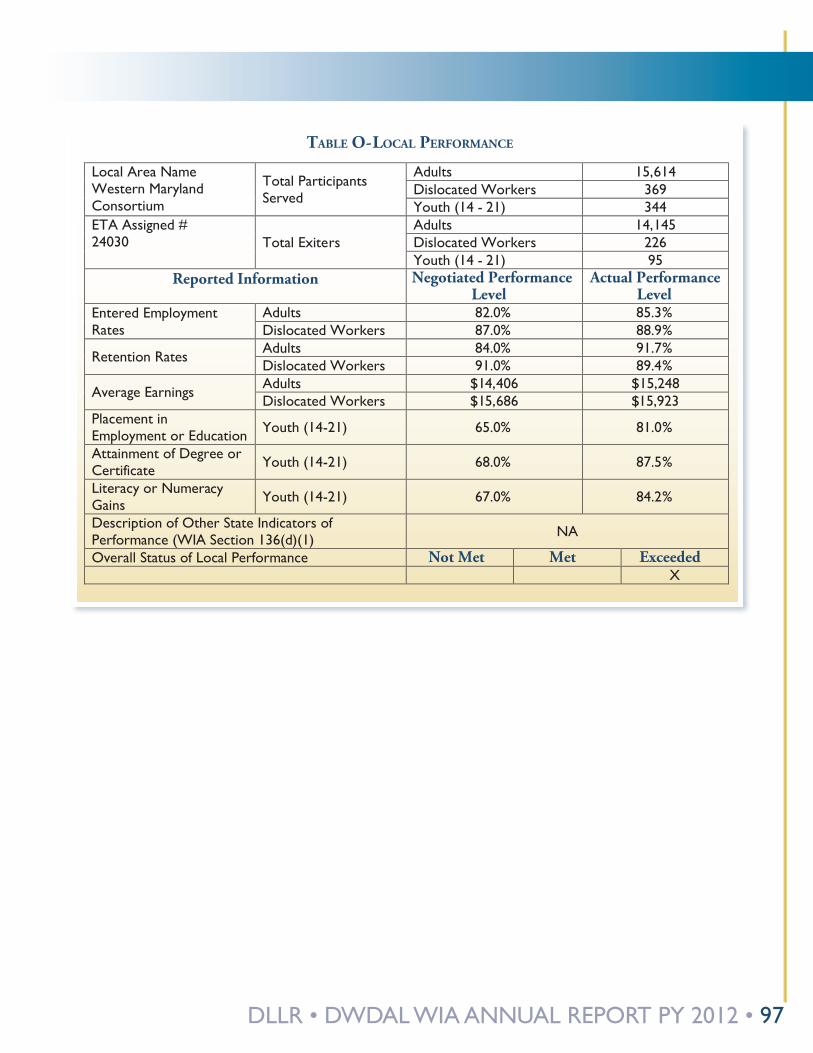
DLLR • DWDAL WIA ANNUAL REPORT PY 2012 • 97
Local Area Name Western Maryland Consortium
Total Participants Served
Adults 15,614 Dislocated Workers 369 Youth (14 - 21) 344
ETA Assigned # 24030 Total Exiters
Adults 14,145 Dislocated Workers 226 Youth (14 - 21) 95
Entered Employment Rates
Adults 82.0% 85.3% Dislocated Workers 87.0% 88.9%
Retention Rates Adults 84.0% 91.7% Dislocated Workers 91.0% 89.4%
Average Earnings Adults $14,406 $15,248 Dislocated Workers $15,686 $15,923
Placement in Employment or Education Youth (14-21) 65.0% 81.0%
Attainment of Degree or Certificate Youth (14-21) 68.0% 87.5%
Literacy or Numeracy Gains Youth (14-21) 67.0% 84.2%
Description of Other State Indicators of Performance (WIA Section 136(d)(1) NA
Overall Status of Local Performance X
TABLE O - LOCAL PERFORMANCE
Reported Information Negotiated Performance Level
Actual Performance Level
Not Met Met Exceeded
98 • DLLR • DWDAL WIA ANNUAL REPORT PY 2012
UNEMPLOYMENT INSURANCE TRUST FUND
MARYLAND UNEMPLOYMENT INSURANCE TRUST FUNDFinancial Statements Together With Report of Independent Public AccountantsAs of June 30, 2012 and 2011
Reporting Entity
The accompanying financial statements present only the Maryland Unemployment Insurance Trust Fund (the Fund), an enterprise fund of the State of Maryland, and do not present the financial statements of the State of Maryland as a whole. The Fund is not a separate legal entity from the State of Maryland.
The administrative costs related to the Fund are not reported in the financial statements of the Fund. The administrative costs are reported in the State of Maryland General Fund, as assessments earned from employers are not designed to recover the costs of administration.
Historical Background
Fund Description
Unemployment Insurance (UI) provides temporary relief for the time that an able-bodied worker is involuntarily unemployed. The goal of such insurance is to provide a minimal livelihood to unemployed workers until they are once again employed.
The United States of America introduced an unemployment insurance program, along with other welfare programs, with the passage of the Social Security Act of 1935. Over the years, Congress has extended the program to many workers initially not covered. Amendments to the Social Security Act provided unemployment insurance for Federal civilian employees (1954) and for ex-servicemen (1958). By 1994, more than 96% of all workers were covered by unemployment insurance. Each state has its own unemployment insurance law and operates its own program.
The total cost is borne by employers in all but a few states. Employers with relative experience of less unemployment (that is, with fewer unemployment benefits paid to their former workers) are rewarded with lower rates. This financing arrangement is intended to promote economic stability by encouraging employers to retain a skilled workforce. The surge in unemploy-ment benefit payments also provides an economic stimulus to the local economy during a recession.
During periods of high unemployment in a state, Federal-State extended benefits are available to workers who have exhausted their regular benefits.
Unemployment Insurance Financing
UI is supported by payroll taxes paid by employers, and these taxes include both Federal and state UI payroll taxes. The State of Maryland UI tax is assessed quarterly based on a rate determined annually per individual employer. The range of rates effective January 1, 2010, January 1, 2011 and January 1, 2012, was 2.2% to 13.5% on the first $8,500 of each employee’s wages during a calendar year. Employers must also pay an annual Federal Unemployment Insurance Tax (FUTA) on the first $7,000 of each employee’s wages during a calendar year. For employers that pay their state UI taxes in a timely manner, the FUTA rate was 0.6% for calendar year 2012 and was 0.8% for the first six months of calendar year 2011 and 0.6% for the last six months. Employers that fail to pay state UI taxes were required to pay a FUTA tax using a 6.0% rate for calendar year 2012, and 6.2% rate for the first six months of calendar year 2011, and 6.0% for the last six months.
DLLR • DWDAL WIA ANNUAL REPORT PY 2012 • 99
UNEMPLOYMENT INSURANCE TRUST FUND
Contributions by Maryland employers for state UI are deposited into the Fund’s account maintained at the U.S. Treasury. Maryland has one of the 53 state accounts that are the source of monies for paying regular UI benefits and the state share of extended benefits (EB). Contributions by Maryland employers for FUTA are deposited into the Federal Employment Security Administration Account (ESAA). This account finances the administrative costs of UI and the Employment Service programs in the states. The Federal share of EB is paid from a second Federal account and a third Federal account makes loans to states with insolvent trust funds.
Under current law, excess monies in the Federal trust funds are slated for return to the states under the Reed Act. Excess Federal trust fund balances are distributed according to each state’s share of Federal taxable UI wages. Reed Act distributions may be used to offset the administrative costs related to the Fund or for unemployment benefits. There was no such alloca-tion for the years ended June 30, 2012 and 2011.
Local Perspective
Maryland employers remit state UI payments directly to a bank lock box. The Maryland Office of Unemployment Insurance (OUI) wires each day’s opening available balance in this depository account to the Fund at the Federal Treasury. Addition-ally, officials in the Maryland OUI determine the amount of funds required for each day’s benefit payment account. Only nominal balances are maintained in both the depository (clearing) and benefit payment accounts.
Both the amounts of taxes paid by Maryland employers, and the amount of benefits received by Maryland’s unemployed, are products of the economic climate. Benefit payments will usually increase during a recession. Charging those benefits to employer accounts will elevate individual employer tax rates, driving an increase in the payment of employer state UI taxes.
SUMMARY OF SIGNIFICANT ACCOUNTING POLICIES
Measurement Focus and Basis of Accounting
The financial statements of the Fund are reported using the economic resources measurement focus and the accrual basis of accounting. Revenue is recorded when earned and expenses are recorded when a liability is incurred, regardless of the timing of related cash flows. Grants and similar items are recognized as revenue as soon as all eligibility requirements imposed by the provider have been met.
The Fund has adopted the provisions of Governmental Accounting Standards Board (GASB) Statement No. 20, Accounting and Financial Reporting for Proprietary Funds and Other Governmental Entities That Use Proprietary Fund Accounting, and it will not implement any of the Financial Accounting Standards Board (FASB) pronouncements issued after November 30, 1989, unless required by GASB.
The Fund implemented the financial reporting model, as required by the provisions of GASB Statement No. 34, Basic Financial Statement - and Management’s Discussion and Analysis- for the State and Local Governments (GASB 34). GASB 34 requires the Fund to present a classified balance sheet, statement of revenue, expense, and change in net assets, and a statement of cash flows using the direct method. GASB 34 does not require stand-alone financial statements of a government fund, which is part of the general government but is not a component unit of the general government to present required supplementary information (RSI), including management’s discussions and analysis. While GASB 34 does not preclude the presentation of RSI from the separate financial statements of a fund, GASB 34 does not require RSI to be presented.
100 • DLLR • DWDAL WIA ANNUAL REPORT PY 2012
UNEMPLOYMENT INSURANCE TRUST FUND
The Fund distinguishes operating revenue and expenses from non-operating items. Operating revenue and expenses general-ly result from providing services in connection with the Fund’s principal ongoing operations. Revenue and expenses not meeting this definition are reported as non-operating revenue and expenses. The principal operating revenue of the Fund is assessments from employers.
Fund Accounting
The financial activities of the State are recorded in individual funds, each of which is deemed to be a separate accounting entity. The State uses fund accounting to report on its financial position and changes in financial position. Fund accounting is designed to demonstrate legal compliance and to aid financial management by segregating transactions related to certain government functions or activities. A fund is a separate accounting entity with a self-balancing set of accounts.
An enterprise fund accounts for those activities for which the intent of management is to recover, primarily through user charges, the cost of providing goods or services to the general public, or where sound financial management dictates that periodic determinations of results of operations are appropriate.
The Fund accounts for the deposit of monies for the Maryland Unemployment Insurance Trust Fund held by the U.S. Treasury for payment of unemployment benefits. The Maryland Unemployment Insurance Trust Fund is an enterprise fund.
Use of Estimates
The preparation of financial statements in conformity with accounting principles generally accepted in the United States of America requires management to make estimates and assumptions that affect the amounts reported in the financial statements and accompanying notes. Actual results could differ from those estimates.
Receivables
Taxes receivable in the Fund represents unemployment taxes due at year-end, net of an allowance for uncollectible amounts. The uncollectible amounts are based on collection experience and a review of the status of existing receivables.
Operating Revenue
Revenue is recorded when earned. Grants and similar items are recognized as revenue as soon as all eligibility require-ments imposed by the provider have been met. Operating revenue is inclusive of provision for allowances for uncollectible accounts.
Net Assets
The net assets of the Fund are reported as restricted net assets, as the laws of the State of Maryland restrict the use of the Fund for payment of unemployment benefits only.
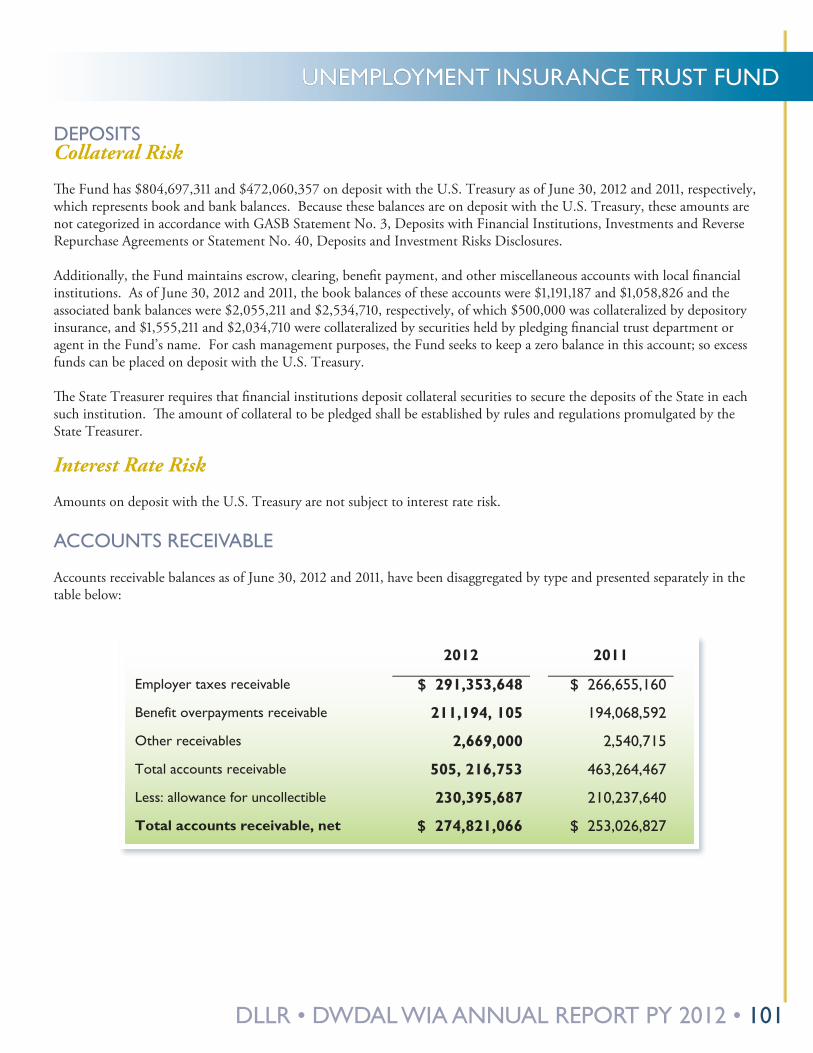
DLLR • DWDAL WIA ANNUAL REPORT PY 2012 • 101
UNEMPLOYMENT INSURANCE TRUST FUND
DEPOSITSCollateral Risk
The Fund has $804,697,311 and $472,060,357 on deposit with the U.S. Treasury as of June 30, 2012 and 2011, respectively, which represents book and bank balances. Because these balances are on deposit with the U.S. Treasury, these amounts are not categorized in accordance with GASB Statement No. 3, Deposits with Financial Institutions, Investments and Reverse Repurchase Agreements or Statement No. 40, Deposits and Investment Risks Disclosures.
Additionally, the Fund maintains escrow, clearing, benefit payment, and other miscellaneous accounts with local financial institutions. As of June 30, 2012 and 2011, the book balances of these accounts were $1,191,187 and $1,058,826 and the associated bank balances were $2,055,211 and $2,534,710, respectively, of which $500,000 was collateralized by depository insurance, and $1,555,211 and $2,034,710 were collateralized by securities held by pledging financial trust department or agent in the Fund’s name. For cash management purposes, the Fund seeks to keep a zero balance in this account; so excess funds can be placed on deposit with the U.S. Treasury.
The State Treasurer requires that financial institutions deposit collateral securities to secure the deposits of the State in each such institution. The amount of collateral to be pledged shall be established by rules and regulations promulgated by the State Treasurer.
Interest Rate Risk
Amounts on deposit with the U.S. Treasury are not subject to interest rate risk.
ACCOUNTS RECEIvABLE
Accounts receivable balances as of June 30, 2012 and 2011, have been disaggregated by type and presented separately in the table below:
2012 2011
Employer taxes receivable $ 291,353,648 $ 266,655,160
Benefit overpayments receivable 211,194, 105 194,068,592
Other receivables 2,669,000 2,540,715
Total accounts receivable 505, 216,753 463,264,467
Less: allowance for uncollectible 230,395,687 210,237,640
Total accounts receivable, net $ 274,821,066 $ 253,026,827
102 • DLLR • DWDAL WIA ANNUAL REPORT PY 2012
UNEMPLOYMENT INSURANCE TRUST FUND
CONTINGENCIES
The employer contribution operations and benefit payment functions of the Fund are subject to Federal compliance audits and related oversight. In addition, the Fund receives significant financial assistance from the U.S. Government. Entitlement to the resources is generally conditioned upon compliance with terms and conditions of the grant agreements and applicable Federal regulations, including the expenditure of the resources for eligible purposes. Substantially all grants are subject to financial and compliance audits by the grantor. Any disallowances as a result of these audits and audits of the employer contribution operations and benefit payment functions become a liability of the Fund. As of June 30, 2012 and 2011, Fund management does not anticipate that material liabilities will result from such audits.
The financial assistance received from the U.S. Government to fund the administrative costs of the Fund is subject to audits. However, any disallowances resulting from these audits would be liabilities of the State’s general fund and not the Fund as administrative costs are borne by the State’s general fund.
NEW PRONOUNCEMENTS
In June 2012, the Governmental Accounting Standards Board (GASB) issued GASB No. 68, Accounting and Financial Reporting for Pension Plans, effective for the year ended June 30, 2015. In June 2012, GASB issued Statement No. 67, Financial Reporting for Pension Plans- an Amendment of GASB No. 25, effective for the year ended June 30, 2014. In March 2012, GASB issued Statement No. 66, Technical Corrections- 2012, effective for the year ended June 30, 2014. In March of 2012, GASB issued Statement No. 65, Items Previously Reported as Assets and Liabilities, effective for the year ended June 30, 2014. In June of 2011, GASB issued Statement No. 64, Derivative Instruments: Application of Hedge Accounting Termination Provision, effective for the year ended June 30, 2013. In June of 2011, GASB issued Statement No. 63, Financial Reporting of Deferred Outflows of Resources, Deferred Inflows of Resources, and Net Position, effective for the year ended June 30, 2013. In December 2010, GASB issued Statement No. 62, Codification of Accounting and Financial Reporting Guidance Contained in Pre-November 30, 1989 FASB and AICPA Pronouncements, effective for the year ended June 30, 2013. In November 2010, GASB issued Statement No. 61, The Financial Reporting Entity: Omnibus, effective for the year ended June 30, 2013. In November 2010, GASB issued Statement No. 60, Accounting and Financial Reporting for Service Concession Arrangements, effective for the year ended June 30, 2013. The Fund will implement these statements as of their effective dates. While the Fund is still in the process of determining the effects of implementing these GASB statements, they are not expected to have a material effect on the financial position of the Fund.
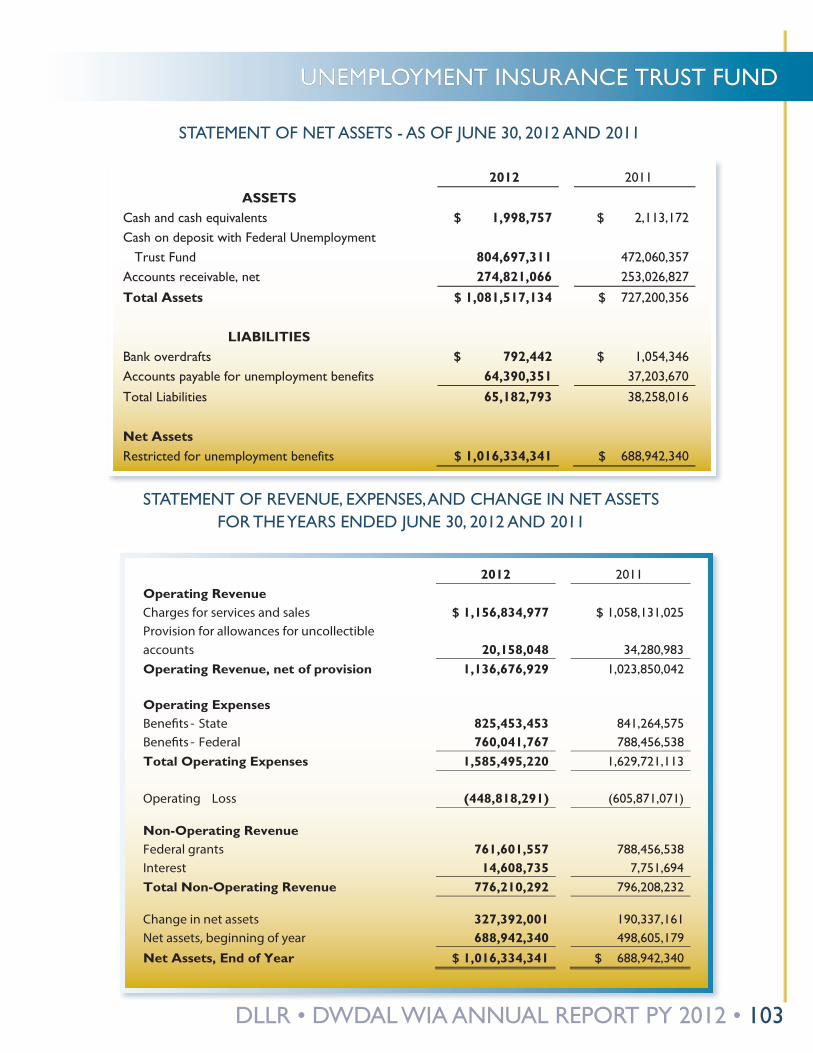
DLLR • DWDAL WIA ANNUAL REPORT PY 2012 • 103
UNEMPLOYMENT INSURANCE TRUST FUND
2012
2011 ASSETS
Cash and cash equivalents $ 1,998,757 $ 2,113,172 Cash on deposit with Federal Unemployment
Trust Fund 804,697,311 472,060,357 Accounts receivable, net 274,821,066 253,026,827
Total Assets $ 1,081,517,134 $ 727,200,356
LIABILITIES Bank overdrafts $ 792,442 $ 1,054,346
Accounts payable for unemployment benefits 64,390,351
37,203,670
Total Liabilities 65,182,793 38,258,016
Net Assets Restricted for unemployment benefits $ 1,016,334,341
$ 688,942,340
2012
2011 Operating Revenue
Charges for services and sales
$ 1,156,834,977 $ 1,058,131,025 Provision for allowances for uncollectible
accounts
20,158,048
34,280,983 Operating Revenue, net of provision
1,136,676,929 1,023,850,042
Operating Expenses Bene�ts - State 825,453,453 841,264,575
Bene�ts - Federal
760,041,767
788,456,538 Total Operating Expenses
1,585,495,220
1,629,721,113
Operating Loss
(448,818,291)
(605,871,071)
Non-Operating Revenue Federal grants
761,601,557 788,456,538 Interest
14,608,735
7,751,694
Total Non-Operating Revenue
776,210,292 796,208,232
Change in net assets
327,392,001
190,337,161 Net assets, beginning of year
688,942,340
498,605,179
Net Assets, End of Year
$ 1,016,334,341
$ 688,942,340
STATEMENT OF NET ASSETS - AS OF JUNE 30, 2012 AND 2011
STATEMENT OF REvENUE, EXPENSES, AND CHANGE IN NET ASSETS FOR THE YEARS ENDED JUNE 30, 2012 AND 2011
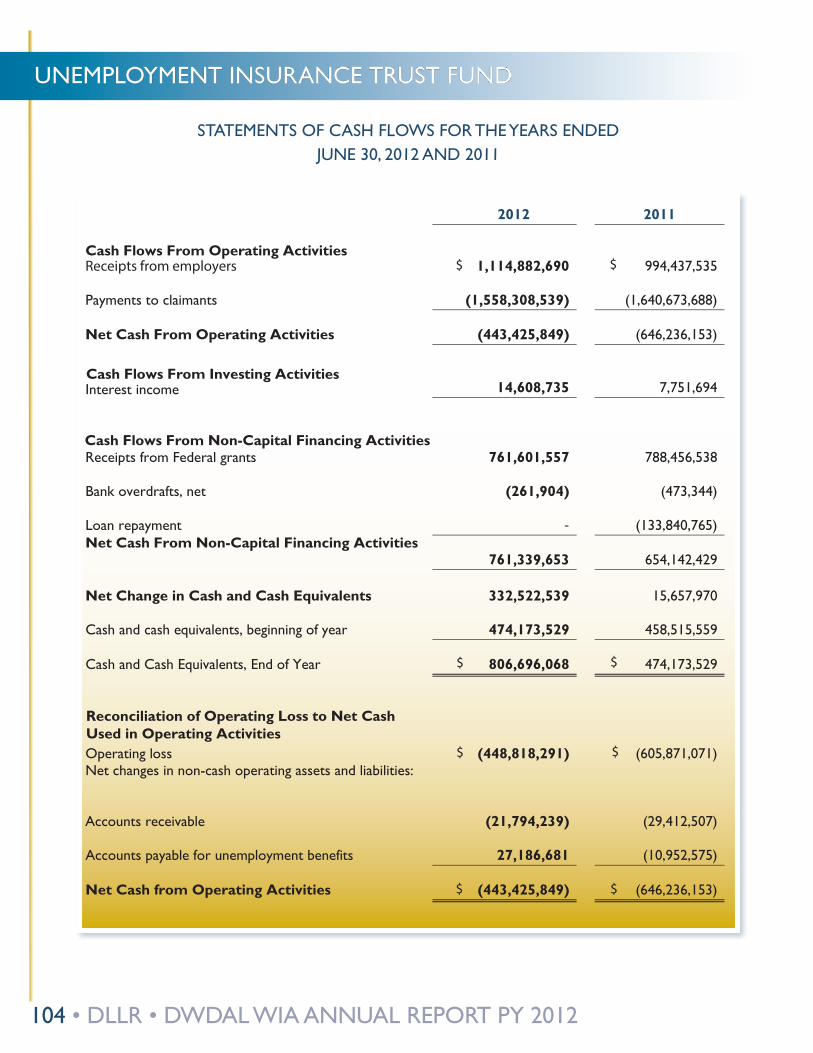
104 • DLLR • DWDAL WIA ANNUAL REPORT PY 2012
UNEMPLOYMENT INSURANCE TRUST FUND
STATEMENTS OF CASH FLOWS FOR THE YEARS ENDED JUNE 30, 2012 AND 2011STATEMENTS OF CASH FLOWS
FOR THE YEARS ENDED JUNE 30, 2012 AND 2011
2012 2011
Cash Flows From Operating Activities
Receipts from employers
$ 1,114,882,690 $ 994,437,535
Payments to claimants
(1,558,308,539) (1,640,673,688)
Net Cash From Operating Activities (443,425,849) (646,236,153) Cash Flows From Investing Activities
Interest income 14,608,735 7,751,694
Cash Flows From Non-Capital Financing Activities
Receipts from Federal grants
761,601,557 788,456,538
Bank overdrafts, net
(261,904) (473,344)
Loan repayment
- (133,840,765) Net Cash From Non-Capital Financing Activities
761,339,653 654,142,429
Net Change in Cash and Cash Equivalents 332,522,539 15,657,970
Cash and cash equivalents, beginning of year
474,173,529 458,515,559
Cash and Cash Equivalents, End of Year
$ 806,696,068
$ 474,173,529
Reconciliation of Operating Loss to Net CashUsed in Operating Activities
Operating loss
$ (448,818,291)
$ (605,871,071)Net changes in non-cash operating assets and liabilities:
Accounts receivable (21,794,239) (29,412,507)
Accounts payable for unemployment benefits
27,186,681 (10,952,575)
Net Cash from Operating Activities
$ (443,425,849)
$ (646,236,153)
DLLR • DWDAL WIA ANNUAL REPORT PY 2012 • 105
UNEMPLOYMENT INSURANCE TRUST FUND
REPORT OF INDEPENDENT PUBLIC ACCOUNTANTS
To ManagementMaryland Unemployment Insurance Trust Fund
We have audited the accompanying statements of net assets of the Maryland Unemployment Insurance Trust Fund (the Fund), an enterprise fund of the State of Maryland, as of June 30, 2012 and 2011, and the related statements of revenue, expenses, and change in net assets and cash flows for the years then ended. These financial statements are the responsibility of the Fund’s management. Our responsibility is to express an opinion on these financial statements based on our audits.
We conducted our audits in accordance with auditing standards generally accepted in the United States of America. Those standards require that we plan and perform the audit to obtain reasonable assurance about whether the financial statements are free of material misstatement. An audit includes examining, on a test basis, evidence supporting the amounts and disclosures in the financial statements. An audit also includes assessing the accounting principles used and significant estimates made by management, as well as evaluat-ing the overall financial statement presentation. We believe that our audits provide a reasonable basis for our opinion.
As discussed in Note 1, the financial statements present only the Fund and do not purport to, and do not, present fairly the financial position of the State of Maryland as of June 30, 2012 and 2011, and the change in its financial position and its cash flows for the years then ended in conformity with accounting principles generally accepted in the United States of America.
In our opinion, the financial statements referred to above present fairly, in all material respects, the financial position of the Fund, as of June 30, 2012 and 2011, and the change in its financial position and its cash flows for the years then ended in conformity with accounting principles generally accepted in the United States of America.
Hunt Valley, MarylandSeptember 28, 2012
200 International Circle • Suite 5500 • Hunt Valley • Maryland 21030 P 410-584-0060 • F 410-584-0061
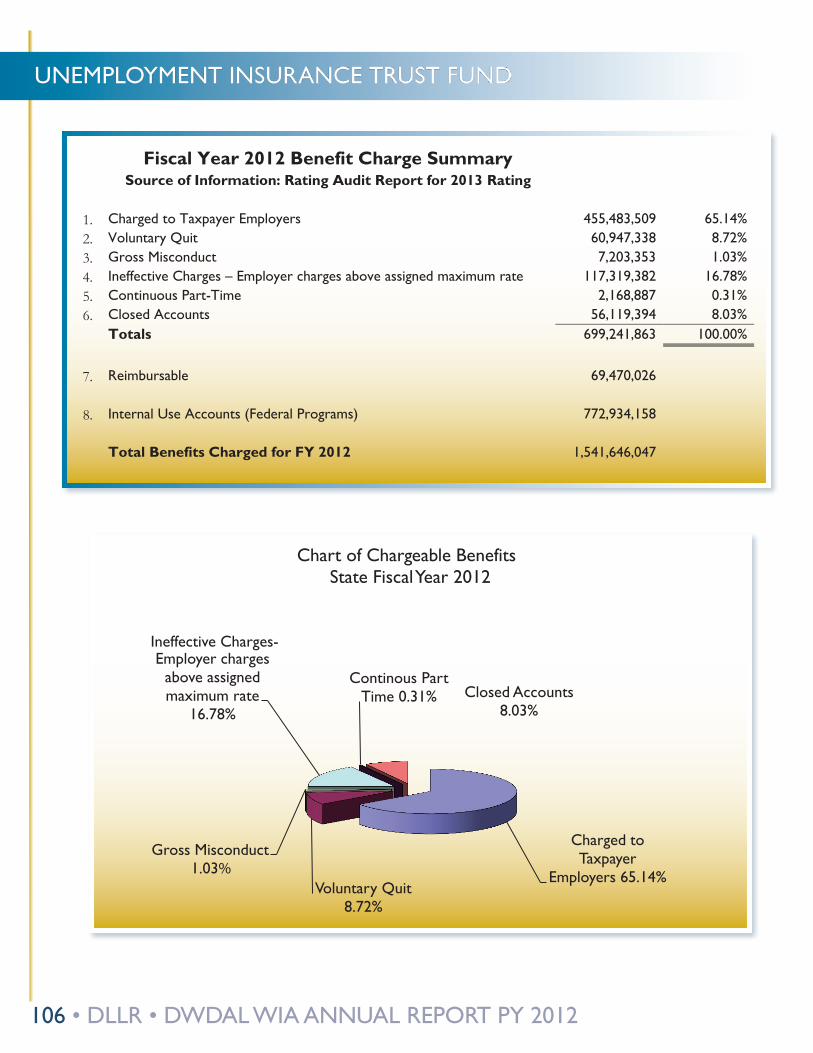
106 • DLLR • DWDAL WIA ANNUAL REPORT PY 2012
UNEMPLOYMENT INSURANCE TRUST FUND
Charged to Taxpayer
Employers 65.14% Voluntary Quit
8.72%
Gross Misconduct 1.03%
Ineffective Charges- Employer charges
above assigned maximum rate
16.78%
Continous Part Time 0.31% Closed Accounts
8.03%
Chart of Chargeable BenefitsState Fiscal Year 2012
Fiscal Year 2012 Benefit Charge Summary
Source of Information: Rating Audit Report for 2013 Rating
1. Charged to Taxpayer Employers
455,483,509 65.14% 2. Voluntary Quit
60,947,338 8.72%
3. Gross Misconduct
7,203,353 1.03% 4. Ineffective Charges – Employer charges above assigned maximum rate
117,319,382 16.78%
5. Continuous Part-Time
2,168,887 0.31% 6. Closed Accounts
56,119,394 8.03%
Totals
699,241,863 100.00%
7. Reimbursable
69,470,026
8. Internal Use Accounts (Federal Programs)
772,934,158
Total Benefits Charged for FY 2012
1,541,646,047

DLLR • DWDAL WIA ANNUAL REPORT PY 2012 • 107
DWDAL ANNUAL REPORT