Embed Size (px)
Citation preview

Workforce Development Plan
for the Construction Industry
Construction Training Council
October 2010

October 2010 Construction Training Council
www.bcitf.org The Construction Training Council acknowledges and appreciates the contributions made to the development of this Industry Workforce Development Plan by the Building and Construction Industry Training Board, members of the Construction Industry Strategic Group, Construction Industry Working Group and key stakeholders within the Construction Industry.

Foreword On behalf of the Building and Construction Industry Training Board I have pleasure in presenting the Construction Industry Workforce Development Plan for 2010. This plan provides an overview of the major sectors and occupations of the Building and Construction Industry in Western Australia. The plan was developed between late 2009 and September 2010 using a wide range of research, industry stakeholder input and respected sources of information. The Workforce Development Plan provides advice to Western Australian Government Departments, Employers, Industry Associations, Registered Training Providers, Schools and Career Advisors, Students and their parents. The Construction Training Fund, in its role as a supporter of apprenticeships and skills development in the Western Australian Construction Industry and as a Training Council, provides this plan to identify the current environment and challenges facing the industry as well as examine strategies that have been developed in consultation with industry and its stakeholders. This industry has a current workforce of 126,500 which represents 10.55% of the State workforce and contributes 9% to the gross state product. With 40% of all Western Australia‟s apprentices and 21.5% of combined apprentices and trainees, this workforce has grown by 65% in the past 10 years and by 50% in the last 5 years. The Construction industry is a major supporter of the apprenticeship system and through its training levy and subsidies has seen a 309% growth in apprentices from 1991 to 2009. The strategies contained within the plan reflect a balance of our stakeholder‟s views and their support that allow us to tackle the issues of skills and labour shortages and maintain a sustainable construction workforce. Through 2010-11, the Board will continue to maintain its professional networks with industry associations, employers, Department of Training and Workforce Development, the State Government and registered training providers to maintain support for our vibrant industry. Finally, I would like to thank all stakeholders for their support and input into this Industry Workforce Development Plan. We look forward to working with you in the coming year.
_________________ Mr Ian Hill Chairman BCIT Board
Table of Contents 1 Executive Summary .............................................................................................................................................. 6
2 Key Recommendations ......................................................................................................................................... 8
3 Environmental Scan .............................................................................................................................................. 9
3.1 Industry Profile ........................................................................................................................................... 10 3.2 Economic Cycle and Impact ....................................................................................................................... 12 3.3 Growth Trend of the Industry – 13 Year Period .......................................................................................... 14 3.4 National v State Projections ....................................................................................................................... 15 3.5 Forecasting ................................................................................................................................................ 16
3.5.1 Housing Industry Association ............................................................................................................ 16
3.5.2 Master Builders Association .............................................................................................................. 16
3.5.3 BIS Shrapnel ..................................................................................................................................... 16
3.5.4 Summary of Forecasting ................................................................................................................... 16
3.5.5 Impact of Worker Flow to Resources Sector ..................................................................................... 16
3.6 Industry Occupational Overview ................................................................................................................ 17 3.7 Industry Sectors - Characteristics .............................................................................................................. 18 3.8 Regional Variations .................................................................................................................................... 18
3.8.1 Regional Training .............................................................................................................................. 19
3.9 Level of Education in the Workforce........................................................................................................... 19 3.10 Quality and Relevance of Secondary Education ........................................................................................ 21 3.11 Age and Change within the Workforce ....................................................................................................... 22 3.12 Impact of Injury Levels and Chronic Conditions on Longevity (age/time) in the Industry. .......................... 22 3.13 Number of Workers and Age Distribution by Trade/Occupation ................................................................ 23 3.14 Apprenticeships and Traineeships within the Construction Industry .......................................................... 25 3.15 Indigenous Employment in the Industry ..................................................................................................... 27
4 Industry Critical Jobs........................................................................................................................................... 28
4.1 Forecast Strong Demand – further evidence ............................................................................................. 29 4.2 Historical Employment and Output by Sector ............................................................................................. 30 4.3 Apprentice Completion Rates, Cancellations, Withdrawals and Overall Attrition. ...................................... 31
5 Barriers to Employment and Training.................................................................................................................. 33
5.1 Barriers to Employment .............................................................................................................................. 33
5.1.1 Apprenticeship Impediments ............................................................................................................. 34
5.1.2 Tax Disincentives .............................................................................................................................. 35
5.1.3 Funding of Training Delivered by RTPs ............................................................................................. 35
5.1.4 Civil Construction .............................................................................................................................. 36
5.1.5 Regional Training .............................................................................................................................. 36
5.2 Other Barriers to Training Identified by Stakeholders................................................................................. 37
6 Strategies to Overcome the Barriers ................................................................................................................... 39
6.1 Attrition in the Apprenticeship System ........................................................................................................ 40 6.2 Retention of Workforce during Downturns in the Economy ........................................................................ 40
6.2.1 Construction Training Fund – Recent Initiatives ................................................................................ 41
6.2.2 Construction Training Fund New Strategies in 2010/11 .................................................................... 42
6.2.3 Migration Issues ................................................................................................................................ 42
6.3 Institutional Training ................................................................................................................................... 42 6.4 Terms of Indenture ..................................................................................................................................... 43
7 Summary of Key Issues ...................................................................................................................................... 44
8 Specific Recommendations ................................................................................................................................ 45
8.1 Apprenticeships ......................................................................................................................................... 45 8.2 Schools ...................................................................................................................................................... 45 8.3 Registered Training Providers .................................................................................................................... 45 8.4 Pre-Apprenticeships ................................................................................................................................... 46 8.5 Employers .................................................................................................................................................. 46 8.6 Indigenous, Disadvantaged and Marginalised Groups ............................................................................... 46 8.7 Migration .................................................................................................................................................... 46

Charts Chart 1 Location of Business – Civil Construction 9 Chart 2 Location of Business – Commercial and Housing 9 Chart 3 Age range of respondents 10 Chart 4 Construction Work Done in $000‟s 12 Chart 5 State Demand in $M‟s 12 Chart 6 Effect of Economic Activity on Mining and Construction 13 Chart 7 Construction Employment Hours – Average by Full-Time Employees 13 Chart 8 Comparison of Industries (Construction v All WA) 14 Chart 9 WA Forecasts 15 Chart 10 Distribution of Occupations compared to all Western Australian Industries 17 Chart 11 Level of Education by Sector 20 Chart 12 Age Distribution within the Construction Workforce – ALL TRADES 22 Chart 13 Age Distribution across a number of construction trades 23 Chart 14 Wet Trades – Age Distribution by Trade 24 Chart 15 Other Trades – Age Distribution by Trade 24 Chart 16 Professional Occupations within the Construction Industry 24 Chart 17 Apprentices in Training by Major Industries 25 Chart 18 Growth in Apprentices-in-Training over the last 10 years 25 Chart 19 Regional Apprentice Employment 26 Chart 20 Output versus Size of Workforce 30 Chart 21 Number Employed as ratio of the value of construction 30 Chart 22 Number Employed versus Residential Construction Activity 31
Tables Table 1 National Employment Growth 15 Table 2 Western Australian Short and Long term forecasts 15 Table 3 Distribution of Occupations Compared to all WA Industries 17 Table 4 ASCO Codes 18 Table 5 Overall Level of Education in Construction Workforce 19 Table 6 Level of Education by Trade 20 Table 7 Apprentices in Training by Region 26 Table 8 Industry Critical/Priority Jobs 28 Table 9 Apprentice Completion rates, cancellations and withdrawal statistics 31 Table 10 Electrical Mechanics - completion rates, cancellations and withdrawal statistics 32 Table 11 Business Challenges 34
Workforce Development Plan – Construction Industry
Page | 6
1 Executive Summary
This Workforce Development Plan is, by its nature and content, a comprehensive document with detailed information on the Construction industry, its workforce and employment and training issues. The Executive Summary sets out the critical issues which industry stakeholders wish to see addressed. The profile of the Construction industry demonstrates that it is a significant contributor to the State economy and productivity as it continues to:
Contribute 9.0% to the Gross State Product
Employ 10.55% of the State workforce
Employ 40% of Western Australia‟s apprentices
Employ 21.5% of all combined apprentices/trainees
Employ 75% of the Construction workforce in the metropolitan area
Have females comprise 15% of the industry‟s workforce
Employ 84% of the industry‟s workforce in full-time employment Identifying the Problem Western Australia does not necessarily have a skilled labour (skills development / training) issue. The problem is primarily a shortage of people at all levels, skilled and otherwise to support the current and projected growth in the economy. Industry and economic organisations are predicting widely varying levels of construction activity and as a result employment growth for future years. The industry has historically experienced peaks and troughs which will continue in the future. This report identifies approximately 30 occupations which are currently in shortage. However, no attempt has been made to quantify anticipated long term labour shortages as there are too many variables. Existing industry and economic analysts already have widely varying views on the subject. At present, the industry is experiencing a downturn in commercial activity. Housing construction remains depressed from previous highs prior to the Global Financial Crisis (GFC). The consensus appears to be a period of general constraint for the next 12 to 18 months followed by a ramping up in activity and as a result, demand for skilled labour. It is still important to plan for the future and the most sensible approach appears to be to identify the impact of planned major projects in both the resources sector and traditional sectors. This impact will drive overall growth in the industry and as a result the need for additional skilled labour. A recent approach to skill shortages has been to reduce training times. Training new recruits to achieve competencies at the standard expected requires time and experience. Industry has expressed the view that attempts to reduce training times and expense to respond to anticipated growth is not supported. Other strategies to improve flexibility and productivity are required. It is also suggested that future planning be based on a process of continual monitoring and adjustment based on short term i.e. 12 to 48 month projections. The industry is too volatile to properly achieve accurate predictions for longer term periods. Vocational Education and Training in Schools (VETiS) A key concern for industry is the limited number of school leavers available and committed to entering careers in trade and para-professional occupations. The school system is still badly skewed to directing students towards tertiary education despite the fact that only about 50% of those students studying for the Tertiary Entrance Examination (TEE) actually end up in university. The VETiS system involves too many options and courses of study which are confusing, do not lead to clear employment and training pathways and do not articulate properly. There are numerous other problems with the VETiS system which industry believes requires a completely new culture, curriculum and approach. Recommendations about how to achieve this are detailed in this plan.
Workforce Development Plan – Construction Industry
Page | 7
Apprenticeship Reform The apprenticeship system is regarded by stakeholders as critically important to the future workforce needs of the industry. Recent reforms to reduce the term of indenture of apprenticeships whilst well intentioned may need to be reviewed. There is however, a need to make apprenticeships more flexible and financially attractive for both apprentices and employers alike. This includes the ability of Registered Training Providers (RTP) to deliver technical training at times and in ways that better meet industry‟s needs. Specifically there is a need to consider alternative funding models which give training providers greater flexibility to deliver training related services. Funding based on student curriculum hours is no longer relevant when RTPs are liaising with employers, coordinating and assessing on-the-job training rather than just delivering training in the institution. Programs such as pre-apprenticeships require coordination of work experience which also warrants a different funding model. A key issue is the cost of training to employers. Recent increases in apprentice commencements in the Construction industry have demonstrated that the Commonwealth Kickstart and Construction Training Fund apprentice subsidies have had a positive impact. This impact is to a certain extent undermined by the fact that the employer hands back 30% of the incentive in income tax to the Commonwealth. It is recommended that this matter be taken up with the Commonwealth Government as a critical workforce development issue. Regional Training There is a need to provide better support for training of people in regional Western Australia as 30% of the State Construction industry apprentices reside in the country and 50% of these apprentices have to travel and live away from home to undertake their off-the-job training. Specifically, the Construction Training Council would like to see all training of first year apprentices conducted in the regions. This will require changes in policy and funding arrangements and cooperation between regional and metropolitan training providers. Resources Industry Employment The Resources industry continues to cause other industries, and in particular, the Construction industry difficulties with skill shortages resulting from the Resources industry‟s recruitment practices. The vast majority of the Resource industry‟s workforce comprises mature age skilled workers who have already been trained by the Construction industry at considerable expense. The productivity of these workers is lost and the substantially higher wages offered by the Resources industry places wage pressure on the Construction industry‟s existing workforce. Policies and processes need to be adopted to ensure that the Resources industry is required to contribute to the training cost of the workforce it is recruiting from other industries. A significant proportion of apprentice attrition in the Construction industry is caused by the loss of skilled and partially trained workers to the Resources industry. Apprentices are leaving because they can receive substantially higher wages in the Resources sector in less qualified roles. Alternatively, the Resource industry should be required to increase its apprentice training commitment for operations and construction to a similar level of the Construction industry.
Workforce Development Plan – Construction Industry
Page | 8
2 Key Recommendations
Recommendation 1
Project owners of major construction projects valued at more than $40 million be required as part of Government approval of the project to provide a workforce requirement statement. The statement should detail sources of labour and training plans (note: this is a recommendation of the Commonwealth Resources Sector Employment Taskforce).
Recommendation 2
The Government should set targets for apprenticeship training for the Resources industry.
The Resources industry has not been prepared to contribute to the Construction industry training levy which has helped the Construction industry to achieve a training rate much higher than other industries. At present the training rate (number of apprentices employed as a percentage of tradespeople) is approximately 12% for the Construction industry. This rate is estimated to be at least double that of the Resources industry.
The Resources industry should be asked, as part of Government approval for construction of infrastructure projects and subsequent operations, to meet apprentice / trainee training targets at least the equivalent of the Construction industry. The performance of the industry should be monitored to ensure that the targets are achieved.
Recommendation 3
The Vocational Education and Training in Schools (VETiS) system requires urgent reform to:
Establish better defined pathways to careers with curriculum that articulates to apprenticeships or para-professional training opportunities;
Have stronger and better coordinated work experience;
Reduce the current complexity and counterproductive choices of curriculum;
Be treated by educators as an equally important education option to tertiary entrance;
Be better promoted to students and parents.
Recommendation 4
The recent changes to the apprenticeship system including reduced term indentures and changes to the Vocational Education and Training Act should be reviewed to determine their effectiveness.
As part of the review, consideration should be given to strategies that:
Reduce the cost of training to employers;
Increase the delivery of „off-the-job‟ training in regions;
Reduce attrition in the apprenticeship system. Licensing of trades is an approach which should be investigated.
Deliver more „off-the-job‟ training earlier in the indenture and in ways which better meet industry‟s needs.
Provide greater flexibility in the system. The Minister has recently approved a proposal by the Construction Training Fund to implement flexible terms of indenture of between three and four years for the Painting and Decorating trade. This model is consistent with the principles of a competency based system and has significant potential to be expanded to other trades.
Recommendation 5
Action should be taken to ensure that regional registered training providers deliver more apprenticeship training and at least the first year training for all regional apprentices.
More specific recommendations are detailed in Section 8 of this plan.
Workforce Development Plan – Construction Industry
Page | 9
3 Environmental Scan
The following environmental scan has been developed to enable the Workforce Development Plan to provide evidence of the current state of the industry. The scan includes the projected skilled and non-skilled labour needs of the industry in the short to medium term and provides advice on the training needs to ensure the Construction industry has access to a skilled workforce.
This scan has been informed by a number of sources and methodologies using regional consultation with stakeholders, individual site visits and spread across a range of business sectors and occupations. The Construction Training Fund‟s network of employers of apprentices was utilised as well as a significant stakeholder database. Additionally, a number of significant research reports and surveys have been undertaken which also provide valuable industry information.
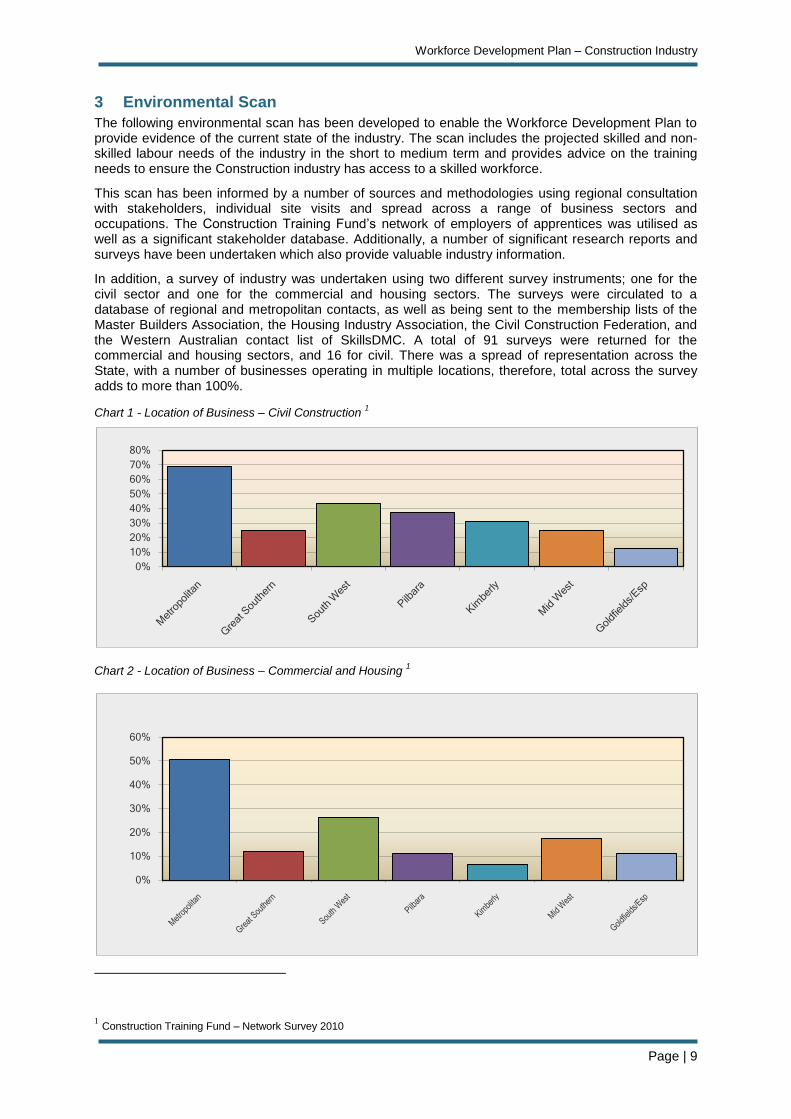
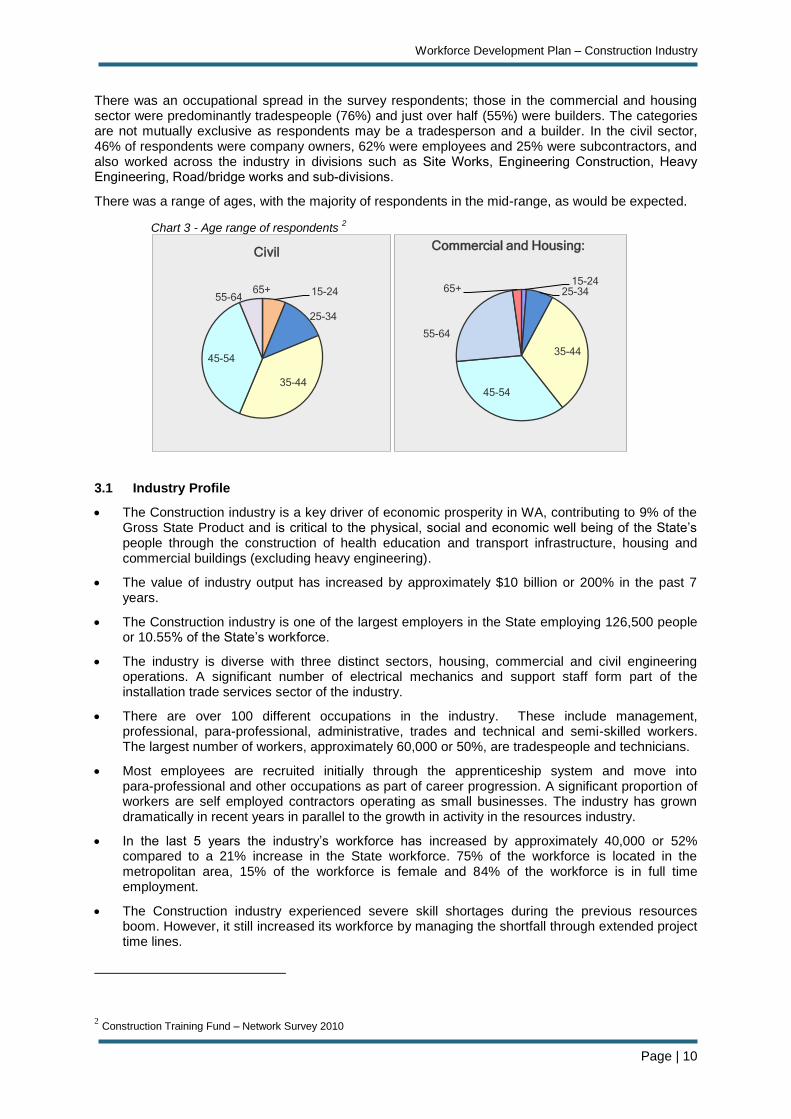
In addition, a survey of industry was undertaken using two different survey instruments; one for the civil sector and one for the commercial and housing sectors. The surveys were circulated to a database of regional and metropolitan contacts, as well as being sent to the membership lists of the Master Builders Association, the Housing Industry Association, the Civil Construction Federation, and the Western Australian contact list of SkillsDMC. A total of 91 surveys were returned for the commercial and housing sectors, and 16 for civil. There was a spread of representation across the State, with a number of businesses operating in multiple locations, therefore, total across the survey adds to more than 100%.
Chart 1 - Location of Business – Civil Construction 1
Chart 2 - Location of Business – Commercial and Housing 1
1 Construction Training Fund – Network Survey 2010
0%
10%
20%
30%
40%
50%
60%
70%
80%
0%
10%
20%
30%
40%
50%
60%
Workforce Development Plan – Construction Industry
Page | 10
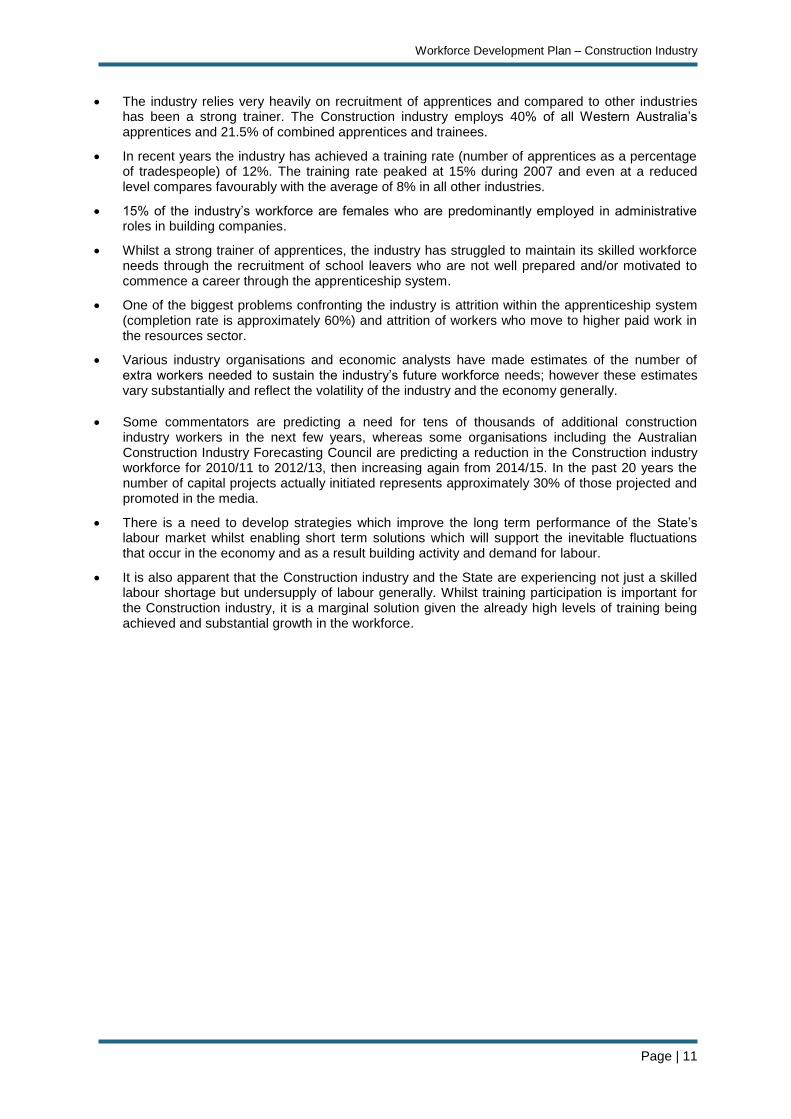
There was an occupational spread in the survey respondents; those in the commercial and housing sector were predominantly tradespeople (76%) and just over half (55%) were builders. The categories are not mutually exclusive as respondents may be a tradesperson and a builder. In the civil sector, 46% of respondents were company owners, 62% were employees and 25% were subcontractors, and also worked across the industry in divisions such as Site Works, Engineering Construction, Heavy Engineering, Road/bridge works and sub-divisions.
There was a range of ages, with the majority of respondents in the mid-range, as would be expected.
Chart 3 - Age range of respondents 2
3.1 Industry Profile
The Construction industry is a key driver of economic prosperity in WA, contributing to 9% of the Gross State Product and is critical to the physical, social and economic well being of the State‟s people through the construction of health education and transport infrastructure, housing and commercial buildings (excluding heavy engineering).
The value of industry output has increased by approximately $10 billion or 200% in the past 7 years.
The Construction industry is one of the largest employers in the State employing 126,500 people or 10.55% of the State‟s workforce.
The industry is diverse with three distinct sectors, housing, commercial and civil engineering operations. A significant number of electrical mechanics and support staff form part of the installation trade services sector of the industry.
There are over 100 different occupations in the industry. These include management, professional, para-professional, administrative, trades and technical and semi-skilled workers. The largest number of workers, approximately 60,000 or 50%, are tradespeople and technicians.
Most employees are recruited initially through the apprenticeship system and move into para-professional and other occupations as part of career progression. A significant proportion of workers are self employed contractors operating as small businesses. The industry has grown dramatically in recent years in parallel to the growth in activity in the resources industry.
In the last 5 years the industry‟s workforce has increased by approximately 40,000 or 52% compared to a 21% increase in the State workforce. 75% of the workforce is located in the metropolitan area, 15% of the workforce is female and 84% of the workforce is in full time employment.
The Construction industry experienced severe skill shortages during the previous resources boom. However, it still increased its workforce by managing the shortfall through extended project time lines.
2 Construction Training Fund – Network Survey 2010
15-24
25-34
35-44
45-54
55-6465+
Civil
15-2425-34
35-44
45-54
55-64
65+
Commercial and Housing:
Workforce Development Plan – Construction Industry
Page | 11
The industry relies very heavily on recruitment of apprentices and compared to other industries has been a strong trainer. The Construction industry employs 40% of all Western Australia‟s apprentices and 21.5% of combined apprentices and trainees.
In recent years the industry has achieved a training rate (number of apprentices as a percentage of tradespeople) of 12%. The training rate peaked at 15% during 2007 and even at a reduced level compares favourably with the average of 8% in all other industries.
15% of the industry‟s workforce are females who are predominantly employed in administrative roles in building companies.
Whilst a strong trainer of apprentices, the industry has struggled to maintain its skilled workforce needs through the recruitment of school leavers who are not well prepared and/or motivated to commence a career through the apprenticeship system.
One of the biggest problems confronting the industry is attrition within the apprenticeship system (completion rate is approximately 60%) and attrition of workers who move to higher paid work in the resources sector.
Various industry organisations and economic analysts have made estimates of the number of extra workers needed to sustain the industry‟s future workforce needs; however these estimates vary substantially and reflect the volatility of the industry and the economy generally.
Some commentators are predicting a need for tens of thousands of additional construction industry workers in the next few years, whereas some organisations including the Australian Construction Industry Forecasting Council are predicting a reduction in the Construction industry workforce for 2010/11 to 2012/13, then increasing again from 2014/15. In the past 20 years the number of capital projects actually initiated represents approximately 30% of those projected and promoted in the media.
There is a need to develop strategies which improve the long term performance of the State‟s labour market whilst enabling short term solutions which will support the inevitable fluctuations that occur in the economy and as a result building activity and demand for labour.
It is also apparent that the Construction industry and the State are experiencing not just a skilled labour shortage but undersupply of labour generally. Whilst training participation is important for the Construction industry, it is a marginal solution given the already high levels of training being achieved and substantial growth in the workforce.
Workforce Development Plan – Construction Industry
Page | 12
3.2 Economic Cycle and Impact
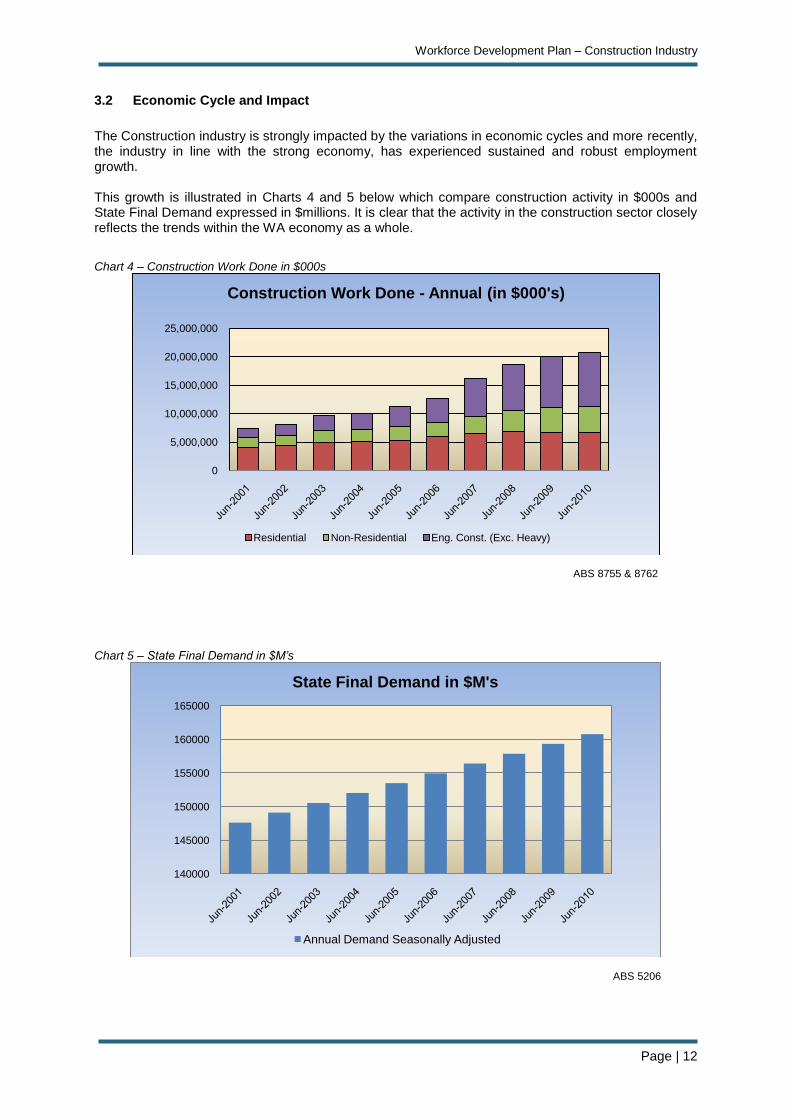
The Construction industry is strongly impacted by the variations in economic cycles and more recently, the industry in line with the strong economy, has experienced sustained and robust employment growth. This growth is illustrated in Charts 4 and 5 below which compare construction activity in $000s and State Final Demand expressed in $millions. It is clear that the activity in the construction sector closely reflects the trends within the WA economy as a whole.
Chart 4 – Construction Work Done in $000s
ABS 8755 & 8762
Chart 5 – State Final Demand in $M’s
ABS 5206
0
5,000,000
10,000,000
15,000,000
20,000,000
25,000,000
Construction Work Done - Annual (in $000's)
Residential Non-Residential Eng. Const. (Exc. Heavy)
140000
145000
150000
155000
160000
165000
State Final Demand in $M's
Annual Demand Seasonally Adjusted
Workforce Development Plan – Construction Industry
Page | 13
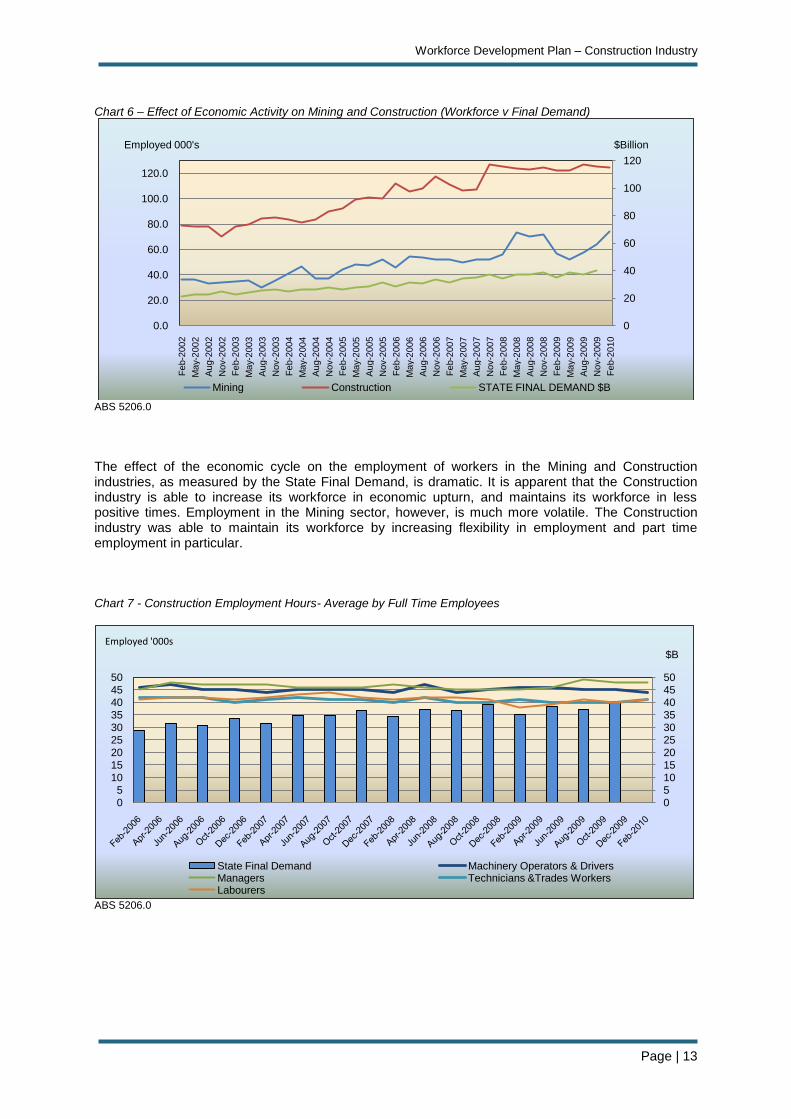
Chart 6 – Effect of Economic Activity on Mining and Construction (Workforce v Final Demand)
ABS 5206.0
The effect of the economic cycle on the employment of workers in the Mining and Construction industries, as measured by the State Final Demand, is dramatic. It is apparent that the Construction industry is able to increase its workforce in economic upturn, and maintains its workforce in less positive times. Employment in the Mining sector, however, is much more volatile. The Construction industry was able to maintain its workforce by increasing flexibility in employment and part time employment in particular. Chart 7 - Construction Employment Hours- Average by Full Time Employees
ABS 5206.0
0
20
40
60
80
100
120
0.0
20.0
40.0
60.0
80.0
100.0
120.0F
eb-2
002
May-
2002
Aug-2
002
Nov-2
002
Feb-2
003
May-
2003
Aug-2
003
Nov-2
003
Feb-2
004
May-
2004
Aug-2
004
Nov-2
004
Feb-2
005
May-
2005
Aug-2
005
Nov-2
005
Feb-2
006
May-
2006
Aug-2
006
Nov-2
006
Feb-2
007
May-
2007
Aug-2
007
Nov-2
007
Feb-2
008
May-
2008
Aug-2
008
Nov-2
008
Feb-2
009
May-
2009
Aug-2
009
Nov-2
009
Feb-2
010
Mining Construction STATE FINAL DEMAND $B
Employed 000's $Billion
0
510
1520
2530
354045
50
0
510
1520
2530
354045
50
State Final Demand Machinery Operators & DriversManagers Technicians &Trades WorkersLabourers
Employed '000s
$B
Workforce Development Plan – Construction Industry
Page | 14
3.3 Growth Trend of the Industry – 13 Year Period
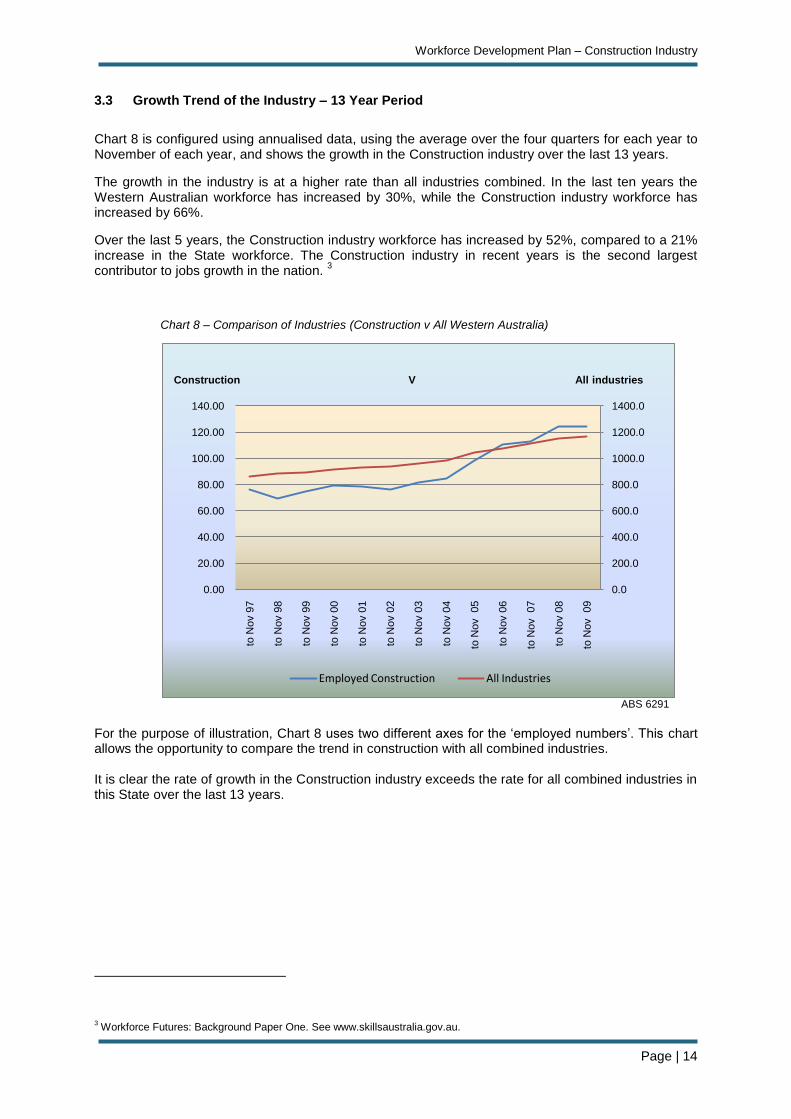
Chart 8 is configured using annualised data, using the average over the four quarters for each year to November of each year, and shows the growth in the Construction industry over the last 13 years.
The growth in the industry is at a higher rate than all industries combined. In the last ten years the Western Australian workforce has increased by 30%, while the Construction industry workforce has increased by 66%.
Over the last 5 years, the Construction industry workforce has increased by 52%, compared to a 21% increase in the State workforce. The Construction industry in recent years is the second largest contributor to jobs growth in the nation.
3
Chart 8 – Comparison of Industries (Construction v All Western Australia)
ABS 6291
For the purpose of illustration, Chart 8 uses two different axes for the „employed numbers‟. This chart allows the opportunity to compare the trend in construction with all combined industries. It is clear the rate of growth in the Construction industry exceeds the rate for all combined industries in this State over the last 13 years.
3 Workforce Futures: Background Paper One. See www.skillsaustralia.gov.au.
0.0
200.0
400.0
600.0
800.0
1000.0
1200.0
1400.0
0.00
20.00
40.00
60.00
80.00
100.00
120.00
140.00
to N
ov 9
7
to N
ov 9
8
to N
ov 9
9
to N
ov 0
0
to N
ov 0
1
to N
ov 0
2
to N
ov 0
3
to N
ov 0
4
to N
ov
05
to N
ov 0
6
to N
ov
07
to N
ov 0
8
to N
ov
09
Employed Construction All Industries
Construction V All industries

Workforce Development Plan – Construction Industry
Page | 15
3.4 National v State Projections
In comparison to Western Australia, the Construction industry nationally accounted for 16 per cent of the total job growth in the period 2004 to 2009. The projected national labour force is expected to grow moderately in the period 2010 to 2014.
4
Table 1 shows national employment growth and forecast rates for Construction in the period 2009 – 2018. The Construction industry is still one of the key growth industries along with mining, utilities, health and community services that are expected to lead the way.
5
Table 1 – National Employment Growth
Australia 08/09 09/10 10/11 11/12 12/13 13/14 14/15 15/16 16/17 17/18 10 yr Av.
Construction 2.36% 0.53% 9.55% 4.29% 4.04% 1.51% 1.49% 2.24% 2.36% 2.49% 3.09%
Table 2 shows short and long term forecasts for construction activity and labour in Western Australia as provided by the Construction Forecasting Council
6. Indications are for a 12.29% growth in the
State workforce between 2009/10 and 2014/15 (annual average 2.46%) then an average annual growth rate of 1.63% into the future. The 10 year average is predicted at 2.17% which appears a conservative figure for Western Australia.
Table 2 - Western Australian Short and Long Term Forecasts 2007-08 2008-09 2009-10
2010-11 F
2011-12 F
2012-13 F
2013-14 F
2014-15 F
2015-16 F
2016-17 F
2017-18 F
Long-term Residential, Non-residential, Engineering WA. Units in $millions.
22,638 24,598 23,758 22,979 24,379 24,778 25,081 26,028 27,428 28,570 30,057
Long-term Labour WA. (Jobs)
120,750 122,750 126,086 132,886 135,285 136,992 140,268 141,581 143,947 146,620 149,623
F = Forecast
Chart 9 – Western Australian Forecasts
Construction Forecasting Council F = Forecast
Chart 9 provides the previous forecast in graphical format.
Over the next 8 years there is a predicted 18% growth in labour requirement and 26% growth in value of work in the Construction sector.
4 Ibid. Workforce Futures: Background Paper One 5 Access Economics Future demand for higher education. See www.deewr.gov.au
6 Construction Forecasting Council; http://www.cfc.acif.com.au/forecast
0
20000
40000
60000
80000
100000
120000
140000
160000
Forecasts - Value v Jobs
Residential, Non-residential, Engineering (exc. Heavy) in $millions.
Long-term Labour WA.
Workforce Development Plan – Construction Industry
Page | 16
3.5 Forecasting
3.5.1 Housing Industry Association
The Housing Industry Association‟s (HIA) update for Western Australia in June 2010 provides the following information about current and forecasted building activity in Western Australia.
7
Dwellings Commencements:
2009/10 23,270 26% (Increase)
2010/11 (f) 22,170 -4.7% (Decrease)
2011/12 (f) 20,040 -10% (Decrease)
Housing Investment – value of work on housing (inc. renovations) in $millions
2009/10 11,098 6% Increase
2010/11 (f) 12,010 8% Increase
2011/12 (f) 11,956 0% Increase (f) = forecast
Underlying demand - the HIA are suggesting a current „national underbuild‟ requirement for 100,000 homes nationally. Total 20 year dwelling demand for Western Australia is estimated to be 472,683
8 & 9
and 230,700 over 10 years.
3.5.2 Master Builders Association
The Master Builders Association sources its forecasting information from the Housing Industry Forecasting Group and the Australian Construction Industry Forum forecast 22,000 dwellings constructed in 2009/10, with a fall in 2010/11 to 21,000 due to the drop in first home owner demand.
3.5.3 BIS Shrapnel
Over the past three years population growth in Western Australia has picked up and as a result there is an emerging undersupply of housing. Overseas migration and net interstate migration data from the Australian Bureau of Statistics (ABS) show a net increase of 68,000 or a growth of 2.8% in Western Australia in 2009. This has helped create a dwelling stock deficiency estimated at 8,500 in 2009, 12,700 in 2010, and 17,600 in 2011. BIS Shrapnel predicts total building commencements will increase from a value of $9.3 billion in 2009/10 to $10.6 billion in 2010/2011.
10 Dwelling
commencements are therefore expected to increase from 23,350 in 2009/10 to 24,050 in 2010/2011.
3.5.4 Summary of Forecasting
Industry and economy analysts all have different views on the level of construction activity in the future which reflects the volatile nature of the industry and its reliance on a wide range of economic and social factors which are difficult to predict.
3.5.5 Impact of Worker Flow to Resources Sector
It is estimated that the loss of skilled workers to the resources sector in the past five years has been in excess of 25,000 people. This situation has left the Construction industry in a difficult position of meeting the cost of training and employing new recruits only to lose those people at the point at which the industry was about to receive a productivity return.
7 HIA State Outlook June 2010.
8 http://www.skillsinfo.gov.au/NR/rdonlyres/552B74D2-C382-4678-AC09-D9571D31DCE6/0/Construction.pdf
9 The Residential Outlook for Western Australia Housing Industry Association, December 2009 10
BIS Shrapnel, Building Industry Prospects, March 2010.
Workforce Development Plan – Construction Industry
Page | 17
0%
5%
10%
15%
20%
25%
30%
35%
40%
45%
50%
Managers
Pro
fessio
nals
Te
chnic
ians &
Tra
des
Com
munity &
P
ers
onal S
erv
ice
Cle
rical &
Adm
in
Sale
s
Machin
ery
O
pera
tors
/Drivers
Laboure
rs
Not S
tate
d
Construction
Total WA Industries
3.6 Industry Occupational Overview
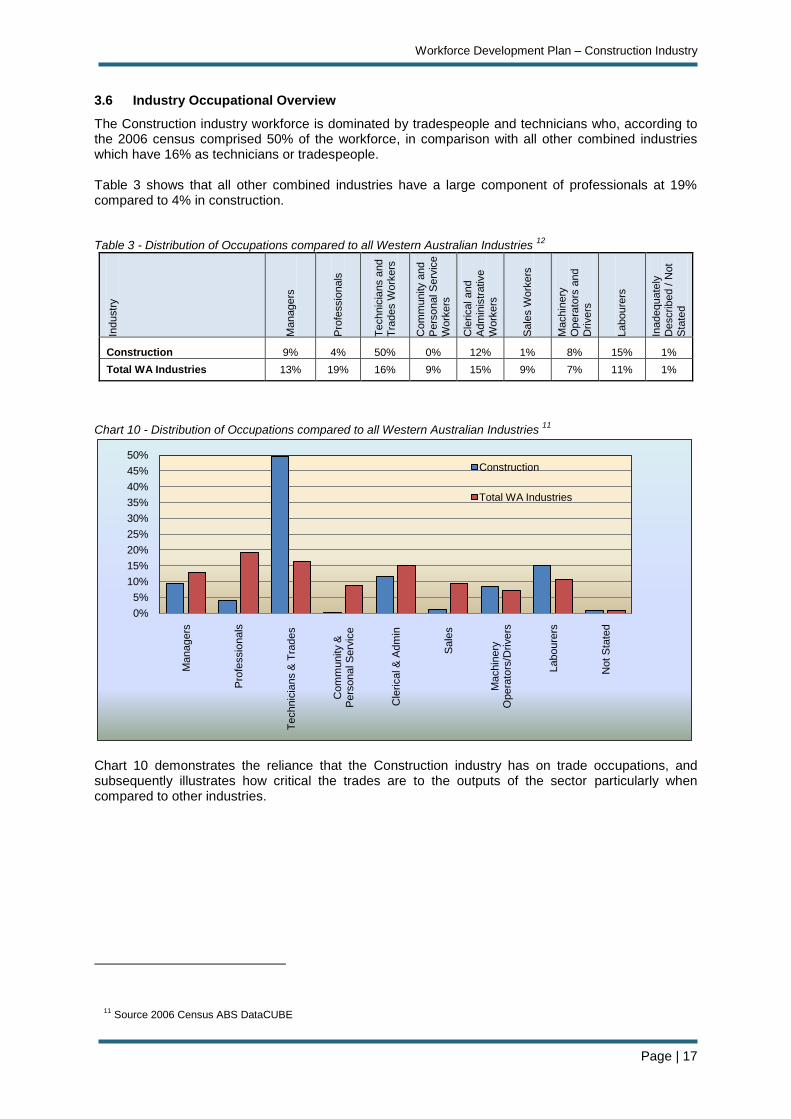
The Construction industry workforce is dominated by tradespeople and technicians who, according to the 2006 census comprised 50% of the workforce, in comparison with all other combined industries which have 16% as technicians or tradespeople.
Table 3 shows that all other combined industries have a large component of professionals at 19% compared to 4% in construction.
Table 3 - Distribution of Occupations compared to all Western Australian Industries
12
Industr
y
Ma
nagers
Pro
fessio
nals
Te
chnic
ians a
nd
Tra
des W
ork
ers
Com
munity a
nd
Pers
onal S
erv
ice
Work
ers
Cle
rical and
Adm
inis
trative
Work
ers
Sale
s W
ork
ers
Ma
chin
ery
Opera
tors
and
Drivers
Laboure
rs
Inadequate
ly
Describ
ed / N
ot
Sta
ted
Construction 9% 4% 50% 0% 12% 1% 8% 15% 1%
Total WA Industries 13% 19% 16% 9% 15% 9% 7% 11% 1%
Chart 10 - Distribution of Occupations compared to all Western Australian Industries 11
Chart 10 demonstrates the reliance that the Construction industry has on trade occupations, and subsequently illustrates how critical the trades are to the outputs of the sector particularly when compared to other industries.
11
Source 2006 Census ABS DataCUBE
Workforce Development Plan – Construction Industry
Page | 18
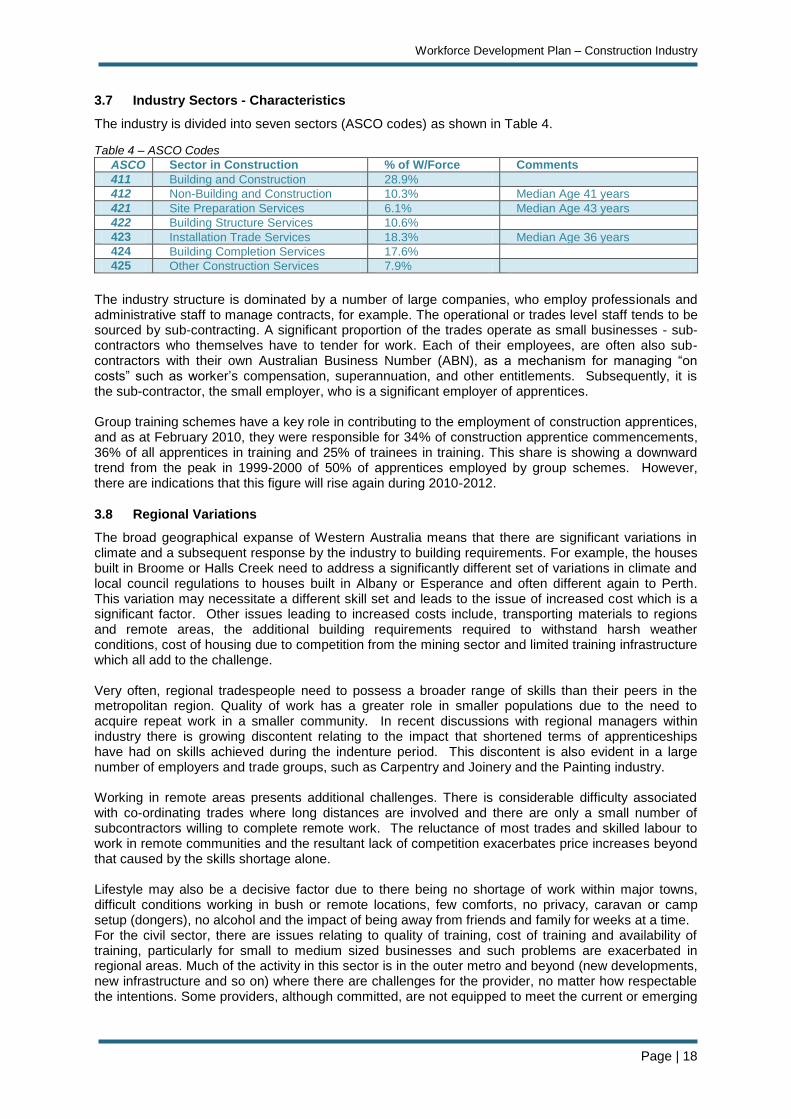
3.7 Industry Sectors - Characteristics
The industry is divided into seven sectors (ASCO codes) as shown in Table 4.
Table 4 – ASCO Codes
ASCO Sector in Construction % of W/Force Comments
411 Building and Construction 28.9%
412 Non-Building and Construction 10.3% Median Age 41 years
421 Site Preparation Services 6.1% Median Age 43 years
422 Building Structure Services 10.6%
423 Installation Trade Services 18.3% Median Age 36 years
424 Building Completion Services 17.6%
425 Other Construction Services 7.9%
The industry structure is dominated by a number of large companies, who employ professionals and administrative staff to manage contracts, for example. The operational or trades level staff tends to be sourced by sub-contracting. A significant proportion of the trades operate as small businesses - sub-contractors who themselves have to tender for work. Each of their employees, are often also sub-contractors with their own Australian Business Number (ABN), as a mechanism for managing “on costs” such as worker‟s compensation, superannuation, and other entitlements. Subsequently, it is the sub-contractor, the small employer, who is a significant employer of apprentices. Group training schemes have a key role in contributing to the employment of construction apprentices, and as at February 2010, they were responsible for 34% of construction apprentice commencements, 36% of all apprentices in training and 25% of trainees in training. This share is showing a downward trend from the peak in 1999-2000 of 50% of apprentices employed by group schemes. However, there are indications that this figure will rise again during 2010-2012.
3.8 Regional Variations
The broad geographical expanse of Western Australia means that there are significant variations in climate and a subsequent response by the industry to building requirements. For example, the houses built in Broome or Halls Creek need to address a significantly different set of variations in climate and local council regulations to houses built in Albany or Esperance and often different again to Perth. This variation may necessitate a different skill set and leads to the issue of increased cost which is a significant factor. Other issues leading to increased costs include, transporting materials to regions and remote areas, the additional building requirements required to withstand harsh weather conditions, cost of housing due to competition from the mining sector and limited training infrastructure which all add to the challenge. Very often, regional tradespeople need to possess a broader range of skills than their peers in the metropolitan region. Quality of work has a greater role in smaller populations due to the need to acquire repeat work in a smaller community. In recent discussions with regional managers within industry there is growing discontent relating to the impact that shortened terms of apprenticeships have had on skills achieved during the indenture period. This discontent is also evident in a large number of employers and trade groups, such as Carpentry and Joinery and the Painting industry. Working in remote areas presents additional challenges. There is considerable difficulty associated with co-ordinating trades where long distances are involved and there are only a small number of subcontractors willing to complete remote work. The reluctance of most trades and skilled labour to work in remote communities and the resultant lack of competition exacerbates price increases beyond that caused by the skills shortage alone. Lifestyle may also be a decisive factor due to there being no shortage of work within major towns, difficult conditions working in bush or remote locations, few comforts, no privacy, caravan or camp setup (dongers), no alcohol and the impact of being away from friends and family for weeks at a time. For the civil sector, there are issues relating to quality of training, cost of training and availability of training, particularly for small to medium sized businesses and such problems are exacerbated in regional areas. Much of the activity in this sector is in the outer metro and beyond (new developments, new infrastructure and so on) where there are challenges for the provider, no matter how respectable the intentions. Some providers, although committed, are not equipped to meet the current or emerging
Workforce Development Plan – Construction Industry
Page | 19
needs of the sector in the areas of technical expertise, delivery methodologies, resources, equipment or capacity to deliver to industry standards.
12
Part of the problem in carrying out any construction in wider regional and remote areas is the lack of continuity of work. Contractors travel, construct the building and leave. As a result there is no incentive or reason to maintain a local presence and to employ or train local residents. Very often contracts are contested in the metropolitan area, won by non local enterprises that do not invest in local people, and therefore, do not invest or support the local expertise or skill base. This further exacerbates the problem of continuity of work and viability of local businesses.
3.8.1 Regional Training
A key concern raised by industry stakeholders and employers in regions is the failure of the training system to provide local training services.
Statistics on regional training are detailed in this Plan but it is apparent that about 53% of all regional apprentices are required to travel and be accommodated away from home to undertake their technical training. The cost of this is prohibitive for the apprentices, their parents and their employers. There is also a significant social and safety problem in having young inexperienced people placed in a situation where they are away from home and unsupervised for lengthy periods of time.
This issue has been raised with the Department of Training and Workforce Development and regional RTP Managing Directors. Work is underway to implement strategies to increase regional delivery but there is a need to establish this as a key whole of Government issue.
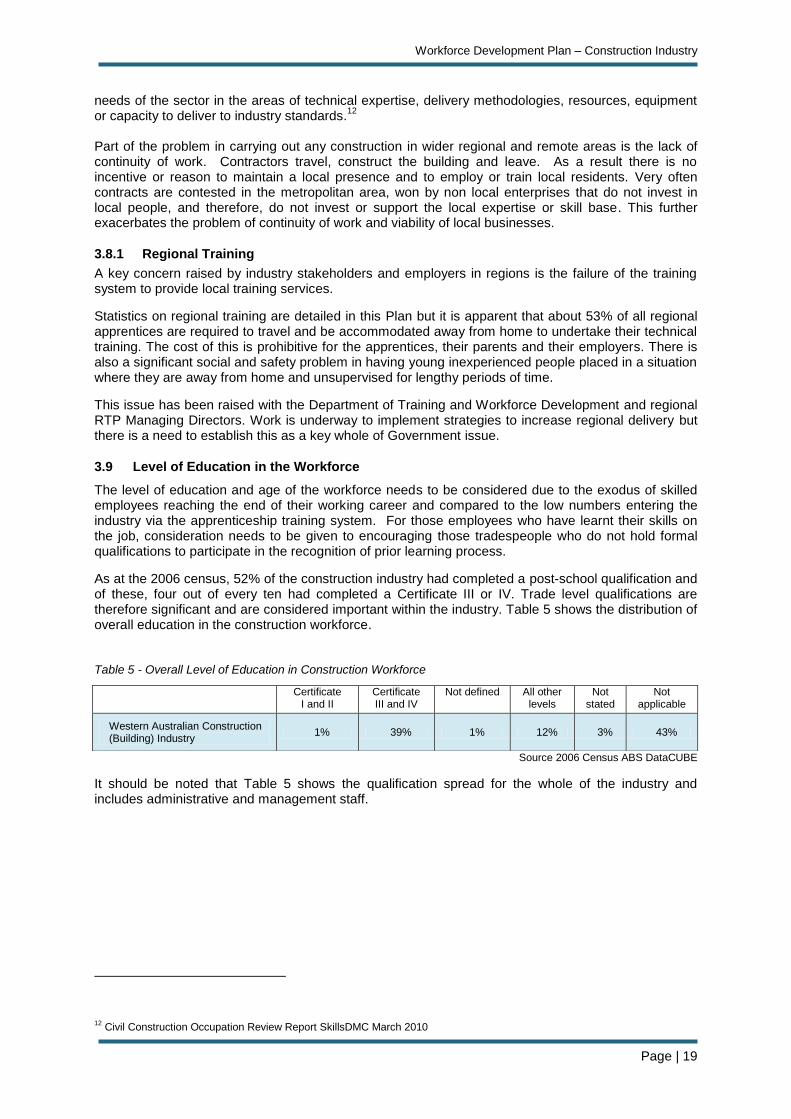
3.9 Level of Education in the Workforce
The level of education and age of the workforce needs to be considered due to the exodus of skilled employees reaching the end of their working career and compared to the low numbers entering the industry via the apprenticeship training system. For those employees who have learnt their skills on the job, consideration needs to be given to encouraging those tradespeople who do not hold formal qualifications to participate in the recognition of prior learning process.
As at the 2006 census, 52% of the construction industry had completed a post-school qualification and of these, four out of every ten had completed a Certificate III or IV. Trade level qualifications are therefore significant and are considered important within the industry. Table 5 shows the distribution of overall education in the construction workforce.
Table 5 - Overall Level of Education in Construction Workforce
Source 2006 Census ABS DataCUBE
It should be noted that Table 5 shows the qualification spread for the whole of the industry and includes administrative and management staff.
12
Civil Construction Occupation Review Report SkillsDMC March 2010
Certificate I and II
Certificate III and IV
Not defined All other levels
Not stated
Not applicable
Western Australian Construction (Building) Industry
1% 39% 1% 12% 3% 43%
Workforce Development Plan – Construction Industry
Page | 20
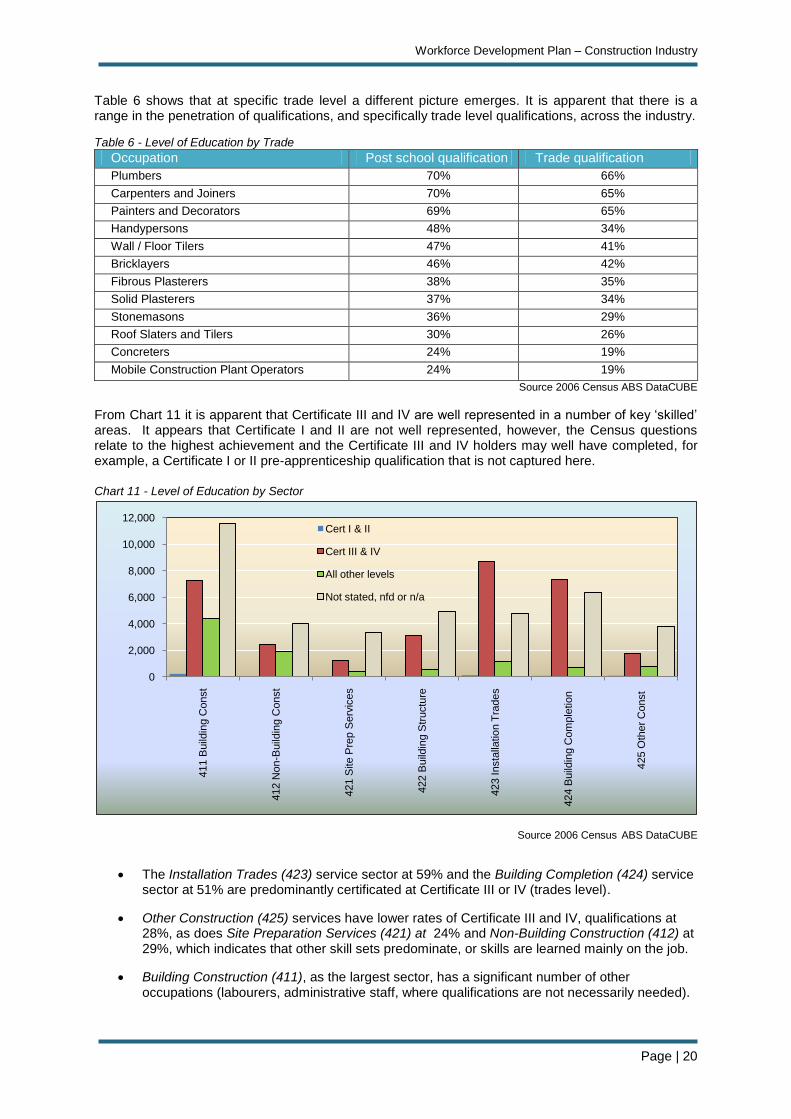
Table 6 shows that at specific trade level a different picture emerges. It is apparent that there is a range in the penetration of qualifications, and specifically trade level qualifications, across the industry.
Table 6 - Level of Education by Trade
Occupation Post school qualification Trade qualification
Plumbers 70% 66%
Carpenters and Joiners 70% 65%
Painters and Decorators 69% 65%
Handypersons 48% 34%
Wall / Floor Tilers 47% 41%
Bricklayers 46% 42%
Fibrous Plasterers 38% 35%
Solid Plasterers 37% 34%
Stonemasons 36% 29%
Roof Slaters and Tilers 30% 26%
Concreters 24% 19%
Mobile Construction Plant Operators 24% 19%
Source 2006 Census ABS DataCUBE
From Chart 11 it is apparent that Certificate III and IV are well represented in a number of key „skilled‟ areas. It appears that Certificate I and II are not well represented, however, the Census questions relate to the highest achievement and the Certificate III and IV holders may well have completed, for example, a Certificate I or II pre-apprenticeship qualification that is not captured here.
Chart 11 - Level of Education by Sector
Source 2006 Census ABS DataCUBE
The Installation Trades (423) service sector at 59% and the Building Completion (424) service sector at 51% are predominantly certificated at Certificate III or IV (trades level).
Other Construction (425) services have lower rates of Certificate III and IV, qualifications at 28%, as does Site Preparation Services (421) at 24% and Non-Building Construction (412) at 29%, which indicates that other skill sets predominate, or skills are learned mainly on the job.
Building Construction (411), as the largest sector, has a significant number of other occupations (labourers, administrative staff, where qualifications are not necessarily needed).
0
2,000
4,000
6,000
8,000
10,000
12,000
411 B
uild
ing C
onst
412 N
on-B
uild
ing C
onst
421 S
ite P
rep S
erv
ices
422 B
uild
ing S
tructu
re
423 Insta
llatio
n T
rades
424 B
uild
ing C
om
ple
tio
n
425 O
ther
Const
Cert I & II
Cert III & IV
All other levels
Not stated, nfd or n/a
Workforce Development Plan – Construction Industry
Page | 21
3.10 Quality and Relevance of Secondary Education
Industry employers and stakeholders are not satisfied with the performance of the education system which continues to focus on tertiary entrance as a first choice and priority for students. There remains a serious problem with vocational education which is perceived by parents, students, teachers and education administrators as less important and generally a second class option. The culture of the system is based on every student aspiring to university entry and those that are not academically capable of completing TEE should move on to employment or other training options. The vocational education programs, such as VET in Schools put in place in recent years are a step in the right direction but are varied, inconsistent in structure, unfocussed and ill defined. In 2009 approximately 6,000 students completed a unit of competency in a VET course and although this represents a significant increase in previous years, the majority of these students enrolled in one or two units of competency and did not complete a full VET qualification. Industry stakeholders criticised the system for being confusing and difficult to understand. It is inconsistently applied from school to school, with schools choosing any number of different options and there is a lack of clearly defined pathways. Students are not well aligned to subsequent training qualifications, with poor articulation; work experience is inconsistent or not provided in many cases and poorly coordinated. The majority of education staff, including teachers, Vocational Education and Training Coordinators and Councillors, have a negative view about vocational education. These groups have generally not worked in industry and therefore have little knowledge or understanding of the opportunities for, and needs of, students who will ultimately not enter university. As an indication of the results being achieved in the system during 2009, approximately 5,600 full time Year 10, 11 and 12 students achieved a full qualification, of which approximately 300 achieved a qualification in a construction related VET program. The Construction industry needs a much larger cohort of students pursuing a career in the industry. In 2009 there were 21,000 Year 12 students of which approximately 15,000 studied four or more subjects in a TEE course. Of this cohort about 11,000 gained an entrance score and 10,000 enrolled in a university course of study. Industry believes that there needs to be a significant change in culture, curriculum, mode of delivery and status of the system including resources to address the current failures and imbalance. One model of vocational education which appears to be working well is the program in place at the Australian Trades College in Armadale. This model involves Western Australian Certificate of Education (WACE) curriculum focused on supporting the student to enter a trade career. The student becomes a school based apprentice and studies in an environment aligned to the work place which enables a better transition to work. The College employs both teaching and trade qualified and industry experienced lecturers which is considered to be a reason for its success. The vast majority of jobs in the Construction industry and in many other industries do not require a tertiary level education. The education system is however, directing about 70% of its students into tertiary entrance courses. Even though about 80% of Tertiary Entrance Examination (TEE) students achieve the necessary education standard for university entry, only 66% of the students who enroll in a TEE program actually gain a place in university. The Construction industry would like to see a new model of vocational education introduced that is given equal status to TEE and which enables students to pursue a clearly defined vocational pathway to apprenticeships or para-professional occupations in the Construction industry.
Workforce Development Plan – Construction Industry
Page | 22
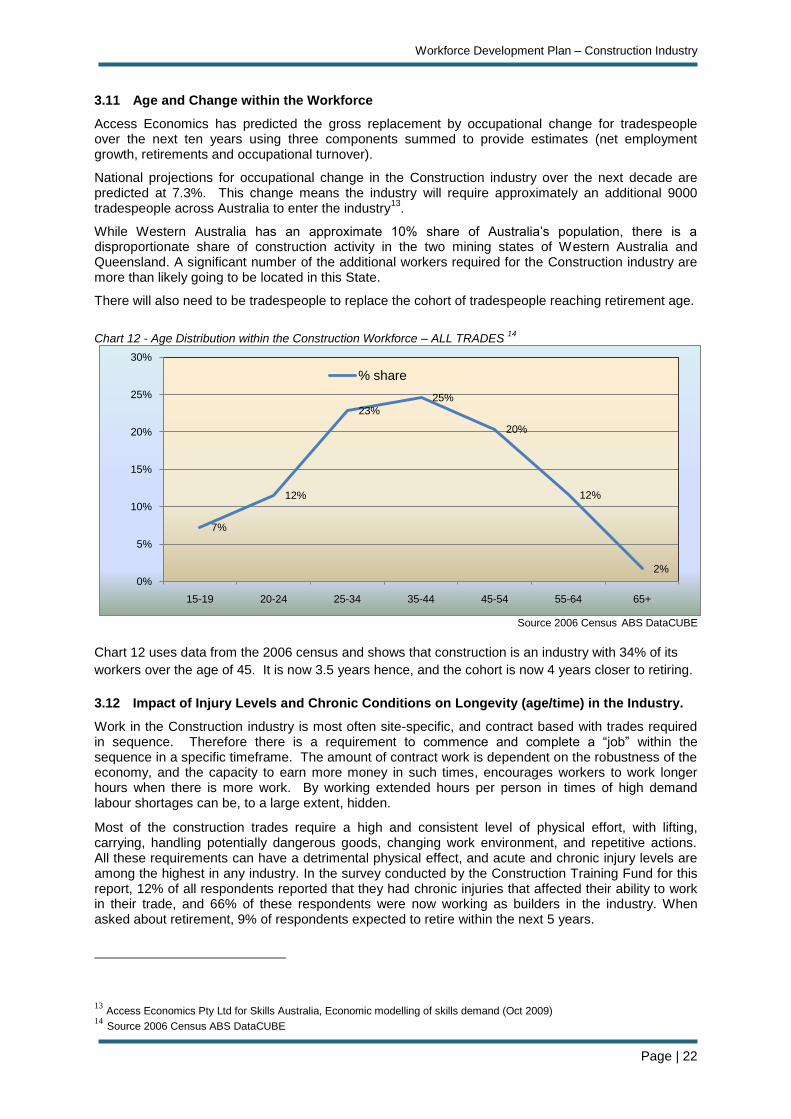
3.11 Age and Change within the Workforce
Access Economics has predicted the gross replacement by occupational change for tradespeople over the next ten years using three components summed to provide estimates (net employment growth, retirements and occupational turnover).
National projections for occupational change in the Construction industry over the next decade are predicted at 7.3%. This change means the industry will require approximately an additional 9000 tradespeople across Australia to enter the industry
13.
While Western Australia has an approximate 10% share of Australia‟s population, there is a disproportionate share of construction activity in the two mining states of Western Australia and Queensland. A significant number of the additional workers required for the Construction industry are more than likely going to be located in this State.
There will also need to be tradespeople to replace the cohort of tradespeople reaching retirement age.
Chart 12 - Age Distribution within the Construction Workforce – ALL TRADES
14
Source 2006 Census ABS DataCUBE
Chart 12 uses data from the 2006 census and shows that construction is an industry with 34% of its
workers over the age of 45. It is now 3.5 years hence, and the cohort is now 4 years closer to retiring.
3.12 Impact of Injury Levels and Chronic Conditions on Longevity (age/time) in the Industry.
Work in the Construction industry is most often site-specific, and contract based with trades required in sequence. Therefore there is a requirement to commence and complete a “job” within the sequence in a specific timeframe. The amount of contract work is dependent on the robustness of the economy, and the capacity to earn more money in such times, encourages workers to work longer hours when there is more work. By working extended hours per person in times of high demand labour shortages can be, to a large extent, hidden.
Most of the construction trades require a high and consistent level of physical effort, with lifting, carrying, handling potentially dangerous goods, changing work environment, and repetitive actions. All these requirements can have a detrimental physical effect, and acute and chronic injury levels are among the highest in any industry. In the survey conducted by the Construction Training Fund for this report, 12% of all respondents reported that they had chronic injuries that affected their ability to work in their trade, and 66% of these respondents were now working as builders in the industry. When asked about retirement, 9% of respondents expected to retire within the next 5 years.
13
Access Economics Pty Ltd for Skills Australia, Economic modelling of skills demand (Oct 2009) 14 Source 2006 Census ABS DataCUBE
7%
12%
23%
25%
20%
12%
2%0%
5%
10%
15%
20%
25%
30%
15-19 20-24 25-34 35-44 45-54 55-64 65+
% share
Workforce Development Plan – Construction Industry
Page | 23
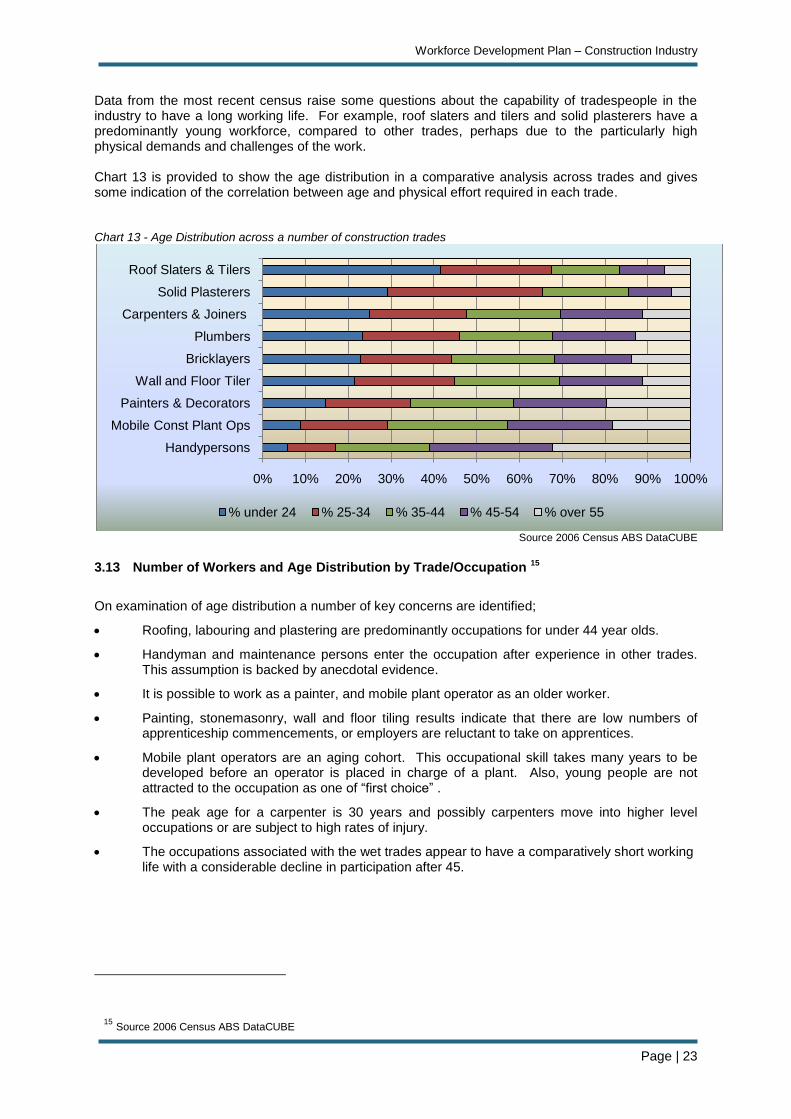
Data from the most recent census raise some questions about the capability of tradespeople in the industry to have a long working life. For example, roof slaters and tilers and solid plasterers have a predominantly young workforce, compared to other trades, perhaps due to the particularly high physical demands and challenges of the work. Chart 13 is provided to show the age distribution in a comparative analysis across trades and gives some indication of the correlation between age and physical effort required in each trade.
Chart 13 - Age Distribution across a number of construction trades
Source 2006 Census ABS DataCUBE
3.13 Number of Workers and Age Distribution by Trade/Occupation 15
On examination of age distribution a number of key concerns are identified;
Roofing, labouring and plastering are predominantly occupations for under 44 year olds.
Handyman and maintenance persons enter the occupation after experience in other trades. This assumption is backed by anecdotal evidence.
It is possible to work as a painter, and mobile plant operator as an older worker.
Painting, stonemasonry, wall and floor tiling results indicate that there are low numbers of apprenticeship commencements, or employers are reluctant to take on apprentices.
Mobile plant operators are an aging cohort. This occupational skill takes many years to be developed before an operator is placed in charge of a plant. Also, young people are not attracted to the occupation as one of “first choice” .
The peak age for a carpenter is 30 years and possibly carpenters move into higher level occupations or are subject to high rates of injury.
The occupations associated with the wet trades appear to have a comparatively short working life with a considerable decline in participation after 45.
15
Source 2006 Census ABS DataCUBE
0% 10% 20% 30% 40% 50% 60% 70% 80% 90% 100%
Handypersons
Mobile Const Plant Ops
Painters & Decorators
Wall and Floor Tiler
Bricklayers
Plumbers
Carpenters & Joiners
Solid Plasterers
Roof Slaters & Tilers
% under 24 % 25-34 % 35-44 % 45-54 % over 55
Workforce Development Plan – Construction Industry
Page | 24
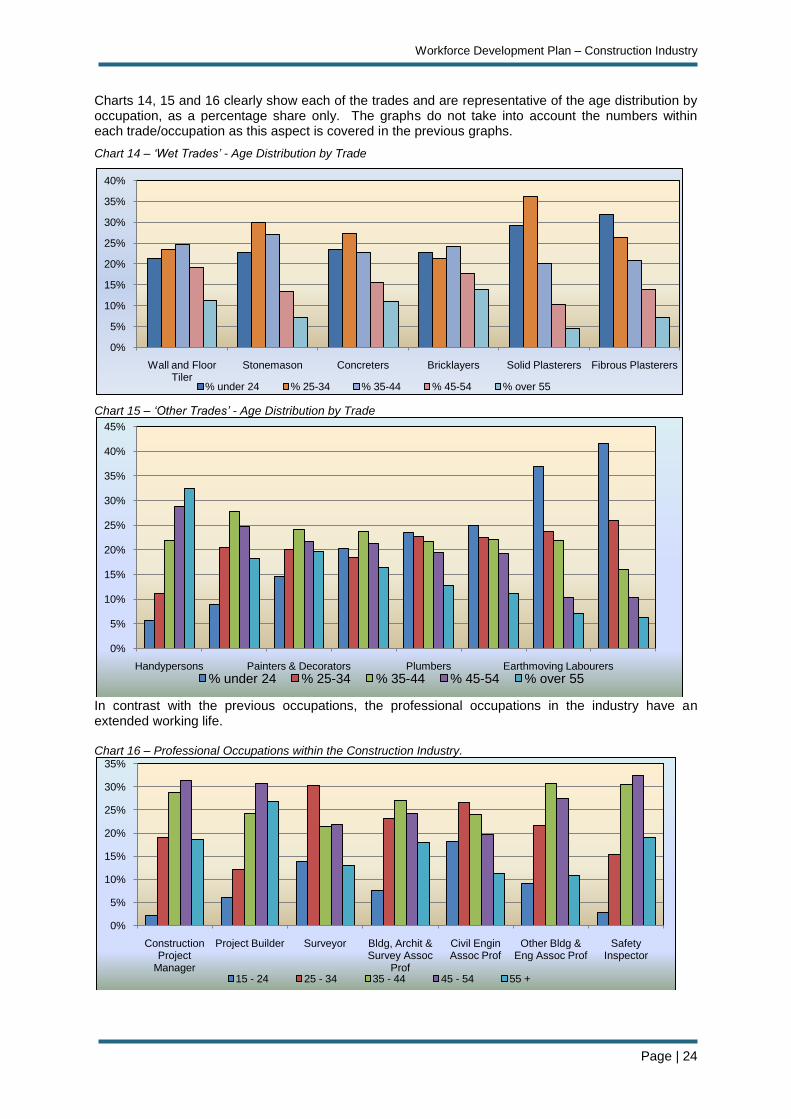
Charts 14, 15 and 16 clearly show each of the trades and are representative of the age distribution by occupation, as a percentage share only. The graphs do not take into account the numbers within each trade/occupation as this aspect is covered in the previous graphs.
Chart 14 – ‘Wet Trades’ - Age Distribution by Trade
Chart 15 – ‘Other Trades’ - Age Distribution by Trade
In contrast with the previous occupations, the professional occupations in the industry have an extended working life.
Chart 16 – Professional Occupations within the Construction Industry.
0%
5%
10%
15%
20%
25%
30%
35%
40%
Wall and Floor Tiler
Stonemason Concreters Bricklayers Solid Plasterers Fibrous Plasterers
% under 24 % 25-34 % 35-44 % 45-54 % over 55
0%
5%
10%
15%
20%
25%
30%
35%
40%
45%
Handypersons Painters & Decorators Plumbers Earthmoving Labourers
% under 24 % 25-34 % 35-44 % 45-54 % over 55
0%
5%
10%
15%
20%
25%
30%
35%
Construction Project
Manager
Project Builder Surveyor Bldg, Archit & Survey Assoc
Prof
Civil Engin Assoc Prof
Other Bldg & Eng Assoc Prof
Safety Inspector
15 - 24 25 - 34 35 - 44 45 - 54 55 +
Workforce Development Plan – Construction Industry
Page | 25
0.0%
5.0%
10.0%
15.0%
20.0%
25.0%
30.0%
% Apprentices in training by major industries
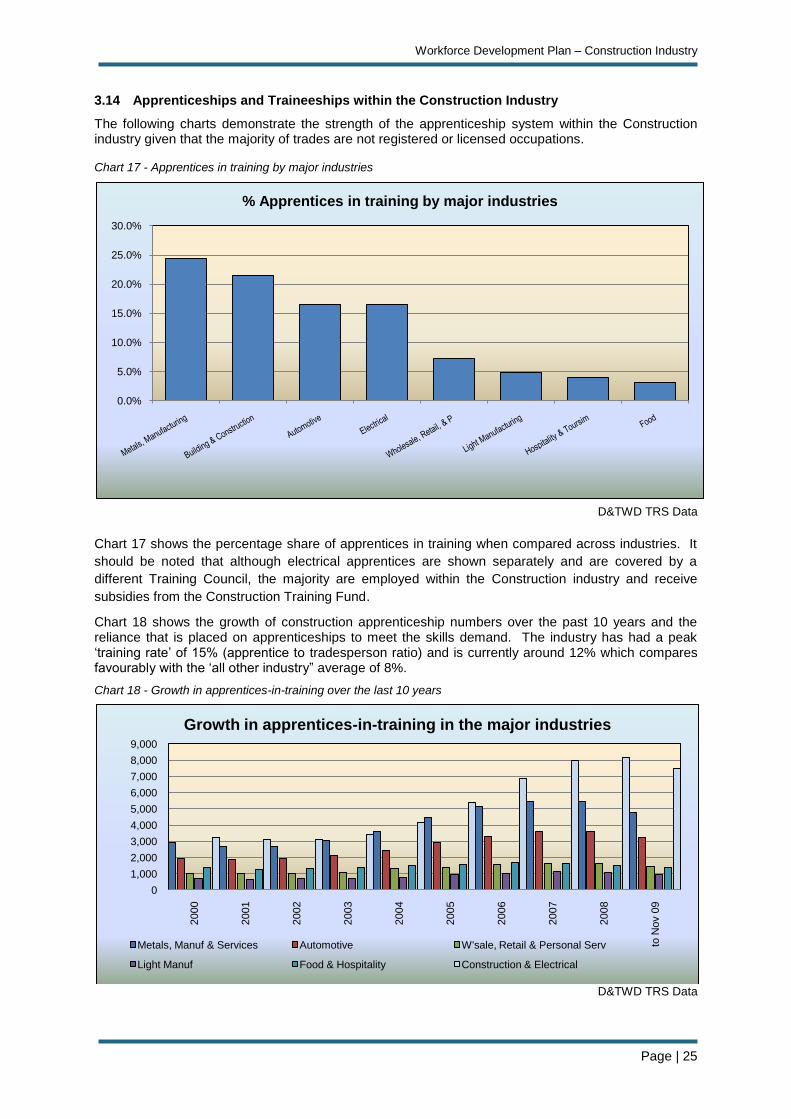
3.14 Apprenticeships and Traineeships within the Construction Industry
The following charts demonstrate the strength of the apprenticeship system within the Construction industry given that the majority of trades are not registered or licensed occupations.
Chart 17 - Apprentices in training by major industries
D&TWD TRS Data
Chart 17 shows the percentage share of apprentices in training when compared across industries. It
should be noted that although electrical apprentices are shown separately and are covered by a
different Training Council, the majority are employed within the Construction industry and receive
subsidies from the Construction Training Fund.
Chart 18 shows the growth of construction apprenticeship numbers over the past 10 years and the reliance that is placed on apprenticeships to meet the skills demand. The industry has had a peak „training rate‟ of 15% (apprentice to tradesperson ratio) and is currently around 12% which compares favourably with the „all other industry” average of 8%.
Chart 18 - Growth in apprentices-in-training over the last 10 years
D&TWD TRS Data
0
1,000
2,000
3,000
4,000
5,000
6,000
7,000
8,000
9,000
2000
2001
2002
2003
2004
2005
2006
2007
2008
to N
ov 0
9
Growth in apprentices-in-training in the major industries
Metals, Manuf & Services Automotive W'sale, Retail & Personal Serv
Light Manuf Food & Hospitality Construction & Electrical
Workforce Development Plan – Construction Industry
Page | 26
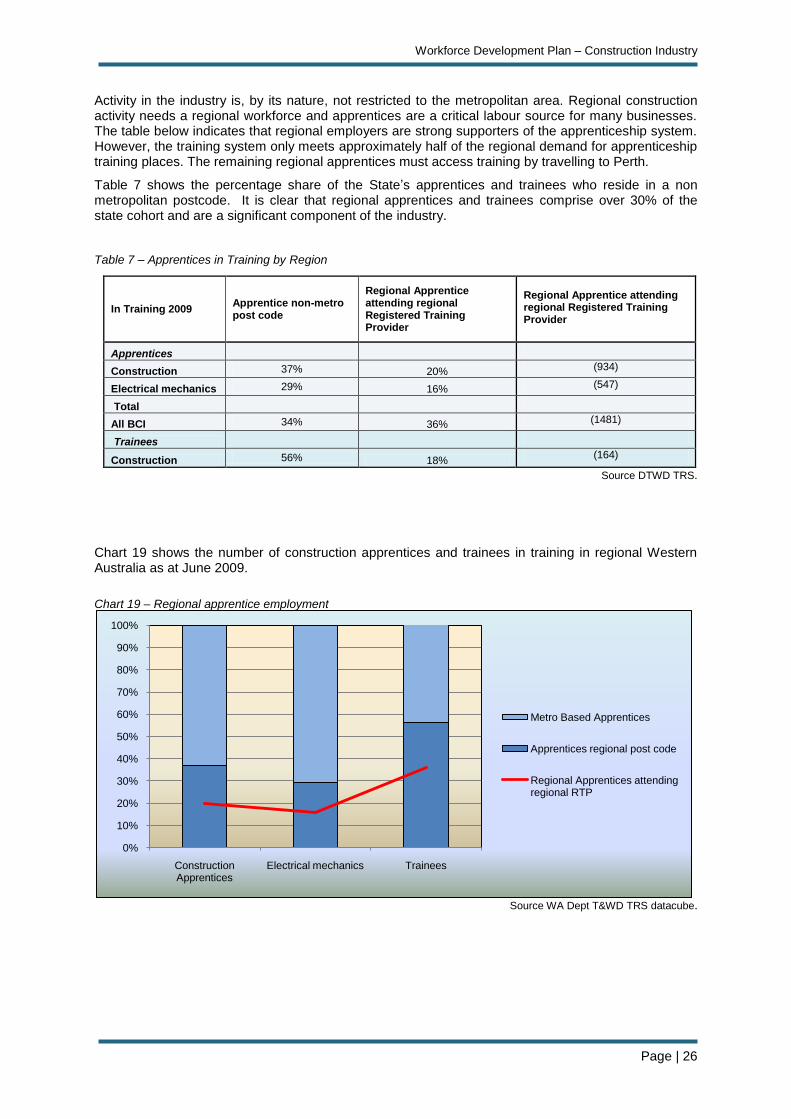
Activity in the industry is, by its nature, not restricted to the metropolitan area. Regional construction activity needs a regional workforce and apprentices are a critical labour source for many businesses. The table below indicates that regional employers are strong supporters of the apprenticeship system. However, the training system only meets approximately half of the regional demand for apprenticeship training places. The remaining regional apprentices must access training by travelling to Perth.
Table 7 shows the percentage share of the State‟s apprentices and trainees who reside in a non metropolitan postcode. It is clear that regional apprentices and trainees comprise over 30% of the state cohort and are a significant component of the industry.
Table 7 – Apprentices in Training by Region
Source DTWD TRS.
Chart 19 shows the number of construction apprentices and trainees in training in regional Western Australia as at June 2009.
Chart 19 – Regional apprentice employment
Source WA Dept T&WD TRS datacube.
0%
10%
20%
30%
40%
50%
60%
70%
80%
90%
100%
Construction Apprentices
Electrical mechanics Trainees
Metro Based Apprentices
Apprentices regional post code
Regional Apprentices attending regional RTP
In Training 2009 Apprentice non-metro post code
Regional Apprentice attending regional Registered Training Provider
Regional Apprentice attending regional Registered Training Provider
Apprentices
Construction 37% 20% (934)
Electrical mechanics 29% 16% (547)
Total
All BCI 34% 36% (1481)
Trainees
Construction 56% 18% (164)
Workforce Development Plan – Construction Industry
Page | 27
3.15 Indigenous Employment in the Industry
The Indigenous population is a “young” population with the last census indicating that the average age of Indigenous males is 21.1 from a population of 35,775, while the average age of a non-Indigenous male is 36.1. More than half (57.5%) of Indigenous males were under 25 years of age in 2006.
16
There are billions of dollars worth of resource projects North of the 26º parallel and 4.6% of Western Australia‟s population resides in that location, with 40% of the population in this location being Indigenous.
There is a significant pool of unemployed Indigenous males, not actively looking for work or not in the labour force. Of those who are employed, a significant number are without qualifications. The participation of Indigenous people in Vocational Education and Training tends to be in Certificate I or II, or subject specific enrolments.
1,055 or 7.1% of Western Australian Indigenous workers reported that they worked in the Construction industry. This figure represents less than 0.8% of the industry‟s workforce while 3% of Western Australia‟s population are Indigenous people.
As at May 2010, there are 323 Indigenous apprentices and trainees within the Construction industry which equates to 3.9% of the apprentice/trainee population.
Very low rates of school attendance and participation amongst Indigenous children, contribute to low literacy and numeracy levels which in turn limits access to mainstream training options. From a labour market perspective, retention to Year 10 is a significant step for Indigenous students with evidence indicating that it almost doubles the chances of employment. Vocational Education and Training participation is not providing Indigenous people with successful pathways from learning to work.
Mainstream construction training programs are a mixed success and may try to get people in at too high a level, such as training for apprenticeships and qualifications, when elementary skills are still missing.
The Construction Training Council recognises this and recently developed the Certificate II Traineeship in Building Maintenance. This traineeship has additional funded hours in order to address the literacy, numeracy, life and employment skills deficit. The qualification is a destination in itself, as well as being a pathway into the trades and more complex aspects of construction as proficiency and confidence grow.
Additionally, the Construction Training Fund recognises the importance of mentoring, and supports the funding of individual projects involving provision of mentoring support for apprentices.
16
Source 2006 Census ABS DataCUBE
Workforce Development Plan – Construction Industry
Page | 28
4 Industry Critical Jobs
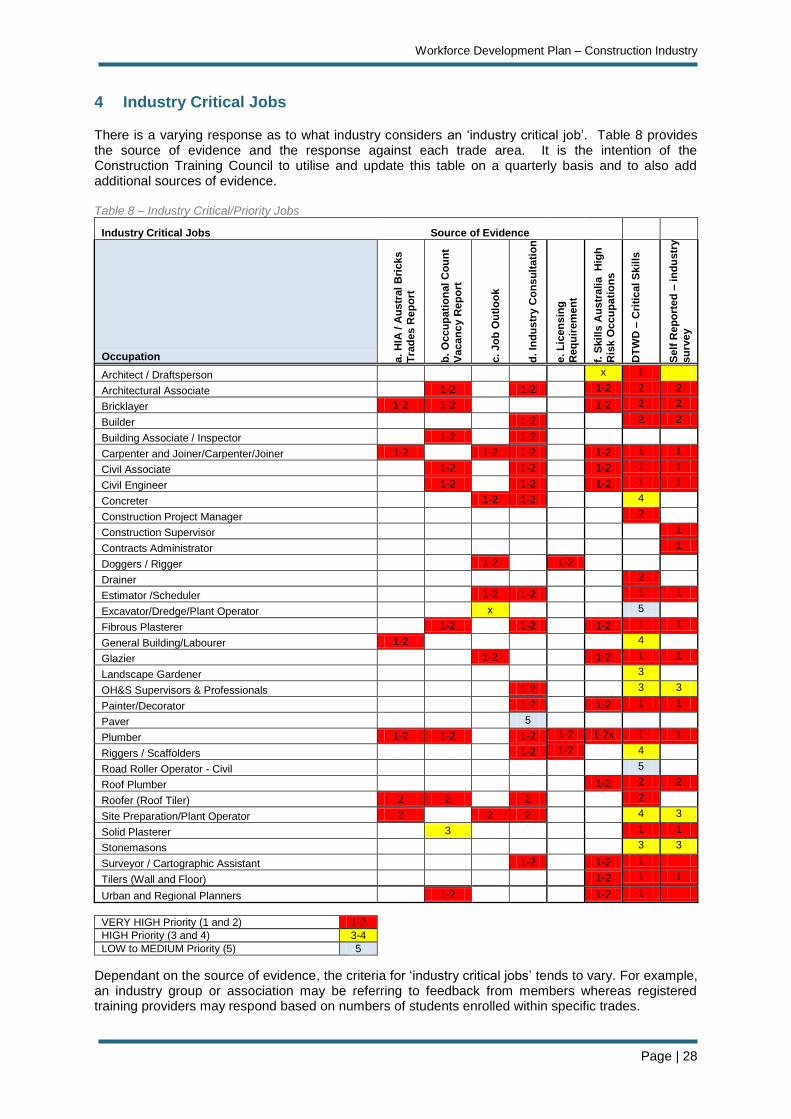
There is a varying response as to what industry considers an „industry critical job‟. Table 8 provides the source of evidence and the response against each trade area. It is the intention of the Construction Training Council to utilise and update this table on a quarterly basis and to also add additional sources of evidence. Table 8 – Industry Critical/Priority Jobs
Industry Critical Jobs Source of Evidence
Occupation a.
HIA
/ A
us
tral
Bri
cks
Tra
de
s R
ep
ort
b.
Occu
pa
tio
nal
Co
un
t
Vacan
cy R
ep
ort
c.
Jo
b O
utl
oo
k
d. In
du
str
y C
on
su
ltati
on
e.
Lic
en
sin
g
Req
uir
em
en
t
f. S
kills
Au
str
alia H
igh
Ris
k O
ccu
pa
tio
ns
DT
WD
– C
riti
cal S
kills
Self
Rep
ort
ed
– in
du
str
y
su
rvey
Architect / Draftsperson x 1
Architectural Associate 1-2
1-2 1-2 2 2
Bricklayer 1-2 1-2
1-2 2 2
Builder 1-2 2 2
Building Associate / Inspector 1-2
1-2
Carpenter and Joiner/Carpenter/Joiner 1-2
1-2 1-2 1-2 1 1
Civil Associate 1-2
1-2 1-2 1 1
Civil Engineer 1-2
1-2 1-2 1 1
Concreter 1-2 1-2 4
Construction Project Manager 2
Construction Supervisor 1
Contracts Administrator 1
Doggers / Rigger 1-2
1-2
Drainer 2
Estimator /Scheduler 1-2 1-2 1 1
Excavator/Dredge/Plant Operator x
5
Fibrous Plasterer 1-2
1-2 1-2 1 1
General Building/Labourer 1-2
4
Glazier 1-2
1-2 1 1
Landscape Gardener 3
OH&S Supervisors & Professionals 1-2 3 3
Painter/Decorator 1-2 1-2 1 1
Paver 5
Plumber 1-2 1-2
1-2 1-2 1-2x 1 1
Riggers / Scaffolders 1-2 1-2 4
Road Roller Operator - Civil 5
Roof Plumber 1-2 2 2
Roofer (Roof Tiler) 2 2
2 2
Site Preparation/Plant Operator 2
2 2 4 3
Solid Plasterer 3
1 1
Stonemasons 3 3
Surveyor / Cartographic Assistant 1-2 1-2 1
Tilers (Wall and Floor) 1-2 1 1
Urban and Regional Planners 1-2
1-2 1
VERY HIGH Priority (1 and 2) 1-2
HIGH Priority (3 and 4) 3-4
LOW to MEDIUM Priority (5) 5
Dependant on the source of evidence, the criteria for „industry critical jobs‟ tends to vary. For example, an industry group or association may be referring to feedback from members whereas registered training providers may respond based on numbers of students enrolled within specific trades.
Workforce Development Plan – Construction Industry
Page | 29
Industry critical jobs can alternatively be viewed as high risk occupations as is the approach of Skills Australia. A discussion paper released in October 2009
17 outlined four criteria for defining such
occupations:
Where the skills are specialised and there is a long lead time to develop them.
Where there is good fit between what people train for and the jobs they get - that is, the skills are well-used in industry.
Where there is significant disruption if the skills are in short supply, for example causing bottlenecks in supply chains, generating significant community costs, or a risk of not meeting government priorities.
Where there is sufficient information to assess the future demand for a skill.
4.1 Forecast Strong Demand – further evidence
A future skills shortage or more specifically a skilled labour and labour shortage is predicted by a number of industry and economic analysts. The shortage of skilled workers in residential construction is predicted to rise to almost 65,000 nationally by 2012-13 (Housing Industry Association), highlighting the need for more apprentices and increased uptake of industry training – based on the assumption that there is labour available.
Lag time for training – skilled trades as shown in the critical skills occupations and SPOL all require training and skills development over extended period of time, usually a two to four year lead time.
Demographics – Western Australia‟s population growth is very strong (on average) at 0.6% per annum since 1982 and running at over 3% in the June 2009 quarter. This growth will impact on the need for housing and infrastructure.
Migration - The federal government has announced changes to its immigration program which focuses primarily on temporary visas addressing skill shortages. A new SPOL has been developed by Skills Australia to identify specific trades and professions in short supply.
New and emerging technology/occupations - The use of prefabrication may impact on aspects of the building industry and especially in regional areas. There is also the expected impact of energy smart and conservation technology and how this will impact on development of skills and training for existing workers.
Decline in training rate - Training rate represents the ratio of apprentices to tradespeople employed in any given industry sector. Over the last five years, as a total of all industries, the training rate has not maintained pace with the increase in the growth of the State construction workforce. However, the Construction industry has maintained a training rate of approximately 12% after a 14% peak during the growth period prior to the Global Financial Crisis as compared to an overall „other industry‟ rate of approximately 8%.
18
17 Workforce Futures, Papers to Promote Discussion: Towards an Australian Workforce Development Strategy, Skills Australia. See http://www.skillsaustralia.gov.au/PDFs_RTFs/WorkforceFuturesOverview1.pdf 18
Construction Industry Snapshot – December 2009 – Construction Training Fund
Workforce Development Plan – Construction Industry
Page | 30
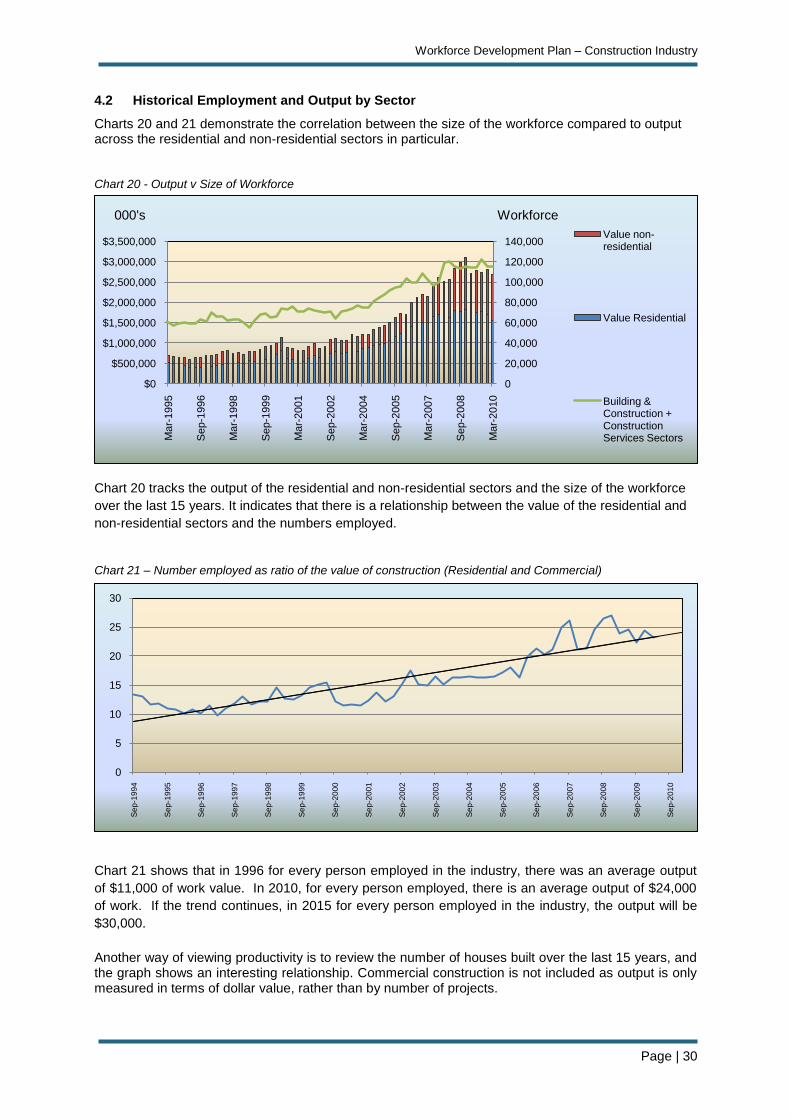
4.2 Historical Employment and Output by Sector
Charts 20 and 21 demonstrate the correlation between the size of the workforce compared to output across the residential and non-residential sectors in particular. Chart 20 - Output v Size of Workforce
Chart 20 tracks the output of the residential and non-residential sectors and the size of the workforce
over the last 15 years. It indicates that there is a relationship between the value of the residential and
non-residential sectors and the numbers employed.
Chart 21 – Number employed as ratio of the value of construction (Residential and Commercial)
Chart 21 shows that in 1996 for every person employed in the industry, there was an average output
of $11,000 of work value. In 2010, for every person employed, there is an average output of $24,000
of work. If the trend continues, in 2015 for every person employed in the industry, the output will be
$30,000.
Another way of viewing productivity is to review the number of houses built over the last 15 years, and the graph shows an interesting relationship. Commercial construction is not included as output is only measured in terms of dollar value, rather than by number of projects.
0
20,000
40,000
60,000
80,000
100,000
120,000
140,000
$0
$500,000
$1,000,000
$1,500,000
$2,000,000
$2,500,000
$3,000,000
$3,500,000
Mar-
1995
Sep-1
996
Mar-
1998
Sep-1
999
Mar-
2001
Sep-2
002
Mar-
2004
Sep-2
005
Mar-
2007
Sep-2
008
Mar-
2010
Value non-residential
Value Residential
Building & Construction + Construction Services Sectors
000's Workforce
0
5
10
15
20
25
30
Se
p-1
99
4
Se
p-1
99
5
Se
p-1
99
6
Se
p-1
99
7
Se
p-1
99
8
Se
p-1
99
9
Se
p-2
00
0
Se
p-2
00
1
Se
p-2
00
2
Se
p-2
00
3
Se
p-2
00
4
Se
p-2
00
5
Se
p-2
00
6
Se
p-2
00
7
Se
p-2
00
8
Se
p-2
00
9
Se
p-2
01
0

Workforce Development Plan – Construction Industry
Page | 31
Chart 22 - Number employed v Residential Construction activity
Chart 22 shows that the number of dwellings has a linear relationship to the number employed in the
two sectors. By 2011, there will be 5.2 people employed in the industry for every dwelling unit
completed. In January 2005, there were 2.4 people employed in the industry for every dwelling
completed.
The purpose of the above charts is that it is a useful predictor in determining the number of workers
needed to meet growing demand.
4.3 Apprentice Completion Rates, Cancellations, Withdrawals and Overall Attrition.
The following table is a snapshot of apprenticeship employment activity by cohort in the Construction industry and provides some insight into the employment patterns during highs and lows of economic activity.
Table 9 – Apprentice Completion rates, cancellations and withdrawal statistics
Apprenticeships (excluding Electrical Mechanics) in Construction Industry
Commenced Completed Still Active
Completion rate
Best possible completion rate*
WD Rate** Cancel***
1999 767 459 0 59.8% 59.8% 14.7% 23.6%
2000 786 478 0 60.8% 60.8% 13.1% 24.3%
2001 658 441 0 67.0% 67.0% 12.3% 19.9%
2002 800 509 0 63.6% 63.6% 13.9% 21.6%
2003 1,009 596 0 59.1% 59.1% 15.8% 23.8%
2004 1,402 815 0 58.1% 58.1% 18.3% 22.5%
2005 1,734 1,054 1 60.8% 60.8% 14.6% 24.0%
2006 2,294 1,221 71 53.2% 56.3% 16.0% 26.4%
2007 2,342 723 497 30.9% 52.1% 17.1% 28.3%
2008 1,873 89 1,028 4.8% 59.6% 14.4% 24.8%
2009 1,637 67 1,089 4.1% 70.6% 8.6% 19.4%
To July 2010 1,697 10 1,472 0.6% 87.3% 7.4% 4.6% Note1: that the statistics for 2010 are preliminary, and it is too early to be conclusive about completion rates for recent years.
Note 2: *Best possible completion rate only applies if all current active apprentices complete. Note 3. **Withdrawals (WD) are when an apprentice leaves during probation
Note 4. *** Cancellations occur after registration.
0
5,000
10,000
15,000
20,000
25,000
0
20,000
40,000
60,000
80,000
100,000
120,000
Workforce Dwellings
Building & Construction + Construction Services Employment Number of Dwelling Units Completed
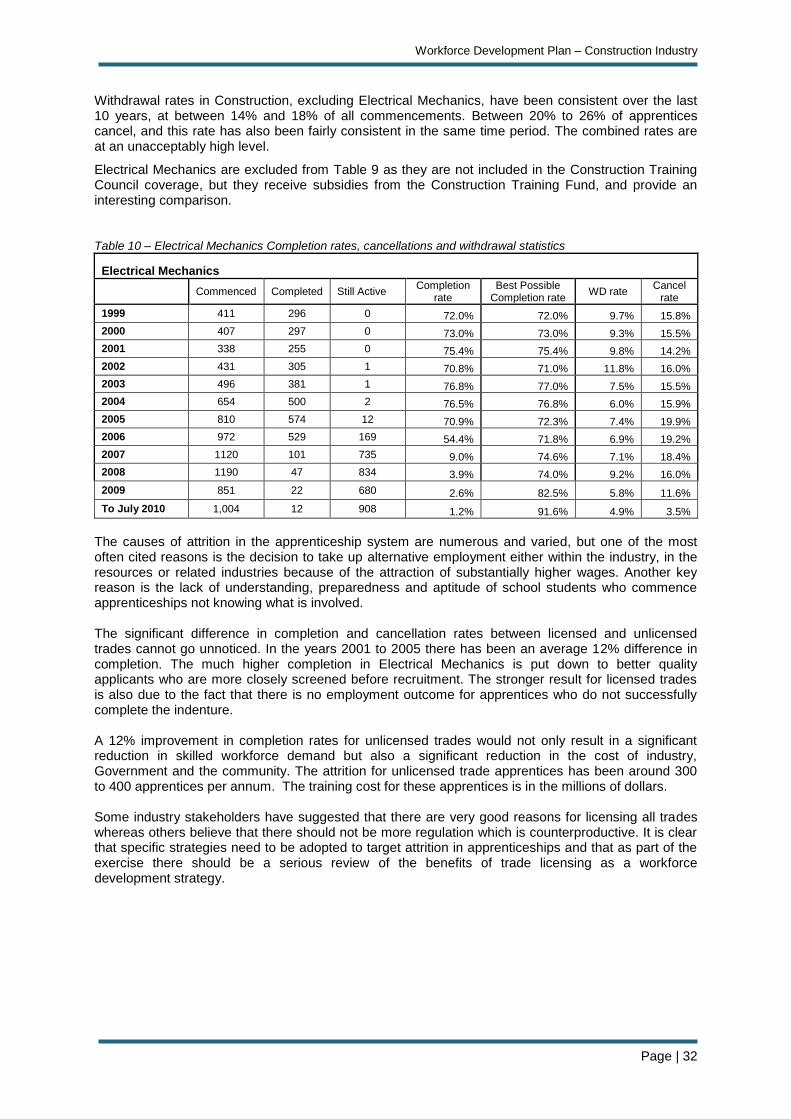
Workforce Development Plan – Construction Industry
Page | 32
Withdrawal rates in Construction, excluding Electrical Mechanics, have been consistent over the last 10 years, at between 14% and 18% of all commencements. Between 20% to 26% of apprentices cancel, and this rate has also been fairly consistent in the same time period. The combined rates are at an unacceptably high level.
Electrical Mechanics are excluded from Table 9 as they are not included in the Construction Training Council coverage, but they receive subsidies from the Construction Training Fund, and provide an interesting comparison.
Table 10 – Electrical Mechanics Completion rates, cancellations and withdrawal statistics
Electrical Mechanics
Commenced Completed Still Active Completion
rate Best Possible
Completion rate WD rate
Cancel rate
1999 411 296 0 72.0% 72.0% 9.7% 15.8%
2000 407 297 0 73.0% 73.0% 9.3% 15.5%
2001 338 255 0 75.4% 75.4% 9.8% 14.2%
2002 431 305 1 70.8% 71.0% 11.8% 16.0%
2003 496 381 1 76.8% 77.0% 7.5% 15.5%
2004 654 500 2 76.5% 76.8% 6.0% 15.9%
2005 810 574 12 70.9% 72.3% 7.4% 19.9%
2006 972 529 169 54.4% 71.8% 6.9% 19.2%
2007 1120 101 735 9.0% 74.6% 7.1% 18.4%
2008 1190 47 834 3.9% 74.0% 9.2% 16.0%
2009 851 22 680 2.6% 82.5% 5.8% 11.6%
To July 2010 1,004 12 908 1.2% 91.6% 4.9% 3.5%
The causes of attrition in the apprenticeship system are numerous and varied, but one of the most often cited reasons is the decision to take up alternative employment either within the industry, in the resources or related industries because of the attraction of substantially higher wages. Another key reason is the lack of understanding, preparedness and aptitude of school students who commence apprenticeships not knowing what is involved. The significant difference in completion and cancellation rates between licensed and unlicensed trades cannot go unnoticed. In the years 2001 to 2005 there has been an average 12% difference in completion. The much higher completion in Electrical Mechanics is put down to better quality applicants who are more closely screened before recruitment. The stronger result for licensed trades is also due to the fact that there is no employment outcome for apprentices who do not successfully complete the indenture. A 12% improvement in completion rates for unlicensed trades would not only result in a significant reduction in skilled workforce demand but also a significant reduction in the cost of industry, Government and the community. The attrition for unlicensed trade apprentices has been around 300 to 400 apprentices per annum. The training cost for these apprentices is in the millions of dollars. Some industry stakeholders have suggested that there are very good reasons for licensing all trades whereas others believe that there should not be more regulation which is counterproductive. It is clear that specific strategies need to be adopted to target attrition in apprenticeships and that as part of the exercise there should be a serious review of the benefits of trade licensing as a workforce development strategy.
Workforce Development Plan – Construction Industry
Page | 33
5 Barriers to Employment and Training
The Global Financial Crisis (GFC) of 2008/09 had a major negative impact on employment and training as shown within the Environmental Scan.
During 2009 the industry experienced a 30% reduction in apprentice commencements. However during 2010 the numbers of apprentices entering the industry has increased substantially. The increase can be attributed to a number of reasons:
The effect of low apprenticeship commencements in 2008/09 has caused a shortage of apprentices in training as the economy recovers.
The seasonal exit of apprentices who are completing their training has compounded the fall in numbers in training.
An increase in building activity in some sectors of the industry.
State Government Worker‟s Compensation Rebate for 1st year apprentices and the Federal
Government „Apprentice Kickstart Bonus‟ incentive program.
Increased Construction Training Fund subsidies for employers of apprentices.
Impact of projects planned for the Resources sector.
Improving economic forecasts.
Employer confidence and awareness of the skilled labour shortage that was experienced in the previous 5 years of growth.
Effects of the Government stimulus package.
5.1 Barriers to Employment
Key factors raised during the consultation process identified a number of barriers to employment:
Economic uncertainty and continuity of work.
In times of growth there is an acute „labour shortage‟ rather than skills shortage.
Competition from other sectors paying higher wages.
Employers express concern at the lack of commitment by some people and the expectation of high wages without the requisite skill level.
There is a level of disillusion with the ability of the Resource sector to poach trained workers, and the small pool of suitable replacements, particularly in regional areas where the population is limited.
Shortage of skilled tradespeople, and the lack of commitment to learning/formal training.
The distortion of high wages available in the Resource sector as a labourer or semi-skilled worker means that many young people will not commit to an apprenticeship.
Cost of recruiting new employees after labour is poached by the Resource sector.
Language, literacy numeracy skills. Particularly evident in areas where formal qualifications or licensing are not required. 50% of survey respondents were affected by poor reading and numerical skills among their employees
19.
On costs such as payroll tax, workers compensation, public liability insurance, superannuation and training costs deter small to medium employers from employing apprentices in particular.
In skilled areas, the development of technical and trade skills relies on time and incremental development of skills and results in a long lead time to achieve skilled competence. Therefore, the ability to address skills shortages in a reduced timeframe is limited.
The migration process for non-sponsored skilled applicants is too lengthy and relies on overseas assessment that is not always able to meet demand.
In the May 2010 Construction Industry Workforce Development Survey20
, 77% of businesses nominated that being able to find the right people with the right skills is the single biggest problem they faced.
19
Construction Industry Workforce Development Survey, Construction Training Council. May 2010 20
Construction Training Council Survey – May 2010
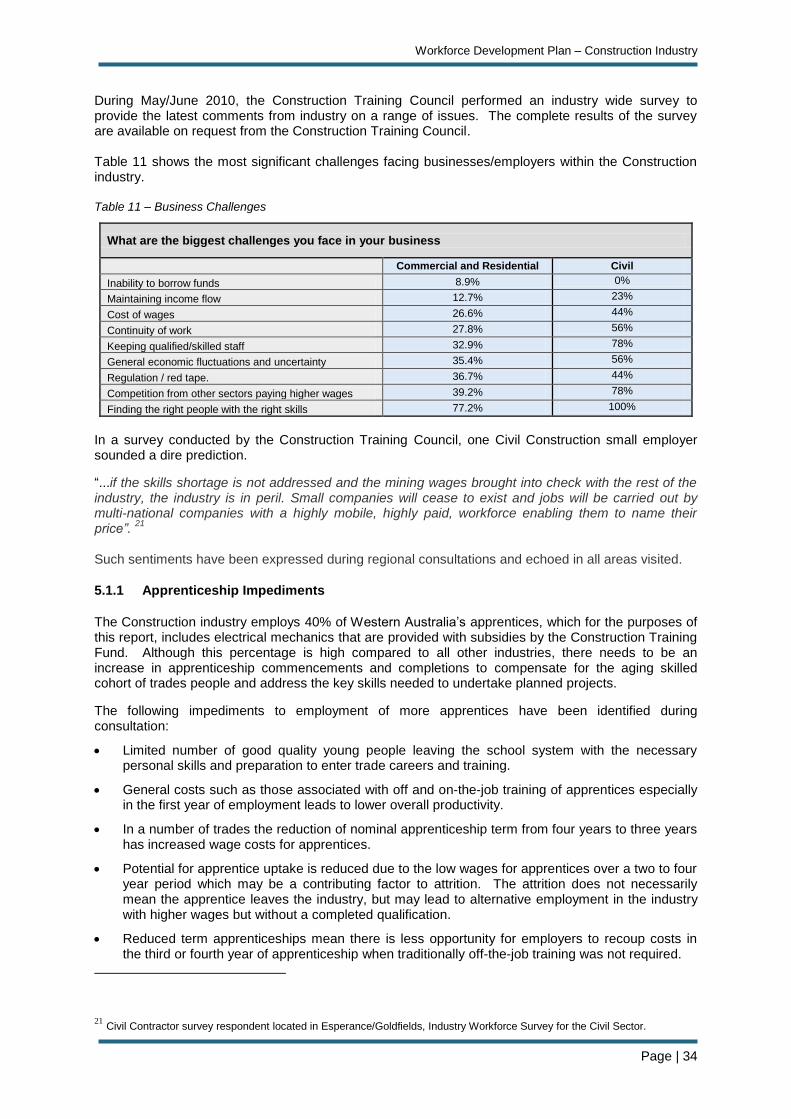
Workforce Development Plan – Construction Industry
Page | 34
During May/June 2010, the Construction Training Council performed an industry wide survey to provide the latest comments from industry on a range of issues. The complete results of the survey are available on request from the Construction Training Council. Table 11 shows the most significant challenges facing businesses/employers within the Construction industry.
Table 11 – Business Challenges
What are the biggest challenges you face in your business
Commercial and Residential Civil
Inability to borrow funds 8.9% 0%
Maintaining income flow 12.7% 23%
Cost of wages 26.6% 44%
Continuity of work 27.8% 56%
Keeping qualified/skilled staff 32.9% 78%
General economic fluctuations and uncertainty 35.4% 56%
Regulation / red tape. 36.7% 44%
Competition from other sectors paying higher wages 39.2% 78%
Finding the right people with the right skills 77.2% 100%
In a survey conducted by the Construction Training Council, one Civil Construction small employer sounded a dire prediction.
“...if the skills shortage is not addressed and the mining wages brought into check with the rest of the industry, the industry is in peril. Small companies will cease to exist and jobs will be carried out by multi-national companies with a highly mobile, highly paid, workforce enabling them to name their price”.
21
Such sentiments have been expressed during regional consultations and echoed in all areas visited.
5.1.1 Apprenticeship Impediments
The Construction industry employs 40% of Western Australia‟s apprentices, which for the purposes of this report, includes electrical mechanics that are provided with subsidies by the Construction Training Fund. Although this percentage is high compared to all other industries, there needs to be an increase in apprenticeship commencements and completions to compensate for the aging skilled cohort of trades people and address the key skills needed to undertake planned projects.
The following impediments to employment of more apprentices have been identified during consultation:
Limited number of good quality young people leaving the school system with the necessary personal skills and preparation to enter trade careers and training.
General costs such as those associated with off and on-the-job training of apprentices especially in the first year of employment leads to lower overall productivity.
In a number of trades the reduction of nominal apprenticeship term from four years to three years has increased wage costs for apprentices.
Potential for apprentice uptake is reduced due to the low wages for apprentices over a two to four year period which may be a contributing factor to attrition. The attrition does not necessarily mean the apprentice leaves the industry, but may lead to alternative employment in the industry with higher wages but without a completed qualification.
Reduced term apprenticeships mean there is less opportunity for employers to recoup costs in the third or fourth year of apprenticeship when traditionally off-the-job training was not required.
21
Civil Contractor survey respondent located in Esperance/Goldfields, Industry Workforce Survey for the Civil Sector.
Workforce Development Plan – Construction Industry
Page | 35
Lack of awareness of the value of a trade and the opportunities it gives to tradespeople.
Employers have stated that the process of employing apprentices is difficult due to the amount of paperwork involved, the number of agencies to deal with, lack of support and inability to „discipline‟, suspend or terminate poor quality apprentices.
There is clear evidence of medium to high levels of attrition amongst apprentices which show as „non-completion‟. One of the reasons for this attrition is wages in the apprenticeship compared to employment opportunities offered at higher wages elsewhere.
22
There is not a widespread uptake of traineeships as many employers view them as inferior to apprenticeships. This viewpoint strengthens the comment that the “original concept of traineeships was as a mechanism for getting disadvantaged young people into employment rather than as an investment in training”.
23
5.1.2 Tax Disincentives
The Construction industry is unique in that it has a Training Fund which is able to provide financial incentives to employers to support the employment and training of apprentices. The subsidy for a three year term apprenticeship is $9,000. In addition the Commonwealth Government provides $4,000 and at present is offering a further $3,000 as a Kick Start bonus. These subsidies have had a positive impact with apprentice commencements in 2010 increasing by 100% compared to 2009. Despite these results there is potential to increase the effectiveness of training subsidies by exempting them from the current requirement to be treated as taxable income. From the $9,000 Construction Training Fund subsidy and $7,000 Commonwealth incentive, the Commonwealth Government reaps 30% or $4,800 in income tax which is perceived by employers as a real disincentive. It is strongly recommended that the Department of Training and Workforce Development take up this issue with the Commonwealth Government as a critical workforce development issue. If necessary this issue should be raised at COAG level.
5.1.3 Funding of Training Delivered by RTPs
Industry has been highly critical of the lack of flexibility and responsiveness of RTPs particularly public RTPs in the delivery of off-the-job training for apprentices. Recently there have been changes attempted to enable RTPs to negotiate more flexible arrangements with more training delivered on the job and RTPs taking a coordination and assessment role rather than simply focused on delivery in the institution. Industry is yet to see a marked difference in approach at this point in time although it is still early in the process of reform. One area of concern raised by stakeholders is the fact that while RTPs continue to be funded on the basis of student curriculum hours (SCH) delivered, there is no incentive for RTPs to be more flexible and responsive. The SCH model is driven by quantity of outputs not the quality of results and rewards growth irrespective of value. Public providers and the system regularly report the delivery of SCH as a successful outcome when a significant proportion of students in VET training do not complete a full VET qualification. The need for a more flexible funding model based on outcomes is even more important when it comes to management of programs that for example require coordination of work experience rather than actual training delivery.
22 NCVER Apprenticeship and Traineeship Destination Survey (2008) 23 Group Training National Conference (2010) – Tom Karmel
Workforce Development Plan – Construction Industry
Page | 36
It is recommended that a review of the funding of training be undertaken to enable options that:
Improve flexibility and responsiveness;
Are based on outcomes achieved rather than outputs;
Lift completion rates. Specifically the Department of Training and Workforce Development should set targets and monitor performance of RTP‟s in delivering quality services. This should include requirements for all apprentices to commence their off-the-job training within a specified time i.e. 3 months from commencement and to complete off-the-job competencies within a specified time frame. These targets should form the basis of a written contract with employers and apprentices.
5.1.4 Civil Construction
During the recent industry survey of this sector, the problems relating to the civil construction sector and the employment of trainees highlighted a number of additional considerations.
The two most common barriers to employing an apprentice or trainee are the lack of suitable candidates and lack of supervisory capacity. Other factors include the high cost of training, lack of suitable work for training, access to training and the poor image of the industry and the fact that staff are poached after completion of training.
For those employers who had not previously employed an apprentice or trainee the key issues were a lack of familiarity with the Australian apprenticeship system and understanding of the process for hiring. Additionally, employers cited a lack of qualified staff for supervising, size of the business, and concern about the time required to undertake on and off-the-job training.
24 In the Training Council‟s
own survey, 70% of respondents in the civil sector thought that the processes to employ a trainee were too complex or confusing compared to 40% of respondents in the commercial and residential sectors (relating to apprentices).
25 & 26
5.1.5 Regional Training
Employing apprentices or trainees in regional areas is viewed as difficult for the same reasons cited in metropolitan areas. However, there are the additional problems of:
Higher cost of living and lack of affordable accommodation. There is very limited affordable accommodation for young single men when wanting to access training.
Regional fuel costs and the need for greater travel, further increasing costs.
Regional workforce can be transient, and the lack of skilled tradespeople to supervise means that they can demand a higher wage.
Difficulty obtaining access to local training for skills upgrade and apprenticeship off-the-job training.
The amount of time an apprentice spends away from the workplace is increased as apprentices have to travel greater distances for off-the-job training and in most cases remain away from home for their training. Therefore, the employer is subjected to an increased employment cost.
There is evidence of a decline in the support for apprenticeships due to the reduced term of apprenticeships. Regional employers have expressed concern that the reduced term does not allow for development of a broad range of skills that are required in regional employment.
Employers have stated that the reduced term of apprenticeship also impacts on higher rates of pay at commencement. Additionally there are instances of apprentices being required to attend off-the-job training in the final year of apprenticeship, a time that employers view as a „pay back‟ period for the cost of training.
Regional employers are particularly sensitive to and hard hit by the poaching of their skilled employees by the resource sector. Training as a means of addressing a labour shortage is no
24
Civil Construction Occupation Review Report , SkillsDMC March 2010. 25 Construction Industry Workforce Survey, Construction Training Council, May 2010 26
Industry Workforce Survey for the Civil Sector, Construction Training Council, May 2010
Workforce Development Plan – Construction Industry
Page | 37
longer a cost effective business decision, and the pool of new recruits is limited in smaller regional centres.
Consideration of safety factors and the employment of new employees is a big issue when recruiting inexperienced new staff.
5.2 Other Barriers to Training Identified by Stakeholders
Characteristics of Generation Y and their desire for instant recognition, willingness to change employers for a „better deal‟, resistance to rigidity of training, dislike for old or outdated technology or teaching methods.
27
Characteristics of some, but not all young people (attitudes, lack of hand skills and work ethic).
Lack of uptake of females in the workforce reduces the pool of potential recruits.
Employers believe that school teacher/advisors need to be trained to provide accurate career advice for non university pathways.
Competition and poaching from other sectors for skilled/trained tradespeople in particular dissuades employers investing in further training to enhance skills.
The numerous short term options for young people to earn money are greater than the drive and discipline needed to complete a qualification.
Lack of value placed on a qualification (industry values outcomes/skills).
Limited access to training in regional areas and requirement to travel long distances.
Enrolment/fee costs especially in areas such as pre-apprenticeships or full-time courses.
Full-time study restricts earning capacity.
No legislative or regulatory requirement to hold a qualification in most trade areas for employment as a tradesperson.
Employer concerns with continuity of work, as contract work can be intermittent.
Employers are still not satisfied with the responsiveness and flexibility of public registered training providers. The absence of apprentices for technical training at difficult times and for periods that is costly to employers is a constant frustration.
In times of high employment there is pressure on the capacity of training providers to provide increased apprenticeship training who cannot “ramp up” their training quickly.
In times of high demand employers are reluctant to release staff for training.
In times of recession training providers are under pressure to train in full-time, institutional pathways and therefore have capacity/funding problems as unemployed people seek or are directed to training.
There is evidence that there is a need to up skill the training provider workforce in the areas of technological change and the introduction of „Green Skills‟.
For the civil sector, contracts are awarded on price with no consideration of training and this should be addressed during contract preparation.
In Civil Construction, there is often a lack of skilled people willing to become supervisors of trainees. Additionally, the Certificate IV in Training and Assessment is not necessarily suitable for supervisors but is more suited to “public RTP lecturers”.
28
27
Generation Y and VET: The Implications for Business – A Strategic issues Paper (2008), National Industry Skills Council 28
Industry Workforce Survey for the Civil Industry, Construction Training Fund, May 2010
Workforce Development Plan – Construction Industry
Page | 38
Civil Construction requires access to plant and equipment that is not available through training providers.
The complexity of the skill level necessary to perform a range of occupations in the civil sector is not adequately described in job titles or reflected in ANZSCO descriptions. There are many occupations at Skill Level 4 which should be at Skill Level 3 which is equivalent to a traditional trade.
29 Additionally, skill levels within an occupation can vary considerably between low skilled to
highly skilled. For example, the skill level of a plant operator is not determined by the plant and equipment they operate, but by the complexity of the tasks they perform and the level of responsibility that is applicable to the work environment.
There are not enough students in Year 10, 11 and 12 undertaking a full vocational education program leading to trade entry to meet the industry‟s needs. The focus is on university entrance and students, teachers and parents do not see the opportunities at trade career level as attractive.
There is a need to encourage more female students in secondary education to consider careers in the Construction industry.
The specific promotion of career options for women in professions that successfully employ women, particularly in para-professional and administrative roles and promoting education pathways leading to those occupations. There is also a need to promote employment and training in trades, but this will always achieve only marginal results until there is a cultural change and a critical mass of women in the industry to bring about this change. In June 2009, there was only 1.4% of women in apprenticeships in the industry and 3.8% in traineeships. The 2006 census indicates that in the professions, the picture is still one of a predominantly male workforce; for example only 3% of women are building associates, 7% are construction estimators, and 6% are construction project managers.
Promotion of careers for women in these occupations should be undertaken using specific marketing strategies by the Department of Training and Workforce Development. The Construction Training Fund should also consider specific marketing of these occupations for women.
The Construction Training Council will conduct research identifying where women are currently employed particularly in para-professional and administrative roles and promoting education pathways leading to those occupations. There is also a need to promote employment and training in trades, but this will always achieve only marginal results.
There is a need to make use of alternative training models to support Indigenous people to obtain trade qualifications and careers. Such an example is the Certificate II in Construction pathway to Building Maintenance, which was developed in recognition of the low number of Indigenous people working in the trades in this industry.
The Department of Training and Workforce Development should promote the use of the Certificate II in Construction - Building Maintenance Pathway to industry and community organisations as a means of increasing Indigenous training. This should be undertaken in conjunction with the Construction Training Fund. This program should include specific promotion in regional WA.
29
Ibid p 57.
Workforce Development Plan – Construction Industry
Page | 39
6 Strategies to Overcome the Barriers
As previously stated, there have been a number of strategies used over the past 18 months to stimulate the economy. From an employment perspective, there has been less of a negative impact on the employment rate than predicted with a peak workforce of 126,500, which reduced to 122,000 during the GFC, and has now recovered to the same level.
From a training perspective there was a substantial drop in apprenticeship commencements during 2008/09 and this will have a follow-on effect in approximately two years time as the „missing cohort‟ of commencements does not exit into the skilled labour workforce. There has however, been a significant increase in intake during the first half of 2010.
Following widespread consultation with industry, the key objectives to support workforce development in the industry are identified below:
Increase the number of young people entering the industry by making apprenticeships more financially attractive.
Improve entry level training opportunities and career paths through transition from school to work.
Increase employer commitment to apprenticeships and traineeships by making apprenticeships less costly and more flexible.
Reduce attrition rates and increase retention of young people in the industry.
Change negative attitudes in the community and young people about the Building and Construction Industry as a career option.
Increase financial support for regional employers, apprentices and trainees.
Target the Civil Construction Industry for an increase in traineeships and upgrade the status of many of the associated traineeships to apprenticeships.
90% of employer respondents in the Construction Training Fund survey stated that employers need more support to ensure higher numbers of apprentices are employed for future trade demand.
30
Raise the quality of training and the value ascribed to a qualification so that newly qualified tradespeople value quality of workmanship, pride in work and derive higher levels of satisfaction from their work.
A longer period of indenture is also related to increasing the skill level and confidence in the “craft” of the trade.
30
At a policy and school level, change the curriculum, culture and process of secondary education to ensure a much larger proportion of students are given the opportunity to understand the difference between TEE and VET programs and undertake a comprehensive vocational education program instead of simply being directed to TEE.
Address the costly poaching of skilled labour from the industry to the Resources Sector.
Recognition of skills irrespective of whether they are developed in the workplace, a training institution or in a previous employment.
Encourage increased recognition of existing worker skills using skills assessment rather than simply assessing against a qualification. To encourage workers to participate there would need to be industry support for either registration or licensing as in other states.
To increase apprenticeship numbers, ensure that 10% of those employed on Government contracts are apprentices.
30
Construction Industry Workforce Survey, Construction Training Fund, May 2010
Workforce Development Plan – Construction Industry
Page | 40
With respect to apprenticeship training, avoid duplication of training effort within an institution for skills that naturally occur and have already been achieved in the workplace. Reduction of training costs to the employer will then occur.
Recognise that in most cases of apprenticeship training almost 90% of skills development occurs in the workplace.
Utilise more flexible funding models for training providers to allow more flexible delivery models to be utilised.
Up skill existing workers or career changers to encourage retention of staff.
Introduce „Apprenticeships for International Students‟ rather than institutional pathways to qualifications.
Provide on-the-job training and assessment to recognise the skills developed on site.
Provide regional training for all 1st year apprentices rather than having to travel to the metropolitan
area.
Refine and define specific VET in Schools pathways for students in Years 10, 11 and 12 to encourage entry into the Construction industry.
6.1 Attrition in the Apprenticeship System
Attrition in the system is high and remains a constant problem which is exacerbated when the economy grows and skills are in short supply. Partially skilled and unqualified tradespeople can get paid high wages without completing their apprenticeship.
The attrition rate, and as a result, the overall cost of training people in the licensed trades of Electrical Mechanics and Plumbing and Gasfitting is substantially lower than other trades. The reasons are:
Better quality selection and recruitment standards and processes;
Inability to gain employment without the trade qualification.
It is recommended that consideration be given to improvement of recruitment processes and secondly to the licensing of trades. In addition stronger efforts need to be made to retain apprentices by increasing apprentice/employer support or counselling services and making it more difficult for the parties to the apprenticeship to cancel the indenture prior to completion. The following strategies were raised by industry stakeholders during the past 18 months;
Consider adjusting employer incentives and strategies to encourage retention and uptake of apprenticeships during changing economic cycles.
Develop effective retention strategies rather than rely on sourcing new employees and build awareness of „good practice‟ models.
Encourage employers to be more pro-active in the training of apprentices and ensure that training providers meet the needs of a more flexible training regime.
Ensure that government projects have an apprentice training component and have a compliance checking process to ensure that contractors adhere to the contract requirements.
6.2 Retention of Workforce during Downturns in the Economy
A number of strategies that were utilised by the industry during the GFC and can be considered as employment, or rather retention strategies, included:
Reduced hours of work. In the residential construction sector, in particular, there is a high reliance on the use of sub-contractors and by reducing excess hours and working basic hours of work, the net workforce was maintained.
Provide part-time employment across sectors of the workforce.
Encourage employees and sub-contractors to take annual or long service leave.
It is recognised that the above strategies cannot be sustained indefinitely but they did provide a short term solution while maintaining the workforce in readiness for an improvement in the economy.
Workforce Development Plan – Construction Industry
Page | 41
In comparison, the mining industry went into a deep recession and shed 15% to 19% of its staff in six months
31 and as many as 30% of its professional workforce.
32
The civil sector recognises that it is competing with the mining sector as its workers are attracted by the higher wages in times of economic growth. Therefore, in times of recession, when the mining sector sheds workers, or when the lifestyle associated with mining is no longer suitable, the civil sector needs assistance in attracting such workers back to the sector, through retraining or short courses.
Access to training for the civil sector is restricted. Individual businesses can be assisted through initiatives such as SkillsDMC Systems Approach methodology whereby businesses undertake a workforce planning analysis which incorporates the following principles:
A workforce competency profile.
Enterprise customisation.
A training needs analysis.
A training plan.
Learning/training methodology.
Implement off and on-the-job training (including assessment and evidence gathering).
Issuing qualifications.
On-going monitoring and evaluation.
Such an exercise serves to raise the qualification profile of the business, and leads to an increase in the “value” experienced by employers, and as such is a valuable retention strategy
33. However, the
age profile of the industry suggests that employees come to the sector at a later age. The sector is not a first choice destination after school and the operational requirements of holding a driving licence, and industry perceptions about maturity are key reasons.
34
6.2.1 Construction Training Fund – Recent Initiatives
The Construction Training Fund is progressively implementing strategies to support employers of apprentices and trainees and encourage the up skilling of existing workers. These include:
Increased apprentice subsidies by 29% for 3 and 3.5 year indentures rising from $7,000 to $9,000;
Implemented a weighting for regional apprentice subsidies with an extra 10% for South West and 20% for North West apprentices;
Changed eligibility for the $3,000 mature age apprentice bonus from 30 years of age to 21 years;
Paying direct indenture employers in three instalments instead of two with 25% paid on commencement, 25% at halfway mark and 50% on successful completion of indenture;
Provided additional support in regions with a second Training Support Officer and travel allowance for regional apprentices;
Developed a new work experience support initiative as part of an expanded School to Work Transition support program.
Industry promotion to attract career changers, females, disadvantaged and disengaged persons.
Promotion of the benefits of apprenticeships and traineeships as leading to a career of choice to employers, schools and parents as well as the students.
Promotion of the earning capacity (wage premium) of qualified tradespeople when compared to other industries and occupations through media advertising and website information.
31
The Financial Review, Ken Henry –28 May 2008 32
ABS Labour Force Australia, detailed. March 2010 33
Civil Construction Occupation Review Report, SkillsDMC, March 2010 p 57 34
Ibid p 5&7
Workforce Development Plan – Construction Industry
Page | 42
6.2.2 Construction Training Fund New Strategies in 2010/11
The following training initiatives are new initiatives forming part of operations in 2010/11;
100% subsidy for unemployed, school students, pre-apprentices and apprentices to cover the cost of supplementary skills and Occupational Safety and Health (OSH) training. This subsidy applies to unemployed people genuinely seeking employment in the Construction industry.
Funding of school to work transition programs such as „try-a-trade‟ courses.
Increased funding for pre-apprenticeship scholarship (up to $500).
Funding for work experience programs.
Providing financial support to employers to release workers for short training courses during working hours.
6.2.3 Migration Issues
The following issues have been raised by industry stakeholders at forums held during 2010.
Utilisation of skilled migrant workers either via permanent migration or a „guest worker‟ program similar to those used in Singapore and Canada (2 year temporary residence then return to home country). It is proposed that such a program also include the following requirements and changes in approval to make it more effective than the current 457 visa arrangements.
Require employers to employ a certain number of apprentices as a percentage of the number of guest workers employed. One option is for the sponsoring employer to be required to employ at least one apprentice prior to application for a guest worker and then one apprentice to every two guest workers employed.
At present the 457 visa arrangements do not take account of the sub-contract nature of the construction industry. Building companies therefore cannot sponsor workers but should be able to take responsibility for the sponsorship by acting as an agent for their sub-contractors. The building company could guarantee continuity of employment for the contract period and ensure placement with sub-contractors. This approach would create many more opportunities which do not currently exist under the existing system.
Improve and reduce the timeframe for the migration application process for applicants on the WA Skilled Migration Occupation List and Skilled Priority Occupation List (SPOL).
Develop effective retention strategies rather than rely on sourcing new employees and build awareness of „good practice‟ models. Specifically the Department of Training and Workforce Development should closely monitor apprentice progress, encourage individuals to complete their training and support the parties to complete their responsibilities in the indenture.
Guest Workers
The concept of employing guest workers for fixed contracts after which they return to their homeland has not been pursued in Australia. There are a range of social, industrial relations, employment and training issues that would need to be resolved to enable such a program to work, however it is clear that what is needed at the very least is a debate to determine whether the idea should be pursued.
The Department of Training and Workforce Development should investigate the concept of guest workers to address an identified and quantified shortfall in labour resulting from construction projects that cannot be serviced by local labour. The review needs to also include the issue of Governments and industry establishing agreed local content targets and compliance measures for future projects that ensures work which is capable of being undertaken by local labour in Western Australia is actually carried out.
6.3 Institutional Training
There has been an interest expressed by some sectors of industry in providing full institutional training pathways to allow students to complete a Certificate III without an employment component. This model has been widely opposed by employers, group training organisations (GTO‟s), unions and all national Industry Training Advisory Boards (ITAB‟s). However, there has been widespread debate within industry strategic and working groups to develop an alternative model for use in times of reduced economic activity.

Workforce Development Plan – Construction Industry
Page | 43
The outcome has been the development of an Advanced Pre-Apprenticeship Model that allows students to complete 70% of a trade qualification in conjunction with 450 hours of work experience and simulated skills practice. The model can be completed in a 6 to 12 month period and provide graduates with extended credit towards an apprenticeship and has been submitted to the State Training Board for consideration and possible implementation. The model will be most useful during periods of economic downturn when apprentice commencement positions decrease.
6.4 Terms of Indenture
Industry stakeholders are expressing concern about the changes to terms of indenture implemented several years ago. Employers are finding the model more expensive and are questioning the competence of apprentices who, in their opinion, in many cases do not have the necessary skill levels developed through application over time to meet the industry‟s standards. More recently, changes to the VET Act and to pre-apprenticeship training have exacerbated employers concerns. Mandatory reductions in term at the front end of the indenture lock all the parties in and reduce the flexibility required for a system based on competency. A recent recommendation to address this issue for the Painting and Decorating trade which involves a flexible term of indenture between three and four years, should be considered for other trades after consultation with stakeholders.
Workforce Development Plan – Construction Industry
Page | 44
7 Summary of Key Issues
The Workforce Development Plan for the Construction industry in Western Australia is based on extensive research that has been carried out over the past three years by the Construction Training Fund and also through its role as the Construction Training Council over the past eighteen months. This summary identifies a number of the key industry environment, skilled workforce development issues and strategies to support the Construction industry‟s future workforce needs. Key Factors Impacting on Workforce Development in the Construction Industry
An education system still focussed on tertiary education and failing to give equal importance to vocational education programs and to deliver programs which properly prepare students for future vocational careers.
Cost to employers of training apprentices including lack of productivity in the early part of the apprenticeship, the higher wage costs due to shorter terms of indenture and completion of off-the-job training in a compressed timeframe.
Employer dissatisfaction with flexibility and responsiveness of RTPs delivering off-the-job training.
Capacity of small businesses (contractors) to commit to training.
Larger construction companies who do not train because of the sub-contract structure of the industry.
Marked fluctuations in industry activity as a result of changes in the economic environment which affect investment in training.
Limitations in availability of technical training for regional apprentices within their place of residence.
Impact of the Resources industry poaching skilled labour from the Construction industry and other industries. This problem is exacerbated by high wages paid by the Resources industry which artificially inflates wages paid by other industries in order to retain their workforce.
Limited availability and high cost of housing stock in Western Australia which inhibit interstate migration.
Need for regional tradespeople to be broadly skilled in trade skills which are being adversely affected by the reduction in terms of indentures.
Poor status of trade qualifications in the Construction industry with approximately 40% of employees in trade occupations possessing a trade qualification.
Aging of the workforce with 34% of workers over the age of 45.
Limited working life of tradespeople due to heavy physical effort required and resultant injury and health impact.
Workforce Development Plan – Construction Industry
Page | 45
8 Specific Recommendations
8.1 Apprenticeships
Recommendation 1: Address the attrition rate of apprenticeships by developing and implementing strategies to reduce apprenticeship attrition and retain workers in the industry that they are qualified to work in, including financial support and mentoring for apprentices. (DTWD)
Recommendation 2: Modify the mandatory reduction in term of indenture for pre-apprentices and Certificate II holders entering apprenticeships. The mandatory reduction should be at the end of an apprenticeship, be no greater than the term of the training completed as a pre-apprentice and be subject to validated workplace competence. (DTWD & STB)
Recommendation 3: Review the terms of indenture and consider flexible terms of apprenticeship ranging from 3 to 4 years to limit the bureaucratic process of extension/reduction of term. This recommendation would also allay the concerns of employers who believe competence has not been fully achieved and regional employers who require apprentices to be engaged in a broad range of skills. (STB)
Recommendation 4: Implement and monitor the mandatory employment of apprentices as 10% of the workforce on all Government contracts and on Resource Sector Construction and operations projects. (Government)
Recommendation 5: Investigate strategies to raise the status and value of trade qualifications including the feasibility of licensing all trades occupations. (STB)
8.2 Schools
Recommendation 6: Reform Vocational Education programs, particularly the VET in Schools program, to achieve a much larger cohort of properly prepared school students completing full courses of vocational education. This needs to involve changes in the culture of the system and its educators, changes in curriculum and changes in process. Schools should use a model such as pre-apprenticeships to form the basis of the vocational education program. (DTWD, STB, CC)
Recommendation 7: Expand the School Based Apprenticeship model to ensure trade competencies are achieved at the earliest possible time to make apprenticeship training more attractive and less expensive to employers. (DTWD, STB, CC)
Recommendation 8: Introduce School Based Pre-Apprenticeships as the trade pathway in schools rather than a multitude of courses with limited articulation to trade competencies. (CC, STB)
Recommendation 9: Provide training and support to school career guidance officers to ensure they have the skills and knowledge to provide current advice to students and parents on the local labour market and help raise the awareness of the value of a trade qualification. (CC, DTWD, STB)
8.3 Registered Training Providers
Recommendation 10: Change the funding model for Registered Training Providers (RTP) to an outcomes performance based model rather than student curriculum hours (SCH) that will encourage more flexible and responsive delivery programs. Strict guidelines will be needed to ensure the requirements of the Australian Quality Training Framework are met. (DTWD)
Recommendation 11: Increase support to regional training providers to allow all apprentices to complete a minimum of their first year‟s off the job training within the region they reside. (DTWD)
Recommendation 12: Improve the response time of RTP‟s to deliver training that meets employer needs and not RTP schedules. Commencement of off-the-job training for apprentices should be within a maximum of three months of employment by investigating the feasibility of calling the apprentices in for training during the probationary period. This recommendation would allow apprentices to complete off the job training while their pay rates are at the lowest. (DTWD)
Workforce Development Plan – Construction Industry
Page | 46
8.4 Pre-Apprenticeships
Recommendation 13: Introduce a pre-apprenticeship that can be varied in duration to allow training to be modified based on the employment situation that prevails at the time. There should be a maximum of 70% of the off-the-job competencies achieved and a minimum of 450 hours of work experience/skills practice completed during the pre-apprenticeship. This model will make apprenticeship training more attractive and less expensive for employers. (DTWD, STB)
Recommendation 14: As in recommendation 2, any mandated reduction of apprenticeship term for pre-apprentices should be applied at the end of the apprenticeship and based on achievement of workplace competence. (DTWD, STB)
8.5 Employers
Recommendation 15: Simplify the process for engaging and employing apprentices and eliminate the need for consultation with multiple agencies by implementing a „one-stop shop‟ approach. (Government, DTWD, STB)
Recommendation 16: Provide incentives for the employment of apprentices to off-set the initial low return period of an apprenticeship. (Government, DTWD)
Recommendation 17: Review the tax imposition on subsidies paid to employers as payment of tax on subsidy payments detracts from the purpose of any subsidies. This will require a formal submission to the Commonwealth Government and is an issue that could be raised at COAG. (Government, DTWD)
Recommendation 18: Require the Resources industry to contribute to the cost of workers recruited from other industries in times of economic growth and skills shortages. Alternatively require the Resources industry to train apprentices at the same rate as the Construction Industry. (Government)
8.6 Indigenous, Disadvantaged and Marginalised Groups
Recommendation 19: Promote the use of Certificate II in Construction, Building Maintenance pathway to industry, RTP‟s community organisations and Indigenous Communities with specific promotion in regional WA in conjunction with the Construction Training Fund. (DTWD)
Recommendation 20: Provide increased incentives for employers to encourage the employment of Indigenous, disadvantaged and marginalised members of the community. (Government)
Recommendation 21: Promote career options for women in para-professional and administrative roles using specific marketing strategies where there is a greater chance of placing young women. This recommendation would require support from the Department of Training and Workforce Development. (DTWD)
8.7 Migration
Recommendation 22: Reform, simplify and expedite the overseas application process for skilled migrants. The delay in time from application to acceptance means applicants arrive after the demand for their skilled occupation occurs. The timeframe from overseas application to approval should be reduced to six months to enable the skilled labour to meet the shortage as it occurs. (Commonwealth and State Governments)
Recommendation 23: Investigate the feasibility of a guest worker program under which workers come to Western Australia for a set contract of employment then return to their own country. Skilled, overseas guest workers could be sponsored by employers on two year visas. This model is utilised in other developed countries. To encourage people to participate it is further recommended that guest workers be provided with the same health and social benefits as the general population. This recommendation would require a review by the Department of Training and Workforce Development. (Commonwealth and State Governments)
Recommendation 24: Provide the opportunity for the use of Apprenticeships for Overseas Students rather than institutional only models. This recommendation would provide employment and relevant experience within the trade area of study, ensure work experience is relevant to the field of study and ease the financial burden on the student.(DTWD, STB)

!Workforce Planning v20101020.docx Monday, 1 November 2010


![“Workforce Development In Coordinated Specialty Care ...€¦ · Workforce Development in Coordinated Specialty Care Programs 2 . ... [FEPS-FS 1.0], ... Workforce Development in](https://img.pdfslide.us/doc/110x75/5af2934f7f8b9a95468b621d/workforce-development-in-coordinated-specialty-care-workforce-development.jpg)