Embed Size (px)
Citation preview

Workforce A
nalysisEconom
ic Developm
ent Region 1
October 2007
Workforce AnalysisCentral OhioEconomic Development Region 1
Delaware, Fairfield, Fayette, Franklin, Licking, Logan, Madison, Pickaway and Union Counties
Lawrence
SciotoGallia
Adams
PikeMeigs
JacksonBrown
Clermont
Hamilton HighlandVinton
Ross AthensClintonWarrenButler WashingtonHocking
Fayette MorganPickawayGreene MonroePreble Montgomery PerryFairfield Noble
Clark MadisonFranklin Muskingum
BelmontMiami GuernseyChampaign
LickingDarke
HarrisonDelaware CoshoctonShelby UnionLogan
Knox JeffersonTuscarawas
HolmesAuglaize Marion MorrowMercer CarrollHardin
Allen ColumbianaStarkVan Wert WayneWyandotRichland
Crawford Ashland
MahoningPutnam Hancock
Paulding Seneca MedinaHuron PortageSummit
Defiance Henry ErieSanduskyTrumbullLorain
Wood
Ottawa
Cuyahoga
Williams GeaugaFulton Lucas
LakeAshtabula

Workforce Analysis Economic Development Region 1
Central Ohio Table of Contents
Preface......................................................................................................................................................... iii Executive Summary................................................................................................................................ v
I. Understanding the Local Labor Market.................................................................................... 1
II. Economic Indicators ......................................................................................................................... 3 Population Trends............................................................................................................................. 3 Demographic Traits.......................................................................................................................... 3 Employment Trends.......................................................................................................................... 4 Unemployment Rate Trends ........................................................................................................... 5 Per Capita Income Trends .............................................................................................................. 6 Residential Construction Permit Trends......................................................................................... 7
III. Employment Projections to 2014 ................................................................................................ 9 Projections by Industry Sector ........................................................................................................ 9 Projections by Occupational Group........................................................................................... 10 High Prospect Occupations ......................................................................................................... 11
IV. Education & Training..................................................................................................................... 15 Educational Attainment................................................................................................................ 15 Institutions and Degree Completions.......................................................................................... 15 Skills-Based Projections .................................................................................................................. 16
Technical Notes...................................................................................................................................... 19 References................................................................................................................................................ 20
Appendix A: Ohio’s Economic Development Regions ...................................................... 21 Appendix B: Ohio’s Metropolitan Statistical Areas ............................................................... 22 Appendix C: Detailed County-to-County Commuting Patterns ................................... 23 Appendix D: Major Employers by County................................................................................. 26 Appendix E: Postsecondary Institutions ...................................................................................... 28 Appendix F: Degree Completions by Program Class.......................................................... 30

Preface
The Ohio Bureau of Labor Market Information (BLMI) recently published a series of Workforce Analysis reports for each of Ohio’s Workforce Investment Areas (WIAs), along with all twelve One-Stop Systems in WIA 7. These customized regional publications have been designed to help local workforce professionals and others gain a better understanding of the local economy and how it has fared compared to other areas. Now we have expanded the coverage to Economic Development Regions (EDRs). Related publications include the Ohio Job Outlook to 2014 for Ohio, eight of the state’s Metropolitan Statistical Areas (MSAs) and the twelve EDRs. A complementary report, released in June 2007, is Ohio Economic Analysis, 2007: Understanding the Environment and Charting a Course for the Future.
This Workforce Analysis report provides a summary snapshot of EDR 1: Central Ohio, which includes Delaware, Fairfield, Fayette, Franklin, Licking, Logan, Madison, Pickaway and Union Counties. The first section begins with a brief review of the region’s basic demographic and economic characteristics. The second section shows trends in several important local economic indicators, including population, nonfarm employment, unemployment rates, per capita income, and residential construction. The next section contains regional employment projections and a list of occupations with high prospects through 2014. The final section presents overall educational attainment in this region and looks ahead to which skills will be in demand in the future.
A careful review of this information can yield important insights about the regional economy. One may assess the health of the local economy by examining key economic trends and comparing them to the state or the nation. Or an examination of occupational composition will yield insights into the strengths and weaknesses that regional policy might address. A regional analysis is at a level or scope that allows for greater opportunities of alignment and synergy across service providers. Hopefully the economic insights provided here will encourage asset mapping of resources and partnerships that span workforce development, education and economic development. The objective of this analysis is to give impetus to and inform such work.
Please refer to the Technical Notes and References sections at the end of this publication for reference and documentation of the wide variety of statistical data presented.
Keith Ewald, Ph.D., Chief Bureau of Labor Market Information Office of Workforce Development Ohio Department of Job and Family Services
iii
v
Executive Summary
The Central Ohio EDR draws about 51,000 commuting workers in net from outside the nine-county region. This region bears a close resemblance to the Columbus MSA.
The region’s population was about 1.77 million in 2006, a 13.0 percent increase from 1995. Growth has been driven by largely Delaware County. Demographically, this region is younger than the rest of the state.
Total payroll employment in 2006 was 927,925 workers, an increase of 15.4 percent from 1995. The economic downturn appears to have hit this region later than it did the rest of the country.
Unemployment in 2006 was 4.7 percent, well below the state rate. The local unemployment rate has fallen 0.7 percentage points since the peak in 2004.
Nominal per capita income in 2005 was $34,876 in Central Ohio. From 1995 to 2005, per capita income rose at a 4.0 percent annual compound rate of growth.
The degree of residential construction in this region has fallen significantly since the peak in 2002. Average valuation was generally higher than the state and national averages.
Central Ohio has a greater concentration of employment in service-providing industries than the rest of the state. Professional and business services; education and health services; and leisure and hospitality are projected to have the most employment growth through 2014.
The fastest growing occupations are projected to be those in healthcare; food preparation and serving; and transportation and material moving occupations.
This EDR has a higher overall level of educational attainment than the rest of Ohio, notably a greater proportion of adults with postsecondary degrees.
There are 38 postsecondary institutions in this region. A combined 27,700 degrees and certificates were awarded in 2006, an 8.9 percent increase from 2005.
Reading comprehension, active listening and critical thinking are projected to be the most in-demand workplace skills in the next ten years.

I. Understanding the Local Labor Market
Labor economists define a labor market as a geographic area in which both the demand and supply for labor are met primarily within that region.1 In other words, it is an area where there are jobs and the majority of workers needed for those jobs. An important first step in identifying local labor markets is to examine the commuting patterns of individuals who live or work in the area. These patterns are one of the primary inputs used to define metropolitan areas, and this region in particular bears a close resemblance to the Columbus Metropolitan Statistical Area (MSA).
In general, local commuting patterns, shown here in Figure 1, show that Central Ohio draws about 51,000 workers in net from outside the region. This total excludes commuting between counties within the region. Franklin County is the strongest employment draw in this region with nearly 144,000 in-commuters, not surprising since it contains the central city of Columbus. Union County also has a positive net flow of commuters (about 6,000), likely from several large manufacturing firms in the area. All the other counties in this EDR have net out-commuting.
Figure 1: Regional Commuting Patterns
Working in the County
In-Commuters
Percent of In-Commuters
Employed Living in the
County
Out-Commuters
Percent of Out-
Commuters
Net Flow of Commuters
Percent of Total
CommutersDelaware 43,463 22,325 51.4% 57,840 36,702 63.5% -14,377 -24.4%Fairfield 36,497 9,847 27.0% 60,465 33,722 55.8% -23,875 -54.8%Fayette 11,415 2,697 23.6% 13,433 4,715 35.1% -2,018 -27.2%Franklin 652,261 143,868 22.1% 548,655 40,262 7.3% 103,606 56.3%Licking 56,215 13,805 24.6% 71,213 28,803 40.4% -14,998 -35.2%Logan 20,355 5,240 25.7% 21,962 6,847 31.2% -1,607 -13.3%Madison 13,180 5,605 42.5% 17,828 10,253 57.5% -4,648 -29.3%Pickaway 17,332 7,557 43.6% 21,921 12,146 55.4% -4,589 -23.3%Union 26,376 14,678 55.6% 20,416 8,718 42.7% 5,960 25.5%Central Ohio 877,094 78,845 9.0% 833,733 27,818 3.3% 51,027 47.8%
In-Commuters Out-Commuters Net Comparisons
County
Figure 2 on the next page shows a visual summary of the net flow of commuters from the 2000 decennial census. Most workers commuting into a county to work usually do so from adjacent counties. Detailed county-to-county commuting is shown in Appendix C.
1 Goldstein, 2005 (p. 1).
1

Figure 2: Net Flow of Ohio Commuters
*Net flow equals in commuters minus out commuters. A negative number means more people are commuting to work outside the county than are in commuting. For more detailed information, please visit http://lmi.state.oh.us/Census/CommutingPatterns2000.pdf on the web.
Source: LMI, 2003.
2

II. Economic Indicators
Population Trends. Population in the Central Ohio EDR was approximately 1.77 million in 2006, about 15.4 percent of the state total. Figure 3 below shows the region’s population from 1995 to 2006, indexed to the 2000 population and compared with the indexes for Ohio and the United States. The chart clearly shows that population growth during this period has been more comparable with nationwide growth than that for the state. Central Ohio’s population grew about 13.0 percent from 1995 to 2006, compared with 12.4 percent nationwide and only 2.5 percent in Ohio. Much of this growth has been driven by Delaware County, the 13th fastest growing county in America.2
Figure 3: Population Trends, 1995-2006
86
88
90
92
94
96
98
100
102
104
106
108
Popu
latio
n In
dex
(100
= 2
000)
Central Ohio Ohio United States
Central Ohio 94.0 94.8 96.0 97.4 98.7 100.0 101.2 102.1 103.2 104.1 105.1 106.2Ohio 98.6 98.9 99.2 99.5 99.7 100.0 100.2 100.4 100.6 100.9 100.9 101.0United States 94.4 95.5 96.6 97.7 98.9 100.0 101.1 102.1 103.0 104.0 105.1 106.1EDR 1 Population 1,562,041 1,575,173 1,594,772 1,618,279 1,639,297 1,661,694 1,681,108 1,696,742 1,714,542 1,729,732 1,747,189 1,765,535
1995 1996 1997 1998 1999 2000 2001 2002 2003 2004 2005 2006
Demographic Traits. Population estimates from 2006, shown in Figure 4, reveal slight differences between this EDR and the rest of the state and nation. Central Ohio has a younger demographic profile than the rest of the state: 35.1 percent of the population is 24 or younger, compared with 33.7 percent statewide and 34.5 percent nationally. Central Ohio also has a larger prime working-age population (44.9% aged 25 to 54).
Figure 4: Demographic Characteristics, 2006
Total 299,238,484 100.0% 11,478,006 100.0% 1,765,535 100.0%Under 5 20,417,636 6.8% 734,735 6.4% 128,375 7.3%5 to 14 40,337,284 13.5% 1,534,571 13.4% 242,781 13.8%15 to 24 42,435,426 14.2% 1,597,458 13.9% 248,528 14.1%25 to 34 40,415,979 13.5% 1,459,394 12.7% 265,155 15.0%35 to 44 43,666,950 14.6% 1,621,662 14.1% 272,306 15.4%45 to 54 43,278,174 14.5% 1,738,480 15.1% 254,791 14.4%55 to 64 31,586,683 10.6% 1,259,712 11.0% 172,764 9.8%65 and older 37,260,352 12.5% 1,531,994 13.3% 180,835 10.2%
United States Ohio Central Ohio
2 U.S. Census Bureau, 2007a.
3

4
Employment Trends. Like population, total employment has grown significantly in the last ten years. Figure 5 below compares employment levels in Central Ohio, Ohio and the United States. Central Ohio’s nonfarm payroll employment was 927,925 in 2006, an increase of 15.4 percent from 1995. For comparison, Ohio employment grew 3.9 percent during this period while nationwide employment grew 16.0 percent. Regional employment grew rapidly through 2001 before declining slightly, indicating that the economic downturn of 2000 affected this EDR a year later than it did the rest of the country.
Figure 5: Nonfarm Employment Trends, 1995-2006
80
85
90
95
100
105
Empl
oym
ent I
ndex
(100
= 2
000)
Central Ohio Ohio United States
Central Ohio 88.2 90.0 92.2 94.6 97.3 100.0 100.3 99.9 99.5 100.2 100.9 101.8
Ohio 92.7 94.1 95.8 97.5 98.8 100.0 98.5 96.7 95.7 95.9 96.2 96.3
United States 88.9 90.7 93.2 95.6 97.8 100.0 99.8 98.7 98.4 99.5 101.3 103.0
EDR 1 Employment 804,163 820,194 840,379 861,934 886,989 911,404 914,303 910,443 906,763 913,098 919,697 927,925
1995 1996 1997 1998 1999 2000 2001 2002 2003 2004 2005 2006

Unemployment Rate Trends. The unemployed are those in the noninstitutional population 16 years or older who were not employed during the reference week but were actively seeking work, waiting to be called back to a job after a layoff, or waiting to report within 30 days to a new job. The unemployment rate for the Central Ohio EDR was 4.7 percent in 2006. Figure 6 below shows how the unemployment rate has changed since 1995 in the region, state and country. Central Ohio has generally had a much lower unemployment rate than the rest of Ohio and the U.S. during this period, with a low point of only 2.7 percent in 1999. The last recession hit this region harder than the U.S. as the unemployment rate climbed for five consecutive years, peaking at 5.4 percent in 2004, a year later than the U.S.
Figure 6: Unemployment Trends, 1995-2006
0.0%
1.0%
2.0%
3.0%
4.0%
5.0%
6.0%
7.0%Central Ohio Ohio United States
Central Ohio 3.2% 3.3% 3.0% 2.8% 2.7% 3.2% 3.5% 5.0% 5.3% 5.4% 5.2% 4.7%
Ohio 4.9% 5.0% 4.6% 4.3% 4.3% 4.0% 4.4% 5.7% 6.2% 6.2% 5.9% 5.5%
United States 5.6% 5.4% 4.9% 4.5% 4.2% 4.0% 4.7% 5.8% 6.0% 5.5% 5.1% 4.6%
1995 1996 1997 1998 1999 2000 2001 2002 2003 2004 2005 2006
5

Per Capita Income Trends. Nominal per capita income in Central Ohio in 2005 was $34,876, slightly higher than the national average $34,471 and much higher the state’s $31,860. Figure 7 shows per capita income between 1995 and 2005. During this period, per capita income in EDR 1 rose at a 4.0 percent annual compound rate of growth. This was faster growth than for Ohio (3.5%) in the last decade.
Figure 7: Per Capita Income, 1995-2005
$0
$5,000
$10,000
$15,000
$20,000
$25,000
$30,000
$35,000
$40,000Central Ohio Ohio United States
Central Ohio $23,656 $24,487 $26,061 $27,538 $28,763 $30,633 $31,326 $32,171 $32,632 $33,641 $34,876
Ohio $22,495 $23,322 $24,656 $26,017 $26,859 $28,205 $28,583 $29,187 $29,826 $30,763 $31,860
United States $23,076 $24,175 $25,334 $26,883 $27,939 $29,843 $30,562 $30,795 $31,466 $33,090 $34,471
1995 1996 1997 1998 1999 2000 2001 2002 2003 2004 2005
6

Residential Construction Permit Trends. Approximately 8,000 residential building permits were issued in Central Ohio in 2006, a significant decline from the prior year and well below the 2002 peak of 17,400 units. Average valuation in 2006 was $177,853, higher than the state and national averages. The number of units built and average valuation are shown in Figures 8 and 9 below.
Figure 8: Number of New Residential Building Permits, 1995-2006
0
20
40
60
80
100
120
140
160
Uni
ts In
dex
(100
= 2
000)
Central Ohio Ohio United States
Central Ohio 73.9 83.4 71.3 74.3 106.8 100.0 102.1 111.1 106.3 84.9 79.6 51.5
Ohio 90.1 99.1 93.5 96.6 112.3 100.0 100.4 103.0 106.6 103.9 95.9 69.2
United States 83.7 89.5 90.5 101.3 104.5 100.0 102.8 109.8 118.6 130.0 135.4 115.5
EDR 1 Units 11,574 13,073 11,177 11,647 16,739 15,668 16,001 17,411 16,660 13,305 12,464 8,073
1995 1996 1997 1998 1999 2000 2001 2002 2003 2004 2005 2006
Figure 9: Valuation of New Residential Building Permits, 1995-2006
$0
$20,000
$40,000
$60,000
$80,000
$100,000
$120,000
$140,000
$160,000
$180,000
$200,000
Ave
rage
Val
uatio
n
Central Ohio Ohio United States
Central Ohio $89,460 $91,000 $94,473 $103,504 $98,102 $117,220 $125,697 $124,901 $140,431 $164,008 $169,261 $177,853
Ohio $97,631 $101,477 $103,158 $112,629 $114,542 $123,703 $129,223 $133,435 $141,455 $154,250 $164,891 $171,982
United States $90,661 $94,118 $97,843 $102,506 $108,952 $116,654 $119,903 $125,417 $132,168 $141,261 $152,764 $158,418
1995 1996 1997 1998 1999 2000 2001 2002 2003 2004 2005 2006
7

9
III. Employment Projections to 2014
Projections by Industry Sector. Figure 10 below gives projections from the Job Outlook to 2014 for Central Ohio. As of 2004, about 13.9 of all employment was in goods-producing industries and 86.1 percent was in service-providing industries. This is a lower proportion of goods-production employment than statewide (19.9%).
Between 2004 and 2014, total employment is expected to grow 9.5 percent to about 1.09 million jobs. The fastest employment growth during this period is projected for professional and business services (22.7%); education and health services (20.6%); and leisure and hospitality (17.3%). Almost all the projected growth for this period is expected in service-providing industries. Among goods-producing industries only construction is expected to add any jobs: about 4,200. Manufacturing is expected to lose the greatest number of jobs from 2004 to 2014: about 7,400 positions (-8.4%).
Figure 10: Central Ohio Projections to 2014 by Industry Sector
Industry 2004 Annual Employment
2014 Projected
Employment
Change in Employment
2004-2014
Percent Change
2004-2014Total Employment 998,300 1,092,900 94,600 9.5%Goods-Producing 138,800 134,500 -4,300 -3.1%
Natural Resources and Mining 10,400 9,400 -1,000 -9.6%Construction 40,200 44,400 4,200 10.4%Manufacturing 88,200 80,800 -7,400 -8.4%
Service-Providing 794,400 892,400 98,000 12.3%Trade, Transportation and Utilities 188,200 206,900 18,700 9.9%
Retail Trade 111,900 119,300 7,400 6.6%Information 19,500 20,400 900 4.6%Financial Activities 75,000 76,500 1,500 2.0%
Finance and Insurance 59,800 59,700 -100 -0.2%Real Estate and Rental and Leasing 15,200 16,800 1,600 10.5%
Professional and Business Services 133,600 163,900 30,300 22.7%Administrative and Waste Services 63,700 80,200 16,500 25.9%
Education and Health Services 102,000 123,000 21,000 20.6%Leisure and Hospitality 89,100 104,500 15,400 17.3%
Arts, Entertainment & Recreation 11,400 13,400 2,000 17.5%Accommodation and Food Services 77,700 91,100 13,400 17.2%
Other Services 39,300 43,000 3,700 9.4%Government 147,700 154,200 6,500 4.4%
Federal Government 13,300 12,800 -500 -3.8%State Government 53,300 55,700 2,400 4.5%Local Government 81,100 85,800 4,700 5.8%
Self-Employed, Private Household and Unpaid Family Workers 65,100 65,900 800 1.2%
Some sectors were excluded from this table due to confidentiality restrictions. Columns may not total due to rounding. See Technical Notes.

10
Projections by Occupational Group. Figure 11 breaks down projected changes in employment in Central Ohio by major occupational group. In 2004, the largest occupational groups in this region were office and administrative support; sales and related; transportation and material moving; and food preparation and serving related occupations.
The most occupational growth from 2004 to 2014 will be in healthcare occupations, adding over 15,000 jobs and offering 2,800 openings per year on average. Other groups with significant projected growth include computer and mathematical occupations (25.2%); food preparation and serving (16.5%); and transportation and material moving (11.1%). Although several industry sectors are projected to lose jobs during this period, only one occupational group, production, is expected to decline in employment (-0.4%). This group is still expected to have about 1,700 annual openings; statewide, three out of every four openings are expected to be replacement hires.
Figure 11: Central Ohio Projections to 2014 by Occupational Group
2004-2014 Percent
Total, All Occupations 998,300 1,092,900 94,600 9.5% 32,968Management Occupations 53,530 57,760 4,230 7.9% 1,329Business and Financial Operations Occupations 53,200 59,070 5,870 11.0% 1,529Computer and Mathematical Occupations 27,990 35,040 7,050 25.2% 1,074Architecture and Engineering Occupations 17,280 18,750 1,470 8.5% 539Life, Physical, and Social Science Occupations 7,380 8,190 810 11.0% 254Community and Social Services Occupations 13,540 15,310 1,770 13.1% 435Legal Occupations 9,220 10,570 1,350 14.6% 244Education, Training, and Library Occupations 49,100 55,800 6,700 13.6% 1,729Arts, Design, Entertainment, Sports, & Media Occ. 14,700 16,110 1,410 9.6% 411Healthcare Occupations, total 74,210 89,710 15,500 20.9% 2,849Protective Service Occupations 18,960 19,800 840 4.4% 637Food Preparation and Serving Related Occupations 80,890 94,270 13,380 16.5% 4,506Building & Grounds Cleaning & Maintenance Occup. 33,110 37,340 4,230 12.8% 1,087Personal Care and Service Occupations 27,170 30,940 3,770 13.9% 1,015Sales and Related Occupations 105,520 112,520 7,000 6.6% 4,054Office and Administrative Support Occupations 176,170 179,460 3,290 1.9% 4,216Farming, Fishing, and Forestry Occupations 2,170 2,260 90 4.1% 67Construction and Extraction Occupations 39,480 43,060 3,580 9.1% 1,111Installation, Maintenance, and Repair Occupations 40,240 43,290 3,050 7.6% 1,214Production Occupations 69,390 69,130 -260 -0.4% 1,700Transportation and Material Moving Occupations 85,090 94,540 9,450 11.1% 2,995Columns may not total due to rounding. See Technical Notes.
Avg. Ann. OpeningsOccupational Group 2004 Annual
Empl.2014 Proj.
Empl.
Change in Employment

High Prospect Occupations in 2014. A high prospect occupation is one that pays at least $12 per hour on average and is expected to have at least 50 average annual openings. There are about 90 such occupations identified for Central Ohio. Figure 12 shows these high prospect occupations arranged by required education and training.
Figure 12: High Prospect Occupations in Central Ohio
2004-2014 Percent
43-3011 Bill and Account Collectors 6,830 8,330 1,500 22.0% 279 $13.9443-3071 Tellers 2,660 2,690 30 1.1% 134 $12.4343-5052 Postal Service Mail Carriers 2,070 1,960 -110 -5.3% 65 $21.8643-5061 Production, Planning, and Expediting Clerks 2,860 3,160 300 10.5% 99 $18.0243-5071 Shipping, Receiving, and Traffic Clerks 6,300 6,630 330 5.2% 162 $13.7943-9051 Mail Clerks & Mail Machine Op., ex. Postal Serv. 1,970 1,190 -780 -39.6% 59 $12.8543-9061 Office Clerks, General 19,100 19,680 580 3.0% 481 $12.0851-9198 Helpers--Production Workers 4,200 4,310 110 2.6% 128 $12.1053-3022 Bus Drivers, School 2,520 2,790 270 10.7% 82 $13.7153-3031 Driver/Sales Workers 3,200 3,760 560 17.5% 109 $12.2553-3033 Truck Drivers, Light or Delivery Services 7,070 8,000 930 13.2% 159 $14.3453-7051 Industrial Truck and Tractor Operators 7,220 8,120 900 12.5% 227 $14.20
31-9091 Dental Assistants 1,400 1,880 480 34.3% 87 $15.8231-9092 Medical Assistants 3,120 4,480 1,360 43.6% 194 $12.8133-3012 Correctional Officers and Jailers 2,790 2,800 10 0.4% 73 $18.0741-4011 Sales Rep., Wholesale & Mfg, Tech./Sci. Prod. 2,870 3,310 440 15.3% 120 $31.8541-4012 Sales Rep., Wholesale/Mfg, ex. Tech./Sci. Prod. 9,710 11,110 1,400 14.4% 395 $30.5343-3021 Billing & Posting Clerks & Machine Operators 4,930 4,900 -30 -0.6% 84 $13.9743-3031 Bookkeeping, Accounting, and Auditing Clerks 13,140 13,240 100 0.8% 257 $16.1343-3051 Payroll and Timekeeping Clerks 1,490 1,630 140 9.4% 54 $16.3343-4051 Customer Service Representatives 21,320 24,930 3,610 16.9% 679 $15.0743-6011 Executive Secretaries & Administrative Assistants 13,170 13,790 620 4.7% 315 $19.4443-6014 Secretaries, except Legal, Medical & Executive 10,910 10,140 -770 -7.1% 209 $14.5743-9021 Data Entry Keyers 3,040 2,910 -130 -4.3% 72 $12.7543-9041 Insurance Claims and Policy Processing Clerks 4,810 4,670 -140 -2.9% 77 $15.6947-2061 Construction Laborers 4,980 5,150 170 3.4% 83 $16.4947-2073 Operating Engineers & Other Con. Equip. Op. 1,970 2,220 250 12.7% 76 $20.7049-9042 Maintenance and Repair Workers, General 10,390 11,320 930 9.0% 293 $16.7451-2092 Team Assemblers 13,660 15,710 2,050 15.0% 558 $13.3651-4031 Cutting/Punching/Press Machine S/O/T, M/P 2,560 2,280 -280 -10.9% 59 $15.3251-9061 Inspectors/Testers/Sorters/Samplers/Weighers 3,550 3,760 210 5.9% 102 $15.2753-3032 Truck Drivers, Heavy and Tractor-Trailer 11,480 13,180 1,700 14.8% 358 $18.28
13-1031 Claims Adjusters, Examiners and Investigators 2,660 2,850 190 7.1% 52 $26.1813-1041 Compl. Off., ex. Agric, Con, Hlth/Safety, & Trans. 1,780 1,900 120 6.7% 53 $29.5433-2011 Fire Fighters 3,420 3,700 280 8.2% 127 $16.5533-3051 Police and Sheriff's Patrol Officers 4,110 4,160 50 1.2% 111 $22.3247-2031 Carpenters 6,930 7,790 860 12.4% 199 $17.2347-2111 Electricians 4,870 5,280 410 8.4% 137 $20.4347-2152 Plumbers, Pipefitters and Steamfitters 2,460 2,750 290 11.8% 86 $22.98
Occupations Requiring Moderate-Term On-the-Job Training (one to twelve months combined experience/training)
Occupations Requiring Long-Term On-the-Job Training (twelve months or more combined experience/training)
Change in Employment Avg. Ann. Openings
2006 Avg. Wage*
Occupations Requiring Short-Term On-the-Job Training (up to one month)
Code Occupational Title**2004
Annual Empl.
2014 Projected
Empl.
11
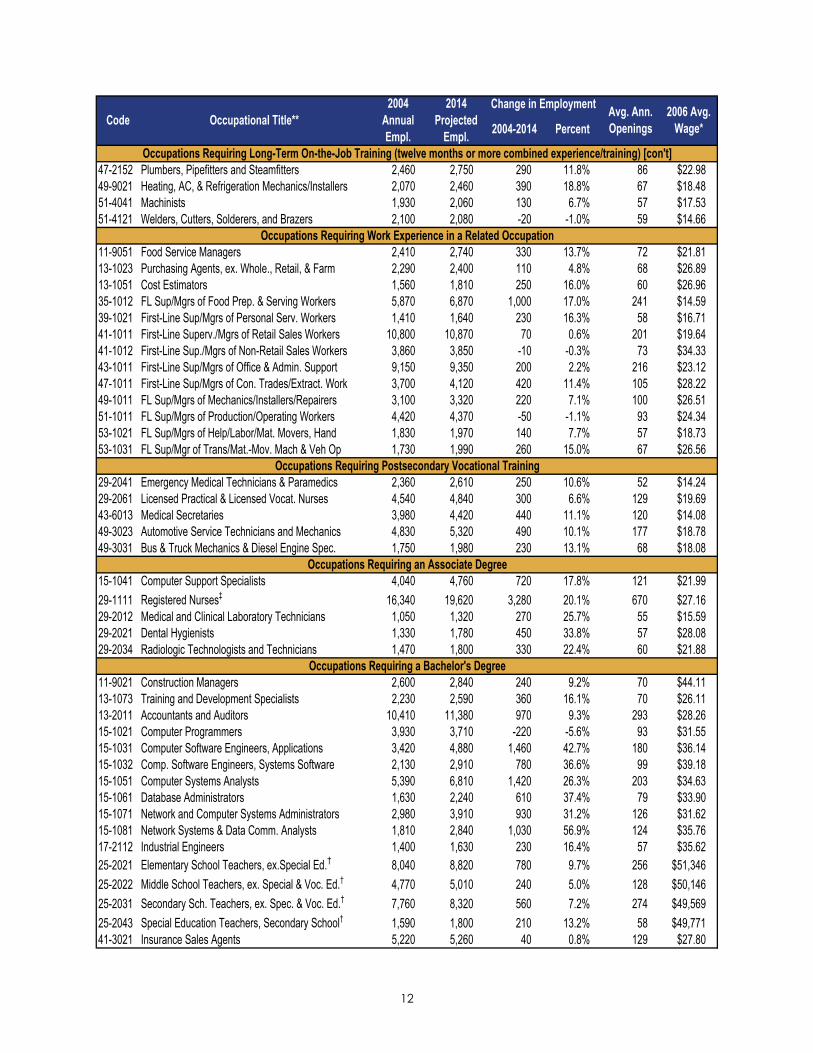
2004-2014 Percent
47-2152 Plumbers, Pipefitters and Steamfitters 2,460 2,750 290 11.8% 86 $22.9849-9021 Heating, AC, & Refrigeration Mechanics/Installers 2,070 2,460 390 18.8% 67 $18.4851-4041 Machinists 1,930 2,060 130 6.7% 57 $17.5351-4121 Welders, Cutters, Solderers, and Brazers 2,100 2,080 -20 -1.0% 59 $14.66
11-9051 Food Service Managers 2,410 2,740 330 13.7% 72 $21.8113-1023 Purchasing Agents, ex. Whole., Retail, & Farm 2,290 2,400 110 4.8% 68 $26.8913-1051 Cost Estimators 1,560 1,810 250 16.0% 60 $26.9635-1012 FL Sup/Mgrs of Food Prep. & Serving Workers 5,870 6,870 1,000 17.0% 241 $14.5939-1021 First-Line Sup/Mgrs of Personal Serv. Workers 1,410 1,640 230 16.3% 58 $16.7141-1011 First-Line Superv./Mgrs of Retail Sales Workers 10,800 10,870 70 0.6% 201 $19.6441-1012 First-Line Sup./Mgrs of Non-Retail Sales Workers 3,860 3,850 -10 -0.3% 73 $34.3343-1011 First-Line Sup/Mgrs of Office & Admin. Support 9,150 9,350 200 2.2% 216 $23.1247-1011 First-Line Sup/Mgrs of Con. Trades/Extract. Work 3,700 4,120 420 11.4% 105 $28.2249-1011 FL Sup/Mgrs of Mechanics/Installers/Repairers 3,100 3,320 220 7.1% 100 $26.5151-1011 FL Sup/Mgrs of Production/Operating Workers 4,420 4,370 -50 -1.1% 93 $24.3453-1021 FL Sup/Mgrs of Help/Labor/Mat. Movers, Hand 1,830 1,970 140 7.7% 57 $18.7353-1031 FL Sup/Mgr of Trans/Mat.-Mov. Mach & Veh Op 1,730 1,990 260 15.0% 67 $26.56
29-2041 Emergency Medical Technicians & Paramedics 2,360 2,610 250 10.6% 52 $14.2429-2061 Licensed Practical & Licensed Vocat. Nurses 4,540 4,840 300 6.6% 129 $19.6943-6013 Medical Secretaries 3,980 4,420 440 11.1% 120 $14.0849-3023 Automotive Service Technicians and Mechanics 4,830 5,320 490 10.1% 177 $18.7849-3031 Bus & Truck Mechanics & Diesel Engine Spec. 1,750 1,980 230 13.1% 68 $18.08
15-1041 Computer Support Specialists 4,040 4,760 720 17.8% 121 $21.9929-1111 Registered Nurses‡ 16,340 19,620 3,280 20.1% 670 $27.1629-2012 Medical and Clinical Laboratory Technicians 1,050 1,320 270 25.7% 55 $15.5929-2021 Dental Hygienists 1,330 1,780 450 33.8% 57 $28.0829-2034 Radiologic Technologists and Technicians 1,470 1,800 330 22.4% 60 $21.88
11-9021 Construction Managers 2,600 2,840 240 9.2% 70 $44.1113-1073 Training and Development Specialists 2,230 2,590 360 16.1% 70 $26.1113-2011 Accountants and Auditors 10,410 11,380 970 9.3% 293 $28.2615-1021 Computer Programmers 3,930 3,710 -220 -5.6% 93 $31.5515-1031 Computer Software Engineers, Applications 3,420 4,880 1,460 42.7% 180 $36.1415-1032 Comp. Software Engineers, Systems Software 2,130 2,910 780 36.6% 99 $39.1815-1051 Computer Systems Analysts 5,390 6,810 1,420 26.3% 203 $34.6315-1061 Database Administrators 1,630 2,240 610 37.4% 79 $33.9015-1071 Network and Computer Systems Administrators 2,980 3,910 930 31.2% 126 $31.6215-1081 Network Systems & Data Comm. Analysts 1,810 2,840 1,030 56.9% 124 $35.7617-2112 Industrial Engineers 1,400 1,630 230 16.4% 57 $35.6225-2021 Elementary School Teachers, ex.Special Ed.† 8,040 8,820 780 9.7% 256 $51,34625-2022 Middle School Teachers, ex. Special & Voc. Ed.† 4,770 5,010 240 5.0% 128 $50,14625-2031 Secondary Sch. Teachers, ex. Spec. & Voc. Ed.† 7,760 8,320 560 7.2% 274 $49,56925-2043 Special Education Teachers, Secondary School† 1,590 1,800 210 13.2% 58 $49,77141-3021 Insurance Sales Agents 5,220 5,260 40 0.8% 129 $27.80
Change in Employment Avg. Ann. Openings
2006 Avg. Wage*Code Occupational Title**
2004 Annual Empl.
2014 Projected
Empl.
Occupations Requiring an Associate Degree
Occupations Requiring a Bachelor's Degree
Occupations Requiring Long-Term On-the-Job Training (twelve months or more combined experience/training) [con't]
Occupations Requiring Work Experience in a Related Occupation
Occupations Requiring Postsecondary Vocational Training
12

2004-2014 Percent
11-1011 Chief Executives 2,680 2,990 310 11.6% 82 $74.4611-1021 General and Operations Managers 10,180 11,530 1,350 13.3% 327 $48.6211-2022 Sales Managers 1,870 2,200 330 17.6% 68 $48.9411-3021 Computer and Information Systems Managers 2,540 3,070 530 20.9% 99 $50.4611-3031 Financial Managers 2,620 2,800 180 6.9% 56 $46.0711-9111 Medical and Health Services Managers 1,890 2,170 280 14.8% 65 $35.5313-1111 Management Analysts 5,020 5,470 450 9.0% 114 $30.10
25-9031 Instructional Coordinators 1,530 1,860 330 21.6% 56 $25.33
23-1011 Lawyers 4,700 5,550 850 18.1% 145 $46.8929-1051 Pharmacists 1,480 1,830 350 23.6% 64 $39.54
Occupations Requiring Work Experience plus a Bachelor's Degree
Occupations Requiring a Master's Degree
Change in Employment Avg. Ann. Openings
2006 Avg. Wage*Code Occupational Title**
2004 Annual Empl.
2014 Projected
Empl.
Occupations Requiring a First Professional Degree
*May 2005 wages aged to April 2006. Wages in italics are statewide figures because EDR wages were unavailable.**Abbreviations
FL Sup/Mgrs = First-Line Supervisors/Managers
Source: Ohio Department of Job and Family Services, Bureau of Labor Market Information, 2007a.
M/P = Metal and PlasticO/T = Operators and Tenders S/O/T = Setters, Operators and Tenders
†Annual earnings, typically for a 9½ month school year‡Training requirements may be met through a two-year associate's degree; a three-year diploma; or a four-year bachelor's degree.
13

15
IV. Education & Training
Educational Attainment. Figure 13 shows educational attainment for persons 25 and older in this region, according to data from the 2000 decennial census. Not surprisingly, Central Ohio’s educational profile shows a higher level of overall educational attainment than the rest of the state. This region has a lower proportion of adults without a high school diploma: 14.4 percent compared with 17.0 percent statewide. The region also has a greater proportion of people with a bachelor’s degree or better: 27.9 percent versus 21.1 percent.
Figure 13: Educational Attainment, 2000
0%
10%
20%
30%
40%
50%
60%
70%
80%
90%
100%
Master's Degree or Higher 547,276 97,230
Bachelor's Degree 1,016,256 198,296
Associate Degree 439,608 60,307
Some College 1,471,964 218,543
High School Graduate 2,674,551 332,629
No High School Diploma 1,262,085 152,210
Ohio Statewide Central Ohio
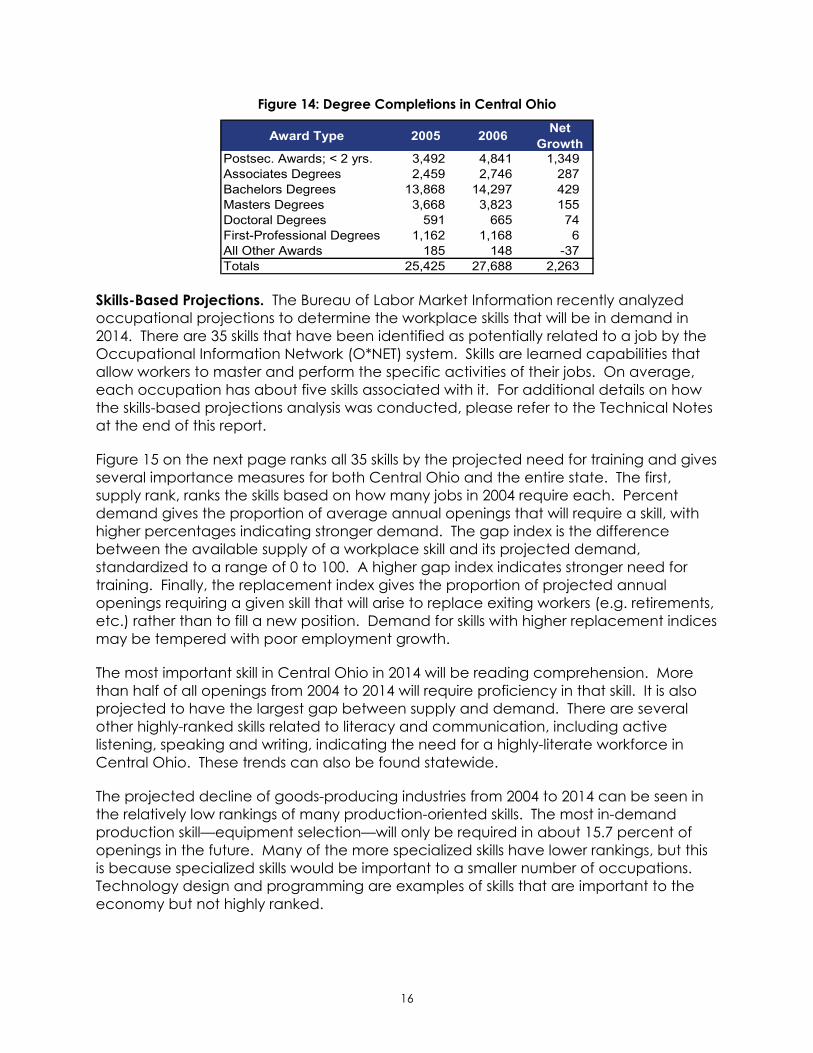
Institutions and Degree Completions. Central Ohio has 38 postsecondary training providers offering about 1,700 different programs: 5 public adult schools with vocational programs; 14 two-year technical and community colleges; 16 four-year colleges and universities; 2 private business and technical schools; and one truck driving school. Figure 14 on the next page shows that there were 8.9 percent more postsecondary awards completed in Central Ohio in 2006 than in 2005. Programs less than two years long have seen the most growth during this period. Details on educational institutions and program completers are available in Appendices E and F, respectively.
16
Figure 14: Degree Completions in Central Ohio
Award Type 2005 2006 Net Growth
Postsec. Awards; < 2 yrs. 3,492 4,841 1,349Associates Degrees 2,459 2,746 287Bachelors Degrees 13,868 14,297 429Masters Degrees 3,668 3,823 155Doctoral Degrees 591 665 74First-Professional Degrees 1,162 1,168 6All Other Awards 185 148 -37Totals 25,425 27,688 2,263
Skills-Based Projections. The Bureau of Labor Market Information recently analyzed occupational projections to determine the workplace skills that will be in demand in 2014. There are 35 skills that have been identified as potentially related to a job by the Occupational Information Network (O*NET) system. Skills are learned capabilities that allow workers to master and perform the specific activities of their jobs. On average, each occupation has about five skills associated with it. For additional details on how the skills-based projections analysis was conducted, please refer to the Technical Notes at the end of this report.
Figure 15 on the next page ranks all 35 skills by the projected need for training and gives several importance measures for both Central Ohio and the entire state. The first, supply rank, ranks the skills based on how many jobs in 2004 require each. Percent demand gives the proportion of average annual openings that will require a skill, with higher percentages indicating stronger demand. The gap index is the difference between the available supply of a workplace skill and its projected demand, standardized to a range of 0 to 100. A higher gap index indicates stronger need for training. Finally, the replacement index gives the proportion of projected annual openings requiring a given skill that will arise to replace exiting workers (e.g. retirements, etc.) rather than to fill a new position. Demand for skills with higher replacement indices may be tempered with poor employment growth.
The most important skill in Central Ohio in 2014 will be reading comprehension. More than half of all openings from 2004 to 2014 will require proficiency in that skill. It is also projected to have the largest gap between supply and demand. There are several other highly-ranked skills related to literacy and communication, including active listening, speaking and writing, indicating the need for a highly-literate workforce in Central Ohio. These trends can also be found statewide.
The projected decline of goods-producing industries from 2004 to 2014 can be seen in the relatively low rankings of many production-oriented skills. The most in-demand production skill—equipment selection—will only be required in about 15.7 percent of openings in the future. Many of the more specialized skills have lower rankings, but this is because specialized skills would be important to a smaller number of occupations. Technology design and programming are examples of skills that are important to the economy but not highly ranked.
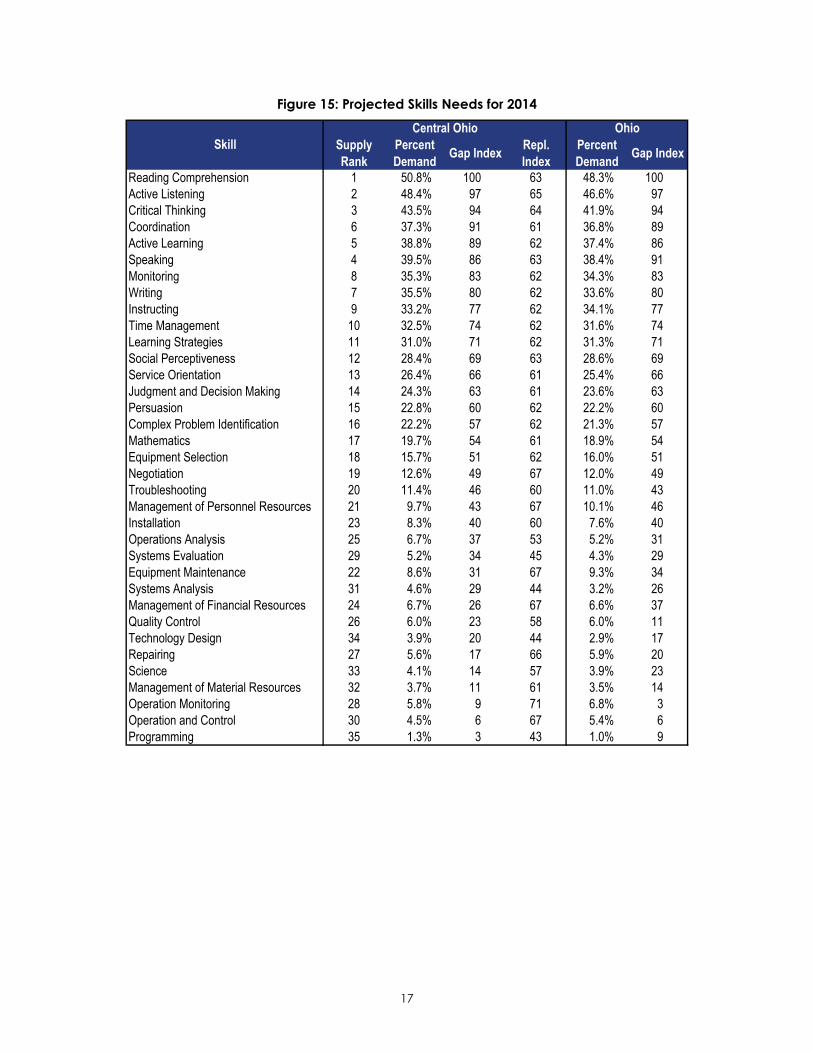
Figure 15: Projected Skills Needs for 2014
Supply Rank
Percent Demand Gap Index Repl.
IndexPercent Demand Gap Index
Reading Comprehension 1 50.8% 100 63 48.3% 100Active Listening 2 48.4% 97 65 46.6% 97Critical Thinking 3 43.5% 94 64 41.9% 94Coordination 6 37.3% 91 61 36.8% 89Active Learning 5 38.8% 89 62 37.4% 86Speaking 4 39.5% 86 63 38.4% 91Monitoring 8 35.3% 83 62 34.3% 83Writing 7 35.5% 80 62 33.6% 80Instructing 9 33.2% 77 62 34.1% 77Time Management 10 32.5% 74 62 31.6% 74Learning Strategies 11 31.0% 71 62 31.3% 71Social Perceptiveness 12 28.4% 69 63 28.6% 69Service Orientation 13 26.4% 66 61 25.4% 66Judgment and Decision Making 14 24.3% 63 61 23.6% 63Persuasion 15 22.8% 60 62 22.2% 60Complex Problem Identification 16 22.2% 57 62 21.3% 57Mathematics 17 19.7% 54 61 18.9% 54Equipment Selection 18 15.7% 51 62 16.0% 51Negotiation 19 12.6% 49 67 12.0% 49Troubleshooting 20 11.4% 46 60 11.0% 43Management of Personnel Resources 21 9.7% 43 67 10.1% 46Installation 23 8.3% 40 60 7.6% 40Operations Analysis 25 6.7% 37 53 5.2% 31Systems Evaluation 29 5.2% 34 45 4.3% 29Equipment Maintenance 22 8.6% 31 67 9.3% 34Systems Analysis 31 4.6% 29 44 3.2% 26Management of Financial Resources 24 6.7% 26 67 6.6% 37Quality Control 26 6.0% 23 58 6.0% 11Technology Design 34 3.9% 20 44 2.9% 17Repairing 27 5.6% 17 66 5.9% 20Science 33 4.1% 14 57 3.9% 23Management of Material Resources 32 3.7% 11 61 3.5% 14Operation Monitoring 28 5.8% 9 71 6.8% 3Operation and Control 30 4.5% 6 67 5.4% 6Programming 35 1.3% 3 43 1.0% 9
Central Ohio OhioSkill
17

Technical Notes Population, demographic and commuting estimates were obtained from the U.S. Census Bureau. Population and demographics are available online at http://www.census.gov/popest/ datasets.html. Commuting data are available online at http://www.census.gov/population/ www/cen2000/commuting.html.
Current employment data were obtained from the Quarterly Census of Employment and Wages (QCEW), as conducted by the Ohio Bureau of Labor Market Information, Administrative Industry Statistics Section. The data are based on reports filed by employers subject to the Ohio Unemployment Compensation Law, as well as those covered under Unemployment Compensation for Federal Employees, by place of work. Total employment figures may include some employment in establishments which could not be classified. See the Economic Development Profiles at http://lmi.state.oh.us/CEP/CEP.htm or the “Data Query” menu for Employment and Wages by Industry at http://www.OhioWorkforceInformer.org. For details on industry classifications, visit 2002 North American Industry Classification System (NAICS) Codes and Titles at http://www.census.gov/epcd/naics02/naicod02.htm.
Unemployment rate estimates were developed by the Ohio Bureau of Labor Market Information, Local Area Unemployment Statistics (LAUS) Section. Data are available online at http://www.OhioWorkforceInformer.org under the “Data Query” tab.
Per capita income figures at the county level are from the U.S. Bureau of Economic Analysis and were recalculated for EDRs by the Ohio Bureau of Labor Market Information, Workforce Research Section. County data are downloadable from http://www.bea.gov/bea/regional/reis and EDR data from http://www.OhioWorkforceInformer.org.
Employment projections data, by industry and occupation, were obtained from the Ohio Job Outlook to 2014, published by the Ohio Bureau of Labor Market Information, Workforce Research Section. These were rounded estimates and columns may not total. Outlooks for each of Ohio’s EDRs are available for download at http://lmi.state.oh.us/proj/OhioJobOutlook.htm. For details on occupational classifications, visit Standard Occupational Classification (SOC) System at http://www.bls.gov/soc/home.htm. The number of average annual openings needed to qualify as a high-prospect occupation may vary depending on the EDR’s relative size and total employment levels.
Data on educational attainment were obtained from the Ohio Department of Development, Office of Strategic Research, based on information from the 2000 decennial census. Detailed information on each of Ohio’s 88 counties, including a list of major employers, is available at http://www.odod.state.oh.us/research/files/s0.htm.
Degree completion data are from the Integrated Postsecondary Education Data System (IPEDS) by the U.S. Department of Education. IPEDS collects data from higher education institutions around the country on the number of degree completers, degree or award types, and educational program types. For more information, visit http://nces.ed.gov/IPEDS/about/ or contact BLMI at (888) 296-7541.
Skills-based projections were developed using the Skills Based Employment Projections web software from the Projections Workgroup. Skills were classified using O*NET—a matching of SOC-like occupations with typically required knowledge, skills and abilities. Skill-occupation matchings were included in the analysis if the skill had an importance score of at least 3 out of 5 and a level score of at least 4 out of 7. A detailed content model is available online at http://www.onetcenter.org/dl_files/ContentModel_DetailedDesc.pdf.
For more information on Ohio workforce statistics, visit the Ohio Workforce Informer online at http://www.OhioWorkforceInformer.org or the Ohio Labor Market Information Classic website at http://lmi.state.oh.us.
19

20
References
Goldstein, H. (2005). Projecting State and Area Industry Employment. Salt Lake City, UT: State Projections Workgroup.
Ohio Department of Development. Office of Strategic Research (2007). Ohio County Profiles. Retrieved November 19, 2007, from http://www.odod.state.oh.us/research/files/s0.htm.
Ohio Department of Job & Family Services. Bureau of Labor Market Information (2007a). Job Outlook to 2014: Economic Development Region 1. Columbus, OH: State Printing & Mail Services.
Ohio Department of Job & Family Services. Bureau of Labor Market information (2007b). Workforce Informer Data Query: Population. Retrieved June 7, 2007, from http://www.OhioWorkforceInformer.org/cgi/dataanalysis/AreaSelection.asp?tableName=Populatn.
Skills-Based Employment Projections [computer software] (2007). Salt Lake City, UT: State Projections Workgroup.
U.S. Bureau of Economic Analysis (2007). Local Area Personal Income. Retrieved June 7, 2007, from http://www.bea.gov/regional/reis.
U.S. Bureau of Labor Statistics (2007). Quarterly Census of Employment and Wages. Retrieved September 12, 2007, from http://www.bls.gov/cew/home.htm.
U.S. Census Bureau (2004). Census 2000—County-to-County Worker Flow Files. Retrieved June 28, 2007, from http://www.census.gov/population/wwwcen2000/commuting.html.
U.S. Census Bureau (2007a). 100 Fastest Growing Counties. Retrieved June 7, 2007, from http://www.census.gov/popest/counties/CO-EST-2006-08.html.
U.S. Census Bureau (2007b). Population Estimates Data Sets. Retrieved August 9, 2007, from http://www.census.gov/popest/datasets.html.
U.S. Department of Education (2007). Integrated Postsecondary Education Data System. Retrieved August 17, 2007.

Appendix A: Ohio’s Economic Development Regions
1. Central Ohio: Delaware, Fairfield, Fayette, Franklin, Licking, Logan, Madison and Union Counties
2. Northwest Ohio: Defiance, Erie, Fulton, Henry, Lucas, Ottawa, Sandusky, Williams and Wood Counties
3. West Central Ohio: Allen, Auglaize, Hancock, Hardin, Mercer, Paulding, Putnam and Van Wert Counties
4. Southwest Central Ohio: Champaign, Clark, Clinton, Darke, Greene, Miami, Montgomery, Preble, and Shelby Counties
5. Southwest Ohio: Butler, Clermont, Hamilton and Warren Counties
6. North Central Ohio: Ashland, Crawford, Huron, Knox, Marion, Morrow, Richland, Seneca and Wyandot Counties
7. Southern Ohio: Adams, Brown, Gallia, Highland, Jackson, Lawrence, Ross, Scioto and Vinton Counties
8. Northern Ohio: Cuyahoga, Geauga, Lake and Lorain Counties
9. Northeast Central Ohio: Medina, Portage, Stark, Summit and Wayne Counties
10. East Central Ohio: Belmont, Carroll, Columbiana, Coshocton, Harrison, Holmes, Jefferson, Muskingum and Tuscarawas Counties
11. Southeast Ohio: Athens, Hocking, Meigs, Monroe, Morgan, Noble, Perry and Washington Counties
12. Northeast Ohio: Ashland, Mahoning and Trumbull Counties
21

Appendix B: Ohio’s Metropolitan Statistical Areas
A. Akron MSA: Portage and Summit Counties.
B. Canton-Massillon MSA: Carroll and Stark Counties.
C. Cincinnati-Middletown MSA: Brown, Butler, Clermont, Hamilton and Warren Counties in Ohio; Dearborn, Franklin and Ohio Counties in Indiana; and Boone, Bracken, Campbell, Gallatin, Grant, Kenton and Pendleton Counties in Kentucky.
D. Cleveland-Elyria-Mentor MSA: Cuyahoga, Geauga, Lake, Lorain and Medina Counties.
E. Columbus MSA: Delaware, Fairfield, Franklin, Licking, Madison, Morrow, Pickaway and Union Counties
F. Dayton MSA: Greene, Miami, Montgomery and Preble Counties
G. Huntington-Ashland MSA*: Cabell and Wayne Counties in West Virginia; Boyd and Greenup Counties in Kentucky; and Lawrence County in Ohio.
H. Lima MSA: Allen County.
I. Mansfield MSA: Richland County.
J. Parkersburg-Marietta-Vienna MSA*: Pleasants, Wirt and Wood Counties in West Virginia and Washington County in Ohio.
K. Sandusky MSA: Erie County.
L. Springfield MSA: Clark County.
M. Toledo MSA: Fulton, Lucas, Ottawa and Wood Counties.
N. Weirton-Steubenville MSA: Jefferson County in Ohio and Brooke and Hancock Counties in West Virginia.
O. Wheeling MSA*: Marshall and Ohio Counties in West Virginia and Belmont County in Ohio.
P. Youngstown-Warren-Boardman MSA: Mahoning and Trumbull Counties in Ohio and Mercer County in Pennsylvania.
*Statistical Areas in other states that include Ohio counties
22

Appendix C: Detailed County-to-County Commuting Patterns 63.5%
26.5
57,840 43,463Commute Out To Number Percent Commute In From Number PercentFranklin Co. OH 31,708 54.8% Franklin Co. OH 14,222 32.7%Union Co. OH 1,782 3.1% Morrow Co. OH 1,983 4.6%Marion Co. OH 839 1.5% Marion Co. OH 1,609 3.7%Licking Co. OH 374 0.6% Licking Co. OH 900 2.1%Knox Co. OH 218 0.4% Union Co. OH 890 2.0%Logan Co. OH 200 0.3% Knox Co. OH 831 1.9%Morrow Co. OH 172 0.3% Fairfield Co. OH 395 0.9%Madison Co. OH 111 0.2% Madison Co. OH 174 0.4%Fairfield Co. OH 102 0.2% Richland Co. OH 129 0.3%Richland Co. OH 63 0.1% Crawford Co. OH 117 0.3%
55.8%27.7
60,465 36,957Commute Out To Number Percent Commute In From Number PercentFranklin Co. OH 28,259 46.7% Franklin Co. OH 3,261 8.8%Licking Co. OH 1,563 2.6% Perry Co. OH 1,980 5.4%Pickaway Co. OH 1,289 2.1% Hocking Co. OH 1,897 5.1%Delaware Co. OH 395 0.7% Licking Co. OH 915 2.5%Hocking Co. OH 361 0.6% Athens Co. OH 431 1.2%Perry Co. OH 273 0.5% Pickaway Co. OH 349 0.9%Ross Co. OH 255 0.4% Muskingum Co. OH 211 0.6%Muskingum Co. OH 158 0.3% Ross Co. OH 191 0.5%Athens Co. OH 142 0.2% Delaware Co. OH 102 0.3%Union Co. OH 91 0.2% Vinton Co. OH 78 0.2%
35.1%24.4
13,433 11,415Commute Out To Number Percent Commute In From Number PercentFranklin Co. OH 1,250 9.3% Highland Co. OH 645 5.7%Clinton Co. OH 1,229 9.1% Ross Co. OH 503 4.4%Madison Co. OH 563 4.2% Clinton Co. OH 351 3.1%Highland Co. OH 457 3.4% Greene Co. OH 350 3.1%Pickaway Co. OH 248 1.8% Pickaway Co. OH 244 2.1%Greene Co. OH 190 1.4% Franklin Co. OH 152 1.3%Ross Co. OH 153 1.1% Madison Co. OH 145 1.3%Clark Co. OH 124 0.9% Montgomery Co. OH 55 0.5%Montgomery Co. OH 78 0.6% Clark Co. OH 54 0.5%Hamilton Co. OH 52 0.4% Pike Co. OH 34 0.3%
Delaware Percent of workers that work outside the county -Average commute time in minutes -
Number of workers 16+ years of age Number of workers 16+ years of ageliving in Delaware County working in Delaware County
Fairfield Percent of workers that work outside the county -Average commute time in minutes -
Number of workers 16+ years of age Number of workers 16+ years of ageliving in Fairfield County working in Fairfield County
living in Fayette County working in Fayette County
Fayette Percent of workers that work outside the county -Average commute time in minutes -
Number of workers 16+ years of age Number of workers 16+ years of age
23

7.3%21.9
548,655 652,261Commute Out To Number Percent Commute In From Number PercentDelaware Co. OH 14,222 2.6% Delaware Co. OH 31,708 4.9%Union Co. OH 4,527 0.8% Fairfield Co. OH 28,259 4.3%Licking Co. OH 4,089 0.7% Licking Co. OH 23,755 3.6%Fairfield Co. OH 3,261 0.6% Pickaway Co. OH 9,613 1.5%Madison Co. OH 1,903 0.3% Madison Co. OH 7,921 1.2%Pickaway Co. OH 1,517 0.3% Union Co. OH 5,473 0.8%Montgomery Co. OH 612 0.1% Morrow Co. OH 3,108 0.5%Marion Co. OH 590 0.1% Knox Co. OH 3,014 0.5%Hamilton Co. OH 552 0.1% Perry Co. OH 2,433 0.4%Logan Co. OH 506 0.1% Ross Co. OH 2,335 0.4%
40.4%24.8
71,213 56,215Commute Out To Number Percent Commute In From Number PercentFranklin Co. OH 23,755 33.4% Franklin Co. OH 4,089 7.3%Muskingum Co. OH 1,100 1.5% Muskingum Co. OH 2,667 4.7%Fairfield Co. OH 915 1.3% Perry Co. OH 1,656 2.9%Delaware Co. OH 900 1.3% Fairfield Co. OH 1,563 2.8%Knox Co. OH 744 1.0% Knox Co. OH 1,304 2.3%Perry Co. OH 107 0.2% Coshocton Co. OH 536 1.0%Coshocton Co. OH 92 0.1% Delaware Co. OH 374 0.7%Union Co. OH 69 0.1% Morgan Co. OH 157 0.3%Ross Co. OH 52 0.1% Guernsey Co. OH 127 0.2%Pickaway Co. OH 48 0.1% Hocking Co. OH 94 0.2%
31.2%22.0
21,962 20,355Commute Out To Number Percent Commute In From Number PercentUnion Co. OH 2,470 11.2% Champaign Co. OH 1,118 5.5%Shelby Co. OH 1,151 5.2% Hardin Co. OH 964 4.7%Champaign Co. OH 707 3.2% Union Co. OH 869 4.3%Franklin Co. OH 570 2.6% Franklin Co. OH 506 2.5%Allen Co. OH 509 2.3% Shelby Co. OH 307 1.5%Hardin Co. OH 303 1.4% Auglaize Co. OH 277 1.4%Clark Co. OH 256 1.2% Marion Co. OH 251 1.2%Montgomery Co. OH 173 0.8% Delaware Co. OH 200 1.0%Miami Co. OH 117 0.5% Clark Co. OH 186 0.9%Auglaize Co. OH 84 0.4% Allen Co. OH 137 0.7%
Franklin Percent of workers that work outside the county -Average commute time in minutes -
Number of workers 16+ years of age Number of workers 16+ years of ageliving in Franklin County working in Franklin County
Licking Percent of workers that work outside the county -Average commute time in minutes -
Number of workers 16+ years of age Number of workers 16+ years of ageliving in Licking County working in Licking County
living in Logan County working in Logan County
Logan Percent of workers that work outside the county -Average commute time in minutes -
Number of workers 16+ years of age Number of workers 16+ years of age
24

57.5%25.8
17,828 13,180Commute Out To Number Percent Commute In From Number PercentFranklin Co. OH 7,921 44.4% Franklin Co. OH 1,903 14.4%Union Co. OH 763 4.3% Clark Co. OH 1,092 8.3%Clark Co. OH 373 2.1% Fayette Co. OH 563 4.3%Delaware Co. OH 174 1.0% Union Co. OH 439 3.3%Pickaway Co. OH 172 1.0% Pickaway Co. OH 392 3.0%Fayette Co. OH 145 0.8% Ross Co. OH 289 2.2%Greene Co. OH 107 0.6% Champaign Co. OH 265 2.0%Champaign Co. OH 91 0.5% Delaware Co. OH 111 0.8%Montgomery Co. OH 79 0.4% Greene Co. OH 71 0.5%Licking Co. OH 73 0.4% Montgomery Co. OH 66 0.5%
55.4%26.7
21,921 17,332Commute Out To Number Percent Commute In From Number PercentFranklin Co. OH 9,613 43.9% Ross Co. OH 2,617 15.1%Ross Co. OH 847 3.9% Franklin Co. OH 1,517 8.8%Madison Co. OH 392 1.8% Fairfield Co. OH 1,289 7.4%Fairfield Co. OH 349 1.6% Hocking Co. OH 564 3.3%Fayette Co. OH 244 1.1% Fayette Co. OH 248 1.4%Licking Co. OH 86 0.4% Pike Co. OH 241 1.4%Hocking Co. OH 62 0.3% Madison Co. OH 172 1.0%Union Co. OH 60 0.3% Vinton Co. OH 128 0.7%Delaware Co. OH 58 0.3% Jackson Co. OH 108 0.6%Clinton Co. OH 51 0.2% Delaware Co. OH 55 0.3%
42.7%23.0
20,416 26,376Commute Out To Number Percent Commute In From Number PercentFranklin Co. OH 5,473 26.8% Franklin Co. OH 4,527 17.2%Delaware Co. OH 890 4.4% Logan Co. OH 2,470 9.4%Logan Co. OH 869 4.3% Champaign Co. OH 1,802 6.8%Marion Co. OH 508 2.5% Delaware Co. OH 1,782 6.8%Madison Co. OH 439 2.2% Marion Co. OH 1,041 3.9%Hardin Co. OH 82 0.4% Clark Co. OH 775 2.9%Champaign Co. OH 80 0.4% Madison Co. OH 763 2.9%Licking Co. OH 54 0.3% Hardin Co. OH 542 2.1%Summit Co. OH 41 0.2% Morrow Co. OH 131 0.5%Knox Co. OH 38 0.2% Fairfield Co. OH 91 0.3%
Madison Percent of workers that work outside the county -Average commute time in minutes -
Number of workers 16+ years of age Number of workers 16+ years of ageliving in Madison County working in Madison County
Pickaway Percent of workers that work outside the county -Average commute time in minutes -
Number of workers 16+ years of age Number of workers 16+ years of ageliving in Pickaway County working in Pickaway County
living in Union County working in Union County
Union Percent of workers that work outside the county -Average commute time in minutes -
Number of workers 16+ years of age Number of workers 16+ years of age
Source: U.S. Census Bureau, 2004.
25

26
Appendix D: Major Employers by County
Delaware City Board of Education GovernmentJP Morgan Chase & Co. FinanceKroger Co. RetailMcGraw Hill Companies ManufacturingOhio Wesleyan University EducationOhioHealth/Grady Memorial Hospital Health CareOlentangy Local Board of Education GovernmentPPG Industries, Inc. ManufacturingShowa Corp./American Showa, Inc. ManufacturingState of Ohio Government
Anchor Hocking Corp. ManufacturingCyril-Scott Co. ManufacturingFairfield Medical Center Health CareKroger Co. RetailLancaster City Board of Education GovernmentMcDermott International/Diamond Power ManufacturingMeijer, Inc. RetailPickerington Local Board of Education GovernmentRalcorp/Ralston Foods ManufacturingState of Ohio Government
Fayette County Memorial Hospital Health CareMcKesson Corp. WholesaleMiami Trace Local Board of Education GovernmentSaint-Gobain/Calmar, Inc. ManufacturingSugar Creek Packing Co. ManufacturingWal-Mart Stores, Inc. RetailWashington Court House City Board of Education GovernmentYamashita Rubber/YUSA Corp. Manufacturing
Abbott Laboratories/Ross Products ManufacturingAmerican Electric Power Co. UtilitiesBattelle Memorial Institute ResearchCardinal Health, Inc. WholesaleHuntington Bancshares, Inc. FinanceJP Morgan Chase & Co. FinanceLimited Brands, Inc. RetailNational City Corp. FinanceNationwide Mutual Insurance Co. InsuranceOhio State University EducationOhioHealth Health CareShottenstein Stores Corp. RetailState of Ohio GovernmentWendy's International, Inc. Food Service
Franklin
Delaware
Fairfield
Fayette

27
Anomatic Corp. ManufacturingArvinMeritor, Inc. ManufacturingBoeing Corp. ManufacturingDenison University EducationKroger Co. RetailLicking Memorial Health Systems Health CareNewark City Board of Education GovernmentOwens-Corning ManufacturingState Farm Mutual Automobile Insurance Co. Insurance
Asahi Glass Co., Ltd./AGC Automotive ManufacturingBellefontaine City Board of Education GovernmentDaido Metal Co., Ltd. ManufacturingHBD Industries ManufacturingHonda Motor Co., Ltd. ManufacturingMary Rutan Hospital Health CareNash-Finch Co. WholesaleWal-Mart Stores, Inc. Retail
Battelle Memorial Institute ResearchKikuchi Metal et al/Jefferson Industries ManufacturingLondon City Board of Education GovernmentMadison County Hospital Health CareNissen Chemtec/London Industries ManufacturingShowa Demco KK/Showa Aluminum Co. ManufacturingStanley Electric U.S. Co., Inc. ManufacturingStaples, Inc. RetailState of Ohio GovernmentTarget Corp. Retail
ALSCO Metals Corp. ManufacturingBerger Health System Health CareCircleville City Board of Education GovernmentE.I. du Pont de Nemours & Co. ManufacturingGeneral Electric Co. ManufacturingLogan Elm Local Board of Education GovernmentPPG Industries, Inc. ManufacturingState of Ohio GovernmentTeays Valley Local Board of Education GovernmentWal-Mart Stores, Inc. Retail
EDP, Inc./Goodyear Tire & Rubber Co. ManufacturingHonda Motor Co., Ltd. ManufacturingMarysville Exempted Village Board of Education GovernmentMemorial Hospital of Union County Health CareNestle R&D ResearchParker Hannifin Corp. ManufacturingScotts Miracle-Gro Co. ManufacturingState of Ohio GovernmentUnion County Government Government
Licking
Madison
Pickaway
Union
Logan
Source: Ohio Department of Development, 2007. Employers are listed in alphabetical order.

Appendix E: Postsecondary Institutions
Name Type Address Telephone URLAcademy of Court Reporting-Columbus Two-Year 630 E Broad St, Columbus, OH 43215 (614) 221-7770Adult and Community Education-Hudson Pub. Adult Sch. 2323 Lexington Avenue, Columbus, OH 43211 (614) 365-6000American Institute of Alternative Medicine Two-Year 6685 Doubletree Ave, Columbus, OH 43229 (614) 825-6278 www.aiam.eduAmerican School of Technology Priv. Bus. & Tech. 2100 Morse Rd Bldg 4599, Columbus, OH 43229 (614) 436-4820 www.ast.eduBradford School Two-Year 2469 Stelzer Road, Columbus, OH 43219 (614) 416-6200 www.bradfordschoolcolumbus.eduCapital University Four-Year 1 College and Main, Columbus, OH 43209 (614) 236-6011 www.capital.eduCentral Ohio Technical College Two-Year 1179 University Drive, Newark, OH 43055 (740) 366-1351 www.cotc.eduColumbus College of Art and Design Four-Year 107 N Ninth St, Columbus, OH 43215 (614) 224-9101 www.ccad.eduColumbus State Community College Two-Year 550 E Spring St, Columbus, OH 43215 (614) 287-5353 www.cscc.eduC-TEC of Licking County Pub. Adult Sch. 150 Price Rd, Newark, OH 43055 (614) 364-2333 www.c-tec.eduDelaware Area Career Center Pub. Adult Sch. 4565 Columbus Pike, Delaware, OH 43015 (740) 548-0708 www.delawareareacc.orgDenison University Four-Year 100 West College Rd, Granville, OH 43023 (740) 587-0810 www.denison.eduDeVry University-Ohio Four-Year 1350 Alum Creek Dr, Columbus, OH 43209 (614) 253-7291 www.devry.eduEastland-Fairfield Career and Technical Schools Pub. Adult Sch. 4300 Amalgamated Pl, Groveport, OH 43125 (614) 836-4541Everest College-Gahanna Two-Year 825 Tech Center Dr, Gahanna, OH 43230 (614) 322-3414Franklin University Four-Year 201 S Grant Ave, Columbus, OH 43215 (614) 797-4700 www.franklin.eduITT Technical Institute-Hilliard Two-Year 3781 Park Mill Run, Suite 1, Hilliard, OH 43026 (614) 771-4888 www.itt-tech.eduMethodist Theological School-Ohio Four-Year 3081 Columbus Pike, Delaware, OH 43015 (740) 363-1146 www.mtso.eduMount Carmel College of Nursing Four-Year 127 So. Davis Ave, Columbus, OH 43222 (614) 234-5800 www.mccn.eduNationwide Beauty Academy Two-Year 5300 Westpointe Plz, Columbus, OH 43228 (614) 252-5252Ohio Christian University Four-Year 1476 Lancaster Pike, Circleville, OH 43113 (740) 474-8896 www.ohiochristian.eduOhio Dominican University Four-Year 1216 Sunbury Rd, Columbus, OH 43219 (614) 253-2741 www.ohiodominican.eduOhio Hi Point Joint Vocational School District Pub. Adult Sch. 2280 St Rte 540, Bellefontaine, OH 43311 (937) 599-3010 www.ohp.k12.oh.usOhio Institute of Health Careers Priv. Bus. & Tech. 1880 E. Dublin - Granville Rd. - Ste 100, Columbus, OH 43229 (614) 891-5030 ohioinstituteofhealthcareers.comOhio State College of Barber Styling Two-Year 4614 E Broad St, Columbus, OH 43213 (614) 868-1015 www.ohiobarbercollege.comOhio State School of Cosmetology Two-Year 6320 E Livingston Ave, Reynoldsburg, OH 43068 (614) 252-5252Ohio State School of Cosmetology Two-Year 3717 S High St, Columbus, OH 43207 (614) 252-5252 www.salonschools.comOhio State School of Cosmetology Two-Year 5970 Westerville Rd, Westerville, OH 43081 (614) 252-5252Ohio State School Of Cosmetology & Experts Barber School Two-Year 4390 Karl Rd, Columbus, OH 43203 (614) 252-5252 salonschools.comOhio State University-Main Campus Four-Year 190 N. Oval Mall, Columbus, OH 43210 (614) 292-6446 www.osu.eduOhio State University-Newark Campus Four-Year 1179 University Dr, Newark, OH 43055 (740) 366-1351 www.newark.osu.eduOhio University-Lancaster Campus Four-Year 1570 Granville Pike, Lancaster, OH 43130 (740) 654-6711 www.lancaster.ohiou.eduOhio Wesleyan University Four-Year 61 S Sandusky Street, Delaware, OH 43015 (740) 368-2000 www.owu.eduOtterbein College Four-Year One Otterbein College, Westerville, OH 43081 (614) 890-3000 www.otterbein.eduPontifical College Josephinum Four-Year 7625 N High, Columbus, OH 43235 (614) 885-5585 www.pcj.edu
28

Appendix E: Postsecondary Institutions
Name Type Address Telephone URLRoadmaster Truck Driving Institute Other inst. 4060 Perimeter Drive, Columbus, OH 43228 (614) 351-1748 www.roadmaster.comRosedale Bible College Two-Year 2270 Rosedale Rd, Irwin, OH 43029 (740) 857-1311 www.rosedale.eduSoutheastern Business College Two-Year 1522 Sheridan Dr, Lancaster, OH 43130 (740) 687-6126 www.southeasternbusinesscollege.comTechnology Education College Two-Year 2745 Winchester Pike, Columbus, OH 43232 (614) 456-4600 teceducation.comThe Spa School Two-Year 5050 N High, Columbus, OH 43214 (614) 252-5252Trinity Lutheran Seminary Four-Year 2199 E Main St, Columbus, OH 43209 (614) 235-4136 www.trinitylutheranseminary.eduUniversity of Phoenix-Columbus Ohio Campus Four-Year 8415 Pulsar Place, Columbus, OH 43240 (614) 443-0095 www.phoenix.eduSource: Integrated Postsecondary Edcucational Data System (IPEDS), College Opportunities Online (COOL)http://nces.ed.gov/collegenavigator
29

Appendix F: Degree Completions by Program Class for Economic Development Region 1
Program Class2005 Completions 2006 Completions
Assoc. Degrees
Bachelor's Degrees
Master's Degrees
Doctoral Degrees
First-Prof. Degrees
Assoc. Degrees
Bachelor's Degrees
Master's Degrees
Doctoral Degrees
First-Prof. Degrees
Agriculture, Agriculture Operations and Related Sciences 339 47 31 290 45 30Natural Resources and Conservation 117 16 2 107 8 6Architecture and Related Services 100 53 112 60 3Area, Ethnic, Cultural and Gender Studies 97 18 78 14Communication, Journalism and Related Programs 669 58 6 803 77 4Communications Technologies/Technicians and Support Services 28 51Computer and Information Sciences and Support Services 116 566 88 9 145 511 59 17Personal and Culinary Services 15 22Education 15 596 783 91 7 574 790 112Engineering 760 282 86 777 245 118Engineering Technologies/Technicians 312 188 11 4 269 122 8 3Foreign Languages, Literatures and Linguistics 28 292 66 32 23 279 58 22Family and Consumer Sciences/Human Sciences 70 830 20 9 76 774 19 20Legal Professions and Studies 72 4 20 459 70 4 11 460English Language and Literature/Letters 411 39 10 482 45 11Liberal Arts and Sciences, General Studies and Humanities 551 78 7 576 79 14Library Science 1 1Biological and Biomedical Sciences 530 50 74 658 73 59Mathematics and Statistics 106 68 12 79 62 24Multi/Interdisciplinary Studies 2 180 2 4 4 169 9 6Parks, Recreation, Leisure and Fitness Studies 45 126 71 117Philosophy and Religious Studies 112 2 3 130 2 4Theology and Religious Vocations 12 47 33 85 10 45 28 81Physical Sciences 112 44 48 114 44 60Psychology 660 24 27 679 17 41Security and Protective Services 73 15 154 10Public Administration and Social Service Professions 13 137 237 4 22 141 202 4Social Sciences 1 1,632 91 39 1,707 93 37Transportation and Materials Moving 42 54Visual and Performing Arts 697 91 25 758 123 17Health Professions and Related Clinical Sciences 575 757 360 47 618 741 942 395 44 627Business, Management, Marketing and Related Support Services 531 3,402 1,137 8 505 3,406 1,301 9History 265 21 20 295 21 14Total, All Programs 2,459 13,868 3,668 591 1,162 2,746 14,297 3,823 665 1,168Source: Integrated Postsecondary Edcucational Data System (IPEDS), College Opportunities Online (COOL)http://nces.ed.gov/collegenavigator
30

State of Ohio Department of Job and Family Services
Office of Workforce Development Bureau of Labor Market Information
Ted Strickland, Governor Helen E. Jones-Kelley, Director
(10/2007)
ODJFS is an Equal Opportunity Employer and Service Provider
The Workforce Research Section, under the direction of Labor Economist Larry Less, was responsible for the composition of this report. Labor Market Analyst Jonathan Calig was primarily responsible for production. Thanks are extended to the many other analysts who developed and reviewed the data presented herein. This publication was prepared under the supervision of Labor Market Information Bureau Chief Keith Ewald and Assistant Bureau Chief Rudy Wilkinson.
This report was prepared by the Ohio Department of Job and Family Services, Office of Workforce Development. For further information, visit our website at http://lmi.state.oh.us or contact the Ohio Bureau of Labor Market Information at 1-888-2WORK-411 or 1-888-296-7541.
Office of Workforce DevelopmentP.O. Box 1618Columbus, OH 43216-1618
Bureau of Labor Market Information Business Principles for Workforce Development
Partner with the workforce and economic development community.
Develop and deploy new information solution tools and systems for the workforce and economic development community.
Provide products that are customer and demand driven.
Be known as an important and reliable source for information solutions that support workforce development goals and outcomes.