Embed Size (px)
Citation preview

2005 IEEE International Symposium on Cluster Computing and the Grid
Performance Metrics and Ontology for Describing Performance Data of GridWorkflows *
Hong-Linh TruongInstitutefor Software Science,
University of [email protected]
Thomas Fahringer, Francesco NerieriInstitutefor Computer Science,
University ofInnsbruck{tfJfnero} @dps.uibk.ac.at
Schahram DustdarInformation Systems Institute, Vienna University of Technology
dustdar@ infosys. tuwien. ac.at
Abstract
To understand the performance ofGrid workflows, perfor-mance analysis tools have to select, measure and analyzevarious performance metrics of the workflows. However;there is a lack of a comprehensive study of performancemetrics which can be used to evaluate the performance ofaworkflow executed in the Grid. This paper presents perfor-mance metrics that performance monitoring and analysistools should provide during the evaluation of the perfor-mance ofGrid workflows. Performance metrics are associ-ated with many levels of abstraction. We introduce an on-tologyfor describing performance data ofGrid workflows.We describe how the ontology can be utilizedfor monitor-ing and analyzing the performance ofGrid workflows.
1. Introduction
Recently, increased interest can be witnessed in exploit-ing the potential of the Grid for workflows, especially forscientific workflows, e.g. [15, 2, 8]. As the Grid is di-verse, dynamic and inter-organizational, the execution ofGrid workflows is very flexible. This requires performancemonitoring and analysis tools to collect, measure and ana-lyze metrics that characterize the performance and depend-ability of workflows at many levels of detail in order to de-tect components that contribute to performance problems,and correlations between them.
To understand the performance and dependability ofGrid workflows, performance metrics of the workflowshave to be studied and defined. However, there is a lack ofacomprehensive study of useful performance metrics which
*The work described in this paper is supported in part by the AustrianScience Fund as part of the Aurora Project under contract SFBF1 104 andby the European Union through the IST-2002-51 1385 project K-WfGrid.
can be used to evaluate the performance of workflows exe-cuted in the Grid. Only a few metrics are supported in mostexisting tools and most of metrics are being limited to theactivity (task) level. Moreover, performance data of work-flows not only is used for reasoning performance problemsbut also needs to be shared because various other tools,such as workflow composition tools, schedulers and opti-mization tools, require the performance data. Therefore, anontology describing performance data of workflows is im-portant because the ontology will facilitate the performancedata sharing and can be used to explicitly describe conceptsassociated with workflow executions.
Previously, we have developed an ontology to describeperformance data of Grid applications [18]. This paper ex-tends our previous work to study performance metrics ofGrid workflows and to describe performance data of theGrid workflows. We propose an extended set of perfor-mance metrics associated with multiple levels of abstrac-tion; these metrics characterize the performance of Gridworkflows. Proposed performance metrics are describedin a metric ontology. We then introduce an ontology whichcan be used to describe performance data of Grid work-flows. The ontology is intended to establish a common un-derstanding about the performance of Grid workflows thusit can be shared and used by various tools and services.
The rest of this paper is organized as follows: Section2 discusses the workflow and workflow execution model.Section 3 presents performance metrics for workflows. Weintroduce an ontology for describing performance data ofworkflows in Section 4. We discuss the use of the ontologyfor performance analysis of Grid workflows in Section 5.Related work is outlined in Section 6. We summarize thepaper and give an outlook to the future work in Section 7.
0-7803-9074-1/05/$20.00 ©2005 IEEE 301

I Execute a workflow If1". *1 ,
Grid siteScheduler!d
IUDMieinvoKenappritcnaon
I Invokedr anolica:tion hstrtedExecution of aworkflow Execution of an
activity instance
Execution of the workflow Execution of ttcompleted ! application ci
Computationa NodeScheduler
~-Execute an application process
Execution of an Execution of aninvoked application application process
[ Execution of the application:ompleted process completed
Figure 1. Hierarchical structureview of a workflow.
2. Workflow Model
2.1. Hierarchical Structure View of a Workflow
Figure 1 presents the hierarchical view of a workflow(WF). A WF consists ofWF constructs. Each WF constructconsists of a set of activities. Two activities can depend on
each other. The dependency between two activities can bedata dependency or control dependency. Each activity isassociated with a set of invoked applications. Each invokedapplication contains a set of code regions.
WF constructs can be fork-join, sequence, do loop, etc.More details of existing WF constructs can be found in[1]. Each activity is associated with one or multiple in-voked application(s). An invoked application can be an ex-
ecutable program (e.g., an MPI program) or a service op-eration (e.g., of Web Service). Invoked applications can
be executed in sequential or parallel manner. An invokedapplication is considered as a set of code regions; a coderegion ranges from a single statement to an entire programunit. A code region can be a function call, a remote service
call, a do loop, an if-then-else statement, etc.
2.2. Workflow Execution
A Grid environment is viewed as a set of Grid sites. AGrid site is comprised of a set of grid services within a
single organization. A Grid site consists of a number ofcomputational nodes (or hosts) that share a common secu-
rity domain and exchange data through a local network. Acomputational node can be any computing platform, from a
single-processor workstation to an SMP (Symmetric Multi-Processor) node to an MPP (Massively Parallel Process-ing) system. Each computational node may have single or
multiple processor(s). On each computational node, therewould be multiple application processes executed, eachprocess may have multiple threads of execution.
Figure 2. Execution model of a workflow.
Figure 2 presents the execution sequence of a WF. Theuser submits a WF to the workflow management system(WfMS). The WfMS instantiates activities. When execut-ing an activity instance, the WfMS locates a Grid site andsubmits the invoked application of the activity instance tothe scheduler of the Grid site. The Grid site scheduler lo-cates computational nodes and executes processes of theinvoked application on corresponding nodes.
2.3. Activities Execution Model
The execution of an activity a is represented by the dis-crete process model [14]. Let P(a) be a discrete process
modeling the execution of activity a (hence, we call P(a)the execution status graph of an activity). A P(a) is a di-rected, acyclic, bipartite graph (S,E,A), in which S is a setof nodes representing activity states, E is a set of nodesrepresenting activity events, and A is a set of edges repre-
senting ordered pairs of activity state and event. Simplyput, an agent (e.g. workflow invocation and control) causesan event (e.g. execute an activity) that changes the activitystate (e.g. from queuing to processing), which in turn influ-ences the occurrence and outcome of the future events (e.g.active, failed). Figure 3 presents an example of a discreteprocess modeling the execution of an activity.
Event Name Descriptionactive indicate the activity instance has been started to process its
work.completed indicate the execution of the activity instance has completed.suspended indicate the execution of the activity instance is suspended.
failed indicate the execution of the activity instance has been stoppedbefore its normal completion.
submitted indicate the activity has been submitted to the scheduling sys-tem.
Table 1. Example of event names.
Each state s of an activity a is determined by two events:leading event ei, and ending event e1 such that ei, ej E E,s E S, and (ei,s),(s,ej) E A of P(a). To denote an event
302
IgWkg2l
hmit innlndnnrlireswinn _ . .. ~~~~~~~~~~~~~~~~~~~~~~~~~~~IS-
III
II
II

Figure 3. Discrete process model for the execution of an activity. = represents a state, 0 represents an event.Category Metric Name DescriptionExecution time ElapsedTime The elapsed time of the code region.
UserCPUTime CPU time spent on user modeSystemCPUTime CPU time spent on system modeCPUTime CPU consumption time. This metric includes CPU times spent on user and system mode.SerialTime The time spent on seralization and deserialization data.EncodingTime The time spent on encoding and decoding data.
Counter L2_TCM. L2_TCA. etc. Hardware counters. The exact number of hardware counters is dependent on specific platforis.NCalls The number of executions of the code region.NSubs The number of executions of sub regions of the code region.SendMsgCount The number of messages sent by the code region.RecvMsgCount The number of messages received by the code region.
Data movement TotalCommTime Communication time.TotalTransSize Size of total data transfered (send and receive).
Synchronization ExclSynTime Single-address space exclusive synchronization.CondSynTime Condition synchronization.
Ratio MeanElapsedTime Mean elapsed time per execution of the code region.CommPerComp Communication per computation.MeanTransRate Mean of transfer rate.MeanTransSize Transfered data size per number of transfers.CacheMissRatio.MLOPS. etc. Ratio metrics computed based on hardware counters.
Temporal overhead octrp.olopa, etc. This type of metrics is defined only for code regions of parallel programs.
Table 2. Performance metrics at code region level.
name ofP(a) we use ename (a); Table 1 presents a few eventnames which can be used to describe activity events. Weuse t(e) to refer to the timestamp of an event e and t,o0 todenote the timestamp at which the analysis is conducted.Because the monitoring and analysis of Grid workflows isnormally conducted at runtime, it is possible that an activitya is on a state s but there is no such (s,e) E A of P(a).When analyzing such state s, we use t,,Ow as a timestamp todetermine the time spent on state s. The happened beforerelation between events is denoted by -+.
3. Performance Metrics of Grid Workflows
The task of performance monitoring and analysis ofGrid WFs is to collect and analyze performance metrics re-lated to the WFs. Interesting performance metrics of WFsare associated with many levels of abstraction. We classifyperformance metrics according to five levels of abstraction,from lower to higher level, including code region, invokedapplication, activity, workflow construct and workfiow.
In principle, from performance metrics of a lower-level, similar metrics can be constructed for the immediatehigher-level by using various aggregate operators such assum and average. For example, the communication spentin one application may be defined as the sum of communi-cation spent on its code regions. Exact aggregate methodsare dependent on specific metrics and their associated lev-els. In the following sections we present performance met-rics with their associated levels. For a higher-level, we willnot show metrics that can be aggregatedfrom that of thelower-level. Instead, we discuss new metrics which appearat the higher level or an existing metric but it requires a dif-ferent computing method at different levels of abstraction.
3.1. Metrics at Code Region Level
Table 2 presents performance metrics of code regions.Performance metrics are categorized into: execution time,counter, data movement, synchronization, ratio and tempo-ral overhead.
Execution time metrics include total elapsed time (wall-clock time or response time)', user CPU time, system CPUtime, etc. Counter metrics include hardware counters (e.g.L2 cache misses, the number of floating point instructions)and other counters such as the number of calls. Data move-ment metrics characterize the data movement such as com-
munication time and exchanged message size. Synchro-nization metrics describe time spent on the synchronizationof executions, such as critical section, condition synchro-nization, etc. Various ratio metrics can be defined based onexecution time and counter metrics.
If the invoked application is a parallel application (e.g.,MPI and OpenMP applications), we can compute temporaloverhead metrics for code regions. Overhead metrics are
based on a classification of temporal overheads for parallelprograms [17]. Examples of overhead metrics are controlof parallelism, loss of parallelism, etc.
3.2. Metrics at Invoked Application Level
Most performance metrics at code region level can beprovided at invoked application level by using aggregateoperators. Table 3 presents extra performance metrics as-
'Elapsed time, wall-clock time, and response time indicate the latencyto complete a task (including 10, waiting time, computation, ...). Theseterms are used interchangeably. In this paper, the term ElapsedTime refersto elapsed time or response time or wall-clock time.
303

sociated with invoked applications.
Category Metric Name DescriptionExecution ElapsedTime The elapsed time of the invoked applica-time tion.
ExecDelay The delay between when the Grid sched-uler receives a request for creating a newinstance of the invoked application andwhen the instance is created.
Counter NCalls The number of executions of the invokedapplication.
Performance SpeedupFactor Speedup factor between executions of theimprovement same application.
Table 3. Performance metrics at invoked applicationlevel.
Let A be an invoked application. Let ElapsedTimei(A)and ElapsedTimej(A) be elapsed times ofA in executionsi and j, respectively. The speedup factor of execution i overexecution j is defined by
SpeedupFactor= ElapsedTimei(A) (1)ElapsedTimej(A)
3.3. Metrics at Activity Level
Table 4 presents metrics measured at activity level. Per-formance metrics can be associated with activities and ac-tivity instances.
Execution time metrics includes end to end responsetime, processing time, queuing time, suspending time,etc. The processing time of an activity instance a,ProcessingTime(a), is defined by
ProcessingTime(a) = t(ecompleted (a)) - t(eactive (a)) (2)
if ecompleted (a) has not occurred, it means the execution ofa has not completed, processing time is defined by
ProcessingTime(a) = tnow- t(eactive(a)) (3)
Synchronization metrics for an activity involves with theexecution of other activities it depends. Let pred(a) bethe set of the immediate predecessors of a; there is adata dependency or control dependency between a and anyai E pred(a). Vai E pred(a); i = 1,*** ,n; synchronizationdelay and execution delay from ai to a, SynDelay(ai, a) andExecDelay(ai, a), respectively, are defined by:
SynDelay(ai,a) = t(esbmitted (a)) -t(ecompleted (ai)) (4)
ExecDelay(ai, a) = t(eative (a)) - t(ecomple,ed (ai)) (5)
If eslibmitted (a) or eactive (a) has not occurred, synchroniza-tion or execution delay will be computed based on tnow.
Metrics associated with an activity are determined frommetrics of activity instances of the activity by using aggre-gate operators. Aggregated metrics of an activity give thesummarized information about the performance of the ac-tivity that can be used to examine the overall performanceof the activity.
Figure 4. A fork-join workflow construct.
3.4. Metrics at Workflow Construct Level
Table 5 presents performance metrics at WF constructlevel. The load imbalance is associated with fork-join WFconstructs. A fork-join WF construct is shown in Figure 4.Load imbalance, LoadIm, is defined by
Loadlm(ai) =ProcessingTime(ai) - l (ProcesskngTime(a,))Speedup factor for a fork-join construct is defined by
SpeedupFactor =ProcessingTime, (a,)
maxnLI (ProcessingTime,, (ai))
(6)
(7)
where ProcessingTime,,(ai) is the processing time of ac-tivity ai in the fork-join version with n activities andProcessingTimel (ai) is the processing time of activity ain the version with a single activity. Load imbalance andspeedup factor metrics can also be computed for fork-joinstructures of structured block of activities. A structuredblock is a single-entry-single-exit block of activities. Inthis case, ProcessingTime,,(ai) will be the processing timeof a structured block in a version with n blocks.
Let SG be a graph of WF construct C. Let Pi =<aiai2,- - ,ai,, > be a critical path from starting nodeto the ending node of of SG. The elapsed time ofC, ElapsedTime(C), and the processing time of C,ProcessingTime(C), are defined as
n
ElapsedTime(C) =- ElapsedTime(aik)k=l
nProcessingTime(C) = 1; ProcessingTime(aik)
k=l
(8)
(9)
Now, let Cg and Ch be WF constructs of a workflow-basedapplication; Cg and Ch may be identical construct but beexecuted on different resources at different times. Speedupfactor ofCg over Ch, SpeedupFactor(Cg, Ch), is defined by
SpeedupFactor(Cg,Ch) = ProcessingTime(Cg) (10)ProcessingTime(Ch,)
3.5. Metrics at Workflow Level
Table 6 presents performance metrics of interest at WFlevel. Let Pi =< ail,ai2,. ,ai,, > be a critical path fromstarting node to the ending node of a WF G. The elapsed
304
Category Metric Name DescriptionExecution time ElapsedTime End-to-end response time of an activity instance.
ProcessingTime The time an activity spends on the processing. Processing time includes both communication and computation times.QueuingTime The time an activity is on queuing system.SuspendingTime The time an activity spends on suspended state.SharedResTime The period of time on which the activity has to share the resource with other activities.
Counter NCalls The number of invocations of an activity.InTransSize Size of total data transfered to the activity per data dependency.OutTransSize Size of total data transfered from the activity to another.
Ratio Throughput The number of successful activity instances over time.MeanTimePerState The mean time that an activity spent on a state.TransRate Data transfer rate per data dependency.
Synchronization SynDelay Synchronization delay.ExecDelay Execution delay.
Performance improvement SlowdownFactor Slowdown factor is the ratio of ElapsedTime to ProcessingTime.
Table 4. Performance metrics at activity level.Category Metric Name DescriptionExecution time ElapsedTime The latency from the time the workflow construct starts until the time the workflow construct finishes.
ProcessingTime The actually portion of elapsed time that the workflow construct spends on processing.Counter RedundantActivity The number of activity instances whose processing results are not utilized (e.g. in a discriminator construct).
NIteration The number of iterations of a loop construct.Ratio MeanElapsedTime The average elapsed time per activity of the workflow construct.
PathSelectionRatio Percent of the selection of a path at a choice construct.Load balancing Loadlm Load imbalance between activity instances of a fork-join construct.Performance improvement SpeedupFactor Speedup factor.Resource RedundantProcessing The time spent to process some work but finally the work is not utilized.
Table 5. Performance metrics at workflow construct level.
time of G, ElapsedTime(G), and the processing time ofG, ProcessingTime(G), are defined based on Equation 8and 9, respectively. Speedup factor of WF G over WF H,SpeedupFactor(G, H), is defined by
SpeedupFactor(G, H) = ProcessingTime(G)ProcessingTime(H) (1
Let ProcInRes(Ri) be the processing time consumed by re-source Ri. Load imbalance at resource Ri, LoadImRes(Ri)is defined by
LoadImRes(R1) = PronRes(R) - (ProcnRes(R1))
3.6. Metric Ontology
{ hasMetricNane thasUnit / inLevel hasDescription"hasSynonym
Figure 5. Description of a WF performance metric.
Performance metrics introduced above are described inan ontology named WfMetricOnto. A metric is describedby class WfMetric. Figure 5 presents the concept WjMetric.WJMetric has five properties: hasMetricName specifies themetric name. Property hasSynonym specifies other namesof the performance metric. Property hasUnit specifies themeasurement unit of the metric. Property inLevel specifiesthe level with which the metric is associated. Property has-Description explains the performance metric.
4. Ontology for Describing Performance Dataof Grid Workflows
We develop an ontology named WfPerfOnto for de-scribing performance data of workflows; WfPerfOnto isbased on OWL [1I1]. This section just outlines main classesand properties of WfPerfOnto shown in Figure 6.
Workflow describes the workflow (WF). A WF has WEconstructs (represented by hasWorkflowConstruct prop-erty), WF graph, etc. AWF construct is described by Work-flowConstruct. Each WF construct has activities (hasActiv-ity), activity instances (hasActivityInstance), WF constructgraph, sub WF constructs, etc.
Activity describes an activity of a WF. ActivityInstancedescribes an activity instance. Each ActivityInstance, exe-cuted on Resources, has an execution graph described byclass ExecutionGraph. An execution graph consists of Ac-tivityState and ActivityEvent describing activity state andevent, respectively. The dependency (control or data) be-tween two activity instances is described by Dependency.An activity instance is an object or a subject of a depen-dency; the objectdepends on the subject. Activity instanceshave invoked applications (hasInvokedApplication).
InvokedApplication describes an invoked application ofan activity. Each InvokedApplication is associated with aSIR [ 13], which represents the structure of the application,with a DRG, which represents the dynamic code region callgraph [17], and with events occurred inside the application.
The dynamic code region call graph, described by DRG,consists of region summaries, each stores summary perfor-mance measurements of an instrumented code region in aprocessing unit. A processing unit, described by Processin-
305

Table 6. Performance metrics at workflow level.
, ' hasWorkllowConstruct
Wor 9,lowC hasWorktlowConstruct
, _ I hasActivity
I hasActivitylnstance 2
I ' ofActivity has nstance
nstane
haslnvokedApplicationt hasExecutionGraph hasSubject isObjectOf isExecutedOn /
\ 3 EectionGray / hasPertMetric
represensBy,' hasDROi hasEvent hasActivityEvent hasActivityState \ hasPertMetric
43 <G3 hasPert4etrici
hasRegionSummary \hasEventAttr \ hasPertMetric \hasEventAtr hasPertTMetric
> ~~~ ~~ ~~ ~~t - _ \~~~~~I /IhasChildRS n t
inProcessingUnit - -hasPertMetric _ - -
Fiuenolg-fr -ecib pefracedt f - w _ _ fo sFigure 6. Ontology for describing performance data of workflows.
11NI
hasPertMetricI
I
II
I
gUnit, indicates the context in which the code region is ex-
ecuted; the context contains information about the activityidentifier, computational node, process identifier and threadidentifier. A region summary, described by RegionSum-mary has performance metrics (hasPerfMetric) and sub re-
gion summaries (hasChildRS). PerfMetric describes a per-
formance metric, each metric has a name and value. Themetric name is in WFMetricOnto. Event describes an
event record. An event happens at a time and has eventattributes (hasEventAttr). EventAttribute describes an at-tribute of an event that has an attribute name and value.
Performance metrics of Workflow, WorkflowConstruct,Activity, Dependency, ActivityInstance, InvokedApplica-tion, and RegionSunmnary are determined through hasPerf-Metric property.
5. Utilizing WfPerfOnto for PerformanceAnalysis of Grid Workflows
5.1. Describing Performance Data
A performance analysis tool can use WfPerfOnto to de-scribe performance data of a workflow. For example, whena client of the performance analysis service requests per-
formance results of a workflow, the client can specify therequests based on WfPerfOnto (e.g., by using RDQL [9]).The service can use WfPerfOnto to express performancemetrics of the workflow. As performance results are de-scribed in a well-defined ontology, the client will easilyunderstand and utilize the performance results.
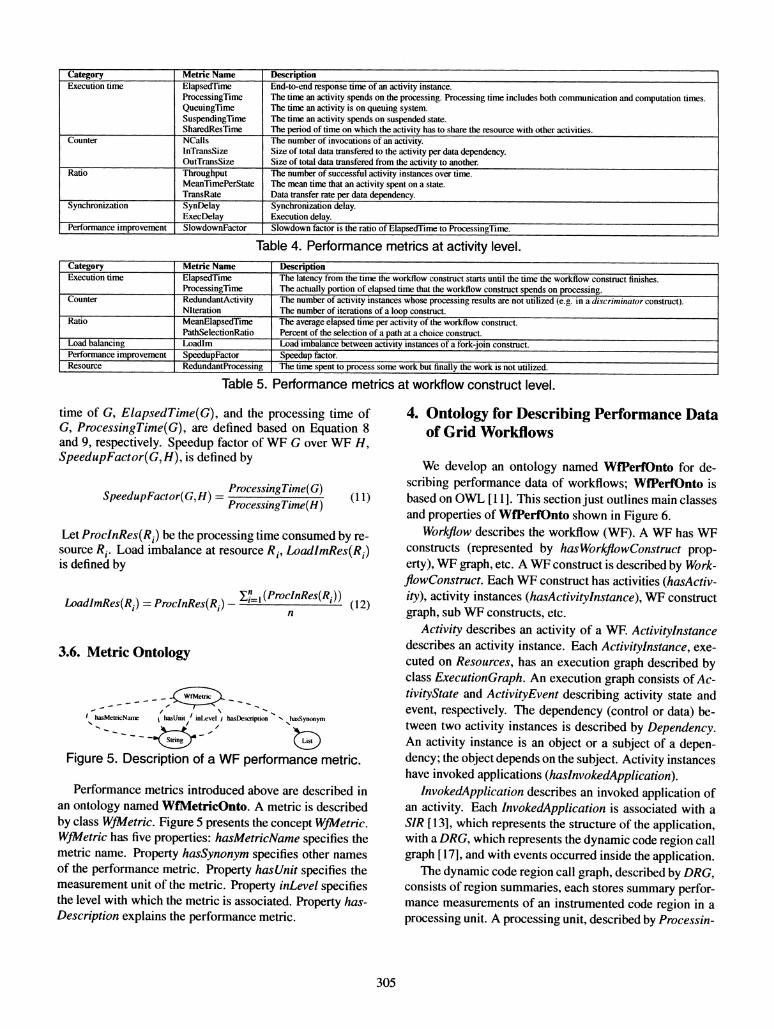
Figure 7 presents an example of a workflow namedMontage. Dependencies between activities are controldependencies. Figure 8 represents part of the perfor-mance data of Montage described in WfPerfOnto. Theperformance experiment is executed on two resources.
At the top-level, the workflow consists of two work-flow constructs, a fork-join construct named ForkJoin2and a sequence construct named Seq. The fork-joinconstruct can be considered as two sequence constructsnamed SeqlForkJoin2 and Seq2ForkJoin2. Activ-ity mImgtbl2 has two dependencies. Figure 8 presentssome interesting performance metrics associated withmImgtbl2 such as ElapsedTime and SynDelay.
Although WfPerfOnto does not describe (dynamic)monitoring data of resources on which invoked applicationsof a workflow are executed, from information described inWfPerfOnto, e.g., activity events and resource identifiers,
306
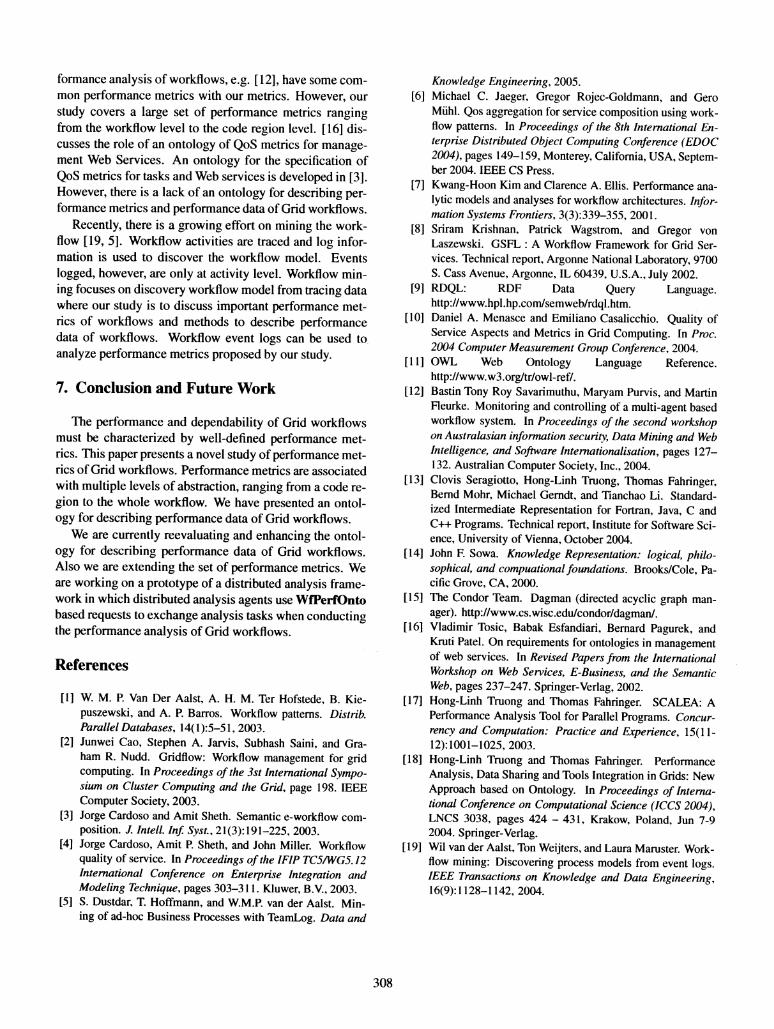
Category Metric Name DescriptionExecution tame ElapsedTime The latency from the time the workflow starts until the time the workflow finishes.
ProcessingTime The actually portion of elapsed time that the workflow spends on processing.ParTime The portion of processing time that workflow activities executed in parallel.SeqTime The portion of processing time that workflow activities executed in sequential manner.
Ratio QueuingRatio Mean queuing time per elapsed time.MeanProcessingTime Mean processing time per activity.MeanQueuingTime Mean queuing time per activity.ResUtilization Time that a resource spends on processing work per elapsed time of the workflow.
Correlation NAPerRes The number of activities executed on a resource.ProclnRes The period of time that a resource spends on processing work.LoadImRes Load imbalance between processing time of resources.
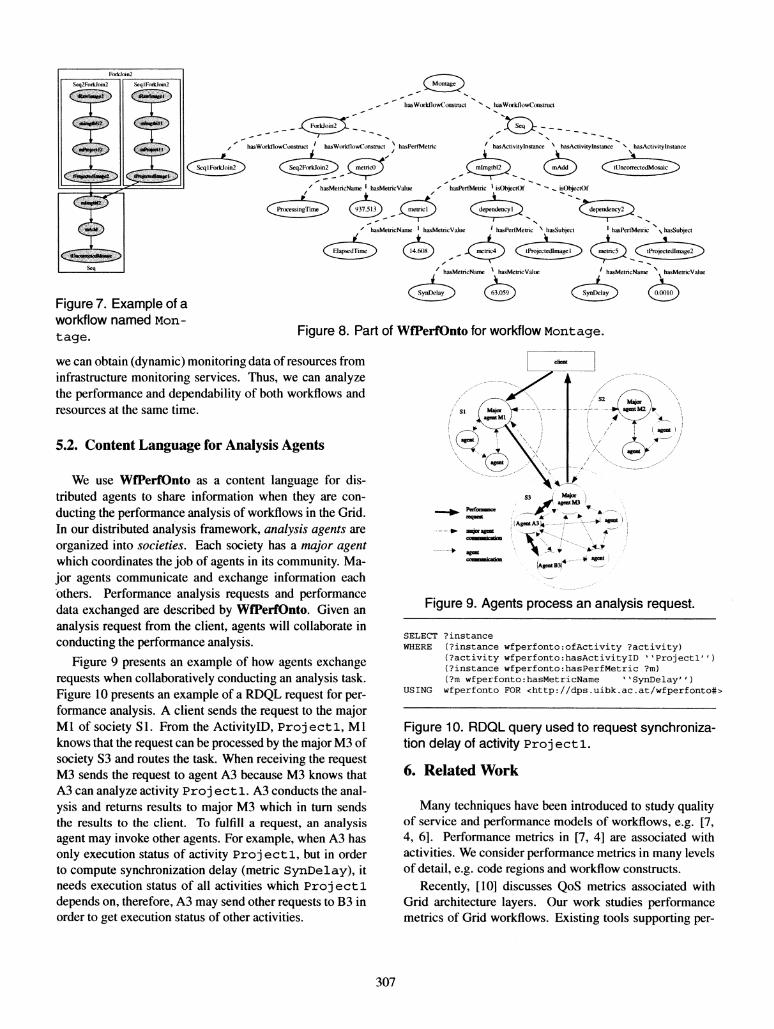
Figure 7. Example of aworkflow named Mon-tage.
hasWorktlowConstruct hasWorktlowConstrucs
- hasWorldlowConstruct hasWorfdlowConstruct hasPertMetric / hasActivitylnstance hasActivityinstance ' hasActivityinstance
3oi <Wnn2 ( AhasMetricName hasMetricValue hasPertetric isObjectOt sObjectOf
depeneyl ~ ~ ~ dpedecy
' hasMetricNamne hasMetricValue hasPertMetric \ hasSubject hasPertMetric hasSubject
/ hasMetricName \ hasMetricValue hasMetricName hasMetricValue
Figure 8. Part of WfPerfOnto for workflow Montage.
we can obtain (dynamic) monitoring data of resources frominfrastructure monitoring services. Thus, we can analyzethe performance and dependability of both workflows andresources at the same time.
5.2. Content Language for Analysis Agents
We use WfPerfOnto as a content language for dis-tributed agents to share information when they are con-ducting the performance analysis of workflows in the Grid.In our distributed analysis framework, analysis agents areorganized into societies. Each society has a major agentwhich coordinates the job of agents in its community. Ma-jor agents communicate and exchange information eachothers. Performance analysis requests and performancedata exchanged are described by WfPerfOnto. Given ananalysis request from the client, agents will collaborate inconducting the performance analysis.
Figure 9 presents an example of how agents exchangerequests when collaboratively conducting an analysis task.Figure 10 presents an example of a RDQL request for per-formance analysis. A client sends the request to the majorMI of society SI. From the ActivityID, Projecti, Mtknows that the request can be processed by the majorM3 ofsociety S3 and routes the task. When receiving the requestM3 sends the request to agent A3 because M3 knows thatA3 can analyze activity Proj ectl. A3 conducts the anal-ysis and returns results to major M3 which in turn sendsthe results to the client. To fulfill a request, an analysisagent may invoke other agents. For example, when A3 hasonly execution status of activity Project 1, but in orderto compute synchronization delay (metric SynDelay), itneeds execution status of all activities which Project 1depends on, therefore, A3 may send other requests to B3 inorder to get execution status of other activities.
Si~~~~~~de
lg_ 'Ml
(AgetA
..
SKr- age
Peufiormu Ml,J ago
AgeMA3ica o4 geM
--*~~~~~~~~~~~~S lrjrgaMV
tAseBiaget
M -----------
V .
eatM2
vge-
Figure 9. Agents process an analysis request.
SELECT ?instanceWHERE (?instance wfperfonto:ofActivity ?activity)
(?activity wfperfonto:hasActivityID ''Projectl'')(?instance wfperfonto:hasPerfMetric ?m)(?m wfperfonto:hasMetricName ''SynDelay'')
USING wfperfonto FOR <http://dps.uibk.ac.at/wfperfonto#>
Figure 10. RDQL query used to request synchroniza-tion delay of activity Proj ect 1.
6. Related Work
Many techniques have been introduced to study qualityof service and performance models of workflows, e.g. [7,4, 6]. Performance metrics in [7, 4] are associated withactivities. We consider performance metrics in many levelsof detail, e.g. code regions and workflow constructs.
Recently, [10] discusses QoS metrics associated withGrid architecture layers. Our work studies performancemetrics of Grid workflows. Existing tools supporting per-
307
formance analysis of workflows, e.g. [ 12], have some com-mon performance metrics with our metrics. However, ourstudy covers a large set of performance metrics rangingfrom the workflow level to the code region level. [16] dis-cusses the role of an ontology of QoS metrics for manage-ment Web Services. An ontology for the specification ofQoS metrics for tasks and Web services is developed in [3].However, there is a lack of an ontology for describing per-formance metrics and performance data of Grid workflows.
Recently, there is a growing effort on mining the work-flow [19, 5]. Workflow activities are traced and log infor-mation is used to discover the workflow model. Eventslogged, however, are only at activity level. Workflow min-ing focuses on discovery workflow model from tracing datawhere our study is to discuss important performance met-rics of workflows and methods to describe performancedata of workflows. Workflow event logs can be used toanalyze performance metrics proposed by our study.
7. Conclusion and Future Work
The performance and dependability of Grid workflowsmust be characterized by well-defined performance met-rics. This paper presents a novel study of performance met-rics of Grid workflows. Performance metrics are associatedwith multiple levels of abstraction, ranging from a code re-gion to the whole workflow. We have presented an ontol-ogy for describing performance data of Grid workflows.We are currently reevaluating and enhancing the ontol-
ogy for describing performance data of Grid workflows.Also we are extending the set of performance metrics. Weare working on a prototype of a distributed analysis frame-work in which distributed analysis agents use WfPerfOntobased requests to exchange analysis tasks when conductingthe performance analysis of Grid workflows.
References
[1] W. M. P. Van Der Aalst, A. H. M. Ter Hofstede, B. Kie-puszewski, and A. P. Barros. Workflow patterns. Distrib.Parallel Databases, 14(1):5-51, 2003.
[2] Junwei Cao, Stephen A. Jarvis, Subhash Saini, and Gra-ham R. Nudd. Gridflow: Workflow management for gridcomputing. In Proceedings of the 3st International Sympo-sium on Cluster Computing and the Grid, page 198. IEEEComputer Society, 2003.
[3] Jorge Cardoso and Amit Sheth. Semantic e-workflow com-position. J. Intell. Inf: Syst., 21(3): 191-225, 2003.
[4] Jorge Cardoso, Amit P. Sheth, and John Miller. Workflowquality of service. In Proceedings of the IFIP TC5/WG5.12International Conference on Enterprise Integration andModeling Technique, pages 303-31 1. Kluwer, B.V., 2003.
[5] S. Dustdar, T. Hoffmann, and W.M.P. van der Aalst. Min-ing of ad-hoc Business Processes with TeamLog. Data and
Knowledge Engineering, 2005.[6] Michael C. Jaeger, Gregor Rojec-Goldmann, and Gero
Muhl. Qos aggregation for service composition using work-flow patterns. In Proceedings of the 8th International En-terprise Distributed Object Computing Conference (EDOC2004), pages 149-159, Monterey, California, USA, Septem-ber 2004. IEEE CS Press.
[7] Kwang-Hoon Kim and Clarence A. Ellis. Performance ana-
lytic models and analyses for workflow architectures. Infor-mation Systems Frontiers, 3(3):339-355, 2001.
[8] Sriram Krishnan, Patrick Wagstrom, and Gregor vonLaszewski. GSFL: A Workflow Framework for Grid Ser-vices. Technical report, Argonne National Laboratory, 9700S. Cass Avenue, Argonne, IL 60439, U.S.A., July 2002.
[9] RDQL: RDF Data Query Language.http://www.hpl.hp.com/semweb/rdql.htm.
[10] Daniel A. Menasce and Emiliano Casalicchio. Quality ofService Aspects and Metrics in Grid Computing. In Proc.2004 Computer Measurement Group Conference, 2004.
[11] OWL Web Ontology Language Reference.http://www.w3.org/tr/owl-ref/.
[12] Bastin Tony Roy Savarimuthu, Maryam Purvis, and MartinFleurke. Monitoring and controlling of a multi-agent basedworkflow system. In Proceedings of the second workshopon Australasian information security, Data Mining and WebIntelligence, and Software Intemationalisation, pages 127-132. Australian Computer Society, Inc., 2004.
[13] Clovis Seragiotto, Hong-Linh Truong, Thomas Fahringer,Bemd Mohr, Michael Gemdt, and Tianchao Li. Standard-ized Intermediate Representation for Fortran, Java, C andC++ Programs. Technical report, Institute for Software Sci-ence, University of Vienna, October 2004.
[14] John F. Sowa. Knowledge Representation: logical, philo-sophical, and compuationalfoundations. Brooks/Cole, Pa-cific Grove, CA, 2000.
[15] The Condor Team. Dagman (directed acyclic graph man-ager). http://www.cs.wisc.edu/condor/dagman/.
[16] Vladimir Tosic, Babak Esfandiari, Bernard Pagurek, andKruti Patel. On requirements for ontologies in managementof web services. In Revised Papers from the InternationalWorkshop on Web Services, E-Business, and the SemanticWeb, pages 237-247. Springer-Verlag, 2002.
[17] Hong-Linh Truong and Thomas Fahringer. SCALEA: APerformance Analysis Tool for Parallel Programs. Concur-rency and Computation: Practice and Experience, 15(1 1-12):1001-1025, 2003.
[18] Hong-Linh Truong and Thomas Fahringer. PerformanceAnalysis, Data Sharing and Tools Integration in Grids: NewApproach based on Ontology. In Proceedings of Interna-tional Conference on Computational Science (ICCS 2004),LNCS 3038, pages 424 - 431, Krakow, Poland, Jun 7-92004. Springer-Verlag.
[19] Wil van der Aalst, Ton Weijters, and Laura Maruster. Work-flow mining: Discovering process models from event logs.IEEE Transactions on Knowledge and Data Engineering,16(9):1128-1 142, 2004.
308