Embed Size (px)
Citation preview
Workflow Overhead Analysis and Optimizations Weiwei Chen Ewa Deelman
Information Sciences Institute, University of Southern California Marina del Rey, California
{wchen, deelman}@isi.edu
ABSTRACT The execution of scientific workflows often suffers from a variety of overheads in distributed environments. It is essential to identify the different overheads and to evaluate how optimization methods help reduce overheads and improve runtime performance. In this paper, we present an overhead analysis for a set of workflow runs on cloud and grid platforms. We present the overhead distributions and conclude that they satisfy an exponential or uniform distribution. We compare three methods to calculate the cumulative sum of the overheads based on how they overlap. In addition, we indicate how experimental parameters impact the overhead and thereby the overall workflow performance. We then show how popular optimization methods improve runtime performance by reducing some or all types of overheads.
Categories and Subject Descriptors F.2.0 [Theory of Computation]; Analysis of Algorithms and Problem Complexity
Keywords Algorithms, measurement, performance
Keywords Scientific workflow, workflow overhead, workflow optimization
1. INTRODUCTION Over the years, scientific workflows [1] have emerged as a paradigm for representing complex distributed scientific computations. The Pegasus Workflow Management System (Pegasus WMS) [2] is a framework for mapping complex workflows onto distributed resources such as grids and clouds. Internally, Pegasus generates executable workflows and then submits them to DAGMan [3] and Condor [4] for execution. Pegasus has been used to optimize runtime performance of various scientific applications in astronomy [5], biology [6], physics [7], and earthquake science [8] on dedicated clusters, and national cyberinfrastructure such as the TeraGrid [9] and the Open Science Grid [10]. Due to the distributed nature of these resources, the large number of tasks in a workflow, and the complex dependencies among the tasks, significant overheads can occur during workflow execution. In this paper we provide a detailed analysis of execution overheads using Pegasus WMS at both the job and the workflow level.
Such overheads may include: unusually large grid latencies, unpredictable waiting times on cluster queues, job status processing time, data staging, and others. The cumulative numbers and distributions of these overheads have a non-negligible influence on overall workflow performance. In this work we study the major overheads of queue delay, workflow
engine delay, job postscript delay, and data transfer delay. We use execution logs gathered from Pegasus and Condor to analyze these overheads. First, we identify the major overheads in workflows and describe how they are measured based on workflow and job events. We provide an integrated and comprehensive quantitative analysis of workflow overheads. The observation about overhead distribution and characteristics can help researchers build a more realistic model for simulations of real applications. Our analysis also offers guidelines for developing further optimization methods.
What distinguishes our work from others is that we develop three metrics to measure the workflow overheads. The execution time and overheads may occur at the same time frame during execution—we refer to that time as the overlap. We explain how the reduction and overlap of overheads improves workflow performance. Much research is underway to address issues of performance optimization. The most straightforward approach is to invest in hardware upgrade and reduce runtime, I/O latency or network latency; for example, replacing current machines with ones that have more CPU, memory, or storage resources. However, this approach results in higher IT expenses. Another solution includes a variety of makespan-centric DAG scheduling algorithms [11] and heuristics that have been proposed and analyzed. However, these algorithms focus on the runtime of computational or data transfer jobs. While scheduling remains an NP-hard problem, overhead analysis tools can play an important role in understanding workflow performance and developing new solutions. Among existing overhead reduction techniques are job clustering [12], job throttling [13], and data pre-staging [14] solutions. Our work takes a comprehensive look at the major overheads occurring in the workflow management system and the workflow execution. We propose three approaches to isolate and measure the influence of overheads on the overall workflow makespan.
2. RELATED WORK Scheduling algorithms and heuristics for workflows have been widely studied in recent years. Canon [11] and others have analyzed the robustness of 20 static, makespan-centric DAG scheduling heuristics and studied whether or not dynamically changing the order of tasks improves the robustness. In comparison, our work offers a detailed study of both the runtime of tasks and the overheads of the workflow management system and the execution environment.
Optimization techniques such as job clustering [12], job throttling [13], data pre-staging [14], and over-provisioning [15] reduce the impact of overheads in different ways. Kumar et al. [16] described an integrated framework to support performance optimizations along with multiple dimensions of the parameter space. They viewed workflow performance optimization as the search for a set of optimal values in a multi-dimensional parameter space based
WORKS’11, November 14, 2011, Seattle, Washington, USA. Copyright 2011 ACM 978-1-4503-1100-7/11/11...$10.00.
WORKS’11, November 14, 2011, Seattle, Washington, USA. Copyright 2011 ACM 978-1-4503-1100-7/11/11...$10.00.
on their QoS requirements. Our work helps identify which part of the overheads have reduced or overlapped with computation or other overheads.
Profiling [17] workflows enables users to quickly and explicitly understand their I/O characteristics, exploiting fine-grained interactions between activities. Our work provides a comprehensive view of overheads that includes queue delays, workflow engine delays, postscript delays, data transfer delays and others. Performance Monitoring and Analysis [18] tools assist users to verify and validate the status of their workflows and to offer useful information about grid services and resources. Parallel overhead [19] is the period when a thread is performing miscellaneous work other than executing the user’s computation. Measuring and attributing parallel overhead provides an understanding of why the performance of a multithreaded program does not improve with the number of cores is increased. However, that work focuses on multi-threaded programming models that use OpenMP [35] and requires libraries or compilers support. Our work does not require modifications to the application.
Overhead analysis [20][21] is a topic of great interest in the grid community. Stratan et al. [22] evaluates workflow engines including DAGMan/Condor and Karajan/Globus in a real-world grid environment. Their methodology focuses on five system characteristics: the overhead, the raw performance, the stability, the scalability and the reliability. They have pointed out that head node consumption should not be negligible and the main bottleneck in a busy system is often the head node. Our work further explains what overheads overwhelm the head node with quantitative analysis. Prodan et al. [20] offers a complete grid workflow overhead classification and a systematic measurement of overheads. In comparison with their work, (1) we focus on measuring the overlap of major overheads imposed by workflow management systems and execution environments; (2) we present a study of the distribution of overheads instead of just overall numbers; (3) we compare workflows running in different platforms (dedicated clusters, clouds, grids) and different environments (resource availability, file systems), explaining how they influence the resulting overheads; and (4) we analyze how existing optimization techniques improve the workflow runtime by reducing or overlapping overheads.
3. WORKFLOW EXECUTION MODEL 3.1 Workflows We model workflows as Directed Acyclic Graphs (DAGs), where each node represents a process or computation to be executed and directed edges represent data or control flow dependencies between the nodes. Pegasus compiles an abstract workflow (resource-independent) to an executable workflow (where appropriate resources are identified) and submits it to its workflow engine (DAGMan). The workflow engine starts from the root job(s) and then submits each job to a remote scheduler on a head node (if this job has all the parent jobs completed and the data dependencies are not violated). The local scheduler matches the job with a resource local to it and executes it. When the job is finished, the workflow engine executes a postscript to check the return status of the job. If the status is “success”, the workflow engine may release the next ready job. If the return status is “failed”, the job may be re-submitted and re-executed.
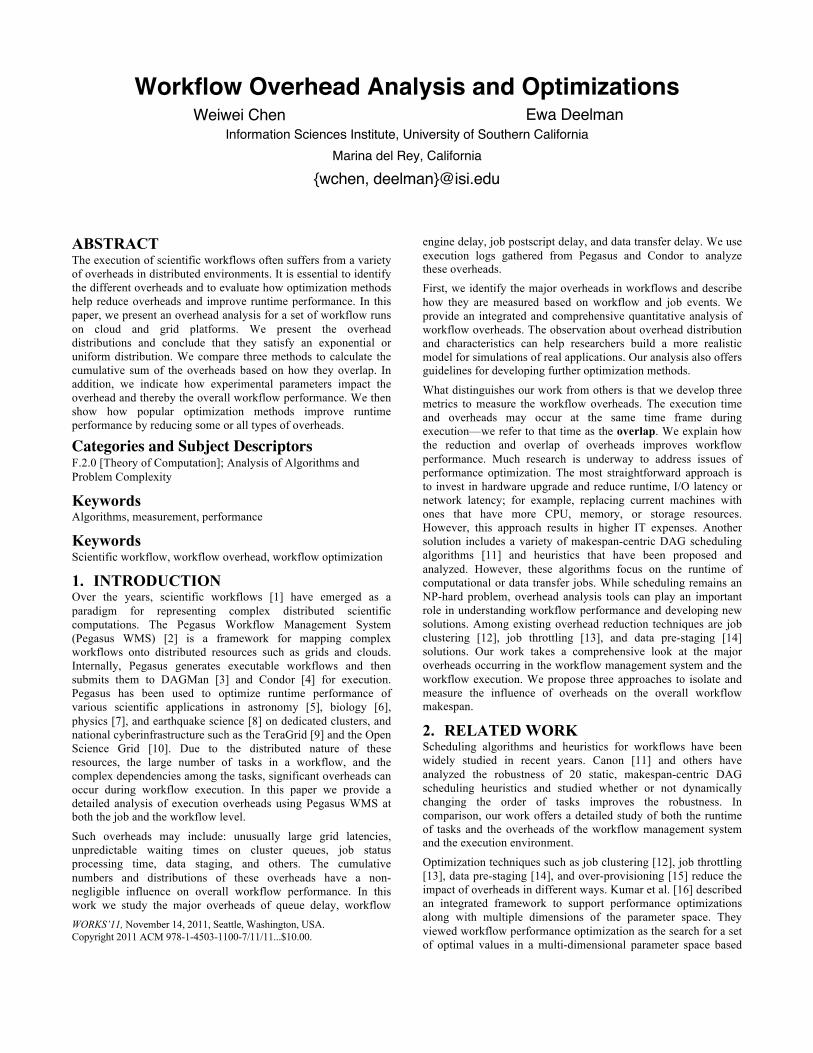
Figure 3.1 System Overview.
Figure 3.1 shows a typical cluster, with a head node visible to the outside network, a number of worker nodes and a data server. The submit host has Pegasus WMS installed (the Pegasus planner, the DAGMan workflow engine, and the Condor local scheduler). The remote scheduler is located at the head node of the cluster. Worker nodes are connected to the data server by NFS [34], or some other network file system. As jobs are executed, a wrapper script is launched to monitor and track the status of jobs.
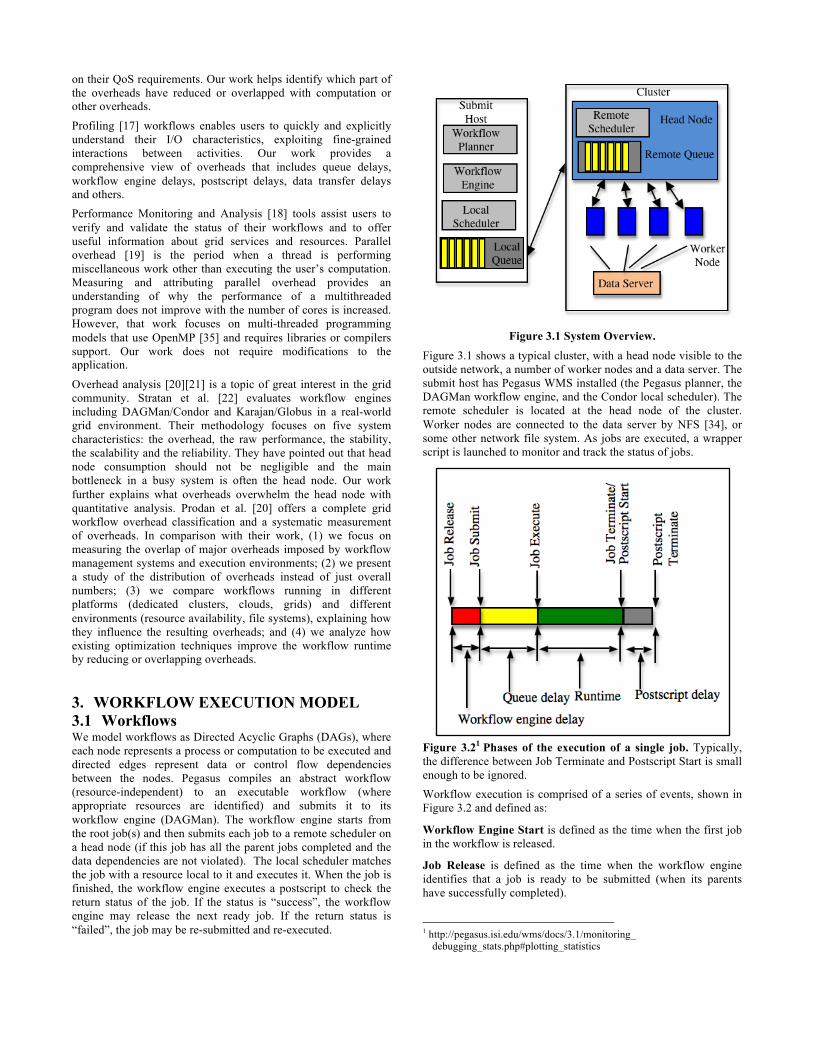
Figure 3.21 Phases of the execution of a single job. Typically, the difference between Job Terminate and Postscript Start is small enough to be ignored. Workflow execution is comprised of a series of events, shown in Figure 3.2 and defined as:
Workflow Engine Start is defined as the time when the first job in the workflow is released.
Job Release is defined as the time when the workflow engine identifies that a job is ready to be submitted (when its parents have successfully completed).
1 http://pegasus.isi.edu/wms/docs/3.1/monitoring_
debugging_stats.php#plotting_statistics
Job Submit is defined as the time when the workflow engine submits a job to the local queue.
Job Execute is defined as the time when the workflow engine sees a job is being executed.
Job Terminate is defined as the time when the workflow engine sees a job has finished and returned a status code.
Postscript Start is defined as the time when the workflow engine starts to execute the postscript.
Postscript Terminate is defined as the time when the postscript returns a status code (success or failure).
Workflow Engine Finished is defined as the time when the postscript completes.
Figure 3.2 shows a typical timeline of overheads and runtime in a compute job. We do not specify the data transfer delay in this timeline because data transfers are handled by data transfer jobs (stage-in and stage-out jobs), which are subject to the similar overheads as the compute jobs.
3.2 Overheads An overhead is defined as the time of performing miscellaneous work other than executing the user’s computational activities. In Prodan et al. [20] define “an ideal scenario” as the case with infinite resources available for execution. However, in our work, we define the ideal case when the runtime of jobs has occupied the timeline of each node without any idle block (overhead). In our experiments, resources are all statically provisioned. Our ideal case is closer to a real execution case with resource constraints. In addition, we focus on reducing and overlapping overheads in order to improve performance through increases in efficiency.
Based on the events illustrated in Figure 3.2 we identify the following overheads:
Workflow engine delay measures the time between when the last parent job of a job completes and the time when the job gets submitted to the local queue. In case of retries the value of the last retry is used for the calculation. Since we use a DAG model to represent workflows, the completion time of the last parent job means this job is released to the ready queue and waiting for resources to be assigned to it. The workflow engine delay reflects the efficiency of a workflow engine (in our experiments, DAGMan).
Queue delay is defined as the time between the submission of a job by the workflow engine to the local queue and the time the local scheduler sees the job running (potentially on remote resources). This overhead reflects the efficiency of the local scheduler (in our experiment, Condor) to execute a job and the availability of resources for the job’s execution. The queue delay is an estimate of the time spent in the Condor queue on the submit host. In case of retries the value is the cumulative of all the retries.
Postscript delay is the time taken to execute a lightweight script under Condor to examine the status code of a job after the computational part of the job is done.
Data transfer delay happens when data is transferred between nodes. It includes three different types of processes: staging data in, cleaning up, and staging data out. Stage-in jobs transfer input files from source sites to execution sites before the computation starts. Cleanup jobs delete intermediate data that is no longer needed by the remainder of the workflow. Stage-out jobs transfer workflow output data to archiving sites for storage and analysis.
The data transfer delay reflects the performance of data transfer services and network latency.
Other terms used in this paper:
Makespan is the difference between the time when the first job is released and the last job completes.
Runtime is the time spent by a job executing on a resource (as seen by the local scheduler).
3.3 Cumulative Overhead In this section, we define three methods2 to calculate cumulative overheads of workflows. We call these methods O1, O2 and O3. O1 simply adds up the overheads of all jobs without considering their overlap. O2 subtracts from O1 all overlaps of the same type of overhead. It is equal to the projection of all overheads to the timeline. O3 subtracts the overlap of all types of overheads from O2. It is equal to the projection of overheads of a particular type excluding all other types of overheads to the timeline.
The reason we have three metrics of calculating cumulative overheads is to present a comprehensive overview of the impact of overlaps between the various overheads and runtime. Many optimization methods such as Data Placement Services [14] try to overlap overheads and runtime to improve the overall performance. By analyzing these three types of cumulative overheads, researchers have a clear view of whether their optimization methods have overlapped the overheads of a same type (if O2 < O1) or other types (if O3 < O2).
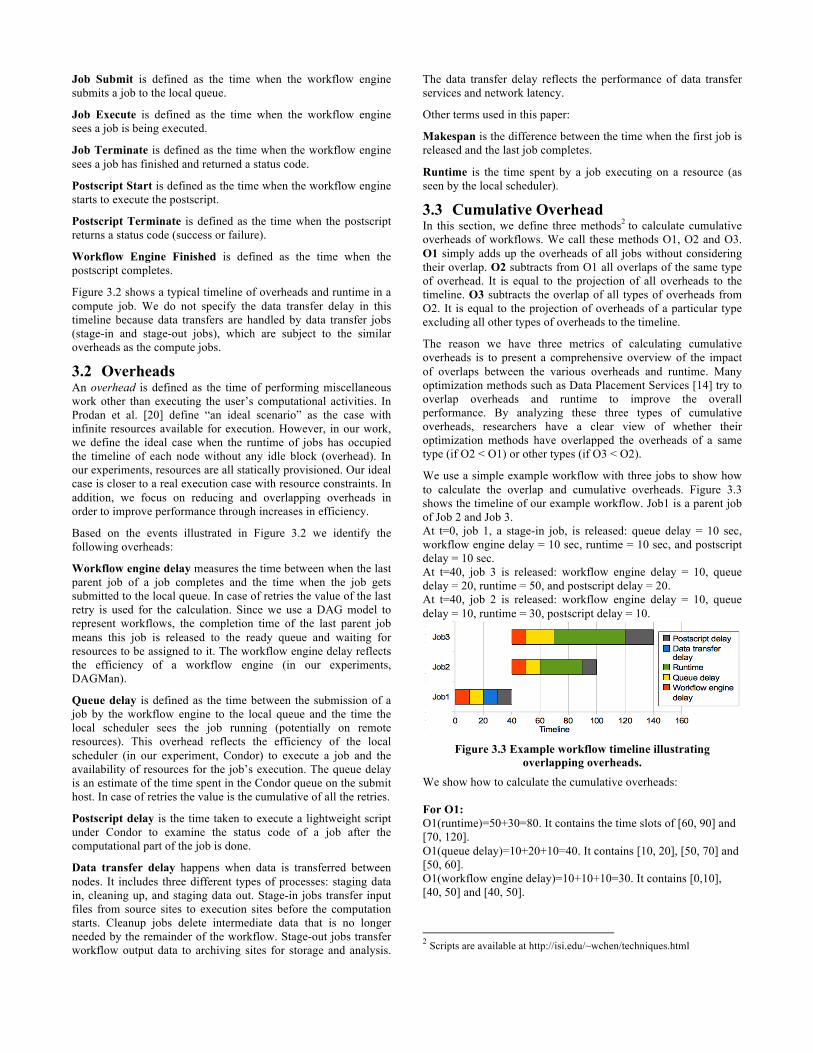
We use a simple example workflow with three jobs to show how to calculate the overlap and cumulative overheads. Figure 3.3 shows the timeline of our example workflow. Job1 is a parent job of Job 2 and Job 3. At t=0, job 1, a stage-in job, is released: queue delay = 10 sec, workflow engine delay = 10 sec, runtime = 10 sec, and postscript delay = 10 sec. At t=40, job 3 is released: workflow engine delay = 10, queue delay = 20, runtime = 50, and postscript delay = 20. At t=40, job 2 is released: workflow engine delay = 10, queue delay = 10, runtime = 30, postscript delay = 10.
Figure 3.3 Example workflow timeline illustrating overlapping overheads.
We show how to calculate the cumulative overheads: For O1: O1(runtime)=50+30=80. It contains the time slots of [60, 90] and [70, 120]. O1(queue delay)=10+20+10=40. It contains [10, 20], [50, 70] and [50, 60]. O1(workflow engine delay)=10+10+10=30. It contains [0,10], [40, 50] and [40, 50].
2 Scripts are available at http://isi.edu/~wchen/techniques.html
O1(postscript delay)=10+20+10=40. It contains [30, 40], [90, 100] and [120, 140]. O1(data transfer delay)=10. It contains [20, 30]. For O2: O2(runtime)=50+30-20=60. It contains [60, 120]. O2(queue delay)=10+20+10-10=30. It contains [10, 20] and [50, 70]. O2(workflow engine delay)=10+10+10-10=20. It contains [0, 10] and [40, 50]. O2(postscript delay)=10+20+10=40. It contains [30, 40], [90, 100] and [120, 140]. O2(data transfer delay)=10. It contains [20, 30]. For O3: O3(runtime)=50+30-20-10-10=40. It contains [70, 90] and [100, 120]. O3(queue delay)=10+20+10-10-10=20. It contains [10, 20] and [50, 60]. O3(workflow engine delay)=10+10+10-10=20. It contains [0, 10] and [40, 50]. O3(postscript delay)=10+20+10-10=30. It contains [30, 40] and [120,140]. O3(data transfer delay)=10. It contains [20, 30]. In calculating the cumulative runtime, we don’t include the runtime of stage-in jobs because we have already classified it as data transfer delay. The overall makespan for this example workflow is 140. Table 3.1 shows the percentage of overheads and runtime over makespan.
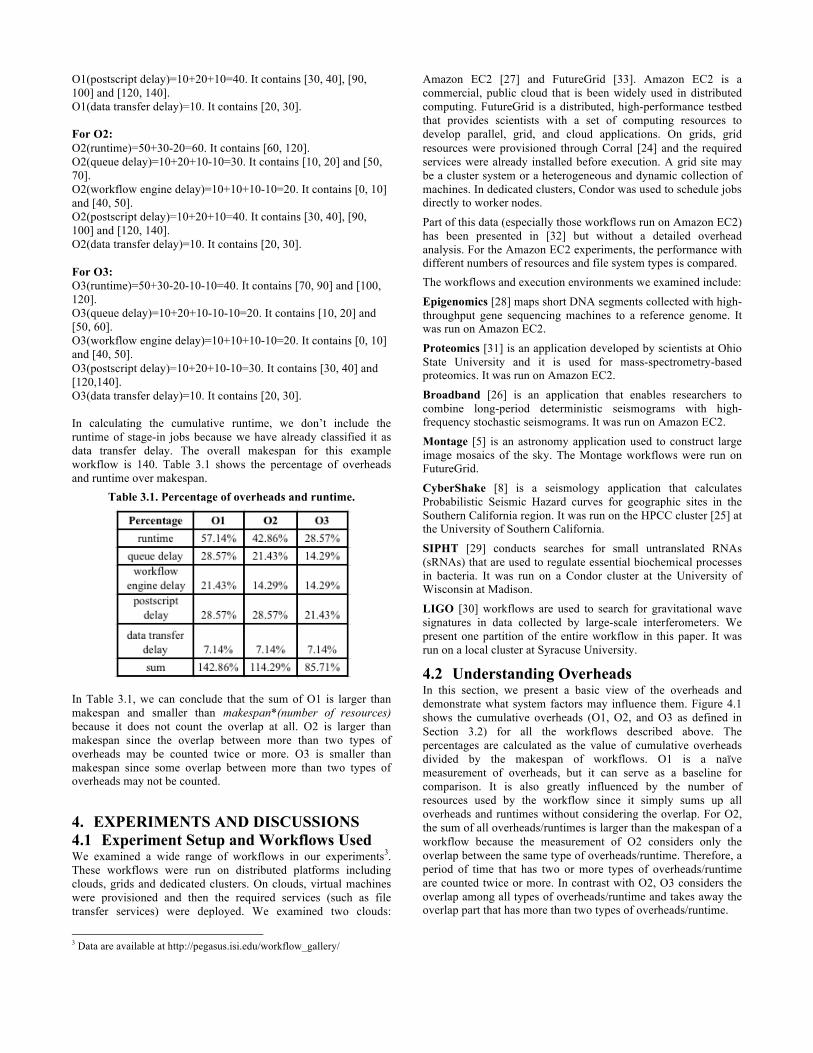
Table 3.1. Percentage of overheads and runtime.
In Table 3.1, we can conclude that the sum of O1 is larger than makespan and smaller than makespan*(number of resources) because it does not count the overlap at all. O2 is larger than makespan since the overlap between more than two types of overheads may be counted twice or more. O3 is smaller than makespan since some overlap between more than two types of overheads may not be counted.
4. EXPERIMENTS AND DISCUSSIONS 4.1 Experiment Setup and Workflows Used We examined a wide range of workflows in our experiments3. These workflows were run on distributed platforms including clouds, grids and dedicated clusters. On clouds, virtual machines were provisioned and then the required services (such as file transfer services) were deployed. We examined two clouds:
3 Data are available at http://pegasus.isi.edu/workflow_gallery/
Amazon EC2 [27] and FutureGrid [33]. Amazon EC2 is a commercial, public cloud that is been widely used in distributed computing. FutureGrid is a distributed, high-performance testbed that provides scientists with a set of computing resources to develop parallel, grid, and cloud applications. On grids, grid resources were provisioned through Corral [24] and the required services were already installed before execution. A grid site may be a cluster system or a heterogeneous and dynamic collection of machines. In dedicated clusters, Condor was used to schedule jobs directly to worker nodes.
Part of this data (especially those workflows run on Amazon EC2) has been presented in [32] but without a detailed overhead analysis. For the Amazon EC2 experiments, the performance with different numbers of resources and file system types is compared. The workflows and execution environments we examined include:
Epigenomics [28] maps short DNA segments collected with high-throughput gene sequencing machines to a reference genome. It was run on Amazon EC2.
Proteomics [31] is an application developed by scientists at Ohio State University and it is used for mass-spectrometry-based proteomics. It was run on Amazon EC2.
Broadband [26] is an application that enables researchers to combine long-period deterministic seismograms with high-frequency stochastic seismograms. It was run on Amazon EC2.
Montage [5] is an astronomy application used to construct large image mosaics of the sky. The Montage workflows were run on FutureGrid.
CyberShake [8] is a seismology application that calculates Probabilistic Seismic Hazard curves for geographic sites in the Southern California region. It was run on the HPCC cluster [25] at the University of Southern California.
SIPHT [29] conducts searches for small untranslated RNAs (sRNAs) that are used to regulate essential biochemical processes in bacteria. It was run on a Condor cluster at the University of Wisconsin at Madison.
LIGO [30] workflows are used to search for gravitational wave signatures in data collected by large-scale interferometers. We present one partition of the entire workflow in this paper. It was run on a local cluster at Syracuse University.
4.2 Understanding Overheads In this section, we present a basic view of the overheads and demonstrate what system factors may influence them. Figure 4.1 shows the cumulative overheads (O1, O2, and O3 as defined in Section 3.2) for all the workflows described above. The percentages are calculated as the value of cumulative overheads divided by the makespan of workflows. O1 is a naïve measurement of overheads, but it can serve as a baseline for comparison. It is also greatly influenced by the number of resources used by the workflow since it simply sums up all overheads and runtimes without considering the overlap. For O2, the sum of all overheads/runtimes is larger than the makespan of a workflow because the measurement of O2 considers only the overlap between the same type of overheads/runtime. Therefore, a period of time that has two or more types of overheads/runtime are counted twice or more. In contrast with O2, O3 considers the overlap among all types of overheads/runtime and takes away the overlap part that has more than two types of overheads/runtime.
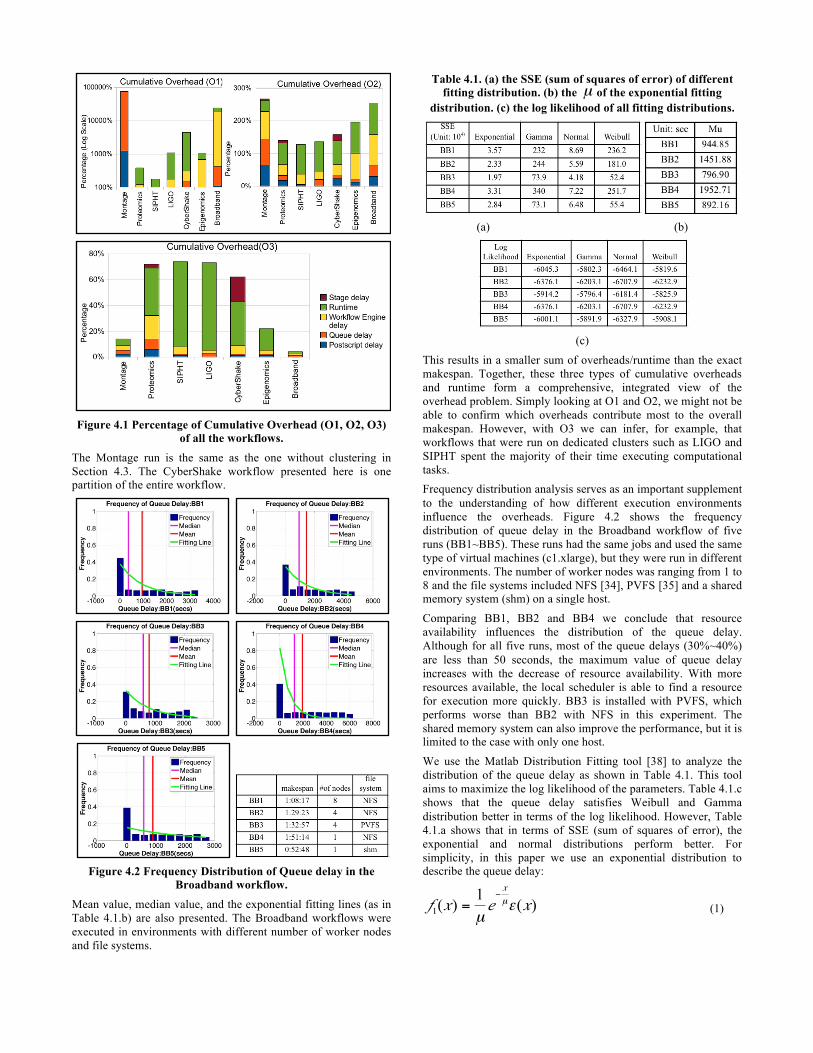
Figure 4.1 Percentage of Cumulative Overhead (O1, O2, O3)
of all the workflows. The Montage run is the same as the one without clustering in Section 4.3. The CyberShake workflow presented here is one partition of the entire workflow.
Figure 4.2 Frequency Distribution of Queue delay in the
Broadband workflow. Mean value, median value, and the exponential fitting lines (as in Table 4.1.b) are also presented. The Broadband workflows were executed in environments with different number of worker nodes and file systems.
Table 4.1. (a) the SSE (sum of squares of error) of different fitting distribution. (b) the of the exponential fitting
distribution. (c) the log likelihood of all fitting distributions.
(a) (b)
(c)
This results in a smaller sum of overheads/runtime than the exact makespan. Together, these three types of cumulative overheads and runtime form a comprehensive, integrated view of the overhead problem. Simply looking at O1 and O2, we might not be able to confirm which overheads contribute most to the overall makespan. However, with O3 we can infer, for example, that workflows that were run on dedicated clusters such as LIGO and SIPHT spent the majority of their time executing computational tasks. Frequency distribution analysis serves as an important supplement to the understanding of how different execution environments influence the overheads. Figure 4.2 shows the frequency distribution of queue delay in the Broadband workflow of five runs (BB1~BB5). These runs had the same jobs and used the same type of virtual machines (c1.xlarge), but they were run in different environments. The number of worker nodes was ranging from 1 to 8 and the file systems included NFS [34], PVFS [35] and a shared memory system (shm) on a single host.
Comparing BB1, BB2 and BB4 we conclude that resource availability influences the distribution of the queue delay. Although for all five runs, most of the queue delays (30%~40%) are less than 50 seconds, the maximum value of queue delay increases with the decrease of resource availability. With more resources available, the local scheduler is able to find a resource for execution more quickly. BB3 is installed with PVFS, which performs worse than BB2 with NFS in this experiment. The shared memory system can also improve the performance, but it is limited to the case with only one host.
We use the Matlab Distribution Fitting tool [38] to analyze the distribution of the queue delay as shown in Table 4.1. This tool aims to maximize the log likelihood of the parameters. Table 4.1.c shows that the queue delay satisfies Weibull and Gamma distribution better in terms of the log likelihood. However, Table 4.1.a shows that in terms of SSE (sum of squares of error), the exponential and normal distributions perform better. For simplicity, in this paper we use an exponential distribution to describe the queue delay:
(1)
where is an unit step function. The estimates of are listed in Table 4.1.b.
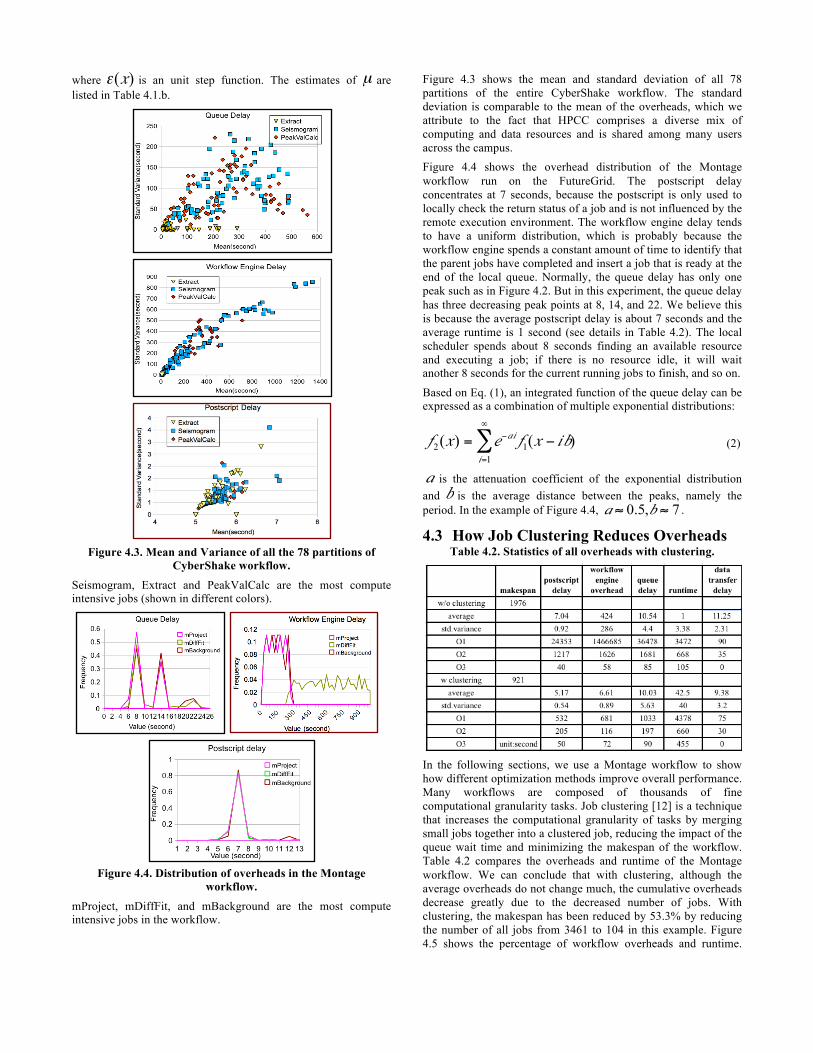
Figure 4.3. Mean and Variance of all the 78 partitions of
CyberShake workflow. Seismogram, Extract and PeakValCalc are the most compute intensive jobs (shown in different colors).
Figure 4.4. Distribution of overheads in the Montage
workflow. mProject, mDiffFit, and mBackground are the most compute intensive jobs in the workflow.
Figure 4.3 shows the mean and standard deviation of all 78 partitions of the entire CyberShake workflow. The standard deviation is comparable to the mean of the overheads, which we attribute to the fact that HPCC comprises a diverse mix of computing and data resources and is shared among many users across the campus. Figure 4.4 shows the overhead distribution of the Montage workflow run on the FutureGrid. The postscript delay concentrates at 7 seconds, because the postscript is only used to locally check the return status of a job and is not influenced by the remote execution environment. The workflow engine delay tends to have a uniform distribution, which is probably because the workflow engine spends a constant amount of time to identify that the parent jobs have completed and insert a job that is ready at the end of the local queue. Normally, the queue delay has only one peak such as in Figure 4.2. But in this experiment, the queue delay has three decreasing peak points at 8, 14, and 22. We believe this is because the average postscript delay is about 7 seconds and the average runtime is 1 second (see details in Table 4.2). The local scheduler spends about 8 seconds finding an available resource and executing a job; if there is no resource idle, it will wait another 8 seconds for the current running jobs to finish, and so on.
Based on Eq. (1), an integrated function of the queue delay can be expressed as a combination of multiple exponential distributions:
(2)
is the attenuation coefficient of the exponential distribution and is the average distance between the peaks, namely the period. In the example of Figure 4.4, .
4.3 How Job Clustering Reduces Overheads Table 4.2. Statistics of all overheads with clustering.
In the following sections, we use a Montage workflow to show how different optimization methods improve overall performance. Many workflows are composed of thousands of fine computational granularity tasks. Job clustering [12] is a technique that increases the computational granularity of tasks by merging small jobs together into a clustered job, reducing the impact of the queue wait time and minimizing the makespan of the workflow. Table 4.2 compares the overheads and runtime of the Montage workflow. We can conclude that with clustering, although the average overheads do not change much, the cumulative overheads decrease greatly due to the decreased number of jobs. With clustering, the makespan has been reduced by 53.3% by reducing the number of all jobs from 3461 to 104 in this example. Figure 4.5 shows the percentage of workflow overheads and runtime.
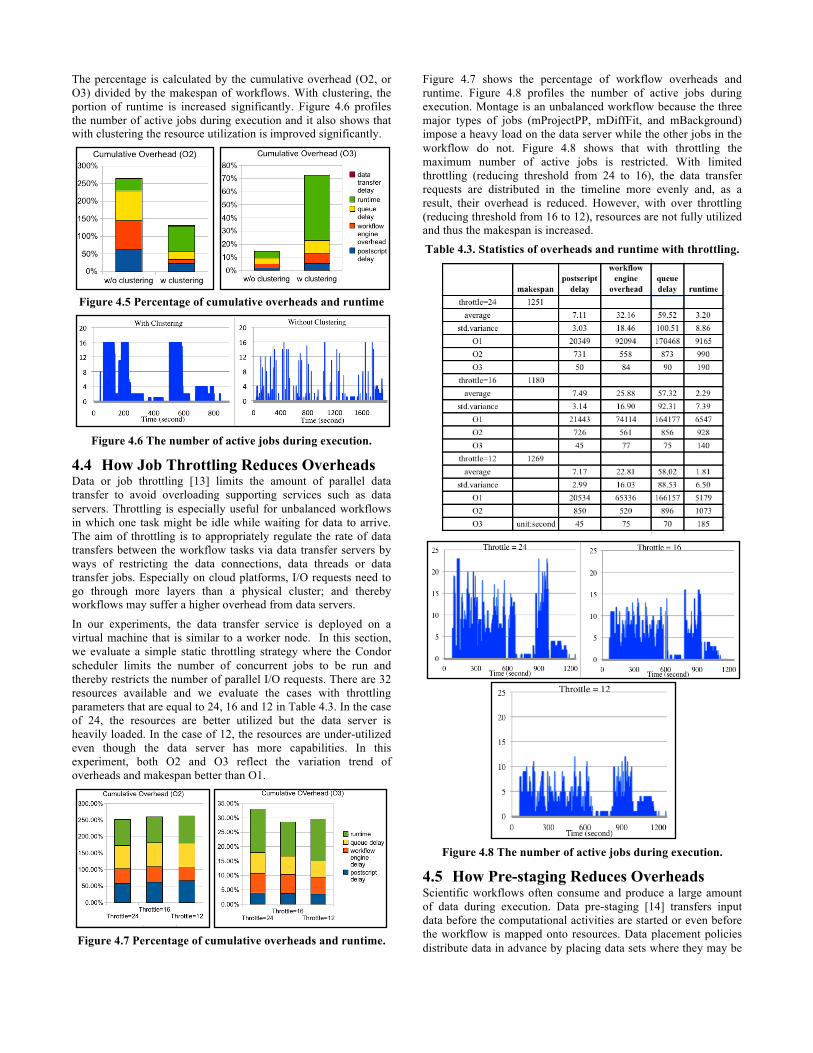
The percentage is calculated by the cumulative overhead (O2, or O3) divided by the makespan of workflows. With clustering, the portion of runtime is increased significantly. Figure 4.6 profiles the number of active jobs during execution and it also shows that with clustering the resource utilization is improved significantly.
Figure 4.5 Percentage of cumulative overheads and runtime
Figure 4.6 The number of active jobs during execution.
4.4 How Job Throttling Reduces Overheads Data or job throttling [13] limits the amount of parallel data transfer to avoid overloading supporting services such as data servers. Throttling is especially useful for unbalanced workflows in which one task might be idle while waiting for data to arrive. The aim of throttling is to appropriately regulate the rate of data transfers between the workflow tasks via data transfer servers by ways of restricting the data connections, data threads or data transfer jobs. Especially on cloud platforms, I/O requests need to go through more layers than a physical cluster; and thereby workflows may suffer a higher overhead from data servers.
In our experiments, the data transfer service is deployed on a virtual machine that is similar to a worker node. In this section, we evaluate a simple static throttling strategy where the Condor scheduler limits the number of concurrent jobs to be run and thereby restricts the number of parallel I/O requests. There are 32 resources available and we evaluate the cases with throttling parameters that are equal to 24, 16 and 12 in Table 4.3. In the case of 24, the resources are better utilized but the data server is heavily loaded. In the case of 12, the resources are under-utilized even though the data server has more capabilities. In this experiment, both O2 and O3 reflect the variation trend of overheads and makespan better than O1.
Figure 4.7 Percentage of cumulative overheads and runtime.
Figure 4.7 shows the percentage of workflow overheads and runtime. Figure 4.8 profiles the number of active jobs during execution. Montage is an unbalanced workflow because the three major types of jobs (mProjectPP, mDiffFit, and mBackground) impose a heavy load on the data server while the other jobs in the workflow do not. Figure 4.8 shows that with throttling the maximum number of active jobs is restricted. With limited throttling (reducing threshold from 24 to 16), the data transfer requests are distributed in the timeline more evenly and, as a result, their overhead is reduced. However, with over throttling (reducing threshold from 16 to 12), resources are not fully utilized and thus the makespan is increased. Table 4.3. Statistics of overheads and runtime with throttling.
Figure 4.8 The number of active jobs during execution.
4.5 How Pre-staging Reduces Overheads Scientific workflows often consume and produce a large amount of data during execution. Data pre-staging [14] transfers input data before the computational activities are started or even before the workflow is mapped onto resources. Data placement policies distribute data in advance by placing data sets where they may be
requested or by replicating data sets to improve runtime performance.
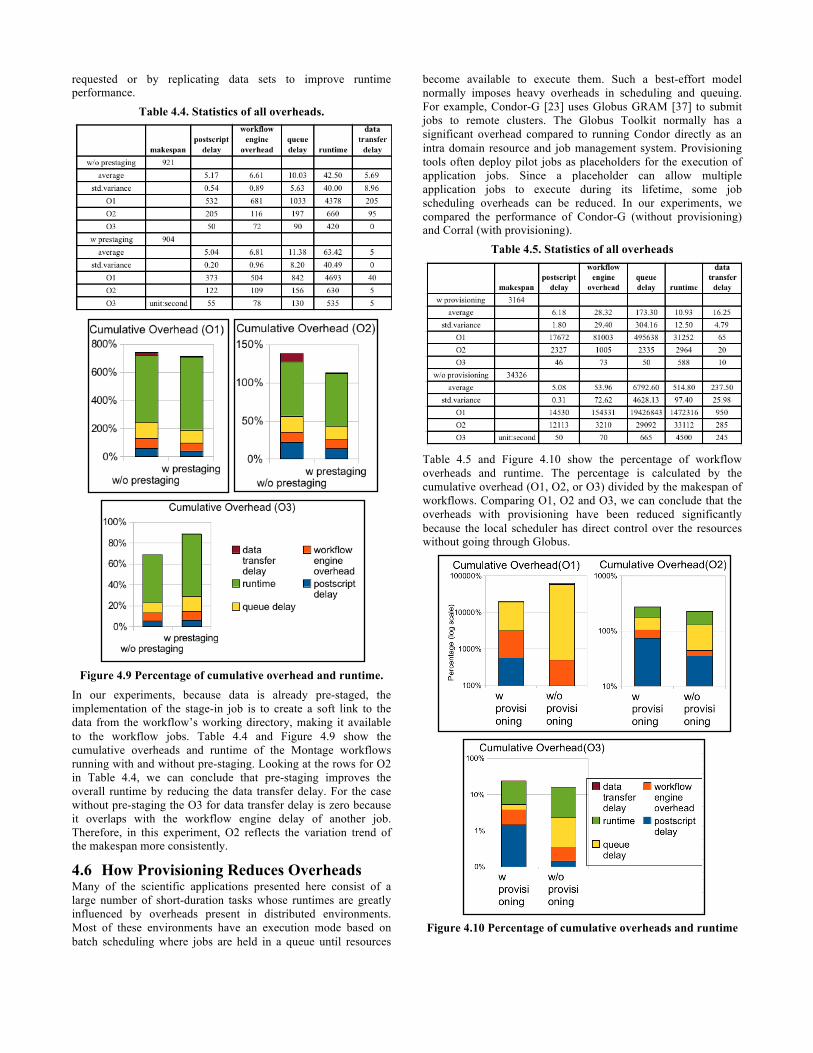
Table 4.4. Statistics of all overheads.
Figure 4.9 Percentage of cumulative overhead and runtime.
In our experiments, because data is already pre-staged, the implementation of the stage-in job is to create a soft link to the data from the workflow’s working directory, making it available to the workflow jobs. Table 4.4 and Figure 4.9 show the cumulative overheads and runtime of the Montage workflows running with and without pre-staging. Looking at the rows for O2 in Table 4.4, we can conclude that pre-staging improves the overall runtime by reducing the data transfer delay. For the case without pre-staging the O3 for data transfer delay is zero because it overlaps with the workflow engine delay of another job. Therefore, in this experiment, O2 reflects the variation trend of the makespan more consistently.
4.6 How Provisioning Reduces Overheads Many of the scientific applications presented here consist of a large number of short-duration tasks whose runtimes are greatly influenced by overheads present in distributed environments. Most of these environments have an execution mode based on batch scheduling where jobs are held in a queue until resources
become available to execute them. Such a best-effort model normally imposes heavy overheads in scheduling and queuing. For example, Condor-G [23] uses Globus GRAM [37] to submit jobs to remote clusters. The Globus Toolkit normally has a significant overhead compared to running Condor directly as an intra domain resource and job management system. Provisioning tools often deploy pilot jobs as placeholders for the execution of application jobs. Since a placeholder can allow multiple application jobs to execute during its lifetime, some job scheduling overheads can be reduced. In our experiments, we compared the performance of Condor-G (without provisioning) and Corral (with provisioning).
Table 4.5. Statistics of all overheads
Table 4.5 and Figure 4.10 show the percentage of workflow overheads and runtime. The percentage is calculated by the cumulative overhead (O1, O2, or O3) divided by the makespan of workflows. Comparing O1, O2 and O3, we can conclude that the overheads with provisioning have been reduced significantly because the local scheduler has direct control over the resources without going through Globus.
Figure 4.10 Percentage of cumulative overheads and runtime
5. CONCLUSIONS and FUTURE WORK From our experiments, we conclude that applying only one type of cumulative overhead analysis does not offer a complete view of how different optimization techniques work. O1 simply measures the amount of overhead occurring to all resources. O2 projects O1 to a timeline and measures the projection. O3 reflects the overlap with other types of overheads. A complete view of these three metrics helps us understand how different optimization techniques reduce the impact of overheads.
We also describe and model the characteristics of workflow overheads and indicate the relationship between different overheads. Such knowledge should help researchers better interpret overheads in their workflow models.
In the last section, we examined existing optimization methods and demonstrated how they improve the makespan of a workflow by reducing or by overlapping overheads. We plan to evaluate the effectiveness of our approach with other optimization methods. Additionally, our current work is based on static provisioning and we plan to analyze the workflow performance along with dynamic provisioning.
Another future work is Optimistic Job Execution. As Tables 4.1, 4.2 and 4.3 have shown, the percentage of the workflow engine overhead and queue delay do not change much with different optimization techniques, which means that there is room for improvement. We therefore suggest an optimistic job execution strategy, which releases child jobs into the local queue before the completion of the parent job (for example, when it is 90% done). The scheduler then starts to look for resources available for these child jobs. A pre-script invoked before running a child job checks whether the child’s input data is available, otherwise it will hold. To make this optimistic strategy work, the tradeoff between possible failures and benefits gained by overlapping the workflow engine overhead and the queue delay should be carefully studied.
6. ACKNOWLEDGMENTS This work is supported by NFS under grant number IIS-0905032. Our thanks to the Pegasus Team, the Southern California Earthquake Center (CyberShake and Broadband), the USC Epigenome Center (Epigenomics), the Infrared Processing and Analysis Center at Caltech (Montage), Michael Freitas (Proteomics), and Johnathan Livny (SIPHT) for providing original data for analysis.
7. REFERENCES [1] Gil, Y.; Deelman, E.; Ellisman, M.; Fahringer, T.; Fox, G.;
Gannon, D.; Goble, C.; Livny, M.; Moreau, L.; Myers, Examing the Challenges of Scientific Workflows, J. - Computer , Vol.40, no.12, pp.24-32, Dec. 2007
[2] E. Deelman, J. Blythe, Y. Gil, C. Kesselman, G. Mehta, S. Patil, M.-H. Su, K. Vahi, and M. Livny. Pegasus: Mapping scientific workflows onto the Grid. Lecture Notes in Computer Science: Grid Computing, pages 11–20, 2004.
[3] Peter Couvares, Tevik Kosar, Alain Roy, Jeff Weber and Kent Wenger, "Workflow in Condor", in In Workflows for e-Science, Editors: I.Taylor, E.Deelman, D.Gannon, M.Shields, Springer Press, January 2007 (ISBN: 1-84628-519-4)
[4] J. Frey, T. Tannenbaum, M. Livny, I. Foster, and S. Tuecke, "Condor-G: A Computation Management Agent for Multi- Institutional Grids," Cluster Computing, vol. 5, pp. 237-246 2002.
[5] G. B. Berriman, E. Deelman, J. Good, J. Jacob, D. S. Katz, C. Kesselman, A. Laity, T. A. Prince, G. Singh, and M.-H.
Su, "Montage: A Grid Enabled Engine for Delivering Custom Science-Grade Mosaics On Demand," presented at SPIE Conference 5487: Astronomical Telescopes, 2004.
[6] A. Lathers, M.-H. Su, A. Kulungowski, A. W. Lin, G. Mehta, S. T. Peltier, E. Deelman, and M. H. Ellisman, "Enabling parallel scientific applications with workflow tools," presented at Challenges of Large Applications in Distributed Environments, 2006 IEEE, 2006.
[7] E. Deelman, J. Blythe, Y. Gil, and C. Kesselman, "Workflow Management in GriPhyN," in Grid Resource Management: State of the Art and Future Trends, J. Nabrzyski, J. M. Schopf, and J. Weglarz, Eds.: Springer, 2003.
[8] E. Deelman, S. Callaghan, E. Field, H. Francoeur, R. Graves, N. Gupta, V. Gupta, T. H. Jordan, C. Kesselman, P. Maechling, J. Mehringer, G. Mehta, D. Okaya, K. Vahi, and L. Zhao, "Managing Large-Scale Workflow Execution from Resource Provisioning to Provenance Tracking: The CyberShake Example," presented at Second IEEE International Conference on e-Science and Grid Computing, 2006.
[9] C. Catlett, "The philosophy of TeraGrid: building an open, extensible, distributed TeraScale facility," presented at Cluster Computing and the Grid 2nd IEEE/ACM International Symposium CCGRID2002, 2002.
[10] The Open Science Grid Consortium, http://www.opensciencegrid.org.
[11] Louis-Claude Canon, Emmanuel Jeannot, Rizos Sakellariou, and Wei Zheng. Comparative evaluation of the Robustness of DAG Scheduling Heuristics. In Grid Computing: Achievements and Prospects (eds: Sergei Gorlatch, Paraskevi Fragopoulou, Thierry Priol), Springer, 2008, pp. 73-84 (ISBN 978-0-387-09456-4)
[12] Gurmeet Singh, Mei-Hui Su, Karan Vahi, Ewa Deelman, Bruce Berriman, John Good, Daniel S. Katz, and Gaurang Mehta. Workflow Task Clustering for Best Effort Systems with Pegasus Mardi Gras Conference, Baton Rouge, LA, January 2008
[13] Sang-Min Park;Humphrey, M.; Data throttling for data-intensive workflows, IEEE Intl. Symposium on Parallel and Distributed Processing, Miami, FL, April 2008.
[14] Ann Chervenak, Ewa Deelman, Miron Livny, Mei-Hui Su, Rob Schuler, Shishir Bharathi, Gaurang Mehta, Karan Vahi, Data Placement for Scientific Applications in Distributed Environments, Proceedings of Grid Conference 2007, Austin, Texas, September 2007.
[15] Nezil Yigitbasi, and Dick Epema, Static and Dynamic Overprovisioning Strategies for Performance Consistency in Grids, The 11th ACM/IEEE International Conference on Grid Computing (Grid 2010), Brussels, Belgium, Oct 2010.
[16] Vijay S. Kumar, P. Sadayappan, Gaurang Mehta, Karan Vahi, Ewa Deelman, Varun Ratnakar, Jihie Kim, Yolanda Gil, Mary W. Hall, Tahsin M. Kurç, Joel H. Saltz, An Integrated Framework for Parameter-based Optimization of Scientific Workflows, HPDC 2009: 177-186
[17] Nan Dun, Kenjiro Taura, Akinori Yonezawa, ParaTrac: A Fine-Grained Profiler for Data-Intensive Workflows, The International Symposium on High Performance Distributed Computing (HPDC’10), Chicago, USA, June 2010.
[18] H. Truong, P. Brunner, etc., K-WfGrid Distributed Monitoring and Performance Analysis Services for Workflows in the Grid, Proceedings of the Second IEEE International Conference on e-Science and Grid Computing, 2006.
[19] N. R. Tallent, Effective Performance Measurement and Analysis of Multithreaded Applications, PPoPP’09, Raleigh NC, USA, Feb 2009.
[20] Radu Prodan, Thomas Fabringer, Overhead Analysis of Scientific Workflows in Grid Environments, IEEE Transactions n Parallel and Distributed System, Vol. 19, No. 3, Mar 2008.
[21] Radu Prodan et al., Online Analysis and Runtime Steering of Dynamic Workflows in the ASKALON Grid Environment, CCGrid 07.
[22] C. Stratan, et al., A Performance Study of Grid Workflow Engines, the 9th IEEE/ACM Intl. Conf. on Grid Computing, Tsukuba, Japan, Sep 2008
[23] James Frey, Todd Tannenbaum, Ian Foster, Miron Livny, and Steven Tuecke, "Condor-G: A Computation Management Agent for Multi-Institutional Grids", Journal of Cluster Computing volume 5, pages 237-246, 2002
[24] Gideon Juve, Ewa Deelman, Karan Vahi, Gaurang Mehta, Experiences with Resource Provisioning for Scientific Workflows Using Corral, Scientific Programming, 18:2, pp. 77-92, April 2010.
[25] http://www.usc.edu/hpcc/ [26] http://scec.usc.edu/research/cme/groups/broadband [27] Amazon.com, “Elastic Compute Cloud (EC2)”;
http://aws.amazon.com/ec2. [28] S. Bharathi, A. Chervenak, E. Deelman, G. Mehta, M.-H. Su,
and K. Vahi, "Characterization of Scientific Workflows," in The 3rd Workshop on Workflows in Support of Large-Scale Science (WORKS08), in conjunction with Supercomputing (SC08) Conference Austin, Texas, November, 2008.
[29] Livny, J., Teonadi, H., Livny, M., and Waldor, M.K. (2008). High-throughput, kingdom-wide prediction and annotation of bacterial non-coding RNAs. PLoS ONE 3, e3197.
[30] A. Abramovici, W. Althouse, et al., "LIGO: The Laser Interferometer Gravitational-Wave Observatory," Science, vol 256, pp. 325-333, 1992 1992.
[31] Proteomics: http://www.ccic.ohio-state.edu/MS/proteomics.htm
[32] Gideon Juve, et al., Scientific Workflow Applications on Amazon EC2. Workshop on Cloud-based Services and Applications in conjunction with 5th IEEE Intl. Conf. on e-Science (e-Science 2009), Oxford UK, December 2009.
[33] FutureGrid: https://portal.futuregrid.org/ [34] Dave Hitz, James Lau, and Michael Malcolm, File system
design for an NFS file server appliance, In Proceedings of the Winter 1994 USENIX Conference, San Francisco, CA, January 1994
[35] P. H. Carns, W. B. Ligon III, R. B. Ross, and R. Thakur. PVFS: A parallel file system for linux clusters. In Proceedings of the 4th Annual Linux Showcase and Conference, pages 317–327, 2000.
[36] DAGUM, L., AND MENON, R. 1998. OpenMP: An industry- standard API for shared-memory programming. IEEE Comput. Sci. Eng. 5, 1, 46–55.
[37] Globus Toolkit: http://www.globus.org/toolkit/ [38] Matlab Interactive distribution fitting:
http://www.mathworks.com/help/toolbox/stats/dfittool.html