Embed Size (px)
DESCRIPTION
Workers, Workplaces and Working Hours. Mark L Bryan ISER, University of Essex Presented at DTI/PSI workshop on linked employer-employee data, 16 th September 2005. Introduction. UK has high and (still?) rising employment rate (75%). Govt aspiration is 80%. - PowerPoint PPT Presentation
Citation preview

Workers, Workplaces and Working Hours
Mark L BryanISER, University of Essex
Presented at DTI/PSI workshop on linked employer-employee data, 16th September 2005

Introduction
• UK has high and (still?) rising employment rate (75%). Govt aspiration is 80%.
• Policy debate about working hours and work-life balance. Govt campaign + new rights.
• Both employers and employees care (to some extent) about working time.
• To design effective working time polices, need to understand determinants of working hours, to identify best areas for intervention.

Why use linked employer-employee data? (1)
• With perfect job mobility, not a problem analytically. Can explain all with, e.g., supply side data.
• But perfect mobility seems implausible (due to geography, specific skills etc).
• Hours then depend on both worker and firm preferences.
• Unlike trad data, LEED can show:– differences in working hours between observably
identical workers across workplaces– ‘sorting’ of workers into workplaces with different
working hours.

Why use linked employer-employee data? (2)
• Can separate within-firm from between-firm variation.
• Can also enrich a standard one-sided analysis with characs from other side of market.
• Can sometimes compare management and worker responses to ‘same’ question (e.g. Budd and Mumford, 2005, using WERS).

Questions
• How important are firm-level factors (hours ‘policies’ or norms) in determining weekly hours of work? Do differences across firms depend on industry etc?
• Do hours vary within firms? If so, how do they vary for different workers? How much to do with job/skills and how much to do with ‘preferences’?
• Are workers sorted non-randomly into firms based on working hours?

Data (1)
• Workplace Employee Relations Survey 1998 (WERS 98) cross section– 2191 workplaces
• Management respondent• Worker representative where possible
– Up to 25 workers in each workplace.– After excluding non-responses and invalid
data: 1740 workplaces with on average 13 workers per workplace.
• Assume workplace = firm.

Data (2)
Working time question:“How many hours do you usually work
each week, including any overtime or extra hours?”
Median = 39 hoursLower quartile = 29 hoursUpper quartile = 44 hours(Weighted figures)

Empirical framework (1)
• Consider equation to explain working hours:hij = si + xi + Dj + εij
hij is hours (individual i in workplacej)
si is skill / occupation
xi is labour supply preferences
Dj is workplace effect

Empirical framework (2)
• The si characteristics reflect particular job within workplace: age and age squared, job tenure, highest educational qualification, receipt of training in the last 12 months, employment on fixed term or temporary contract, health problems affecting daily activities, 1 digit occupation, gender (allow different occupation and age effects for men and women).

Empirical framework (3)
• The xi are standard labour supply variables: marital status and presence of children less than 5, 5-11 and 12-18 years old (allow separate effects for men and women). Assume mainly capture value of domestic time rather than market time (after controlling for skill & occupation).

Empirical framework (4)
• Decomposition of hours variance into parts due to each set of factors, and their joint effects. Do for whole economy and then by sector.
• Examine Dj and variables correlated with Dj:– Industry etc to capture, e.g., fixed costs of
employment, fatigue at long hours.– Average levels within each workplace of si and xi to
see sorting effects.
• Examine effects associated with family characteristics within workplace (and compare with sorting effects).

The (un)importance of workplace affiliation (1)
Individual variable Mean Variance Proportion of variation due to workplace affiliation
Total hours 36.03 171.2 0.41
Log total hours 3.48 0.27 0.41
Part time incidence 0.25 - 0.38

The (un)importance of workplace affiliation (2)
Individual variable Mean Variance
Proportion of variation due to workplace affiliation
Degree level qualified
0.21 - 0.25
High-skilled non-manual
0.31 - 0.28
Less-skilled non-manual
0.26 - 0.34
Manual 0.44 - 0.43
Age 39.7 146.4 0.15
Tenure (months) 88.1 6103 0.22
Female 0.48 - 0.32
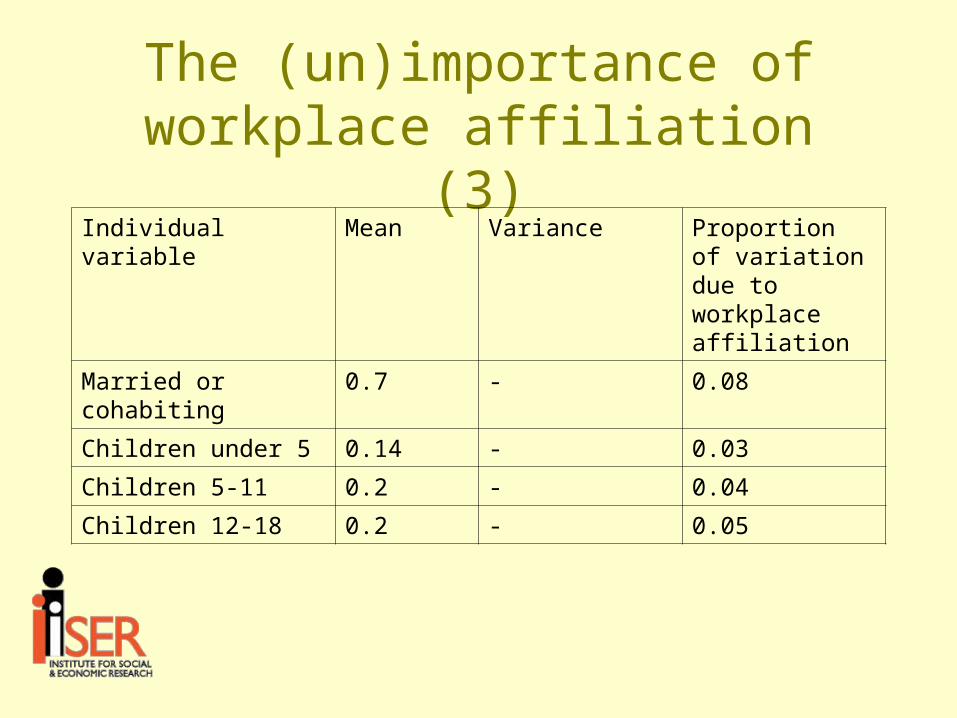
The (un)importance of workplace affiliation (3)
Individual variable Mean Variance Proportion of variation due to workplace affiliation
Married or cohabiting
0.7 - 0.08
Children under 5 0.14 - 0.03
Children 5-11 0.2 - 0.04
Children 12-18 0.2 - 0.05

Decomposition of total weekly hours
VarianceShare of total
Share of explained
Total explained 56.5 % 100 %
Skill / occupation chars 16.1 % 28.4 %
Preference chars 3.9 % 6.9 %
Workplace effects 17.8 % 31.5 %
Joint skill / occupation – workplace 11.2 % 19.7 %
Joint preference – workplace 3.7 % 6.6 %
Joint skill / occupation – preference 3.9 % 6.8 %

Decomposition of hours by sector (1)
• Disaggregate by goods (manufacturing, electricity, gas and water, and construction), private services and public services.
• Aggregate analysis hides differences between sectors (due to capital intensity and use, differing needs to suit customers’ time schedules, position of public sector relative to market and govt ?).
• In goods, relatively tightly bunched hours (variance=74) with important role for workplace affiliation (50% of explained variance). Consistent with hours coordination in capital-intensive industries (e.g. production line).

Decomposition of hours by sector (2)
• In private service sector, very wide variation in hours (variance=204), due to: – widely differing workplaces: absolute variance of
workplace effects is 3-4 times bigger than in other sectors.
– skills and occupation also have large effect – especially, workers sorted on skills (24% of explained
variance). We do not see sorting on skills to this degree in either of the other sectors.
• In public sector, wide hours variation (variance=164)– but workplace effects relatively unimportant (19% of
explained variance)– instead, skills and preference characteristics account for
large variance shares (46% and 13% of explained variance).

Workplace effects – goods sector
0.0
5.1
.15
De
nsity
-30 -25 -20 -15 -10 -5 0 5 10 15 20 25 30Workplace-level hours effects in the goods sector

Workplace effects – private services
0.0
2.0
4.0
6.0
8.1
De
nsity
-30 -25 -20 -15 -10 -5 0 5 10 15 20 25 30Workplace-level hours effects in the private services sector

Workplace effects – public services
0.0
5.1
.15
De
nsity
-30 -25 -20 -15 -10 -5 0 5 10 15 20 25 30Workplace-level hours effects in the public sector

Correlates of workplace effects
• Industry strongly affects workplace-level hours.
• For example, in private services, expect a worker in property to work 3.5 hours/week more than a comparable worker in retail (5.5 hours/week more for transport worker).
• Workplace/organisation size has some association, but less than industry.
• Many factors unobserved.

Effect of labour supply characteristics – men
GoodsPrivateservices
Publicservices
Variable
Individual
level
W/placemean
Individual
level
W/placemean
Individual
levelW/placemean
Married1.220*** 1.025 0.590 3.978* -0.387 5.352**
(4.00) (0.55) (1.63) (1.70) (0.87) (2.41)
Children <19 0.213 -1.876 0.141 0.433 0.196 -2.337
(0.81) (0.98) (0.41) (0.20) (0.49) (1.15)

Effect of labour supply characteristics – women
GoodsPrivateservices
Publicservices
Variable
Individual
levelW/placemean
Individual
level
W/placemean
Individual
levelW/placemean
Married -0.585 2.462 -0.305 -2.298 -2.078*** 0.828
(1.33) (0.80) (0.99) (1.33) (5.92) (0.49)
Child <12 -4.651*** -3.272 -6.403***-3.273* -6.167*** -3.530**
(8.59) (0.88) (18.93) (1.73) (17.38) (2.06)
Child 12-18 -1.151* -1.767 -1.856***
-3.932* -0.934** -4.422***
(1.82) (0.46) (4.96) (1.80) (2.56) (2.63)

Conclusions (1)
• Workplace-level hours ‘policies’ or norms are strong drivers of the employees’ hours (nearly a third of explained variation), especially in private services.
• Differences across workplaces unrelated to the observed worker characteristics, so would not be identified in unlinked employee-level data. Demonstrates values of linked data.
• Hours also vary within firms (another third of explained variance), according to skill/occupation and family characteristics. E.g. effect of children on women’s hours. Effect combines worker prefs and firm response.
Conclusions (2)
• Sorting process (final third of explained variation). Especially based on skill/occupation. Weaker evidence that workers who prefer longer (or shorter) hours also sort into long-hours (or short-hours) workplaces.
• Policy implications? – Hours likely to become increasingly diverse with
expansion of private services (contains largest spread of hours across workplaces).
– If job mobility restricted, could be difficult to achieve policy goal of matching workers to jobs with hours that suit.
– Encourage job mobility? Or, given substantial within-firm variation, dual-pronged approach: promote of job mobility and build on existing within-firm flexibility?