Embed Size (px)
Citation preview
© 2005 National Council on Compensation Insurance, Inc. 1
WORKERSCOMPENSATION
RATEMAKING
MONTANA LEGISLATIVE FINANCE COMMITTEE
March 6, 2008
Mike Taylor
NCCI
Source:© 2005 National Council on Compensation Insurance, Inc.
2
WC Ratemaking
• Where to start• Where does it come from• What to do with it• How can we be sure• Bottom line to Joe Q. Public
Source:© 2005 National Council on Compensation Insurance, Inc.
3
Technical & Actuarial Language
• Tail Factors• Incurred But Not Reported• On-Level Factor• Exponential Trend Factors• 18th to Ultimate Development• Composite Adjustment Factor• Off-Balance
Source:© 2005 National Council on Compensation Insurance, Inc.
4
Where to start?
• Look at where the state is
• Gather new and updated data
• Objectively analyze it
• Mix in other factors
• Spread it out
Source:© 2005 National Council on Compensation Insurance, Inc.
5
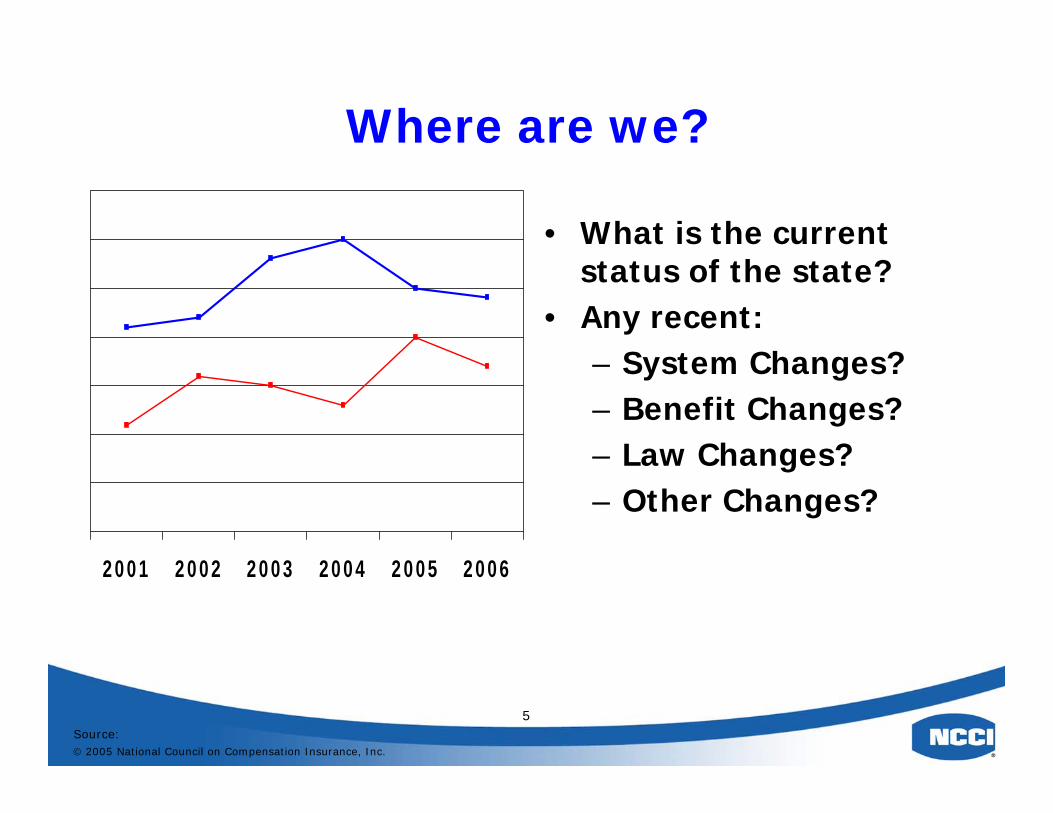
Where are we?
• What is the current status of the state?
• Any recent:– System Changes?– Benefit Changes?– Law Changes?– Other Changes?
2001 2002 2003 2004 2005 2006
Source:© 2005 National Council on Compensation Insurance, Inc.
6
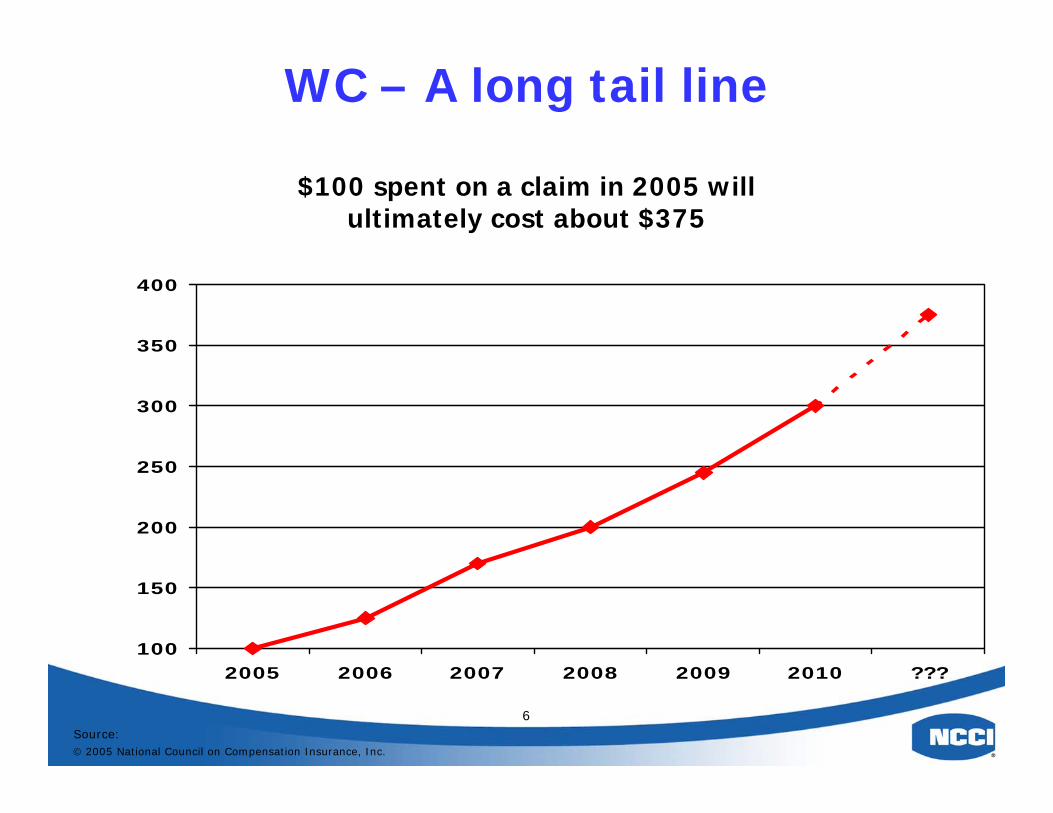
WC – A long tail line
$100 spent on a claim in 2005 willultimately cost about $375
100
150
200
250
300
350
400
2005 2006 2007 2008 2009 2010 ???
Source:© 2005 National Council on Compensation Insurance, Inc.
7
1ST Step:Determine Overall Rate Level
How much premium is needed:
• To fund the system?
• Only pay the anticipated indemnity and medical losses?
Source:© 2005 National Council on Compensation Insurance, Inc.
8
Data…
• Financial Data– Calendar Year Data– Policy Year Data
Answers the 1st question:
“How much was collected?”
Source:© 2005 National Council on Compensation Insurance, Inc.
9
…and more Data• Loss Data
Answers the 2nd question:
“How much was paid out?”
• Medical costs• Wage Replacement• Type of injuries• Frequency• Severity
Source:© 2005 National Council on Compensation Insurance, Inc.
10
Different Data ForDifferent Needs
•Calendar Year Data•Policy Year Data• Individual Policy Data
Source:© 2005 National Council on Compensation Insurance, Inc.
11
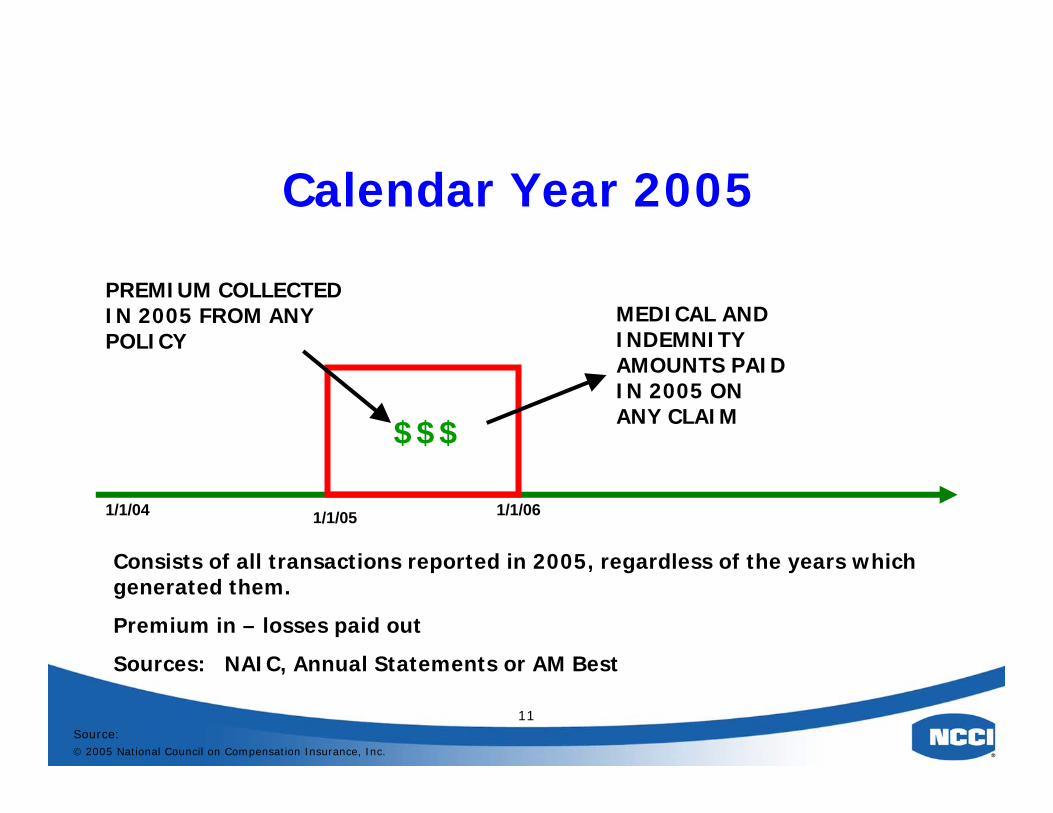
Calendar Year 2005
Consists of all transactions reported in 2005, regardless of the years which generated them.
Premium in – losses paid out
Sources: NAIC, Annual Statements or AM Best
1/1/04 1/1/05 1/1/06
PREMIUM COLLECTED IN 2005 FROM ANY POLICY
MEDICAL AND INDEMNITY AMOUNTS PAID IN 2005 ON ANY CLAIM
$$$
Source:© 2005 National Council on Compensation Insurance, Inc.
12
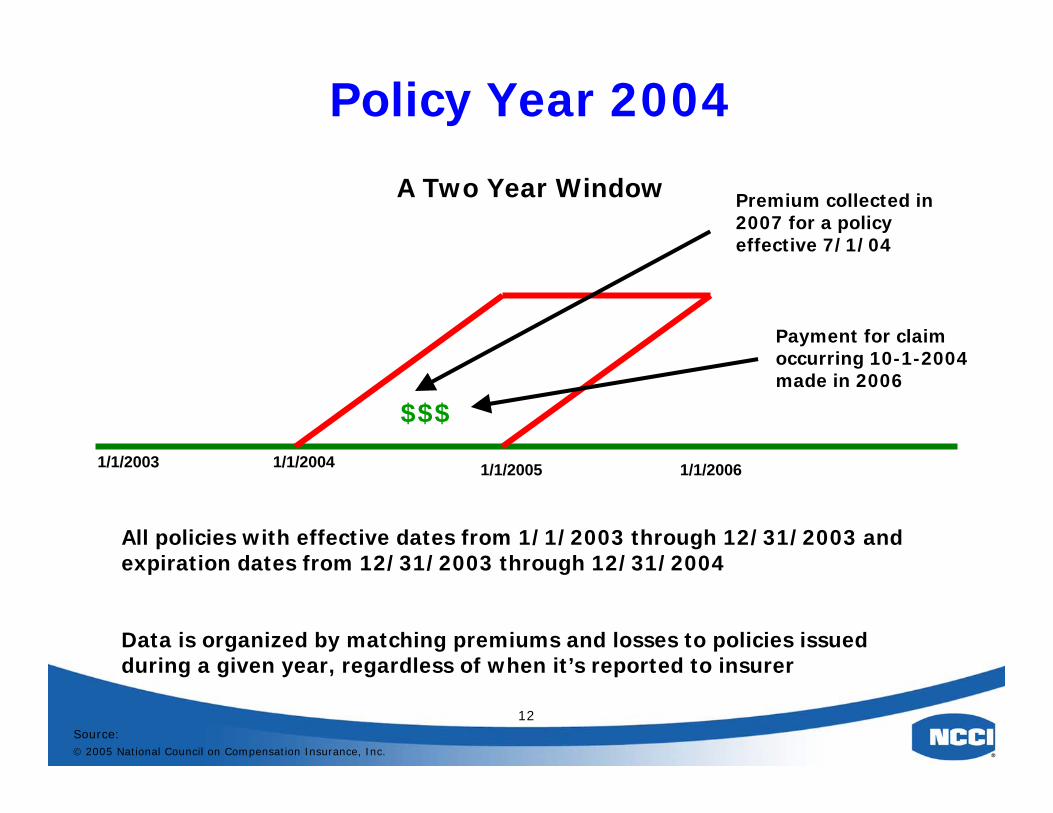
1/1/2003 1/1/2004 1/1/2005
All policies with effective dates from 1/1/2003 through 12/31/2003 and expiration dates from 12/31/2003 through 12/31/2004
Data is organized by matching premiums and losses to policies issued during a given year, regardless of when it’s reported to insurer
1/1/2006
Policy Year 2004
A Two Year Window
Payment for claim occurring 10-1-2004 made in 2006
Premium collected in 2007 for a policy effective 7/1/04
$$$
Source:© 2005 National Council on Compensation Insurance, Inc.
13
Individual Policy Data
• Payroll and Loss Data by Classification and Policy– Used in individual class ratemaking
• What was the overall experience of different industries?
– Used for individual employer experience rating
• Measurement of employer’s own losses
Source:© 2005 National Council on Compensation Insurance, Inc.
14
2nd Step: Trend
• Getting from Point AWhere we are today
• to Point B Where we need to go
• Measure the changes in the growth/decline of wages and losses
Differences indicate trend
Source:© 2005 National Council on Compensation Insurance, Inc.
15
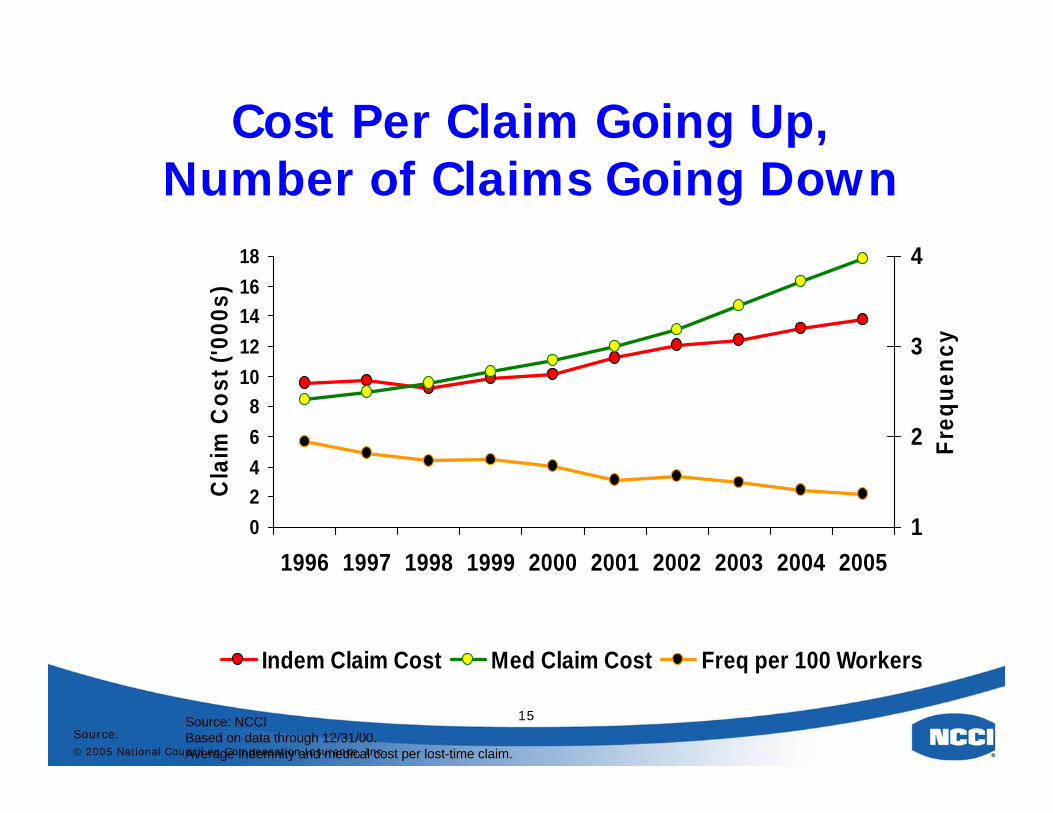
Cost Per Claim Going Up,Number of Claims Going Down
Source: NCCIBased on data through 12/31/00.Average indemnity and medical cost per lost-time claim.
02468
1012141618
1996 1997 1998 1999 2000 2001 2002 2003 2004 2005
Cla
im C
ost (
'000
s)
1
2
3
4
Freq
uenc
y
Indem Claim Cost Med Claim Cost Freq per 100 Workers
Source:© 2005 National Council on Compensation Insurance, Inc.
16
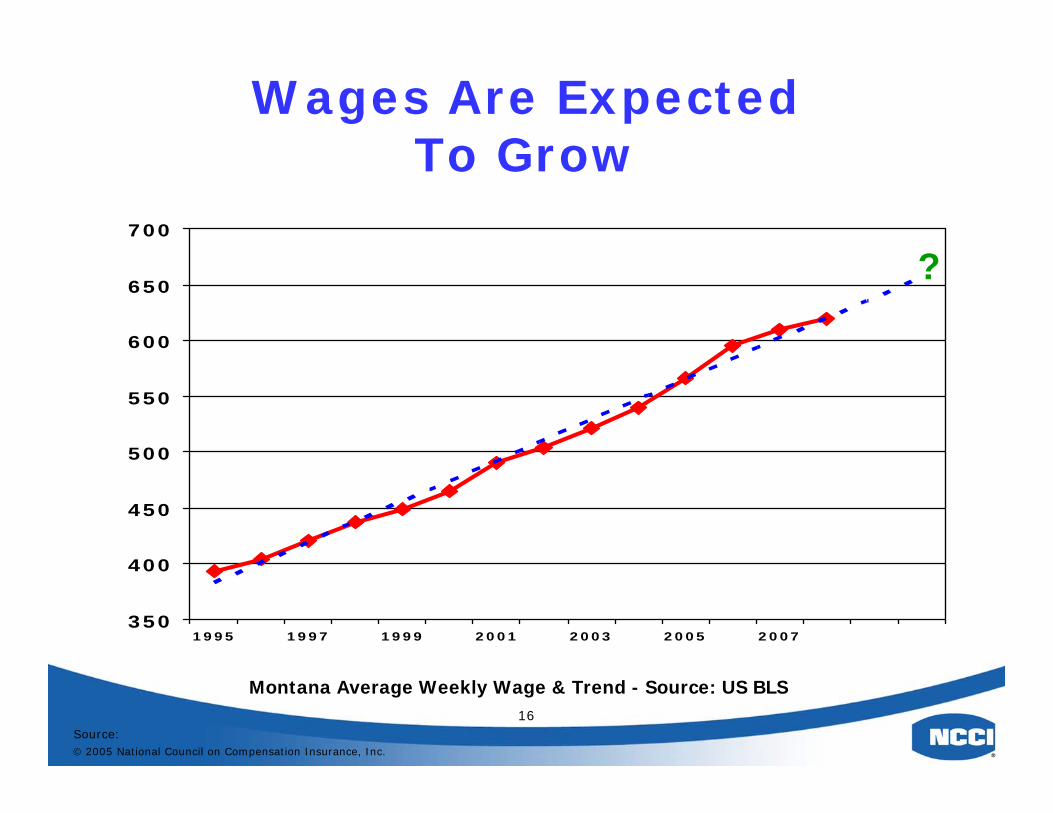
Wages Are Expected To Grow
Montana Average Weekly Wage & Trend - Source: US BLS
350
400
450
500
550
600
650
700
1995 1997 1999 2001 2003 2005 2007
?
Source:© 2005 National Council on Compensation Insurance, Inc.
17
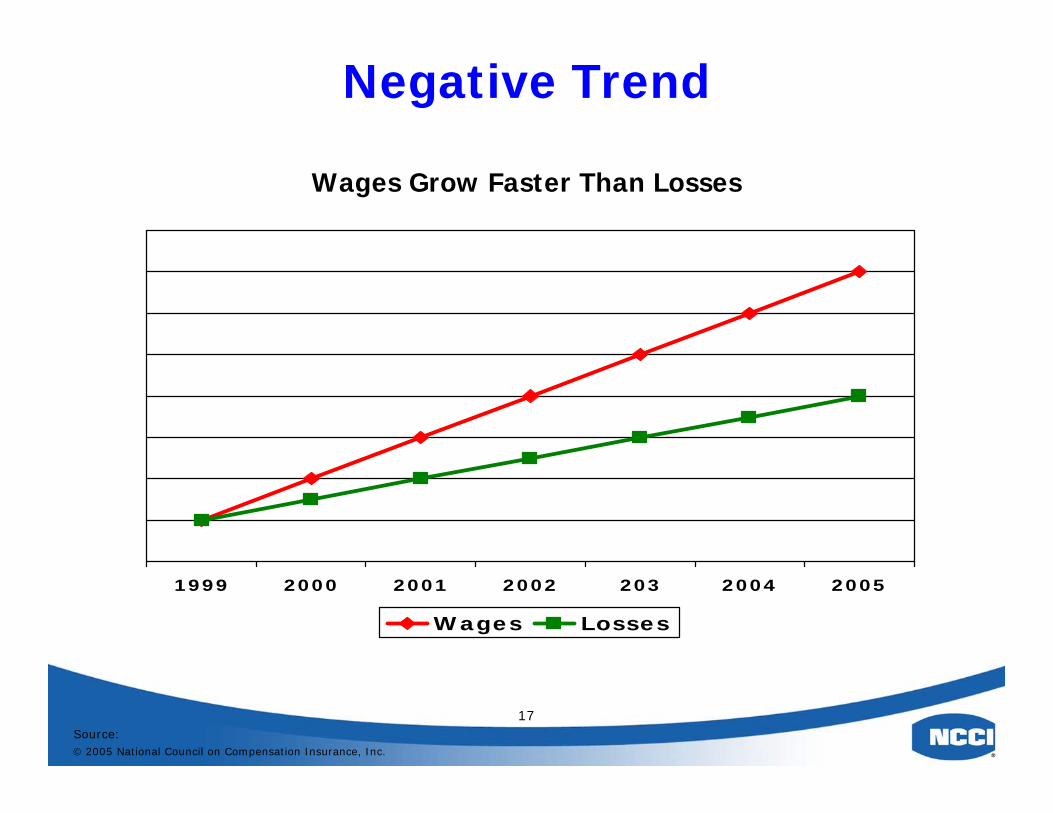
Negative Trend
Wages Grow Faster Than Losses
1999 2000 2001 2002 203 2004 2005
Wages Losses
Source:© 2005 National Council on Compensation Insurance, Inc.
18
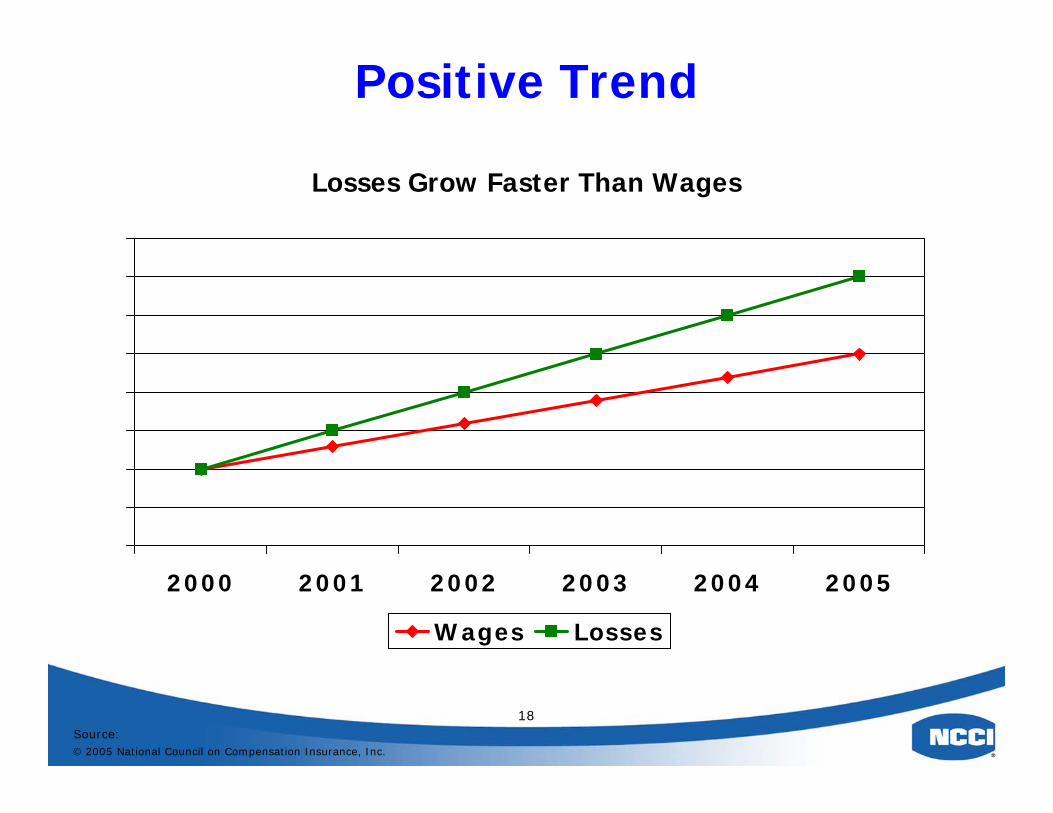
Positive Trend
Losses Grow Faster Than Wages
2000 2001 2002 2003 2004 2005
Wages Losses
Source:© 2005 National Council on Compensation Insurance, Inc.
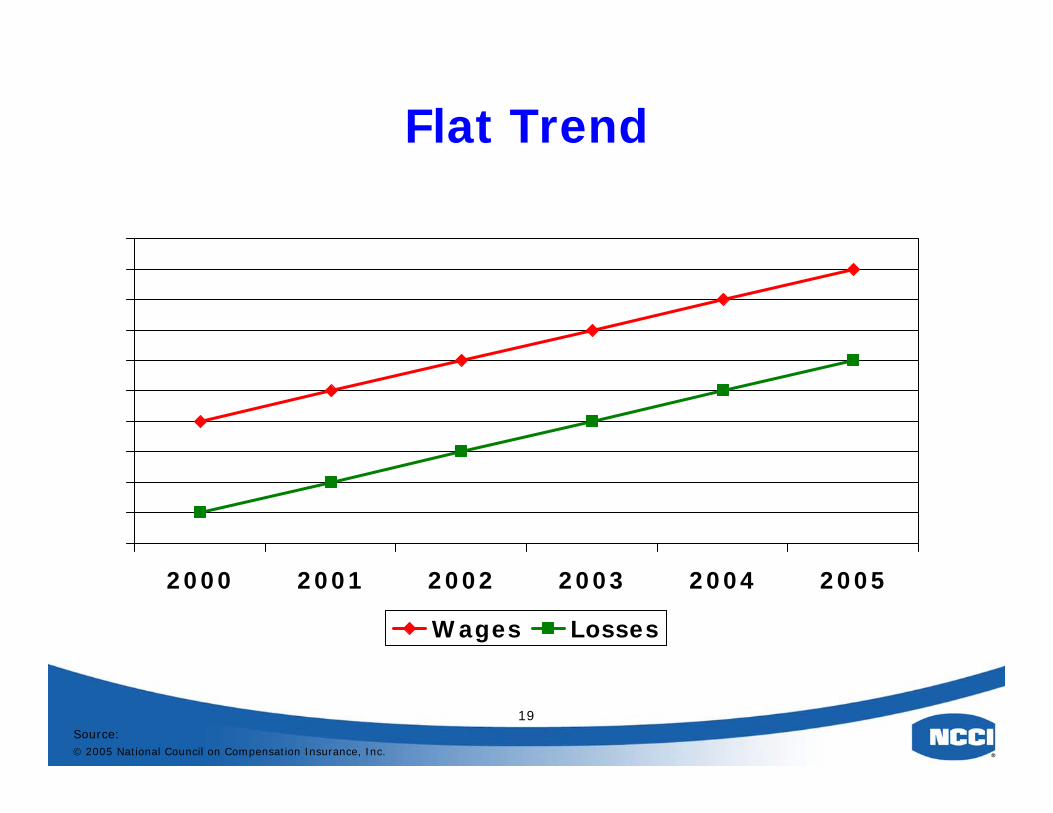
19
Flat Trend
2000 2001 2002 2003 2004 2005
Wages Losses
Source:© 2005 National Council on Compensation Insurance, Inc.
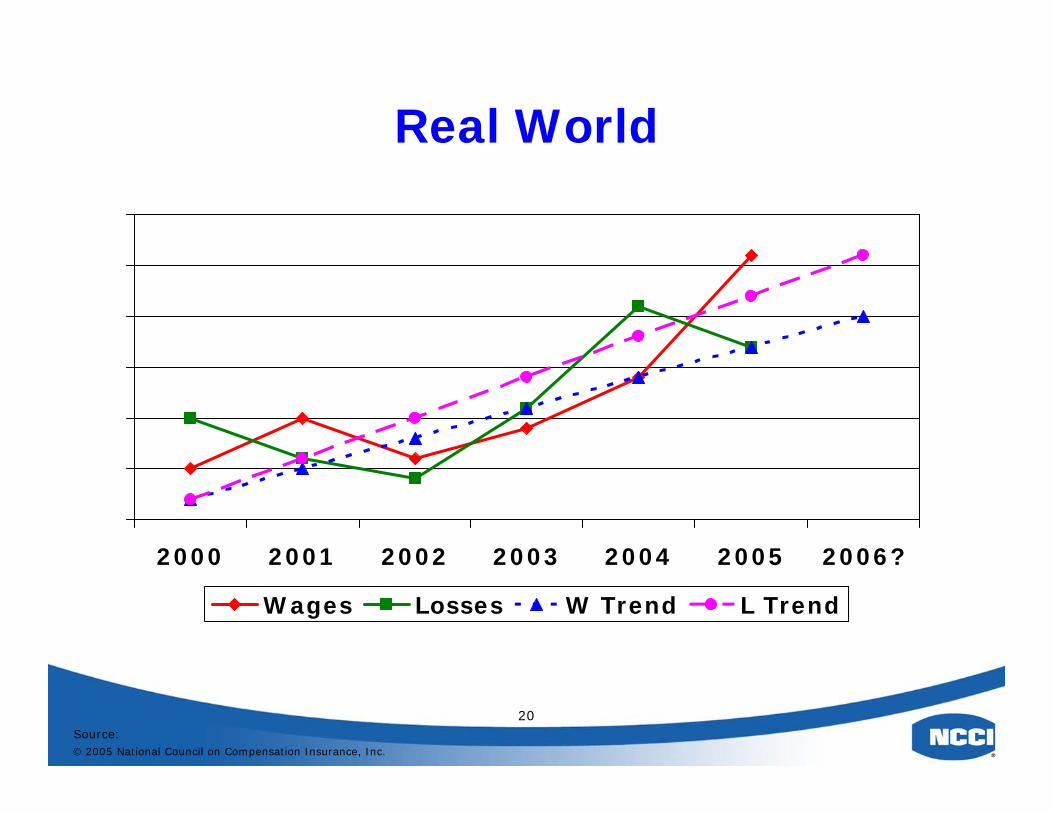
20
Real World
2000 2001 2002 2003 2004 2005 2006?
Wages Losses W Trend L Trend
Source:© 2005 National Council on Compensation Insurance, Inc.
21
3rd Step:Analyze & Include Any Changes
• Legislation
•Court Decisions
•Regulations
Source:© 2005 National Council on Compensation Insurance, Inc.
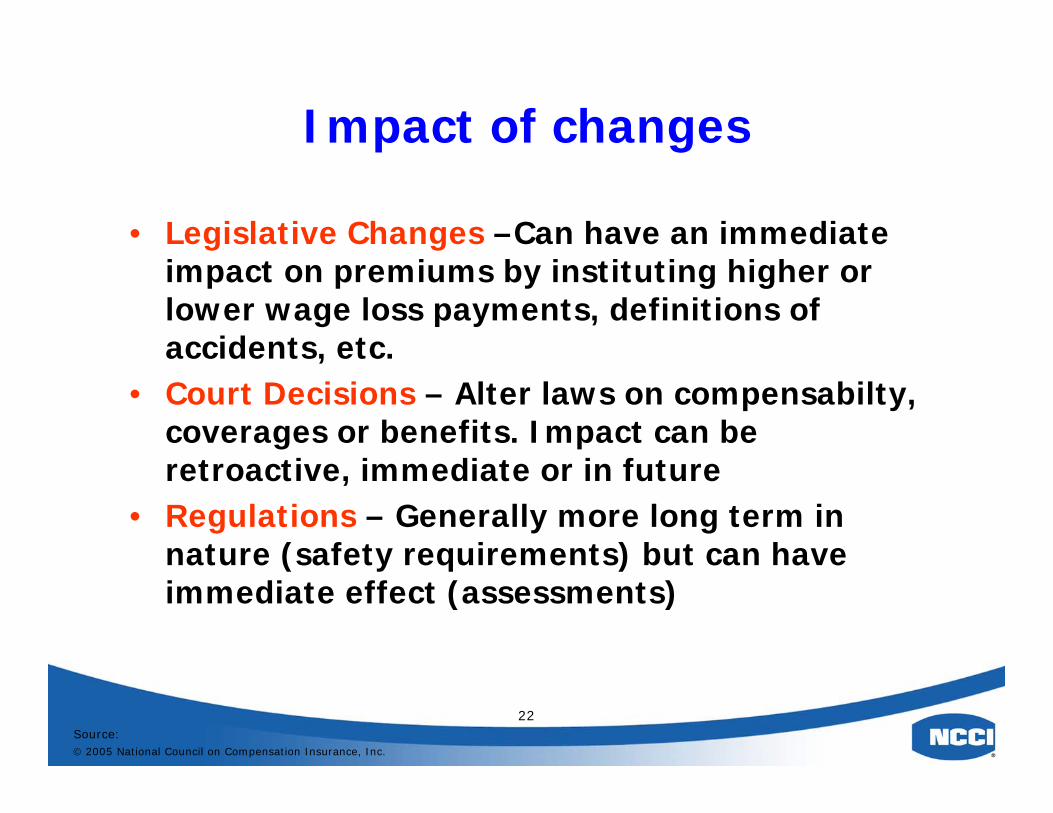
22
Impact of changes
• Legislative Changes –Can have an immediate impact on premiums by instituting higher or lower wage loss payments, definitions of accidents, etc.
• Court Decisions – Alter laws on compensabilty, coverages or benefits. Impact can be retroactive, immediate or in future
• Regulations – Generally more long term in nature (safety requirements) but can have immediate effect (assessments)
Source:© 2005 National Council on Compensation Insurance, Inc.
23
If we continue at the same level…
• Will thingsbalance out?
• Will there be enough money to pay claims?
• Will there be more than needed?
Source:© 2005 National Council on Compensation Insurance, Inc.
24
4th Step: Sanity Check
Check outside sourcesfor independentverification:• DOL• WCD• OSHA• BLS• Carriers• Guy on the street
Source:© 2005 National Council on Compensation Insurance, Inc.
25
5th Step: Determine Overall Premium Level
Add everything upto determine whatthe overall premiumlevel needs to do: • Up?• Down? • No change?
Source:© 2005 National Council on Compensation Insurance, Inc.
26
6th Step:Spread Out The Changes
Not equitable to apply the rate change unilaterally to all employers
– Distribute to 5 Industry groups based on their experience
– Distribute to individual classifications based on their experience
Source:© 2005 National Council on Compensation Insurance, Inc.
27
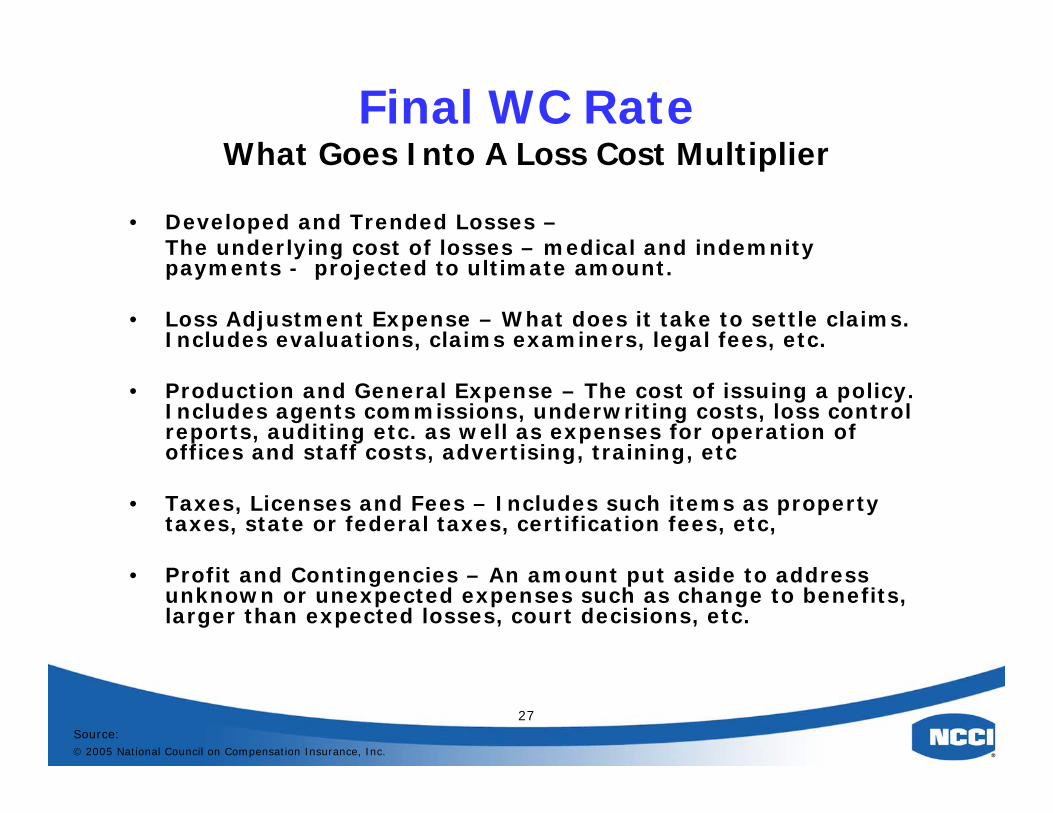
Final WC RateWhat Goes Into A Loss Cost Multiplier
• Developed and Trended Losses –The underlying cost of losses – medical and indemnity payments - projected to ultimate amount.
• Loss Adjustment Expense – What does it take to settle claims. Includes evaluations, claims examiners, legal fees, etc.
• Production and General Expense – The cost of issuing a policy. Includes agents commissions, underwriting costs, loss control reports, auditing etc. as well as expenses for operation of offices and staff costs, advertising, training, etc
• Taxes, Licenses and Fees – Includes such items as property taxes, state or federal taxes, certification fees, etc,
• Profit and Contingencies – An amount put aside to address unknown or unexpected expenses such as change to benefits, larger than expected losses, court decisions, etc.
Source:© 2005 National Council on Compensation Insurance, Inc.
28
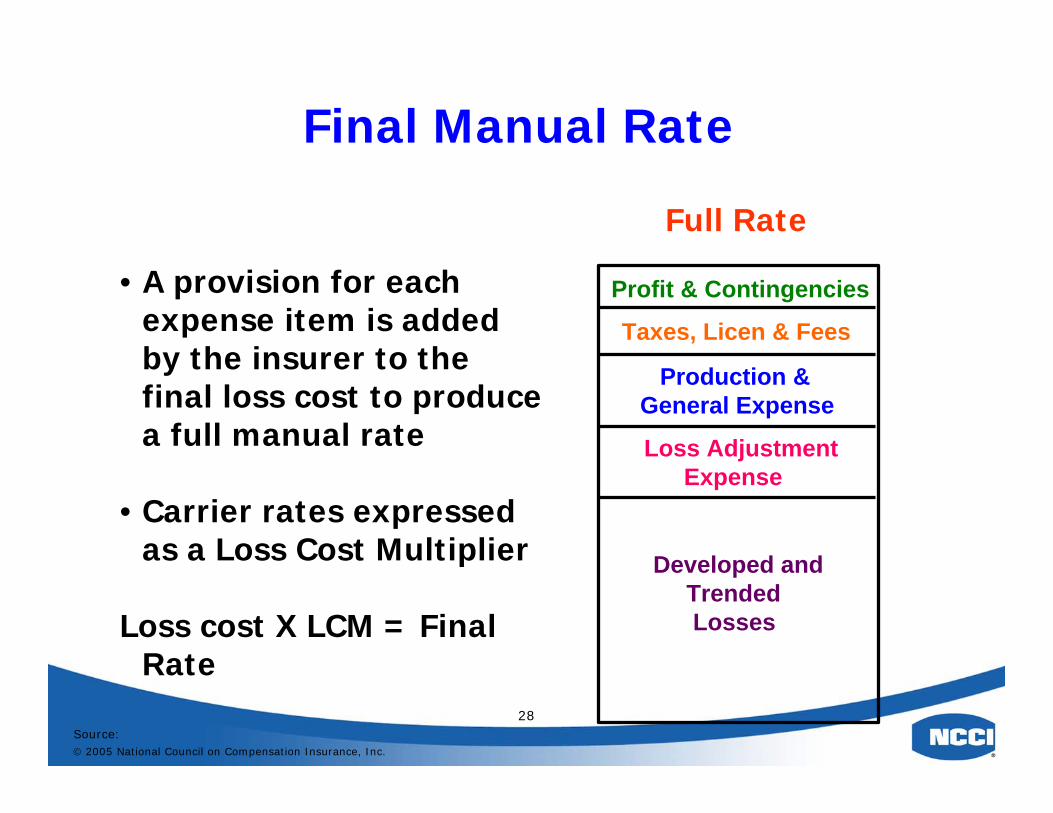
• A provision for each expense item is added by the insurer to the final loss cost to produce a full manual rate
• Carrier rates expressed as a Loss Cost Multiplier
Loss cost X LCM = Final Rate
Profit & Contingencies
Taxes, Licen & Fees
Production &General Expense
Loss AdjustmentExpense
Developed andTrendedLosses
Full Rate
Final Manual Rate
Source:© 2005 National Council on Compensation Insurance, Inc.
29
Final Premium Impact
• What does this mean to the average employer?
• Are there other factors involved?– Growth– Change in exposure– Losses
• Bottom Line:“How much will this cost me?”
Source:© 2005 National Council on Compensation Insurance, Inc.
30
Programs "tailor" the final premium to better match the characteristics of each insured
• Experience rating
• Contractors Premium Credit Program
• Schedule Rating
• Premium discounts by size of policy
• Retrospective Rating
• Etc.
Policyholder Pricing Programs
Source:© 2005 National Council on Compensation Insurance, Inc.
31
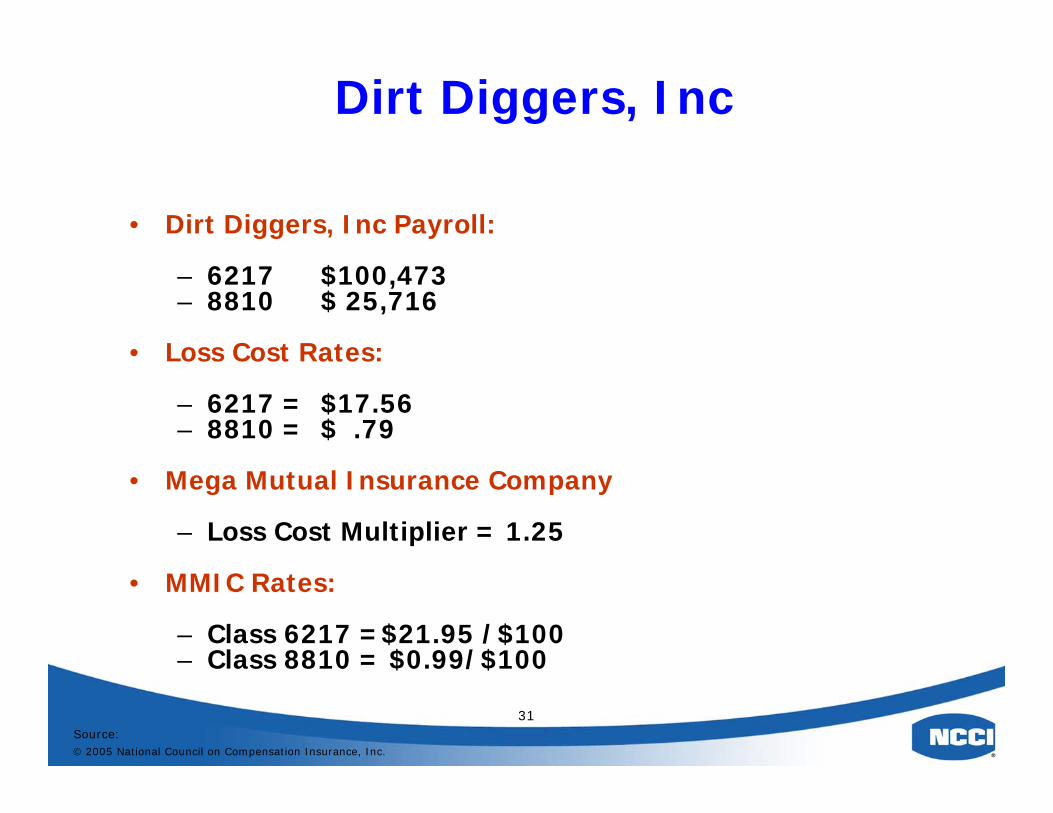
Dirt Diggers, Inc
• Dirt Diggers, Inc Payroll:
– 6217 $100,473– 8810 $ 25,716
• Loss Cost Rates:
– 6217 = $17.56– 8810 = $ .79
• Mega Mutual Insurance Company
– Loss Cost Multiplier = 1.25
• MMIC Rates:
– Class 6217 =$21.95 /$100– Class 8810 = $0.99/$100
Source:© 2005 National Council on Compensation Insurance, Inc.
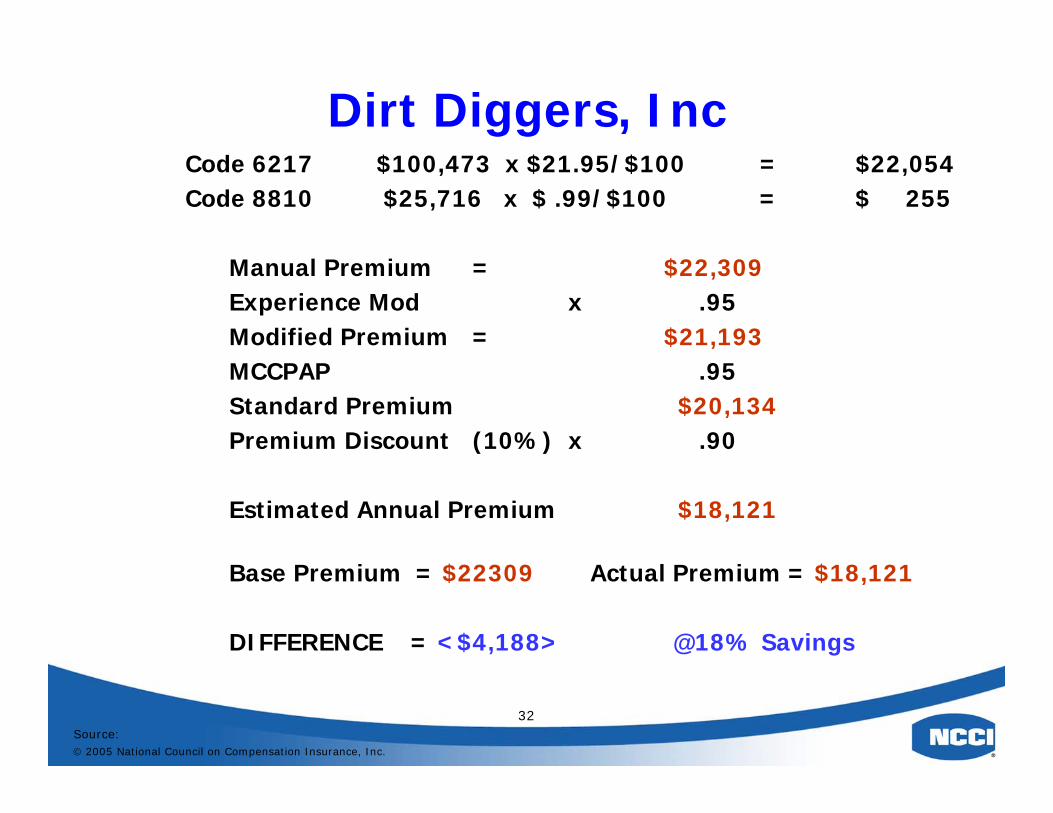
32
Dirt Diggers, IncCode 6217 $100,473 x $21.95/$100 = $22,054Code 8810 $25,716 x $ .99/$100 = $ 255
Manual Premium = $22,309Experience Mod x .95Modified Premium = $21,193MCCPAP .95Standard Premium $20,134Premium Discount (10%) x .90
Estimated Annual Premium $18,121
Base Premium = $22309 Actual Premium = $18,121
DIFFERENCE = <$4,188> @18% Savings
Source:© 2005 National Council on Compensation Insurance, Inc.
33
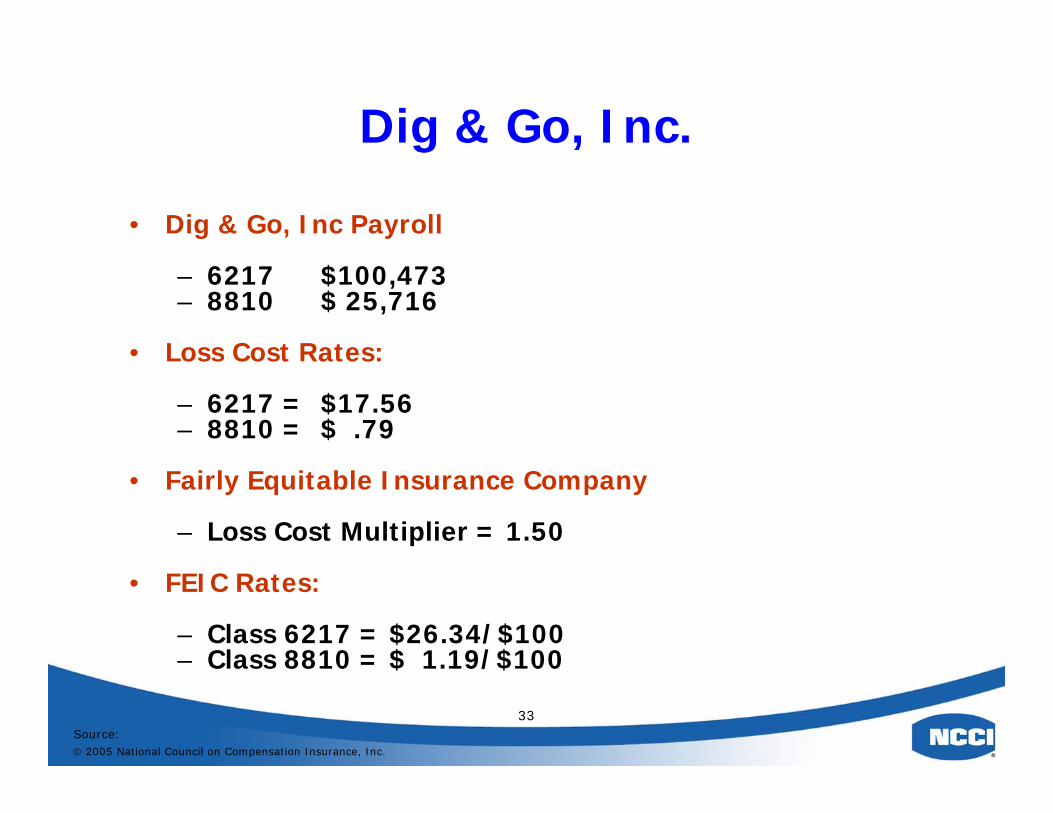
Dig & Go, Inc.
• Dig & Go, Inc Payroll
– 6217 $100,473– 8810 $ 25,716
• Loss Cost Rates:
– 6217 = $17.56– 8810 = $ .79
• Fairly Equitable Insurance Company
– Loss Cost Multiplier = 1.50
• FEIC Rates:
– Class 6217 = $26.34/$100– Class 8810 = $ 1.19/$100
Source:© 2005 National Council on Compensation Insurance, Inc.
34
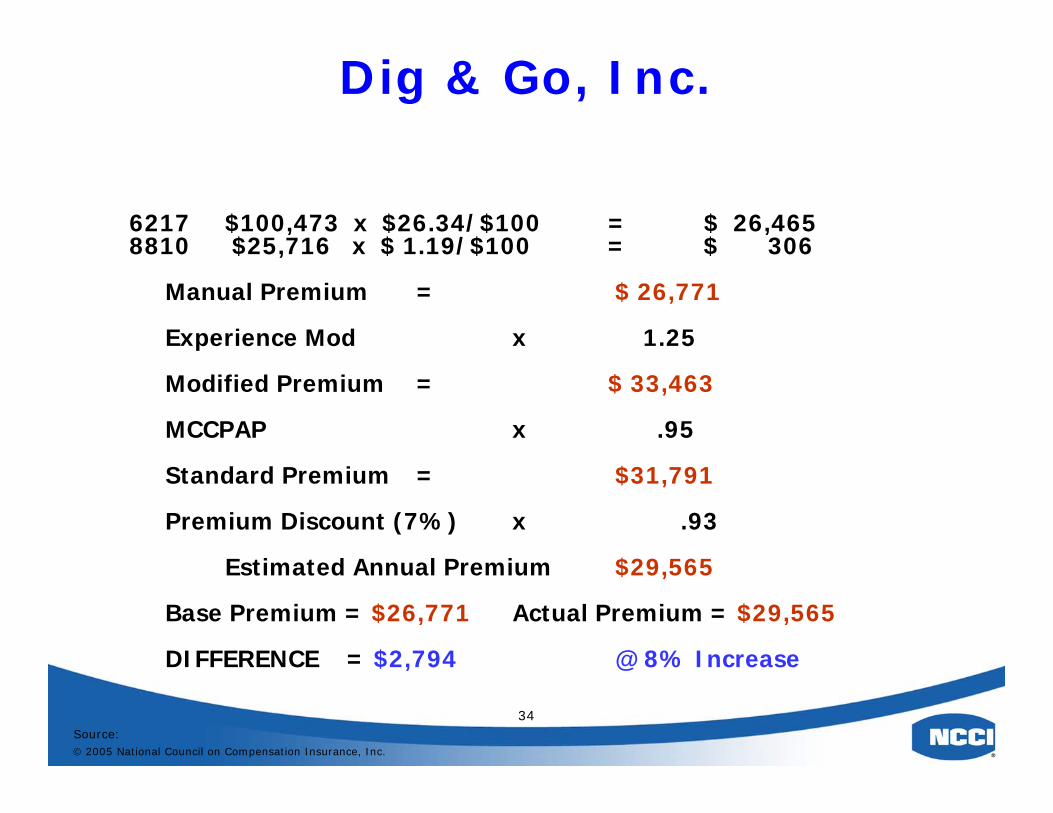
Dig & Go, Inc.
6217 $100,473 x $26.34/$100 = $ 26,4658810 $25,716 x $ 1.19/$100 = $ 306
Manual Premium = $ 26,771
Experience Mod x 1.25
Modified Premium = $ 33,463
MCCPAP x .95
Standard Premium = $31,791
Premium Discount (7%) x .93
Estimated Annual Premium $29,565
Base Premium = $26,771 Actual Premium = $29,565
DIFFERENCE = $2,794 @ 8% Increase
Source:© 2005 National Council on Compensation Insurance, Inc.
35
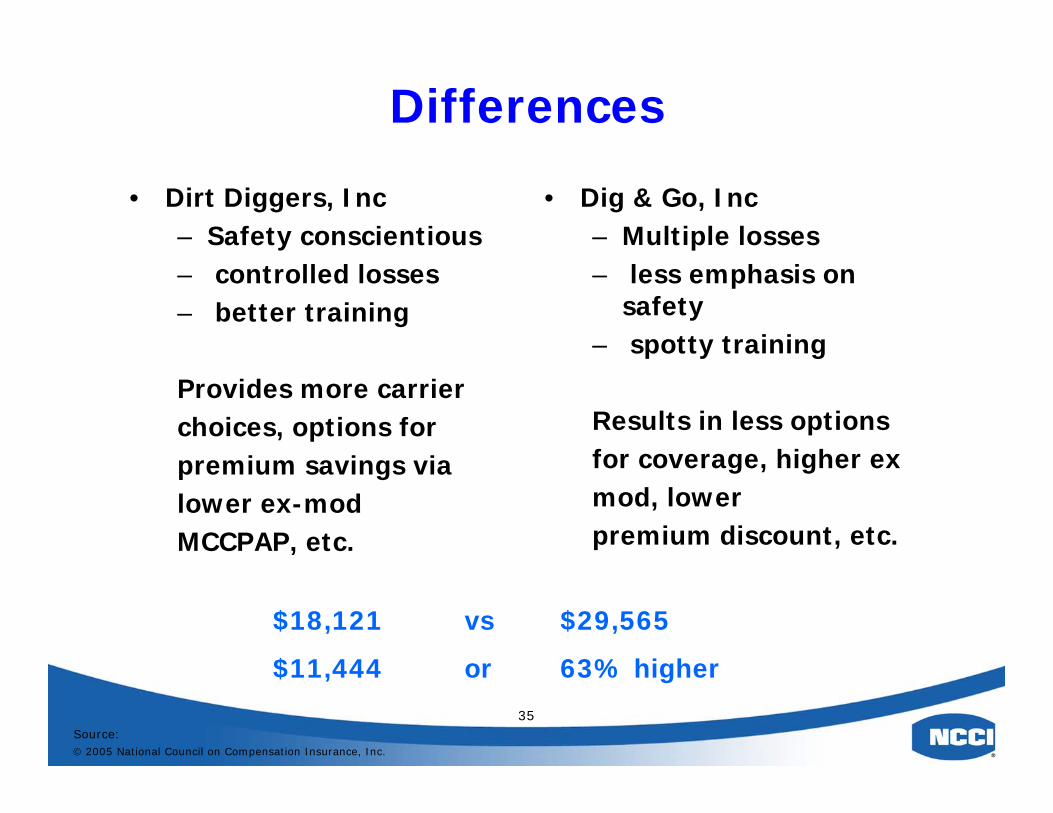
Differences
• Dirt Diggers, Inc– Safety conscientious– controlled losses– better training
Provides more carrierchoices, options for premium savings vialower ex-modMCCPAP, etc.
• Dig & Go, Inc– Multiple losses– less emphasis on
safety– spotty training
Results in less optionsfor coverage, higher exmod, lower premium discount, etc.
$18,121 vs $29,565
$11,444 or 63% higher
Source:© 2005 National Council on Compensation Insurance, Inc.
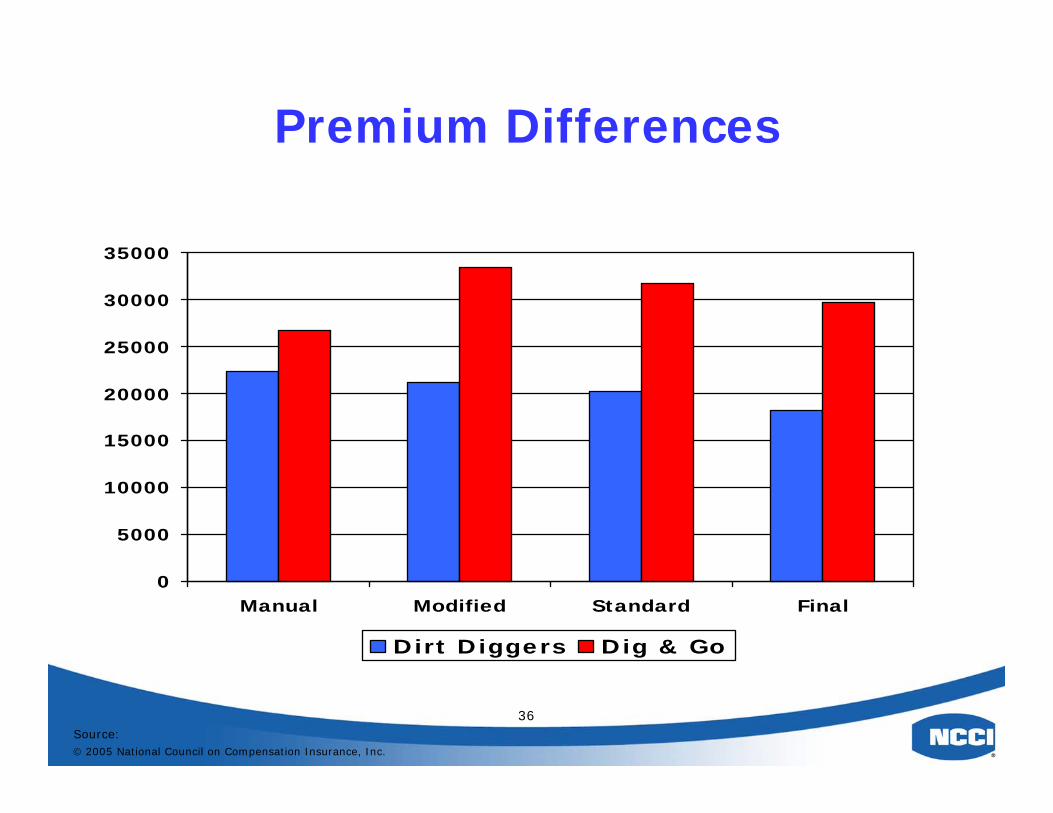
36
Premium Differences
0
5000
10000
15000
20000
25000
30000
35000
Manual Modified Standard Final
Dirt Diggers Dig & Go
Source:© 2005 National Council on Compensation Insurance, Inc.
37
Questions?
Comments?
Source:© 2005 National Council on Compensation Insurance, Inc.
38
Contact:
Contact:
Mike TaylorState RelationsNCCI10300 SW Greenburg RoadSuite 550Portland, OR 97223
[email protected] - office503-789-2328 - mobile