Embed Size (px)
Citation preview
Workers Compensation: Economic & Regulatory Considerations
Workers Compensation Educational ConferenceOrlando, FL
August 17, 2010Download at www.iii.org/presentations
Robert P. Hartwig, Ph.D., CPCU, President & EconomistInsurance Information Institute 110 William Street New York, NY 10038
Tel: 212.346.5520 Cell: 917.453.1885 [email protected] www.iii.org

2
Presentation Outline
Workers Compensation and the Economy
Labor Market Trends & Workers Comp
Employment, Unemployment & Payroll Exposure
Measures of Production and Capacity Utilization
Labor Market Performance and Workers Comp Claiming Behavior
Industry and Occupation Growth Analysis through 2018
Crisis and Recovery Exposure Drivers in Workers Comp Investment Outlook, Regulation, Torts, Terrorism, Healthcare Reform
Sources of Future Exposure Growth Favored industries and occupations: 2010 - 2018
Inflation Outlook: Workers Comp Cost Driver
Financial Market Impacts
Persistently low interest rates and the long-tailed nature of worker comp
Healthcare Reform and Workers Compensation
Q&A

3
Workers Compensation and the Economy
Workers Comp Exposure and Performance is Intimately Linked to
the Economy and Labor Market

4
US Real GDP Growth*
* Estimates/Forecasts from Blue Chip Economic Indicators.Source: US Department of Commerce, Blue Economic Indicators 8/10; Insurance Information Institute.
2.7
%
0.9
%
3.2
%
2.3
%
2.9
%
-0.7
%
0.6
%
-4.0
%
-6.8
% -4.9
%
-0.7
%
1.6
%
5.0
%
3.7
%
2.4
%
2.4
%
2.7
%
2.8
%
2.9
%
3.1
%
3.2
%
4.1
%
1.1
%
1.8
%
2.5
% 3.6
%
3.1
%
-8%
-6%
-4%
-2%
0%
2%
4%
6%
2
00
0
2
00
1
2
00
2
2
00
3
2
00
4
2
00
5
2
00
6
07
:1Q
07
:2Q
07
:3Q
07
:4Q
08
:1Q
08
:2Q
08
:3Q
08
:4Q
09
:1Q
09
:2Q
09
:3Q
09
:4Q
10
:1Q
10
:2Q
10
:3Q
10
:4Q
11
:1Q
11
:2Q
11
:3Q
11
:4Q
Demand for Commercial Insurance Has Been Impacted by Sluggish Economic Conditions
Real GDP Growth (%)
Recession began in Dec. 2007. Economic toll of credit
crunch, housing slump, labor market contraction has
been severe but modest recovery is underway
The Q4:2008 decline was the steepest since the Q1:1982 drop of 6.8%
Economic growth up sharply in late 2009 with rebuilding
of inventories and stimulus. More moderate growth expected in 2010/11 as
recovery remains sluggish.

7
Labor Market Trends
Massive Job Losses Sapped the Economy and the Workers Comp
Payroll Exposure BaseThe Long Road to Recovery

8
Unemployment and Underemployment Rates: Rocketed Up in 2008-09; Stabilizing in 2010?
2
4
6
8
10
12
14
16
18
Jan 00 Jan 01 Jan 02 Jan 03 Jan 04 Jan 05 Jan 06 Jan 07 Jan 08 Jan 09 Jan 10
Traditional Unemployment Rate U-3
Unemployment + Underemployment Rate U-6
Jun10
Unemployment rate was 9.5% in
June
Unemployment peaked at 10.1%
in Oct. 2009, highest monthly rate since 1983.
Peak rate in the last 30 years: 10.8% in Nov -
Dec 1982
Source: US Bureau of Labor Statistics; Insurance Information Institute.
U-6 went from 8.0% in March
2007 to 17.5% in Oct 2009; Stood at 16.5% in June
2010
January 2000 through June 2010, Seasonally Adjusted (%)
Recession ended in
November 2001
Unemployment kept rising for
19 more months
Recession began in
December 2007

10
US Unemployment Rate
4.5
%
4.5
%
4.6
%
4.8
%
4.9
% 5.4
% 6.1
%
6.9
%
8.1
%
9.3
%
9.6
% 10
.0%
9.7
%
9.7
%
9.6
%
9.4
%
9.2
%
9.0
%
8.8
%9.5
%
4.0%
5.0%
6.0%
7.0%
8.0%
9.0%
10.0%
11.0%
07
:Q1
07
:Q2
07
:Q3
07
:Q4
08
:Q1
08
:Q2
08
:Q3
08
:Q4
09
:Q1
09
:Q2
09
:Q3
09
:Q4
10
:Q1
10
:Q2
10
:Q3
10
:Q4
11
:Q1
11
:Q2
11
:Q3
11
:Q4
Rising unemployment eroded payrolls
and workers comp’s exposure base.
Unemployment likely peaked at 10% in late 2009.
* = actual; = forecastsSources: US Bureau of Labor Statistics; Blue Chip Economic Indicators (8/10); Insurance Information Institute
2007:Q1 to 2011:Q4F*
Unemployment forecasts remain stubbornly high
through 2011

12
Unemployment Rates by State, June 2010:Highest 25 States*
10.0
10.0
10.1
10.0
10.0
10.1
9.2
9.0
9.1
8.89.
6
8.8
8.99.
610.711
.4
10.3
10.4
10.5
10.511
.0
13.2
12.3
12.0
14.2
0
2
4
6
8
10
12
14
16
NV MI CA RI FL MS SC OR OH IL AL TN IN NC KY GA DC NJ AZ PA MO MA WA ID CT
Une
mpl
oym
ent R
ate
(%)
*Provisional figures for June 2010, seasonally adjusted.
Sources: US Bureau of Labor Statistics; Insurance Information Institute.
In June the majority of states (39 and DC) recorded a decrease in unemployment rates, while just 5 out of 50 states had
increases.

13
6.8
6.5
6.3
6.0
6.8
6.87.
17.
2
4.54.
85.
9
7.0
7.0
3.6
6.8
8.08.2
7.37.57.
97.
98.08.
5
8.2
8.28.
5
0
2
4
6
8
10
WV DE TX NY NM ME CO WI AK AR MT UT MD VA LA WY OK MN IA KS HI VT NH NE SD ND
Une
mpl
oym
ent R
ate
(%)
Unemployment Rates By State, June 2010: Lowest 25 States*
*Provisional figures for June 2010, seasonally adjusted.Sources: US Bureau of Labor Statistics; Insurance Information Institute.
In June the majority of states (39 and DC) recorded a decrease in unemployment rates, while just 5 out of 50 states had
increases.

14
Monthly Change Employment*-7
2
-14
4-1
22
-16
0-1
37
-16
1
-12
8-1
75
-32
1
-38
0-5
97
-68
1-7
79
-72
6
-75
3-5
28 -3
87
-51
5 -34
6 -21
2-2
25
-22
46
4
-10
9
14 39
20
8 31
3 43
2
-22
1-1
31
-1,000
-800
-600
-400
-200
0
200
400
600
Jan
08
Fe
b 0
8
Ma
r 0
8
Ap
r 0
8M
ay
08
Jun
08
Jul 0
8
Au
g 0
8
Se
p 0
8O
ct 0
8
No
v 0
8
De
c 0
8Ja
n 0
9
Fe
b 0
9M
ar
09
Ap
r 0
9
Ma
y 0
9Ju
n 0
9
Jul 0
9A
ug
09
Se
p 0
9
Oct
09
No
v 0
9
De
c 0
9
Jan
10
Fe
b 1
0
Ma
r 1
0A
pr
10
Ma
y 1
0
Jun
10
Jul 1
0
Monthly Losses in Dec. 08–Mar. 09 Were
the Largest in the Post-WW II Period
*Estimate based on Reuters poll of economists.Source: US Bureau of Labor Statistics: http://www.bls.gov/ces/home.htm; Insurance Information Institute
Job Losses Since the Recession Began in Dec. 2007 Peaked at 8.4 Mill in Dec. 09; Stands at 7.7 Million Through June 2010;
14.6 Million People are Now Defined as Unemployed
January 2008 through July 2010* (Thousands)
May’s gain of 432,000 jobs was distorted by the hiring of 411,000 temporary Census workers. Census job losses totaled 225,000 in June and
143,000 in July, distorting figures in both months. Private sector employment was up 31,000 in May,
51,000 in June and 71,000 in July.
15
US Nonfarm Private Employment1
38
.01
38
.11
38
.01
37
.91
37
.81
37
.81
37
.71
37
.61
37
.61
37
.41
37
.01
36
.71
36
.21
35
.11
33
.51
32
.81
32
.11
31
.51
31
.21
30
.61
30
.31
30
.11
29
.91
29
.61
29
.71
29
.61
29
.61
29
.61
29
.81
30
.21
30
.61
30
.41
30
.2
129130131132133134135136137138139
No
v 0
7D
ec
07
Jan
08
Fe
b 0
8M
ar
08
Ap
r 0
8M
ay
08
Jun
eJu
l 08
Au
g 0
8S
ep
08
Oct
08
No
v 0
8D
ec
08
Jan
09
Fe
b 0
9M
ar
09
Ap
r 0
9M
ay
09
Jun
09
Jul 0
9A
ug
09
Se
p 0
9O
ct 0
9N
ov
09
De
c 0
9Ja
n 1
0F
eb
10
Ma
r 1
0A
pr
10
Ma
y 1
0Ju
n 1
0Ju
l 10
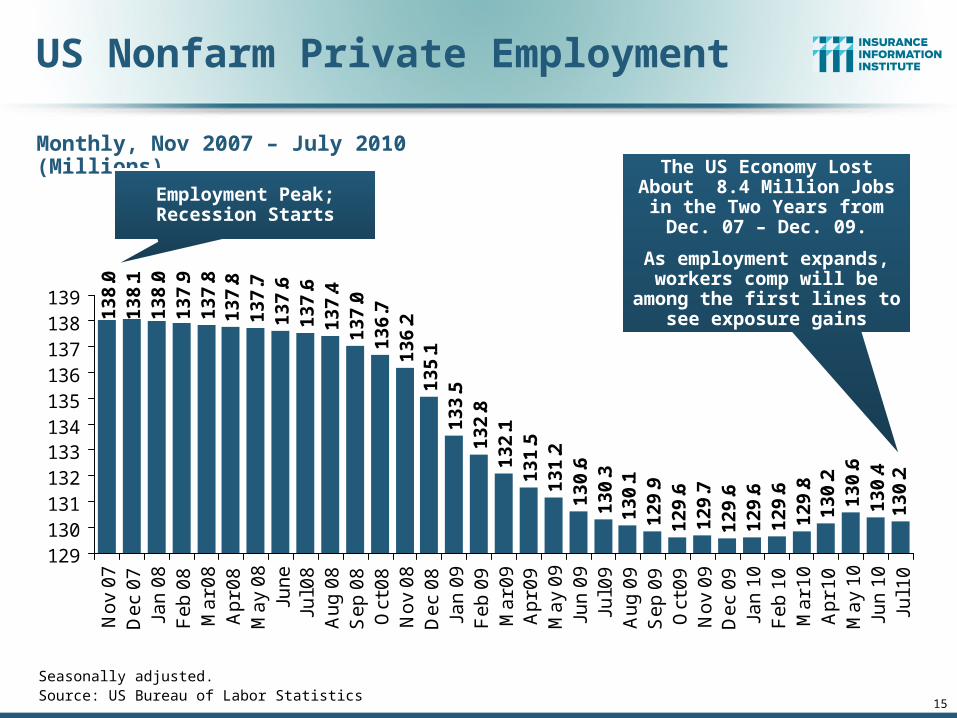
Monthly, Nov 2007 – July 2010 (Millions)
The US Economy Lost About 8.4 Million Jobs in the Two
Years from Dec. 07 – Dec. 09.
As employment expands, workers comp will be among the first lines to see exposure
gains
Employment Peak; Recession Starts
Seasonally adjusted. Source: US Bureau of Labor Statistics
16
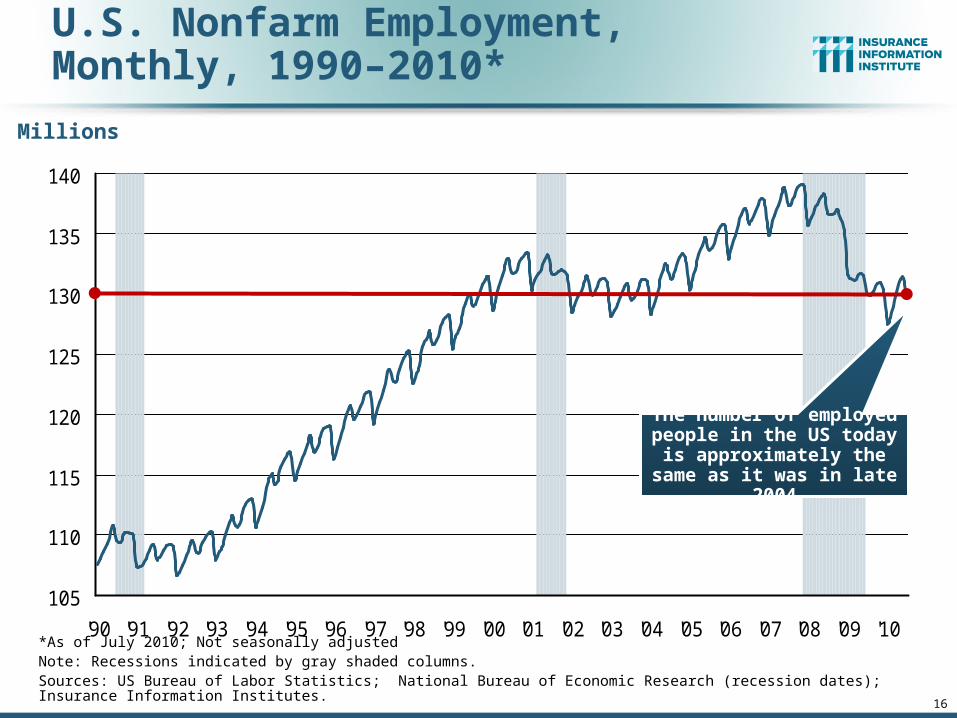
U.S. Nonfarm Employment,Monthly, 1990–2010*
*As of July 2010; Not seasonally adjustedNote: Recessions indicated by gray shaded columns.Sources: US Bureau of Labor Statistics; National Bureau of Economic Research (recession dates); Insurance Information Institutes.
Millions
105
110
115
120
125
130
135
140
'90 '91 '92 '93 '94 '95 '96 '97 '98 '99 '00 '01 '02 '03 '04 '05 '06 '07 '08 '09 '10
The number of employed people in the US today is
approximately the same as it was in late 2004

Estimated Effect of Recessions* on Payroll (Workers Comp Exposure)
*Data represent maximum recorded decline over 12-month period using annualized quarterly wage and salary accrual dataSource: Insurance Information Institute research; Federal Reserve Bank of St. Louis (wage and salary data); National Bureau of Economic Research (recession dates).
-4.4%
-2.0%-1.1%
1.1%
3.7%4.6%
8.5%
3.5%
2.1%
-0.5%
-3.6%
-6%
-4%
-2%
0%
2%
4%
6%
8%
10%
1948-1949
1953-1954
1957-1958
1960-1961
1969-1970
1973-1975
1980 1981-1982
1990-1991
2001 2007-2009
Recessions in the 1970s and 1980s saw smaller exposure impacts
because of continued wage inflation, a factor not present
during the 2007-2009 recession
The Dec. 2007 to mid-2009 recession
caused the largest impact on WC
exposure in 60 years
(Percent Change)
(All Post WWII Recessions)
Recession Dates (Beginning/Ending Years)

18
Wage & Salary Disbursement (Private Employment) vs. WC NWP ($ Billions)
Wage & Salary Disbursements (Payroll Base) vs. Workers Comp Net Written Premiums
* Average Wage and Salary data as of 10/1/2009. Shaded areas indicate recessions. **Estimated “official” end of recession June 2009.Source: US Bureau of Economic Analysis; Federal Reserve Bank of St. Louis at http://research.stlouisfed.org/fred2/series/WASCUR ; I.I.I. Fact Books
Weakening Payrolls Have Eroded $2B+ in Workers Comp Premiums; Nearly 29% of NPW Has Been Eroded Away by the Soft Market and Weak Economy
7/90-3/91 3/01-11/01
$0
$1,000
$2,000
$3,000
$4,000
$5,000
$6,000
$7,000
90 91 92 93 94 95 96 97 98 99 00 01 02 03 04 05 06 07 08 09*
$0
$10
$20
$30
$40
$50
$60
Wage & SalaryDisbursements
WC NPW
WC net premiums written were down $13.7B or 28.7%
to $34.1B in 2009 after peaking at $47.8B in 2005
12/07-6/09**

Soft Labor Markets and Impacts on WC Claim Frequency
19
Net Impact of Recession Appears to Be a Decline in Frequency;
Swaps and Layoff-Induced Effect

20
Workers Compensation Lost-Time Claim Frequency Continues to Decline*
-4.4
%
0.3
%
-6.5
%
-4.5
%
0.5
%
-3.9
%
-2.3
%
-4.5
%
-6.9
%
-4.5
%
-4.1
%
-3.7
%
-6.6
%
-6.2
%
-3.0
%
-3.4
%
-4.0
%
-9.2
%
-4.2
%
-10%
-8%
-6%
-4%
-2%
0%
2%
91 92 93 94 95 96 97 98 99 00 01 02 03 04 05 06 07 08 09P
(Percent) Lost-Time Claims
Claim frequency fell in 4.0% in 2009, in part due to the recession
Cumulative Change of -54.7%
(1991 – 2008)
2009p: Preliminary based on data valued as of 12/31/2009; *Frequency is defined as the number of lost-time claims per 100,000 workers.1991-2008: Based on data through 12/31/2008, developed to ultimateBased on the states where NCCI provides ratemaking services including state funds; Excludes the effects of deductible policies

21
Frequency: 1926–2009A Long-Term Drift Downward
Note: Recessions indicated by gray bars.Sources: NCCI from US Bureau of Labor Statistics; National Bureau of Economic Research.
Manufacturing – Total Recordable CasesRate of Injury and Illness Cases per 100 Full-Time Workers

22
Note: Recessions indicated by gray bars.Sources: NCC, US Bureau of Labor Statistics;
Workplace Injury Incidence Rates Declined in Last Four Economic Downturns

Crisis and Recovery-Driven Exposure Drivers in WC
23
Myriad of Impacts on Workers Comp Exposure
Filling the Economic Crater

24
43,6
9448
,125
69,3
0062
,436
64,0
04 71,2
77 81,2
3582
,446
63,8
5363
,235
64,8
5371
,549
70,6
4362
,304
52,3
7451
,959
53,5
4954
,027
44,3
6737
,884
35,4
7240
,099
38,5
4035
,037
34,3
1739
,201
19,6
95 28,3
2243
,546
60,8
3714
,607
0
10,000
20,000
30,000
40,000
50,000
60,000
70,000
80,000
90,000
80 81 82 83 84 85 86 87 88 89 90 91 92 93 94 95 96 97 98 99 00 01 02 03 04 05 06 07 08 0910
:Q1
Business Bankruptcy Filings,1980-2010:Q1
Source: American Bankruptcy Institute; Insurance Information Institute
Significant Exposure Implications for All Commercial Lines
There were 60,837 business bankruptcies in 2009, up 40% from 2008 and the most since 1993. 2010:Q1 bankruptcies totaled 14,607, up 18% from Q1:2009
% Change Surrounding Recessions
1980-82 58.6%1980-87 88.7%1990-91 10.3%2000-01 13.0%2006-09 208.9%*

25
Private Sector Business Starts,1993:Q2 – 2009:Q3*
175
186
174
180
186
192
188
187 18
918
6 190 19
419
119
9 204
202
195
196
196
206
206
201
192
198
206
206
203
211
205
212
200 20
520
420
419
720
320
920
1
192
192
193
201 20
420
221
0 212
209
216 22
0 223
220
220
210
221
212
204
218
209
207
199
191 19
317
117
716
9
203
150
160
170
180
190
200
210
220
230
93 94 95 96 97 98 99 00 01 02 03 04 05 06 07 08 09
Business Starts Are Down Nearly 20% in the Current Downturn, Holding Back Most Types of Commercial Insurance Exposure
*Latest available as of June 7, 2010, seasonally adjustedSource: Bureau of Labor Statistics, http://www.bls.gov/news.release/cewbd.t07.htm.
(Thousands)
169,000 businesses started in 2009:Q3, actually declining during
form the prior quarter. The figure is the lowest level since 1993.

66%
68%
70%
72%
74%
76%
78%
80%
82%
Ma
r 0
1
Ju
n 0
1
Se
p 0
1
De
c 0
1
Ma
r 0
2
Ju
n 0
2
Se
p 0
2
De
c 0
2
Ma
r 0
3
Ju
n 0
3
Se
p 0
3
De
c 0
3
Ma
r 0
4
Ju
n 0
4
Se
p 0
4
De
c 0
4
Ma
r 0
5
Ju
n 0
5
Se
p 0
5
De
c 0
5
Ma
r 0
6
Ju
n 0
6
Se
p 0
6
De
c 0
6
Ma
r 0
7
Ju
n 0
7
Se
p 0
7
De
c 0
7
Ma
r 0
8
Ju
n 0
8
Se
p 0
8
De
c 0
8
Ma
r 0
9
Ju
n 0
9
Se
p 0
9
De
c 0
9
Ma
r 1
0
Ju
n 1
0
Recovery in Capacity Utilization is a Positive Sign for Insurance
Source: Federal Reserve Board statistical releases at http://www.federalreserve.gov/releases/g17/Current/default.htm. 26
Hurricane Katrina
March 2001-November 2001
recession
“Full Capacity”
The closer the economy is to operating at “full
capacity,” the greater the demand for insurance
Manufacturing capacity stood at 74.1% in June 2010, above the June 2009 low of 68.3% but
well below the pre-crisis peak of 80%+
Recession began December 2007
Percent of Total Industry Capacity

Where Will the Growth in WC Exposure Come From?
27
Industry and Occupation Growth Analysis

28
Fastest Growing Occupations, 2008–2018:Health/Science/Tech Dominate
Sources: US Bureau of Labor Statistics: Occupational Outlook Handbook, 2010-2011 Edition; Insurance Information Institute
OccupationsPercent change
Number of
new jobs(in thousands)
Wages (May 2008 median) Education/training category
Biomedical engineers 72 11.6 $ 77,400 Bachelor's degree
Network systems and data communications analysts
53 155.8 71,100 Bachelor's degree
Home health aides 50 460.9 20,460 Short-term on-the-job training
Personal and home care aides 46 375.8 19,180 Short-term on-the-job training
Financial examiners 41 11.1 70,930 Bachelor's degree
Medical scientists, except epidemiologists
40 44.2 72,590 Doctoral degree
Physician assistants 39 29.2 81,230 Master's degree
Skin care specialists 38 14.7 28,730 Postsecondary vocational award
Biochemists and biophysicists 37 8.7 82,840 Doctoral degree
Athletic trainers 37 6.0 39,640 Bachelor's degree
Physical therapist aides 36 16.7 23,760 Short-term on-the-job training
Dental hygienists 36 62.9 66,570 Associate degree
Veterinary technologists and technicians
36 28.5 28,900 Associate degree
Dental assistants 36 105.6 32,380 Moderate-term on-the-job training
Computer software engineers, applications
34 175.1 85,430 Bachelor's degree
Medical assistants 34 163.9 28,300 Moderate-term on-the-job training
Physical therapist assistants 33 21.2 46,140 Associate degree
Veterinarians 33 19.7 79,050 First professional degree
Self-enrichment education teachers
32 81.3 35,720 Work experience in a related occupation
Compliance officers, except agriculture, construction, health and safety, and transportation
31 80.8 48,890 Long-term on-the-job training
SOURCE: BLS Occupational Employment Statistics and Division of Occupational Outlook
WC exposure growth the fastest in the health, science and tech areas

29
Occupations with Largest Numerical Growth, 2008–2018: Health, Services Dominate
Sources: US Bureau of Labor Statistics: Occupational Outlook Handbook, 2010-2011 Edition; Insurance Information Institute
Dollar growth in WC exposures should grow the most (at current rate levels) in the health and services industries
Occupations
Number of
new jobs(in thousands) Percent change
Wages (May 2008 median) Education/training category
Registered nurses 581.5 22 $ 62,450 Associate degree
Home health aides 460.9 50 20,460 Short-term on-the-job training
Customer service representatives 399.5 18 29,860 Moderate-term on-the-job training
Combined food preparation and serving workers, including fast food
394.3 15 16,430 Short-term on-the-job training
Personal and home care aides 375.8 46 19,180 Short-term on-the-job training
Retail salespersons 374.7 8 20,510 Short-term on-the-job training
Office clerks, general 358.7 12 25,320 Short-term on-the-job training
Accountants and auditors 279.4 22 59,430 Bachelor's degree
Nursing aides, orderlies, and attendants
276.0 19 23,850 Postsecondary vocational award
Postsecondary teachers 256.9 15 58,830 Doctoral degree
Construction laborers 255.9 20 28,520 Moderate-term on-the-job training
Elementary school teachers, except special education
244.2 16 49,330 Bachelor's degree
Truck drivers, heavy and tractor-trailer
232.9 13 37,270 Short-term on-the-job training
Landscaping and groundskeeping workers
217.1 18 23,150 Short-term on-the-job training
Bookkeeping, accounting, and auditing clerks
212.4 10 32,510 Moderate-term on-the-job training
Executive secretaries and administrative assistants
204.4 13 40,030 Work experience in a related occupation
Management analysts 178.3 24 73,570 Bachelor's or higher degree, plus work experience
Computer software engineers, applications
175.1 34 85,430 Bachelor's degree
Receptionists and information clerks
172.9 15 24,550 Short-term on-the-job training
Carpenters 165.4 13 38,940 Long-term on-the-job trainingSOURCE: BLS Occupational Employment Statistics and Division of Occupational Outlook

30
(Thousands)
704
654
446
322
304
256
236
118
102
788
838
1,431
1,683
2,657
4,017
0 500 1,000 1,500 2,000 2,500 3,000 3,500 4,000 4,500
Health Care and Social Assistance
Professional, Scientific, Tech. Srvs.
Education Services
Administration, Support, Waste Mgmt & Removal
Accomodation & Food Services
Government
Other Services (excl. Govt.)
Retail Trade
Transportation and Warehousing
Finance & Insurance
Arts, Entertainment & Recreation
holesale Trade
Real Estate, Rental & Leasing
Information
Mgmt. of Companies & Enterprises
Health, Science and Education will be
important sources of exposure growth for WC
insurers this decade
Sources: US Bureau of Labor Statistics: Occupational Outlook Handbook, 2010-2011 Edition; Insurance Information Institute
Numeric Change in Wage and Salary Employment in Service-Providing Industries: 2008-2018P

31
Mounting Pressure on Claim Cost Severities?
Inflation Trends:Concerns Over Stimulus Spending
and Monetary Policy

32
Annual Inflation Rates(CPI-U, %), 1990–2011F
2.8 2.6
1.51.9
3.3 3.4
1.3
2.5 2.3
3.0
3.8
2.8
3.8
-0.4
1.6 1.5
2.92.4
3.23.0
5.14.9
-1.0
0.0
1.0
2.0
3.0
4.0
5.0
6.0
90 91 92 93 94 95 96 97 98 99 00 01 02 03 04 05 06 07 08 09 10F11F
Sources: US Bureau of Labor Statistics; Blue Chip Economic Indicators, 8/2010 (forecasts).
There is So Much Slack in the US Economy Inflation Should Not Be a Concern Through 2010/11, but Deficits and Monetary Policy Remain Longer
Run Concerns
Annual Inflation Rates (%) Inflation peaked at 5.6% in August 2008 on high energy and commodity crisis. The recession and the collapse of the
commodity bubble have reduced inflationary pressures

WC Insurers Experience Inflation More Intensely than 2009 CPI Suggests
Source: Bureau of Labor Statistics; Insurance Information Institute.
2.7%
1.8%
6.9%
3.0% 3.0%3.4%
3.1%3.4%
0%
2%
4%
6%
8%
Overall CPI "Core" CPI HospitalServices
Physicians'Services
DentalServices
PrescriptionDrugs
Medical CareCommodities
Medical CPI
(Percent increase Dec 08 to Dec 09)
Healthcare Costs Are a Major WC Insurance Cost Driver. They AreLikely to Increase Faster than the CPI for the Next Few Years, at Least
33
Excludes Food and Energy
Inpatient Services Rose 6.7%;
Outpatient Services Rose 7.4%
4.5%
3.5%2.8%
3.2% 3.5%4.1%
4.6% 4.7%4.0%
4.4% 4.2% 4.0%4.4%
3.7% 3.4%
5.1%
7.4%
10.1%
8.3%
10.6%
7.3%
13.5%
8.8%
7.3%
5.6%
7.4%
5.4% 5.4%
6.7%
5.0%
0%
2%
4%
6%
8%
10%
12%
14%
16%
1995 1996 1997 1998 1999 2000 2001 2002 2003 2004 2005 2006 2007 2008 2009
Change in Medical CPI
Change Med Cost per Lost Time Claim
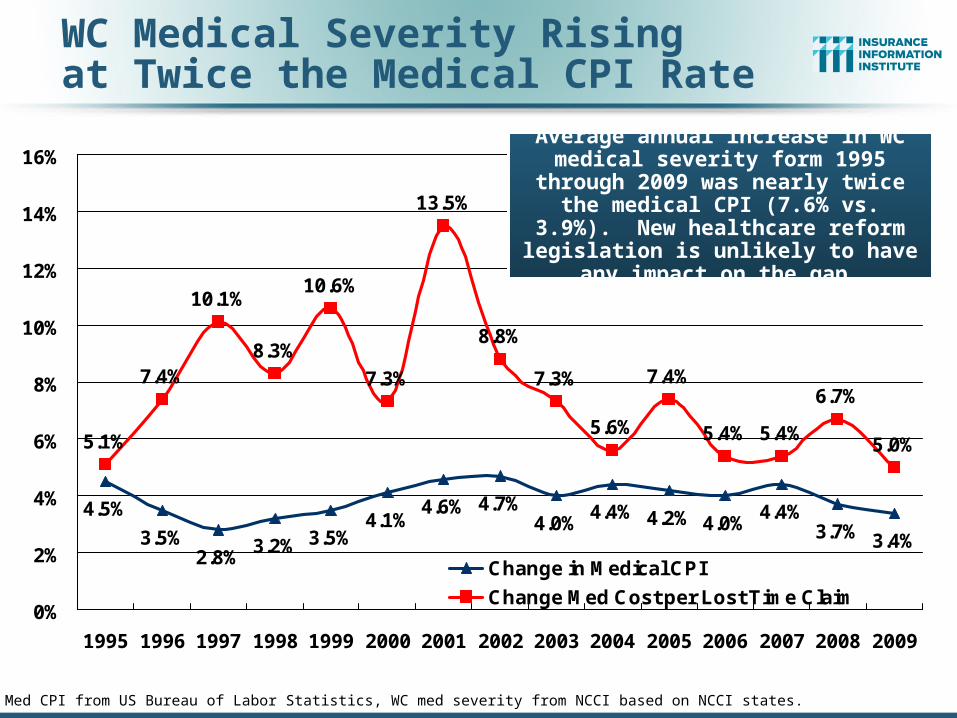
WC Medical Severity Risingat Twice the Medical CPI Rate
Sources: Med CPI from US Bureau of Labor Statistics, WC med severity from NCCI based on NCCI states.
Average annual increase in WC medical severity form 1995 through 2009 was nearly twice the medical CPI (7.6% vs.
3.9%). New healthcare reform legislation is unlikely to have any
impact on the gap.

4.2%
5.2%5.6%
4.7%
6.3%
2.3%
1.1%
2.7%
1.7%
4.7% 4.6%
2.3%
5.9%
7.7%
9.0%
10.1%
4.1%
1.7%
3.1%
5.0% 5.0%5.8%
4.5%
-1.0%
3.5%
3.6%
1.7%
10.1%
9.2%
3.1%
-2%
0%
2%
4%
6%
8%
10%
12%
1995 1997 1999 2001 2003 2005 2007 2009p
Change in CPS Wage Change in Indemnity Cost per Lost-Time Claim
WC Indemnity Severity vs. Wage Inflation
2009p: Preliminary based on data valued as of 12/31/2009; 1991-2008: Based on data through 12/31/2008, developed to ultimate. Based on the states where NCCI provides ratemaking services. Excludes the effects of deductible policies. CPS = Current Population Survey.Source: NCCI
WC indemnity severity is once again outpacing
wage inflation

Investment Performance
36
Persistently Low Interest Rates Must Eventually Impact Pricing as Underwriting Losses Mount

Property/Casualty Insurance Industry Investment Gain: 1994–2010:Q11
$35.4
$42.8$47.2
$52.3
$44.4
$36.0
$45.3$48.9
$59.4$55.7
$64.0
$31.7
$39.0
$12.6
$58.0
$51.9$56.9
$0
$10
$20
$30
$40
$50
$60
$70
94 95 96 97 98 99 00 01 02 03 04 05* 06 07 08 09 10:Q1
In 2008, Investment Gains Fell by 50% Due to Lower Yields andNearly $20B of Realized Capital Losses
2009 Saw Smaller Realized Capital Losses But Declining Investment Income
1 Investment gains consist primarily of interest, stock dividends and realized capital gains and losses.* 2005 figure includes special one-time dividend of $3.2B.Sources: ISO; Insurance Information Institute.
($ Billions) 2009:Q1 gain was
$3.7B

38
Treasury Yield Curves: Pre-Crisis (July 2007) vs. July 2010
0.16% 0.16% 0.20% 0.29%0.62%
2.43%
3.01%
4.82% 4.96% 5.04% 4.96% 4.82% 4.82% 4.88% 5.00% 4.93% 5.00%5.19%
1.76%
0.98%
3.99%3.80%
0%
1%
2%
3%
4%
5%
6%
1M 3M 6M 1Y 2Y 3Y 5Y 7Y 10Y 20Y 30Y
July 2010 Yield Curve*Pre-Crisis (July 2007)
Treasury yield curve is near its most depressed level in at least 45 years. Investment
income is falling as a result
Stock Dividend Cuts Have Further Pressured Investment Income
Sources: Board of Governors of the United States Federal Reserve Bank; Insurance Information Institute.

39
-1.8
%
-1.8
%
-2.0
%
-3.6
%
-3.3
%
-3.3
%
-3.7
%
-4.3
%
-5.2
%
-5.7
%
-7.3%
-1.9
%
-2.1
%
-3.1
%
-8%-7%-6%-5%-4%-3%-2%-1%0%
Perso
nal L
ines
Pvt Pass
Aut
o
Pers P
rop
Comm
ercia
l
Comm
l Auto
Credit
Comm
Pro
p
Comm
Cas
Fidelity
/Sure
ty
War
rant
y
Surplu
s Line
s
Med
Mal
WC
Reinsu
ranc
e**
Lower Investment Earnings Place a Greater Burden on Underwriting and Pricing Discipline
*Based on 2008 Invested Assets and Earned Premiums**US domestic reinsurance onlySource: A.M. Best; Insurance Information Institute.
Reduction in Combined Ratio Necessary to Offset 1% Decline in Investment Yield to Maintain Constant ROE, by Line*

Healthcare Reform & Workers Compensation
40
Likely a Slight, Net Positive for Workers Comp in the Long Run
41
Healthcare Reform: Potential Impacts on Workers Comp Insurers
Source: Managed Care Matters (www.joepaduda.com); Insurance Information Institute.
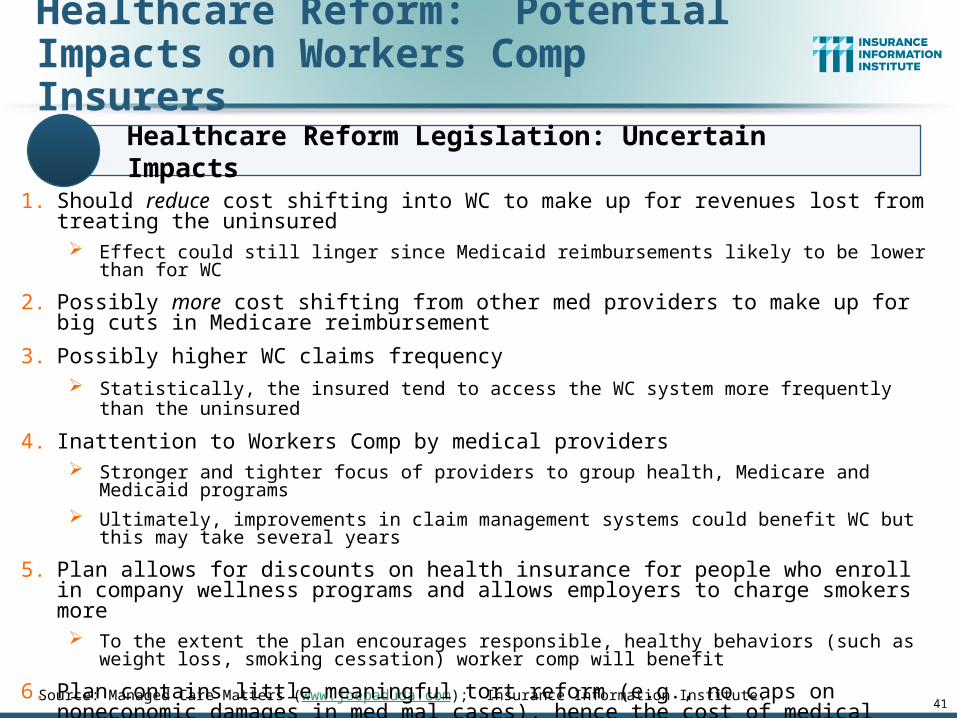
1. Should reduce cost shifting into WC to make up for revenues lost from treating the uninsured Effect could still linger since Medicaid reimbursements likely to be lower than for WC
2. Possibly more cost shifting from other med providers to make up for big cuts in Medicare reimbursement
3. Possibly higher WC claims frequency Statistically, the insured tend to access the WC system more frequently than the uninsured
4. Inattention to Workers Comp by medical providers Stronger and tighter focus of providers to group health, Medicare and Medicaid programs
Ultimately, improvements in claim management systems could benefit WC but this may take several years
5. Plan allows for discounts on health insurance for people who enroll in company wellness programs and allows employers to charge smokers more To the extent the plan encourages responsible, healthy behaviors (such as weight loss, smoking
cessation) worker comp will benefit
6. Plan contains little meaningful tort reform (e.g., no caps on noneconomic damages in med mal cases), hence the cost of medical care, will be inflated by tort costs and the cost of defensive medicine, including care provided through the WC system The CBO priced the savings from tort reform, if adopted, at $54 billion over 10 years.
Healthcare Reform Legislation: Uncertain Impacts

www.iii.org
Thank you for your timeand your attention!
Twitter: twitter.com/bob_hartwig
Insurance Information Institute Online: