Embed Size (px)
Citation preview
2012 WoWorker R
Worke
PrograIn responthousandWashingWorkforcThis law to the thchange c The Worworkers to job retenrollmelayoffs anThe indualso varyretrainincareer sctraining askills, baswith thei ParticipFor this rcompleterecent remonths,
The raciageneral ppercent)a greaterpercent) 1 The 2012programs 2 In this repindividual Hispanics)Islanders (referred towhites (alsAmerican American;
orkforce TraiRetraining
er Retra
am Detainse to dramds of worker
gton citizensce Employmsignificantlyousands of j
careers in or
ker Retraininand the lontraining for
ents vary frond, during r
ustries from wy over time. Ag participan
chools. This eat communsic skills andir tuition.
pant Profireport, reseaed or otherw
eporting yeaup from six
al and ethnicpopulation i. African Amr percentageare at a slig
2 Workforce Traduring 2009-1port, unless otbelongs to on; non-Hispanicalso referred t
o as Native Amso referred to aCommunity Su8 percent are
ning Results
aining P
ils atic changers in major i
s, the Legislament and Tra
y expanded jobless wor
rder to re-en
ng programg-term unema new caree
om year to yeecessions, twhich particAbout one p
nts receive tevaluation, ity and tech
d literacy. Qu
le archers studwise left a coar.1 The med
months on
c compositioin Washingt
mericans (8 pe than their
ghtly lower p
aining Results 0.
therwise statedne group only. c African Amero as Asians/Pa
mericans); non-as whites). Accurvey, 73 percAsians/Pacific
s
Program
es in the strundustries, a
ature enacteaining Act in
the trainingkers who ne
nter the wor
m provides dimployed wier. Program ear in respohe need inccipants are lpercent of wheir traininghowever, is
hnical collegualifying par
ied the resuommunity o
dian length othe last rep
on of Worketon for Asianpercent) andportion of t
percentage.2
reports are ba
d, racial and etThe groups in
ricans (also refacific IslandersHispanic mult
cording to the ent are white;
c Islander; 4 pe
m
ucture of Wand the long
ed the n 1993. g available eed to kforce.
islocated th access
nse to reases. laid off
worker g at private limited to es. The collerticipants m
ults of 7,188 or technical cof enrollmenort.
er Retrainingn/Pacific Islad Native Amthe general 2 In terms of
ased on data o
thnic minority nclude the folloferred to as Afr); non-Hispaniiracial (also ref2010 U.S. Cen3 percent are
ercent are mult
ashington's e-term need
eges providmay receive f
Worker Retcollege prognt for these
g participananders (7 pe
mericans (2 ppopulation,f program co
observed in 20
groups are mowing: Hispanrican Americanic Native Amerferred to as m
nsus Bureau esAfrican Ameri
tiracial; and 11
Every yBoard mperformprografind ouprograthe meperformprogra
economy, thfor training
e training infinancial ass
raining partgram duringparticipants
ts roughly rrcent) and w
percent) are , whereas Hiompletion b
010-11 for indiv
utually exclusnics of any racens); non-Hisparicans and Alaultiracial); andtimates for Waican; 1 percent1 percent are H
year, the Womeasures thmance of ke
ams. In this rut more aboam and who etrics used tomance and h
am performe
he layoffs of programs f
n occupationistance to h
ticipants whg the most s was 12
eflects the whites (74 represented
ispanics (7 by racial and
viduals exiting
ive; that is, an e (also referredanic Asians/Pacskan Natives (a
d non-Hispanicashington fromt are Native
Hispanic.
orkforce he ey workforcereport, you’l
out the o is served, to measure how the ed.
1
f for
nal elp
ho
d at
d
g
d to as cific also c m the
e ll
2012 WoWorker R
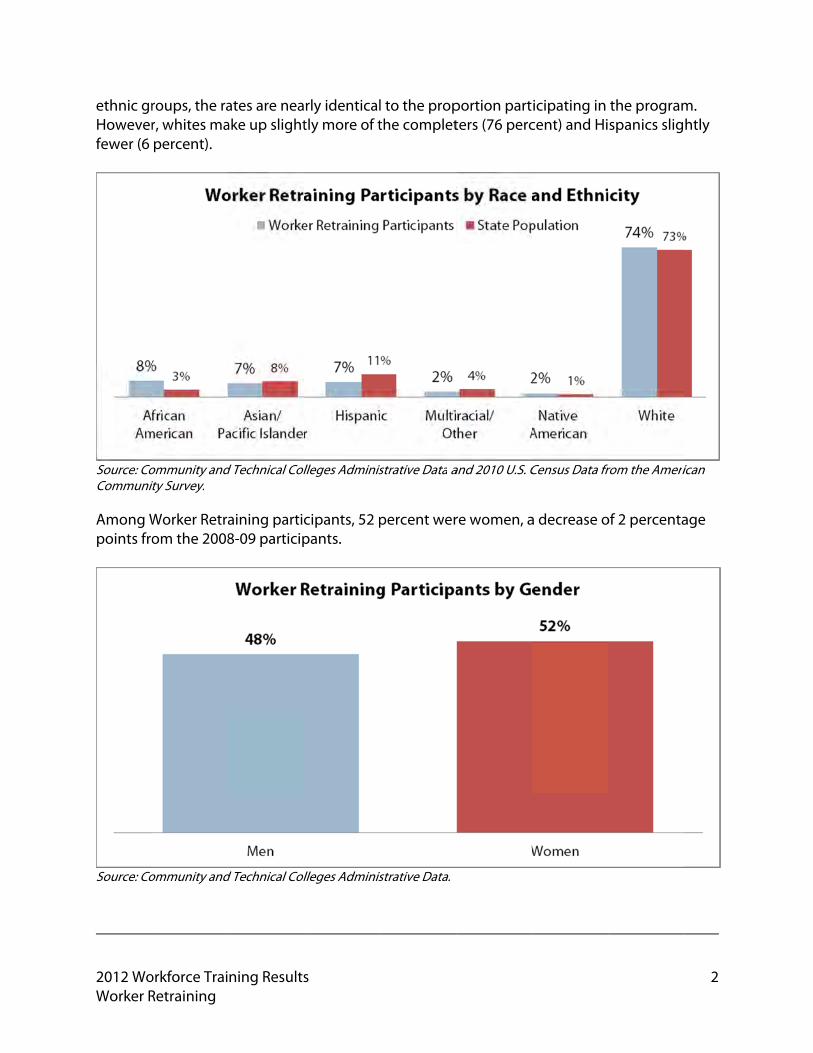
ethnic grHoweverfewer (6
Source: CoCommunit Among Wpoints fro
Source: Co
orkforce TraiRetraining
roups, the rar, whites mapercent).
ommunity andity Survey.
Worker Retraom the 2008
ommunity and
ning Results
ates are neaake up slight
d Technical Col
aining partic8-09 particip
d Technical Col
s
rly identicaltly more of t
lleges Adminis
cipants, 52 ppants.
lleges Adminis
l to the propthe complet
strative Data a
percent wer
strative Data.
portion partters (76 perc
and 2010 U.S. C
re women, a
icipating in cent) and Hi
Census Data fr
a decrease o
the programspanics slig
rom the Ameri
of 2 percenta
2
m. htly
ican
age
2012 WoWorker R
When thcollege, 2receivedhigher dOne in fo
State CThe WorprogramWorkforceducatiotaxpayer The Wor
D D W H D
Data CoThe 2012Security Idaho, anfor 2010- Net ImpProgramIn additiocomprehshort- antrends, d2009 is uevery foucomparishelp answworkforca higher comparin
3 Worker Rprovides feskills; read
orkforce TraiRetraining
ey enrolled 23 percent h a certificateegree. The m
our participa
Core Meakforce Board
ms. As a custoce Board str
on and trainirs.
kforce Train
Did participaDid participaWere employHas the progDid participa
omes From2 WorkforceDepartmen
nd Oregon, a-11.3
pact Studm Performon, this yearhensive Net nd long-termdata on partiused in the Nur years, thisson of particwer a centra
ce participanwage, is dung program
Retraining parteedback on hoing, writing an
ning Results
in the proghad attendee or associatmedian age ants was und
asures: Td routinely momer-focuseives to proving program
ing Results
nts get the nts get a job
yers satisfiedram made ants and the
m State W Training Ret wage files and federal
y Adds Mmance r’s report incImpact Stud
m employmeicipant expe
Net Impact Ss study provcipants and al question: nt’s success e to the wor
m participant
icipants were
ow well workfond math, and t
s
ram, 41 perced college wte’s degree, at the start
der age 33, w
Tracking measures thed advocate
vide performms provide a
report seeks
skills they nb and how md with the pa difference
public rece
Wage Filesesults includ
in Washingemploymen
ore Insigh
cludes a dy. To assessent and earneriences throStudy. Condvides a head
non-particiHow much in obtainingrkforce progts with simila
not included iorce program teamwork, am
cent of partiwithout recei
and 15 percof the last qwhile anoth
Worker he performae for Washin
mance accou return on in
s to answer
eeded? much were treparation win the particive a return
des informat
ton, nt records
ht into
s both nings ough ucted -to-head pants to of a
g a job, or gram? By ar individua
n the Workforparticipants pong others.
icipants hadiving a credecent had recquarter of thher one in fo
Retraininnce of our sgton’s work
untability, venvestment f
five core qu
they paid? workers rececipant’s succon their inv
tion obtaine
als who did n
rce Board’s 201perform in the
Turn toImpact every foreport aWorkfoThe stuside covs. simianswerwhethemaking
d not previoential, 15 pe
ceived a bache program wour participa
ng Progrstate’s largeskers and emerifying whefor participa
uestions:
eived? cess?
vestment?
ed from Emp
not participa
12 Employer Sworkplace in a
o page 15 fot Study. Condfour years, thadds extra v
orce Trainingudy providesomparison ofilar non-partring the queer the prograg a differenc
usly attendeercent had ccalaureate owas 43 year
ants was ove
ress st workforceployers, the
ether workerants and
ployment
ate in a
Survey, which areas such as j
or the Net nducted his in-depth value to 201g Results. s a side-by-
of participantrticipants, estion of ram is ce.
3
ed
or rs. er 52.
e e r
ob
h12
nts
2012 Workforce Training Results Worker Retraining
4
workforce training program, the Net Impact Study indicates whether employment and earnings gains are due to the workforce program, or if workers could have made this progress on their own. This research also allows for a more detailed analysis as to whether the participant and the public received a return on their investment in the program. Did Participants Get the Skills They Needed? As a measure of whether participants got the skills they needed, this study tracks the credentials and degrees earned by participants. Among those leaving a Worker Retraining program in 2009-10:
15 percent received an associate’s degree. 19 percent received a certificate. 2 percent received another type of credential.
Another 15 percent were defined as completers because they completed 45 or more credits or a unique (non-degree) program. Altogether, 51 percent of participants completed their program. This completion rate is lower than the 54 percent for those who left Worker Retraining programs in the 2011 report. In that year, 13 percent received an associate’s degree, 15 percent received a certificate, and 15 percent were defined as completers because they completed 45 or more credits or a unique (non-degree) program. Did Participants Have a Job and How Much Were They Paid? To find out whether participants had jobs and how much they earned, participant records were matched with Employment Security Department wage files from Washington and neighboring states.4 The study looks at employment and earnings three calendar quarters after the participant left a Worker Retraining program. Record matches found that 61 percent of the participants had reported employment during the third quarter after they left their program, 3 percentage points lower than that reported in the last report. Their median hourly wage was $16.90, and they had median annualized earnings of $27,583.5 Program completers were more likely to be working full time than those who did not complete their training programs (64 percent compared to 57 percent) and had higher annual earnings ($28,073 compared to $27,583).
4 These files contain quarterly earnings and hours worked information on those individuals with employment reported for unemployment insurance (UI) benefits purposes (approximately 90 percent of in-state employment, with self-employment, active duty military, and those working for religious nonprofit organizations being the major groups of employers not included). 5 Annual earnings are calculated as third quarter earnings multiplied by four. Quarterly earnings are the result of hourly wage rates and the number of hours worked in a calendar quarter. All wages and earnings are stated in first quarter 2011 dollars.
2012 Workforce Training Results Worker Retraining
5
Employment and Earnings for Worker Retraining Participants, 2012
Performance Measure Results
Employment Rate* (State Records) 61%
Full Time Employment ** 58%
Median Quarterly Hours 442 hours
Median Hourly Wage*** $16.90
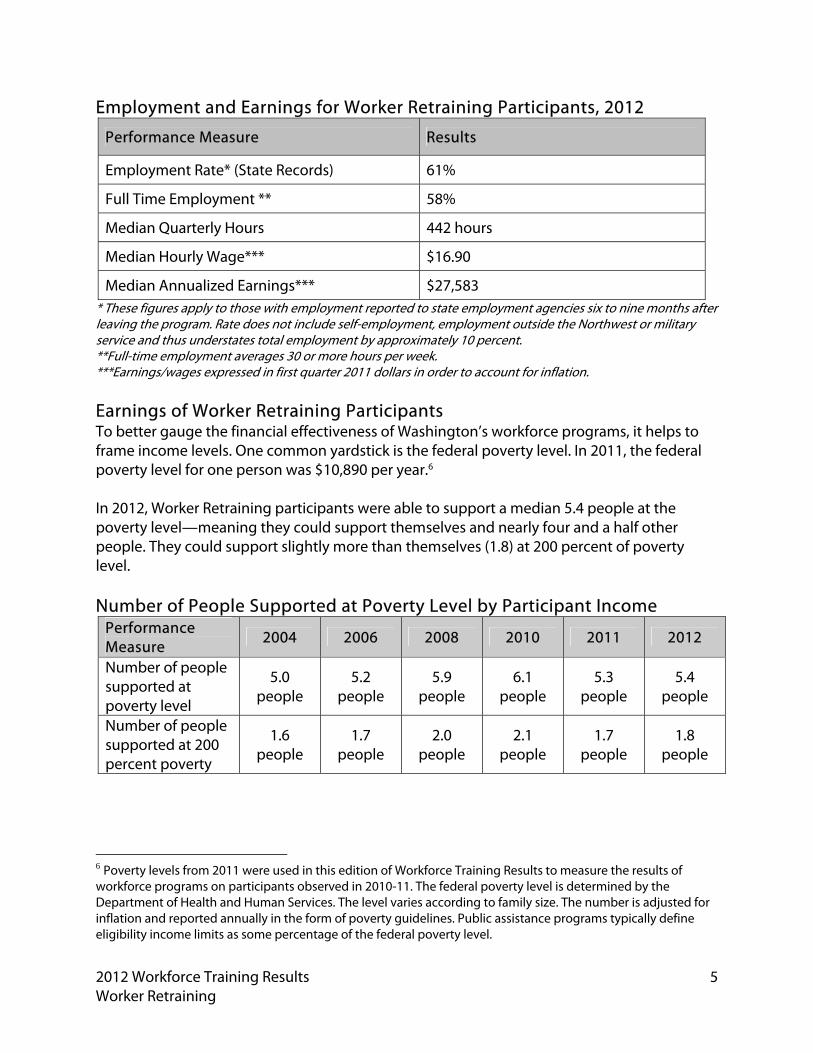
Median Annualized Earnings*** $27,583 * These figures apply to those with employment reported to state employment agencies six to nine months after leaving the program. Rate does not include self-employment, employment outside the Northwest or military service and thus understates total employment by approximately 10 percent. **Full-time employment averages 30 or more hours per week. ***Earnings/wages expressed in first quarter 2011 dollars in order to account for inflation. Earnings of Worker Retraining Participants To better gauge the financial effectiveness of Washington’s workforce programs, it helps to frame income levels. One common yardstick is the federal poverty level. In 2011, the federal poverty level for one person was $10,890 per year.6 In 2012, Worker Retraining participants were able to support a median 5.4 people at the poverty level—meaning they could support themselves and nearly four and a half other people. They could support slightly more than themselves (1.8) at 200 percent of poverty level. Number of People Supported at Poverty Level by Participant Income
Performance Measure 2004 2006 2008 2010 2011 2012
Number of people supported at poverty level
5.0 people
5.2 people
5.9 people
6.1 people
5.3 people
5.4 people
Number of people supported at 200 percent poverty
1.6 people
1.7 people
2.0 people
2.1 people
1.7 people
1.8 people
6 Poverty levels from 2011 were used in this edition of Workforce Training Results to measure the results of workforce programs on participants observed in 2010-11. The federal poverty level is determined by the Department of Health and Human Services. The level varies according to family size. The number is adjusted for inflation and reported annually in the form of poverty guidelines. Public assistance programs typically define eligibility income limits as some percentage of the federal poverty level.
2012 Workforce Training Results Worker Retraining
6
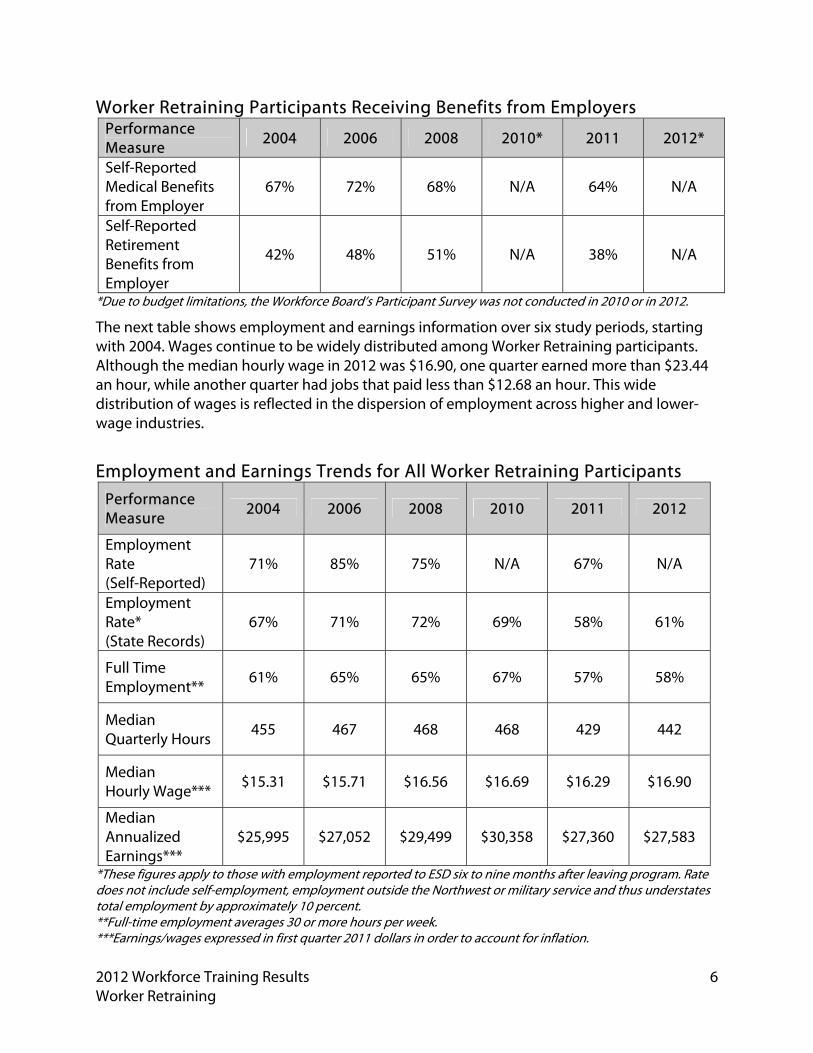
Worker Retraining Participants Receiving Benefits from Employers Performance Measure 2004 2006 2008 2010* 2011 2012*
Self-Reported Medical Benefits from Employer
67% 72% 68% N/A 64% N/A
Self-Reported Retirement Benefits from Employer
42% 48% 51% N/A 38% N/A
*Due to budget limitations, the Workforce Board’s Participant Survey was not conducted in 2010 or in 2012.
The next table shows employment and earnings information over six study periods, starting with 2004. Wages continue to be widely distributed among Worker Retraining participants. Although the median hourly wage in 2012 was $16.90, one quarter earned more than $23.44 an hour, while another quarter had jobs that paid less than $12.68 an hour. This wide distribution of wages is reflected in the dispersion of employment across higher and lower-wage industries.
Employment and Earnings Trends for All Worker Retraining Participants
Performance Measure 2004 2006 2008 2010 2011 2012
Employment Rate (Self-Reported)
71% 85% 75% N/A 67% N/A
Employment Rate* (State Records)
67% 71% 72% 69% 58% 61%
Full Time Employment**
61% 65% 65% 67% 57% 58%
Median Quarterly Hours
455 467 468 468 429 442
Median Hourly Wage*** $15.31 $15.71 $16.56 $16.69 $16.29 $16.90
Median Annualized Earnings***
$25,995 $27,052 $29,499 $30,358 $27,360 $27,583
*These figures apply to those with employment reported to ESD six to nine months after leaving program. Rate does not include self-employment, employment outside the Northwest or military service and thus understates total employment by approximately 10 percent. **Full-time employment averages 30 or more hours per week. ***Earnings/wages expressed in first quarter 2011 dollars in order to account for inflation.
2012 WoWorker R
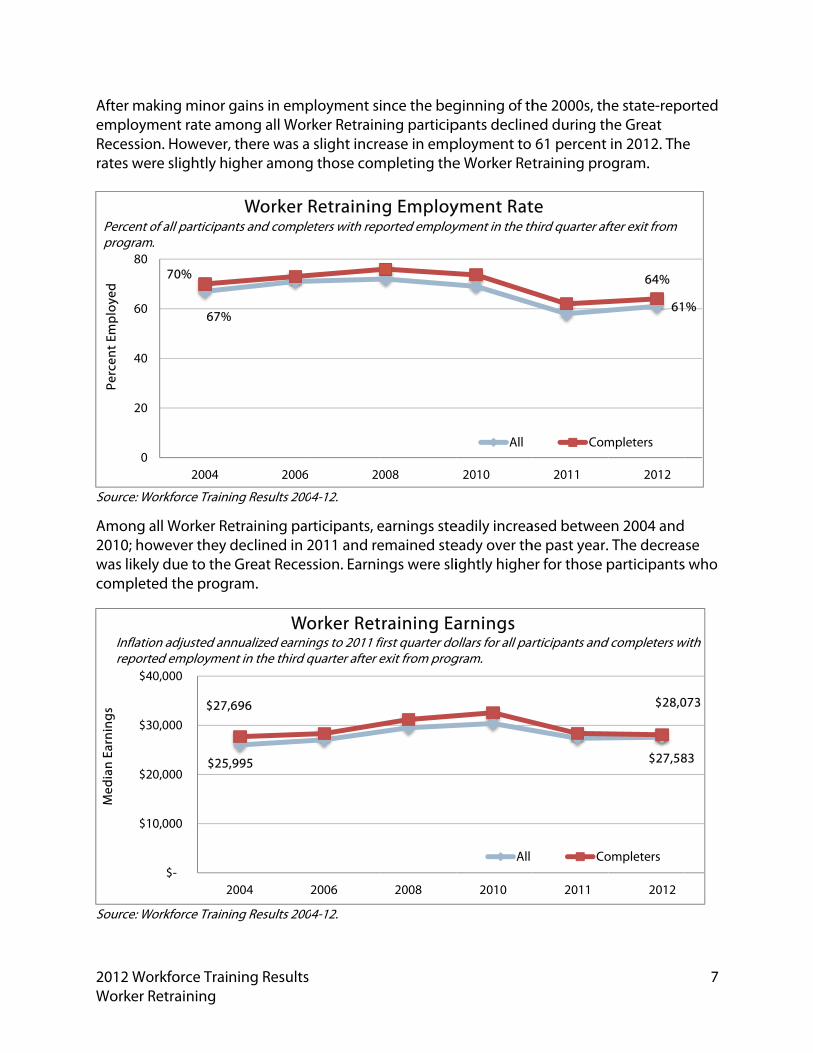
After maemploymRecessiorates we
Source: Wo
Among a2010; howas likelycomplete
Source: Wo
0
20
40
60
80
Perc
ent E
mpl
oyed
Percent oprogram
$1
$2
$3
$4
Med
ian
Earn
ings
Inflatioreporte
orkforce TraiRetraining
king minor ment rate amn. Howeverre slightly h
Workforce Train
all Worker Reowever they
y due to theed the prog
Workforce Train
67%
70%
2004
of all participanm.
$25
$27,
$-
0,000
0,000
0,000
40,000
2
on adjusted anted employme
ning Results
gains in emmong all Wo, there was aigher amon
ning Results 20
etraining padeclined in
e Great Receram.
ning Results 20
%
2006
Worker ants and compl
,995
,696
2004
Wnnualized earnent in the third
s
ployment siorker Retraina slight increg those com
004-12.
articipants, e2011 and re
ession. Earni
004-12.
6 20
Retraininpleters with rep
2006
Worker Retnings to 2011 fid quarter after e
ince the begning participease in emp
mpleting the
earnings steemained stengs were sli
008
g Employported employ
2008
raining Eafirst quarter doexit from prog
ginning of thpants declineployment to e Worker Ret
eadily increaeady over thightly highe
2010
yment Rat
All
yment in the th
2010
arnings
All
ollars for all pargram.
he 2000s, thed during th61 percent training pro
ased betweehe past year.er for those p
2011
te
Com
hird quarter af
2011
Co
articipants and
he state-repohe Great in 2012. The
ogram.
en 2004 and The decreaparticipants
61
64%
2012
mpleters
fter exit from
$27,58
$28,0
2012
ompleters
d completers w
7
orted
e
se
s who
%
83
073
with
2012 Workforce Training Results Worker Retraining
8
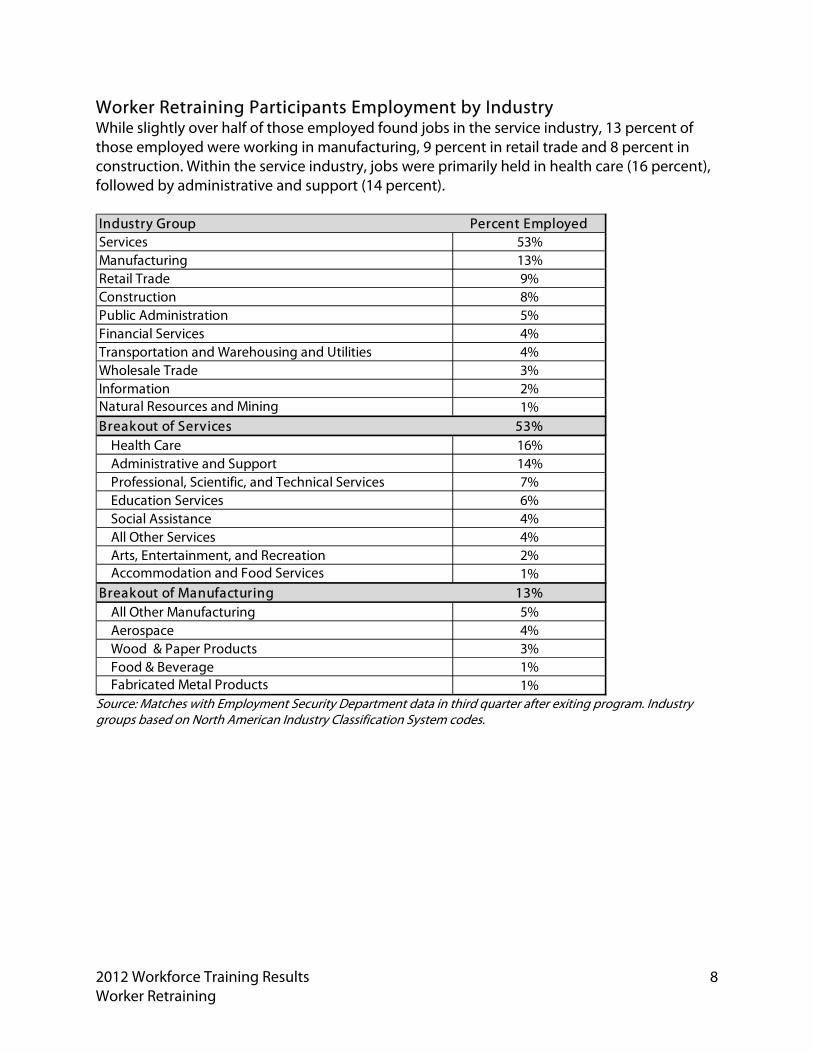
Worker Retraining Participants Employment by Industry While slightly over half of those employed found jobs in the service industry, 13 percent of those employed were working in manufacturing, 9 percent in retail trade and 8 percent in construction. Within the service industry, jobs were primarily held in health care (16 percent), followed by administrative and support (14 percent).
Source: Matches with Employment Security Department data in third quarter after exiting program. Industry groups based on North American Industry Classification System codes.
Industry Group Percent EmployedServices 53%Manufacturing 13%Retail Trade 9%Construction 8%Public Administration 5%Financial Services 4%Transportation and Warehousing and Utilities 4%Wholesale Trade 3%Information 2%Natural Resources and Mining 1%Breakout of Services 53%
Health Care 16%Administrative and Support 14%Professional, Scientific, and Technical Services 7%Education Services 6%Social Assistance 4%All Other Services 4%Arts, Entertainment, and Recreation 2%Accommodation and Food Services 1%
Breakout of Manufacturing 13%All Other Manufacturing 5%Aerospace 4%Wood & Paper Products 3%Food & Beverage 1%Fabricated Metal Products 1%
2012 Workforce Training Results Worker Retraining
9
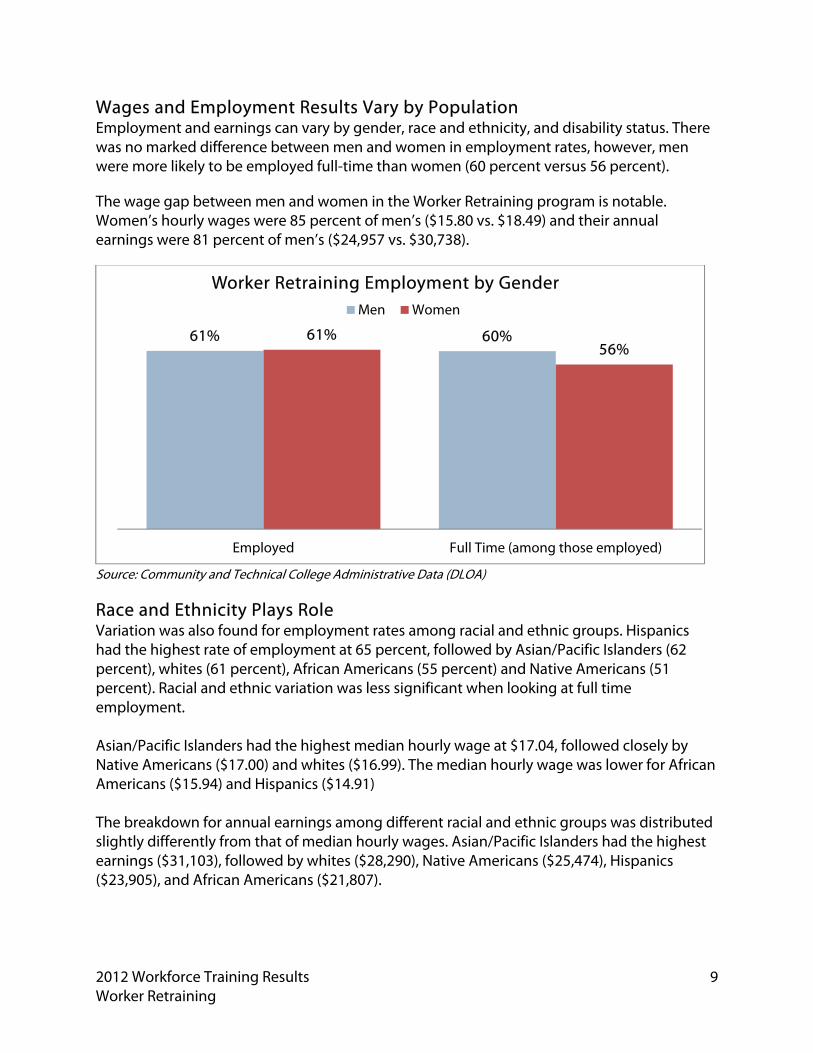
Wages and Employment Results Vary by Population Employment and earnings can vary by gender, race and ethnicity, and disability status. There was no marked difference between men and women in employment rates, however, men were more likely to be employed full-time than women (60 percent versus 56 percent).
The wage gap between men and women in the Worker Retraining program is notable. Women’s hourly wages were 85 percent of men’s ($15.80 vs. $18.49) and their annual earnings were 81 percent of men’s ($24,957 vs. $30,738).
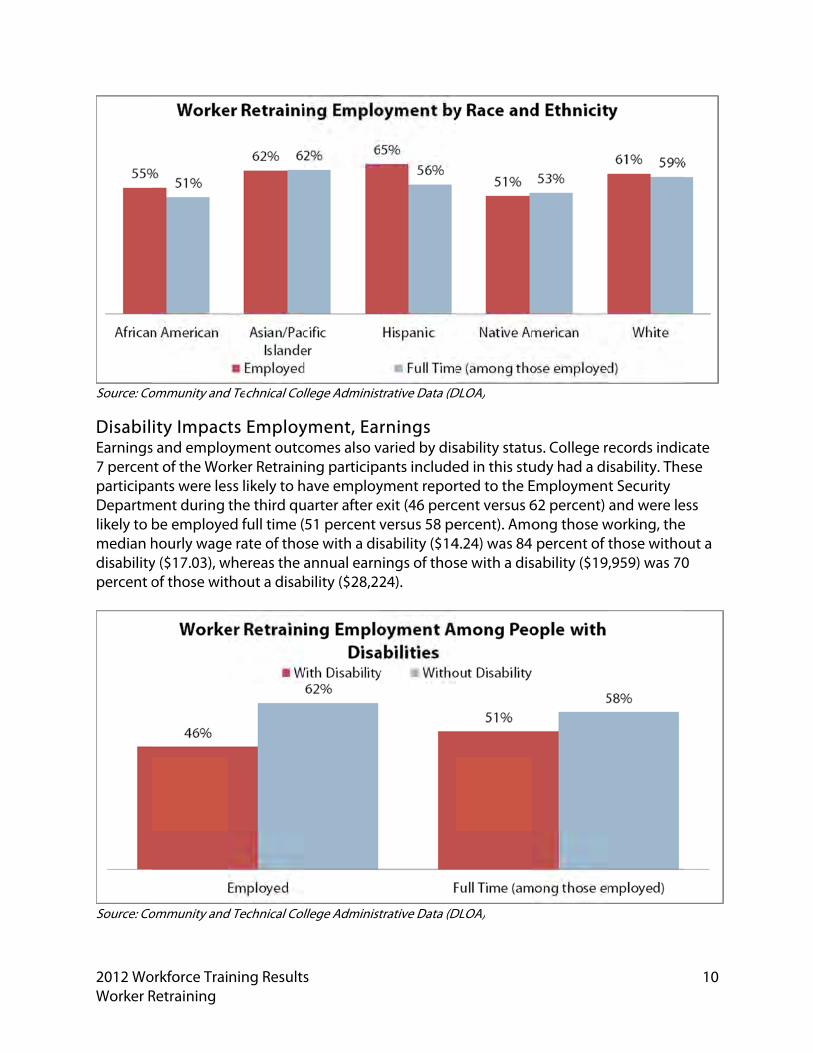
Source: Community and Technical College Administrative Data (DLOA) Race and Ethnicity Plays Role Variation was also found for employment rates among racial and ethnic groups. Hispanics had the highest rate of employment at 65 percent, followed by Asian/Pacific Islanders (62 percent), whites (61 percent), African Americans (55 percent) and Native Americans (51 percent). Racial and ethnic variation was less significant when looking at full time employment. Asian/Pacific Islanders had the highest median hourly wage at $17.04, followed closely by Native Americans ($17.00) and whites ($16.99). The median hourly wage was lower for African Americans ($15.94) and Hispanics ($14.91) The breakdown for annual earnings among different racial and ethnic groups was distributed slightly differently from that of median hourly wages. Asian/Pacific Islanders had the highest earnings ($31,103), followed by whites ($28,290), Native Americans ($25,474), Hispanics ($23,905), and African Americans ($21,807).
61% 60%61%56%
Employed Full Time (among those employed)
Worker Retraining Employment by GenderMen Women
2012 WoWorker R
Source: Co
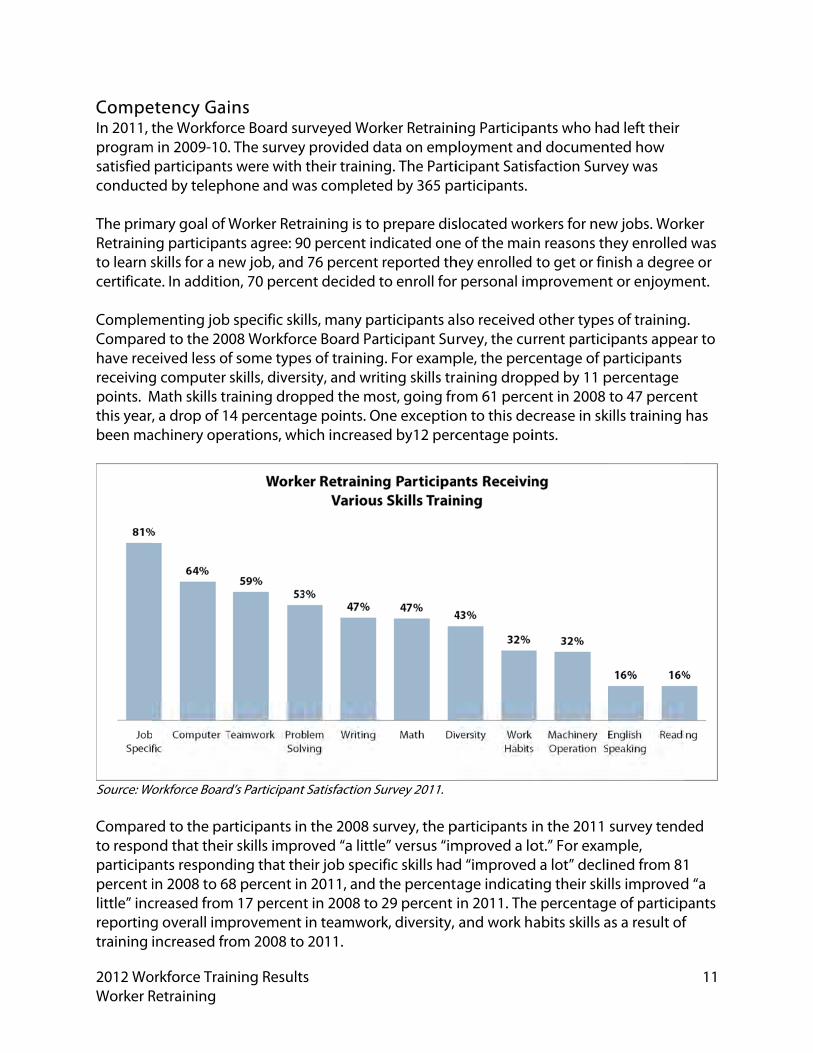
DisabilEarnings7 percenparticipaDepartmlikely to bmedian hdisabilitypercent o
Source: Co
orkforce TraiRetraining
ommunity and
ity Impacts and emplont of the Worants were les
ment during be employehourly wagey ($17.03), wof those wit
ommunity and
ning Results
d Technical Col
ts Employyment outcrker Retrainss likely to hthe third qu
ed full time (e rate of tho
whereas the athout a disab
d Technical Col
s
llege Administ
yment, Eaomes also ving participa
have employuarter after e51 percent vse with a disannual earnbility ($28,22
llege Administ
trative Data (D
rnings varied by disants includeyment reporexit (46 percversus 58 pesability ($14
nings of thos24).
trative Data (D
DLOA)
sability statued in this sturted to the Ecent versus 6ercent). Amo4.24) was 84se with a dis
DLOA)
us. College rudy had a diEmploymen62 percent) ong those w percent of t
sability ($19,
ecords indicisability. Thet Security and were le
working, thethose witho,959) was 70
10
cate ese
ess e out a 0
2012 WoWorker R
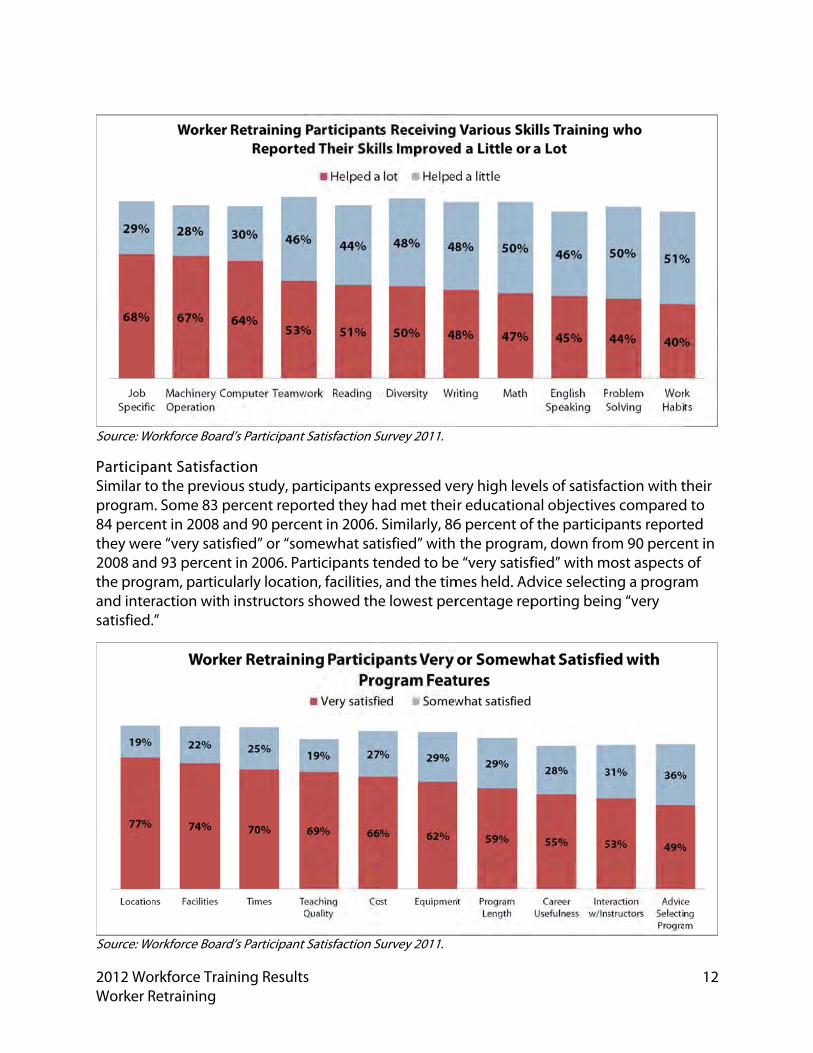
CompeIn 2011, tprogramsatisfied conducte The primRetraininto learn scertificat ComplemComparehave recreceivingpoints. Mthis yearbeen ma
Source: Wo Compareto responparticipapercent ilittle” increportingtraining
orkforce TraiRetraining
etency Gaithe Workfor
m in 2009-10participantsed by teleph
mary goal of ng participanskills for a nete. In additio
menting jobed to the 20eived less o
g computer Math skills tr, a drop of 1
achinery ope
Workforce Board
ed to the pand that thei
ants respondin 2008 to 6
creased fromg overall imincreased fr
ning Results
ins rce Board su. The surveys were with hone and wa
Worker Retrnts agree: 90ew job, and
on, 70 perce
b specific ski08 Workforcf some typeskills, divers
raining drop4 percentag
erations, wh
d’s Participant
rticipants inr skills impro
ding that the8 percent in
m 17 percentprovement
rom 2008 to
s
urveyed Wory provided d
their traininas complete
raining is to 0 percent in76 percent nt decided t
lls, many pace Board Pa
es of trainingsity, and wripped the moge points. O
hich increase
t Satisfaction S
n the 2008 suoved “a littleeir job speci
n 2011, and tt in 2008 to in teamwor2011.
rker Retrainidata on empng. The Partied by 365 pa
prepare disndicated one
reported thto enroll for
articipants articipant Su
g. For exampting skills tra
ost, going frne exceptio
ed by12 perc
Survey 2011.
urvey, the pe” versus “imific skills hadthe percent29 percent
rk, diversity,
ing Participaployment anicipant Satisarticipants.
slocated woe of the mai
hey enrolledr personal im
lso receivedrvey, the cuple, the percaining dropom 61 perce
on to this decentage poi
participants improved a lod “improvedage indicatiin 2011. Theand work h
ants who had documen
sfaction Surv
rkers for newn reasons th to get or fin
mprovement
d other typerrent partici
centage of ppped by 11 p
ent in 2008 ecrease in skints.
in the 2011 ot.” For examd a lot” decliing their skile percentagabits skills a
ad left their nted how vey was
w jobs. Worhey enrollednish a degret or enjoym
s of trainingipants appe
participantspercentage to 47 perce
kills training
survey tendmple, ined from 81lls improvede of particip
as a result of
11
ker d was ee or ent.
g. ear to
nt has
ded
1 d “a pants f
2012 WoWorker R
Source: Wo
ParticipaSimilar toprogram84 percethey wer2008 andthe progand intersatisfied.
Source: Wo
orkforce TraiRetraining
Workforce Board
ant Satisfaco the previo
m. Some 83 pent in 2008 are “very satisd 93 percentram, particuraction with.”
Workforce Board
ning Results
d’s Participant
ction ous study, papercent repoand 90 percesfied” or “sot in 2006. Paularly locatioh instructors
d’s Participant
s
t Satisfaction S
articipants eorted they hent in 2006. mewhat sat
articipants teon, facilities, showed the
t Satisfaction S
Survey 2011.
expressed vead met theiSimilarly, 86
tisfied” with ended to be, and the time lowest per
Survey 2011.
ery high lever education6 percent ofthe program
e “very satisfmes held. Adrcentage rep
els of satisfaal objective
f the participm, down frofied” with mdvice selectiporting bein
action with tes comparedpants reportom 90 perce
most aspects ng a progra
ng “very
12
their d to ted nt in of
am
2012 WoWorker R
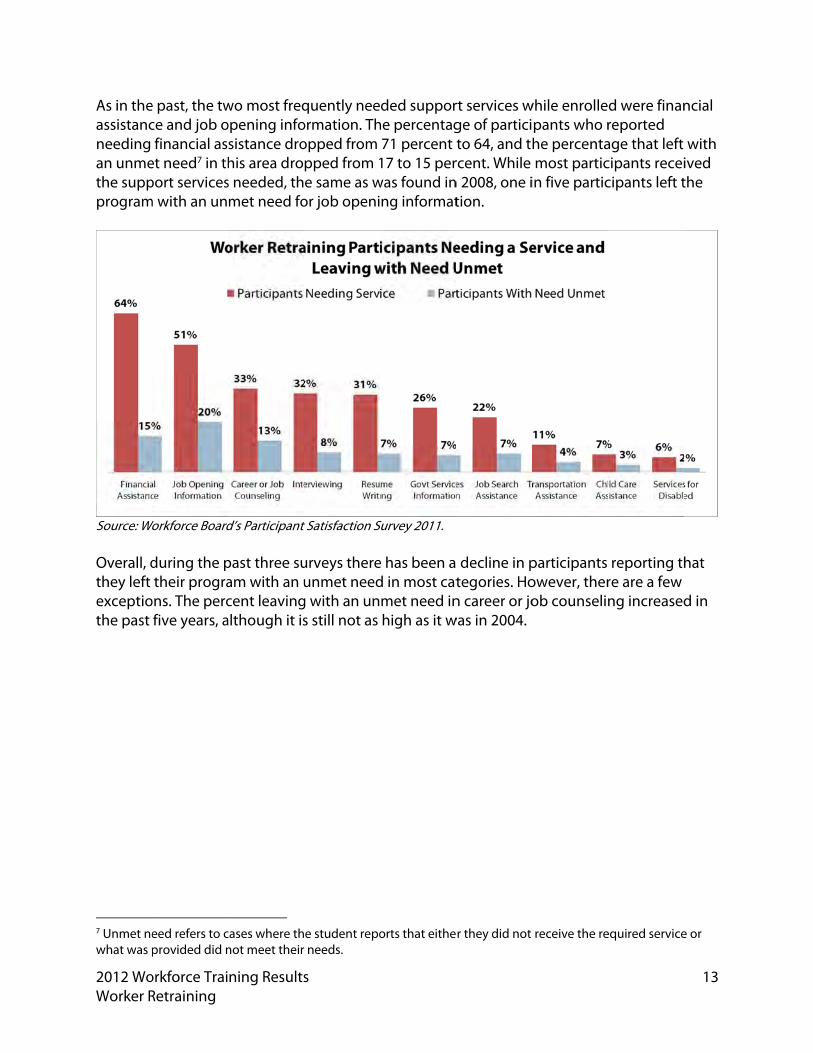
As in theassistancneeding an unmethe suppprogram
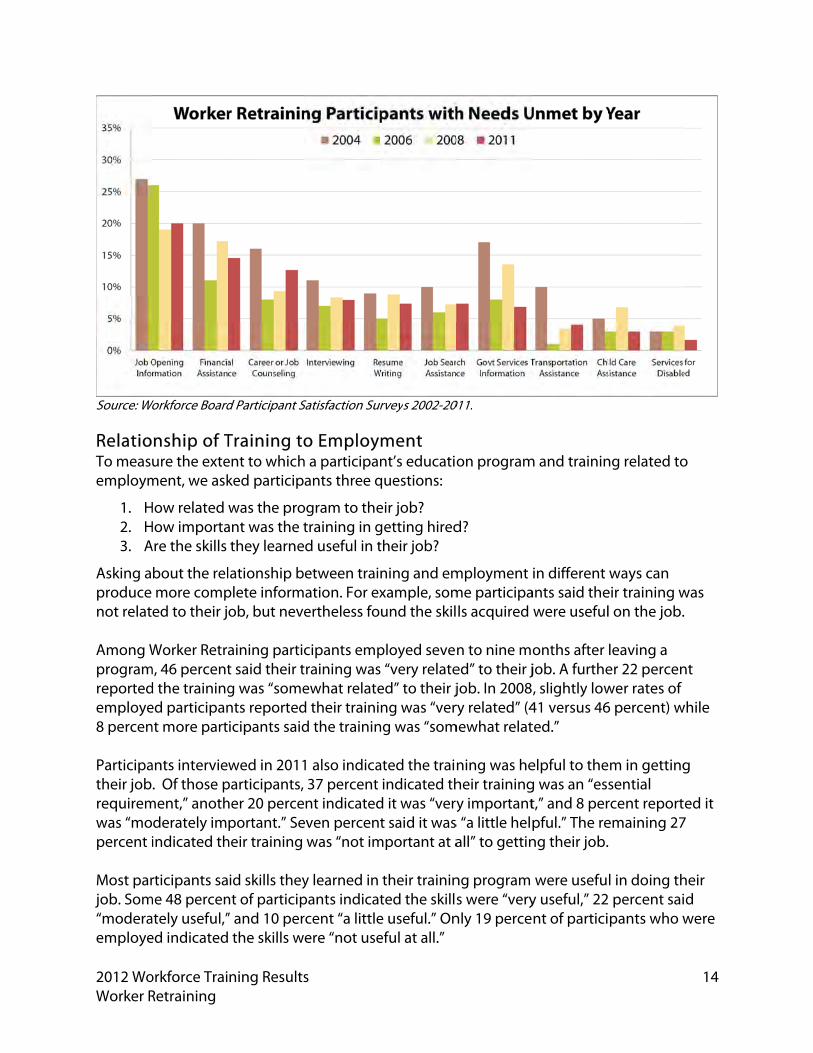
Source: Wo Overall, dthey left exceptiothe past
7 Unmet newhat was p
orkforce TraiRetraining
e past, the twce and job ofinancial as
et need7 in thport services
m with an un
Workforce Board
during the ptheir progra
ons. The percfive years, a
eed refers to cprovided did n
ning Results
wo most freqopening info
sistance drohis area dros needed, thmet need fo
d’s Participant
past three suam with an ucent leaving
although it is
cases where thnot meet their
s
quently neeormation. Thopped from pped from 1e same as w
or job openi
t Satisfaction S
urveys thereunmet need
g with an uns still not as
e student repo needs.
ded supporhe percentag
71 percent t17 to 15 per
was found inng informat
Survey 2011.
e has been ad in most catmet need inhigh as it w
orts that eithe
rt services wge of particito 64, and th
rcent. While n 2008, one ition.
decline in ptegories. Ho
n career or jowas in 2004.
r they did not
while enrollepants who rhe percentamost partic
in five partic
participants owever, therob counselin
receive the re
d were finanreported age that left cipants receicipants left t
reporting thre are a few ng increased
equired service
13
ncial
with ived the
hat
d in
e or
2012 WoWorker R
Source: Wo
RelatioTo measemploym
1. H2. H3. A
Asking aproduce not relat Among Wprogramreportedemploye8 percen Participatheir jobrequiremwas “mopercent i Most parjob. Som“moderaemploye
orkforce TraiRetraining
Workforce Board
nship of Ture the exte
ment, we ask
How related How importaAre the skills
bout the relmore comped to their j
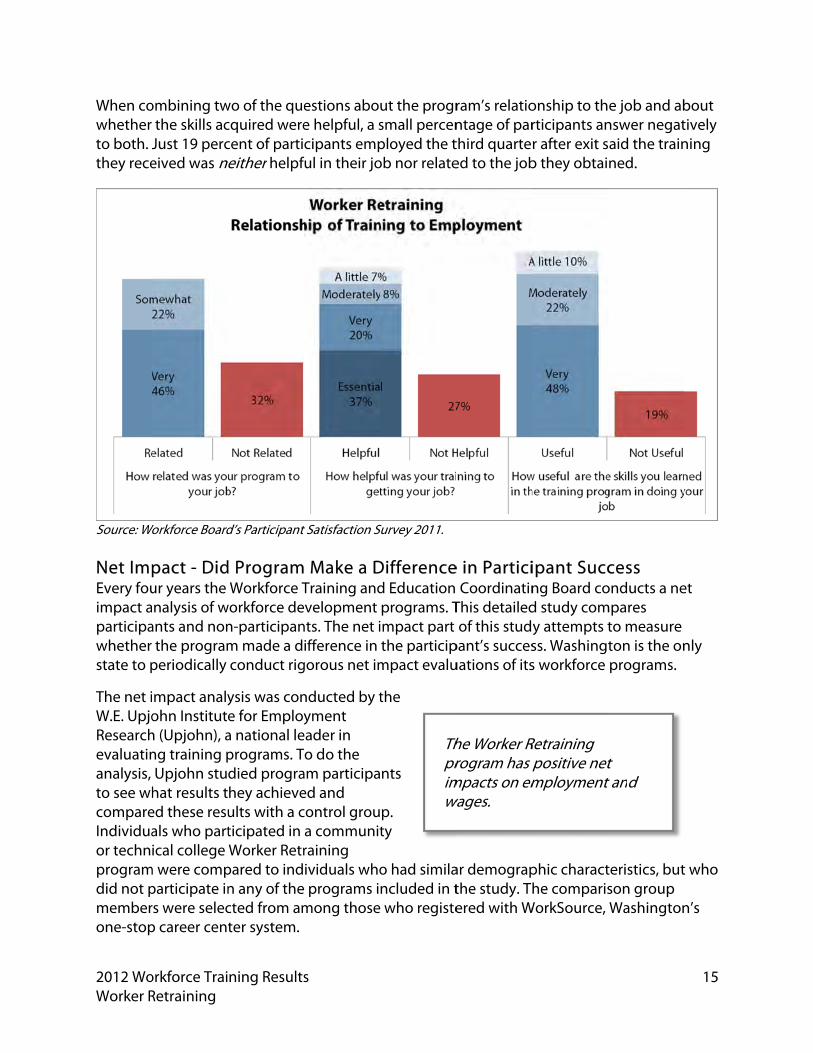
Worker Retram, 46 percentd the traininged participannt more part
ants intervie. Of those p
ment,” anothderately imindicated th
rticipants same 48 percenately useful,”ed indicated
ning Results
d Participant S
Training toent to whichked particip
was the proant was the t
they learne
lationship bplete informob, but neve
aining partict said their tg was “soments reportedicipants said
wed in 2011participants, her 20 perceportant.” Se
heir training
id skills theynt of particip” and 10 per the skills w
s
Satisfaction Sur
o Employh a participan
ants three q
ogram to thetraining in gd useful in t
etween traiation. For exertheless fo
cipants emptraining wasewhat relate
d their trainid the trainin
1 also indica37 percent nt indicated
even percentwas “not im
y learned in pants indicatrcent “a littleere “not use
rveys 2002-20
ment nt’s educatio
questions:
eir job? getting hiredtheir job?
ning and emxample, somund the skil
ployed seves “very relateed” to their jng was “ver
ng was “som
ated the traiindicated th
d it was “veryt said it was
mportant at a
their traininted the skills
e useful.” Oneful at all.”
011.
on program
d?
mployment me participa
ls acquired
n to nine med” to their jjob. In 2008ry related” (4
mewhat relat
ning was heheir trainingy important
s “a little helpall” to gettin
ng program s were “very
nly 19 perce
m and trainin
in different ants said thewere useful
onths after job. A furthe, slightly low
41 versus 46ted.”
elpful to theg was an “esst,” and 8 perpful.” The reng their job.
were usefuy useful,” 22nt of partici
ng related to
ways can eir training wl on the job.
leaving a er 22 percenwer rates of 6 percent) w
m in gettingsential rcent reportemaining 27
l in doing th percent saipants who w
14
o
was
nt
while
g
ed it 7
heir d were
2012 WoWorker R
When cowhether to both. Jthey rece
Source: Wo Net ImpEvery fouimpact aparticipawhether state to p
The net iW.E. UpjoResearchevaluatinanalysis, to see whcompareIndividuaor technprogramdid not pmemberone-stop
orkforce TraiRetraining
ombining twthe skills acJust 19 perceived was ne
Workforce Board
pact - Didur years the analysis of wants and non
the programperiodically
impact analyohn Institute
h (Upjohn), ang training pUpjohn stu
hat results ted these resuals who partical college
m were compparticipate inrs were selecp career cent
ning Results
wo of the quecquired werecent of parti
neither helpf
d’s Participant
d ProgramWorkforce T
workforce den-participanm made a dconduct rig
ysis was cone for Employa national leprograms. Tdied prograhey achieveults with a cticipated in Worker Retr
pared to indn any of thected from amter system.
s
estions aboe helpful, a scipants emp
ful in their jo
t Satisfaction S
Make a DTraining andvelopment
nts. The net iifference in
gorous net im
nducted by tyment
eader in o do the
am participaed and control groua communitraining ividuals who programs i
mong those
ut the progrsmall percenployed the tob nor relate
Survey 2011.
Differenced Education programs. Timpact part the particip
mpact evalu
the
nts
p. ty
o had similancluded in t who registe
Thprimwa
ram’s relationtage of parthird quarteed to the job
e in Partici Coordinatin
This detailedof this stud
pant’s succesuations of its
ar demograpthe study. Thered with W
he Worker Rrogram has p
mpacts on emwages.
onship to thrticipants anr after exit s
b they obtai
ipant Succng Board cod study comy attempts tss. Washingts workforce
phic characthe comparis
WorkSource,
Retraining positive netmployment
e job and abnswer negataid the trainned.
cess onducts a ne
mpares to measureton is the onprograms.
teristics, butson group Washington
t t and
15
bout tively ning
et
nly
t who
n’s
2012 Workforce Training Results Worker Retraining
16
The most recent net impact analyses examined experiences of participants who left the Worker Retraining program through 2009. The short-term impact (Program Year 2007-08) was observed in 2008-09, while the long-term impact (Program Year 2005-06) was observed from 2006-07 through 2008-09. Impact on Employment and Earnings: Participants vs. Control Group
Worker Retraining Short-term^ Long-term^
Net Employment Impact* 8.80 percentage points 7.50 percentage points
Net Hourly Wage Impacts** No significant positive impacts $1.04
Net Quarterly Hours Impacts 26.6 23.5
Net Annualized Earnings** $1,680 $2,870
^Short-term is 3 quarters after program exit; Long-term is average across 3 years since program exit. *Percentages listed are employment percentage points above those of the control group of non-participants. **Wages and earnings, expressed in first quarter 2011 dollars, represent the average difference between Worker Retraining participants who got jobs and those in the control group who were employed. As can be seen above, the Worker Retraining Program had a positive impact on employment, hours worked and annualized earnings. The long-term net impacts on hourly wages were also positive among Worker Retraining participants versus the control group. Costs and Benefits The cost-benefit analysis estimates the value of the net impact on earnings, employee benefits (estimated at 25 percent of earnings), UI benefits, and certain taxes.8 Program costs include both direct program costs and support payments borne by taxpayers and the tuition and foregone earnings borne by students. Benefits and costs are calculated for both the observed period of time abased upon a statistical model that estimated the benefits and costs out to age 65 in order to compare benefits and costs in terms of net present values, post-program benefits and costs are discounted by 3 percent per year and all figures are stated in 2011 Q1 dollars to control for inflation. The benefits and costs presented here are based on impacts estimated for students leaving programs in 2005-2006 (observed from 2006-07 through 2008-09), because a longer-term follow-up is required for this analysis.
8 Upjohn estimated the impact of the net change in earnings on social security, Medicare, federal income, and state sales taxes.
2012 Workforce Training Results Worker Retraining
17
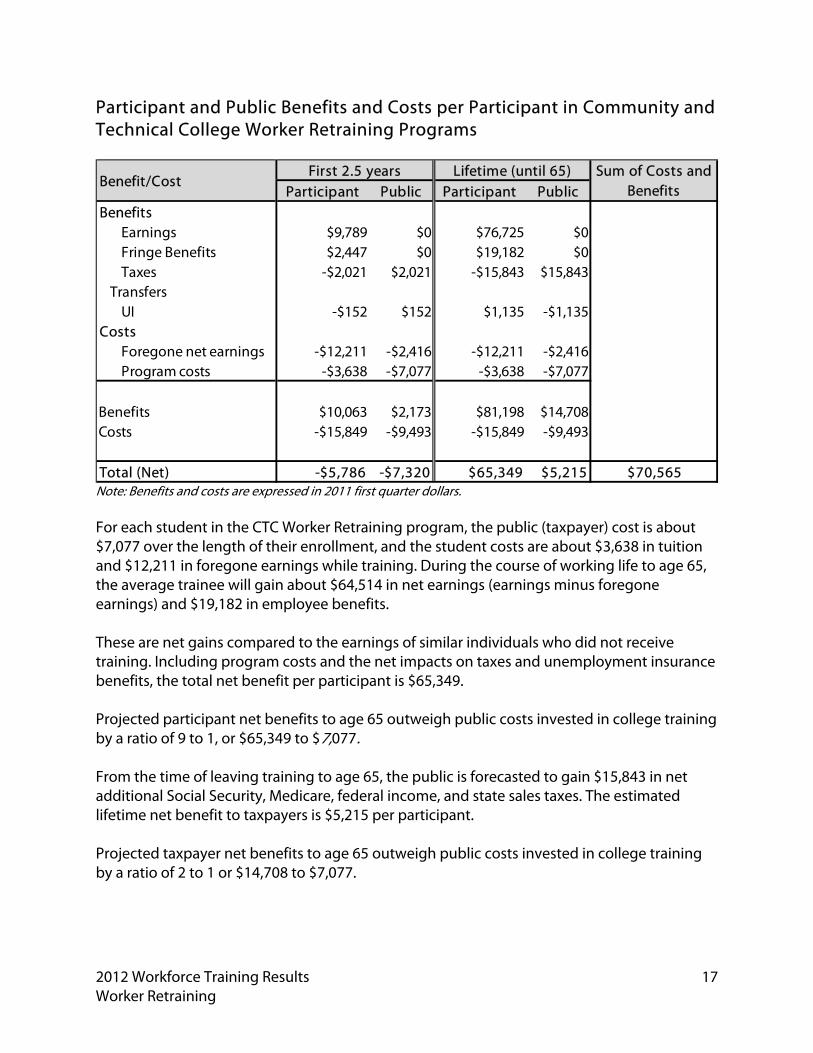
Participant and Public Benefits and Costs per Participant in Community and Technical College Worker Retraining Programs
Note: Benefits and costs are expressed in 2011 first quarter dollars. For each student in the CTC Worker Retraining program, the public (taxpayer) cost is about $7,077 over the length of their enrollment, and the student costs are about $3,638 in tuition and $12,211 in foregone earnings while training. During the course of working life to age 65, the average trainee will gain about $64,514 in net earnings (earnings minus foregone earnings) and $19,182 in employee benefits. These are net gains compared to the earnings of similar individuals who did not receive training. Including program costs and the net impacts on taxes and unemployment insurance benefits, the total net benefit per participant is $65,349. Projected participant net benefits to age 65 outweigh public costs invested in college training by a ratio of 9 to 1, or $65,349 to $7,077. From the time of leaving training to age 65, the public is forecasted to gain $15,843 in net additional Social Security, Medicare, federal income, and state sales taxes. The estimated lifetime net benefit to taxpayers is $5,215 per participant. Projected taxpayer net benefits to age 65 outweigh public costs invested in college training by a ratio of 2 to 1 or $14,708 to $7,077.
Participant Public Participant PublicBenefits
Earnings $9,789 $0 $76,725 $0Fringe Benefits $2,447 $0 $19,182 $0Taxes -$2,021 $2,021 -$15,843 $15,843
TransfersUI -$152 $152 $1,135 -$1,135
CostsForegone net earnings -$12,211 -$2,416 -$12,211 -$2,416Program costs -$3,638 -$7,077 -$3,638 -$7,077
Benefits $10,063 $2,173 $81,198 $14,708Costs -$15,849 -$9,493 -$15,849 -$9,493
Total (Net) -$5,786 -$7,320 $65,349 $5,215 $70,565
Benefit/CostFirst 2.5 years Lifetime (until 65) Sum of Costs and
Benefits