Embed Size (px)
Citation preview
Workbook for the New I.B. Economics – Answer key for selected exercises
This answer key is for teacher use only – please do not distribute directly to students, either
electronically or in paper form.
Note – Answers for the definition questions can be taken from the lessons directly
EP1
2. Wants – a new TV, a Blackberry, a milkshake – things that you could do without but which
would be nice to have
Needs – Food, Clothing, Shelter – things which are necessary to live
3. What to produce – Do I produce trousers or blouses?
How to produce – Do I use sweatshop labour in Asia or do I use unionized workers in Europe?
Do I use mainly labour or machines? Do I use natural fabrics or synthetic fabrics?
How to distribute what is produced? – Do I sell through my own shops? Do I sell online? Do I sell
through chain stores like Walmart and Carrefour?
4. If I got a new TV, I might then want to get more DVDs, more cable channels, or a nicer sofa. If I
got a Blackberry, I might want a case and a better mobile plan. A milkshake might make me
want to eat a salty snack to counteract the sweet, like some French fries.
5. Natural resources (in particular mineral and fossil fuel resources) are limited. There is only so
much that we are able to access with current technology. There are only so many people on
earth. And there is a countable quantity of equipment and machinery on earth. Thus, they are
all finite.
6. a) Limited Resource – Time; Unlimited Want – Fun
b) Limited Resources – workers and equipment; Unlimited Want – output and revenues
c) Limited Resources – money in the roads budget; Unlimited Want – better roads
7. Only rational choices can be readily understood. Many people do, however, make choices
that are harmful which may seem irrational, but as the reasons behind these choices are difficult
to understand, economics chooses not to study them (although, increasingly, the field of
behavioural economics is looking into such choices).
EP2
2. My student model is not a good one as my students’ actual behaviour was not the same as
the behaviour predicted by the model. As their teacher, to save my self-esteem, I would be
more likely to change assumption 2 than assumption 1.
3. If there had been a big chemistry lab or English essay due the same day my homework was
due the ceteris paribus assumption would have been upset. Similarly, if there had been a big
entertainment or sporting event on the night they were to do their economics homework, it is
possible that both of my assumptions could have been correct despite my students failure to
complete their homework.
4. Normative economic statements. Election campaigns are often fought using emotional
appeals to take action without considering the costs of such action. For instance, governments
around the world are now obsessed with reducing deficits to tame debt levels, but there is no
discussion as to what the costs of such actions will be. Instead, it is simply put forward as an
initial assumption that debt levels are now ‘too high’ and ‘bad’, and the debate simply proceeds
from this point.
EP3
2. Surfing on Facebook
3. People with university degrees generally face a higher opportunity cost of having children
when in their early 20s than high school graduates, as they are still pursuing education. A person
who has finished high school is already working and so the decision to have children simply
involves a reduction in work hours and earnings. On the other hand, people pursuing a
university education may not want to interrupt that education or their career path in the 5 or 10
years after they finish their education, as they perceive that the cost in terms of income and
career advancement from having children young will be significant.
4. a) Yes, it is possible as (6,6) lies inside the PPF
b) No, it is not possible to produce (7,8) as this point lies outside the PPF
c) There would be no opportunity cost as you did not need to give up any good A to
increase the production of good B from 4 to 9
d)The opportunity cost is two units of good A
5. The PPC would be a straight line for goods which use the same skills and
resources/technology. For instance, a PPF for cola and orange soda would likely be a straight
line as producing one more bottle of one should always cost one bottle of the other. The PPC
would be concave to the origin where there were gains from specialization where the
productive resources would be best employed to produce one good or the other, but not both.
For instance, if a firm were to produce both computer business software and computer games,
perhaps it would be more efficient to produce just one or the other so as to have a consistent
business culture.
EP4
2. a) Sustainable development (environmental/resource issues)
b) The appropriate role of government in the economy
c) Efficiency vs equity
d) Economic growth vs economic development
e) Efficiency vs equity, and perhaps also economic and social sustainability
f) Efficiency vs equity – except this seems to be a case where inefficiency and unfairness
are combined
EMI1
2. Probably assumption 2 – it is increasingly clear that consuming goods and services is not a
major contributor to human happiness once fundamental needs are met
3. a) Assumption 2
b) Assumption 3
c) Assumption 4
4. a) 5 units
b) 10 units
5. Yes, for instance, if it is raining, people would buy more umbrellas, despite the price of
umbrellas remaining unchanged.
EMI2
2. Because the new point (same price, different quantity) would not be on the original demand
curve
3. Top left – Demand curve shifts IN to the left
Top right – No shift in the curve, just a move down and to the right on the existing curve
Bottom left – Demand curve shifts OUT to the right
Bottom right – Demand curve shifts IN to the left
EMI3
1. a) (P,Q) = { (0, 20), (1, 18), (2, 16), (3, 14), (4, 12)....}
b) draw the points appropriately – with price on the vertical axis and quantity on the
horizontal axis. The y-intercept should be 10 and the x-intercept should be 20.
2. a) Qd = 22 – 2P
b) The y-intercept should be 11, and the x-intercept should be 22.
3. The graphs have the same slope, but the graph for Q2 lies above the graph for Q1. The
equations have the same ‘b’ term, but a different ‘a’ term.
4. The new equations would be Qd = 20 – P, and Qd = 22 – P. The b terms would be
different.
EMI4
2. Probably 4, but 3 is also likely.
3. a) Assumption 2
b) Assumption 2
c) Assumption 4
4. a) 5 units
b) 5 units
Yes, there could be situations where, for instance, even if the price of an agricultural commodity
was unchanged, if there was good weather, farmers would have more of the good available to
sell.
EMI5
1. Top left – Supply curve shifts IN to the left
Top right – Supply curve shifts OUT to the right (as farmers shift to raising beef instead
of unprofitable sheep and hogs)
Bottom left – Supply curve shifts OUT to the right
Bottom right – no shift in the supply curve, but a movement along the existing supply
curve from the bottom left towards the upper right
EMI6
1. a) (P,Q) = { (2,0), (3,2), (4,4), (5,6)...}
b) straight line with y-intercept of 2 and x-intercept of -4
2. a) Qs = -6 + 2P
b) straight line with y-intercept at 3 and x-intercept at -6
3. The 2 equations differ in their ‘c’ terms, and the graphs, while having the same slope,
are one above the other – in this case the graph for Q2 is above the graph for Q1.
4. The new equations would be Qs = -4 + P and Qs = -6 + P, respectively.
EMI 7
2. a) Demand shifts OUT to the right, increasing price and quantity sold as well
b) Supply shifts IN to the left, increasing price while decreasing quantity sold
c) Demand shifts IN to the left, decreasing price and quantity sold
d) No shift in the demand and supply curves – rather a move from the equilibrium to a
price below equilibrium, with a likely situation of excess demand (ie quantity demanded
at that price exceeding the quantity supplied). Price falls, while quantity demanded
increases
e) Supply shifts OUT to the right, lowering the price for gasoline and increasing the
quantity sold
f) Demand shifts IN to the left, lowering both the price and quantity sold
g) Supply shifts IN to the left, increasing the price while decreasing the quantity sold
h) Supply shifts OUT to the right, decreasing prices while increasing the quantity sold
EMI 8
2. a) Equilibrium price is: -4 +2P = 24 – 2P
4P = 28
P=7
b) Equilibrium quantity is: Qs = -4 + 2 (7) OR Qd = 24 – 2 (7)
Qs = 10 Qd = 10
c) Complete the tables and graph to match – equilibrium is at (P,Q) = (7,10)
3. At a government mandated price of $4, there would be excess demand. The quantity
demanded at a price of $4 is 16 while the quantity supplied at a price of $4 is 4, leaving
an excess demand of 12 units. This should be confirmed with the graph.
EMI 9
2. Examples that spring readily to mind are some ex-Soviet countries in Eastern Europe,
such as Bulgaria or, even more starkly, Moldova, where it is said that rather than the
country having a mafia, the mafia has the country.
3. Signalling function – buying new sewing machines
Incentive function – making more jean jackets
4. a) Consumer surplus – region between the demand curve and the price P1
Producer surplus – region above the supply curve below P1, from the vertical axis until
Q1.
b) Q1 is not allocatively efficient as there are still opportunities to enjoy consumer and
producer surplus to the right of Q1. If the price and quantity were set where the supply
and demand curves intersect, total surplus would be the entire area between the supply
and demand curve to the left of the intersection point. This area of surplus is greater
than the area of surplus to Q1.
EMI 9 HL Extension Questions
a) Price 0 1 2 3 4 ...
Quantity Demanded 24 23.5 23 22.5 22
Price 8 9 10 11 12 ...
Quantity Supplied 0 0.5 1 1.5 2
b) Make sure graphs are fully labelled (axes and lines) and that the equilibrium point is indicated
with dotted lines and that the equilibrium price and quantity are marked ‘P1’ and ‘Q1’
c) 24 – 0.5P = -4 + 0.5P
28 = P
(and equilibrium quantity is 10 units)
d) Consumer surplus – calculate the area of the right triangle with a base at P=28, going over 10
units, rising to P= 48 where no units are sold. So, consumer surplus = 0.5 (b * h) = 0.5 (10 * $20)
= $100.
Producer surplus – calculate the area of the right triangle with a base at P=28, going over 10
units, falling to P= 8 where no units are provided. So, producer surplus = 0.5 (b*h) =
0.5 (10 * $20) = $100
e) Limiting output to 8 units would result in a price of $32.
Consumer surplus would be the area of the right triangle with a base at P=32, going over 8 units,
rising to P=48 where no units are sold, calculated as 0.5 (b*h) = 0.5 (8 *$16) = $64.
Producer surplus would be the area of the rectangle from $32 to the price suppliers were willing
to accept to sell 8 units (in this case $24) PLUS the triangle from $24 down to $8 going over 8
units.
So, a rectangle of $8 * 8 = $64 plus a triangle of 0.5 (8 * $16) = $64, for a total of $128.
The total producer and consumer surplus is therefore $64 + $128 = $192. This implies a welfare
loss of $8 (we can check this by looking for the area of the small triangle of welfare loss – it
would have a base of 8 (difference between $24 and $32) and a height of 2 (difference between
8 and ten units) – note I am looking at the triangle sideways. The area of this triangle would be
0.5 ( b * h) = 0.5 ($8 *2) = $8, which is the difference between $200 (the old surplus) and $192).
This has nonetheless been a good move from the point of view of the producers. While total
surplus declined by $8, producer surplus increased from $100 to $128.
EMI10
2. a) PED = 5/15 = 0.33
b) PED = 10/25 = 0.4 [percentage change in price is {(1.25-1.00)/1.00} *100]
3. a) inelastic as cigarettes are addictive/habitual
b) chicken legs would likely be elastic as there are many substitutes (other meats)
c) inelastic as they are a small proportion of total income and there are no close
substitutes – you can’t use just ANY decorations for Christmas
d) could go either way – elastic if you consider that close substitutes exist (aka Pepsi),
but inelastic if people believe the advertising and branding and as people spend only a
small portion of their income on Coke
4. If cigarettes have price-inelastic demand, then government taxes will not curb smoking
as much as they will raise revenue for the government.
EMI11
1. Graph the demand schedule with P on the vertical axis and Qd on the horizontal axis.
PED values: from $10 to $8 – 40%/20% = 2
from $8 to $6 - 28%/25% = 1.12
from $6 to $4 – 22%/33% = 0.66
from $4 to $2 – 18%/50% = 0.36
Demand is elastic with respect to price along the upper portion of the demand curve.
This is because of the denominators change differently as you calculate the percentage
change in price and quantity as you move down the curve. For instance, as I move down
the demand curve by a steady $2, at the top, that $2 is a small portion of the initial
value of $10. Meanwhile, the corresponding increase of 2 units of quantity is a big
portion of the initial value of 5. So, at the top, the PED is a big portion over a small
portion, thus it is a value greater than one. At the bottom portion of the demand curve,
the relative portions are reversed (ie a $2 change in price is a big portion of $4, while a
change of 2 units is not a big portion of 11), so the PED is less than one.
To maximize revenue, I would charge somewhere between $8 and $6, which is probably
in the region where PED would be equal to one. As firms also have costs, they then tend
to want to operate in the elastic portion of the demand curve.
EMI 12
2. a) Fish YED = – 0.4; Pork YED = 1.32
b) Pork is a normal good while fish is an inferior good
c) Farmers would be likely to increase their production of hogs
3. a) XED (gas/trucks) = - 1; XED (gas/ethanol) = +0.4
b) Gas and ethanol are substitutes while gas and trucks are complements
c) Perhaps offer discounted gasoline to purchasers of your trucks
4. It is a good idea from the point of view of YED as travel and tourism are strongly normal
goods whereas primary commodities are often inferior goods. As global incomes rise,
people are likely to increase their spending on tourism much more than their spending
on commodities.
5. Yachts are strongly normal and new children’s clothing is normal, while used children’s
clothing is an inferior good.
6. The demand curve for the second good (the substitute) will shift outwards. For instance,
if the price of beef increases, then people will switch to chicken. So, more chicken is
bought even though the price did not change, implying a shift outward in the demand
curve.
EMI 13
2. From $4 to $6 – 33%/50% = 0.66; From $8 to $10 – 20%/25% = 0.8
In general, the quantity supplied is inelastic with respect to price
3. a) Automobiles – automakers have more spare capacity and they do not make such a
specialized product so they should be able to change their output more in response to
price changes. As well, they operate in a much more competitive marketplace, with
dozens of making cars, whereas there are only a few airliner manufacturers (ie Boeing,
Airbus, Bombardier...).
b) MP3 players – while both have high PES values, the makers of unbranded MP3
players likely have more spare capacity and a greater ability to switch production from
other goods than Apple, mainly due to their greater collective productive capacity.
c) New homes during a recession, mainly due to the presence of unused capacity. During
a recession, it is easy to find the skilled workers and materials to build houses, whereas
during a boom, such workers and materials are harder to find.
4. People with more widely applicable skills and an awareness of opportunities are more
likely to switch to sectors and industries where their skills are in demand.
Fundamentally, such education makes individuals more responsive to market forces, as
expressed by price changes.
5. Example – supply curves going through (0,0), (1,5), (2,10), and going through (0,0), (5,1),
(10,2) both have a PES of one.
EMI14
2. Less than one unit less was sold because of the tax. The price went up almost the entire
amount of the tax. The government would raise almost $15 from the tax.
3. Less than one additional unit was sold due to the subsidy. The price went down by
almost the entire amount of the subsidy. The subsidy would cost the gov’t about $17.
EMI15
1. a) P=8 and Q=4
b) Qs = -5 + P, P=8.33 and Q=3.33
c) the price rose by 33 cents, the quantity sold fell by 0.66 units, consumer expenditure
fell from $32 to $27.74, company revenue fell from $32 to ($7.33 * 3.33 =) $24.41, while
the government raised $3.33.
d) Producers paid more of the tax, as they accepted a reduction in price of 0.66 while
the consumers only paid an extra 0.33. This is because the supply curve is steeper (less
price elastic) than the demand curve.
2. a) Qs = -3 + P, P=7.66 and Q =4.66
b) The price has fallen by 33 cents, the quantity sold has increased by 2/3 of a unit,
consumer spending has risen to $35.70, and company revenue has risen even more
sharply to (8.66 * 4.66) $40.36. The government, though, has had to pay $4.66 in
subsidies to producers.
c) Producers benefited more from the subsidy than consumers. Prices only fell by 33
cents for consumers while they rose 66 cents for producers. Again, this has to do with
the relative slopes of the demand and supply curves. In general, the less elastic of the
two either pays most of the tax or receives most of the subsidy.
3. The graphs should confirm the results in Q1 and Q2.
EMI16
2. a) Rationing – usually there are limits on the number of tickets which can be bought per
person. Prices are kept lower than equilibrium to remain attractive to teenagers who
may not have much money but who make a good audience.
b) Waiting lists – Often it will take years to move up the queue to receive the keys to a
subsidized or rent-controlled apartment. The price is kept low to keep living costs
affordable to the poor.
c) Waiting lists or actual physical queuing – if you want a non-emergency procedure
done, often under a public health system you will need to wait a period of months to get
it done. If you visit an emergency room or public clinic, you will often have to wait for
hours to see a doctor.
d) Rationing – often governments issue ration coupons to the poor in developing
countries (like India) which entitle them to purchase essential commodities like rice and
kerosene at subsidized prices.
3. Milk and eggs do not store well and thus need to be supplied on a regular basis. Thus,
wild swings in prices would lead to consumers being unable to, during times of low
prices, find milk and eggs. So, price management schemes do help to ensure that
consumers have a steady supply of these commodities in shops, by ensuring that
farmers have an incentive to produce a steady supply. By contrast, wheat and rice store
well and so swings in prices are unlikely to mean the good is unavailable as authorities
and traders will sell stored grain in times of shortage and high prices.
4. a) excess demand of 3 units, total expenditure before - $24; after - $12 (remember, at
the lower price, only 4 are available for sale, even though people want 7)
b) excess supply of 9 units, total expenditure after - $21 (as at $7, people only want to
buy 3 units)
c) answers on graph paper should agree
EMI17
2. In all three cases, there are costs incurred on others (second-hand smoke, sidewalk
violence at bar closing time etc.) that are not borne by the user of the good in question.
3. In all three cases, there are benefits which accrue to others (ie firms enjoy employing
well-educated workers, people who have access to regular health care do not get and
spread as many diseases to others) which cannot be captured by the person who would
be paying for the good.

4. While the buyer may know that the car he is selling is a good one, the buyer will often
not have confidence that this is the case. This lack of information and thus trust will
scupper many such transactions.
5. Example – the market for health care is allocatively efficient if health care is provided to
the point where the benefit gained from providing the last unit of health care are
exactly equal to the cost of providing that last unit. If less health care is provided than
this, ie if there are still benefits, be they to the person receiving the health care or
others, available in excess of the costs of providing health care at the level being
provided, the result would be allocative inefficiency.
EMI18
2. Costs suffered by you – shorter lifespan, smelly breath, stained fingers and teeth
Costs suffered by others – shorter lifespan (from second hand smoke), allergic reactions
Draw a negative externality diagram, like the first one on the facing page, and label it
correctly.
3. If I get a good education, I can enjoy higher income, more job satisfaction and more
interesting leisure activities. My family will also enjoy my higher income, my employer
will profit from my additional skills, and my community will benefit from my greater
interest in rewarding leisure activities if I engage more in community recreation
programs.
Draw a positive externality diagram, like the second one on the facing page, and label it
correctly.
4. Environmental costs – polluted water and smelly air from the mill, perhaps leading to
health problems for the residents.
Economic benefits – economic spinoffs – jobs at the mill and increased economic
activity for local businesses, and perhaps increased property values
Economic development projects often simultaneously feature both positive and
negative externalities. So long as the positive spillover effects are greater than the
negative spillover effects, the projects are usually undertaken. Other examples of such
projects are things like wind farms to generate electricity. They have clear benefits
(clean power) but also some costs (ruined vistas, dead birds).
EMI19
1. a) taxes, campaigns, and regulations (concerning age and location of smokers)
b) regulations, sometimes campaigns
c) subsidies, campaigns, regulations (ie truancy laws)
d) subsidies, regulations (housing codes to ensure safe housing)
e) campaigns and regulations (you need to get your car tested regularly in many
jurisdictions). If carbon taxes ever gain traction (like in British Columbia), taxes too.
f) subsidies, campaigns and sometimes regulations – mandatory vaccinations for school
children
2. a) Negative externality diagram. Show the MPB moving to the left, as the campaign
makes people with gambling problems more sensitive to the pain they are causing their
families
b) Positive externality diagram. Show the MPC disappearing, ie moving to the x-axis, and
thus the quantity offered being the intersection of the x-axis and MPB.
c) Negative externality diagram. Show the MPB moving in to the left, as people cannot
drink as much in fewer hours (I know, I know – this is a very weak argument, but it is the
one made by authorities who have never experienced the 10:45 last call line-up).
d) Positive externality diagram. Show the MPC moving down and to the right by the
amount of the subsidy.
EMI20
2. a) a toll highway is not non-excludable. You can be kept out with the toll gate.
b) an apple is excludable. If I eat it, you can’t.
c) a subscription satellite service is not non-excludable. You can be excluded by the
signal being scrambled.
d) so long as the concerts are not crowded, they are public goods, but once the park
gets crowded, enjoying the concert becomes somewhat rivalrous, as getting space for
your blanket becomes more difficult – ie either you get to put down your blanket in that
space, or I do.
3. If I decided to fund the production or radio and television shows to be broadcast over
the airwaves in the hope that people would pay for them I would likely go bankrupt
quite quickly. People would be happy to enjoy the programs, but would not likely bother
to send me money. PBS in the US shows this dilemma quite nicely. So, instead,
broadcasters sell your attention to advertisers and with that money they produce the
shows which capture your attention to sell. In some countries, like Britain (BBC) and
Canada (CBC) broadcast radio and television is produced by a government broadcaster
which is funded by taxes or, in the case of Britain, by the sale of mandatory licences
levied on the ownership of televisions.
4. National defence, public roads, lighthouses...
EMI21
2. Price 5 4 3 2
Qd 1 2 3 4
TRevenue 5 8 9 8
MRevenue 5 3 1 -1
TCost 2 4 6 8
TProfit 3 4 3 0
The graph should show that the allocatively efficient output would be 4 units (where the
cost of the last ice lolly to the vendor is equal to the amount the Italian tourist is willing
to pay , while the monopolist will choose to sell no more than 2 units, as this is where
his profits are greatest. Show the total cost and total profit calculations above to help
explain.
3. The vendors know much more about the items on offer than most buyers. Often, when
you point out that the item on sale is similar to an item you just saw that was half the
price, the vendor will respond that his is of “much higher quality” and usually the buyer
is not in a position to argue with any confidence. Governments could intervene to create
standards so that buyers could more easily compare prices between items of similar
workmanship.
EMI22
2. As the fish become scarce and their value rises, the incentives to individual fishermen to
catch the fish rises, making it more likely that they will continue to be fish until there are
so few that they are hard to find and likely critically endangered.
3. a) The fishing lodge and the town will both complain about the effluent from the paper
mill ruining their business and fouling their drinking water.
b) The town could then charge the mill for using the water and use the proceeds to build
a treatment plant to make river water safe for drinking. Or, alternatively, to avoid such
charges, the mill could build a treatment plant to render their effluent safe.
c) If the mill were given ownership of the water, then at least ownership is clear and the
town would want to either pay the mill to reduce their effluent or, if it was cheaper to
build their own treatment plant, do so. So long as the river water is owned by someone,
it is in someone’s interest to act to limit pollution levels. In the latter case, the firm has
an incentive to reduce pollution as they can get the town to pay for it to do so.
4. Governments could simply reduce the number of permits in circulation. This reduction
in total allowable pollution levels would force the price of the remaining permits higher,
thereby keeping in place the incentive for firms to reduce pollution levels.
5. Some of the external costs of greenhouse grass emissions are felt in places far away
from the world’s industrial centres (for instance, the Seychelles or the Maldives may
actually disappear due to global warming and rising sea levels).
Binding international agreements are required as global climate can be seen as a public
good (ie it is non-excludable and non-rivalrous) which is therefore subject to the free-
rider problem. Countries and firms and individuals in countries will not want to reduce
their emissions if other countries are not seen to be doing the same.
EMI23
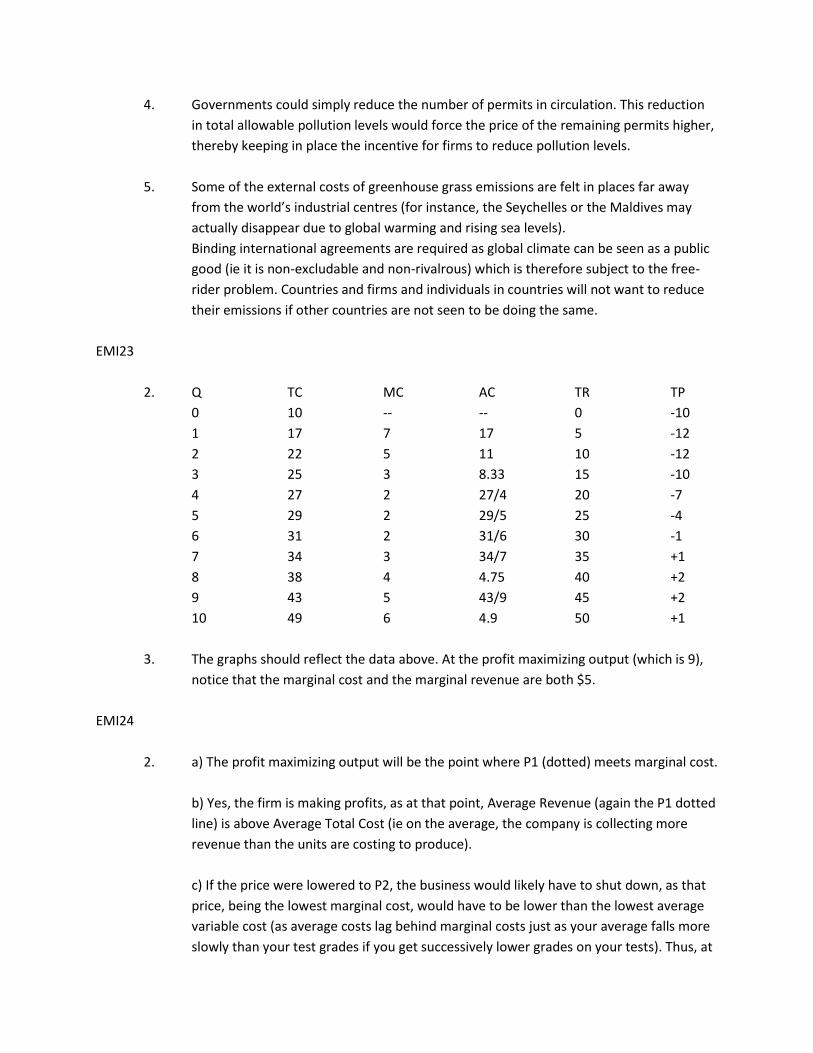
2. Q TC MC AC TR TP
0 10 -- -- 0 -10
1 17 7 17 5 -12
2 22 5 11 10 -12
3 25 3 8.33 15 -10
4 27 2 27/4 20 -7
5 29 2 29/5 25 -4
6 31 2 31/6 30 -1
7 34 3 34/7 35 +1
8 38 4 4.75 40 +2
9 43 5 43/9 45 +2
10 49 6 4.9 50 +1
3. The graphs should reflect the data above. At the profit maximizing output (which is 9),
notice that the marginal cost and the marginal revenue are both $5.
EMI24
2. a) The profit maximizing output will be the point where P1 (dotted) meets marginal cost.
b) Yes, the firm is making profits, as at that point, Average Revenue (again the P1 dotted
line) is above Average Total Cost (ie on the average, the company is collecting more
revenue than the units are costing to produce).
c) If the price were lowered to P2, the business would likely have to shut down, as that
price, being the lowest marginal cost, would have to be lower than the lowest average
variable cost (as average costs lag behind marginal costs just as your average falls more
slowly than your test grades if you get successively lower grades on your tests). Thus, at
P2, the firm is not even covering its average variable costs, and so is losing more money
for every unit produced. The wise course of action in this case is to shut down.
3. So long as the marginal costs are below average costs, average costs will be dragged
lower. However, the moment marginal costs rise above average costs, average costs will
begin to rise. From this, we can see that the lowest average costs will be at the point
where the marginal costs are equal to average costs, as at that point, average costs are
neither being dragged down or being made to rise.
EMI25
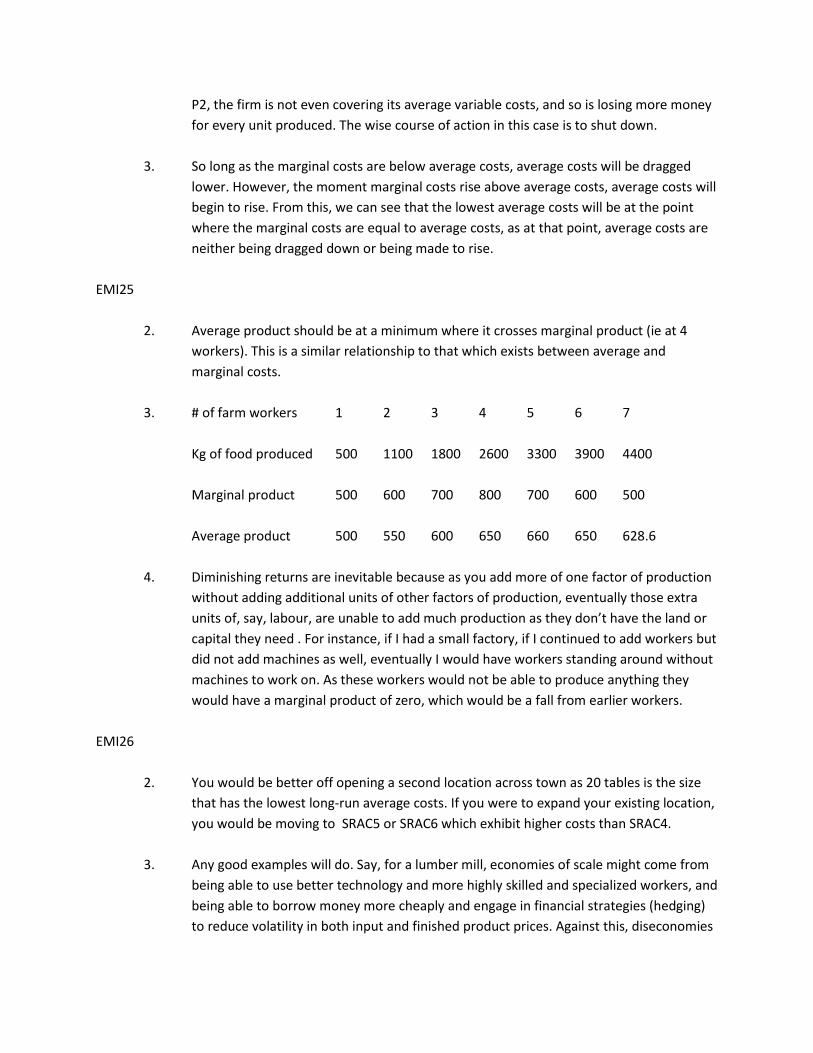
2. Average product should be at a minimum where it crosses marginal product (ie at 4
workers). This is a similar relationship to that which exists between average and
marginal costs.
3. # of farm workers 1 2 3 4 5 6 7
Kg of food produced 500 1100 1800 2600 3300 3900 4400
Marginal product 500 600 700 800 700 600 500
Average product 500 550 600 650 660 650 628.6
4. Diminishing returns are inevitable because as you add more of one factor of production
without adding additional units of other factors of production, eventually those extra
units of, say, labour, are unable to add much production as they don’t have the land or
capital they need . For instance, if I had a small factory, if I continued to add workers but
did not add machines as well, eventually I would have workers standing around without
machines to work on. As these workers would not be able to produce anything they
would have a marginal product of zero, which would be a fall from earlier workers.
EMI26
2. You would be better off opening a second location across town as 20 tables is the size
that has the lowest long-run average costs. If you were to expand your existing location,
you would be moving to SRAC5 or SRAC6 which exhibit higher costs than SRAC4.
3. Any good examples will do. Say, for a lumber mill, economies of scale might come from
being able to use better technology and more highly skilled and specialized workers, and
being able to borrow money more cheaply and engage in financial strategies (hedging)
to reduce volatility in both input and finished product prices. Against this, diseconomies
of scale may enter into things if there is increased waste and absenteeism due to the
emergence of toxic worker/management relationship and poor morale.
4. This should be an interesting discussion, particularly if students in your class have been
to bigger or smaller schools. Economies of scale might be the ability to offer specialized
courses and use the same admin staff to do the work of 200 or 700. Diseconomies
would emerge from teachers and administrators not knowing all the students, leaving
some to ‘fall between the cracks’ and that alienation leading some students to
vandalism etc.
EMI27
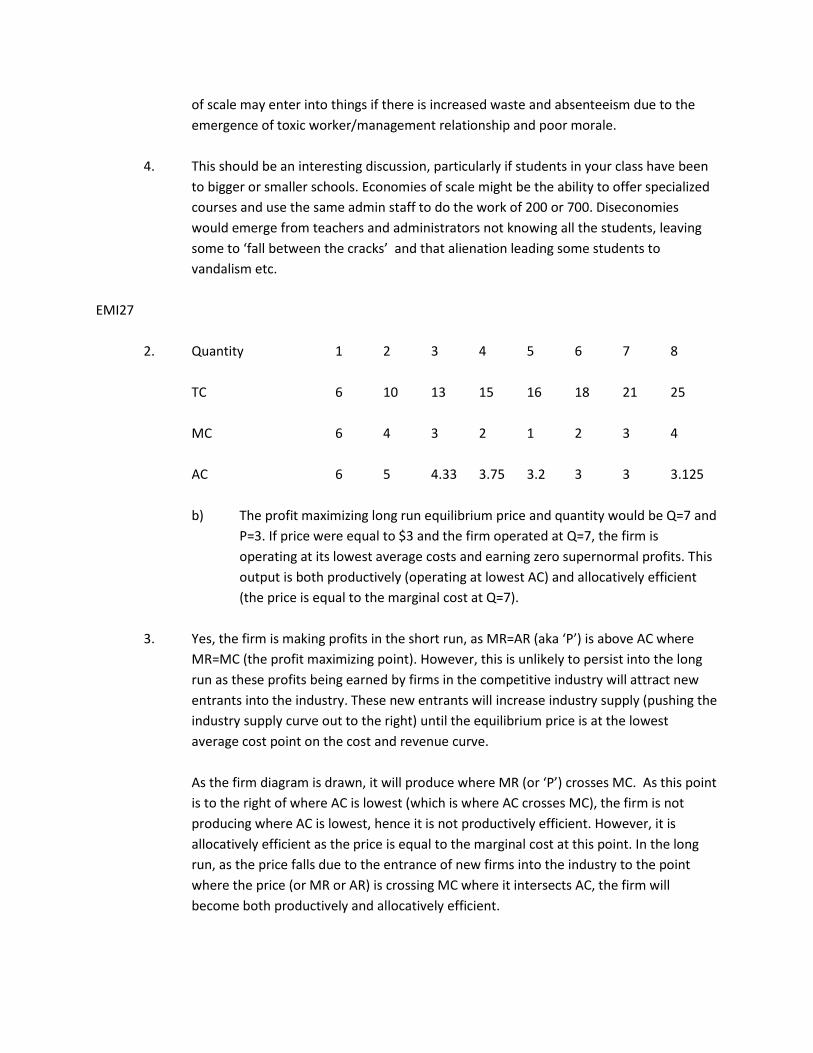
2. Quantity 1 2 3 4 5 6 7 8
TC 6 10 13 15 16 18 21 25
MC 6 4 3 2 1 2 3 4
AC 6 5 4.33 3.75 3.2 3 3 3.125
b) The profit maximizing long run equilibrium price and quantity would be Q=7 and
P=3. If price were equal to $3 and the firm operated at Q=7, the firm is
operating at its lowest average costs and earning zero supernormal profits. This
output is both productively (operating at lowest AC) and allocatively efficient
(the price is equal to the marginal cost at Q=7).
3. Yes, the firm is making profits in the short run, as MR=AR (aka ‘P’) is above AC where
MR=MC (the profit maximizing point). However, this is unlikely to persist into the long
run as these profits being earned by firms in the competitive industry will attract new
entrants into the industry. These new entrants will increase industry supply (pushing the
industry supply curve out to the right) until the equilibrium price is at the lowest
average cost point on the cost and revenue curve.
As the firm diagram is drawn, it will produce where MR (or ‘P’) crosses MC. As this point
is to the right of where AC is lowest (which is where AC crosses MC), the firm is not
producing where AC is lowest, hence it is not productively efficient. However, it is
allocatively efficient as the price is equal to the marginal cost at this point. In the long
run, as the price falls due to the entrance of new firms into the industry to the point
where the price (or MR or AR) is crossing MC where it intersects AC, the firm will
become both productively and allocatively efficient.
EMI28
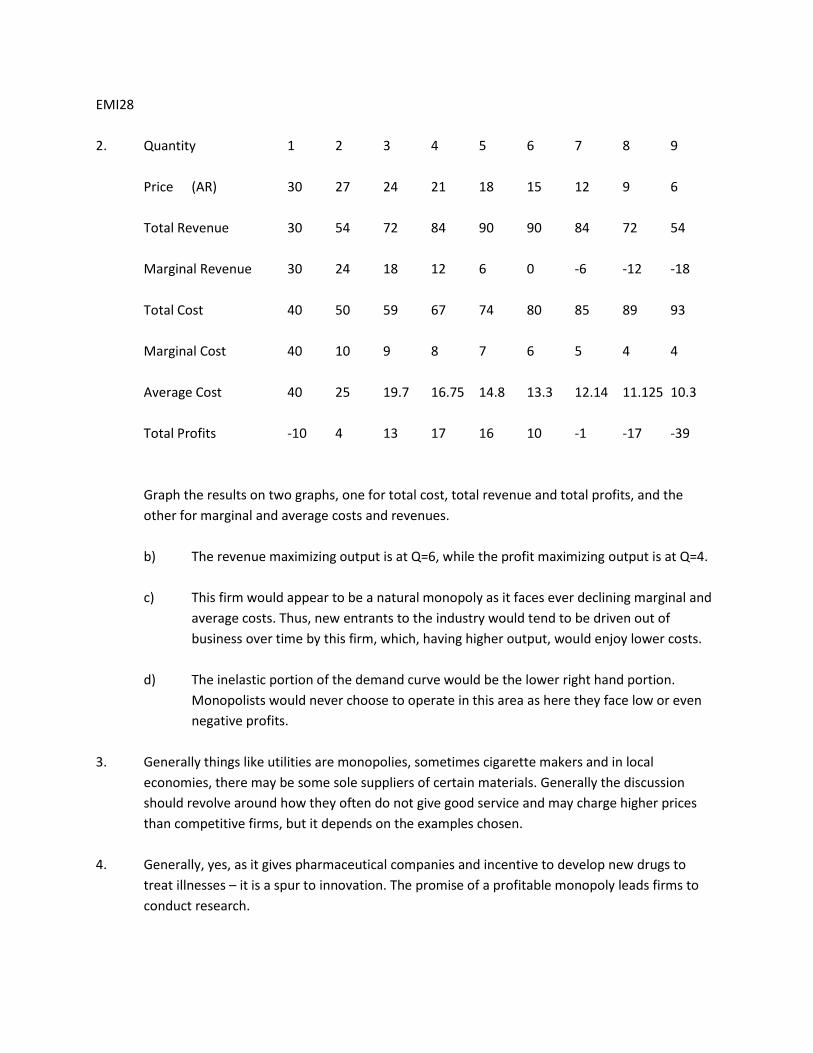
2. Quantity 1 2 3 4 5 6 7 8 9
Price (AR) 30 27 24 21 18 15 12 9 6
Total Revenue 30 54 72 84 90 90 84 72 54
Marginal Revenue 30 24 18 12 6 0 -6 -12 -18
Total Cost 40 50 59 67 74 80 85 89 93
Marginal Cost 40 10 9 8 7 6 5 4 4
Average Cost 40 25 19.7 16.75 14.8 13.3 12.14 11.125 10.3
Total Profits -10 4 13 17 16 10 -1 -17 -39
Graph the results on two graphs, one for total cost, total revenue and total profits, and the
other for marginal and average costs and revenues.
b) The revenue maximizing output is at Q=6, while the profit maximizing output is at Q=4.
c) This firm would appear to be a natural monopoly as it faces ever declining marginal and
average costs. Thus, new entrants to the industry would tend to be driven out of
business over time by this firm, which, having higher output, would enjoy lower costs.
d) The inelastic portion of the demand curve would be the lower right hand portion.
Monopolists would never choose to operate in this area as here they face low or even
negative profits.
3. Generally things like utilities are monopolies, sometimes cigarette makers and in local
economies, there may be some sole suppliers of certain materials. Generally the discussion
should revolve around how they often do not give good service and may charge higher prices
than competitive firms, but it depends on the examples chosen.
4. Generally, yes, as it gives pharmaceutical companies and incentive to develop new drugs to
treat illnesses – it is a spur to innovation. The promise of a profitable monopoly leads firms to
conduct research.
EMI29
2. a) By offering better fares in the low season or to people who book far in advance
b) By offering discounts to people willing to eat dinner early (ie the ‘early bird special’)
c) By branding and marketing – premium brand beans can command higher prices than
store brand beans, even when the store brand is made at the same plant as the name
brand beans.
d) By closely observing their clothing and other markers of wealth, as well as by
observing their gullibility.
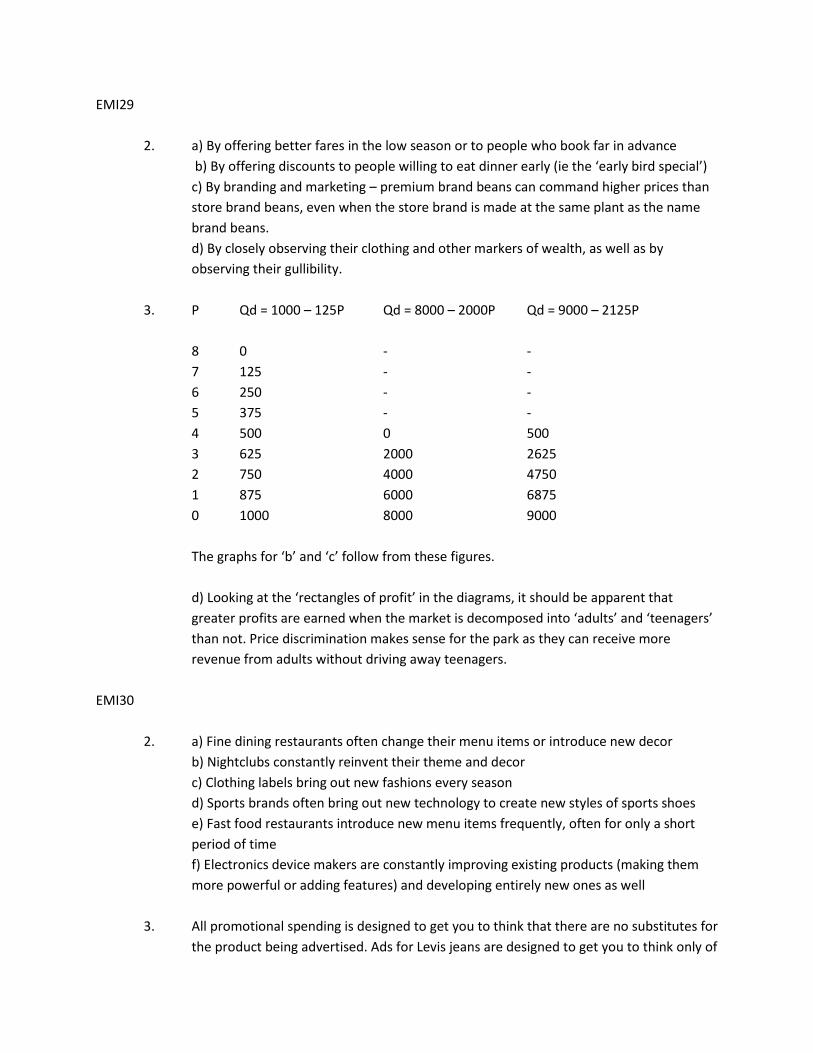
3. P Qd = 1000 – 125P Qd = 8000 – 2000P Qd = 9000 – 2125P
8 0 - -
7 125 - -
6 250 - -
5 375 - -
4 500 0 500
3 625 2000 2625
2 750 4000 4750
1 875 6000 6875
0 1000 8000 9000
The graphs for ‘b’ and ‘c’ follow from these figures.
d) Looking at the ‘rectangles of profit’ in the diagrams, it should be apparent that
greater profits are earned when the market is decomposed into ‘adults’ and ‘teenagers’
than not. Price discrimination makes sense for the park as they can receive more
revenue from adults without driving away teenagers.
EMI30
2. a) Fine dining restaurants often change their menu items or introduce new decor
b) Nightclubs constantly reinvent their theme and decor
c) Clothing labels bring out new fashions every season
d) Sports brands often bring out new technology to create new styles of sports shoes
e) Fast food restaurants introduce new menu items frequently, often for only a short
period of time
f) Electronics device makers are constantly improving existing products (making them
more powerful or adding features) and developing entirely new ones as well
3. All promotional spending is designed to get you to think that there are no substitutes for
the product being advertised. Ads for Levis jeans are designed to get you to think only of
Levis when you want to buy jeans, and not to consider other brands like Lee, Wrangler
etc.
4. The output of firms operating under monopolistic competition is usually to the left of
the productively efficient output, which is to say, they are not busy – sales clerks and
waiters tend to spend some time just standing around when there are few customers.
5. MS # of firms B to E? Homog. Goods? Econ profit SR? LR? Ex?
PC many no yes rarely no farmers
M one yes yes yes utilities
MC many no no – differentiated yes no restos
MI31
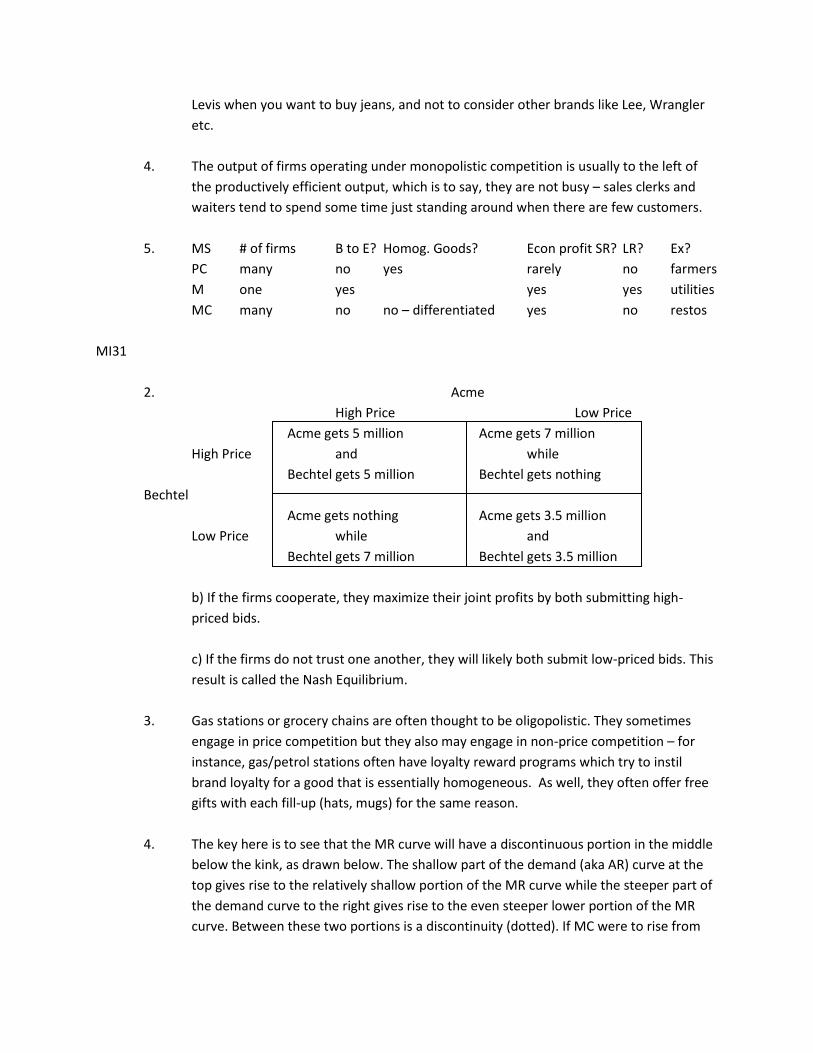
2. Acme
High Price Low Price
Acme gets 5 million Acme gets 7 million
High Price and while
Bechtel gets 5 million Bechtel gets nothing
Bechtel
Acme gets nothing Acme gets 3.5 million
Low Price while and
Bechtel gets 7 million Bechtel gets 3.5 million
b) If the firms cooperate, they maximize their joint profits by both submitting high-
priced bids.
c) If the firms do not trust one another, they will likely both submit low-priced bids. This
result is called the Nash Equilibrium.
3. Gas stations or grocery chains are often thought to be oligopolistic. They sometimes
engage in price competition but they also may engage in non-price competition – for
instance, gas/petrol stations often have loyalty reward programs which try to instil
brand loyalty for a good that is essentially homogeneous. As well, they often offer free
gifts with each fill-up (hats, mugs) for the same reason.
4. The key here is to see that the MR curve will have a discontinuous portion in the middle
below the kink, as drawn below. The shallow part of the demand (aka AR) curve at the
top gives rise to the relatively shallow portion of the MR curve while the steeper part of
the demand curve to the right gives rise to the even steeper lower portion of the MR
curve. Between these two portions is a discontinuity (dotted). If MC were to rise from
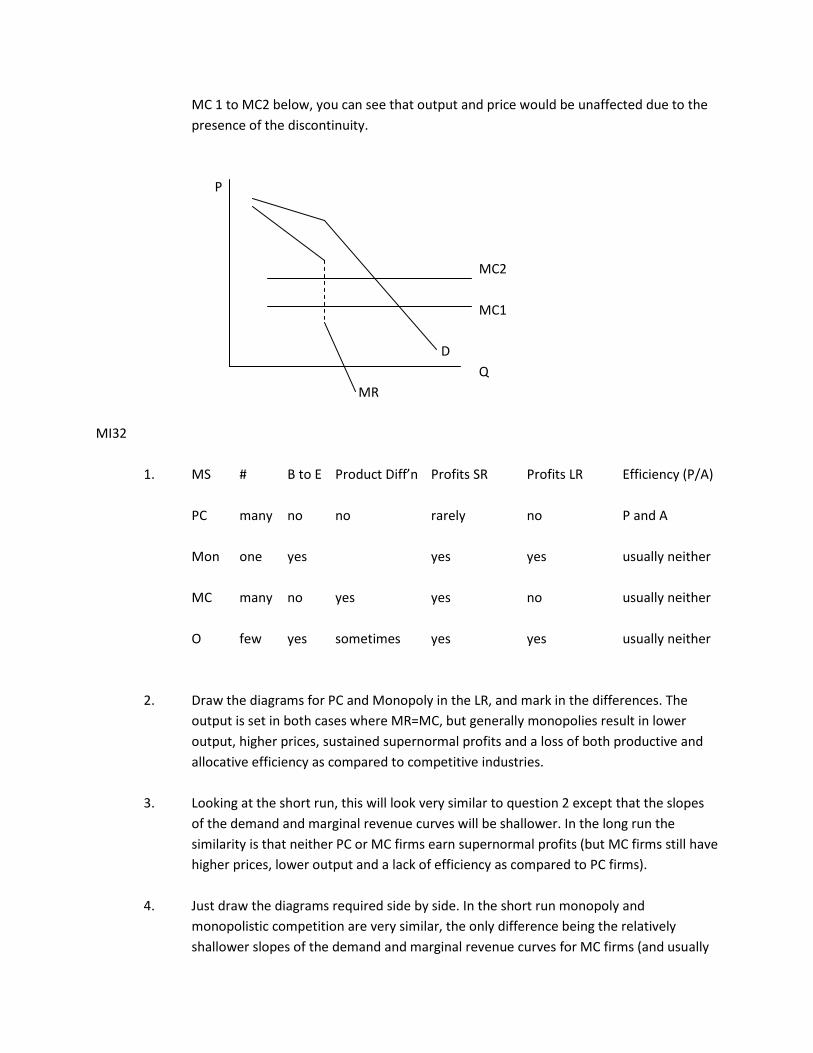
MC 1 to MC2 below, you can see that output and price would be unaffected due to the
presence of the discontinuity.
P
MC2
MC1
D
Q
MR
MI32
1. MS # B to E Product Diff’n Profits SR Profits LR Efficiency (P/A)
PC many no no rarely no P and A
Mon one yes yes yes usually neither
MC many no yes yes no usually neither
O few yes sometimes yes yes usually neither
2. Draw the diagrams for PC and Monopoly in the LR, and mark in the differences. The
output is set in both cases where MR=MC, but generally monopolies result in lower
output, higher prices, sustained supernormal profits and a loss of both productive and
allocative efficiency as compared to competitive industries.
3. Looking at the short run, this will look very similar to question 2 except that the slopes
of the demand and marginal revenue curves will be shallower. In the long run the
similarity is that neither PC or MC firms earn supernormal profits (but MC firms still have
higher prices, lower output and a lack of efficiency as compared to PC firms).
4. Just draw the diagrams required side by side. In the short run monopoly and
monopolistic competition are very similar, the only difference being the relatively
shallower slopes of the demand and marginal revenue curves for MC firms (and usually
lower levels of supernormal profit) reflecting their weaker market power (ie close
substitutes do exist for their products). However, in the long run the situations are very
different in that the MC firms are no longer earning supernormal profits as the absence
of barriers to entry has made them vulnerable to new entrants if they do not innovate
to remain in the short run.
5. When oligopolists engage in a ‘price war’ to drive a fellow oligopolist out of business
they resemble competitive firms. When they cooperate to maximize their joint profits,
they, as an industry, resemble a monopoly. Oligopolists are unique in their decision
making processes as their decisions depend on how they perceive their fellow
oligopolists will respond to their decisions – they are interdependent. The diagram
drawn should be the same as for a monopoly. This outcome is not stable as the
individual oligopolists will have a temptation to cheat to either increase their market
share, often by secretly lowering prices, which will make the situation more
competitive.
MA1
2. Such actions would likely reduce the level of economic activity of firms and households.
3. The correct counter-cyclical response to a crash or recession would be to cut taxes and
increase spending.
4. A reduction in interest rates reduces the cost of borrowing and the reward for saving.
Thus, lower interest rates should encourage borrowing and discourage saving. Both of
these should result in higher spending and investment by both firms and households.
5. (6) Central Europeans like von Mises and von Hayek had first-hand experience with fascism,
which involved a great deal of government control over the economy. This was not
without good aspects – Germany under Hitler embarked on big public works projects
(and rearmament) that resulted in a marked reduction in unemployment while the
western democracies were still wallowing in misery in the mid-1930s. However, the
tyranny that ultimately resulted was too high a price to pay for lower unemployment,
which is why economists of the Austrian school value freedom (supported by free
markets) so highly.
6. (7) Often we see governments being kicked out of office if unemployment remains high or
inflation is high. I suspect unemployment and weak growth will result in trouble at the
polls for Barack Obama in the US in 2012.
MA2
2. AD = C + I + G + (X-M), so in this case
AD = 400 + 60 + 20 + 60 + (50-40)
AD = 490 billion dollars
Note – As I am counting nominal GDP using the expenditure approach, I am counting all
consumer spending on goods and services, ALL spending by firms on equipment and
machinery (‘gross’, not ‘net’), all government spending that results in the production of
goods and services (including salaries) and net exports. The reason we count
government spending on salaries for government workers but not for the spending of
firms on wages and salaries is that the value of the government worker’s work is not
made a part of his or her product (ie a nurse in a public hospital does create value, but
as people don’t have to pay to go to the hospital, the value of her work would not show
up as consumption expenditure) while the wages paid to workers employed by firms is
captured in the selling price of whatever it is the firms produce, and so does show up as
consumption expenditure.
3. GDP from the expenditure side might be consistently greater due to income tax
avoidance and evasion. People may earn money and not declare it on their tax forms
but nonetheless spend it on goods and services. The gap between GDP calculated using
the expenditure approach and the income approach gives a rough estimate of the size
of the ‘underground’ economy.
4. See ‘Note’ above for the first part of this. As to why government transfer payments are
excluded, they are not counted as nothing was produced in order for individuals to
receive them. Remember, both the income and expenditure approach are trying to
capture the level of output of goods and services in an economy.
5. Nominal GDP = 400 + 70 + 60 + 15 = 545 billion dollars
Nominal GNP = 545 -15 + 10 = 540 billion dollars
6. 120/124 = x/545
X = (120 * 545)/124 = 527.42 billion dollars
In words, the price level in 2010 is 3-4% higher than it was in 2009. So, you have to take
that increase in prices out of the figure for nominal GDP to arrive at the real GDP in
2009 dollars.
7. a) This would show up under the income approach (wages and salaries) or the
expenditure approach (G)
b) This spending would not show up under either the income or expenditure approach,
as the goods are not finished products/final goods and services
c) The spending on the materials would show up under the expenditure approach (C)
d) This would be part of the calculation of ‘G’ under the expenditure approach
e) This would show up using the income approach
f) This would not show up using either approach (however the person’s spending of the
money would eventually show up as ‘C’ under the expenditure approach)
g) This would show up under the expenditure approach as ‘I’ – a casino is an income
producing asset and so building one (or building a hotel or office building or even
homes) counts as investment spending. However, the money that was earned selling
drugs did not likely get counted in any fashion as people tend not to ask for receipts
when buying drugs.
8. 64/60 = x/100; x = 106.66, therefore economic growth between 2008 and 2009 was 6
and 2/3 % (ie 6.66%).
69/64 = x/100; x = 107.8, therefore economic growth between 2009 and 2010 was 7.8%.
MA3
2. During an expansion, saving (leakage) is likely going down as people spend more, and as
a consequence, investment (injection) is rising to meet the rising demand for goods and
services. During a contraction, the opposite is likely the case – savings are rising (and
consumption spending falls) as people are fearful of future uncertainty and investment
is falling.
3. During the boom, the common sense was that ‘houses always rise in value’ – this belief
led not only to individuals borrowing ever greater sums of money to buy increasingly
expensive (and unaffordable) houses but to banks gladly lending them the money. This
confidence in the unsinkable nature of the housing market was what led to the boom,
despite many more sober voices warning that the housing market was already in an
asset bubble. As people who were renting saw house prices rising steadily, they didn’t
want to be ‘left behind’ – this was particularly the case in Ireland which had never
experienced a housing bubble before.
4. Austrian school economists believe that positive real interest rates are necessary to
avoid the creation of asset bubbles that ultimately pop. The housing bubble can be in
large part blamed on Alan Greenspan who pursued a zero interest rate policy at the US
Federal Reserve in response to the technology stock market crash of 2001. These low
rates were also made possible by global trade imbalances. China invested much of the
surplus cash earned in trade in US treasury bonds, which depressed interest rates in the
US. These low rates made it possible for people to service much bigger loans than in the
past, which in turn allowed people to bid higher and higher prices for homes.
5. eBay makes sense – it is a trading platform that manages information, and information
can be transported at zero cost on the internet. Pets dot com makes no sense – it was
an online pet food store. Ordering pet food online was easy for consumers, but shipping
the orders to consumers was far more expensive than having them drive down to their
local supermarket and pick it up. So, early on in the business cycle, good ideas are
developed, but in the later stages increasingly sketchy ideas are explored.
MA4
2. a) AD shifts to the right, increasing both real output and the price level
b) AS shifts to the right, increasing real output and reducing the price level
(while the roads are being built, increased gov’t spending could increase AD)
c) AS shifts to the right
d) AS shifts to the right
e) AD shifts to the left, decreasing real output and the price level
f) AS shifts to the left, decreasing real output and increasing the price level
g) AD shifts to the left
h) AS shifts to the right (the deductions should encourage greater investment)
(AD may shift out as well, but the dominant intended effect is on AS)
i) AS shifts to the left
j) AS shifts to the left
k) AS shifts to the left
l) AS shifts to the right
MA5
1. Keynesian – an increase in real output, no increase in the price level
Neo-classical – an increase in the price level, no increase in real output
The Keynesian view is supportive of government intervention to reduce unemployment
while the neoclassical view sees government intervention as inherently inflationary.
2. The diagram will feature SRAS 3 to the left of SRAS 2, and AD3 to the right of AD2.
Joining up the points where the corresponding SRAS/AD pairs intersect (ie SRAS1/AD1,
SRAS2/AD2) should result in a vertical line, which is LRAS.
If governments had done nothing in response the initial increase in oil prices would have
had a short-term effect on output (lower) and the price level (higher) but over time
firms and consumers would have found substitutes or made processes more efficient
and the increase in oil prices would have been absorbed without leading to higher
inflation.
3. The diagram on the left shows a recessionary gap (unemployment ) while the diagram
on the right shows an inflationary gap (inflation).
MA6
2. Multiplier = (1/1-MPC), therefore = (1/1-0.75), therefore = 1/0.25, therefore = 4
So, the total increase in AD would be 4*$1000 = $4000.
3. Left diagram – problem is overheating/inflation – governments should cut spending,
raise taxes and increase interest rates
Right diagram – problem is low output/unemployment – government should increase
spending, lower taxes and lower interest rates
4. Recessions are good in that they cleanse the economy of wasteful enterprises and
investment. If the impact of recession is blunted, while that will spare people misery, it
can also lead to unsound businesses remaining in business and using up scarce
resources. This affects people as well – if unsound businesses remain in operation
people will develop the skills necessary to work in the business when perhaps they
should develop skills more suitable for other industries and businesses.
5. A belief in government management may make firms and workers believe that their
success or failure is due to government action, not their own actions. Thus, firms may
not make necessary investments and workers may not upgrade their own training as
much as they would were they not sure that, if they ran into trouble, the government
would help them out. For instance, if workers can see that their industry is facing stiff
competition from foreign competitors, under a free-market system, they have an
incentive to learn new skills that are transferable to work in other industries. In a system
that is used to government intervention (like the UK from the 1940s to the 1970s)
workers will not bother as they will view it as the government’s responsibility to
preserve their jobs.
MA7
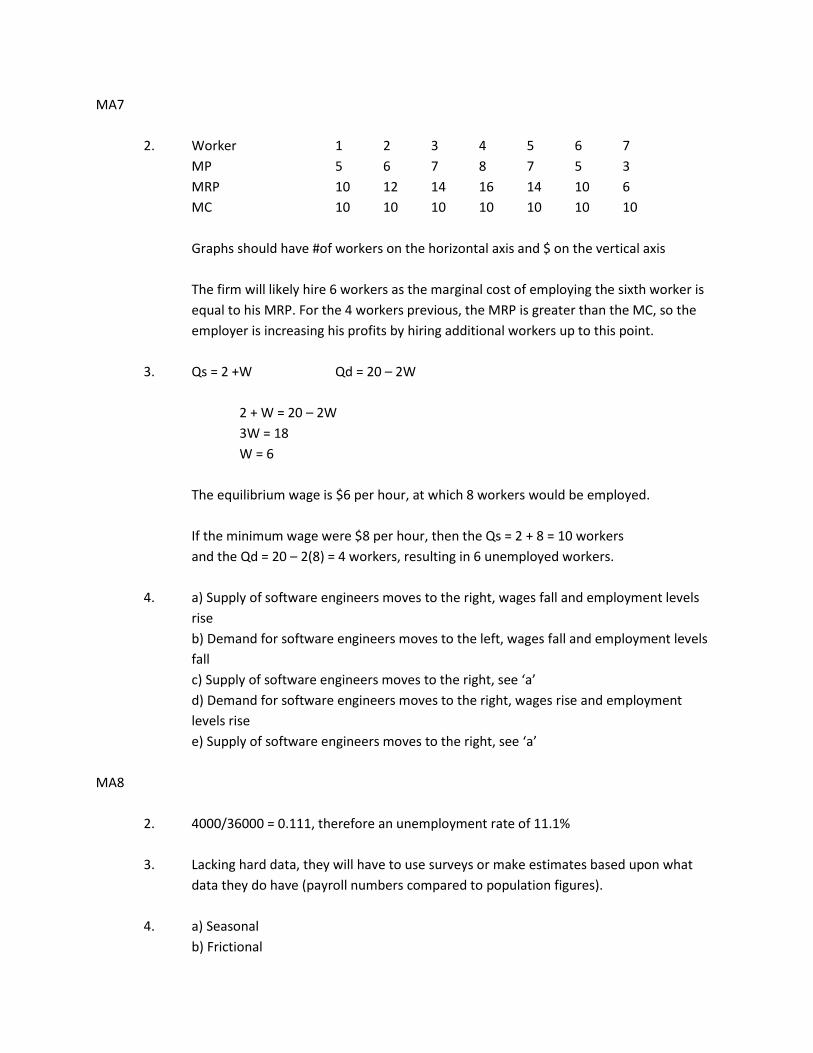
2. Worker 1 2 3 4 5 6 7
MP 5 6 7 8 7 5 3
MRP 10 12 14 16 14 10 6
MC 10 10 10 10 10 10 10
Graphs should have #of workers on the horizontal axis and $ on the vertical axis
The firm will likely hire 6 workers as the marginal cost of employing the sixth worker is
equal to his MRP. For the 4 workers previous, the MRP is greater than the MC, so the
employer is increasing his profits by hiring additional workers up to this point.
3. Qs = 2 +W Qd = 20 – 2W
2 + W = 20 – 2W
3W = 18
W = 6
The equilibrium wage is $6 per hour, at which 8 workers would be employed.
If the minimum wage were $8 per hour, then the Qs = 2 + 8 = 10 workers
and the Qd = 20 – 2(8) = 4 workers, resulting in 6 unemployed workers.
4. a) Supply of software engineers moves to the right, wages fall and employment levels
rise
b) Demand for software engineers moves to the left, wages fall and employment levels
fall
c) Supply of software engineers moves to the right, see ‘a’
d) Demand for software engineers moves to the right, wages rise and employment
levels rise
e) Supply of software engineers moves to the right, see ‘a’
MA8
2. 4000/36000 = 0.111, therefore an unemployment rate of 11.1%
3. Lacking hard data, they will have to use surveys or make estimates based upon what
data they do have (payroll numbers compared to population figures).
4. a) Seasonal
b) Frictional
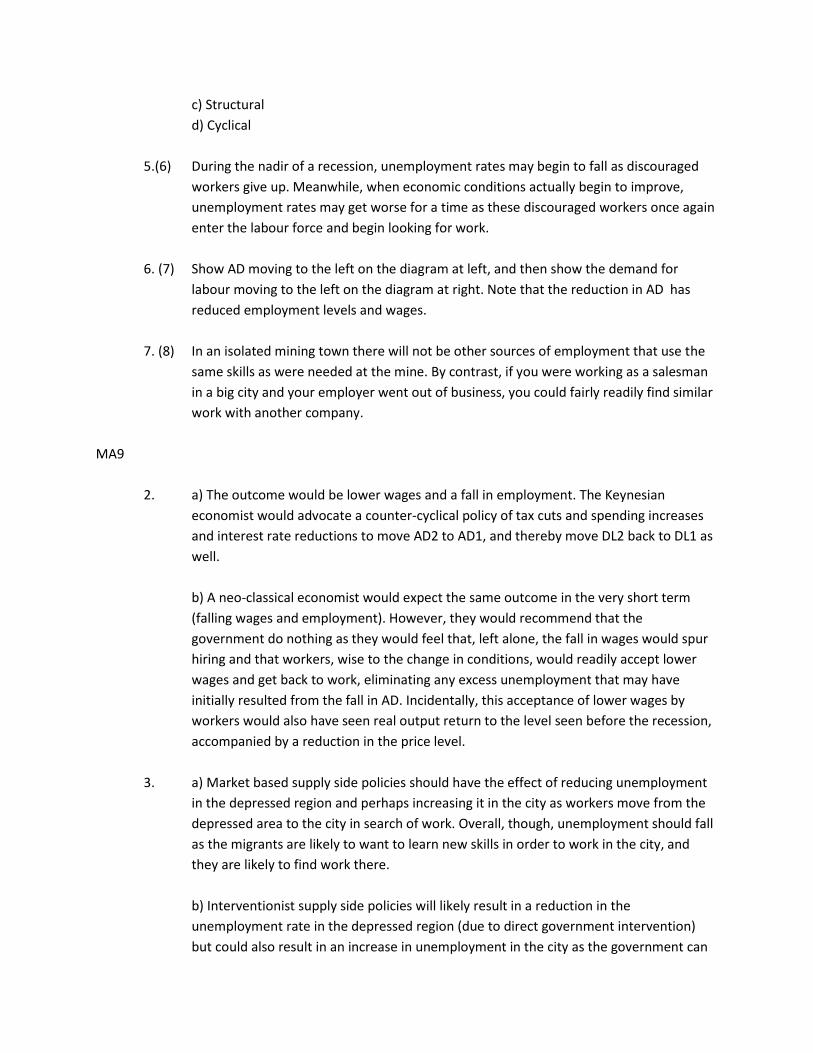
c) Structural
d) Cyclical
5.(6) During the nadir of a recession, unemployment rates may begin to fall as discouraged
workers give up. Meanwhile, when economic conditions actually begin to improve,
unemployment rates may get worse for a time as these discouraged workers once again
enter the labour force and begin looking for work.
6. (7) Show AD moving to the left on the diagram at left, and then show the demand for
labour moving to the left on the diagram at right. Note that the reduction in AD has
reduced employment levels and wages.
7. (8) In an isolated mining town there will not be other sources of employment that use the
same skills as were needed at the mine. By contrast, if you were working as a salesman
in a big city and your employer went out of business, you could fairly readily find similar
work with another company.
MA9
2. a) The outcome would be lower wages and a fall in employment. The Keynesian
economist would advocate a counter-cyclical policy of tax cuts and spending increases
and interest rate reductions to move AD2 to AD1, and thereby move DL2 back to DL1 as
well.
b) A neo-classical economist would expect the same outcome in the very short term
(falling wages and employment). However, they would recommend that the
government do nothing as they would feel that, left alone, the fall in wages would spur
hiring and that workers, wise to the change in conditions, would readily accept lower
wages and get back to work, eliminating any excess unemployment that may have
initially resulted from the fall in AD. Incidentally, this acceptance of lower wages by
workers would also have seen real output return to the level seen before the recession,
accompanied by a reduction in the price level.
3. a) Market based supply side policies should have the effect of reducing unemployment
in the depressed region and perhaps increasing it in the city as workers move from the
depressed area to the city in search of work. Overall, though, unemployment should fall
as the migrants are likely to want to learn new skills in order to work in the city, and
they are likely to find work there.
b) Interventionist supply side policies will likely result in a reduction in the
unemployment rate in the depressed region (due to direct government intervention)
but could also result in an increase in unemployment in the city as the government can
only pay for the interventionist policy through raising taxes on other workers and
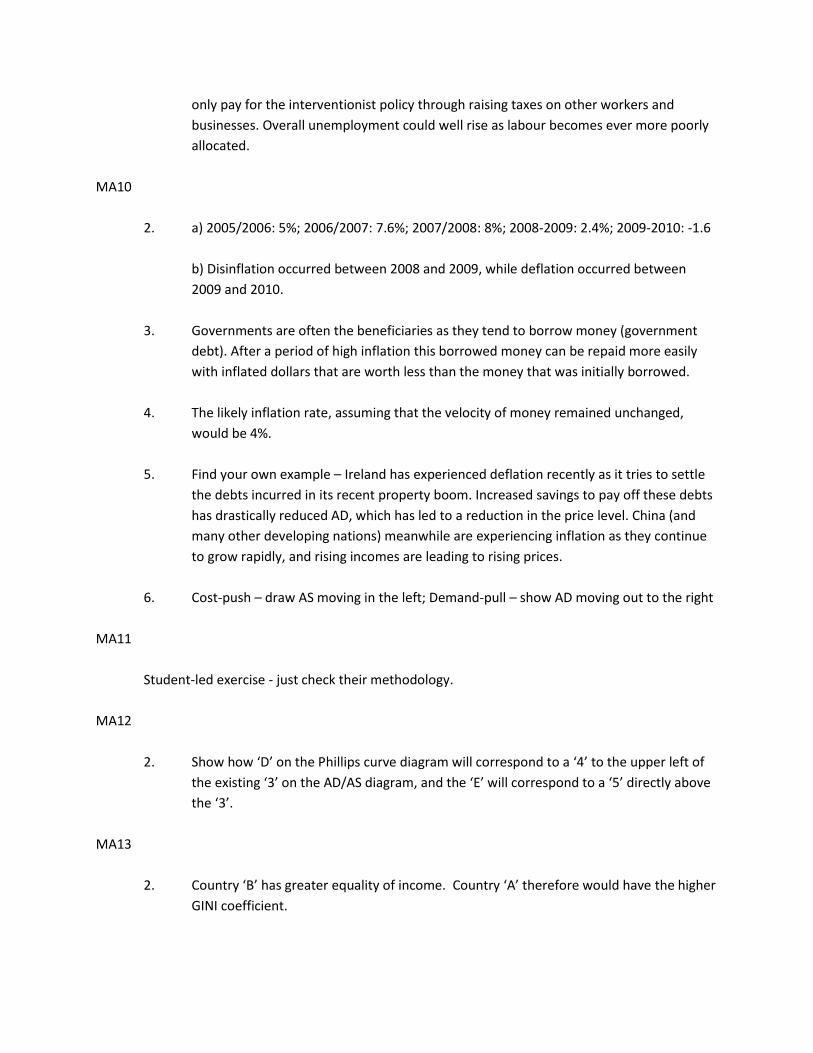
businesses. Overall unemployment could well rise as labour becomes ever more poorly
allocated.
MA10
2. a) 2005/2006: 5%; 2006/2007: 7.6%; 2007/2008: 8%; 2008-2009: 2.4%; 2009-2010: -1.6
b) Disinflation occurred between 2008 and 2009, while deflation occurred between
2009 and 2010.
3. Governments are often the beneficiaries as they tend to borrow money (government
debt). After a period of high inflation this borrowed money can be repaid more easily
with inflated dollars that are worth less than the money that was initially borrowed.
4. The likely inflation rate, assuming that the velocity of money remained unchanged,
would be 4%.
5. Find your own example – Ireland has experienced deflation recently as it tries to settle
the debts incurred in its recent property boom. Increased savings to pay off these debts
has drastically reduced AD, which has led to a reduction in the price level. China (and
many other developing nations) meanwhile are experiencing inflation as they continue
to grow rapidly, and rising incomes are leading to rising prices.
6. Cost-push – draw AS moving in the left; Demand-pull – show AD moving out to the right
MA11
Student-led exercise - just check their methodology.
MA12
2. Show how ‘D’ on the Phillips curve diagram will correspond to a ‘4’ to the upper left of
the existing ‘3’ on the AD/AS diagram, and the ‘E’ will correspond to a ‘5’ directly above
the ‘3’.
MA13
2. Country ‘B’ has greater equality of income. Country ‘A’ therefore would have the higher
GINI coefficient.
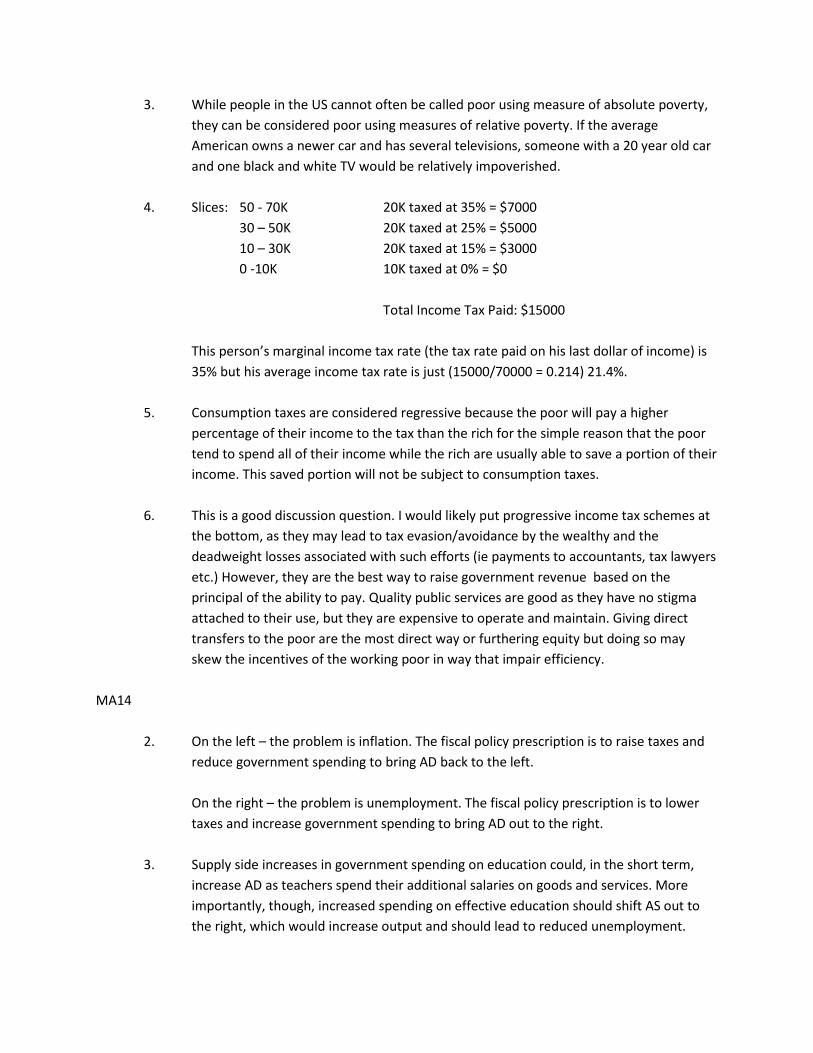
3. While people in the US cannot often be called poor using measure of absolute poverty,
they can be considered poor using measures of relative poverty. If the average
American owns a newer car and has several televisions, someone with a 20 year old car
and one black and white TV would be relatively impoverished.
4. Slices: 50 - 70K 20K taxed at 35% = $7000
30 – 50K 20K taxed at 25% = $5000
10 – 30K 20K taxed at 15% = $3000
0 -10K 10K taxed at 0% = $0
Total Income Tax Paid: $15000
This person’s marginal income tax rate (the tax rate paid on his last dollar of income) is
35% but his average income tax rate is just (15000/70000 = 0.214) 21.4%.
5. Consumption taxes are considered regressive because the poor will pay a higher
percentage of their income to the tax than the rich for the simple reason that the poor
tend to spend all of their income while the rich are usually able to save a portion of their
income. This saved portion will not be subject to consumption taxes.
6. This is a good discussion question. I would likely put progressive income tax schemes at
the bottom, as they may lead to tax evasion/avoidance by the wealthy and the
deadweight losses associated with such efforts (ie payments to accountants, tax lawyers
etc.) However, they are the best way to raise government revenue based on the
principal of the ability to pay. Quality public services are good as they have no stigma
attached to their use, but they are expensive to operate and maintain. Giving direct
transfers to the poor are the most direct way or furthering equity but doing so may
skew the incentives of the working poor in way that impair efficiency.
MA14
2. On the left – the problem is inflation. The fiscal policy prescription is to raise taxes and
reduce government spending to bring AD back to the left.
On the right – the problem is unemployment. The fiscal policy prescription is to lower
taxes and increase government spending to bring AD out to the right.
3. Supply side increases in government spending on education could, in the short term,
increase AD as teachers spend their additional salaries on goods and services. More
importantly, though, increased spending on effective education should shift AS out to
the right, which would increase output and should lead to reduced unemployment.
MA15
1. The central bank should raise interest rates. This will shift AD back to the left and
eliminate the inflationary gap. Raising interest rates reduces aggregate demand mainly
by increasing the cost of borrowing. With higher borrowing costs, people are less likely
to borrow to spend on big ticket items like homes, cars and appliances. As well, firms
are less likely to borrow money to spend on additional equipment and machinery.
2. The banking industry would like interest rates to remain low so as to maintain the
health of their loan portfolios. At low interest rates, borrowers can continue to make
payments on their loans and the loans can remain on the accounts of the bank as
performing assets.
If interest rates were to rise, though, many individuals and firms would be unable to
make their payments on their mortgage and other debts and would default. This would
threaten the health of the banks as then the loans become non-performing assets,
which cannot be counted as bank assets. More directly, if the banks borrowed money to
lend to others, and if these other people cannot pay the money back, the banks are
going to have to accept losses.
3. If interest rates remain low for a long period of time, inflation could become a problem
as with lower interest rates, speculators might be tempted to speculate in commodity
markets which would push up the price of food and energy. Generally investors shun
commodities as they don’t yield a dividend or interest payment, but in a zero interest
rate environment, the opportunity cost of investing in commodities instead of in stocks
or bonds is minimal – you are not giving up much in the way of interest payments to
invest in commodities.
4. Ultra-low rates nonetheless serve the policy objectives of full employment, equity and
growth. If low rates can encourage businesses to invest in increasing capacity, they may
hire additional workers. If low rates can keep over-indebted people in their homes, that
is good for equity (and, as well, good for household wealth – if people who cannot make
their mortgage payments are forced out of their homes, the sale of their homes will
depress prices of other homes, reducing the household wealth of everyone). If people
feel wealthy and if they are getting work, that is good for growth.
MA16
2. In the short term, the construction project will increase AD, shifting AD to the right.
In the long term, the completed port and rail link will increase the productive capacity of
the country, and so will shift both SRAS and LRAS to the right.
3. In the short run, such cuts will reduce AD, shifting it to the left as workers and the
unemployed suffer reduced purchasing power.
In the long run, though, as the unemployed are motivated to seek employment and as
unionized workers begin to be more amenable to working flexible shifts in order to earn
higher wages, AS should shift out to the right.
However, if the workers refuse to accept these changes and go on a general strike, AS
could also, in the medium term, shift to the left (aka Greece).
MA17
2. Depending too much on demand management to ensure full employment can result in
an economy losing its responsiveness to changing market conditions, ie losing
competitiveness. This can, over time, lead to inflation.
3. Popular protest often prevents governments from pursuing greater supply-side
regulatory reform. For example, much of Southern Europe should have enacted supply-
side reforms before the adoption of the euro, but political resistance resulted in such
reforms being postponed. Now, the glaring productivity and competitiveness gap
between nations such as Greece and Portugal as opposed to Germany threatens the
euro’s existence itself.
4. a) The Singapore government should likely do nothing, apart from encouraging people
to shop at less expensive stores or use less expensive cuts of meat in their cooking. The
problem is unlikely to persist so a policy solution may be counterproductive.
b) The Chinese government may want to engage in expansionary demand management
policies in the short term, so they may want to increase government spending and
reduce taxes in order to encourage domestic consumption to take up the output from
export-oriented industries. In the long term they may want to undertake supply-side
reforms to enhance competitiveness to improve their position in future downturns.
c)In the short term the government should enact contractionary demand management
policies (fiscal – cut spending, raise taxes; monetary – raise interest rates) to slow down
the rate of growth. In the long term, supply side policies should be enacted to permit
more and faster labour productivity increases.
5. Individual answers will vary.
IE 1
2. a) The PPC for Taiwan should be inside the PPC for Japan
b) Opportunity cost for: Japan Taiwan
Rice (1 tonne) 10 computers 13.33
Computers (ea.) 100 kg of rice (1/10 tonne) 75 kg
c) Japan has an absolute advantage in the production of both goods
d) Japan has a comparative advantage in the production of rice, while Taiwan has a
comparative advantage in the production of computers.
e) Japan Taiwan Total
Rice 50 30 80
Computers 500 400 900
f) I need to produce 80t of rice. I will devote 4/5 of Japan’s economy to rice
production to do this, which leaves 1/5 of its capacity for computers as well as
the entire Taiwanese economy. That will result in 200 computers being
produced in Japan and 800 computers being produced in Taiwan, giving a total
of 1000 computers. So, simply by specializing and trading, the two nations are
able to produce 100 extra computers.
g) Without trade, the Taiwanese need to give up 13.3 computers for every tonne
of rice. So, as long as they can give up fewer than 13.3 computers for a tonne or
rice through trade, they are better off.
Without trade, the Japanese only get 10 computers for each tonne of rice they
give up. So, as long as they can get more than ten computers for each tonne of
rice they trade, they are better off.
So, as long as the two countries can trade rice at a price of between 10 and 13.3
(a price of 11.6 would be quite fair) computers per tonne of rice, they would
both be happy.
IE2
2. a) geography – much of Canada is covered in boreal forest
b) history and geography – the US is a large country that needed to develop air
transport. European countries, not being so big, and having already developed dense
rail networks, did not need to develop air transport with the same urgency.
3. They were motivated to form a free trade area so as to develop close links to one
another so as to avoid a fourth war between the two nations (the first three being in
1870, 1914 and 1939). The belief was that with closer economic ties, war would be
made impossible.
4. Ghana might do so to encourage the development of a domestic chocolate industry
based upon domestically grown chocolate – to move up the value chain from primary to
secondary production.
5. Why would a country’s producers want to sell a product to another country’s consumers
for less than the costs of production? It doesn’t make much sense. However, it is a
commonly used justification for protectionism as it is one of the only allowable
justifications for protectionism under international trade law.
6. Benefit to workers – 1000 jobs * $20000 = 20 million dollars
Cost to consumers - 2 million households * $50 = $100 million dollars
The government nonetheless imposed the tariff as the workers were concentrated and
motivated to act to apply pressure on the government while the consumers were
dispersed and not likely to feel the impact of the tariffs very directly, and so were not as
well motivated to act to pressure the government to maintain free trade.
IE3
1. a) 500 units at $8 per unit
b) $4000 – yes it would be the same.
c) (or b2) – under free trade – 800 units at $5 per unit
d) (or c) – domestic share – 200, imports – 600
Domestic income ($1000) + Income of foreign producers ($3000) = consumer spending
($4000)
e)(or d) i) 600 units at $7 per unit
ii) 400 units. Their total revenue would be 400*$7 = $2800
iii) 200 units. Their total revenue would be 200 * $5 = $1000
iv) The gov’t would collect $2 * 200, so $400
v) Consumers spend 600 * $7 = $4200
2. Label the diagrams correctly. Tariffs do not simply transfer consumer surplus to
domestic firms and the government. A little bit of consumer surplus is simply lost, that
being the portion between the old world price and the new world price plus the tariff, to
the right of the new equilibrium point with the tariff.

IE4
2. a) $25000, 35000 cars
b) i) draw a horizontal line at $15000
ii) $15000, 55000 cars
iii) 15000 are made in Australia, 40000 are imports
c) i) tariff of $5000/vehicle
$20000, 45000 cars
Domestic share – 25000, imports – 20000
Treasury collects (20000 * $5000) $100 million
ii) subsidy of $5000
$15000, 55000 cars
Domestic share – 25000 cars, imports – 30000
Treasury spends $125 million (25000 * $5000)
iii) quota of 20000
$20000, 45000 cars
Domestic share – 25000, imports – 20000
Treasury neither spends nor receives anything
Generally, from an efficiency standpoint, the subsidy is seen as the best outcome, as
does not affect car prices and so leads to a more efficient allocation of resources.
Consumers continue to get lower priced cars and workers can (mostly) keep their jobs.
However, the subsidy will have to be paid with taxes...
Clearly the worst option is the quota, as it raises the price of cars for consumers and
delivers a bonus to the foreign car companies. As the price is now $20000, and as there
is no tariff being collected, the foreign producers can keep an extra $5000 per car. At
least with a tariff, that money is flowing to the government which may use it in ways to
benefit the country.
IE5
1. It is unlikely that they would ever entirely specialize as the opportunity costs of doing so
would become increasingly high. As they move towards either axis, the amount of one
good they would have to give up to get one more of the other good would become
prohibitive.
2. Once the trade grouping collapsed, it was hard for Cuba to find other buyers of sugar or
for Estonia to find other buyers of thermostats. It is never good to depend too much on
the production and trade of a particular good or service. It is always better to, if
possible, develop different industries to both give you domestic security and additional
export opportunities.
3. Good examples are sugar producers in the USA and Europe, or rice farmers in Japan.
Softwood lumber in the US is another good example, but there are many others.
4. Generally China and either the US or the EU have ongoing disputes...
IE6
2. a) visible import
b) invisible export
c) invisible export
d) invisible import
e) invisible import
f) visible export
g) capital outflow
h) invisible import
3. Balance of visible trade: +50 – 46 = +4 billion
Balance of invisible trade: +7 – 12 + 6 – 7 = -6 billion
Current account balance: +4 – 6 = -2 billion
Capital account balance: +10 – 9 = +1 billion
Overall balance of payments: -2 + 1 = -1
Under a floating exchange rate system, we should expect a slight depreciation in the
value of the Balancian currency.
IE7
2. a) Foreigners buy pounds on the foreign exchange markets to place in British banks. This
will shift the demand for pounds in the forex markets out to the right, resulting in an
appreciation of the pound.
b) British people will begin to buy more imports. To do so, they need to buy foreign
currencies, and to do this they need to sell pounds on the forex markets. This will shift
the supply of pounds in the foreign exchange markets out to the right, resulting in a
depreciation of the pound.
c) This will increase the demand for pounds on the foreign exchange market, and should
either blunt a depreciation or lead to an appreciation of the pound.
d) The British investors will have to buy UAE Dirhams in order to purchase the property
company. To purchase these Dh, they will need to sell pounds. Thus, the supply of
pounds on the forex markets will increase (shift to the right), resulting in a depreciation
of the pound.
IE8
2. Pound/Euro = 1/1.5
a) 1/1.5 = x/5; x = 3.33 pounds
b) 1/1.5 = x/120; x = 80 pounds
3. a) Price 25 30 35 40 45
Qd = 180 – 2P 130 120 110 100 90
Qd = 20 + 2P 70 80 90 100 110
b) Be sure the diagrams are fully labelled and that the scales are sensible
c) 180 – 2P = 20 + 2P
160 = 4P
40 = P
So, the exchange rate of the USD is 1 USD = 40 Indian Rupees
d) Remember to keep the USD point of view!
Americans are finding Indian goods fashionable and so are buying more of
them. To do so they need to buy rupees. To buy rupees they need to sell dollars.
So, on the diagram, the supply of USD on forex markets would shift out to the
right. As a consequence, the USD should, ceteris paribus, depreciate (ie a USD
would not be worth as many rupees as before).
IE9
2. a) To send their money abroad to US banks, the Argentines would have to first sell their
pesos in order to buy USD. So, from the point of view of the Argentine peso, the supply
of pesos in the forex market has increased or moved to the right.
b) If the Argentine government chose to simply use their foreign exchange reserves to
buy up the pesos that their citizens are dumping on the foreign exchange markets, the
diagram could look one of two ways. One, you could keep it as it is, and just label the
excess supply of pesos on the forex market as being bought up by the Argentine
government. Alternatively, you could show the Argentine intervention as an increase in
demand for pesos on the foreign exchange market , so pushing out the demand curve to
the right so that it crosses the new supply curve from part ‘a’ at the fixed rate.
If the Argentine government chose to raise interest rates, that could have one of two
effects. It would either stop Argentines investing their money abroad, thus decreasing
the demand of Argentines for dollars and therefore the supply of Argentine pesos on
the foreign exchange market being sold to buy dollars (so S would go back to its original
position to the left) or the higher rates would attract foreign money to Argentine banks,
in which case the demand for Argentine pesos on the foreign exchange market would
shift to the right.
IE10
2. As food prices can be quite volatile, and can change rapidly in the short term, the
appropriate policy response would likely be to simply intervene in the foreign exchange
market to buy up surplus domestic currency using the central bank’s foreign currency
reserves. As a longer term measure, perhaps supply side policies designed to foster food
security and reduce dependence on imports would also be in order.
3. An increase in competitiveness should compress the J-curve horizontally (ie deficits will
not last as long following a devaluation). An increase in competitiveness implies a
greater price elasticity of supply, ie a greater responsiveness to changes in price on the
part of producers. If producers are more responsive to prices, we should expect them to
adapt more quickly to changes in price. This should result in the J curve getting shorter.
The initial depth of the J curve may not be affected, but firms (and consumers) who are
more sensitive to price changes should change their behaviour more quickly if they are
more competitive, which would in turn eliminate current account deficits more quickly.
4. a) According to the M-L condition, a devaluation should make the BoP situation worse.
b) The export picture will be the same as the example in the text.
The import picture will be as follows:
The devaluation will lead to a 25% rise in the oil price in terms of CFA francs.
This will affect import volumes by, according to a PED of 0.4, 10%.
If import volumes fall by 10%, that means that oil imports are now 0.9 * 120 or 108
barrels of oil, each of which costs 25% more CFA francs than before (38 * 1.25 =) 47.5
CFA francs, giving an import bill of (108 * 47.5 =) 5130 CFA francs.
Bringing exports and imports together post-devaluation, we get:
4104 – 5130 = -1026. As we would expect from the Marshall-Lerner condition, this is a
deterioration from the pre-devaluation deficit of -760.
Extra Practice – Exchange Rates
1. Supply of yen on forex markets will increase as Japanese consumers spend more,
including more in imported goods, which requires them to sell yen in order to buy the
foreign currencies they need to buy foreign goods.
2. The demand for yen on forex markets will decrease as foreigners choose not to buy
increasingly uncompetitive Japanese goods, and therefore do not need to buy yen to
buy the good.
3. The demand for yen on forex markets will increase as foreigners need to buy yen in
order to deposit yen in Japanese banks
4. The demand for yen on forex markets will fall as foreigners do not want to invest in
Japan and so do also not need to buy yen with which to invest.
IE11
1. If the yuan had been allowed to appreciate, China would not have been able to export
so easily and the US would not have been able to buy Chinese goods as inexpensively,
and so likely would have imported fewer Chinese goods. The US also would not have
been able to sell its government bonds as easily, and so interest rates would have had to
have been higher, which would have discouraged the ‘housing bubble’ of 2001-2007,
the wreckage of which is behind the current global financial crisis.
China can likely adapt to a higher yuan more easily than the US. If the yuan appreciates,
while export markets will dry up, there is a vast pool of unmet needs and wants in China
which Chinese firms should be able to cater to to fuel continued economic growth.
However, the US has become quite used to inexpensive imports and low interest rates.
Higher inflation (as import prices rise) and higher interest rates will lead to a reduction
in the standard of living of many Americans.
Basically, China and the US need to rebalance their consumption and production – for
most of the past 10-15 years China has produced more than it has consumed while the
US has consumed more than it has produced.
The Chinese have, in response to American calls for them to revalue the yuan, quite
legitimately been calling for the US to address their gigantic structural trade deficit.
IE12
2. Any sensible answer will do – Pokemon, Canto-pop, Nando’s chicken...
3. People are afraid of losing their distinct cultural identity. The Basques do not want to be
simply Spaniards or Europeans or global citizens. They want to be Basques, yet also they
want to take part in the opportunities of a global market and tap into the ideas and
advances of a global civilization.
4. ....let students find out the current state of affairs...
IE13
2. Participating in a regional or bilateral negotiation is much easier as there are fewer
participants and so agreements can be ironed out much more rapidly. The WTO has
been likened to a car with one accelerator and 190 brake pedals.
3. Poorer developing countries do not have a lot to offer the global trading system. Thus,
they are likely to be left out of most bilateral or regional agreements. Already, trade is
dominated by the industrialized and rapidly industrializing nations of the world. Without
a framework that explicitly includes them, the world’s poorest nations will be left
behind.
4. a) AD would move to the left as export competitiveness (and hence export receipts) fell.
The policy response would have been to increase government spending to push AD back
out.
b) From the point of view of the Euro, if international investors sold their Euro
denominated bonds, and then sold the Euros they got from the sale of their bonds on
the foreign exchange markets so they could bring their money back home, the supply of
Euros on the forex markets would increase, and the exchange value of the Euro relative
to other currencies would fall.
IE 14
2. Export Price Index = 0.4{(12/10)*100} + 0.6{100}
108
Import Price Index = 0.3{100) + 0.7{(8/10)*100}
86
Therefore, the terms of trade for Morocco for 2010 were (108/86) * 100 = 125.6
3. a) Korea’s terms of trade would go down, BUT if people worldwide buy many more flat
screen TVs (as I would expect would happen – I would imagine that the demand for flat
screen TVs is price elastic) then Korea’s national income, balance of payments and
exchange rate could all conceivably rise.
b) Saudi Arabia’s terms of trade would go up, and, at least in the short term, as the
demand for oil is quite price inelastic, I would expect that Saudi Arabia’s national
income and balance of payments would rise. As the Saudi riyal is pegged to the USD,
there would not be any impact on the exchange rate.
c) For India, the story is reversed. India’s terms of trade would go down, and I would
expect their balance of payments to worsen as well. This could lead to a fall in the value
of the rupee. As well, an increase in oil prices may cause national income to fall, but I
doubt by much in an economy as large and diverse as India.
4. Developing countries should move away from exporting primary products (farm goods,
minerals, fish) and develop secondary and tertiary industries. Manufactured goods and
services have more stable prices than primary products and have historically
commanded higher prices.
ED1
2. 140/1.04=134.6 (Elbonia’s real GDP in 2010, adjusted by using a GDP deflator)
Therefore the real growth in GDP was {(134.6/130)*100 = 103.53} 3.53%.
3. a) Using rates today (October 26th, 2011) and using Yahoo Currency Converter:
100 000 CHF = 114 187 USD
60 000 Rs = 1 214 USD
It would appear that the average Swiss is more than 100 times wealthier than the
average Indian.
b) Using the Big Mac Index PPP exchange rates (from the July 28th, 2011 edition of “The
Economist” magazine:
100 000 CHF (divided by the implied PPP exchange rate of 1.6) = 62 500 USD
60 000 Rs (divided by the implied PPP exchange rate of 20.7) = 2 899 USD
Still a big difference, but now the average Swiss is only a little more than 20 times
wealthier than the average Indian.
The comparison has changed because the purchasing power of an Indian rupee in India
is higher than an equivalent (calculated using exchange rates from the forex market)
amount of dollars in America or francs in Switzerland.
4. Both show economic growth, as in both the PPC is moving out. However, only the PPC
on the right shows economic development, as growth in health care should improve the
standard of living of the people in the country, while more military equipment is unlikely
to have such an effect.
5. This is a great activity, and generates much discussion, but doesn’t lend itself out to an
answer...
6. Again, have students go to the website and discuss.
7. Ditto.
ED2
1. Add ‘foreign aid’, ‘trade’, foreign direct investment’ and ‘loans’ under the box “Initial
injection of capital” and the three leakages on page 169 coming out of the cycle at some point –
probably before step one (“Invested in infrastructure, education, health care, capital goods”).
2. A poverty cycle would look like:
A shortage of investment capital
Leading to
Poor quality health care, education, infrastructure and capital goods
Leading to
Poor productivity and consequent low output and income
Leading to
An inability to generate savings
Leading to...(go to top)
ED3
1. Box 2 – “Newly rich rural folk demanded more manufactured goods from cities (bottled
beer, crockery etc, the manufacture of which drew in workers from the countryside to
the cities” or some such
Box 3 – “ Larger, more populous cities in turn demanded more food and raw materials
from the countryside, which stimulated farmers to raise productivity further” or some
such
b) Some specific improvements might be deeper ploughs, flooding of pastures, the
invention of the seed drill, better animal husbandry....
2. Depends on the place...
ED4
2. Governments can run an efficient police force to maintain internal order and maintain a
military which is good at deterring external threats. Neither the police nor the military
should themselves become forces that threaten the lives and livelihoods of citizens.
By ensuring the security of people’s lives and property, the government gives people the
courage to improve their property and their businesses, safe in the knowledge that they
will be able to keep and enjoy their improved property and will be able to profit from
their improved businesses.
3. Good infrastructure, in particular roads and telephones, can help police and the military
move quickly to counter threats or respond to crimes.
4. Initially it was because they were seen as a better credit risk than men. However, the
improvement in the status of women that has resulted from their being granted micro-
credit loans has had many other benefits that have aided development – ie more family
planning, better education and health care for children, etc.
5. These pumps are easy to build and easy to maintain and easy to operate without
specialized tools or skills.
6. If you don’t have money or recognized assets, you can’t open a bank account. By being
excluded in this way, though (see last lesson’s bit about Hernando de Soto), the capital
they do have (but which is extra-legal and therefore not recognized officially) is ‘dead’
and can’t be used as collateral to take out a loan to start a business. In this way, millions
or even billions of people who could have the ideas and the drive to start businesses are
left in poverty, to their own detriment and to the detriment of the people around them.
7. In this generation, people earn a bit of money in petty trade. However, this allows them
to send their children to school a few more years, which makes them able to take up
better employment. Their children in turn perhaps finish high school or even college. In
later stages, people may be able to be employed in the formal economy, even if in the
beginning that is not the case.
ED5
2. During a global recession, you are probably better off if you had been pursuing a
strategy of import substitution, as in that case you will not face collapsing export
markets and so your own GDP and employment will be less affected than if you
depended on foreign buyers for your goods.
3. Large nations can more effectively pursue an import substitution strategy than small
nations as they have a more diverse resource base and variety of climate zones. The US
could make pretty much everything it needs in the US if necessary, whereas Switzerland
would have a hard time doing the same (ie it can’t grow its own oranges).
4. India was demanding that the developed countries (notably the EU and the USA) open
up their markets to agricultural and other primary products from the developing world
by eliminating subsidies and quotas designed to help European and American farmers.
One set of global trade rules would be beneficial for developing nations as they would
not have to negotiate a variety of different rules and they would be included in the
global system whereas they may be left out of most bilateral or regional agreements.
5. Often I think of local brand sodas and potato chips (ie “Thums Up” in India as opposed
to Coke). Often they appeal to patriotism and usually they are a cheaper than imported
brands.
6. If you wish to pursue economic development, you need to have access to machine
goods and technology. These are available from the advanced industrialized countries.
So, to develop, initially you need to trade in order to acquire these ‘building blocks’ of
development.
ED6
2. Most will choose to work for the multinational. This suggests that they have better
labour practices than national firms in many places around the world.
3. Often the multinationals are held to the environmental and labour standards of their
home countries. Even if they are not, though, they are often judged by the standards of
their home countries and are sensitive to public relations fiascos that may erupt due to
poor practices (ie Nike and its use of sweatshop labour, Apple and the Foxconn suicides
in China).
4. If a country can offer an MNC a skilled and trained labour force, they are less likely to
want to leave. Even if the MNC does leave, though, the skilled labour will continue to be
productive in other enterprises which have likely sprung up around the MNC to build
components or offer logistical support. Eventually the industrial cluster will have built
up its own momentum.
5. The MNC has succeeded in raising the average wage rate in that country, which should
have a positive impact on its level of economic development.
6. People often view MNCs involved in extraction as exploitative (blood suckers etc.).
These attitudes are often to do with the nature of the business (taking resources) and
the fact that they don’t usually employ great numbers of people, and the fact that most
senior management and technical positions are held by foreigners.
ED7
2. Students should look up the information and present it. Alternative examples can also
be used to show the contrast between top-down mega-project based tied aid and more
humble but less flashy forms of development aid.
3. If there are good jobs to be had in the aid sector, the best and brightest will be drawn to
them. However, it would be better if they were drawn to industry or agriculture or other
careers which focus on creating wealth as opposed to merely distributing it.
ED8
2. Often a structural adjustment plan calls for governments to cut subsidies and raise taxes
in order to correct a balance of payments deficit (ie “expenditure reducing”). These
policies can retard development as without subsidies (for food, fuel etc) many poor
families in developing countries may be unable to continue to send their children to
school or seek medical attention, etc. As well, the imposition of higher taxes and the
elimination of subsidies for businesses can lead to bankruptcies and unemployment,
again hurting the poor.
3. If you owe someone money, they have power over you. In the 1800s, the Khedive of
Egypt surrendered Egypt’s sovereignty to England and France when he could no longer
service the debts he had incurred while modernizing (ie developing) the country. Today
we are seeing the EU increasingly seeking to take control of Greek government policy in
exchange for bailout money needed to keep Greece from defaulting on its debts.
4. Stronger domestic institutions would help curb corruption amongst the officials of
developing nations. This would make it less likely that loans taken on by developing
nations were squandered. If loans taken were used effectively, the increases in output
and productivity that resulted would be enough to easily pay the interest on the loans.
ED9
2. Newly independent countries pursued policies of state-led development as that was
what all the experts were recommending. Remember, in Britain at this time, the
government of Clement Attlee was busy nationalizing the “Commanding Heights” of the
economy (rail, coal, steel, shipbuilding etc.).
3. The risk is that you end up strangling the spirit of free enterprise and end up with very
low rates of economic growth. India suffered mightily under the ‘licence raj’ where
government regulations stifled entrepreneurship and led to 40 years of economic
stagnation during which living standards in India remained very low.
4. Every game needs rules and referees. A developing economy needs a strong and
effective government to make sure that growth is supported by infrastructure, that
education and health care continue to improve to support further growth, and that the
inequalities that inevitably result from growth are ameliorated.
5. As technology improves, we might be able to achieve bigger gains in human welfare
with fewer resources and less pollution than in the past. For instance, if we can continue
to develop renewable energy technology (wind, solar) we may be able to have abundant
energy without pollution and without running down our finite stocks of fossil fuels.