Embed Size (px)
Citation preview
NCAT Report 03-03
WORKABILITY OF HOT MIX ASPHALT By Jagan M. Gudimettla L. Allen Cooley, Jr. E. Ray Brown
Mike Huner April 2003
277 Technology Parkway Auburn, AL 36830
WORKABILITY OF HOT MIX ASPHALT
By:
Jagan M. Gudimettla Graduate Student
National Center for Asphalt Technology Auburn University, Auburn, Alabama
L. Allen Cooley, Jr.
Manager, Southeastern Superpave Center National Center for Asphalt Technology Auburn University, Auburn, Alabama
E. Ray Brown
Director National Center for Asphalt Technology Auburn University, Auburn, Alabama
NCAT Report 03-03
April 2003

- i -
DISCLAIMER
The contents of this report reflect the views of the authors who are responsible for the facts and accuracy of the data presented herein. The contents do not necessarily reflect the official views or policies of the National Center for Asphalt Technology or Auburn University. This report does not constitute a standard, specification, or regulation.
- ii -
TABLE OF CONTENTS Introduction............................................................................................................................1 Objective ..........................................................................................................................2 Scope ..............................................................................................................................2 Background and Problem Statement......................................................................................2 Literature Review on Measuring Workability .................................................................2 Need for Measuring Workability of HMA ......................................................................4 Determining Mixing and Compaction Temperatures ......................................................6 Research Approach ................................................................................................................9 Task 1 – Development of the Prototype Workability Device..........................................11 Task 2 – Identify Limitations of Prototype Workability Device .....................................13 Task 3 – Effect of Equipment Variables on Workability ................................................13 Task 4 – Evaluation of Material Effects ..........................................................................14 Task 5 – Evaluate Method of Determining Compaction Temperature of HMA .............14 Task 6 – Prepare Final Report .........................................................................................16 Material Properties.................................................................................................................16 Aggregates .......................................................................................................................16 Gradations ........................................................................................................................16 Binder Properties .............................................................................................................16 Mix Designs .....................................................................................................................23 Test Results and Analysis ......................................................................................................23 Data Reduction.................................................................................................................23 Task 2 – Identify Limitations of Prototype Workability Device .....................................26 Effect of Equipment Variables on Workability ...............................................................29 Limestone Mixtures ...................................................................................................30 SMA Mixtures ...........................................................................................................30 Rounded Aggregates..................................................................................................30 Calibrating the Device ...............................................................................................32 Effect of Mix Constituents on Workability .....................................................................32 Effect of Aggregate Type...........................................................................................35 Effect of NMAS.........................................................................................................40 Effect of Binder Type ................................................................................................41 Effect of Temperature ................................................................................................42 Summary of Workability Testing ....................................................................................42 Concept of Using Mix Workability to Define Compaction Temperature of HMA Mixes .........................................................................................................43 Compacting Temperature Methodology ....................................................................45 Shear Study ................................................................................................................45 Conclusions and Recommendations ......................................................................................50 References ..............................................................................................................................52 Appendix A – Raw Workability Data from Task 4 ...............................................................54
- iii -
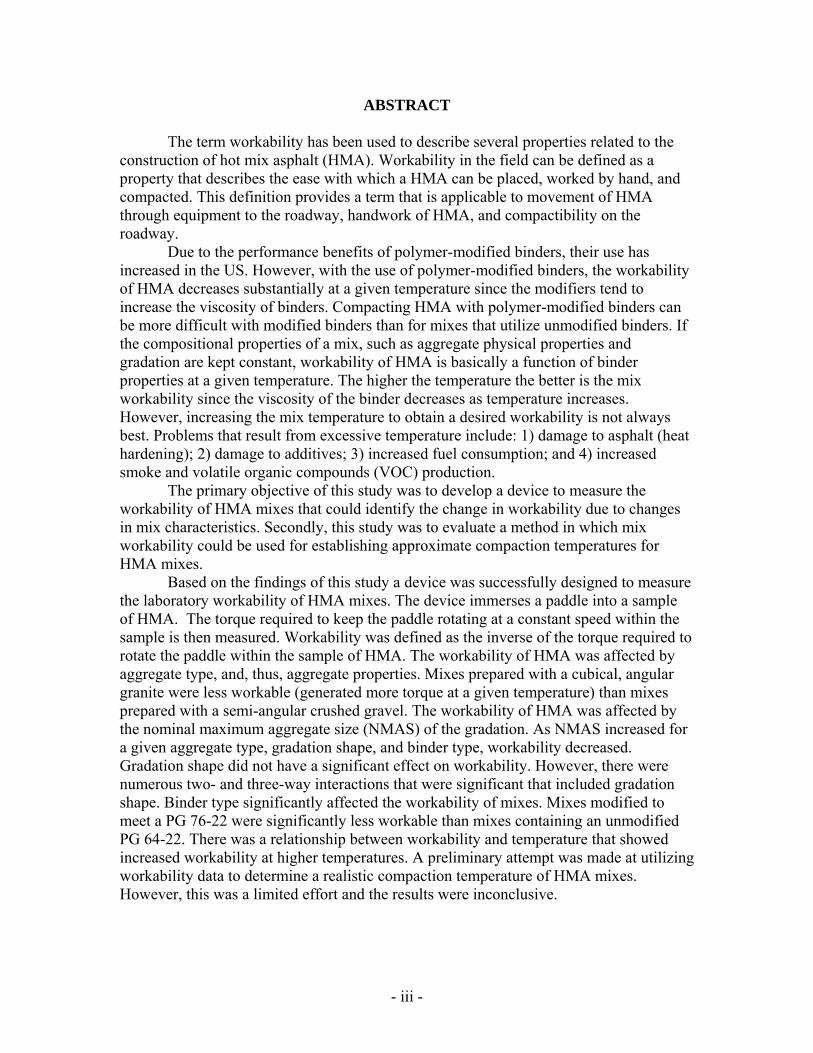
ABSTRACT
The term workability has been used to describe several properties related to the construction of hot mix asphalt (HMA). Workability in the field can be defined as a property that describes the ease with which a HMA can be placed, worked by hand, and compacted. This definition provides a term that is applicable to movement of HMA through equipment to the roadway, handwork of HMA, and compactibility on the roadway.
Due to the performance benefits of polymer-modified binders, their use has increased in the US. However, with the use of polymer-modified binders, the workability of HMA decreases substantially at a given temperature since the modifiers tend to increase the viscosity of binders. Compacting HMA with polymer-modified binders can be more difficult with modified binders than for mixes that utilize unmodified binders. If the compositional properties of a mix, such as aggregate physical properties and gradation are kept constant, workability of HMA is basically a function of binder properties at a given temperature. The higher the temperature the better is the mix workability since the viscosity of the binder decreases as temperature increases. However, increasing the mix temperature to obtain a desired workability is not always best. Problems that result from excessive temperature include: 1) damage to asphalt (heat hardening); 2) damage to additives; 3) increased fuel consumption; and 4) increased smoke and volatile organic compounds (VOC) production.
The primary objective of this study was to develop a device to measure the workability of HMA mixes that could identify the change in workability due to changes in mix characteristics. Secondly, this study was to evaluate a method in which mix workability could be used for establishing approximate compaction temperatures for HMA mixes.
Based on the findings of this study a device was successfully designed to measure the laboratory workability of HMA mixes. The device immerses a paddle into a sample of HMA. The torque required to keep the paddle rotating at a constant speed within the sample is then measured. Workability was defined as the inverse of the torque required to rotate the paddle within the sample of HMA. The workability of HMA was affected by aggregate type, and, thus, aggregate properties. Mixes prepared with a cubical, angular granite were less workable (generated more torque at a given temperature) than mixes prepared with a semi-angular crushed gravel. The workability of HMA was affected by the nominal maximum aggregate size (NMAS) of the gradation. As NMAS increased for a given aggregate type, gradation shape, and binder type, workability decreased. Gradation shape did not have a significant effect on workability. However, there were numerous two- and three-way interactions that were significant that included gradation shape. Binder type significantly affected the workability of mixes. Mixes modified to meet a PG 76-22 were significantly less workable than mixes containing an unmodified PG 64-22. There was a relationship between workability and temperature that showed increased workability at higher temperatures. A preliminary attempt was made at utilizing workability data to determine a realistic compaction temperature of HMA mixes. However, this was a limited effort and the results were inconclusive.
Gudimettla, Cooley Jr., & Brown
1
WORKABILITY OF HOT MIX ASPHALT
Jagan M. Gudimettla, L. Allen Cooley, Jr., and E. Ray Brown
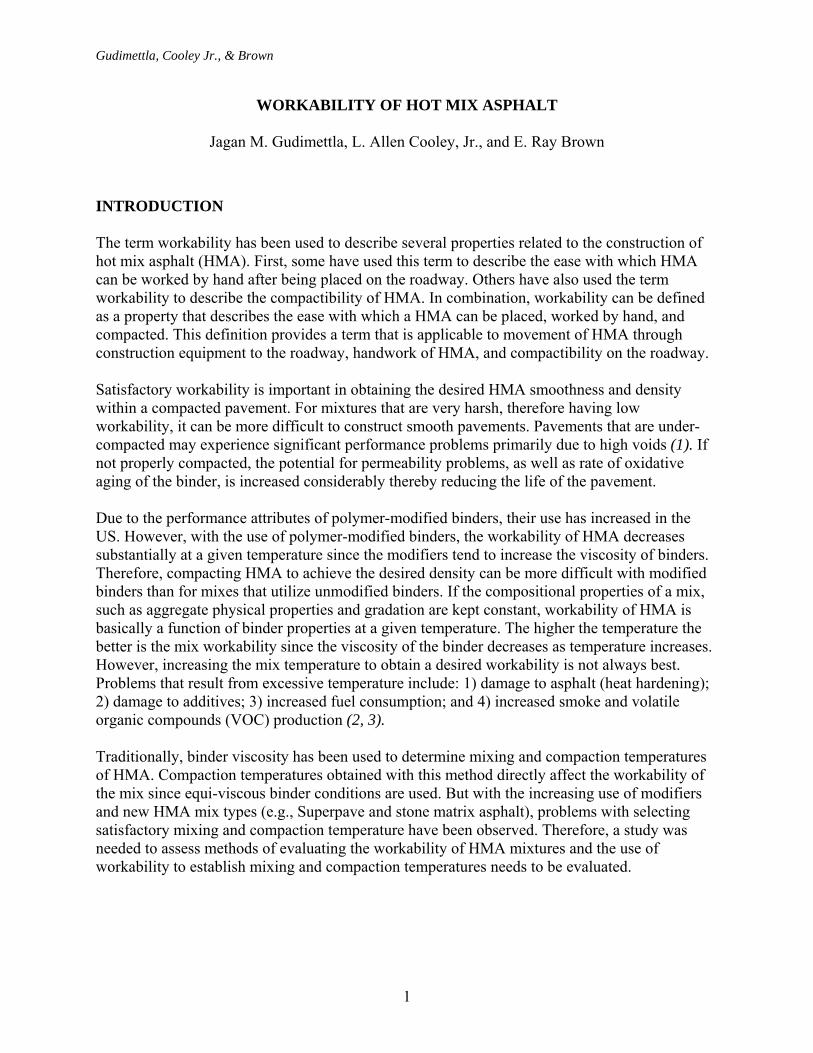
INTRODUCTION The term workability has been used to describe several properties related to the construction of hot mix asphalt (HMA). First, some have used this term to describe the ease with which HMA can be worked by hand after being placed on the roadway. Others have also used the term workability to describe the compactibility of HMA. In combination, workability can be defined as a property that describes the ease with which a HMA can be placed, worked by hand, and compacted. This definition provides a term that is applicable to movement of HMA through construction equipment to the roadway, handwork of HMA, and compactibility on the roadway. Satisfactory workability is important in obtaining the desired HMA smoothness and density within a compacted pavement. For mixtures that are very harsh, therefore having low workability, it can be more difficult to construct smooth pavements. Pavements that are under-compacted may experience significant performance problems primarily due to high voids (1). If not properly compacted, the potential for permeability problems, as well as rate of oxidative aging of the binder, is increased considerably thereby reducing the life of the pavement. Due to the performance attributes of polymer-modified binders, their use has increased in the US. However, with the use of polymer-modified binders, the workability of HMA decreases substantially at a given temperature since the modifiers tend to increase the viscosity of binders. Therefore, compacting HMA to achieve the desired density can be more difficult with modified binders than for mixes that utilize unmodified binders. If the compositional properties of a mix, such as aggregate physical properties and gradation are kept constant, workability of HMA is basically a function of binder properties at a given temperature. The higher the temperature the better is the mix workability since the viscosity of the binder decreases as temperature increases. However, increasing the mix temperature to obtain a desired workability is not always best. Problems that result from excessive temperature include: 1) damage to asphalt (heat hardening); 2) damage to additives; 3) increased fuel consumption; and 4) increased smoke and volatile organic compounds (VOC) production (2, 3). Traditionally, binder viscosity has been used to determine mixing and compaction temperatures of HMA. Compaction temperatures obtained with this method directly affect the workability of the mix since equi-viscous binder conditions are used. But with the increasing use of modifiers and new HMA mix types (e.g., Superpave and stone matrix asphalt), problems with selecting satisfactory mixing and compaction temperature have been observed. Therefore, a study was needed to assess methods of evaluating the workability of HMA mixtures and the use of workability to establish mixing and compaction temperatures needs to be evaluated.
Gudimettla, Cooley Jr., & Brown
2
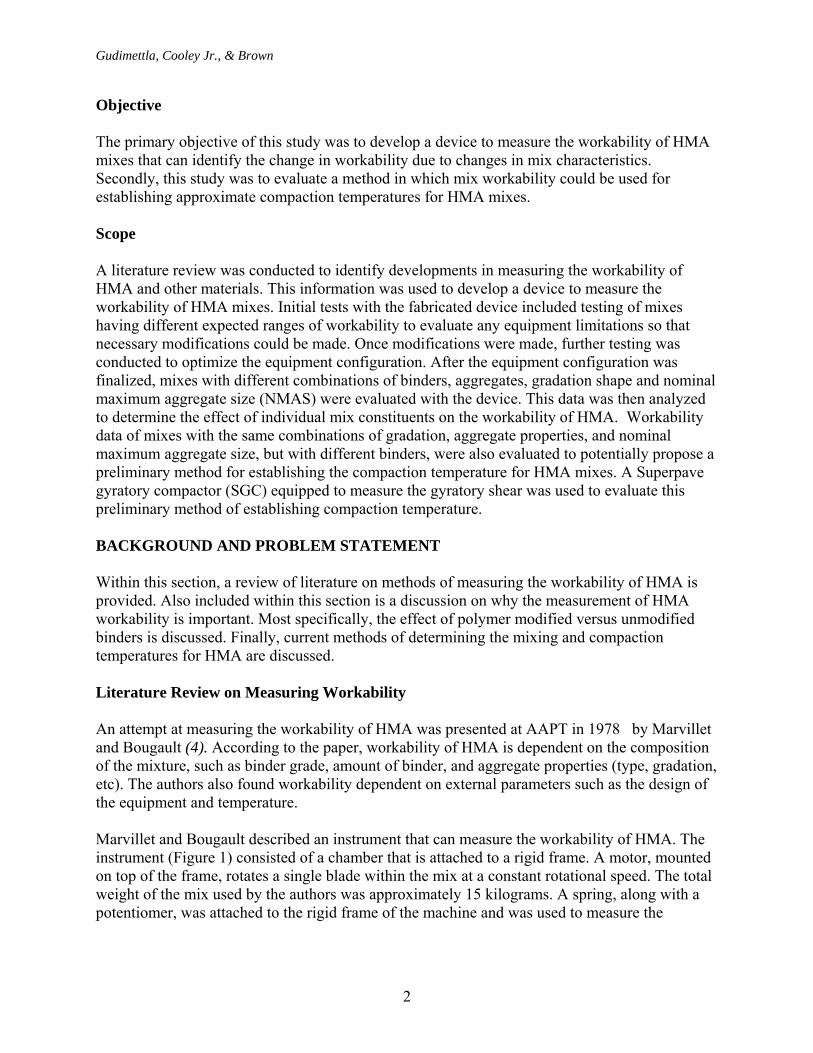
Objective The primary objective of this study was to develop a device to measure the workability of HMA mixes that can identify the change in workability due to changes in mix characteristics. Secondly, this study was to evaluate a method in which mix workability could be used for establishing approximate compaction temperatures for HMA mixes. Scope A literature review was conducted to identify developments in measuring the workability of HMA and other materials. This information was used to develop a device to measure the workability of HMA mixes. Initial tests with the fabricated device included testing of mixes having different expected ranges of workability to evaluate any equipment limitations so that necessary modifications could be made. Once modifications were made, further testing was conducted to optimize the equipment configuration. After the equipment configuration was finalized, mixes with different combinations of binders, aggregates, gradation shape and nominal maximum aggregate size (NMAS) were evaluated with the device. This data was then analyzed to determine the effect of individual mix constituents on the workability of HMA. Workability data of mixes with the same combinations of gradation, aggregate properties, and nominal maximum aggregate size, but with different binders, were also evaluated to potentially propose a preliminary method for establishing the compaction temperature for HMA mixes. A Superpave gyratory compactor (SGC) equipped to measure the gyratory shear was used to evaluate this preliminary method of establishing compaction temperature. BACKGROUND AND PROBLEM STATEMENT Within this section, a review of literature on methods of measuring the workability of HMA is provided. Also included within this section is a discussion on why the measurement of HMA workability is important. Most specifically, the effect of polymer modified versus unmodified binders is discussed. Finally, current methods of determining the mixing and compaction temperatures for HMA are discussed. Literature Review on Measuring Workability An attempt at measuring the workability of HMA was presented at AAPT in 1978 by Marvillet and Bougault (4). According to the paper, workability of HMA is dependent on the composition of the mixture, such as binder grade, amount of binder, and aggregate properties (type, gradation, etc). The authors also found workability dependent on external parameters such as the design of the equipment and temperature. Marvillet and Bougault described an instrument that can measure the workability of HMA. The instrument (Figure 1) consisted of a chamber that is attached to a rigid frame. A motor, mounted on top of the frame, rotates a single blade within the mix at a constant rotational speed. The total weight of the mix used by the authors was approximately 15 kilograms. A spring, along with a potentiomer, was attached to the rigid frame of the machine and was used to measure the
Gudimettla, Cooley Jr., & Brown
3
resistance of mix within the chamber against the rotation of the blade. The electrical signal was converted to numeric values and expressed in units of torque.
Figure 1. Diagram of the Workability Meter (4)
A CORECI regulator was used for measuring and displaying the temperature of the mix. The entire chamber where the mix was placed was heated to raise the temperature of the mix at the rate of 1°C/min. Test results were recorded as the temperature increased from 150°C to 200°C. The blade used to push the mix rotated at a constant rotational speed of 22 RPM. In Marvillet and Bougalt’s paper, the term “Workability” was defined as the inverse of the resistance moment (torque) produced by the mix against the rotation of the blade. Therefore, as torque increased, workability decreased. Results from Marvillet and Bougalt`s study (4) can be summarized as follows: • Workability of HMA mixtures increased as the viscosity of the binder grade decreased. • Change in binder content did not have any direct relationship with workability. • As the filler content in the mix increased, the workability decreased. • Mixes with angular particles were less workable than mixes having semi-angular or round
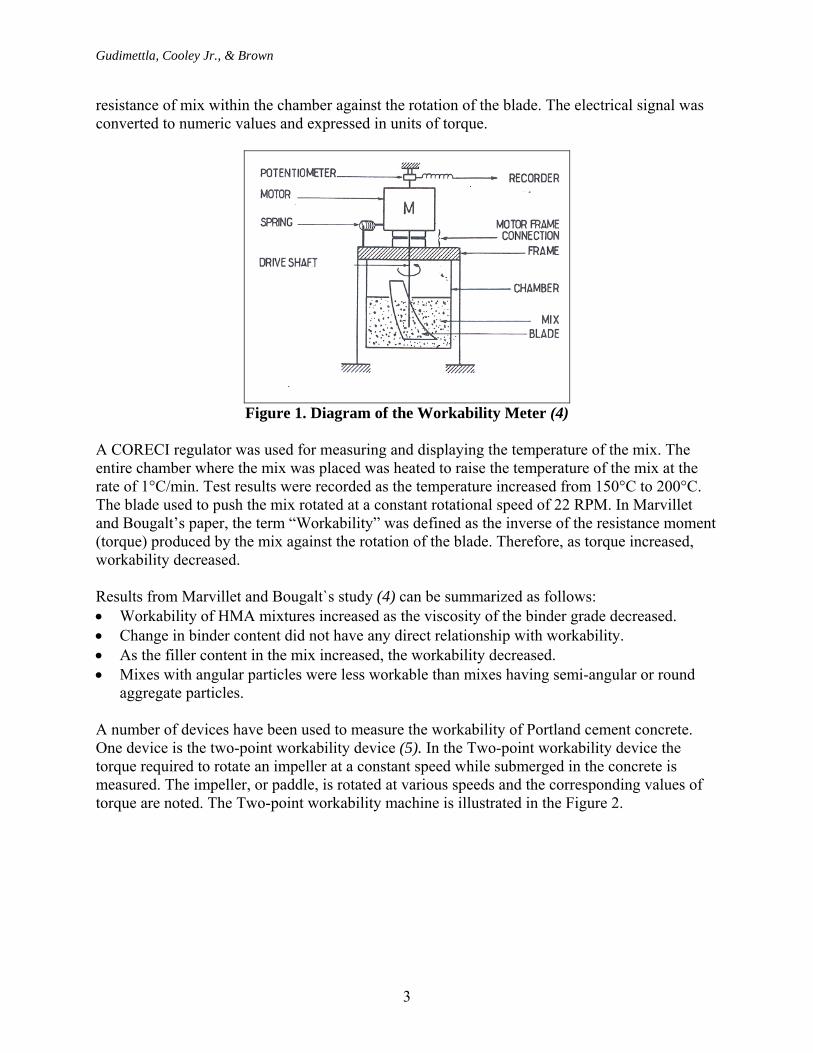
aggregate particles. A number of devices have been used to measure the workability of Portland cement concrete. One device is the two-point workability device (5). In the Two-point workability device the torque required to rotate an impeller at a constant speed while submerged in the concrete is measured. The impeller, or paddle, is rotated at various speeds and the corresponding values of torque are noted. The Two-point workability machine is illustrated in the Figure 2.
Gudimettla, Cooley Jr., & Brown
4
Figure 2. Two-Point Workability Machine (5)
Need for Measuring Workability of HMA Modification of asphalt binders has increased within the last few years. Modifiers have increased the resistance of HMA pavements to some major distresses such as deformation (rutting), cracking (thermal and fatigue) and disintegration (raveling and stripping). Several laboratory studies, as well as field experience, have shown the effectiveness of using modified binders in HMA. According to Terrel and Epps (3), some of the reasons for modification are: • Reduced
1. Structural thickness of pavement layers. 2. Life cycle cost of pavement. 3. Low temperature cracking of pavements.
Gudimettla, Cooley Jr., & Brown
5
• Improved 1. Fatigue resistance of asphalts. 2. Bonding between aggregate and asphalt and thus reduce stripping. 3. Resistance to aging or oxidation. 4. Crack sealing. 5. Overall performance of pavements. 6. Strength and stability of mixes.
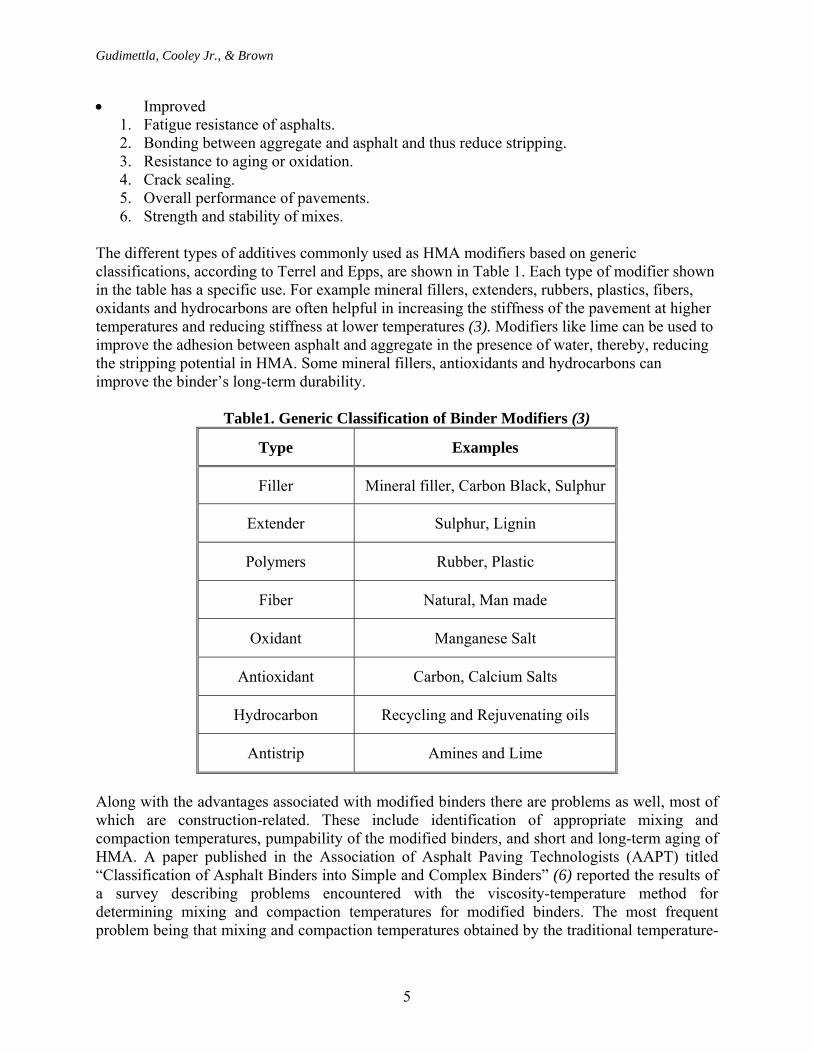
The different types of additives commonly used as HMA modifiers based on generic classifications, according to Terrel and Epps, are shown in Table 1. Each type of modifier shown in the table has a specific use. For example mineral fillers, extenders, rubbers, plastics, fibers, oxidants and hydrocarbons are often helpful in increasing the stiffness of the pavement at higher temperatures and reducing stiffness at lower temperatures (3). Modifiers like lime can be used to improve the adhesion between asphalt and aggregate in the presence of water, thereby, reducing the stripping potential in HMA. Some mineral fillers, antioxidants and hydrocarbons can improve the binder’s long-term durability.
Table1. Generic Classification of Binder Modifiers (3)
Type Examples
Filler Mineral filler, Carbon Black, Sulphur
Extender Sulphur, Lignin
Polymers Rubber, Plastic
Fiber Natural, Man made
Oxidant Manganese Salt
Antioxidant Carbon, Calcium Salts
Hydrocarbon Recycling and Rejuvenating oils
Antistrip Amines and Lime
Along with the advantages associated with modified binders there are problems as well, most of which are construction-related. These include identification of appropriate mixing and compaction temperatures, pumpability of the modified binders, and short and long-term aging of HMA. A paper published in the Association of Asphalt Paving Technologists (AAPT) titled “Classification of Asphalt Binders into Simple and Complex Binders” (6) reported the results of a survey describing problems encountered with the viscosity-temperature method for determining mixing and compaction temperatures for modified binders. The most frequent problem being that mixing and compaction temperatures obtained by the traditional temperature-
Gudimettla, Cooley Jr., & Brown
6
viscosity method for modified asphalt binders were much higher than those for unmodified binders. The problems associated with high compaction temperatures are many. As noted, asphalt binders are mixed with modifiers to achieve specific qualities. When modified binders are heated to high temperatures separation may take place between the modifier and base asphalt (7). If this happens the effectiveness of the modified binder will be reduced. There are several other problems as well, some of which include:
• Excessive heating may result in oxidation of the binder, and damage which may result in premature pavement cracking.
• Both visible (smoke) and non-visible emissions increase as the binder’s temperature is increased. This may pose health and environmental problems.
• Due to separation, modifiers may be extruded from the mix onto the pavement surface under breakdown rolling. This will cause excessive pick-up of material when using rubber tire rollers, which may cause unacceptable surface texture.
• Heating the HMA mix to a high temperature can also release the internal moisture of the aggregates. The moisture can then cause the binder to be semi-emulsified during the vibratory rolling process, which may lead to tenderness.
• Also excessive compaction temperatures can mean excessive mixing temperature. This may cause draindown of the binder in haul trucks for mixes like SMA (Stone Matrix Asphalt) and OGFC (open-graded friction courses) that use high asphalt contents.
During the 1990s, there were some major advances in the design of HMA mixes. Mix design systems for Superpave and Stone Matrix Asphalt (SMA) were adopted in the U.S. Both of these design systems have proven to reduce the amount of rutting on the nation's highways (8). However, with these new mix design systems came a wider range in gradations than used in the past. Historically, gradations associated with both the Marshall and Hveem mix design systems passed close to or above the maximum density line. Gradations within the Superpave system are allowed to pass either above or below the maximum density line. SMA mixes are very coarse and generally contain 70 to 80 percent coarse aggregate (retained on 4.75 mm sieve). It would be expected that mixes containing the same aggregate and binder type, but having different gradations will likely have different workabilities. Determining Mixing and Compaction Temperatures
The equi-viscous temperature range of asphalt has long been used in establishing the mixing and compaction temperatures for mix designs and field production. This procedure assumes that two mixes with the same aggregate gradation exhibit similar volumetric properties when mixed with soft or hard binder as long as they are mixed when the asphalt viscosity is similar. The Asphalt Institute presented the first recommendation for the laboratory mixing and compaction temperature ranges based on viscosity of asphalt in 1962 within its publication “Mix Design Methods for Asphalt Concrete and Other Hot-mix Types” (9). According to this method the temperature to which asphalt must be heated to produce viscosities of 85±10 seconds Saybolt-Furol and 140±15 seconds Saybolt-Furol should be taken as mixing and compaction temperature, respectively. Saybolt-Furol viscosity is the viscosity of a liquid measured based on
Gudimettla, Cooley Jr., & Brown
7
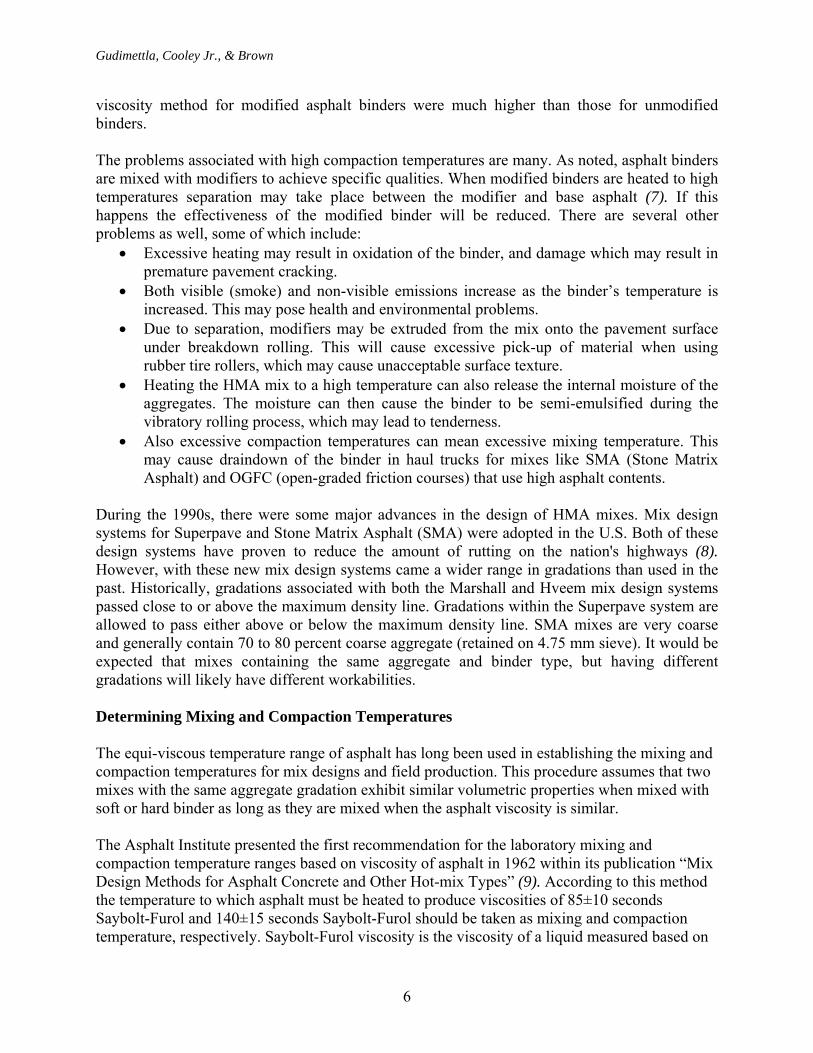
the time taken for a specific amount of liquid to flow through an orifice of specified dimensions. In 1974, the Asphalt Institute changed the viscosity measurements from units of Saybolt-Furol to units of centistokes (cSt) (10). In this procedure absolute viscosity, in poise, at 60°C and kinematic viscosity at 135°C in cSt are measured. The absolute viscosity at 60°C is then converted into kinematic viscosity (cSt) by dividing viscosity by the specific gravity of the binder at 60°C. The two kinematic viscosity points are then plotted on a viscosity and temperature graph with viscosity on a log-log centistokes scale and temperature in log Rankine. The two points are joined as a straight line. Once the line is established, viscosity ranges of 170±20 cSt were recommended for mixing temperature and 280±30 cSt for compaction temperature, while performing the Marshall mix design. With Superpave, the basic concept of equi-viscous mixing and compaction remained the same. However, the units of measuring viscosity changed from cSt to Pascal-seconds (Pa-s) and the viscosity values are now determined using a Rotational Viscometer at 135°C and 165°C. Once the two points on a semi-log graph are known the temperature-viscosity relationship is established. After this line is established on the graph the viscosity range of 0.17±0.02 Pa-s is used for mixing temperature and 0.28±.03 Pa-s is used for compaction temperatures during Superpave mix design (Figure 3). As can be seen from all the procedures described above, the basic principles remain that both mixing and compaction temperatures should be taken as the temperature at which the binder achieves a specific viscosity. Using this concept, polymer-modified binders require much higher temperatures to attain the same viscosity as unmodified binders. Temperatures obtained for mixing and compaction by the existing methods can be 177° C or higher. This is not reasonable based on experience. Recently, Yildrim et al. (11), put forth a new method for determination of mixing and compaction temperature. According to this paper the traditional method of using viscosity and temperature to determine the mixing and compaction temperature is suited for unmodified binder but not for modified binders. The authors indicate that unmodified binders are basically Newtonian in nature; that is their viscosity is not shear rate dependent. Modified binders at certain temperatures tend to exhibit a property called shear thinning, or pseudo-plasticity, where viscosity depends on shear rate. They suggested that shear rate inside the rotational viscometer does not simulate the shear rates inside a gyratory compactor during compaction. The paper concludes that the shear rate inside the Superpave gyratory compactor should be calculated first and then points on the temperature-viscosity graph should be obtained by measuring the viscosity at those shear rates. Once the two points are obtained the paper says that the viscosity-temperature graph can be used to determine the mixing and compaction temperatures.
De Sombre et al. (12) also provide an idea on the compaction temperature range for HMA. The author considered the asphalt mix to behave similar to a soil, and used Mohrs-Columb equation to explain the shear stress in the HMA mix:
Gudimettla, Cooley Jr., & Brown
8
Figure 3. Typical Viscosity –Temperature Plot to Determine Compaction
Temperature τ = c + σ tan ø
Where, τ = shear stress in the mix
c = cohesion of the mix σ = normal stress in mix ø =angle of internal friction
According to the De Sombre et al., shear strength for HMA is dependent on both the binder as well as the aggregate properties. The asphalt binder provides the cohesive component in HMA and the friction is provided by the aggregate particles. At a given temperature and normal stress, the cohesion of the mix depends on the amount of the binder, nature or degree of modification of the binder, and the filler used. As the amount of binder increases it becomes easier to work, (i.e., compact the mix). But as the degree of modification or filler content increases the cohesion of the mix increases which makes it more difficult to compact. With regard to aggregates, the more rounded the aggregates the lower the angle of internal friction, which reduces the shear strength of the mix. In this study six different lab samples and five different field mixes were compacted in a Finnish gyratory compactor. This compactor measured the shear stress and power required to compact each sample to 4% air voids. Samples were compacted at different temperatures. The
Gudimettla, Cooley Jr., & Brown
9
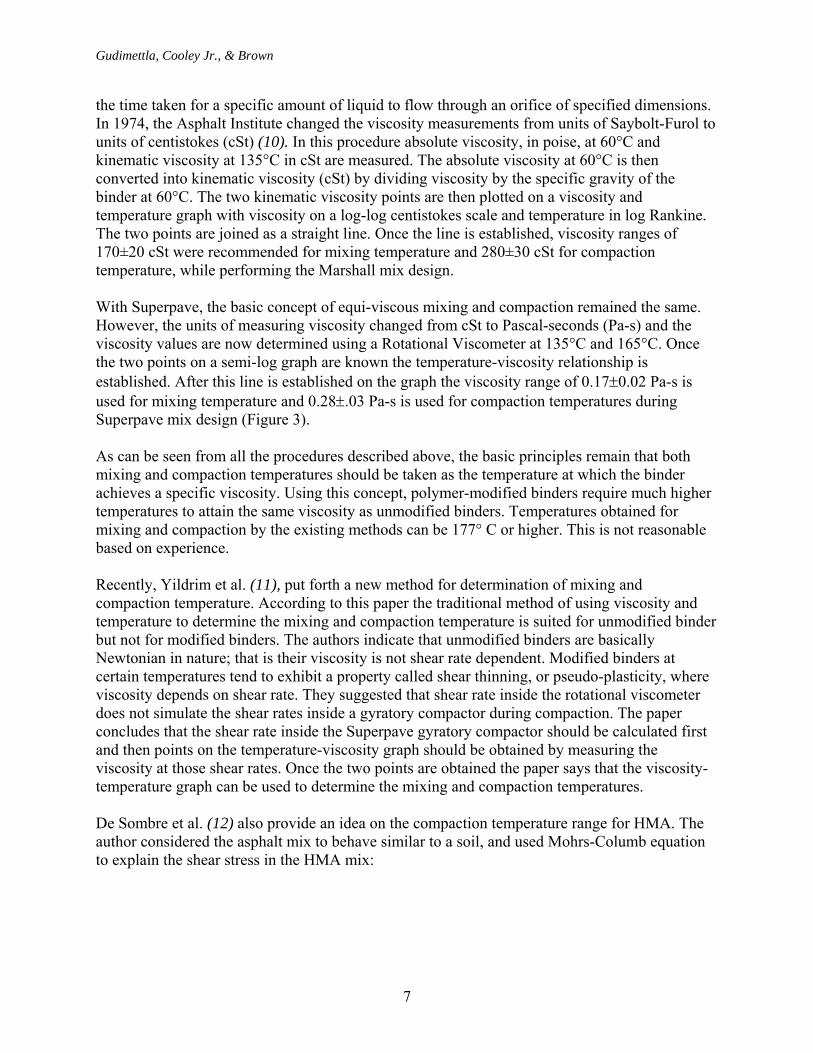
relationships between shear and temperature necessary to compact were examined. According to this study an examination of the field temperature data combined with laboratory compaction data showed that for most mixes there was a minimum shear stress, which indicated that an optimum compaction temperature range existed (Figure 4).
Figure 4. Relation Between Stress and Compaction Results for the Field Mixes
Tested (14)
The following are observations from development of this background information:
• Workability of HMA depends on binder type, gradation, aggregate type, additives and temperature of the mix.
• There has been a limited attempt at quantifying the workability of HMA in the literature; however there are some limitations with this prototype.
• Instruments have been designed to measure workability based on the principle of using the torque necessary to rotate a paddle within a mix.
• The traditional method of using viscosity-temperature relationship to determine mixing and compaction temperature was developed for neat binders. It does not take into account the mix properties like aggregate properties and/or gradation shape while determining the mixing and compacting temperatures.
• There is an increasing need to determine the mixing and compacting temperatures for HMA mixes especially when modified binders are used.
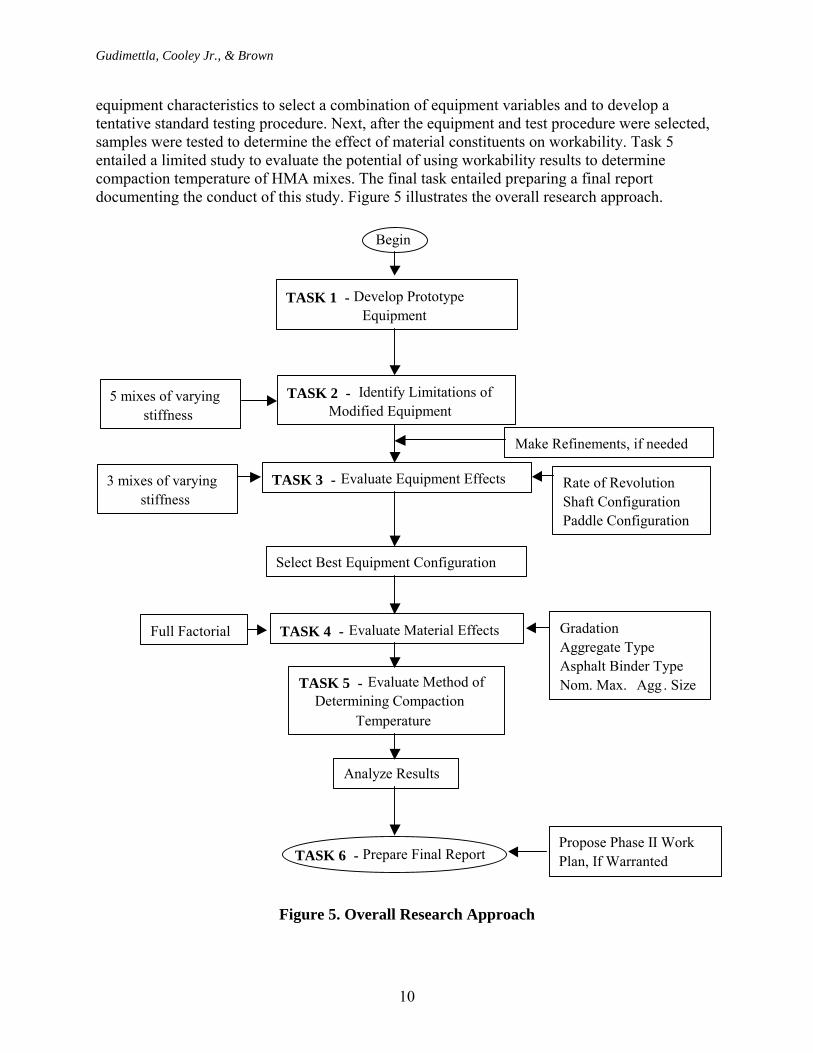
RESEARCH APPROACH To accomplish the project objectives, six separate tasks were conducted. The first task entailed development of the prototype workability device. Within the second task, mixes of expected different workability characteristics were tested with the prototype device to evaluate the limitations of the equipment and to identify needed refinements. Task 3 entailed varying several
Gudimettla, Cooley Jr., & Brown
10
equipment characteristics to select a combination of equipment variables and to develop a tentative standard testing procedure. Next, after the equipment and test procedure were selected, samples were tested to determine the effect of material constituents on workability. Task 5 entailed a limited study to evaluate the potential of using workability results to determine compaction temperature of HMA mixes. The final task entailed preparing a final report documenting the conduct of this study. Figure 5 illustrates the overall research approach.
Begin
TASK 1 - Develop PrototypeEquipment
TASK 2 - Identify Limitations ofModified Equipment
5 mixes of varying stiffness
TASK 3 - Evaluate Equipment Effects
Make Refinements, if needed
3 mixes of varying stiffness
Rate of RevolutionShaft ConfigurationPaddle Configuration
Select Best Equipment Configuration
TASK 4 - Evaluate Material Effects Gradation Aggregate TypeAsphalt Binder TypeNom. Max. Agg . SizeTASK 5 - Evaluate Method of
Determining CompactionTemperature
TASK 6 - Prepare Final ReportPropose Phase II Work Plan, If Warranted
Full Factorial
Analyze Results
Figure 5. Overall Research Approach
Gudimettla, Cooley Jr., & Brown
11
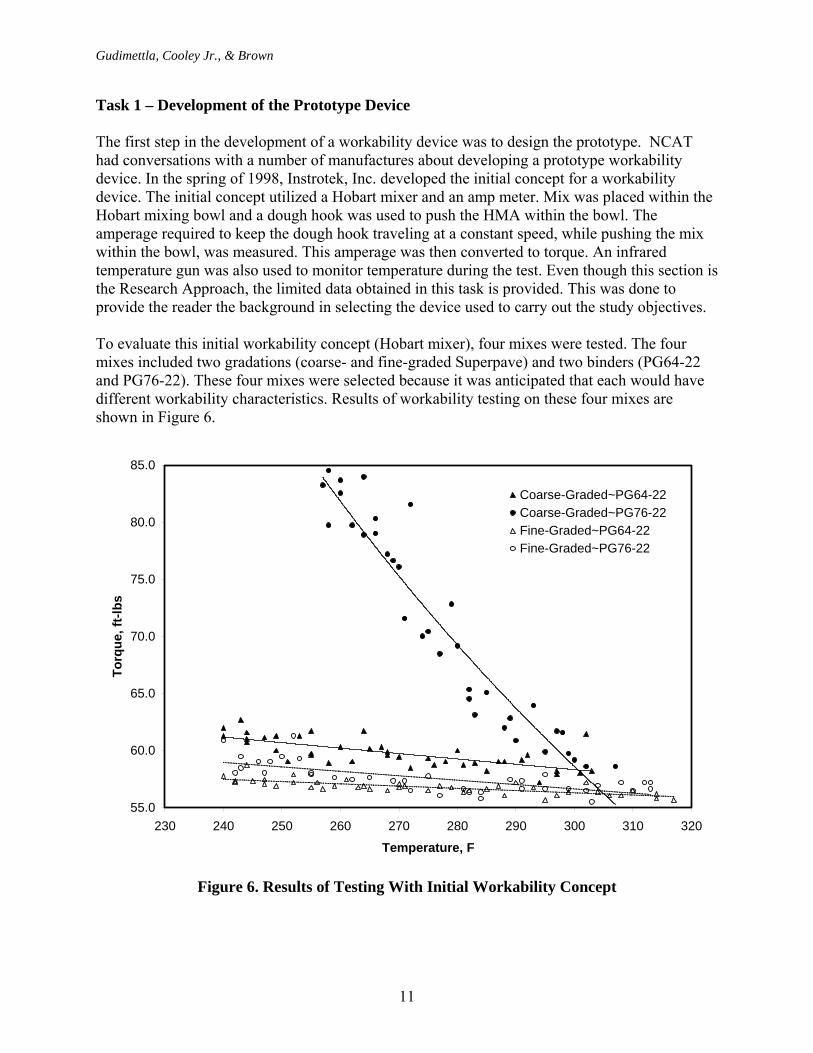
Task 1 – Development of the Prototype Device The first step in the development of a workability device was to design the prototype. NCAT had conversations with a number of manufactures about developing a prototype workability device. In the spring of 1998, Instrotek, Inc. developed the initial concept for a workability device. The initial concept utilized a Hobart mixer and an amp meter. Mix was placed within the Hobart mixing bowl and a dough hook was used to push the HMA within the bowl. The amperage required to keep the dough hook traveling at a constant speed, while pushing the mix within the bowl, was measured. This amperage was then converted to torque. An infrared temperature gun was also used to monitor temperature during the test. Even though this section is the Research Approach, the limited data obtained in this task is provided. This was done to provide the reader the background in selecting the device used to carry out the study objectives. To evaluate this initial workability concept (Hobart mixer), four mixes were tested. The four mixes included two gradations (coarse- and fine-graded Superpave) and two binders (PG64-22 and PG76-22). These four mixes were selected because it was anticipated that each would have different workability characteristics. Results of workability testing on these four mixes are shown in Figure 6.
55.0
60.0
65.0
70.0
75.0
80.0
85.0
230 240 250 260 270 280 290 300 310 320
Temperature, F
Torq
ue, f
t-lbs
Coarse-Graded~PG64-22Coarse-Graded~PG76-22Fine-Graded~PG64-22Fine-Graded~PG76-22
Figure 6. Results of Testing With Initial Workability Concept
Gudimettla, Cooley Jr., & Brown
12
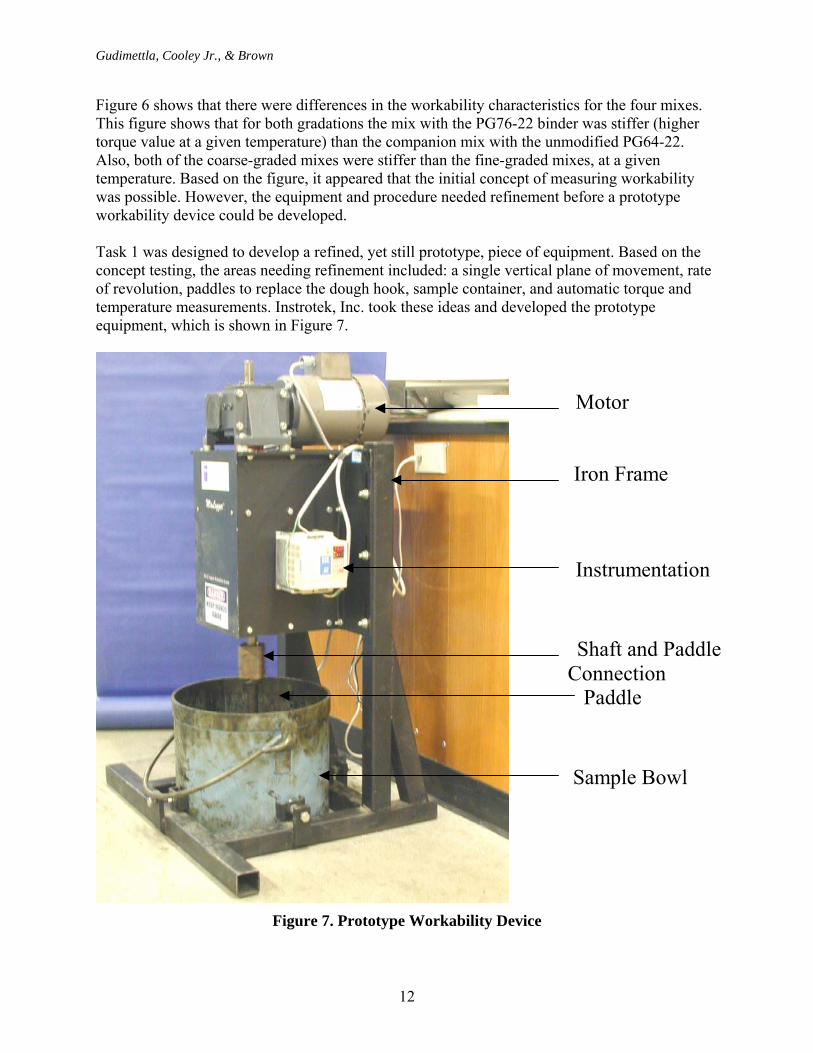
Figure 6 shows that there were differences in the workability characteristics for the four mixes. This figure shows that for both gradations the mix with the PG76-22 binder was stiffer (higher torque value at a given temperature) than the companion mix with the unmodified PG64-22. Also, both of the coarse-graded mixes were stiffer than the fine-graded mixes, at a given temperature. Based on the figure, it appeared that the initial concept of measuring workability was possible. However, the equipment and procedure needed refinement before a prototype workability device could be developed. Task 1 was designed to develop a refined, yet still prototype, piece of equipment. Based on the concept testing, the areas needing refinement included: a single vertical plane of movement, rate of revolution, paddles to replace the dough hook, sample container, and automatic torque and temperature measurements. Instrotek, Inc. took these ideas and developed the prototype equipment, which is shown in Figure 7.
Motor
Instrumentation
Shaft and Paddle Connection Paddle
Sample Bowl
Iron Frame
Figure 7. Prototype Workability Device
Gudimettla, Cooley Jr., & Brown
13
Task 2 – Identify limitations of Prototype Workability Device Initial work with the prototype device entailed identifying the operating limits of the equipment. This was accomplished by testing five mixtures of expected varying degrees of workability. Mixes tested included: 1. Stone matrix asphalt utilizing high filler content, fibers, polymer modified PG76-22, and
a very angular aggregate (granite). 2. A mixture with a gradation passing near the lower Superpave gradation control points
using the PG76-22 and granite aggregate. 3. Same mixture as Item 2 except with a PG64-22 and less angular aggregate (limestone). 4. A mixture with a gradation passing near the upper Superpave control points using a PG
64-22 and crushed gravel. 5. A mixture similar to Item 4 except using rounded gravel.
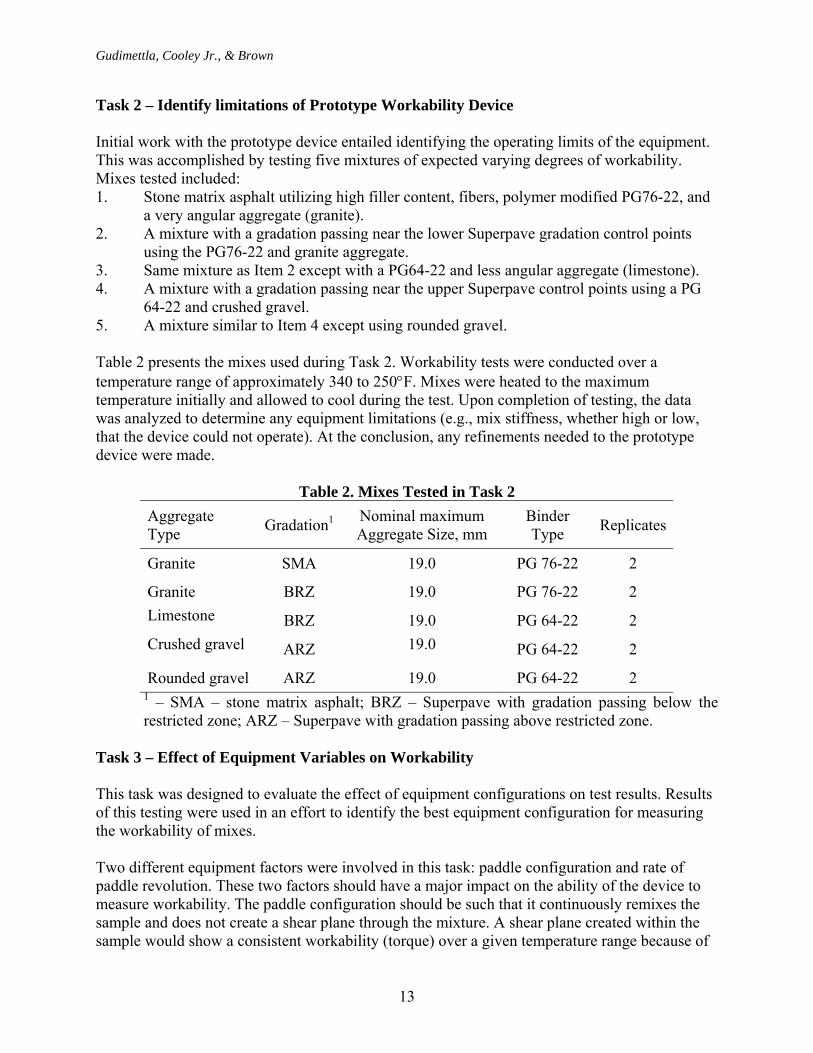
Table 2 presents the mixes used during Task 2. Workability tests were conducted over a temperature range of approximately 340 to 250°F. Mixes were heated to the maximum temperature initially and allowed to cool during the test. Upon completion of testing, the data was analyzed to determine any equipment limitations (e.g., mix stiffness, whether high or low, that the device could not operate). At the conclusion, any refinements needed to the prototype device were made.
Table 2. Mixes Tested in Task 2 Aggregate Type Gradation1 Nominal maximum
Aggregate Size, mm Binder Type Replicates
Granite SMA 19.0 PG 76-22 2
Granite BRZ 19.0 PG 76-22 2 Limestone BRZ 19.0 PG 64-22 2 Crushed gravel ARZ 19.0 PG 64-22 2
Rounded gravel ARZ 19.0 PG 64-22 2 1 – SMA – stone matrix asphalt; BRZ – Superpave with gradation passing below the
restricted zone; ARZ – Superpave with gradation passing above restricted zone. Task 3 – Effect of Equipment Variables on Workability This task was designed to evaluate the effect of equipment configurations on test results. Results of this testing were used in an effort to identify the best equipment configuration for measuring the workability of mixes. Two different equipment factors were involved in this task: paddle configuration and rate of paddle revolution. These two factors should have a major impact on the ability of the device to measure workability. The paddle configuration should be such that it continuously remixes the sample and does not create a shear plane through the mixture. A shear plane created within the sample would show a consistent workability (torque) over a given temperature range because of
Gudimettla, Cooley Jr., & Brown
14
a lack of resistance. If the rate of revolution for the paddle is too fast, a shear plane can also be created. Testing for this task included three of the mixes used in Task 2. The three mixes included the stiffest, least stiff, and one between the extremes based on the Task 2 testing.
A full factorial experiment was conducted using two levels of paddle configuration and two levels of rate of revolution. Instrotec, Inc. manufactured the paddles after discussions with NCAT. The two rates of revolution included within the experiment were 5 and 15 rpm. At the conclusion of testing, the data was analyzed to determine which set of equipment variables would provide the most suitable workability values over the temperature interval evaluated.
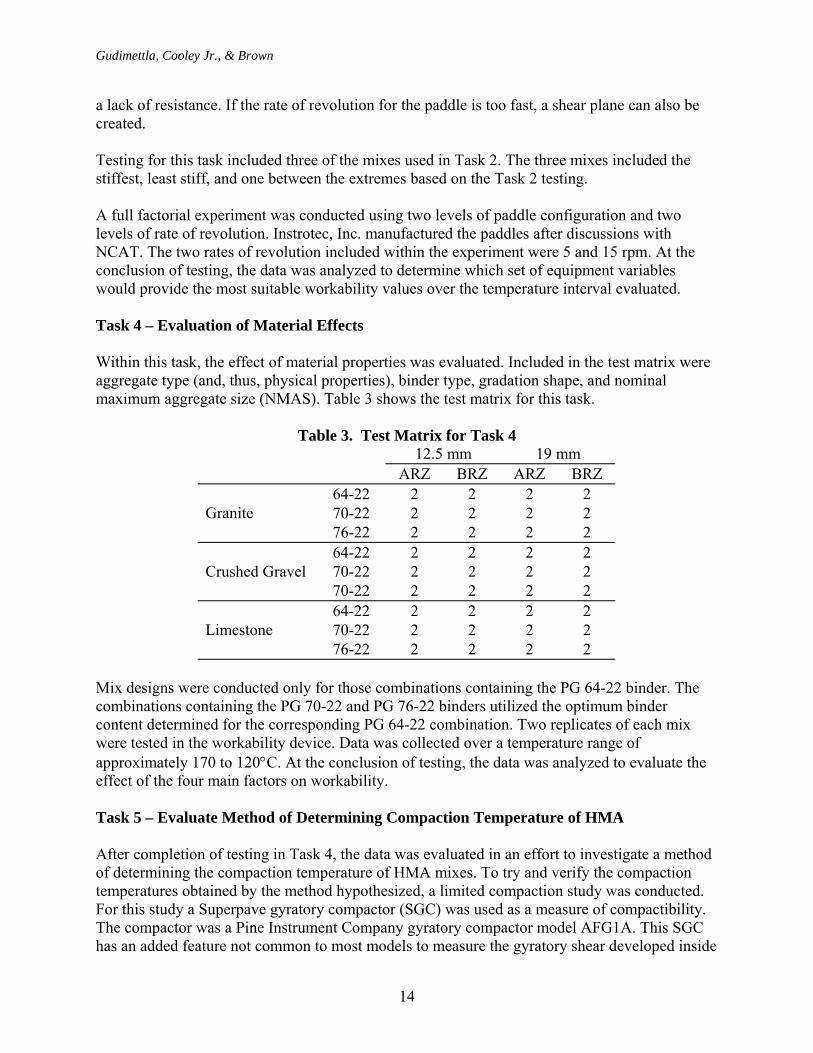
Task 4 – Evaluation of Material Effects Within this task, the effect of material properties was evaluated. Included in the test matrix were aggregate type (and, thus, physical properties), binder type, gradation shape, and nominal maximum aggregate size (NMAS). Table 3 shows the test matrix for this task.
Table 3. Test Matrix for Task 4 12.5 mm 19 mm
ARZ BRZ ARZ BRZ 64-22 2 2 2 2 70-22 2 2 2 2 Granite 76-22 2 2 2 2 64-22 2 2 2 2 70-22 2 2 2 2 Crushed Gravel 70-22 2 2 2 2 64-22 2 2 2 2 70-22 2 2 2 2 Limestone 76-22 2 2 2 2
Mix designs were conducted only for those combinations containing the PG 64-22 binder. The combinations containing the PG 70-22 and PG 76-22 binders utilized the optimum binder content determined for the corresponding PG 64-22 combination. Two replicates of each mix were tested in the workability device. Data was collected over a temperature range of approximately 170 to 120°C. At the conclusion of testing, the data was analyzed to evaluate the effect of the four main factors on workability. Task 5 – Evaluate Method of Determining Compaction Temperature of HMA After completion of testing in Task 4, the data was evaluated in an effort to investigate a method of determining the compaction temperature of HMA mixes. To try and verify the compaction temperatures obtained by the method hypothesized, a limited compaction study was conducted. For this study a Superpave gyratory compactor (SGC) was used as a measure of compactibility. The compactor was a Pine Instrument Company gyratory compactor model AFG1A. This SGC has an added feature not common to most models to measure the gyratory shear developed inside
Gudimettla, Cooley Jr., & Brown
15
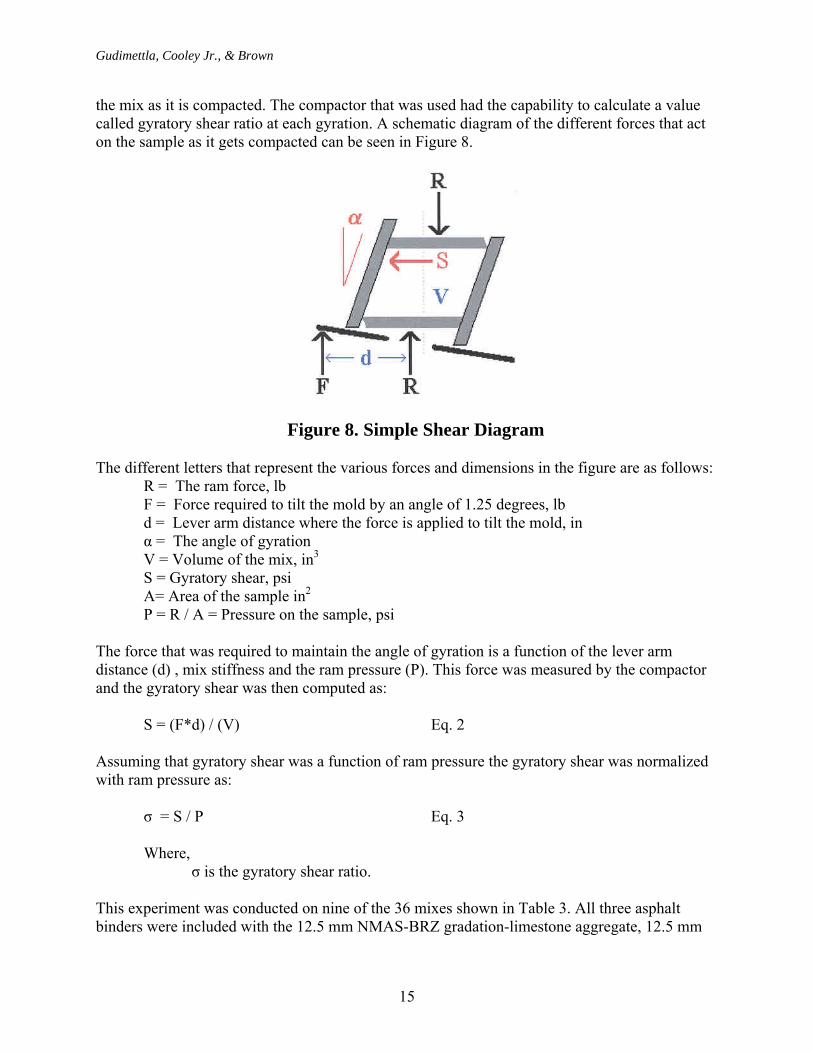
the mix as it is compacted. The compactor that was used had the capability to calculate a value called gyratory shear ratio at each gyration. A schematic diagram of the different forces that act on the sample as it gets compacted can be seen in Figure 8.
Figure 8. Simple Shear Diagram
The different letters that represent the various forces and dimensions in the figure are as follows: R = The ram force, lb F = Force required to tilt the mold by an angle of 1.25 degrees, lb d = Lever arm distance where the force is applied to tilt the mold, in α = The angle of gyration V = Volume of the mix, in3 S = Gyratory shear, psi A= Area of the sample in2 P = R / A = Pressure on the sample, psi
The force that was required to maintain the angle of gyration is a function of the lever arm distance (d) , mix stiffness and the ram pressure (P). This force was measured by the compactor and the gyratory shear was then computed as:
S = (F*d) / (V) Eq. 2
Assuming that gyratory shear was a function of ram pressure the gyratory shear was normalized with ram pressure as:
σ = S / P Eq. 3 Where, σ is the gyratory shear ratio.
This experiment was conducted on nine of the 36 mixes shown in Table 3. All three asphalt binders were included with the 12.5 mm NMAS-BRZ gradation-limestone aggregate, 12.5 mm
Gudimettla, Cooley Jr., & Brown
16
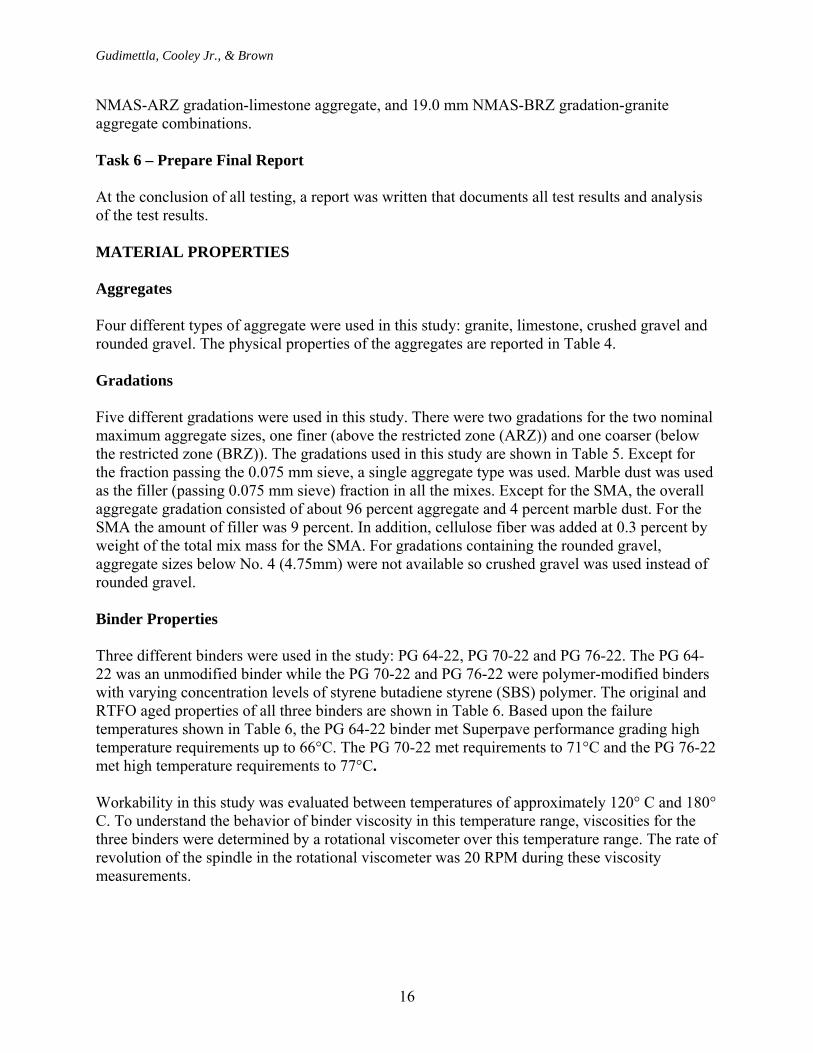
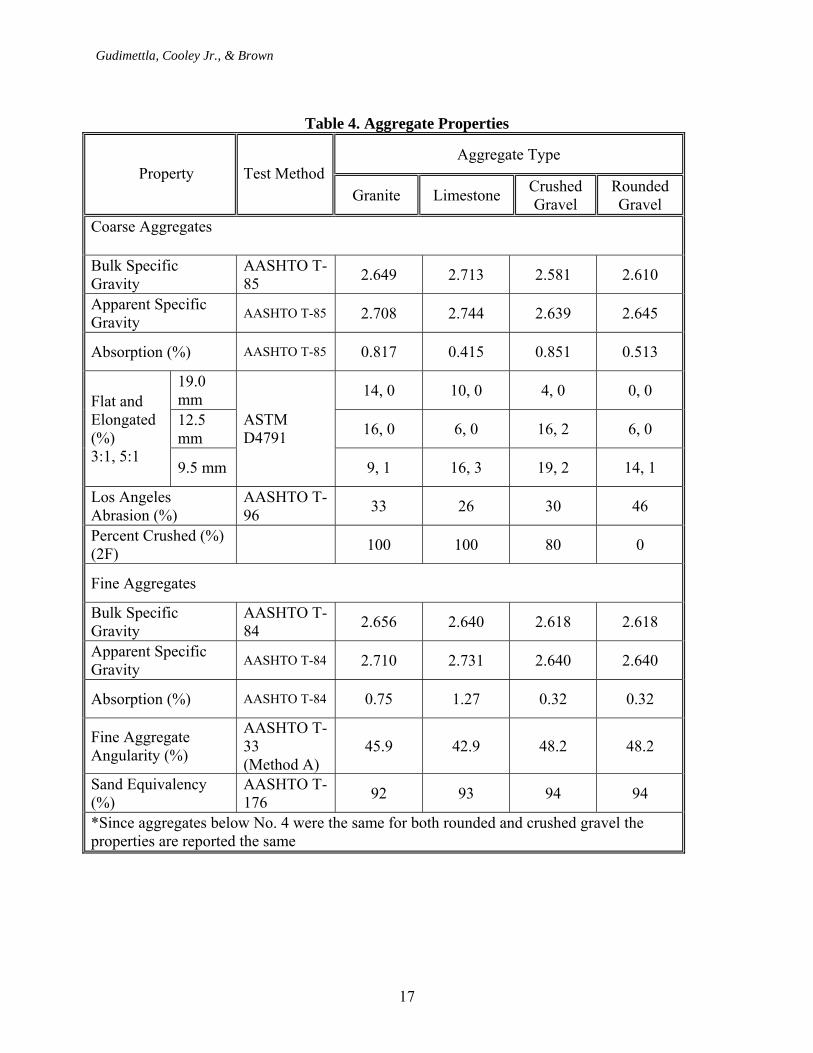
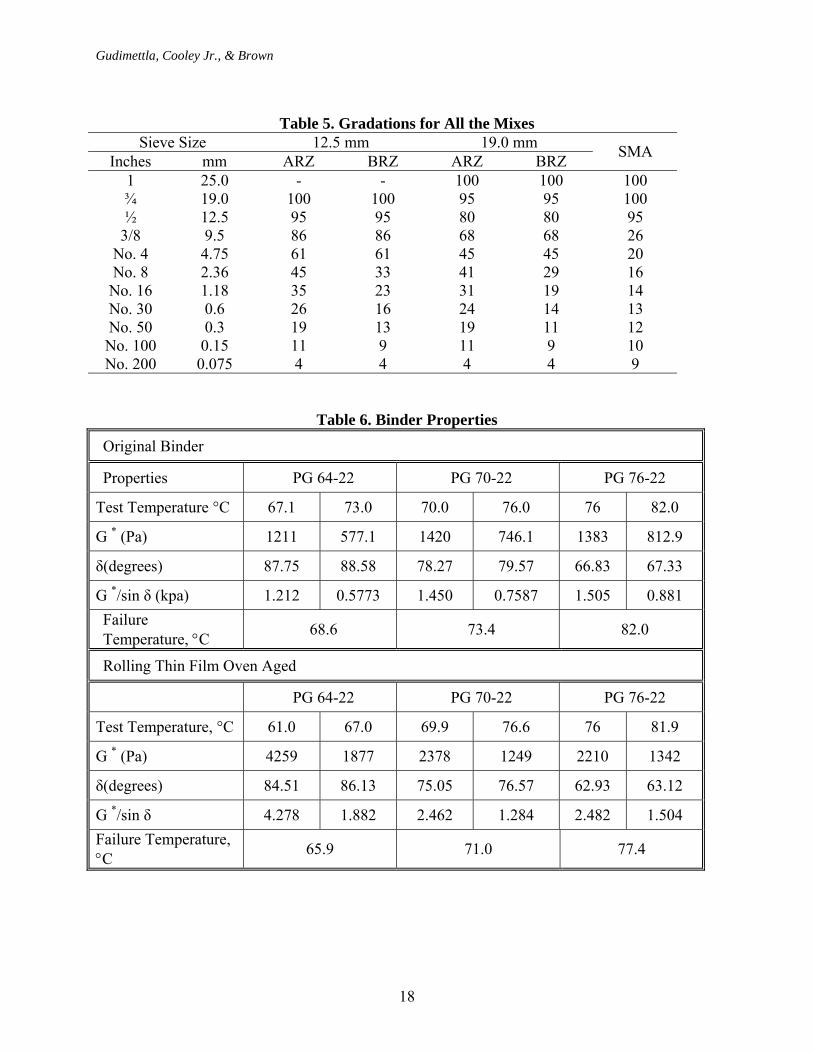
NMAS-ARZ gradation-limestone aggregate, and 19.0 mm NMAS-BRZ gradation-granite aggregate combinations. Task 6 – Prepare Final Report At the conclusion of all testing, a report was written that documents all test results and analysis of the test results. MATERIAL PROPERTIES Aggregates Four different types of aggregate were used in this study: granite, limestone, crushed gravel and rounded gravel. The physical properties of the aggregates are reported in Table 4. Gradations Five different gradations were used in this study. There were two gradations for the two nominal maximum aggregate sizes, one finer (above the restricted zone (ARZ)) and one coarser (below the restricted zone (BRZ)). The gradations used in this study are shown in Table 5. Except for the fraction passing the 0.075 mm sieve, a single aggregate type was used. Marble dust was used as the filler (passing 0.075 mm sieve) fraction in all the mixes. Except for the SMA, the overall aggregate gradation consisted of about 96 percent aggregate and 4 percent marble dust. For the SMA the amount of filler was 9 percent. In addition, cellulose fiber was added at 0.3 percent by weight of the total mix mass for the SMA. For gradations containing the rounded gravel, aggregate sizes below No. 4 (4.75mm) were not available so crushed gravel was used instead of rounded gravel. Binder Properties Three different binders were used in the study: PG 64-22, PG 70-22 and PG 76-22. The PG 64-22 was an unmodified binder while the PG 70-22 and PG 76-22 were polymer-modified binders with varying concentration levels of styrene butadiene styrene (SBS) polymer. The original and RTFO aged properties of all three binders are shown in Table 6. Based upon the failure temperatures shown in Table 6, the PG 64-22 binder met Superpave performance grading high temperature requirements up to 66°C. The PG 70-22 met requirements to 71°C and the PG 76-22 met high temperature requirements to 77°C. Workability in this study was evaluated between temperatures of approximately 120° C and 180° C. To understand the behavior of binder viscosity in this temperature range, viscosities for the three binders were determined by a rotational viscometer over this temperature range. The rate of revolution of the spindle in the rotational viscometer was 20 RPM during these viscosity measurements.
Gudimettla, Cooley Jr., & Brown
17
Table 4. Aggregate Properties
Aggregate Type Property Test Method
Granite Limestone Crushed Gravel
Rounded Gravel
Coarse Aggregates
Bulk Specific Gravity
AASHTO T-85 2.649 2.713 2.581 2.610
Apparent Specific Gravity AASHTO T-85 2.708 2.744 2.639 2.645
Absorption (%) AASHTO T-85 0.817 0.415 0.851 0.513
19.0 mm 14, 0 10, 0 4, 0 0, 0
12.5 mm 16, 0 6, 0 16, 2 6, 0
Flat and Elongated (%) 3:1, 5:1
9.5 mm
ASTM D4791
9, 1 16, 3 19, 2 14, 1
Los Angeles Abrasion (%)
AASHTO T-96 33 26 30 46
Percent Crushed (%) (2F) 100 100 80 0
Fine Aggregates
Bulk Specific Gravity
AASHTO T-84 2.656 2.640 2.618 2.618
Apparent Specific Gravity AASHTO T-84 2.710 2.731 2.640 2.640
Absorption (%) AASHTO T-84 0.75 1.27 0.32 0.32
Fine Aggregate Angularity (%)
AASHTO T-33 (Method A)
45.9 42.9 48.2 48.2
Sand Equivalency (%)
AASHTO T-176 92 93 94 94
*Since aggregates below No. 4 were the same for both rounded and crushed gravel the properties are reported the same
Gudimettla, Cooley Jr., & Brown
18
Table 5. Gradations for All the Mixes
Sieve Size 12.5 mm 19.0 mm Inches mm ARZ BRZ ARZ BRZ SMA
1 25.0 - - 100 100 100 ¾ 19.0 100 100 95 95 100 ½ 12.5 95 95 80 80 95
3/8 9.5 86 86 68 68 26 No. 4 4.75 61 61 45 45 20 No. 8 2.36 45 33 41 29 16
No. 16 1.18 35 23 31 19 14 No. 30 0.6 26 16 24 14 13 No. 50 0.3 19 13 19 11 12
No. 100 0.15 11 9 11 9 10 No. 200 0.075 4 4 4 4 9
Table 6. Binder Properties
Original Binder
Properties PG 64-22 PG 70-22 PG 76-22
Test Temperature °C 67.1 73.0 70.0 76.0 76 82.0
G * (Pa) 1211 577.1 1420 746.1 1383 812.9
δ(degrees) 87.75 88.58 78.27 79.57 66.83 67.33
G */sin δ (kpa) 1.212 0.5773 1.450 0.7587 1.505 0.881 Failure Temperature, °C 68.6 73.4 82.0
Rolling Thin Film Oven Aged
PG 64-22 PG 70-22 PG 76-22
Test Temperature, °C 61.0 67.0 69.9 76.6 76 81.9
G * (Pa) 4259 1877 2378 1249 2210 1342
δ(degrees) 84.51 86.13 75.05 76.57 62.93 63.12
G */sin δ 4.278 1.882 2.462 1.284 2.482 1.504 Failure Temperature, °C 65.9 71.0 77.4
Gudimettla, Cooley Jr., & Brown
19
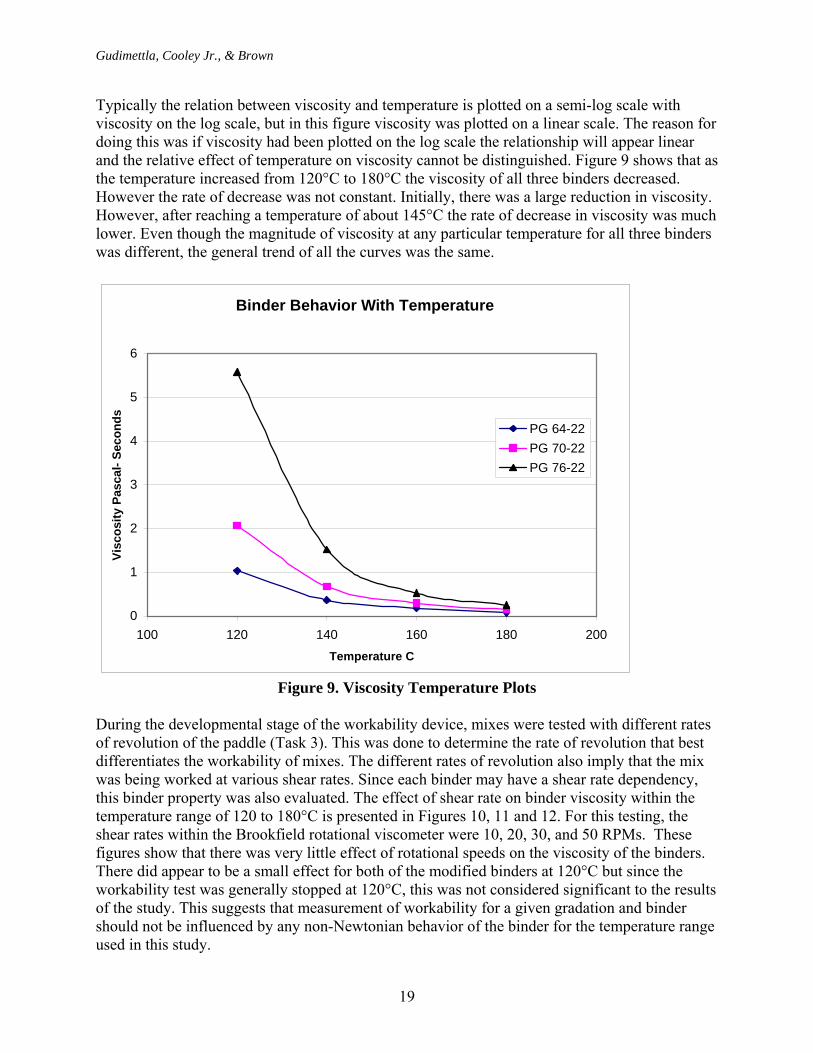
Typically the relation between viscosity and temperature is plotted on a semi-log scale with viscosity on the log scale, but in this figure viscosity was plotted on a linear scale. The reason for doing this was if viscosity had been plotted on the log scale the relationship will appear linear and the relative effect of temperature on viscosity cannot be distinguished. Figure 9 shows that as the temperature increased from 120°C to 180°C the viscosity of all three binders decreased. However the rate of decrease was not constant. Initially, there was a large reduction in viscosity. However, after reaching a temperature of about 145°C the rate of decrease in viscosity was much lower. Even though the magnitude of viscosity at any particular temperature for all three binders was different, the general trend of all the curves was the same.
Binder Behavior With Temperature
0
1
2
3
4
5
6
100 120 140 160 180 200Temperature C
Visc
osity
Pas
cal-
Seco
nds
PG 64-22PG 70-22PG 76-22
Figure 9. Viscosity Temperature Plots
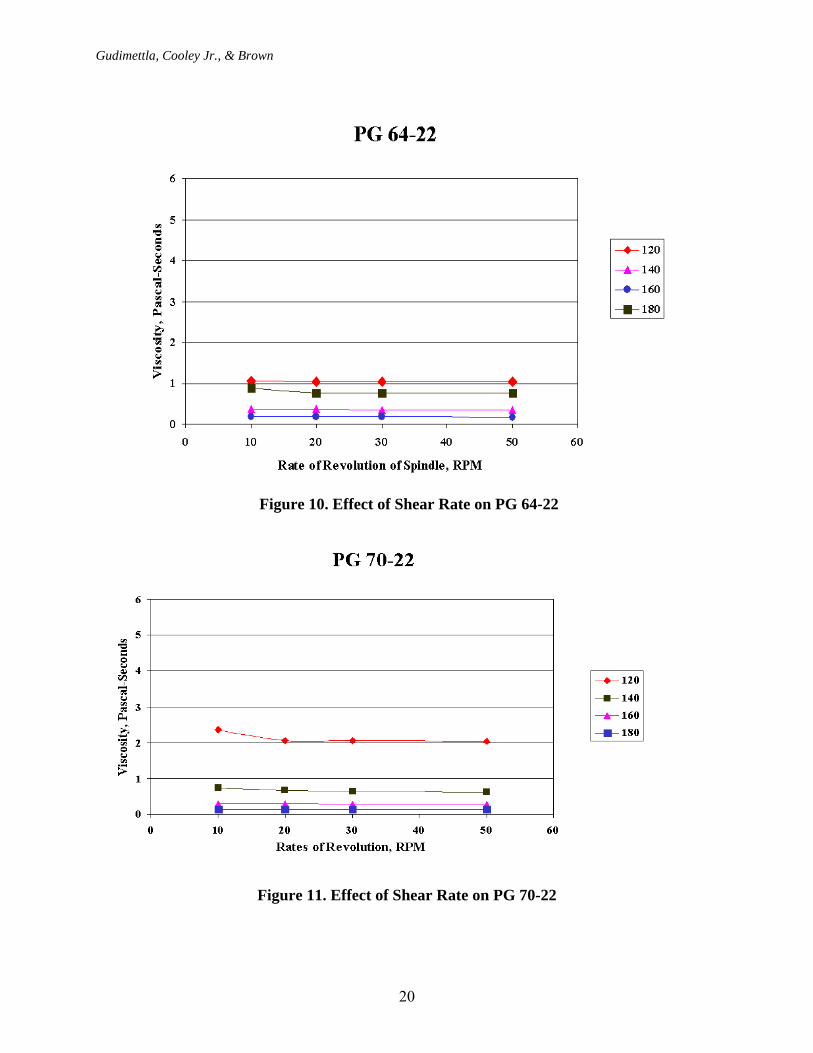
During the developmental stage of the workability device, mixes were tested with different rates of revolution of the paddle (Task 3). This was done to determine the rate of revolution that best differentiates the workability of mixes. The different rates of revolution also imply that the mix was being worked at various shear rates. Since each binder may have a shear rate dependency, this binder property was also evaluated. The effect of shear rate on binder viscosity within the temperature range of 120 to 180°C is presented in Figures 10, 11 and 12. For this testing, the shear rates within the Brookfield rotational viscometer were 10, 20, 30, and 50 RPMs. These figures show that there was very little effect of rotational speeds on the viscosity of the binders. There did appear to be a small effect for both of the modified binders at 120°C but since the workability test was generally stopped at 120°C, this was not considered significant to the results of the study. This suggests that measurement of workability for a given gradation and binder should not be influenced by any non-Newtonian behavior of the binder for the temperature range used in this study.
Gudimettla, Cooley Jr., & Brown
20
Figure 10. Effect of Shear Rate on PG 64-22
Figure 11. Effect of Shear Rate on PG 70-22
Gudimettla, Cooley Jr., & Brown
21
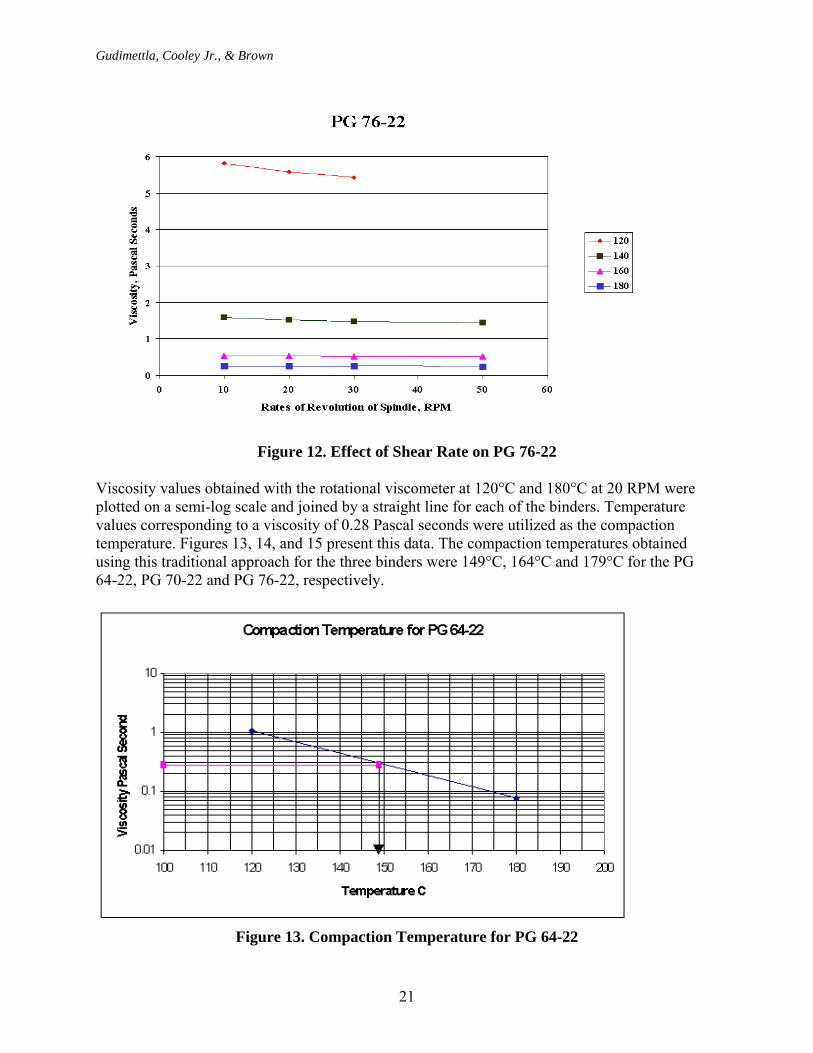
Figure 12. Effect of Shear Rate on PG 76-22
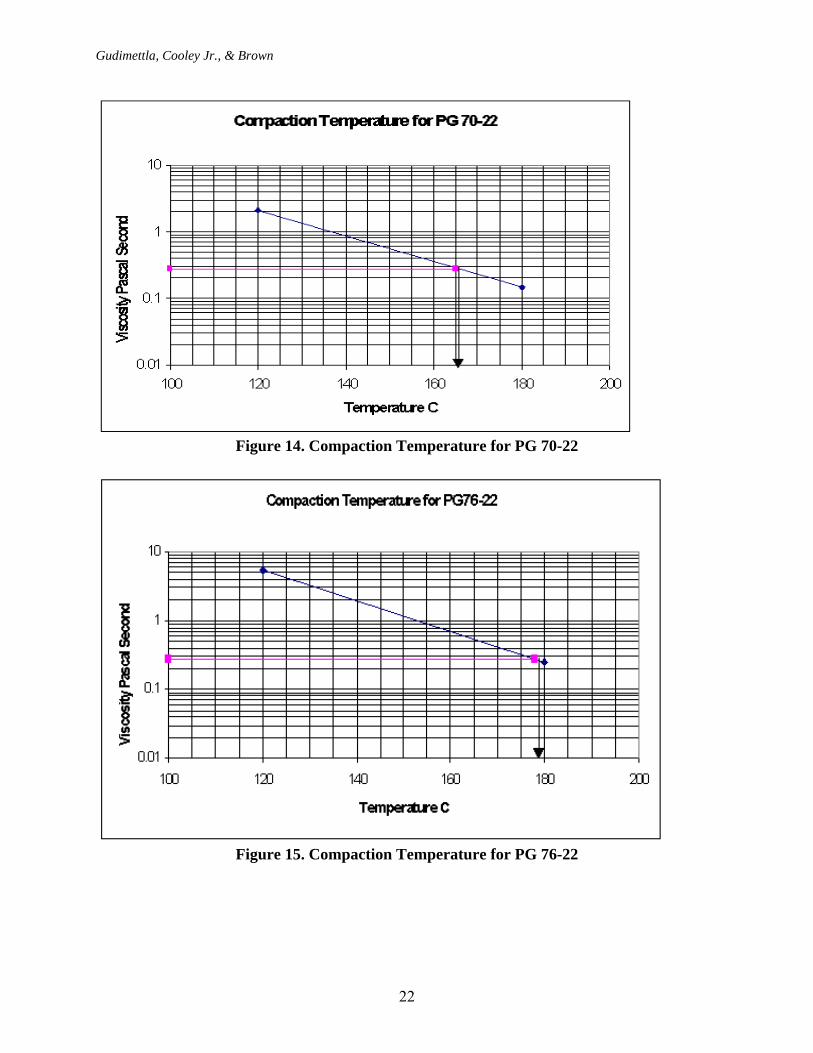
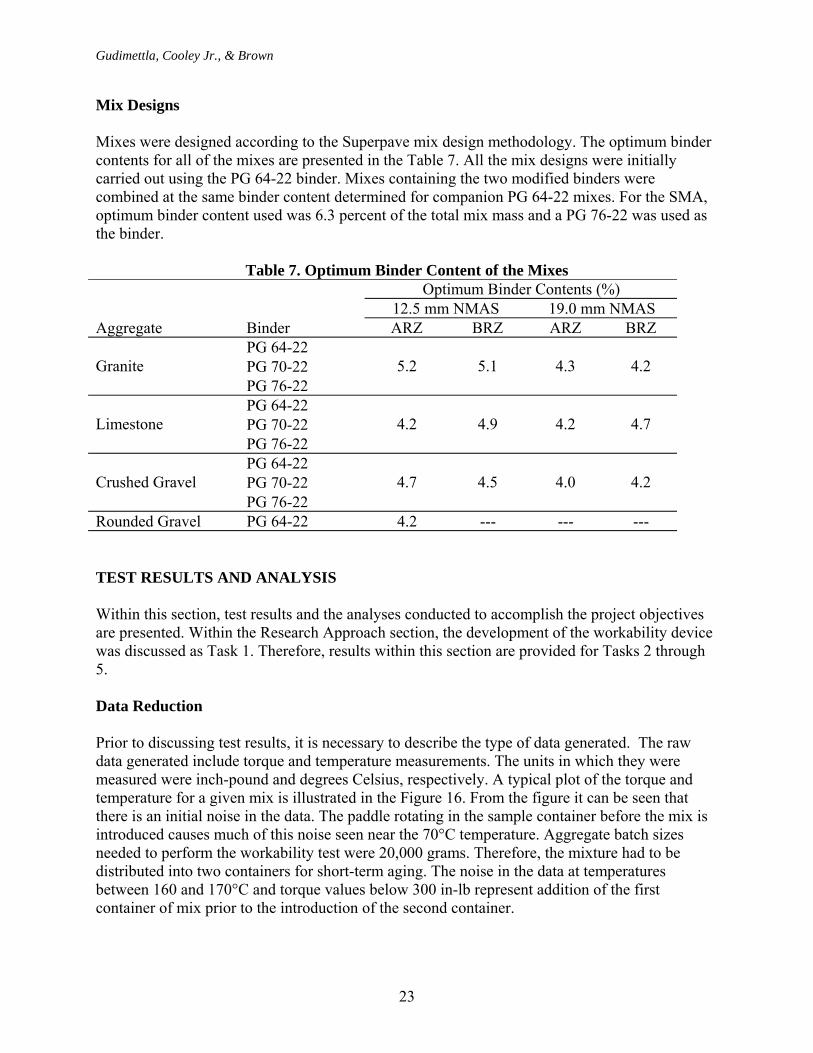
Viscosity values obtained with the rotational viscometer at 120°C and 180°C at 20 RPM were plotted on a semi-log scale and joined by a straight line for each of the binders. Temperature values corresponding to a viscosity of 0.28 Pascal seconds were utilized as the compaction temperature. Figures 13, 14, and 15 present this data. The compaction temperatures obtained using this traditional approach for the three binders were 149°C, 164°C and 179°C for the PG 64-22, PG 70-22 and PG 76-22, respectively.
Figure 13. Compaction Temperature for PG 64-22
Gudimettla, Cooley Jr., & Brown
22
Figure 14. Compaction Temperature for PG 70-22
Figure 15. Compaction Temperature for PG 76-22
Gudimettla, Cooley Jr., & Brown
23
Mix Designs Mixes were designed according to the Superpave mix design methodology. The optimum binder contents for all of the mixes are presented in the Table 7. All the mix designs were initially carried out using the PG 64-22 binder. Mixes containing the two modified binders were combined at the same binder content determined for companion PG 64-22 mixes. For the SMA, optimum binder content used was 6.3 percent of the total mix mass and a PG 76-22 was used as the binder.
Table 7. Optimum Binder Content of the Mixes
Optimum Binder Contents (%) 12.5 mm NMAS 19.0 mm NMAS
Aggregate Binder ARZ BRZ ARZ BRZ PG 64-22 PG 70-22 Granite PG 76-22
5.2 5.1 4.3 4.2
PG 64-22 PG 70-22 Limestone PG 76-22
4.2 4.9 4.2 4.7
PG 64-22 PG 70-22 Crushed Gravel PG 76-22
4.7 4.5 4.0 4.2
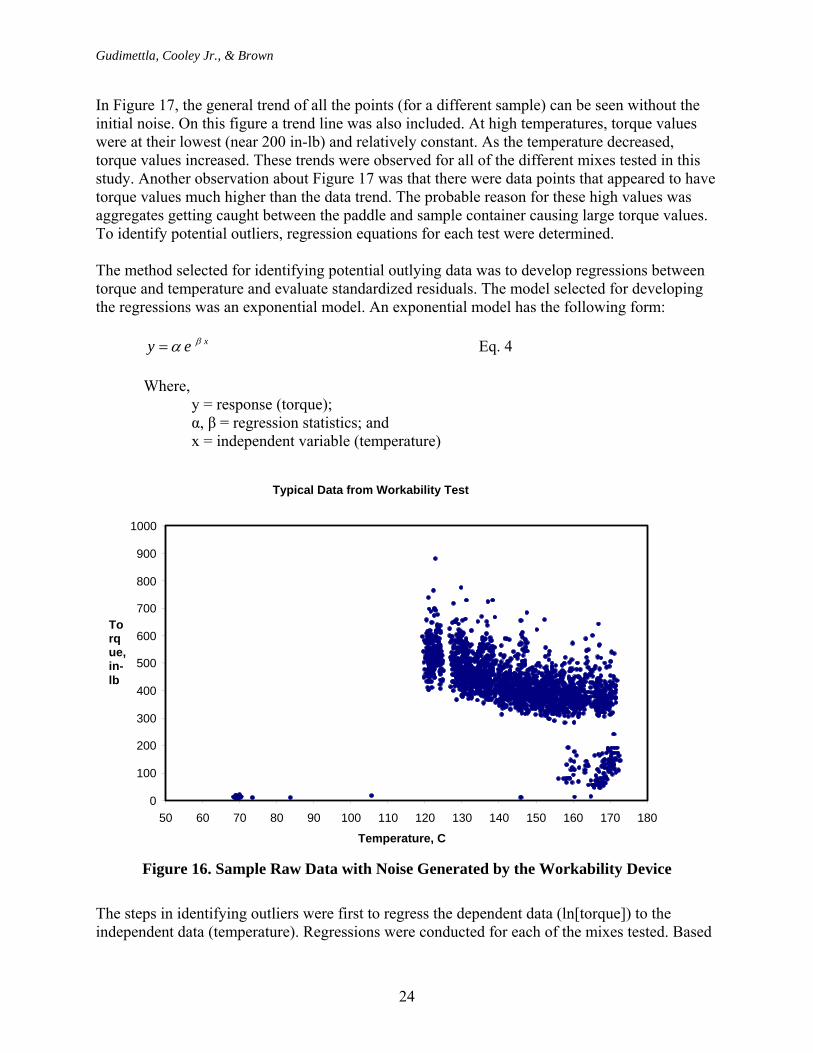
Rounded Gravel PG 64-22 4.2 --- --- --- TEST RESULTS AND ANALYSIS Within this section, test results and the analyses conducted to accomplish the project objectives are presented. Within the Research Approach section, the development of the workability device was discussed as Task 1. Therefore, results within this section are provided for Tasks 2 through 5. Data Reduction Prior to discussing test results, it is necessary to describe the type of data generated. The raw data generated include torque and temperature measurements. The units in which they were measured were inch-pound and degrees Celsius, respectively. A typical plot of the torque and temperature for a given mix is illustrated in the Figure 16. From the figure it can be seen that there is an initial noise in the data. The paddle rotating in the sample container before the mix is introduced causes much of this noise seen near the 70°C temperature. Aggregate batch sizes needed to perform the workability test were 20,000 grams. Therefore, the mixture had to be distributed into two containers for short-term aging. The noise in the data at temperatures between 160 and 170°C and torque values below 300 in-lb represent addition of the first container of mix prior to the introduction of the second container.
Gudimettla, Cooley Jr., & Brown
24
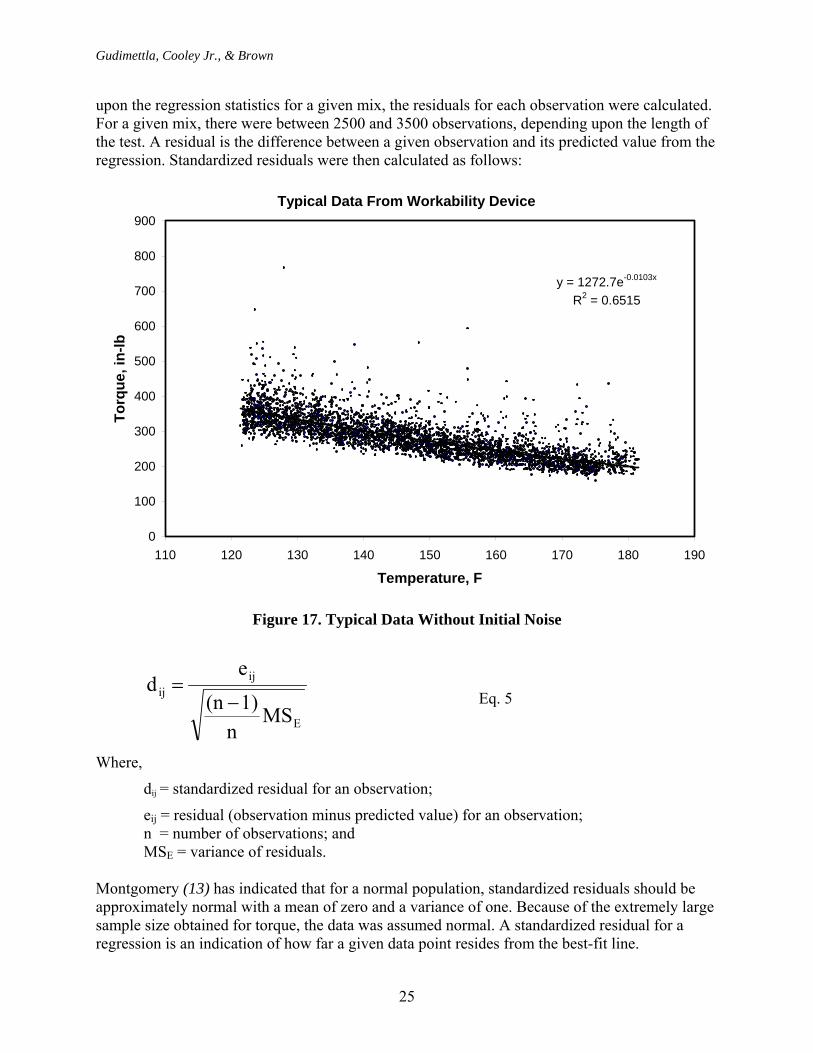
In Figure 17, the general trend of all the points (for a different sample) can be seen without the initial noise. On this figure a trend line was also included. At high temperatures, torque values were at their lowest (near 200 in-lb) and relatively constant. As the temperature decreased, torque values increased. These trends were observed for all of the different mixes tested in this study. Another observation about Figure 17 was that there were data points that appeared to have torque values much higher than the data trend. The probable reason for these high values was aggregates getting caught between the paddle and sample container causing large torque values. To identify potential outliers, regression equations for each test were determined. The method selected for identifying potential outlying data was to develop regressions between torque and temperature and evaluate standardized residuals. The model selected for developing the regressions was an exponential model. An exponential model has the following form:
xey βα= Eq. 4
Where,
y = response (torque); α, β = regression statistics; and x = independent variable (temperature)
Typical Data from Workability Test
0
100
200
300
400
500
600
700
800
900
1000
50 60 70 80 90 100 110 120 130 140 150 160 170 180
Temperature, C
Torque, in-lb
Figure 16. Sample Raw Data with Noise Generated by the Workability Device
The steps in identifying outliers were first to regress the dependent data (ln[torque]) to the independent data (temperature). Regressions were conducted for each of the mixes tested. Based
Gudimettla, Cooley Jr., & Brown
25
upon the regression statistics for a given mix, the residuals for each observation were calculated. For a given mix, there were between 2500 and 3500 observations, depending upon the length of the test. A residual is the difference between a given observation and its predicted value from the regression. Standardized residuals were then calculated as follows:
Typical Data From Workability Device
y = 1272.7e-0.0103x
R2 = 0.6515
0
100
200
300
400
500
600
700
800
900
110 120 130 140 150 160 170 180 190
Temperature, F
Torq
ue, i
n-lb
Figure 17. Typical Data Without Initial Noise
E
ijij
MSn
1)(ne
d−
= Eq. 5
Where,
dij = standardized residual for an observation;
eij = residual (observation minus predicted value) for an observation; n = number of observations; and MSE = variance of residuals. Montgomery (13) has indicated that for a normal population, standardized residuals should be approximately normal with a mean of zero and a variance of one. Because of the extremely large sample size obtained for torque, the data was assumed normal. A standardized residual for a regression is an indication of how far a given data point resides from the best-fit line.
Gudimettla, Cooley Jr., & Brown
26
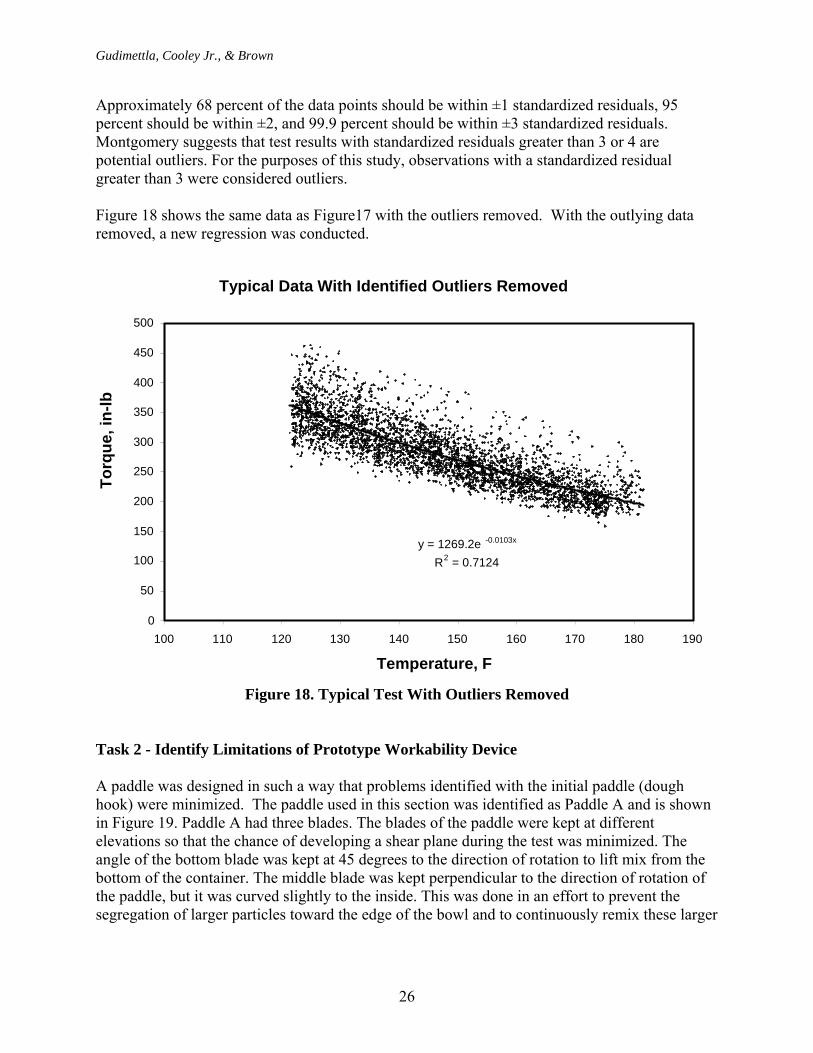
Approximately 68 percent of the data points should be within ±1 standardized residuals, 95 percent should be within ±2, and 99.9 percent should be within ±3 standardized residuals. Montgomery suggests that test results with standardized residuals greater than 3 or 4 are potential outliers. For the purposes of this study, observations with a standardized residual greater than 3 were considered outliers. Figure 18 shows the same data as Figure17 with the outliers removed. With the outlying data removed, a new regression was conducted.
Typical Data With Identified Outliers Removed
y = 1269.2e -0.0103x
R2 = 0.7124
0
50
100
150
200
250
300
350
400
450
500
100 110 120 130 140 150 160 170 180 190
Temperature, F
Torq
ue, i
n-lb
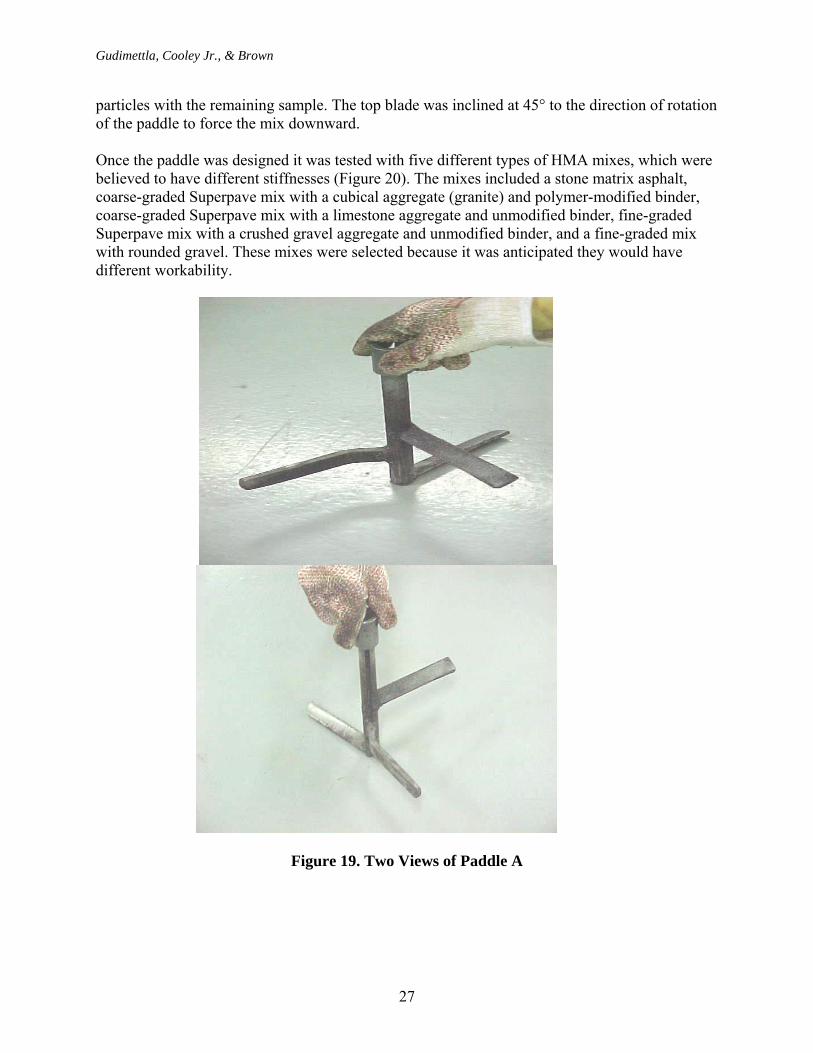
Figure 18. Typical Test With Outliers Removed Task 2 - Identify Limitations of Prototype Workability Device A paddle was designed in such a way that problems identified with the initial paddle (dough hook) were minimized. The paddle used in this section was identified as Paddle A and is shown in Figure 19. Paddle A had three blades. The blades of the paddle were kept at different elevations so that the chance of developing a shear plane during the test was minimized. The angle of the bottom blade was kept at 45 degrees to the direction of rotation to lift mix from the bottom of the container. The middle blade was kept perpendicular to the direction of rotation of the paddle, but it was curved slightly to the inside. This was done in an effort to prevent the segregation of larger particles toward the edge of the bowl and to continuously remix these larger
Gudimettla, Cooley Jr., & Brown
27
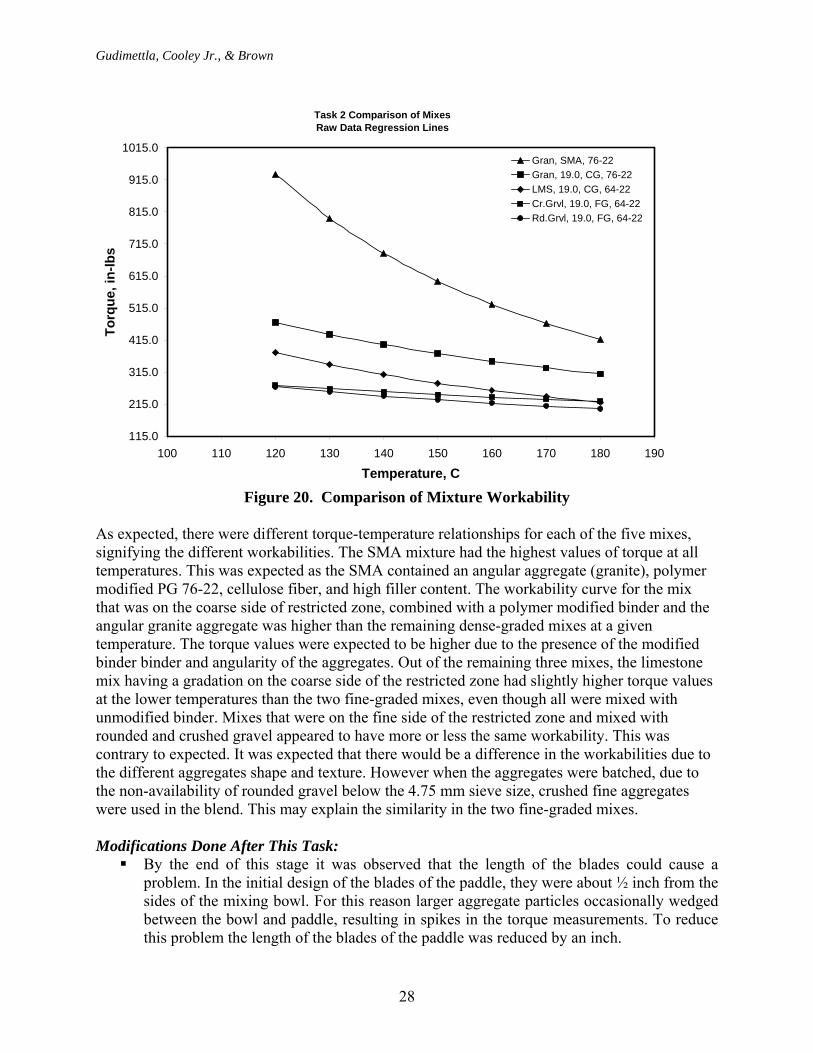
particles with the remaining sample. The top blade was inclined at 45° to the direction of rotation of the paddle to force the mix downward. Once the paddle was designed it was tested with five different types of HMA mixes, which were believed to have different stiffnesses (Figure 20). The mixes included a stone matrix asphalt, coarse-graded Superpave mix with a cubical aggregate (granite) and polymer-modified binder, coarse-graded Superpave mix with a limestone aggregate and unmodified binder, fine-graded Superpave mix with a crushed gravel aggregate and unmodified binder, and a fine-graded mix with rounded gravel. These mixes were selected because it was anticipated they would have different workability.
Figure 19. Two Views of Paddle A
Gudimettla, Cooley Jr., & Brown
28
Task 2 Comparison of MixesRaw Data Regression Lines
115.0
215.0
315.0
415.0
515.0
615.0
715.0
815.0
915.0
1015.0
100 110 120 130 140 150 160 170 180 190
Temperature, C
Torq
ue, i
n-lb
s
Gran, SMA, 76-22Gran, 19.0, CG, 76-22LMS, 19.0, CG, 64-22Cr.Grvl, 19.0, FG, 64-22Rd.Grvl, 19.0, FG, 64-22
Figure 20. Comparison of Mixture Workability
As expected, there were different torque-temperature relationships for each of the five mixes, signifying the different workabilities. The SMA mixture had the highest values of torque at all temperatures. This was expected as the SMA contained an angular aggregate (granite), polymer modified PG 76-22, cellulose fiber, and high filler content. The workability curve for the mix that was on the coarse side of restricted zone, combined with a polymer modified binder and the angular granite aggregate was higher than the remaining dense-graded mixes at a given temperature. The torque values were expected to be higher due to the presence of the modified binder binder and angularity of the aggregates. Out of the remaining three mixes, the limestone mix having a gradation on the coarse side of the restricted zone had slightly higher torque values at the lower temperatures than the two fine-graded mixes, even though all were mixed with unmodified binder. Mixes that were on the fine side of the restricted zone and mixed with rounded and crushed gravel appeared to have more or less the same workability. This was contrary to expected. It was expected that there would be a difference in the workabilities due to the different aggregates shape and texture. However when the aggregates were batched, due to the non-availability of rounded gravel below the 4.75 mm sieve size, crushed fine aggregates were used in the blend. This may explain the similarity in the two fine-graded mixes. Modifications Done After This Task: By the end of this stage it was observed that the length of the blades could cause a
problem. In the initial design of the blades of the paddle, they were about ½ inch from the sides of the mixing bowl. For this reason larger aggregate particles occasionally wedged between the bowl and paddle, resulting in spikes in the torque measurements. To reduce this problem the length of the blades of the paddle was reduced by an inch.
Gudimettla, Cooley Jr., & Brown
29
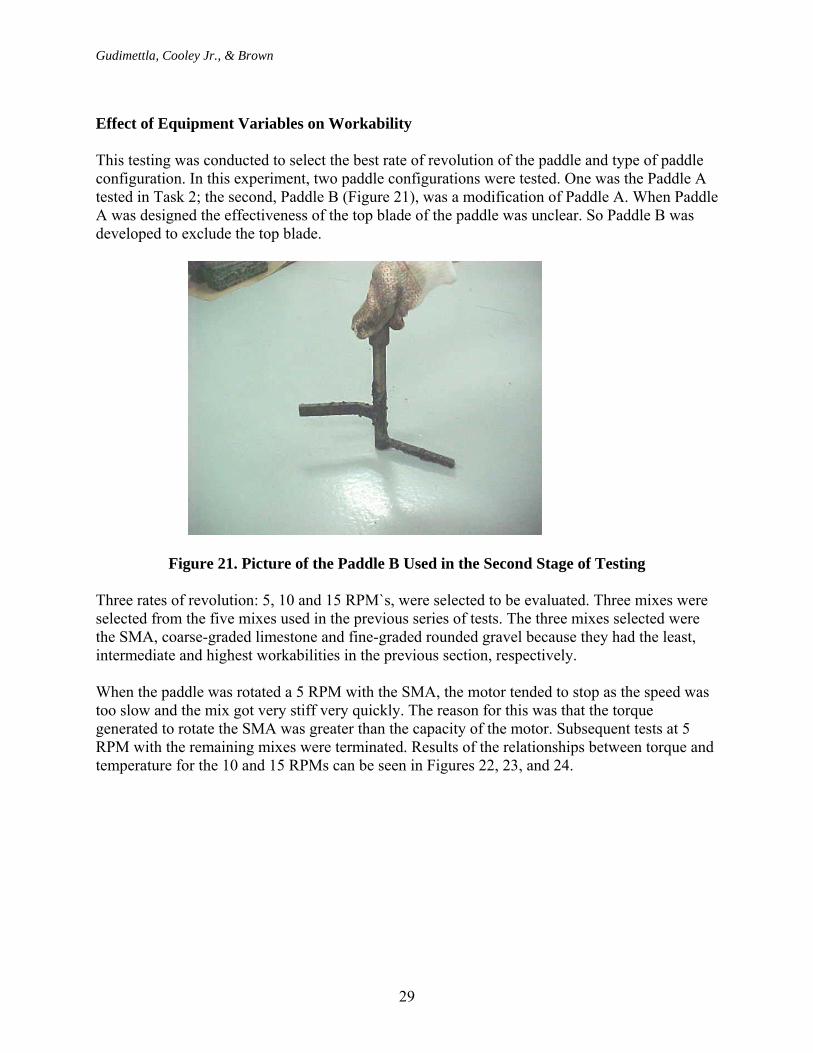
Effect of Equipment Variables on Workability This testing was conducted to select the best rate of revolution of the paddle and type of paddle configuration. In this experiment, two paddle configurations were tested. One was the Paddle A tested in Task 2; the second, Paddle B (Figure 21), was a modification of Paddle A. When Paddle A was designed the effectiveness of the top blade of the paddle was unclear. So Paddle B was developed to exclude the top blade.
Figure 21. Picture of the Paddle B Used in the Second Stage of Testing
Three rates of revolution: 5, 10 and 15 RPM`s, were selected to be evaluated. Three mixes were selected from the five mixes used in the previous series of tests. The three mixes selected were the SMA, coarse-graded limestone and fine-graded rounded gravel because they had the least, intermediate and highest workabilities in the previous section, respectively.
When the paddle was rotated a 5 RPM with the SMA, the motor tended to stop as the speed was too slow and the mix got very stiff very quickly. The reason for this was that the torque generated to rotate the SMA was greater than the capacity of the motor. Subsequent tests at 5 RPM with the remaining mixes were terminated. Results of the relationships between torque and temperature for the 10 and 15 RPMs can be seen in Figures 22, 23, and 24.
Gudimettla, Cooley Jr., & Brown
30
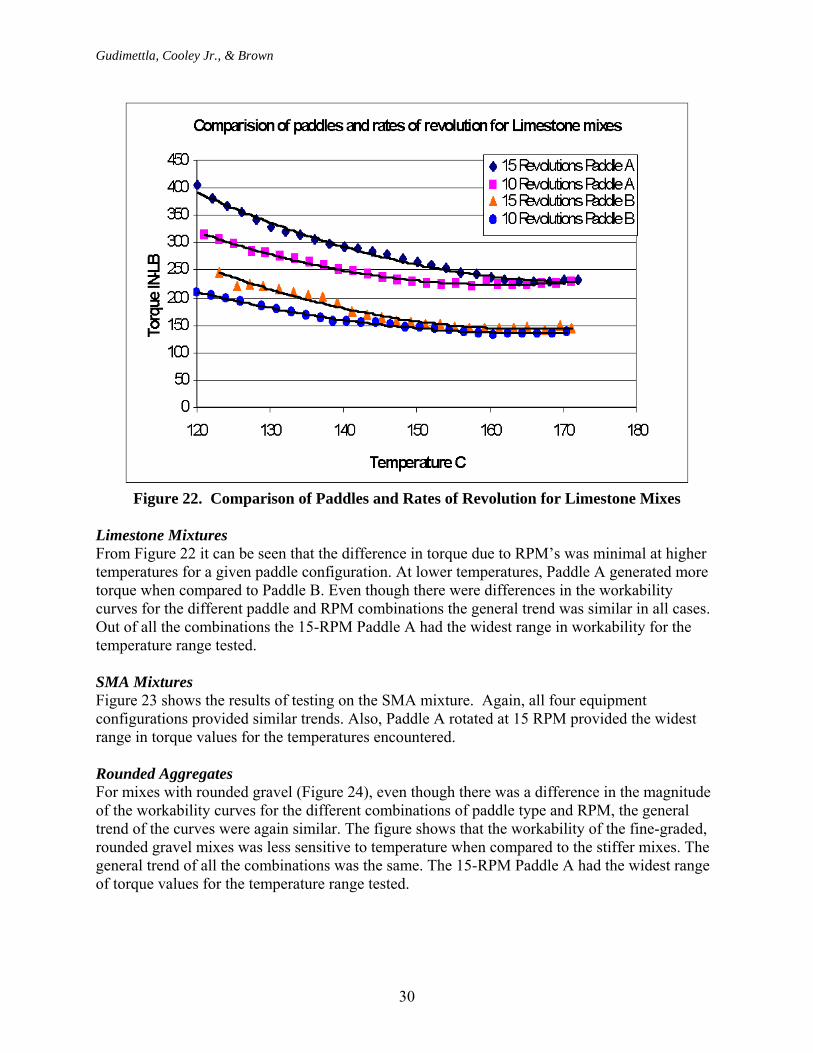
Figure 22. Comparison of Paddles and Rates of Revolution for Limestone Mixes
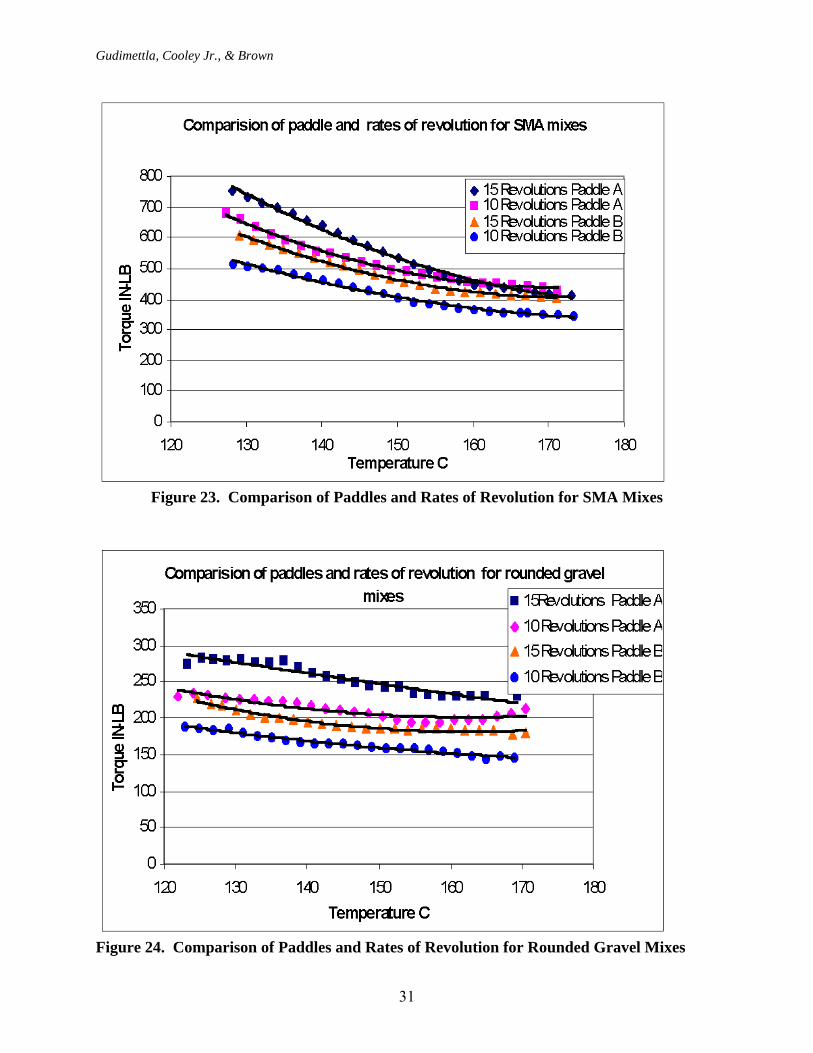
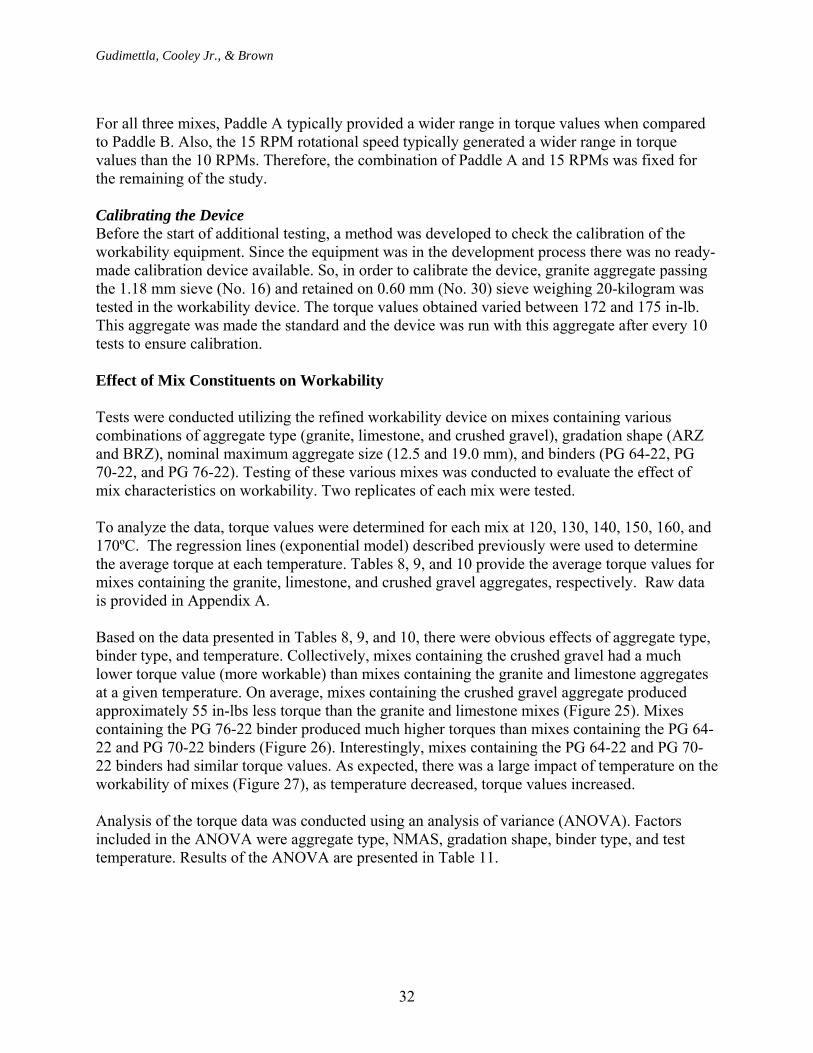
Limestone Mixtures From Figure 22 it can be seen that the difference in torque due to RPM’s was minimal at higher temperatures for a given paddle configuration. At lower temperatures, Paddle A generated more torque when compared to Paddle B. Even though there were differences in the workability curves for the different paddle and RPM combinations the general trend was similar in all cases. Out of all the combinations the 15-RPM Paddle A had the widest range in workability for the temperature range tested. SMA Mixtures Figure 23 shows the results of testing on the SMA mixture. Again, all four equipment configurations provided similar trends. Also, Paddle A rotated at 15 RPM provided the widest range in torque values for the temperatures encountered. Rounded Aggregates For mixes with rounded gravel (Figure 24), even though there was a difference in the magnitude of the workability curves for the different combinations of paddle type and RPM, the general trend of the curves were again similar. The figure shows that the workability of the fine-graded, rounded gravel mixes was less sensitive to temperature when compared to the stiffer mixes. The general trend of all the combinations was the same. The 15-RPM Paddle A had the widest range of torque values for the temperature range tested.
Gudimettla, Cooley Jr., & Brown
31
Figure 23. Comparison of Paddles and Rates of Revolution for SMA Mixes
Figure 24. Comparison of Paddles and Rates of Revolution for Rounded Gravel Mixes
Gudimettla, Cooley Jr., & Brown
32
For all three mixes, Paddle A typically provided a wider range in torque values when compared to Paddle B. Also, the 15 RPM rotational speed typically generated a wider range in torque values than the 10 RPMs. Therefore, the combination of Paddle A and 15 RPMs was fixed for the remaining of the study.
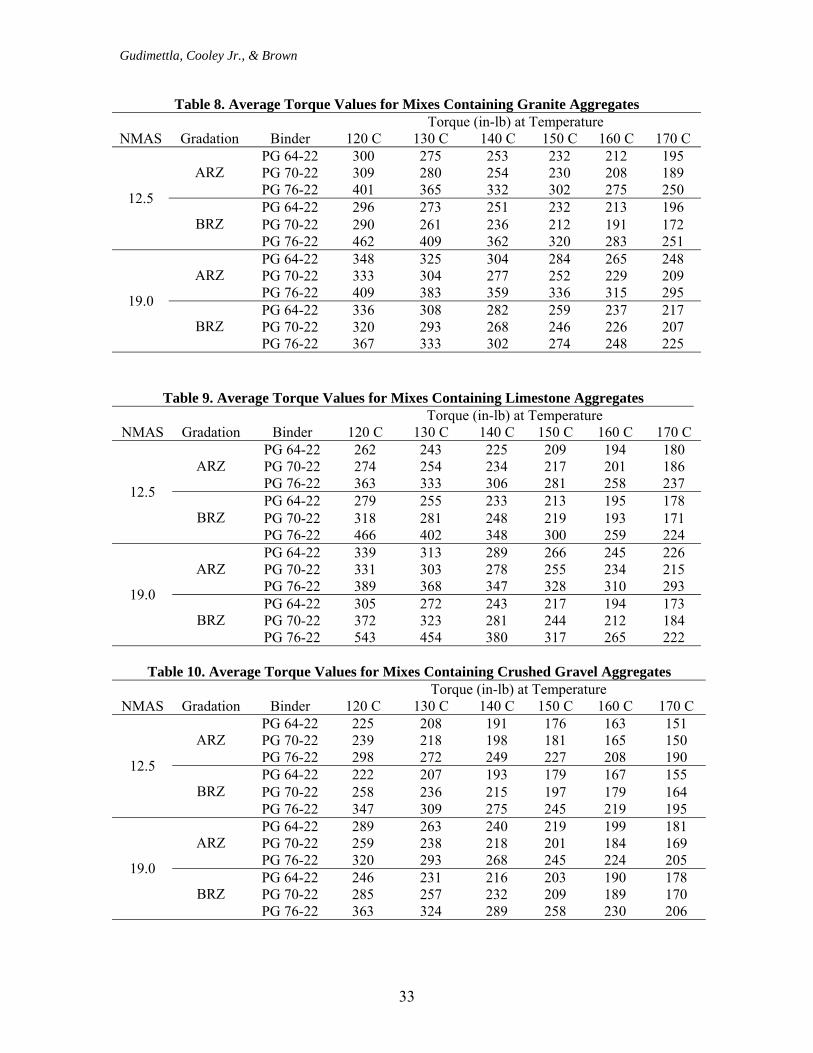
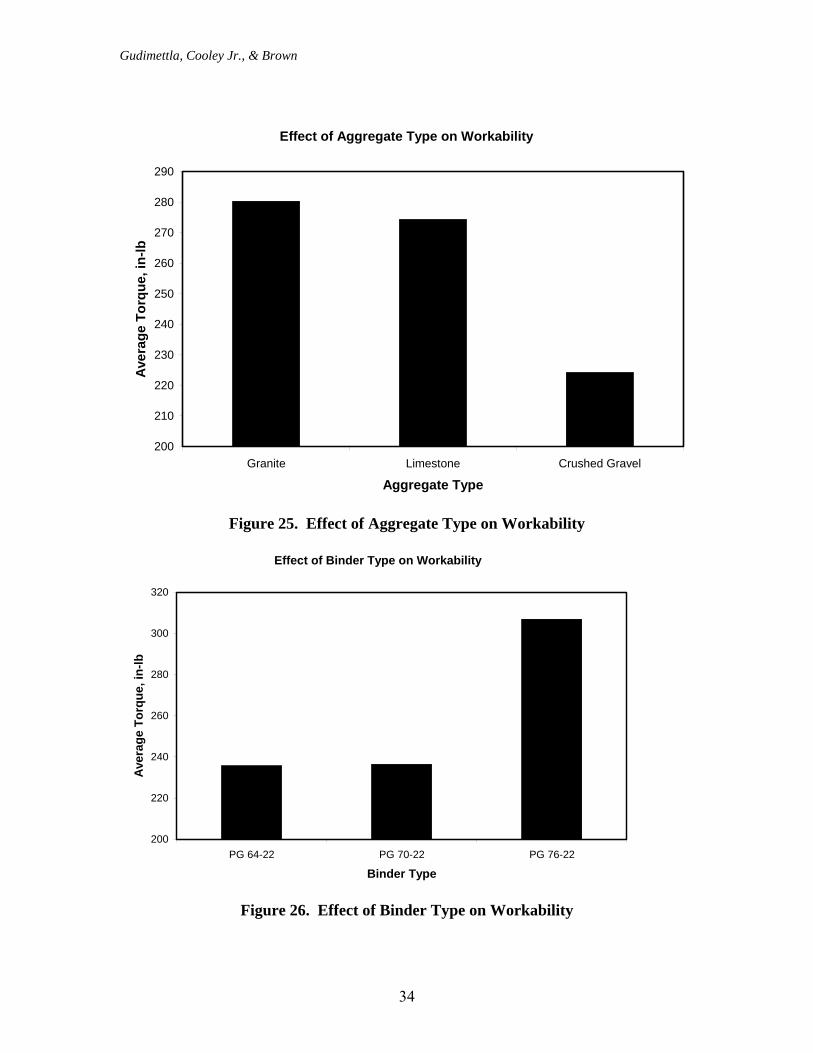
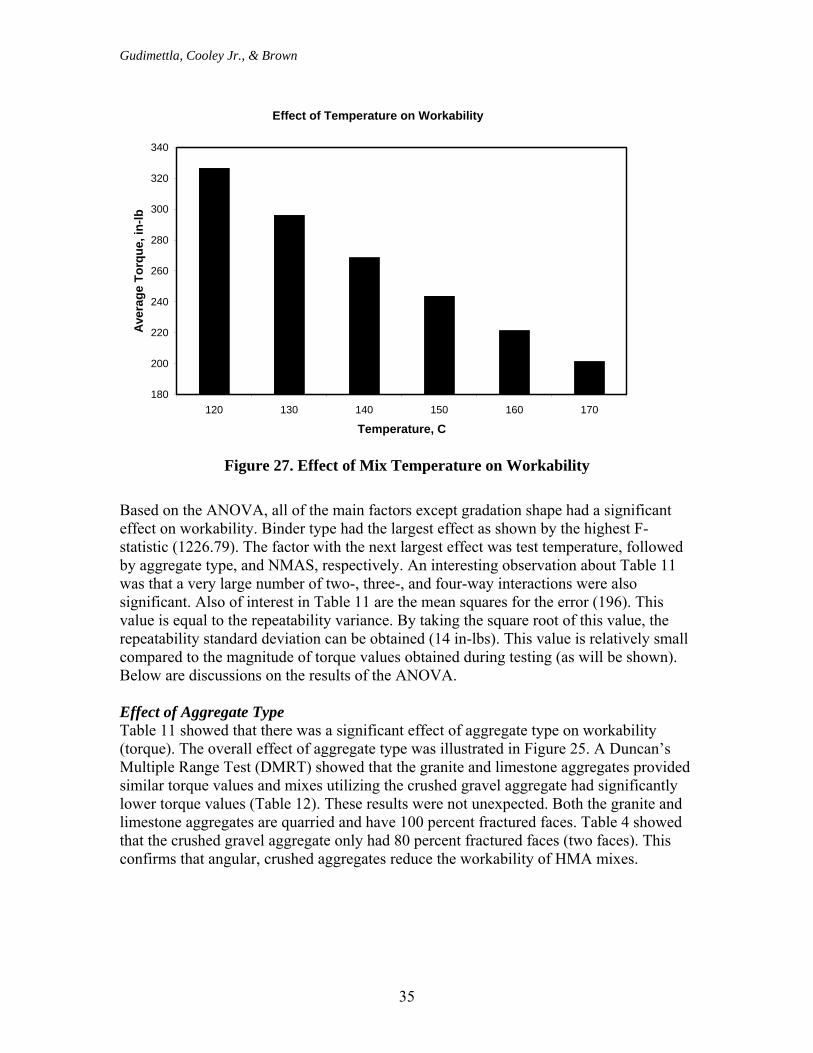
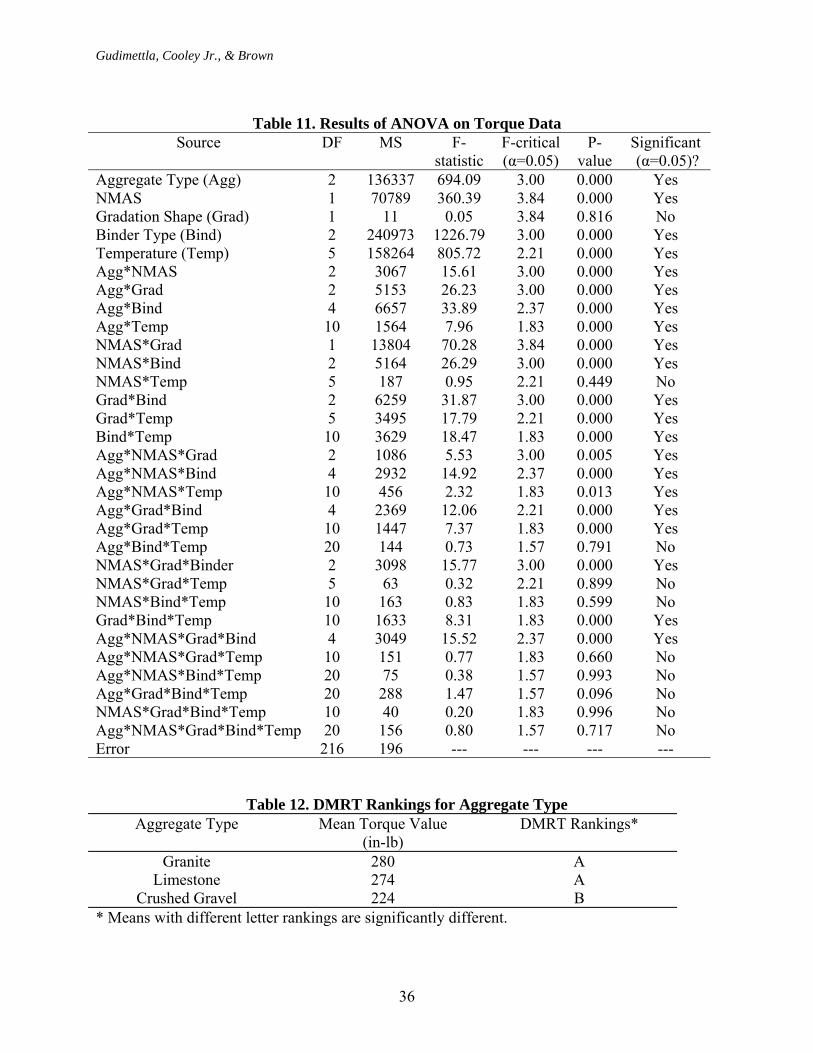
Calibrating the Device Before the start of additional testing, a method was developed to check the calibration of the workability equipment. Since the equipment was in the development process there was no ready-made calibration device available. So, in order to calibrate the device, granite aggregate passing the 1.18 mm sieve (No. 16) and retained on 0.60 mm (No. 30) sieve weighing 20-kilogram was tested in the workability device. The torque values obtained varied between 172 and 175 in-lb. This aggregate was made the standard and the device was run with this aggregate after every 10 tests to ensure calibration. Effect of Mix Constituents on Workability Tests were conducted utilizing the refined workability device on mixes containing various combinations of aggregate type (granite, limestone, and crushed gravel), gradation shape (ARZ and BRZ), nominal maximum aggregate size (12.5 and 19.0 mm), and binders (PG 64-22, PG 70-22, and PG 76-22). Testing of these various mixes was conducted to evaluate the effect of mix characteristics on workability. Two replicates of each mix were tested. To analyze the data, torque values were determined for each mix at 120, 130, 140, 150, 160, and 170ºC. The regression lines (exponential model) described previously were used to determine the average torque at each temperature. Tables 8, 9, and 10 provide the average torque values for mixes containing the granite, limestone, and crushed gravel aggregates, respectively. Raw data is provided in Appendix A. Based on the data presented in Tables 8, 9, and 10, there were obvious effects of aggregate type, binder type, and temperature. Collectively, mixes containing the crushed gravel had a much lower torque value (more workable) than mixes containing the granite and limestone aggregates at a given temperature. On average, mixes containing the crushed gravel aggregate produced approximately 55 in-lbs less torque than the granite and limestone mixes (Figure 25). Mixes containing the PG 76-22 binder produced much higher torques than mixes containing the PG 64-22 and PG 70-22 binders (Figure 26). Interestingly, mixes containing the PG 64-22 and PG 70-22 binders had similar torque values. As expected, there was a large impact of temperature on the workability of mixes (Figure 27), as temperature decreased, torque values increased. Analysis of the torque data was conducted using an analysis of variance (ANOVA). Factors included in the ANOVA were aggregate type, NMAS, gradation shape, binder type, and test temperature. Results of the ANOVA are presented in Table 11.
Gudimettla, Cooley Jr., & Brown
33
Table 8. Average Torque Values for Mixes Containing Granite Aggregates Torque (in-lb) at Temperature
NMAS Gradation Binder 120 C 130 C 140 C 150 C 160 C 170 C PG 64-22 300 275 253 232 212 195 PG 70-22 309 280 254 230 208 189 ARZ PG 76-22 401 365 332 302 275 250 PG 64-22 296 273 251 232 213 196 PG 70-22 290 261 236 212 191 172
12.5
BRZ PG 76-22 462 409 362 320 283 251 PG 64-22 348 325 304 284 265 248 PG 70-22 333 304 277 252 229 209 ARZ PG 76-22 409 383 359 336 315 295 PG 64-22 336 308 282 259 237 217 PG 70-22 320 293 268 246 226 207
19.0
BRZ PG 76-22 367 333 302 274 248 225
Table 9. Average Torque Values for Mixes Containing Limestone Aggregates Torque (in-lb) at Temperature
NMAS Gradation Binder 120 C 130 C 140 C 150 C 160 C 170 C PG 64-22 262 243 225 209 194 180 PG 70-22 274 254 234 217 201 186 ARZ PG 76-22 363 333 306 281 258 237 PG 64-22 279 255 233 213 195 178 PG 70-22 318 281 248 219 193 171
12.5
BRZ PG 76-22 466 402 348 300 259 224 PG 64-22 339 313 289 266 245 226 PG 70-22 331 303 278 255 234 215 ARZ PG 76-22 389 368 347 328 310 293 PG 64-22 305 272 243 217 194 173 PG 70-22 372 323 281 244 212 184
19.0
BRZ PG 76-22 543 454 380 317 265 222
Table 10. Average Torque Values for Mixes Containing Crushed Gravel Aggregates
Torque (in-lb) at Temperature NMAS Gradation Binder 120 C 130 C 140 C 150 C 160 C 170 C
PG 64-22 225 208 191 176 163 151 PG 70-22 239 218 198 181 165 150 ARZ PG 76-22 298 272 249 227 208 190 PG 64-22 222 207 193 179 167 155 PG 70-22 258 236 215 197 179 164
12.5
BRZ PG 76-22 347 309 275 245 219 195 PG 64-22 289 263 240 219 199 181 PG 70-22 259 238 218 201 184 169 ARZ PG 76-22 320 293 268 245 224 205 PG 64-22 246 231 216 203 190 178 PG 70-22 285 257 232 209 189 170
19.0
BRZ PG 76-22 363 324 289 258 230 206
Gudimettla, Cooley Jr., & Brown
34
Effect of Aggregate Type on Workability
200
210
220
230
240
250
260
270
280
290
Granite Limestone Crushed Gravel
Aggregate Type
Aver
age
Torq
ue, i
n-lb
Figure 25. Effect of Aggregate Type on Workability
Effect of Binder Type on Workability
200
220
240
260
280
300
320
PG 64-22 PG 70-22 PG 76-22
Binder Type
Aver
age
Torq
ue, i
n-lb
Figure 26. Effect of Binder Type on Workability
Gudimettla, Cooley Jr., & Brown
35
Effect of Temperature on Workability
180
200
220
240
260
280
300
320
340
120 130 140 150 160 170
Temperature, C
Aver
age
Torq
ue, i
n-lb
Figure 27. Effect of Mix Temperature on Workability
Based on the ANOVA, all of the main factors except gradation shape had a significant effect on workability. Binder type had the largest effect as shown by the highest F-statistic (1226.79). The factor with the next largest effect was test temperature, followed by aggregate type, and NMAS, respectively. An interesting observation about Table 11 was that a very large number of two-, three-, and four-way interactions were also significant. Also of interest in Table 11 are the mean squares for the error (196). This value is equal to the repeatability variance. By taking the square root of this value, the repeatability standard deviation can be obtained (14 in-lbs). This value is relatively small compared to the magnitude of torque values obtained during testing (as will be shown). Below are discussions on the results of the ANOVA. Effect of Aggregate Type Table 11 showed that there was a significant effect of aggregate type on workability (torque). The overall effect of aggregate type was illustrated in Figure 25. A Duncan’s Multiple Range Test (DMRT) showed that the granite and limestone aggregates provided similar torque values and mixes utilizing the crushed gravel aggregate had significantly lower torque values (Table 12). These results were not unexpected. Both the granite and limestone aggregates are quarried and have 100 percent fractured faces. Table 4 showed that the crushed gravel aggregate only had 80 percent fractured faces (two faces). This confirms that angular, crushed aggregates reduce the workability of HMA mixes.
Gudimettla, Cooley Jr., & Brown
36
Table 11. Results of ANOVA on Torque Data
Source DF MS F-statistic
F-critical (α=0.05)
P-value
Significant (α=0.05)?
Aggregate Type (Agg) 2 136337 694.09 3.00 0.000 Yes NMAS 1 70789 360.39 3.84 0.000 Yes Gradation Shape (Grad) 1 11 0.05 3.84 0.816 No Binder Type (Bind) 2 240973 1226.79 3.00 0.000 Yes Temperature (Temp) 5 158264 805.72 2.21 0.000 Yes Agg*NMAS 2 3067 15.61 3.00 0.000 Yes Agg*Grad 2 5153 26.23 3.00 0.000 Yes Agg*Bind 4 6657 33.89 2.37 0.000 Yes Agg*Temp 10 1564 7.96 1.83 0.000 Yes NMAS*Grad 1 13804 70.28 3.84 0.000 Yes NMAS*Bind 2 5164 26.29 3.00 0.000 Yes NMAS*Temp 5 187 0.95 2.21 0.449 No Grad*Bind 2 6259 31.87 3.00 0.000 Yes Grad*Temp 5 3495 17.79 2.21 0.000 Yes Bind*Temp 10 3629 18.47 1.83 0.000 Yes Agg*NMAS*Grad 2 1086 5.53 3.00 0.005 Yes Agg*NMAS*Bind 4 2932 14.92 2.37 0.000 Yes Agg*NMAS*Temp 10 456 2.32 1.83 0.013 Yes Agg*Grad*Bind 4 2369 12.06 2.21 0.000 Yes Agg*Grad*Temp 10 1447 7.37 1.83 0.000 Yes Agg*Bind*Temp 20 144 0.73 1.57 0.791 No NMAS*Grad*Binder 2 3098 15.77 3.00 0.000 Yes NMAS*Grad*Temp 5 63 0.32 2.21 0.899 No NMAS*Bind*Temp 10 163 0.83 1.83 0.599 No Grad*Bind*Temp 10 1633 8.31 1.83 0.000 Yes Agg*NMAS*Grad*Bind 4 3049 15.52 2.37 0.000 Yes Agg*NMAS*Grad*Temp 10 151 0.77 1.83 0.660 No Agg*NMAS*Bind*Temp 20 75 0.38 1.57 0.993 No Agg*Grad*Bind*Temp 20 288 1.47 1.57 0.096 No NMAS*Grad*Bind*Temp 10 40 0.20 1.83 0.996 No Agg*NMAS*Grad*Bind*Temp 20 156 0.80 1.57 0.717 No Error 216 196 --- --- --- ---
Table 12. DMRT Rankings for Aggregate Type
Aggregate Type Mean Torque Value (in-lb)
DMRT Rankings*
Granite 280 A Limestone 274 A
Crushed Gravel 224 B * Means with different letter rankings are significantly different.
Gudimettla, Cooley Jr., & Brown
37
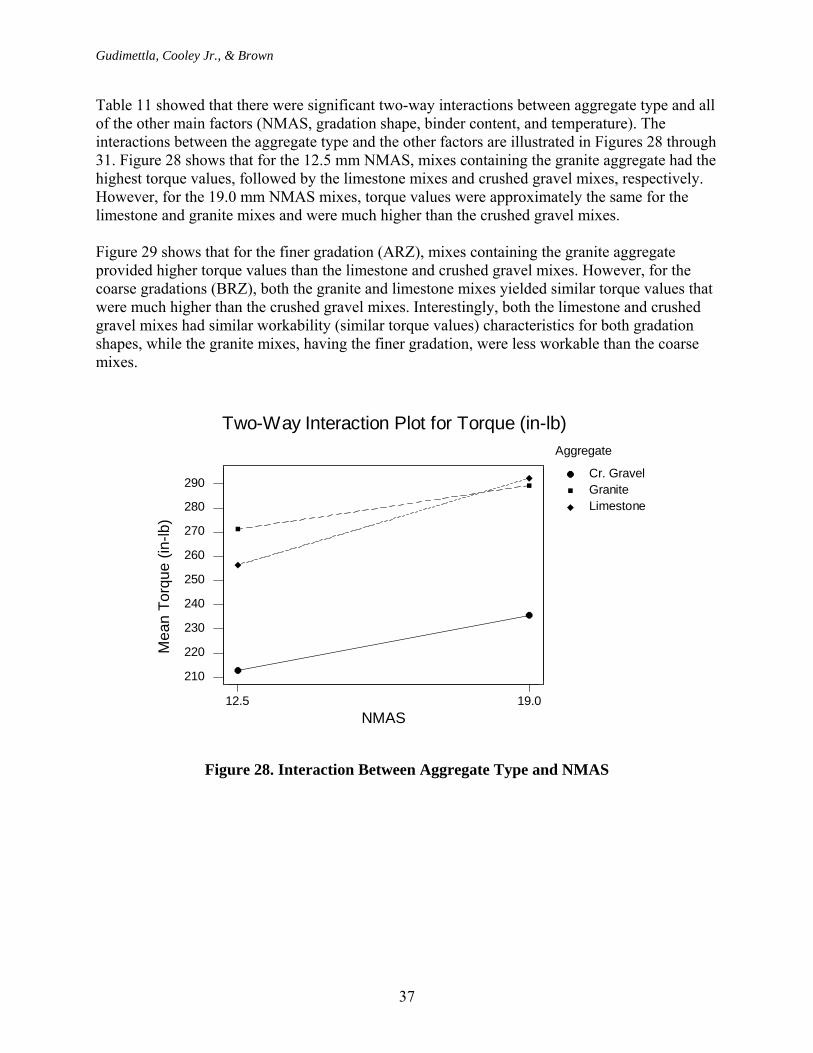
Table 11 showed that there were significant two-way interactions between aggregate type and all of the other main factors (NMAS, gradation shape, binder content, and temperature). The interactions between the aggregate type and the other factors are illustrated in Figures 28 through 31. Figure 28 shows that for the 12.5 mm NMAS, mixes containing the granite aggregate had the highest torque values, followed by the limestone mixes and crushed gravel mixes, respectively. However, for the 19.0 mm NMAS mixes, torque values were approximately the same for the limestone and granite mixes and were much higher than the crushed gravel mixes.
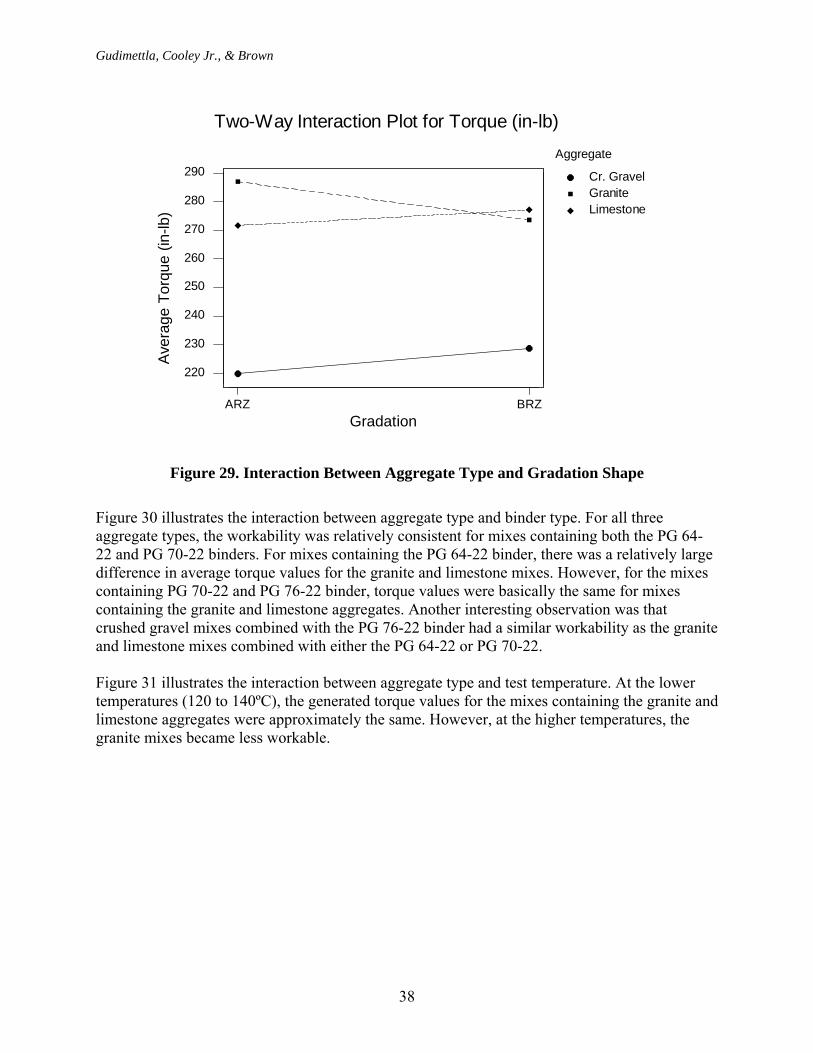
Figure 29 shows that for the finer gradation (ARZ), mixes containing the granite aggregate provided higher torque values than the limestone and crushed gravel mixes. However, for the coarse gradations (BRZ), both the granite and limestone mixes yielded similar torque values that were much higher than the crushed gravel mixes. Interestingly, both the limestone and crushed gravel mixes had similar workability (similar torque values) characteristics for both gradation shapes, while the granite mixes, having the finer gradation, were less workable than the coarse mixes.
Cr. Gravel Granite Limestone
19.012.5
290
280
270
260
250
240
230
220
210
NMAS
Aggregate
Mea
n To
rque
(in-
lb)
Two-Way Interaction Plot for Torque (in-lb)
Figure 28. Interaction Between Aggregate Type and NMAS
Gudimettla, Cooley Jr., & Brown
38
Cr. Gravel Granite Limestone
BRZARZ
290
280
270
260
250
240
230
220
Gradation
AggregateAv
erag
e To
rque
(in-
lb)
Two-Way Interaction Plot for Torque (in-lb)
Figure 29. Interaction Between Aggregate Type and Gradation Shape
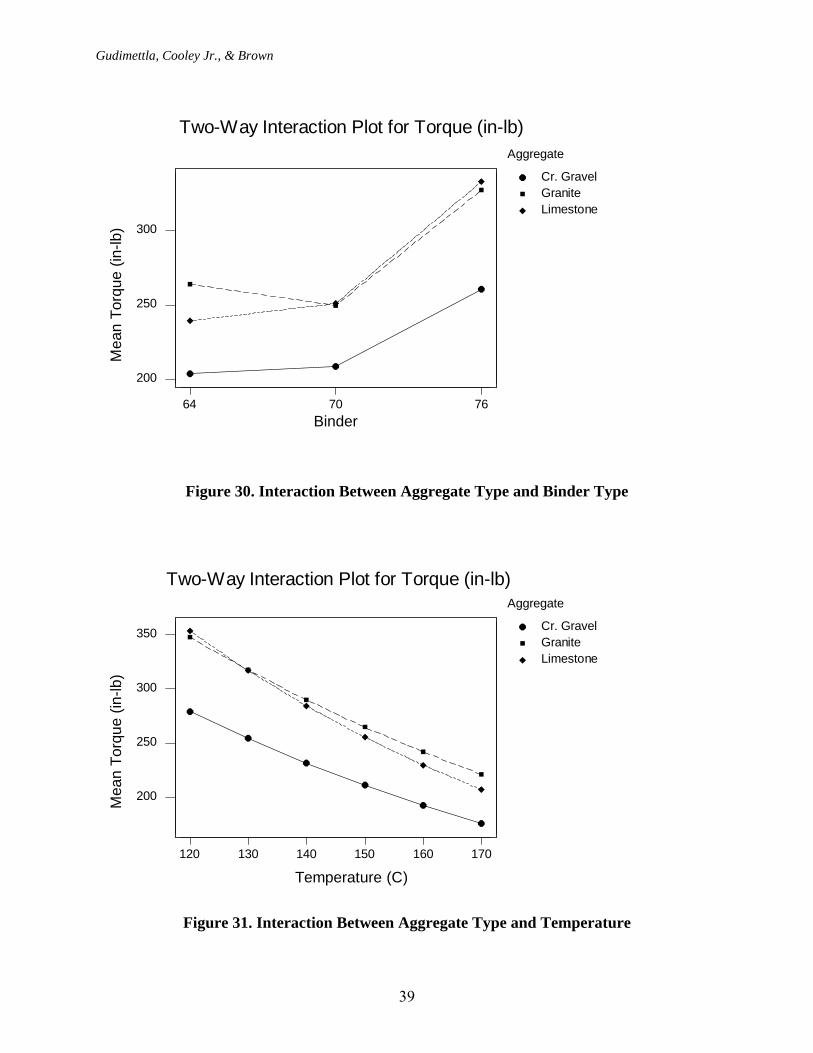
Figure 30 illustrates the interaction between aggregate type and binder type. For all three aggregate types, the workability was relatively consistent for mixes containing both the PG 64-22 and PG 70-22 binders. For mixes containing the PG 64-22 binder, there was a relatively large difference in average torque values for the granite and limestone mixes. However, for the mixes containing PG 70-22 and PG 76-22 binder, torque values were basically the same for mixes containing the granite and limestone aggregates. Another interesting observation was that crushed gravel mixes combined with the PG 76-22 binder had a similar workability as the granite and limestone mixes combined with either the PG 64-22 or PG 70-22. Figure 31 illustrates the interaction between aggregate type and test temperature. At the lower temperatures (120 to 140ºC), the generated torque values for the mixes containing the granite and limestone aggregates were approximately the same. However, at the higher temperatures, the granite mixes became less workable.
Gudimettla, Cooley Jr., & Brown
39
Cr. Gravel Granite Limestone
767064
300
250
200
Binder
Aggregate
Mea
n To
rque
(in-
lb)
Two-Way Interaction Plot for Torque (in-lb)
Figure 30. Interaction Between Aggregate Type and Binder Type
Cr. Gravel Granite Limestone
170160150140130120
350
300
250
200
Temperature (C)
Aggregate
Mea
n To
rque
(in-
lb)
Two-Way Interaction Plot for Torque (in-lb)
Figure 31. Interaction Between Aggregate Type and Temperature
Gudimettla, Cooley Jr., & Brown
40
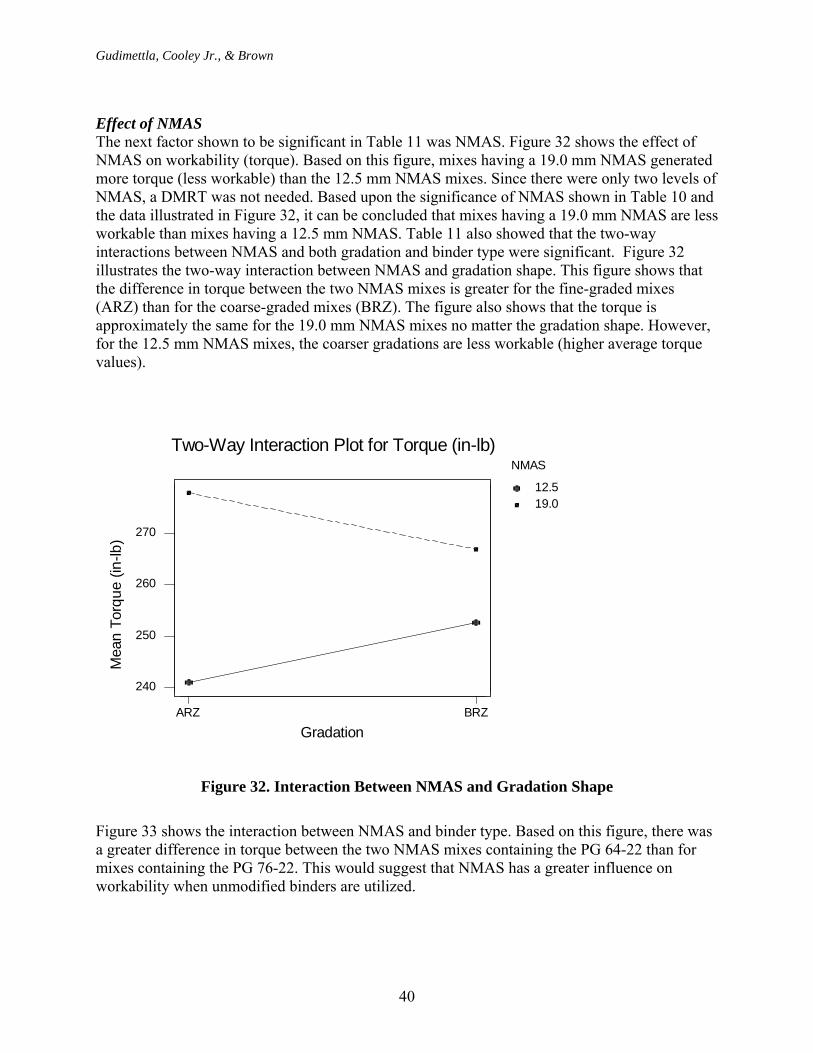
Effect of NMAS The next factor shown to be significant in Table 11 was NMAS. Figure 32 shows the effect of NMAS on workability (torque). Based on this figure, mixes having a 19.0 mm NMAS generated more torque (less workable) than the 12.5 mm NMAS mixes. Since there were only two levels of NMAS, a DMRT was not needed. Based upon the significance of NMAS shown in Table 10 and the data illustrated in Figure 32, it can be concluded that mixes having a 19.0 mm NMAS are less workable than mixes having a 12.5 mm NMAS. Table 11 also showed that the two-way interactions between NMAS and both gradation and binder type were significant. Figure 32 illustrates the two-way interaction between NMAS and gradation shape. This figure shows that the difference in torque between the two NMAS mixes is greater for the fine-graded mixes (ARZ) than for the coarse-graded mixes (BRZ). The figure also shows that the torque is approximately the same for the 19.0 mm NMAS mixes no matter the gradation shape. However, for the 12.5 mm NMAS mixes, the coarser gradations are less workable (higher average torque values).
12.5 19.0
BRZARZ
270
260
250
240
Gradation
NMAS
Mea
n To
rque
(in-
lb)
Two-Way Interaction Plot for Torque (in-lb)
Figure 32. Interaction Between NMAS and Gradation Shape
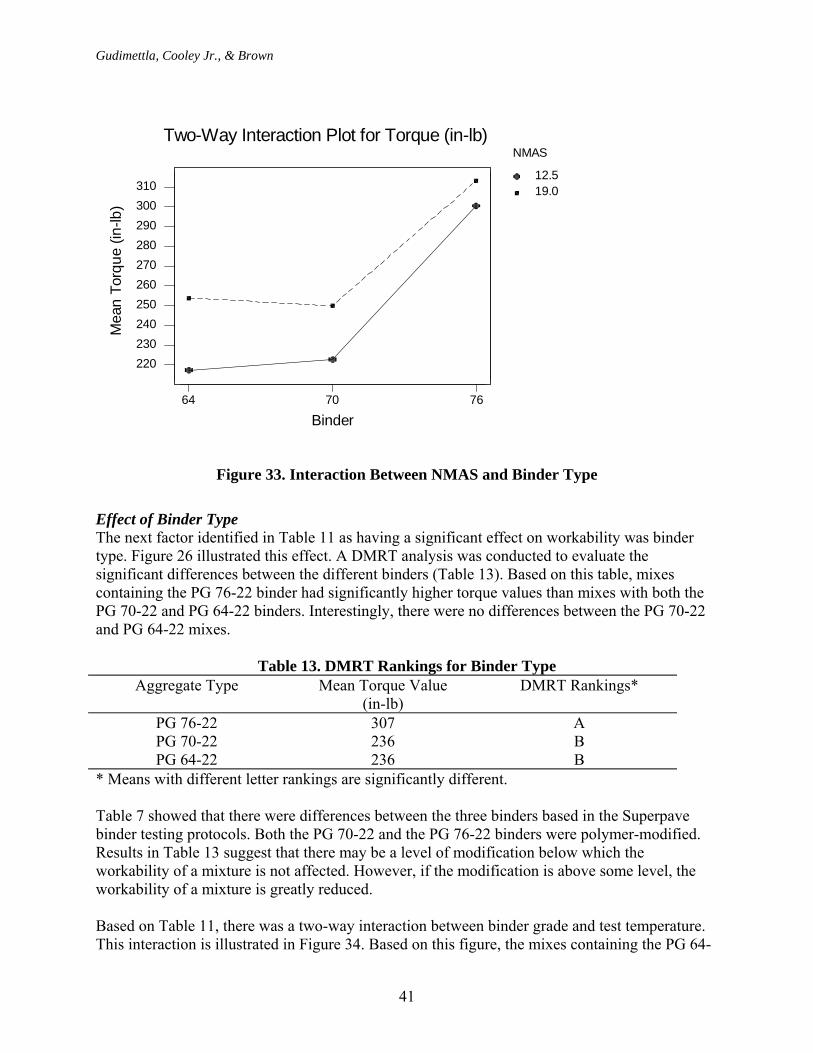
Figure 33 shows the interaction between NMAS and binder type. Based on this figure, there was a greater difference in torque between the two NMAS mixes containing the PG 64-22 than for mixes containing the PG 76-22. This would suggest that NMAS has a greater influence on workability when unmodified binders are utilized.
Gudimettla, Cooley Jr., & Brown
41
12.5 19.0
767064
310300290280270260250240230220
Binder
NMAS
Mea
n To
rque
(in-
lb)
Two-Way Interaction Plot for Torque (in-lb)
Figure 33. Interaction Between NMAS and Binder Type
Effect of Binder Type The next factor identified in Table 11 as having a significant effect on workability was binder type. Figure 26 illustrated this effect. A DMRT analysis was conducted to evaluate the significant differences between the different binders (Table 13). Based on this table, mixes containing the PG 76-22 binder had significantly higher torque values than mixes with both the PG 70-22 and PG 64-22 binders. Interestingly, there were no differences between the PG 70-22 and PG 64-22 mixes.
Table 13. DMRT Rankings for Binder Type Aggregate Type Mean Torque Value
(in-lb) DMRT Rankings*
PG 76-22 307 A PG 70-22 236 B PG 64-22 236 B
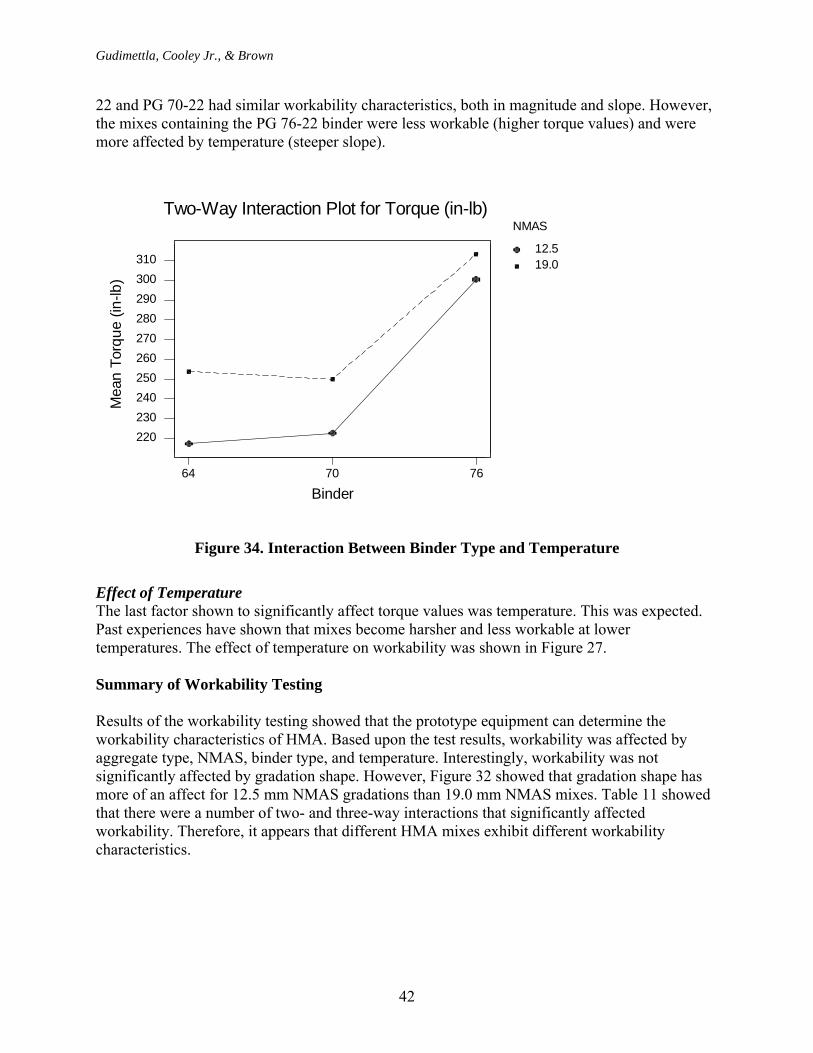
* Means with different letter rankings are significantly different. Table 7 showed that there were differences between the three binders based in the Superpave binder testing protocols. Both the PG 70-22 and the PG 76-22 binders were polymer-modified. Results in Table 13 suggest that there may be a level of modification below which the workability of a mixture is not affected. However, if the modification is above some level, the workability of a mixture is greatly reduced. Based on Table 11, there was a two-way interaction between binder grade and test temperature. This interaction is illustrated in Figure 34. Based on this figure, the mixes containing the PG 64-
Gudimettla, Cooley Jr., & Brown
42
22 and PG 70-22 had similar workability characteristics, both in magnitude and slope. However, the mixes containing the PG 76-22 binder were less workable (higher torque values) and were more affected by temperature (steeper slope).
12.5 19.0
767064
310300290280270260250240230220
Binder
NMAS
Mea
n To
rque
(in-
lb)
Two-Way Interaction Plot for Torque (in-lb)
Figure 34. Interaction Between Binder Type and Temperature
Effect of Temperature The last factor shown to significantly affect torque values was temperature. This was expected. Past experiences have shown that mixes become harsher and less workable at lower temperatures. The effect of temperature on workability was shown in Figure 27. Summary of Workability Testing Results of the workability testing showed that the prototype equipment can determine the workability characteristics of HMA. Based upon the test results, workability was affected by aggregate type, NMAS, binder type, and temperature. Interestingly, workability was not significantly affected by gradation shape. However, Figure 32 showed that gradation shape has more of an affect for 12.5 mm NMAS gradations than 19.0 mm NMAS mixes. Table 11 showed that there were a number of two- and three-way interactions that significantly affected workability. Therefore, it appears that different HMA mixes exhibit different workability characteristics.
Gudimettla, Cooley Jr., & Brown
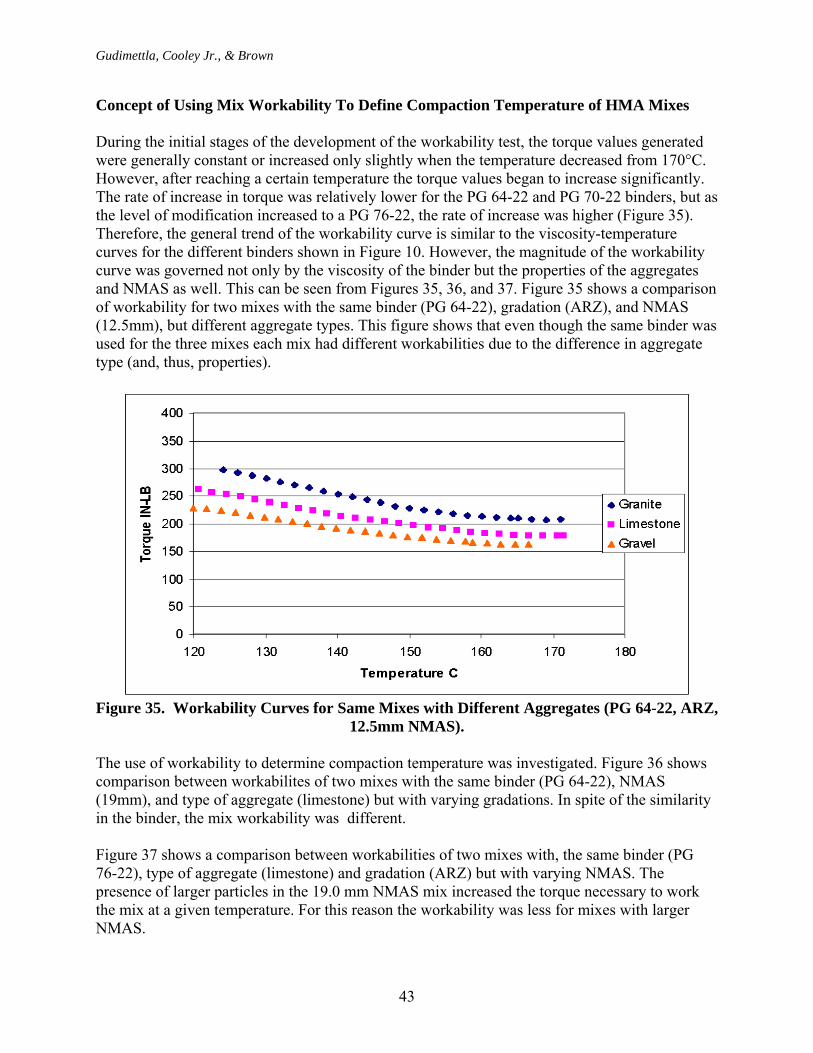
43
Concept of Using Mix Workability To Define Compaction Temperature of HMA Mixes During the initial stages of the development of the workability test, the torque values generated were generally constant or increased only slightly when the temperature decreased from 170°C. However, after reaching a certain temperature the torque values began to increase significantly. The rate of increase in torque was relatively lower for the PG 64-22 and PG 70-22 binders, but as the level of modification increased to a PG 76-22, the rate of increase was higher (Figure 35). Therefore, the general trend of the workability curve is similar to the viscosity-temperature curves for the different binders shown in Figure 10. However, the magnitude of the workability curve was governed not only by the viscosity of the binder but the properties of the aggregates and NMAS as well. This can be seen from Figures 35, 36, and 37. Figure 35 shows a comparison of workability for two mixes with the same binder (PG 64-22), gradation (ARZ), and NMAS (12.5mm), but different aggregate types. This figure shows that even though the same binder was used for the three mixes each mix had different workabilities due to the difference in aggregate type (and, thus, properties).
Figure 35. Workability Curves for Same Mixes with Different Aggregates (PG 64-22, ARZ,
12.5mm NMAS).
The use of workability to determine compaction temperature was investigated. Figure 36 shows comparison between workabilites of two mixes with the same binder (PG 64-22), NMAS (19mm), and type of aggregate (limestone) but with varying gradations. In spite of the similarity in the binder, the mix workability was different. Figure 37 shows a comparison between workabilities of two mixes with, the same binder (PG 76-22), type of aggregate (limestone) and gradation (ARZ) but with varying NMAS. The presence of larger particles in the 19.0 mm NMAS mix increased the torque necessary to work the mix at a given temperature. For this reason the workability was less for mixes with larger NMAS.
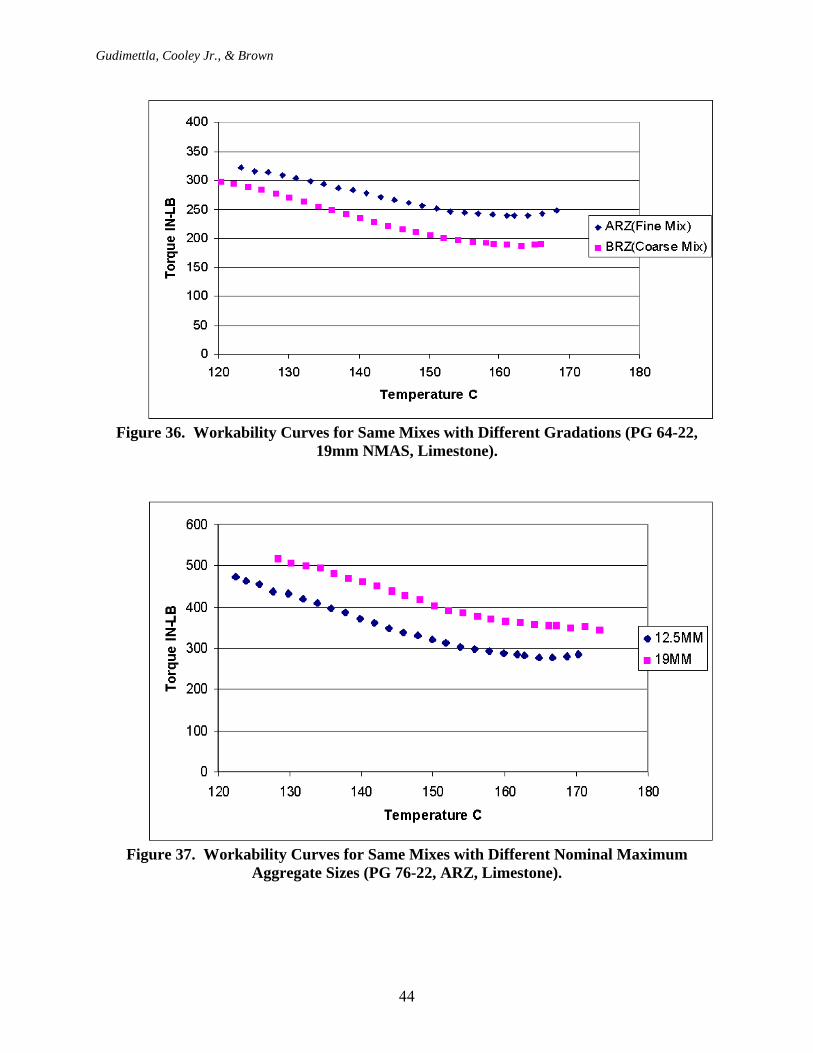
Gudimettla, Cooley Jr., & Brown
44
Figure 36. Workability Curves for Same Mixes with Different Gradations (PG 64-22,
19mm NMAS, Limestone).
Figure 37. Workability Curves for Same Mixes with Different Nominal Maximum
Aggregate Sizes (PG 76-22, ARZ, Limestone).
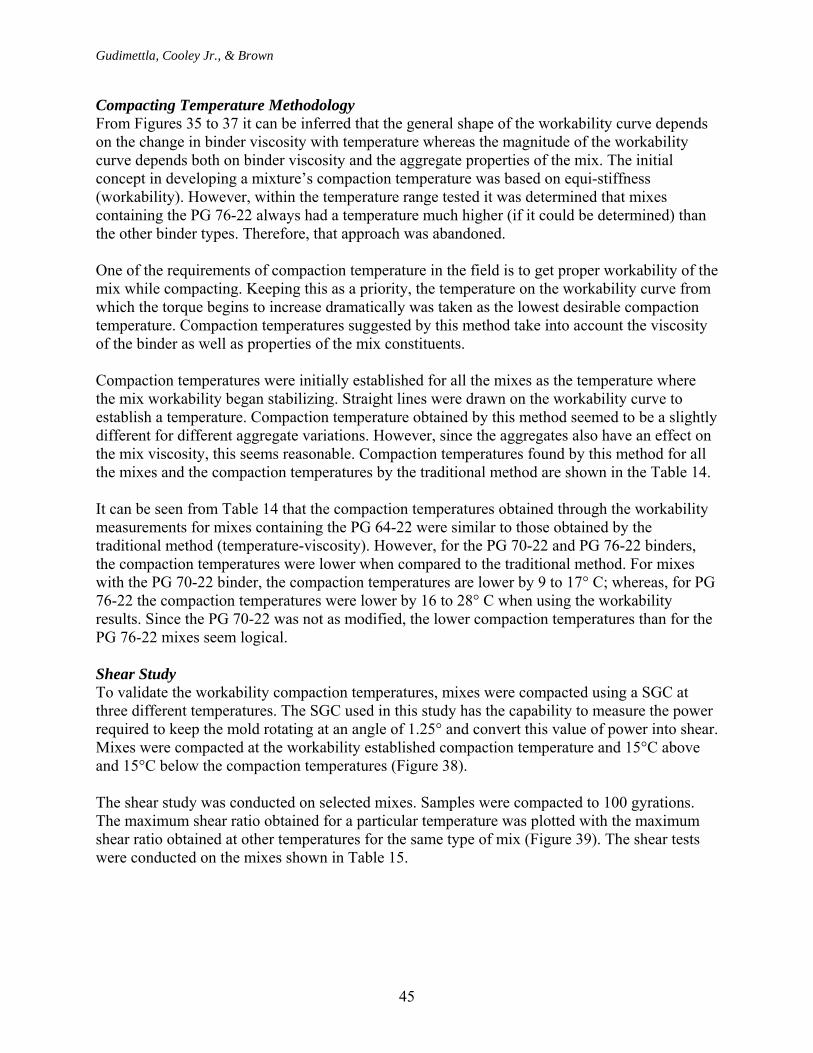
Gudimettla, Cooley Jr., & Brown
45
Compacting Temperature Methodology From Figures 35 to 37 it can be inferred that the general shape of the workability curve depends on the change in binder viscosity with temperature whereas the magnitude of the workability curve depends both on binder viscosity and the aggregate properties of the mix. The initial concept in developing a mixture’s compaction temperature was based on equi-stiffness (workability). However, within the temperature range tested it was determined that mixes containing the PG 76-22 always had a temperature much higher (if it could be determined) than the other binder types. Therefore, that approach was abandoned. One of the requirements of compaction temperature in the field is to get proper workability of the mix while compacting. Keeping this as a priority, the temperature on the workability curve from which the torque begins to increase dramatically was taken as the lowest desirable compaction temperature. Compaction temperatures suggested by this method take into account the viscosity of the binder as well as properties of the mix constituents. Compaction temperatures were initially established for all the mixes as the temperature where the mix workability began stabilizing. Straight lines were drawn on the workability curve to establish a temperature. Compaction temperature obtained by this method seemed to be a slightly different for different aggregate variations. However, since the aggregates also have an effect on the mix viscosity, this seems reasonable. Compaction temperatures found by this method for all the mixes and the compaction temperatures by the traditional method are shown in the Table 14.
It can be seen from Table 14 that the compaction temperatures obtained through the workability measurements for mixes containing the PG 64-22 were similar to those obtained by the traditional method (temperature-viscosity). However, for the PG 70-22 and PG 76-22 binders, the compaction temperatures were lower when compared to the traditional method. For mixes with the PG 70-22 binder, the compaction temperatures are lower by 9 to 17° C; whereas, for PG 76-22 the compaction temperatures were lower by 16 to 28° C when using the workability results. Since the PG 70-22 was not as modified, the lower compaction temperatures than for the PG 76-22 mixes seem logical. Shear Study To validate the workability compaction temperatures, mixes were compacted using a SGC at three different temperatures. The SGC used in this study has the capability to measure the power required to keep the mold rotating at an angle of 1.25° and convert this value of power into shear. Mixes were compacted at the workability established compaction temperature and 15°C above and 15°C below the compaction temperatures (Figure 38). The shear study was conducted on selected mixes. Samples were compacted to 100 gyrations. The maximum shear ratio obtained for a particular temperature was plotted with the maximum shear ratio obtained at other temperatures for the same type of mix (Figure 39). The shear tests were conducted on the mixes shown in Table 15.
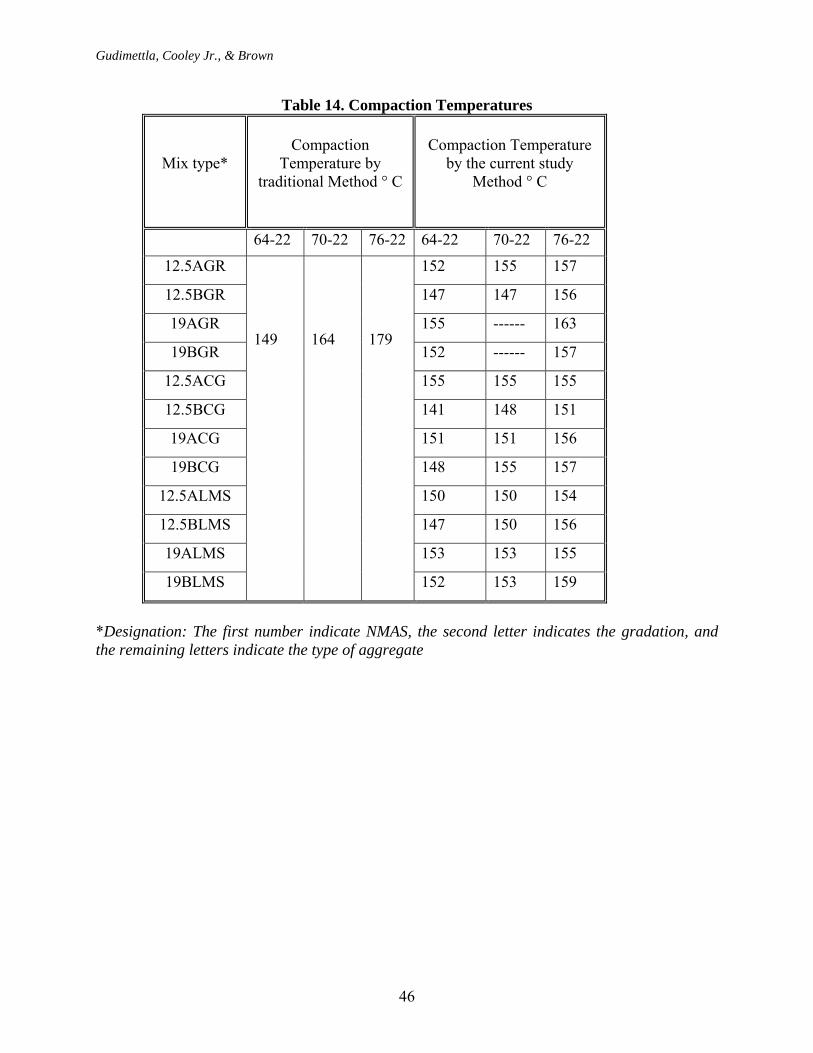
Gudimettla, Cooley Jr., & Brown
46
Table 14. Compaction Temperatures
*Designation: The first number indicate NMAS, the second letter indicates the gradation, and the remaining letters indicate the type of aggregate
Mix type*
Compaction
Temperature by traditional Method ° C
Compaction Temperature
by the current study Method ° C
64-22 70-22 76-22 64-22 70-22 76-22
12.5AGR 152 155 157
12.5BGR 147 147 156
19AGR 155 ------ 163
19BGR 152 ------ 157
12.5ACG 155 155 155
12.5BCG 141 148 151
19ACG 151 151 156
19BCG 148 155 157
12.5ALMS 150 150 154
12.5BLMS 147 150 156
19ALMS 153 153 155
19BLMS
149
164
179
152 153 159
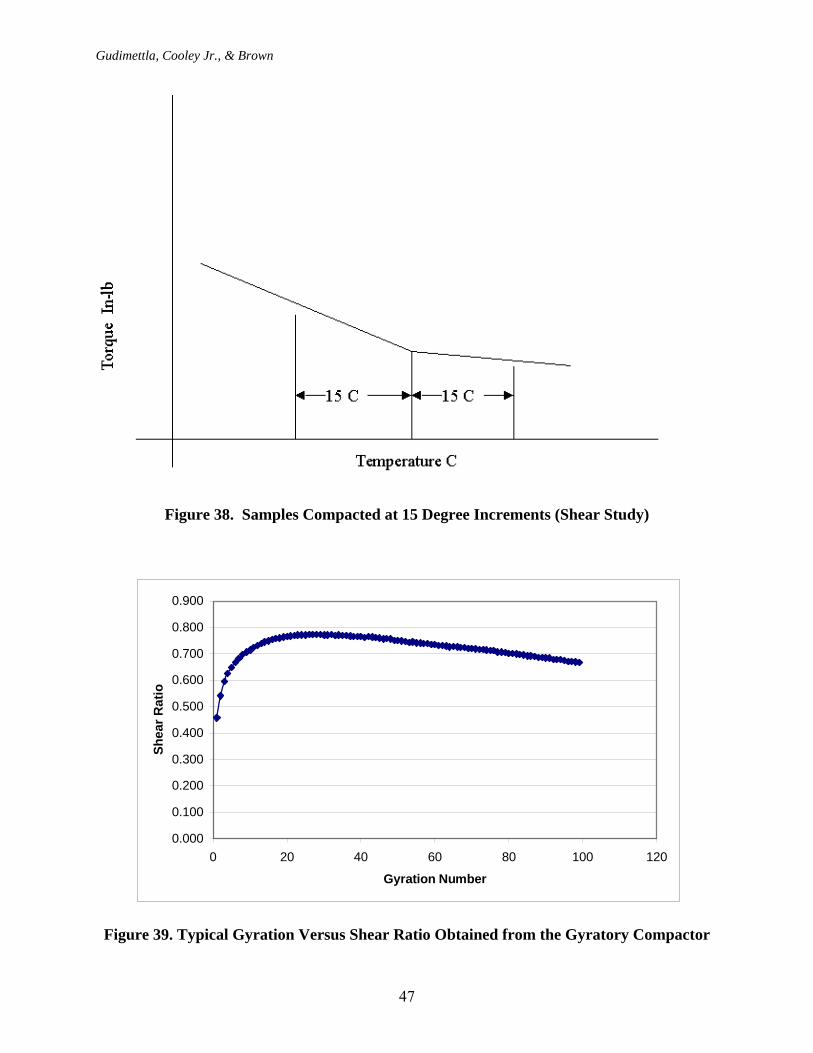
Gudimettla, Cooley Jr., & Brown
47
Figure 38. Samples Compacted at 15 Degree Increments (Shear Study)
Figure 39. Typical Gyration Versus Shear Ratio Obtained from the Gyratory Compactor
0.000
0.100
0.200
0.300
0.400
0.500
0.600
0.700
0.800
0.900
0 20 40 60 80 100 120
Gyration Number
Shea
r Rat
io
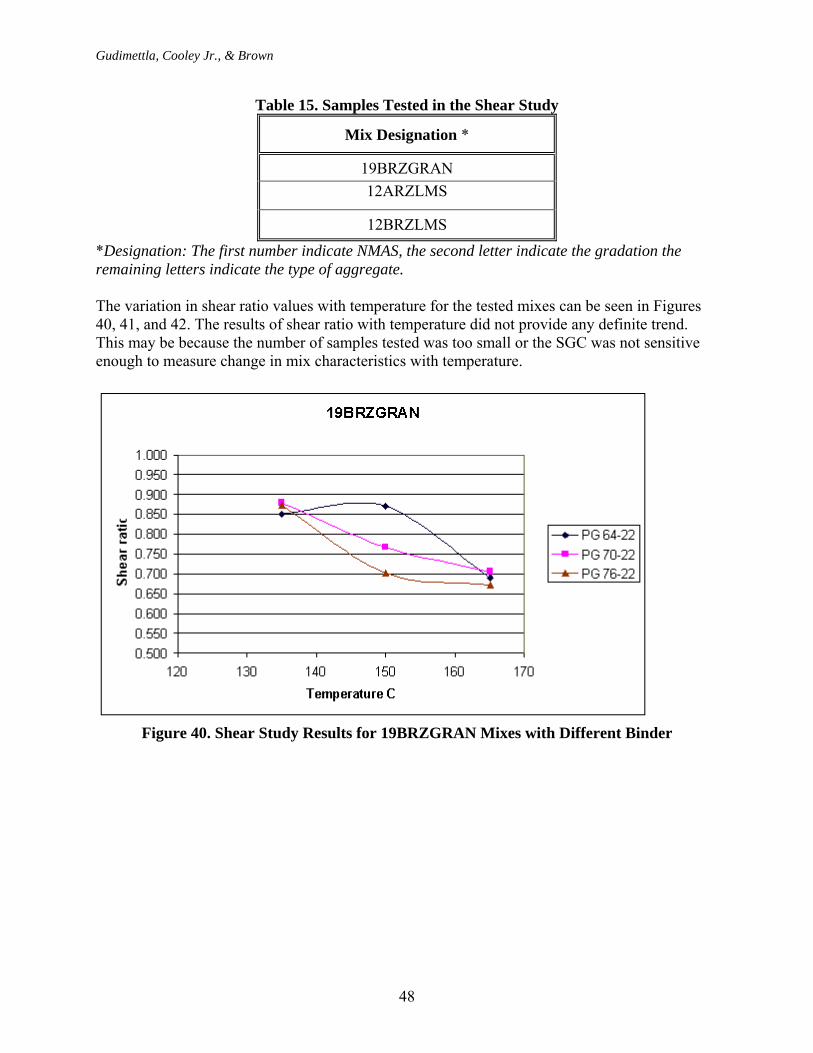
Gudimettla, Cooley Jr., & Brown
48
Table 15. Samples Tested in the Shear Study
Mix Designation *
19BRZGRAN 12ARZLMS
12BRZLMS *Designation: The first number indicate NMAS, the second letter indicate the gradation the remaining letters indicate the type of aggregate. The variation in shear ratio values with temperature for the tested mixes can be seen in Figures 40, 41, and 42. The results of shear ratio with temperature did not provide any definite trend. This may be because the number of samples tested was too small or the SGC was not sensitive enough to measure change in mix characteristics with temperature.
Figure 40. Shear Study Results for 19BRZGRAN Mixes with Different Binder
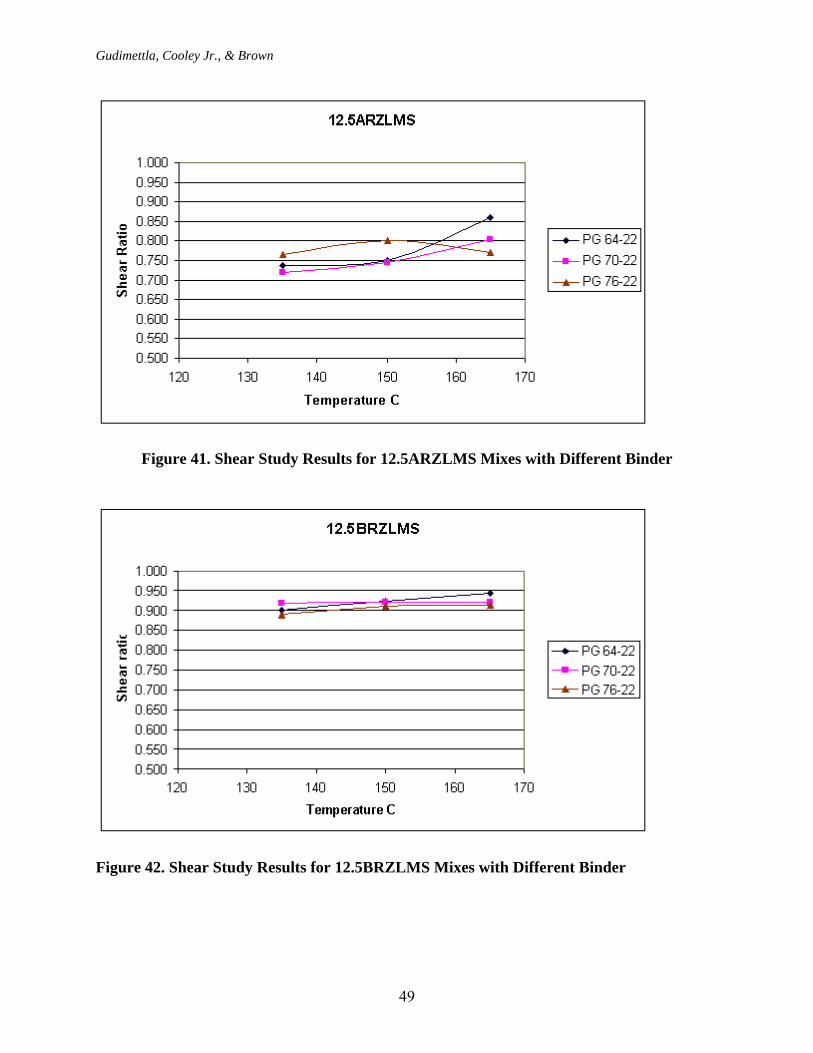
Gudimettla, Cooley Jr., & Brown
49
Figure 41. Shear Study Results for 12.5ARZLMS Mixes with Different Binder
Figure 42. Shear Study Results for 12.5BRZLMS Mixes with Different Binder
Gudimettla, Cooley Jr., & Brown
50
Based on recent research reported, subsequent to the beginning of this study, by the Asphalt Institute (16), the outcome of the gyratory shear experiment was not surprising. Within their research, gyratory shear results were compared to the rutting potential of mixes. However, during the course of the work, it was shown that gyratory shear was not sensitive to binder grade. Therefore, the gyratory shear ratio was not sensitive to the viscosity of binders as temperatures were changed. CONCLUSIONS AND RECOMMENDATIONS The primary objective of this study was to develop a device to measure the workability of hot mix asphalt (HMA) mixes. Workability was used in this study to describe the ease with which a HMA could be constructed. The workability of mixes was evaluated by pushing a paddle through HMA and measuring the torque required to maintain a given rate of revolution. Based on the test results and analyses conducted in this study, the following conclusions are provided:
• A device was successfully designed to measure the laboratory workability of HMA mixes.
• The workability of HMA as measured by the device was affected by aggregate type, and, thus, aggregate properties. Mixes prepared with a cubical, angular granite were less workable (generated more torque at a given temperature) than mixes prepared with a semi-angular crushed gravel.
• The workability of HMA as measured by the device was affected by the nominal maximum aggregate size (NMAS) of the gradation. As NMAS increased for a given aggregate type, gradation shape, and binder type, workability decreased.
• Gradation shape did not have a significant effect on workability. However, there were numerous two- and three-way interactions which were significant that included gradation shape.
• Binder type significantly affected the workability of mixes. As expected, mixes modified to meet a PG 76-22 were significantly less workable than mixes containing an unmodified PG 64-22 for a given temperature.
• As expected, the temperature of the mix significantly affected the workability of HMA. There was a relationship between workability and temperature that showed increased workability at higher temperatures.
• A preliminary attempt was made at utilizing workability data to determine a realistic compaction temperature of HMA mixes. However, this was a limited effort and the results were inconclusive.
One of the important issues in the HMA industry is the compactibility of mixes. This concern has become more pronounced due to the increased use of coarse-graded mixes and/or the increased use of polymer-modified binders (mixes with low workability). Compactibility of HMA is related to workability; therefore, the conclusions of this study were important in that the workability of HMA mixes was successfully characterized and that the prototype device could differentiate between different mix characteristics. Since the workability of HMA mixes can be measured, future work should be conducted to develop the relationship between workability and compactibility.
Gudimettla, Cooley Jr., & Brown
51
Prior to future research with the workability device, there should be some minor refinements of the prototype device. Specific areas needing refinement include the design of the paddle and sample container to minimize the amount of aggregates being caught between the paddle and container side. A next generation device should also include an additional temperature sensor to provide a better measure of temperature. The data acquisition system should also be enhanced prior to additional study with the device. The prototype acquisition system output 48 data points per second. The next generation device should be able to better average results to minimize noise within the data. Finally, re-engineering of the equipment is needed to make the device more user friendly. Testing within future research should involve mixes with a wide range in compactibility. Field produced HMA mixture should be tested in the workability device and then the compactibility in the field monitored. Monitoring of compactibility would entail fully documenting mix properties, thickness, and roller types/patterns along with mat temperature. Changes in density between roller passes should also be monitored using a nondestructive method to evaluate relative changes in density.
The relationship between compactibility and workability for the field mixes would likely result in guidance on the difficulty of compacting a particular mix on the roadway. As an example, four ranges of stiffness (workability) could be developed to provide guidance on the field compactive effort needed to achieve a desirable density (Table 16). Both temperature and stiffness would be tied to the guidance provided. As shown within this study, a given mix has a relationship between stiffness and temperature. If a particular mix had a given stiffness at 140°C and was categorized as difficult to achieve a desirable density, then at 150°C the stiffness might be such that it would fall in the “normal compactibility” category. Therefore, by increasing the temperature of the mix by 10°C on the roadway, additional rollers would not be necessary to achieve a desirable density. Development of guidance categories similar to that shown in Table 16 could be a great benefit to the HMA industry.
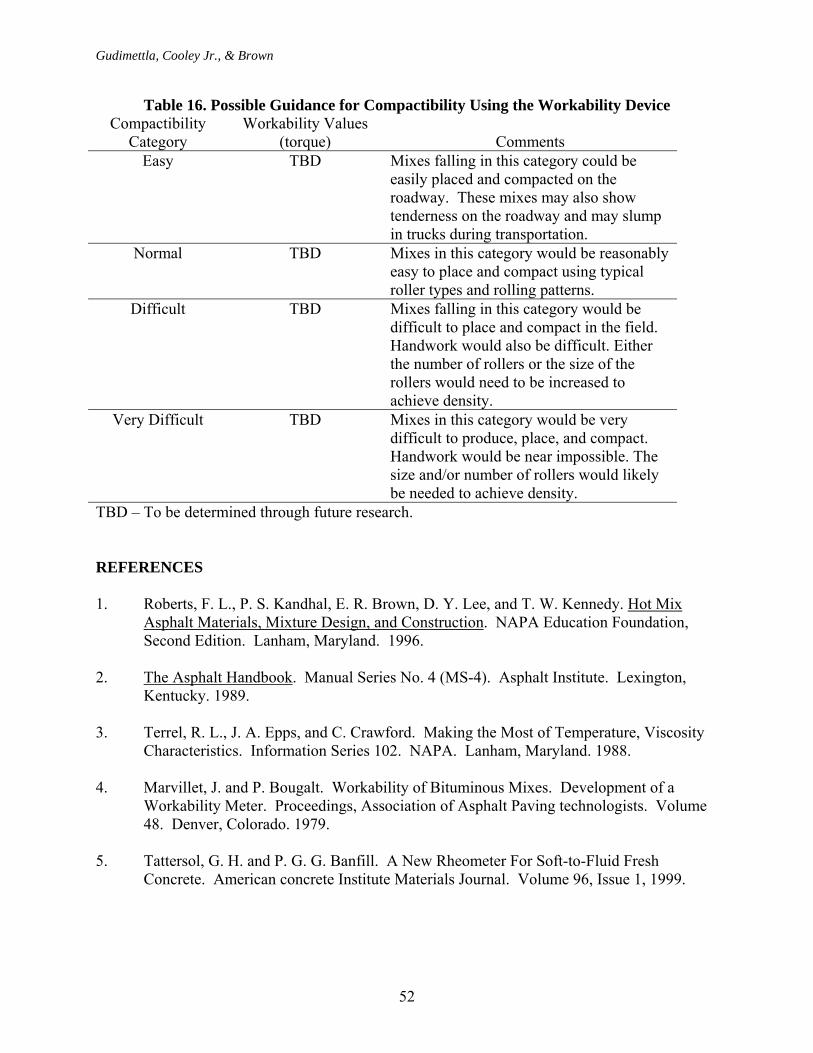
Gudimettla, Cooley Jr., & Brown
52
Table 16. Possible Guidance for Compactibility Using the Workability Device Compactibility
Category Workability Values
(torque) Comments Easy TBD Mixes falling in this category could be
easily placed and compacted on the roadway. These mixes may also show tenderness on the roadway and may slump in trucks during transportation.
Normal TBD Mixes in this category would be reasonably easy to place and compact using typical roller types and rolling patterns.
Difficult TBD Mixes falling in this category would be difficult to place and compact in the field. Handwork would also be difficult. Either the number of rollers or the size of the rollers would need to be increased to achieve density.
Very Difficult TBD Mixes in this category would be very difficult to produce, place, and compact. Handwork would be near impossible. The size and/or number of rollers would likely be needed to achieve density.
TBD – To be determined through future research.
REFERENCES 1. Roberts, F. L., P. S. Kandhal, E. R. Brown, D. Y. Lee, and T. W. Kennedy. Hot Mix
Asphalt Materials, Mixture Design, and Construction. NAPA Education Foundation, Second Edition. Lanham, Maryland. 1996.
2. The Asphalt Handbook. Manual Series No. 4 (MS-4). Asphalt Institute. Lexington,
Kentucky. 1989. 3. Terrel, R. L., J. A. Epps, and C. Crawford. Making the Most of Temperature, Viscosity
Characteristics. Information Series 102. NAPA. Lanham, Maryland. 1988. 4. Marvillet, J. and P. Bougalt. Workability of Bituminous Mixes. Development of a
Workability Meter. Proceedings, Association of Asphalt Paving technologists. Volume 48. Denver, Colorado. 1979.
5. Tattersol, G. H. and P. G. G. Banfill. A New Rheometer For Soft-to-Fluid Fresh
Concrete. American concrete Institute Materials Journal. Volume 96, Issue 1, 1999.
Gudimettla, Cooley Jr., & Brown
53
6. Bahia, H. U., W. P. Hislop, H. Zhai, and A. Rangel. Classification of Asphalt Binders into Simple and Complex Binders. Journal of the Association of Asphalt Paving Technologists. Boston, Massachusetts. 1998.
7. Hensley, J. and A. Palmer. Establishing Hot Mix Asphalt Mixing and Compaction
Temperatures At the Project Level. http://www.asphaltinstitute.org/superpav/temperature/html. Asphalt Institute. September 20, 2002
8. Watson, D. E. An Updated Review of SMA and Superpave Projects. Paper Submitted
For Presentation and Publication at the 2003 Annual Meeting of the Transportation Research Board. Washington, D. C. January 2003.
9. Mix Design Methods for Asphalt Concrete and Other Hot-Mix Types. Manual Series
No. 1. Asphalt Institute. 1962. 10. Mix Design Methods for Asphalt Concrete and Other Hot-Mix Types. Manual Series
No. 2. Asphalt Institute. 1974. 11. Yildrim, Y., M. Solaimanian, and T. Kennedy. Mixing and Compaction Temperatures
for Superpave Mixes. Journal of the Association of Asphalt Paving Technologists. Vol. 69. Reno, Nevada. 2000.
12. DeSombre, R., D. E. Newcomb, B. Chadbourn, and V. Voller. Parameters to Define the
Laboratory Compaction Temperature Range of Hot Mix Asphalt. Journal of the Association of Asphalt Paving Technologists. Volume 67, Boston, Massachusetts. 1998.
13. Montgomery, D. C. Design and Analysis of Experiments. Fifth Edition. John Wiley &
Sons, Inc. New York, New York. 2001. 14. Anderson, R. M. Relationship Between Superpave Gyratory Compaction Properties on
the Rutting Potential of Asphalt Mixes. Presented at the Annual Meeting of the Association of Asphalt Paving Technologists. Colorado Springs, Colorado. March 2002 (to be published in Vol. 71).

Gudimettla, Cooley Jr., & Brown
54
APPENDIX A
Raw Workability Data From Task 4
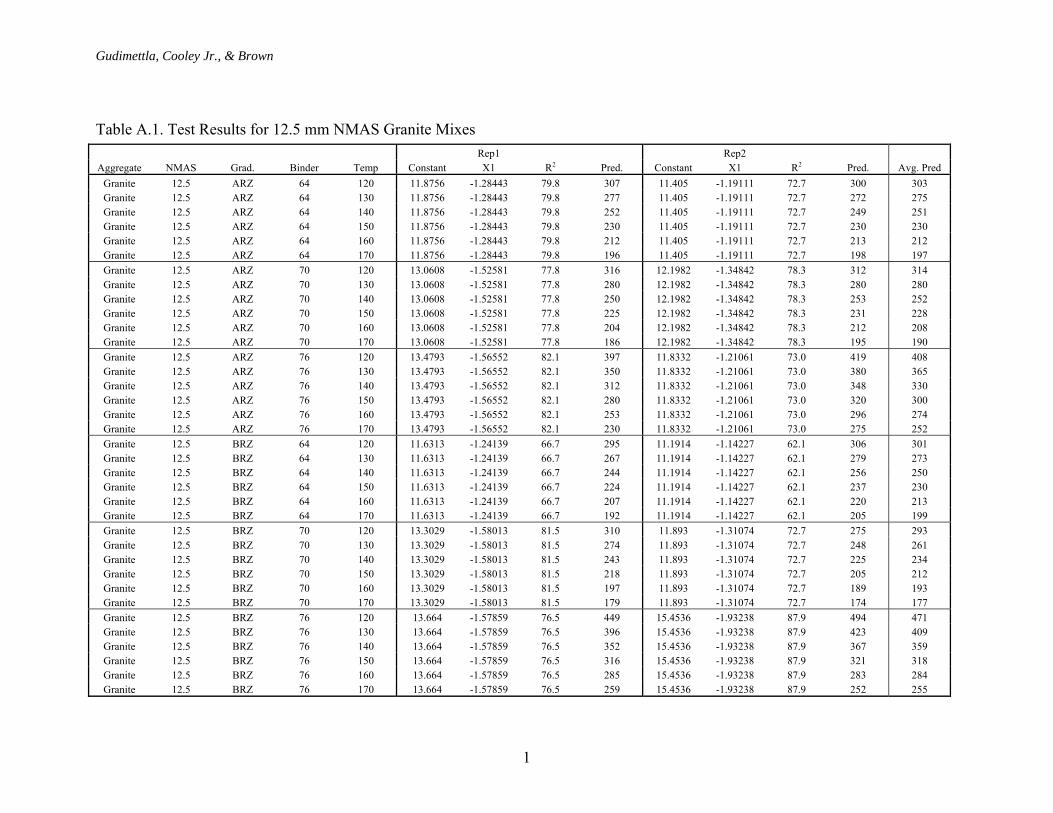
Gudimettla, Cooley Jr., & Brown
1
Table A.1. Test Results for 12.5 mm NMAS Granite Mixes Rep1 Rep2
Aggregate NMAS Grad. Binder Temp Constant X1 R2 Pred. Constant X1 R2 Pred. Avg. Pred Granite 12.5 ARZ 64 120 11.8756 -1.28443 79.8 307 11.405 -1.19111 72.7 300 303 Granite 12.5 ARZ 64 130 11.8756 -1.28443 79.8 277 11.405 -1.19111 72.7 272 275 Granite 12.5 ARZ 64 140 11.8756 -1.28443 79.8 252 11.405 -1.19111 72.7 249 251 Granite 12.5 ARZ 64 150 11.8756 -1.28443 79.8 230 11.405 -1.19111 72.7 230 230 Granite 12.5 ARZ 64 160 11.8756 -1.28443 79.8 212 11.405 -1.19111 72.7 213 212 Granite 12.5 ARZ 64 170 11.8756 -1.28443 79.8 196 11.405 -1.19111 72.7 198 197 Granite 12.5 ARZ 70 120 13.0608 -1.52581 77.8 316 12.1982 -1.34842 78.3 312 314 Granite 12.5 ARZ 70 130 13.0608 -1.52581 77.8 280 12.1982 -1.34842 78.3 280 280 Granite 12.5 ARZ 70 140 13.0608 -1.52581 77.8 250 12.1982 -1.34842 78.3 253 252 Granite 12.5 ARZ 70 150 13.0608 -1.52581 77.8 225 12.1982 -1.34842 78.3 231 228 Granite 12.5 ARZ 70 160 13.0608 -1.52581 77.8 204 12.1982 -1.34842 78.3 212 208 Granite 12.5 ARZ 70 170 13.0608 -1.52581 77.8 186 12.1982 -1.34842 78.3 195 190 Granite 12.5 ARZ 76 120 13.4793 -1.56552 82.1 397 11.8332 -1.21061 73.0 419 408 Granite 12.5 ARZ 76 130 13.4793 -1.56552 82.1 350 11.8332 -1.21061 73.0 380 365 Granite 12.5 ARZ 76 140 13.4793 -1.56552 82.1 312 11.8332 -1.21061 73.0 348 330 Granite 12.5 ARZ 76 150 13.4793 -1.56552 82.1 280 11.8332 -1.21061 73.0 320 300 Granite 12.5 ARZ 76 160 13.4793 -1.56552 82.1 253 11.8332 -1.21061 73.0 296 274 Granite 12.5 ARZ 76 170 13.4793 -1.56552 82.1 230 11.8332 -1.21061 73.0 275 252 Granite 12.5 BRZ 64 120 11.6313 -1.24139 66.7 295 11.1914 -1.14227 62.1 306 301 Granite 12.5 BRZ 64 130 11.6313 -1.24139 66.7 267 11.1914 -1.14227 62.1 279 273 Granite 12.5 BRZ 64 140 11.6313 -1.24139 66.7 244 11.1914 -1.14227 62.1 256 250 Granite 12.5 BRZ 64 150 11.6313 -1.24139 66.7 224 11.1914 -1.14227 62.1 237 230 Granite 12.5 BRZ 64 160 11.6313 -1.24139 66.7 207 11.1914 -1.14227 62.1 220 213 Granite 12.5 BRZ 64 170 11.6313 -1.24139 66.7 192 11.1914 -1.14227 62.1 205 199 Granite 12.5 BRZ 70 120 13.3029 -1.58013 81.5 310 11.893 -1.31074 72.7 275 293 Granite 12.5 BRZ 70 130 13.3029 -1.58013 81.5 274 11.893 -1.31074 72.7 248 261 Granite 12.5 BRZ 70 140 13.3029 -1.58013 81.5 243 11.893 -1.31074 72.7 225 234 Granite 12.5 BRZ 70 150 13.3029 -1.58013 81.5 218 11.893 -1.31074 72.7 205 212 Granite 12.5 BRZ 70 160 13.3029 -1.58013 81.5 197 11.893 -1.31074 72.7 189 193 Granite 12.5 BRZ 70 170 13.3029 -1.58013 81.5 179 11.893 -1.31074 72.7 174 177 Granite 12.5 BRZ 76 120 13.664 -1.57859 76.5 449 15.4536 -1.93238 87.9 494 471 Granite 12.5 BRZ 76 130 13.664 -1.57859 76.5 396 15.4536 -1.93238 87.9 423 409 Granite 12.5 BRZ 76 140 13.664 -1.57859 76.5 352 15.4536 -1.93238 87.9 367 359 Granite 12.5 BRZ 76 150 13.664 -1.57859 76.5 316 15.4536 -1.93238 87.9 321 318 Granite 12.5 BRZ 76 160 13.664 -1.57859 76.5 285 15.4536 -1.93238 87.9 283 284 Granite 12.5 BRZ 76 170 13.664 -1.57859 76.5 259 15.4536 -1.93238 87.9 252 255
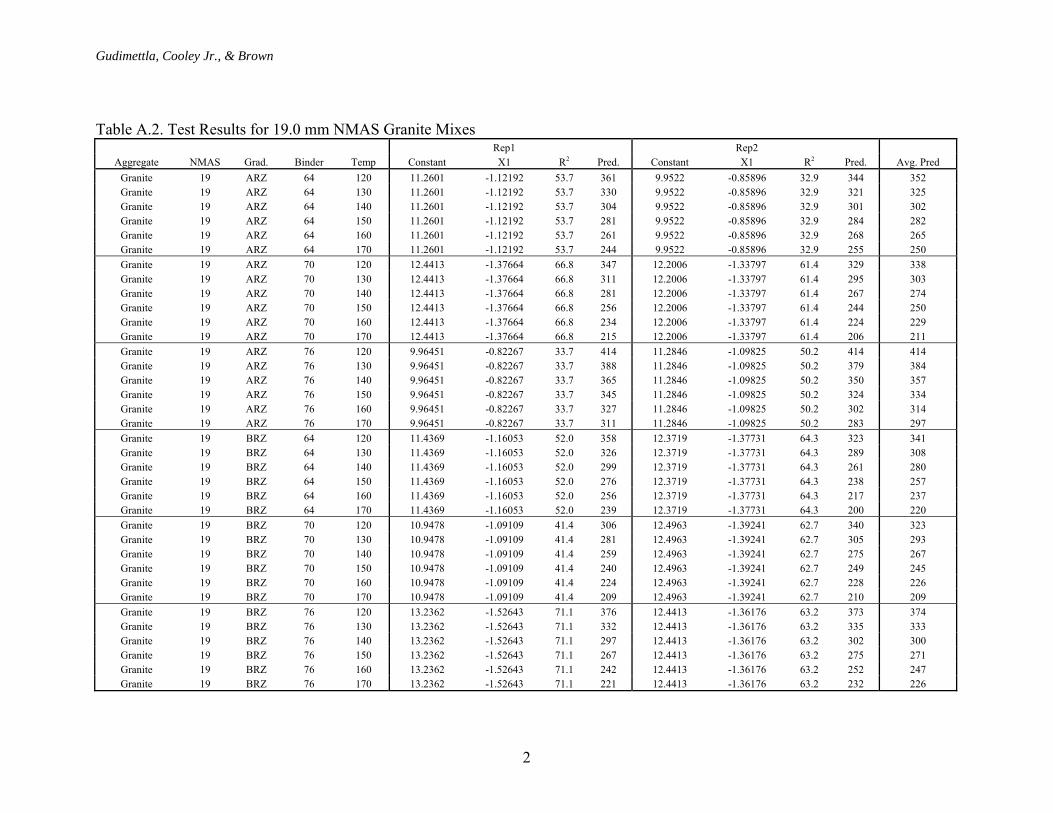
Gudimettla, Cooley Jr., & Brown
2
Table A.2. Test Results for 19.0 mm NMAS Granite Mixes Rep1 Rep2
Aggregate NMAS Grad. Binder Temp Constant X1 R2 Pred. Constant X1 R2 Pred. Avg. Pred Granite 19 ARZ 64 120 11.2601 -1.12192 53.7 361 9.9522 -0.85896 32.9 344 352 Granite 19 ARZ 64 130 11.2601 -1.12192 53.7 330 9.9522 -0.85896 32.9 321 325 Granite 19 ARZ 64 140 11.2601 -1.12192 53.7 304 9.9522 -0.85896 32.9 301 302 Granite 19 ARZ 64 150 11.2601 -1.12192 53.7 281 9.9522 -0.85896 32.9 284 282 Granite 19 ARZ 64 160 11.2601 -1.12192 53.7 261 9.9522 -0.85896 32.9 268 265 Granite 19 ARZ 64 170 11.2601 -1.12192 53.7 244 9.9522 -0.85896 32.9 255 250 Granite 19 ARZ 70 120 12.4413 -1.37664 66.8 347 12.2006 -1.33797 61.4 329 338 Granite 19 ARZ 70 130 12.4413 -1.37664 66.8 311 12.2006 -1.33797 61.4 295 303 Granite 19 ARZ 70 140 12.4413 -1.37664 66.8 281 12.2006 -1.33797 61.4 267 274 Granite 19 ARZ 70 150 12.4413 -1.37664 66.8 256 12.2006 -1.33797 61.4 244 250 Granite 19 ARZ 70 160 12.4413 -1.37664 66.8 234 12.2006 -1.33797 61.4 224 229 Granite 19 ARZ 70 170 12.4413 -1.37664 66.8 215 12.2006 -1.33797 61.4 206 211 Granite 19 ARZ 76 120 9.96451 -0.82267 33.7 414 11.2846 -1.09825 50.2 414 414 Granite 19 ARZ 76 130 9.96451 -0.82267 33.7 388 11.2846 -1.09825 50.2 379 384 Granite 19 ARZ 76 140 9.96451 -0.82267 33.7 365 11.2846 -1.09825 50.2 350 357 Granite 19 ARZ 76 150 9.96451 -0.82267 33.7 345 11.2846 -1.09825 50.2 324 334 Granite 19 ARZ 76 160 9.96451 -0.82267 33.7 327 11.2846 -1.09825 50.2 302 314 Granite 19 ARZ 76 170 9.96451 -0.82267 33.7 311 11.2846 -1.09825 50.2 283 297 Granite 19 BRZ 64 120 11.4369 -1.16053 52.0 358 12.3719 -1.37731 64.3 323 341 Granite 19 BRZ 64 130 11.4369 -1.16053 52.0 326 12.3719 -1.37731 64.3 289 308 Granite 19 BRZ 64 140 11.4369 -1.16053 52.0 299 12.3719 -1.37731 64.3 261 280 Granite 19 BRZ 64 150 11.4369 -1.16053 52.0 276 12.3719 -1.37731 64.3 238 257 Granite 19 BRZ 64 160 11.4369 -1.16053 52.0 256 12.3719 -1.37731 64.3 217 237 Granite 19 BRZ 64 170 11.4369 -1.16053 52.0 239 12.3719 -1.37731 64.3 200 220 Granite 19 BRZ 70 120 10.9478 -1.09109 41.4 306 12.4963 -1.39241 62.7 340 323 Granite 19 BRZ 70 130 10.9478 -1.09109 41.4 281 12.4963 -1.39241 62.7 305 293 Granite 19 BRZ 70 140 10.9478 -1.09109 41.4 259 12.4963 -1.39241 62.7 275 267 Granite 19 BRZ 70 150 10.9478 -1.09109 41.4 240 12.4963 -1.39241 62.7 249 245 Granite 19 BRZ 70 160 10.9478 -1.09109 41.4 224 12.4963 -1.39241 62.7 228 226 Granite 19 BRZ 70 170 10.9478 -1.09109 41.4 209 12.4963 -1.39241 62.7 210 209 Granite 19 BRZ 76 120 13.2362 -1.52643 71.1 376 12.4413 -1.36176 63.2 373 374 Granite 19 BRZ 76 130 13.2362 -1.52643 71.1 332 12.4413 -1.36176 63.2 335 333 Granite 19 BRZ 76 140 13.2362 -1.52643 71.1 297 12.4413 -1.36176 63.2 302 300 Granite 19 BRZ 76 150 13.2362 -1.52643 71.1 267 12.4413 -1.36176 63.2 275 271 Granite 19 BRZ 76 160 13.2362 -1.52643 71.1 242 12.4413 -1.36176 63.2 252 247 Granite 19 BRZ 76 170 13.2362 -1.52643 71.1 221 12.4413 -1.36176 63.2 232 226
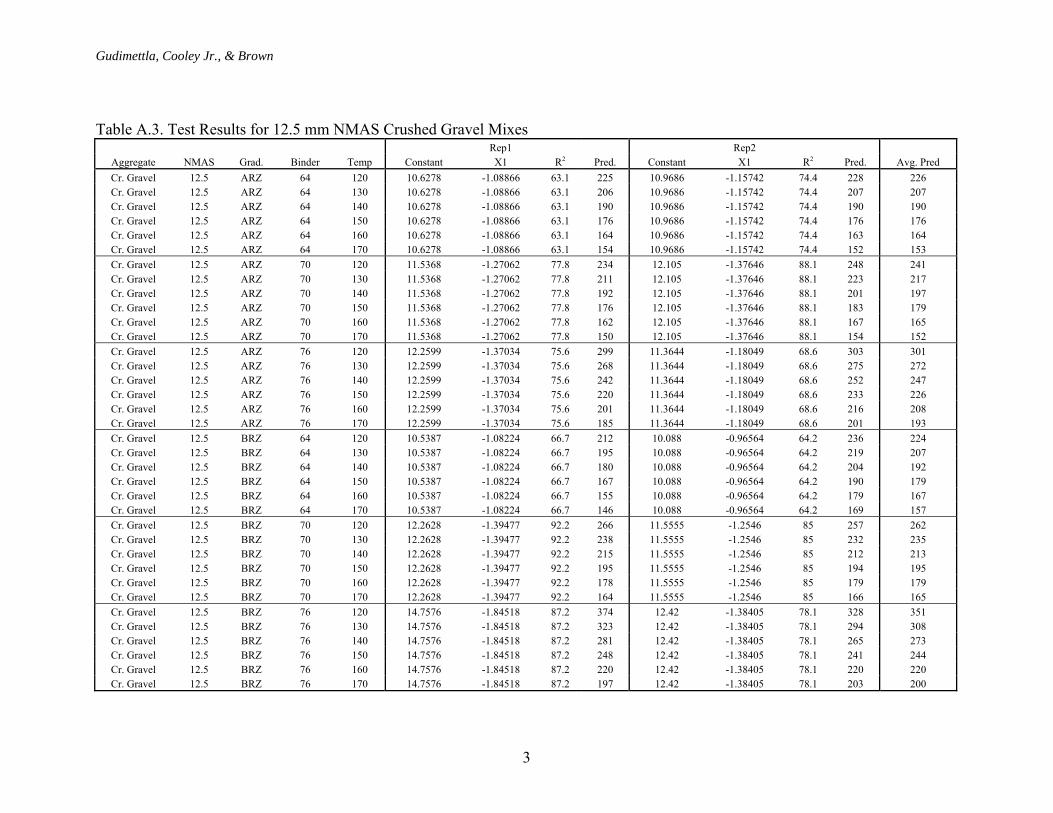
Gudimettla, Cooley Jr., & Brown
3
Table A.3. Test Results for 12.5 mm NMAS Crushed Gravel Mixes Rep1 Rep2
Aggregate NMAS Grad. Binder Temp Constant X1 R2 Pred. Constant X1 R2 Pred. Avg. Pred Cr. Gravel 12.5 ARZ 64 120 10.6278 -1.08866 63.1 225 10.9686 -1.15742 74.4 228 226 Cr. Gravel 12.5 ARZ 64 130 10.6278 -1.08866 63.1 206 10.9686 -1.15742 74.4 207 207 Cr. Gravel 12.5 ARZ 64 140 10.6278 -1.08866 63.1 190 10.9686 -1.15742 74.4 190 190 Cr. Gravel 12.5 ARZ 64 150 10.6278 -1.08866 63.1 176 10.9686 -1.15742 74.4 176 176 Cr. Gravel 12.5 ARZ 64 160 10.6278 -1.08866 63.1 164 10.9686 -1.15742 74.4 163 164 Cr. Gravel 12.5 ARZ 64 170 10.6278 -1.08866 63.1 154 10.9686 -1.15742 74.4 152 153 Cr. Gravel 12.5 ARZ 70 120 11.5368 -1.27062 77.8 234 12.105 -1.37646 88.1 248 241 Cr. Gravel 12.5 ARZ 70 130 11.5368 -1.27062 77.8 211 12.105 -1.37646 88.1 223 217 Cr. Gravel 12.5 ARZ 70 140 11.5368 -1.27062 77.8 192 12.105 -1.37646 88.1 201 197 Cr. Gravel 12.5 ARZ 70 150 11.5368 -1.27062 77.8 176 12.105 -1.37646 88.1 183 179 Cr. Gravel 12.5 ARZ 70 160 11.5368 -1.27062 77.8 162 12.105 -1.37646 88.1 167 165 Cr. Gravel 12.5 ARZ 70 170 11.5368 -1.27062 77.8 150 12.105 -1.37646 88.1 154 152 Cr. Gravel 12.5 ARZ 76 120 12.2599 -1.37034 75.6 299 11.3644 -1.18049 68.6 303 301 Cr. Gravel 12.5 ARZ 76 130 12.2599 -1.37034 75.6 268 11.3644 -1.18049 68.6 275 272 Cr. Gravel 12.5 ARZ 76 140 12.2599 -1.37034 75.6 242 11.3644 -1.18049 68.6 252 247 Cr. Gravel 12.5 ARZ 76 150 12.2599 -1.37034 75.6 220 11.3644 -1.18049 68.6 233 226 Cr. Gravel 12.5 ARZ 76 160 12.2599 -1.37034 75.6 201 11.3644 -1.18049 68.6 216 208 Cr. Gravel 12.5 ARZ 76 170 12.2599 -1.37034 75.6 185 11.3644 -1.18049 68.6 201 193 Cr. Gravel 12.5 BRZ 64 120 10.5387 -1.08224 66.7 212 10.088 -0.96564 64.2 236 224 Cr. Gravel 12.5 BRZ 64 130 10.5387 -1.08224 66.7 195 10.088 -0.96564 64.2 219 207 Cr. Gravel 12.5 BRZ 64 140 10.5387 -1.08224 66.7 180 10.088 -0.96564 64.2 204 192 Cr. Gravel 12.5 BRZ 64 150 10.5387 -1.08224 66.7 167 10.088 -0.96564 64.2 190 179 Cr. Gravel 12.5 BRZ 64 160 10.5387 -1.08224 66.7 155 10.088 -0.96564 64.2 179 167 Cr. Gravel 12.5 BRZ 64 170 10.5387 -1.08224 66.7 146 10.088 -0.96564 64.2 169 157 Cr. Gravel 12.5 BRZ 70 120 12.2628 -1.39477 92.2 266 11.5555 -1.2546 85 257 262 Cr. Gravel 12.5 BRZ 70 130 12.2628 -1.39477 92.2 238 11.5555 -1.2546 85 232 235 Cr. Gravel 12.5 BRZ 70 140 12.2628 -1.39477 92.2 215 11.5555 -1.2546 85 212 213 Cr. Gravel 12.5 BRZ 70 150 12.2628 -1.39477 92.2 195 11.5555 -1.2546 85 194 195 Cr. Gravel 12.5 BRZ 70 160 12.2628 -1.39477 92.2 178 11.5555 -1.2546 85 179 179 Cr. Gravel 12.5 BRZ 70 170 12.2628 -1.39477 92.2 164 11.5555 -1.2546 85 166 165 Cr. Gravel 12.5 BRZ 76 120 14.7576 -1.84518 87.2 374 12.42 -1.38405 78.1 328 351 Cr. Gravel 12.5 BRZ 76 130 14.7576 -1.84518 87.2 323 12.42 -1.38405 78.1 294 308 Cr. Gravel 12.5 BRZ 76 140 14.7576 -1.84518 87.2 281 12.42 -1.38405 78.1 265 273 Cr. Gravel 12.5 BRZ 76 150 14.7576 -1.84518 87.2 248 12.42 -1.38405 78.1 241 244 Cr. Gravel 12.5 BRZ 76 160 14.7576 -1.84518 87.2 220 12.42 -1.38405 78.1 220 220 Cr. Gravel 12.5 BRZ 76 170 14.7576 -1.84518 87.2 197 12.42 -1.38405 78.1 203 200
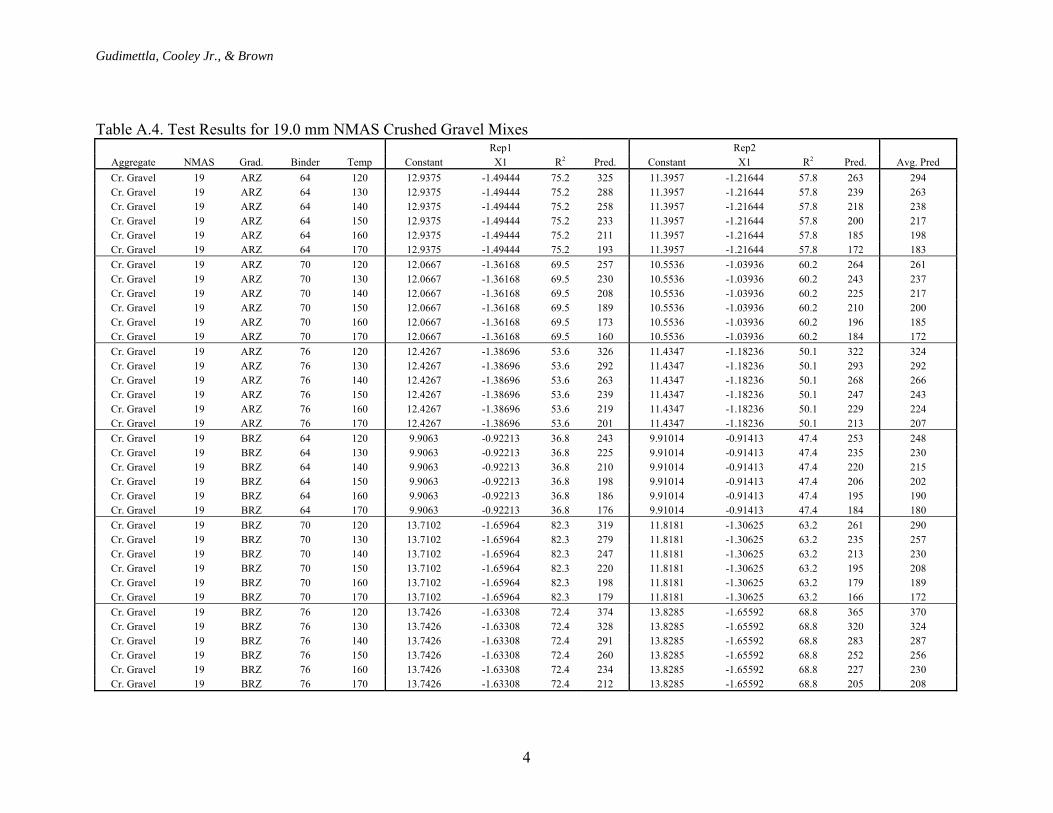
Gudimettla, Cooley Jr., & Brown
4
Table A.4. Test Results for 19.0 mm NMAS Crushed Gravel Mixes Rep1 Rep2
Aggregate NMAS Grad. Binder Temp Constant X1 R2 Pred. Constant X1 R2 Pred. Avg. Pred Cr. Gravel 19 ARZ 64 120 12.9375 -1.49444 75.2 325 11.3957 -1.21644 57.8 263 294 Cr. Gravel 19 ARZ 64 130 12.9375 -1.49444 75.2 288 11.3957 -1.21644 57.8 239 263 Cr. Gravel 19 ARZ 64 140 12.9375 -1.49444 75.2 258 11.3957 -1.21644 57.8 218 238 Cr. Gravel 19 ARZ 64 150 12.9375 -1.49444 75.2 233 11.3957 -1.21644 57.8 200 217 Cr. Gravel 19 ARZ 64 160 12.9375 -1.49444 75.2 211 11.3957 -1.21644 57.8 185 198 Cr. Gravel 19 ARZ 64 170 12.9375 -1.49444 75.2 193 11.3957 -1.21644 57.8 172 183 Cr. Gravel 19 ARZ 70 120 12.0667 -1.36168 69.5 257 10.5536 -1.03936 60.2 264 261 Cr. Gravel 19 ARZ 70 130 12.0667 -1.36168 69.5 230 10.5536 -1.03936 60.2 243 237 Cr. Gravel 19 ARZ 70 140 12.0667 -1.36168 69.5 208 10.5536 -1.03936 60.2 225 217 Cr. Gravel 19 ARZ 70 150 12.0667 -1.36168 69.5 189 10.5536 -1.03936 60.2 210 200 Cr. Gravel 19 ARZ 70 160 12.0667 -1.36168 69.5 173 10.5536 -1.03936 60.2 196 185 Cr. Gravel 19 ARZ 70 170 12.0667 -1.36168 69.5 160 10.5536 -1.03936 60.2 184 172 Cr. Gravel 19 ARZ 76 120 12.4267 -1.38696 53.6 326 11.4347 -1.18236 50.1 322 324 Cr. Gravel 19 ARZ 76 130 12.4267 -1.38696 53.6 292 11.4347 -1.18236 50.1 293 292 Cr. Gravel 19 ARZ 76 140 12.4267 -1.38696 53.6 263 11.4347 -1.18236 50.1 268 266 Cr. Gravel 19 ARZ 76 150 12.4267 -1.38696 53.6 239 11.4347 -1.18236 50.1 247 243 Cr. Gravel 19 ARZ 76 160 12.4267 -1.38696 53.6 219 11.4347 -1.18236 50.1 229 224 Cr. Gravel 19 ARZ 76 170 12.4267 -1.38696 53.6 201 11.4347 -1.18236 50.1 213 207 Cr. Gravel 19 BRZ 64 120 9.9063 -0.92213 36.8 243 9.91014 -0.91413 47.4 253 248 Cr. Gravel 19 BRZ 64 130 9.9063 -0.92213 36.8 225 9.91014 -0.91413 47.4 235 230 Cr. Gravel 19 BRZ 64 140 9.9063 -0.92213 36.8 210 9.91014 -0.91413 47.4 220 215 Cr. Gravel 19 BRZ 64 150 9.9063 -0.92213 36.8 198 9.91014 -0.91413 47.4 206 202 Cr. Gravel 19 BRZ 64 160 9.9063 -0.92213 36.8 186 9.91014 -0.91413 47.4 195 190 Cr. Gravel 19 BRZ 64 170 9.9063 -0.92213 36.8 176 9.91014 -0.91413 47.4 184 180 Cr. Gravel 19 BRZ 70 120 13.7102 -1.65964 82.3 319 11.8181 -1.30625 63.2 261 290 Cr. Gravel 19 BRZ 70 130 13.7102 -1.65964 82.3 279 11.8181 -1.30625 63.2 235 257 Cr. Gravel 19 BRZ 70 140 13.7102 -1.65964 82.3 247 11.8181 -1.30625 63.2 213 230 Cr. Gravel 19 BRZ 70 150 13.7102 -1.65964 82.3 220 11.8181 -1.30625 63.2 195 208 Cr. Gravel 19 BRZ 70 160 13.7102 -1.65964 82.3 198 11.8181 -1.30625 63.2 179 189 Cr. Gravel 19 BRZ 70 170 13.7102 -1.65964 82.3 179 11.8181 -1.30625 63.2 166 172 Cr. Gravel 19 BRZ 76 120 13.7426 -1.63308 72.4 374 13.8285 -1.65592 68.8 365 370 Cr. Gravel 19 BRZ 76 130 13.7426 -1.63308 72.4 328 13.8285 -1.65592 68.8 320 324 Cr. Gravel 19 BRZ 76 140 13.7426 -1.63308 72.4 291 13.8285 -1.65592 68.8 283 287 Cr. Gravel 19 BRZ 76 150 13.7426 -1.63308 72.4 260 13.8285 -1.65592 68.8 252 256 Cr. Gravel 19 BRZ 76 160 13.7426 -1.63308 72.4 234 13.8285 -1.65592 68.8 227 230 Cr. Gravel 19 BRZ 76 170 13.7426 -1.63308 72.4 212 13.8285 -1.65592 68.8 205 208
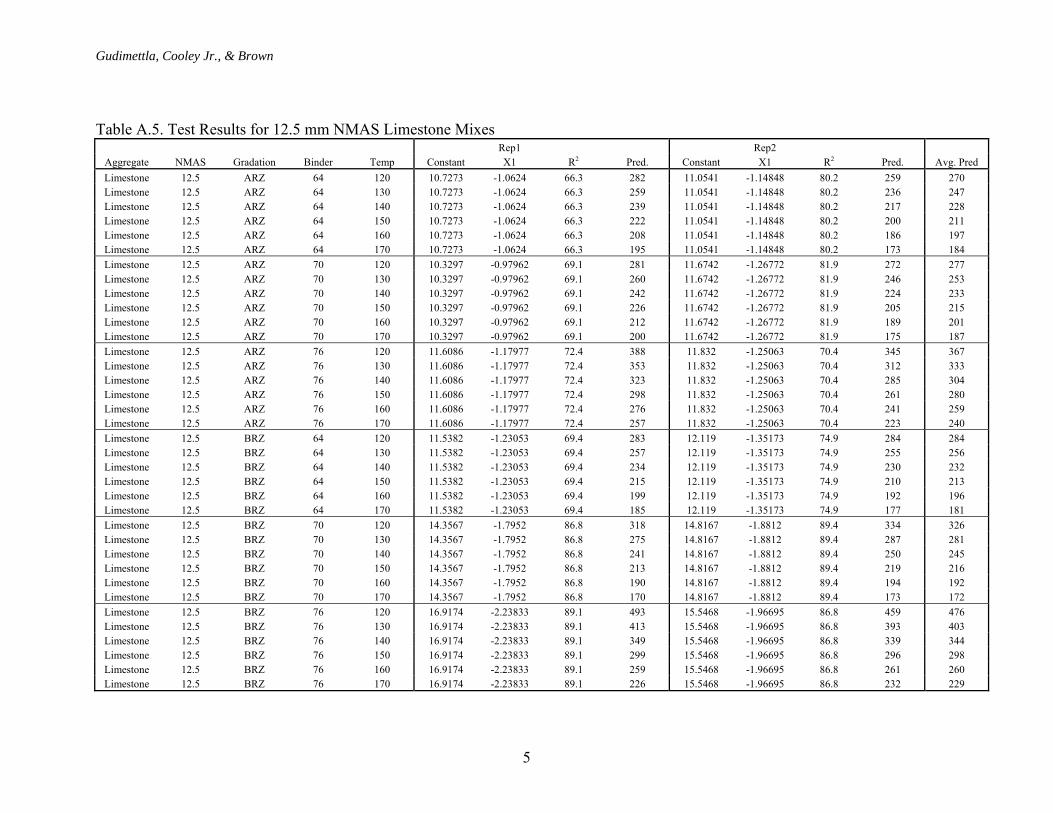
Gudimettla, Cooley Jr., & Brown
5
Table A.5. Test Results for 12.5 mm NMAS Limestone Mixes Rep1 Rep2
Aggregate NMAS Gradation Binder Temp Constant X1 R2 Pred. Constant X1 R2 Pred. Avg. Pred Limestone 12.5 ARZ 64 120 10.7273 -1.0624 66.3 282 11.0541 -1.14848 80.2 259 270 Limestone 12.5 ARZ 64 130 10.7273 -1.0624 66.3 259 11.0541 -1.14848 80.2 236 247 Limestone 12.5 ARZ 64 140 10.7273 -1.0624 66.3 239 11.0541 -1.14848 80.2 217 228 Limestone 12.5 ARZ 64 150 10.7273 -1.0624 66.3 222 11.0541 -1.14848 80.2 200 211 Limestone 12.5 ARZ 64 160 10.7273 -1.0624 66.3 208 11.0541 -1.14848 80.2 186 197 Limestone 12.5 ARZ 64 170 10.7273 -1.0624 66.3 195 11.0541 -1.14848 80.2 173 184 Limestone 12.5 ARZ 70 120 10.3297 -0.97962 69.1 281 11.6742 -1.26772 81.9 272 277 Limestone 12.5 ARZ 70 130 10.3297 -0.97962 69.1 260 11.6742 -1.26772 81.9 246 253 Limestone 12.5 ARZ 70 140 10.3297 -0.97962 69.1 242 11.6742 -1.26772 81.9 224 233 Limestone 12.5 ARZ 70 150 10.3297 -0.97962 69.1 226 11.6742 -1.26772 81.9 205 215 Limestone 12.5 ARZ 70 160 10.3297 -0.97962 69.1 212 11.6742 -1.26772 81.9 189 201 Limestone 12.5 ARZ 70 170 10.3297 -0.97962 69.1 200 11.6742 -1.26772 81.9 175 187 Limestone 12.5 ARZ 76 120 11.6086 -1.17977 72.4 388 11.832 -1.25063 70.4 345 367 Limestone 12.5 ARZ 76 130 11.6086 -1.17977 72.4 353 11.832 -1.25063 70.4 312 333 Limestone 12.5 ARZ 76 140 11.6086 -1.17977 72.4 323 11.832 -1.25063 70.4 285 304 Limestone 12.5 ARZ 76 150 11.6086 -1.17977 72.4 298 11.832 -1.25063 70.4 261 280 Limestone 12.5 ARZ 76 160 11.6086 -1.17977 72.4 276 11.832 -1.25063 70.4 241 259 Limestone 12.5 ARZ 76 170 11.6086 -1.17977 72.4 257 11.832 -1.25063 70.4 223 240 Limestone 12.5 BRZ 64 120 11.5382 -1.23053 69.4 283 12.119 -1.35173 74.9 284 284 Limestone 12.5 BRZ 64 130 11.5382 -1.23053 69.4 257 12.119 -1.35173 74.9 255 256 Limestone 12.5 BRZ 64 140 11.5382 -1.23053 69.4 234 12.119 -1.35173 74.9 230 232 Limestone 12.5 BRZ 64 150 11.5382 -1.23053 69.4 215 12.119 -1.35173 74.9 210 213 Limestone 12.5 BRZ 64 160 11.5382 -1.23053 69.4 199 12.119 -1.35173 74.9 192 196 Limestone 12.5 BRZ 64 170 11.5382 -1.23053 69.4 185 12.119 -1.35173 74.9 177 181 Limestone 12.5 BRZ 70 120 14.3567 -1.7952 86.8 318 14.8167 -1.8812 89.4 334 326 Limestone 12.5 BRZ 70 130 14.3567 -1.7952 86.8 275 14.8167 -1.8812 89.4 287 281 Limestone 12.5 BRZ 70 140 14.3567 -1.7952 86.8 241 14.8167 -1.8812 89.4 250 245 Limestone 12.5 BRZ 70 150 14.3567 -1.7952 86.8 213 14.8167 -1.8812 89.4 219 216 Limestone 12.5 BRZ 70 160 14.3567 -1.7952 86.8 190 14.8167 -1.8812 89.4 194 192 Limestone 12.5 BRZ 70 170 14.3567 -1.7952 86.8 170 14.8167 -1.8812 89.4 173 172 Limestone 12.5 BRZ 76 120 16.9174 -2.23833 89.1 493 15.5468 -1.96695 86.8 459 476 Limestone 12.5 BRZ 76 130 16.9174 -2.23833 89.1 413 15.5468 -1.96695 86.8 393 403 Limestone 12.5 BRZ 76 140 16.9174 -2.23833 89.1 349 15.5468 -1.96695 86.8 339 344 Limestone 12.5 BRZ 76 150 16.9174 -2.23833 89.1 299 15.5468 -1.96695 86.8 296 298 Limestone 12.5 BRZ 76 160 16.9174 -2.23833 89.1 259 15.5468 -1.96695 86.8 261 260 Limestone 12.5 BRZ 76 170 16.9174 -2.23833 89.1 226 15.5468 -1.96695 86.8 232 229
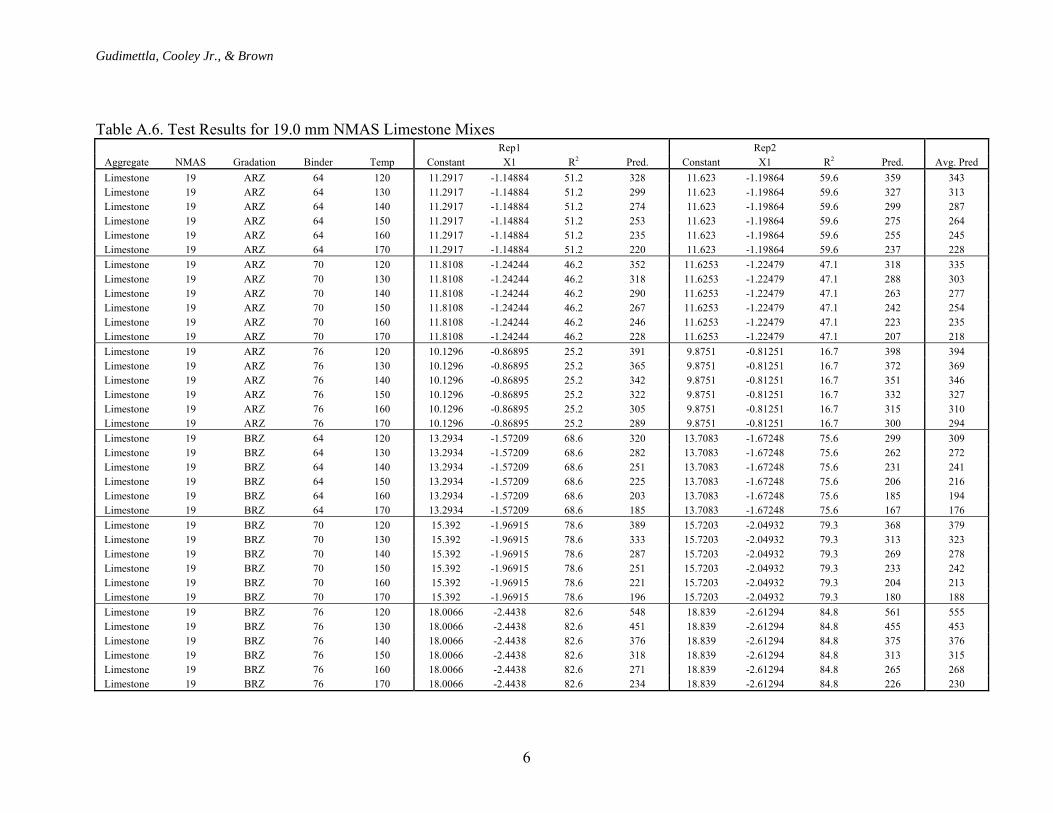
Gudimettla, Cooley Jr., & Brown
6
Table A.6. Test Results for 19.0 mm NMAS Limestone Mixes Rep1 Rep2
Aggregate NMAS Gradation Binder Temp Constant X1 R2 Pred. Constant X1 R2 Pred. Avg. Pred Limestone 19 ARZ 64 120 11.2917 -1.14884 51.2 328 11.623 -1.19864 59.6 359 343 Limestone 19 ARZ 64 130 11.2917 -1.14884 51.2 299 11.623 -1.19864 59.6 327 313 Limestone 19 ARZ 64 140 11.2917 -1.14884 51.2 274 11.623 -1.19864 59.6 299 287 Limestone 19 ARZ 64 150 11.2917 -1.14884 51.2 253 11.623 -1.19864 59.6 275 264 Limestone 19 ARZ 64 160 11.2917 -1.14884 51.2 235 11.623 -1.19864 59.6 255 245 Limestone 19 ARZ 64 170 11.2917 -1.14884 51.2 220 11.623 -1.19864 59.6 237 228 Limestone 19 ARZ 70 120 11.8108 -1.24244 46.2 352 11.6253 -1.22479 47.1 318 335 Limestone 19 ARZ 70 130 11.8108 -1.24244 46.2 318 11.6253 -1.22479 47.1 288 303 Limestone 19 ARZ 70 140 11.8108 -1.24244 46.2 290 11.6253 -1.22479 47.1 263 277 Limestone 19 ARZ 70 150 11.8108 -1.24244 46.2 267 11.6253 -1.22479 47.1 242 254 Limestone 19 ARZ 70 160 11.8108 -1.24244 46.2 246 11.6253 -1.22479 47.1 223 235 Limestone 19 ARZ 70 170 11.8108 -1.24244 46.2 228 11.6253 -1.22479 47.1 207 218 Limestone 19 ARZ 76 120 10.1296 -0.86895 25.2 391 9.8751 -0.81251 16.7 398 394 Limestone 19 ARZ 76 130 10.1296 -0.86895 25.2 365 9.8751 -0.81251 16.7 372 369 Limestone 19 ARZ 76 140 10.1296 -0.86895 25.2 342 9.8751 -0.81251 16.7 351 346 Limestone 19 ARZ 76 150 10.1296 -0.86895 25.2 322 9.8751 -0.81251 16.7 332 327 Limestone 19 ARZ 76 160 10.1296 -0.86895 25.2 305 9.8751 -0.81251 16.7 315 310 Limestone 19 ARZ 76 170 10.1296 -0.86895 25.2 289 9.8751 -0.81251 16.7 300 294 Limestone 19 BRZ 64 120 13.2934 -1.57209 68.6 320 13.7083 -1.67248 75.6 299 309 Limestone 19 BRZ 64 130 13.2934 -1.57209 68.6 282 13.7083 -1.67248 75.6 262 272 Limestone 19 BRZ 64 140 13.2934 -1.57209 68.6 251 13.7083 -1.67248 75.6 231 241 Limestone 19 BRZ 64 150 13.2934 -1.57209 68.6 225 13.7083 -1.67248 75.6 206 216 Limestone 19 BRZ 64 160 13.2934 -1.57209 68.6 203 13.7083 -1.67248 75.6 185 194 Limestone 19 BRZ 64 170 13.2934 -1.57209 68.6 185 13.7083 -1.67248 75.6 167 176 Limestone 19 BRZ 70 120 15.392 -1.96915 78.6 389 15.7203 -2.04932 79.3 368 379 Limestone 19 BRZ 70 130 15.392 -1.96915 78.6 333 15.7203 -2.04932 79.3 313 323 Limestone 19 BRZ 70 140 15.392 -1.96915 78.6 287 15.7203 -2.04932 79.3 269 278 Limestone 19 BRZ 70 150 15.392 -1.96915 78.6 251 15.7203 -2.04932 79.3 233 242 Limestone 19 BRZ 70 160 15.392 -1.96915 78.6 221 15.7203 -2.04932 79.3 204 213 Limestone 19 BRZ 70 170 15.392 -1.96915 78.6 196 15.7203 -2.04932 79.3 180 188 Limestone 19 BRZ 76 120 18.0066 -2.4438 82.6 548 18.839 -2.61294 84.8 561 555 Limestone 19 BRZ 76 130 18.0066 -2.4438 82.6 451 18.839 -2.61294 84.8 455 453 Limestone 19 BRZ 76 140 18.0066 -2.4438 82.6 376 18.839 -2.61294 84.8 375 376 Limestone 19 BRZ 76 150 18.0066 -2.4438 82.6 318 18.839 -2.61294 84.8 313 315 Limestone 19 BRZ 76 160 18.0066 -2.4438 82.6 271 18.839 -2.61294 84.8 265 268 Limestone 19 BRZ 76 170 18.0066 -2.4438 82.6 234 18.839 -2.61294 84.8 226 230

Gudimettla, Cooley Jr., & Brown
7