Embed Size (px)
Citation preview

SHRUTI AGRAWAL
https://www.linkedin.com/in/shrutiagrawal5 [email protected](706)-410-5017
SA
WORK SAMPLE
SA SHRUTI AGRAWAL
https://www.linkedin.com/in/shrutiagrawal5 [email protected](706)-410-5017
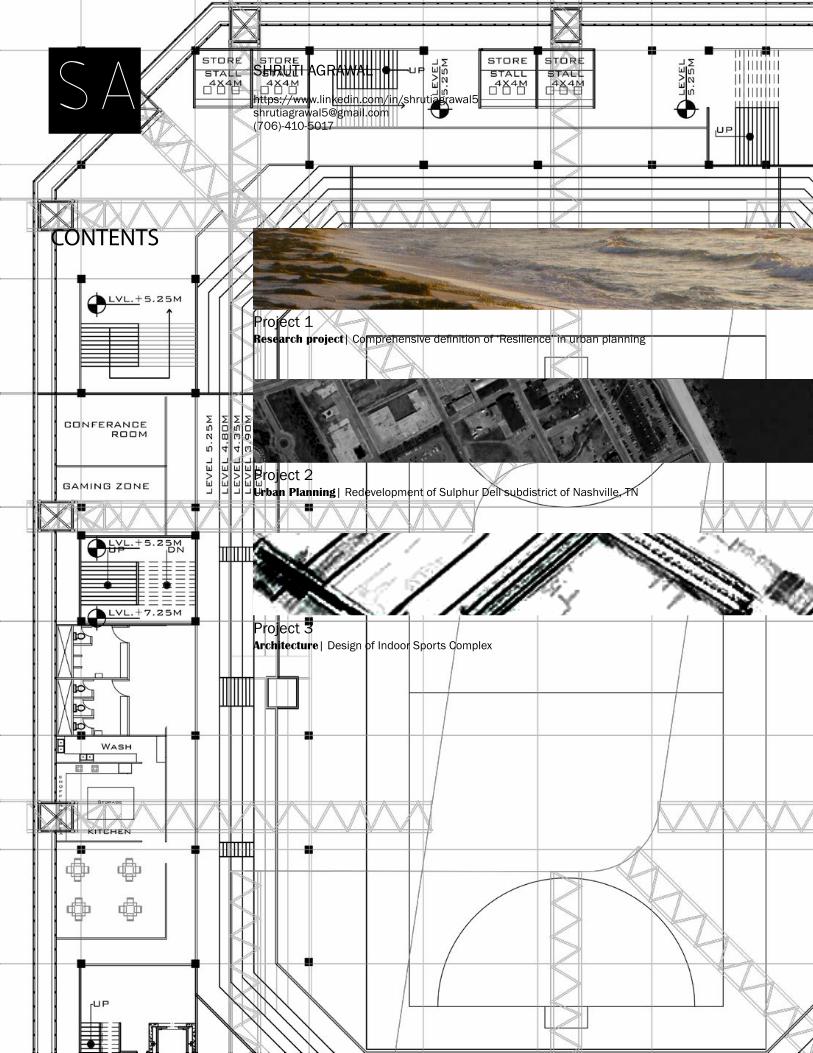
Project 1Research project| Comprehensive definition of ‘Resilience’ in urban planning
Project 2Urban Planning| Redevelopment of Sulphur Dell subdistrict of Nashville, TN
Project 3Architecture| Design of Indoor Sports Complex
CONTENTS
SA SHRUTI AGRAWAL
https://www.linkedin.com/in/shrutiagrawal5 [email protected](706)-410-5017
SKILLS | SOFTWARES: Photography |Photoshop, MS-Excel, In- Design, Arc GIS

SA SHRUTI AGRAWAL
https://www.linkedin.com/in/shrutiagrawal5 [email protected](706)-410-5017
Comprehensive Definition of “Resilience in Urban PlanningThe term resilience has been used in several different disciplines and has now evolved as an umbrella term for addressing global concerns that bring together issues from fields such as climate
science, sociology, anthropology, ecology, economics, etc. The purpose of this study is to identify the factors that de-fine “resilience” in the field of urban planning. It is imper-ative to understand the resilience of factors such as demography, infrastructure, ecology and incorporate these in a comprehensive planning document for it to be useful in times when majority of discourses are centered around concerns such as global climate change. A review of the existing literature on ‘resilience’ helped me identify important factors that are most popularly discussed. This pointed towards the larger discussions that view resilience in relation to these factors and how they are married to urban planning. A resiliency matrix was created centered around all the identified factors and issues. This matrix was then used to assess the performance of a city’s planning documents. For this project I have used this tool to assess the planning documents of the coast-al counties of Georgia and Duval County, Florida and calculated the resilience scores for the same.
The study also helped identify gaps in the existing documents that should be addressed to enhance the disaster risk mitigation efforts of the cities. This tool can be expanded to include more factors and fine-tuned to address concerns of natural disaster mitigation for other cities as well, hence acting as a skeleton tool to build upon on a case-by-case basis.
The illustration (left) shows the resilience score for the coastal counties of Georgia in the field of Ecological resilience, Resilience of Organizational Infrastructure (Planning documents), Resilience of Physical Infrastructure and Demographic Resilience. From the analysis it is clear that in Georgia:• For Ecological Resilience CHATHAM COUNTY has best management plans for ecosystem management• For Resilience of Organizational Infrastructure (i.e. compliance with standard policies), GLYNN COUNTY has done an exceptional job• For Resilience of Physical Infrastructure, CAMDEN COUNTY has very well laid out policies• For Demographic Resilience, CHATHAM COUNTY has great consideration towards people
Also, this analysis can be done for the counties of neighboring states with similar geographical, ecological and physical condi-tions to find better solutions for missing information. In this case it was done for DUVAL COUNTY, Florida and planning solutions were referred from it.
Thus this research can not only help the counties evaluate their own performance but also help finding the best management practice adopted by neighboring counties so that the entire region can progress towards resilience.
50+50+50+50Ecological ResilienceResilience of Organizational Infrastructure
Resilience of Physical InfrastructureDemographic Resilience
76+82+79+7876.5%82%79%78.5%
Chatham County
61+50+52+5050.5%52.5%50%61%
Bryan County
37+55+53+3838.5%53%55.5%37%
Liberty County
32+32+42+3939.5%42%32.5%32%
McIntosh County
68+75+100++545.5%100%75%68%
Glynn County
61+85+79+6767.5%79%85%61%
Camden County
98+94+100++383%100%94%98%
Duval County
Coastal Cities
Population density of Coastal cities
Coastal Counties
Past Hurricane tracks

The construction of the matrix is a simple row and column format with each issue listed as row. The matrix consist of eight columns, of which four stating the informations related to the identified issue. The other four columns are completed by referring to the county’s documents, for validating the availability of the infor-mation. As stated earlier, this matrix is a frame work designed to
SA SHRUTI AGRAWAL
https://www.linkedin.com/in/shrutiagrawal5 [email protected](706)-410-5017
1) Demographic Resilience is defined as resiliency of people and their belongings. The main considerations that can help improving demographic resilience are:•The geographical location of the study area•Understanding and documenting the census data•Existing mitigation strategies adopted for existing populations•Special consideration for critical population
2) Resilience of Organizational Infrastructure are a set of regulatory policies and procedures that act as the framework to support the functioning of a city. These can be categorized under the following subheads to ensure the functioning of city at times of disaster:•Mitigation plans•Preparedness policies•Disaster response plans•Recovery and Reconstruction plan
3) Resilience of Physical Infrastructure is defined as resiliency of an actual built environment, as damage to these can cause major economic impact. The following are the categories for identified issues:•Understanding the nature of natural event•Identification of Critical infrastructures•Regulations for standardizing and maintaining the critical infrastructure
4) Ecological Resilience is defined as resiliency of natural buffer in the form of green space and ecosystem , available in the area. The matrix was crafted under following considerations:•Understanding the type of ecosystem in the area•Measuring the climate change in the area•Understating the effects of climate change•Policies to prevent and protect further modification in the natural ecosystem
The ‘Resilience Matrix’address the minimum basic elements that can contribute in a resil-ience plan of a county. Some additional information can be added specific to a disaster type, to modify this matrix for a particular area. This give a flexibilty to adopt this matrix for verifying the plan-ning documents of any city irrespective of their location.
MAIN CONSIDERATIONS FOR UNDERSTANDING FACTORS OF RESILIENCE:
SAMPLE OF RESILIENCE MATRIX:
Issues of Demographic Resilience
Measurement value
Planning document of citySource of
informationPossible sources for
data availabilityDocuments
referredAddressed Not AddressedNeeds an update
1) Geographical location
a) Location Proximity USGA Geological (Lall & Deich-
b) Type of natural disaster
Intensity of the disaster type
National Weather Services- For hurri-cane path (OECD, 2003)
c) Estimated boundary or destruction by natural disaster
Path of hurri-cane or Area under sea level rise
National Weather Service/ National Hurricane Center (OECD, 2003)
As the resilience matrix consist of four sections and each section has a long list of issues addressed under each category, this is just an example of construction of the matrix. If intrested the complete matrix can be discussed in person.

SA SHRUTI AGRAWAL
https://www.linkedin.com/in/shrutiagrawal5 [email protected](706)-410-5017
SKILLS | SOFTWARES: Hand Graphics |Arc GIS, 3ds Max, Auto CAD, In- Design Adobe Photoshop
SA SHRUTI AGRAWAL
https://www.linkedin.com/in/shrutiagrawal5 [email protected](706)-410-5017
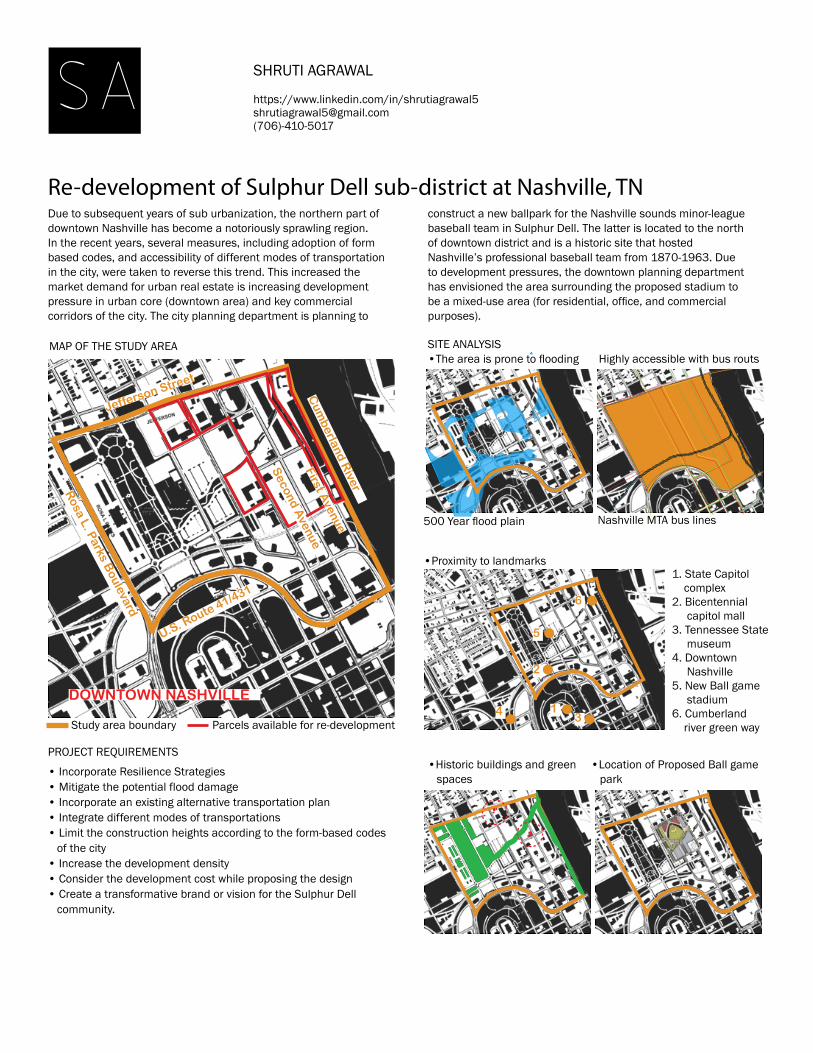
Due to subsequent years of sub urbanization, the northern part of downtown Nashville has become a notoriously sprawling region. In the recent years, several measures, including adoption of form based codes, and accessibility of different modes of transportation in the city, were taken to reverse this trend. This increased the market demand for urban real estate is increasing development pressure in urban core (downtown area) and key commercial corridors of the city. The city planning department is planning to
construct a new ballpark for the Nashville sounds minor-league baseball team in Sulphur Dell. The latter is located to the north of downtown district and is a historic site that hosted Nashville’s professional baseball team from 1870-1963. Due to development pressures, the downtown planning department has envisioned the area surrounding the proposed stadium to be a mixed-use area (for residential, office, and commercial purposes).
•Historic buildings and green spaces
•Highly accessible with bus routs
•Location of Proposed Ball game park
•Proximity to landmarks
SITE ANALYSISMAP OF THE STUDY AREA
PROJECT REQUIREMENTS
Re-development of Sulphur Dell sub-district at Nashville, TN
•The area is prone to flooding
U.S. Route 41/431
Jefferson Street
Rosa L. Parks B
oulevard
Cum
berland River
DOWNTOWN NASHVILLE
500 Year flood plain Nashville MTA bus lines
1. State Capitol complex2. Bicentennial capitol mall3. Tennessee State museum4. Downtown Nashville5. New Ball game stadium6. Cumberland river green way
1
2
34
5
6
• Incorporate Resilience Strategies• Mitigate the potential flood damage • Incorporate an existing alternative transportation plan• Integrate different modes of transportations• Limit the construction heights according to the form-based codes of the city • Increase the development density • Consider the development cost while proposing the design• Create a transformative brand or vision for the Sulphur Dell community.
Study area boundary Parcels available for re-development
First Avenue
Second A
venue
SA SHRUTI AGRAWAL
https://www.linkedin.com/in/shrutiagrawal5 [email protected](706)-410-5017
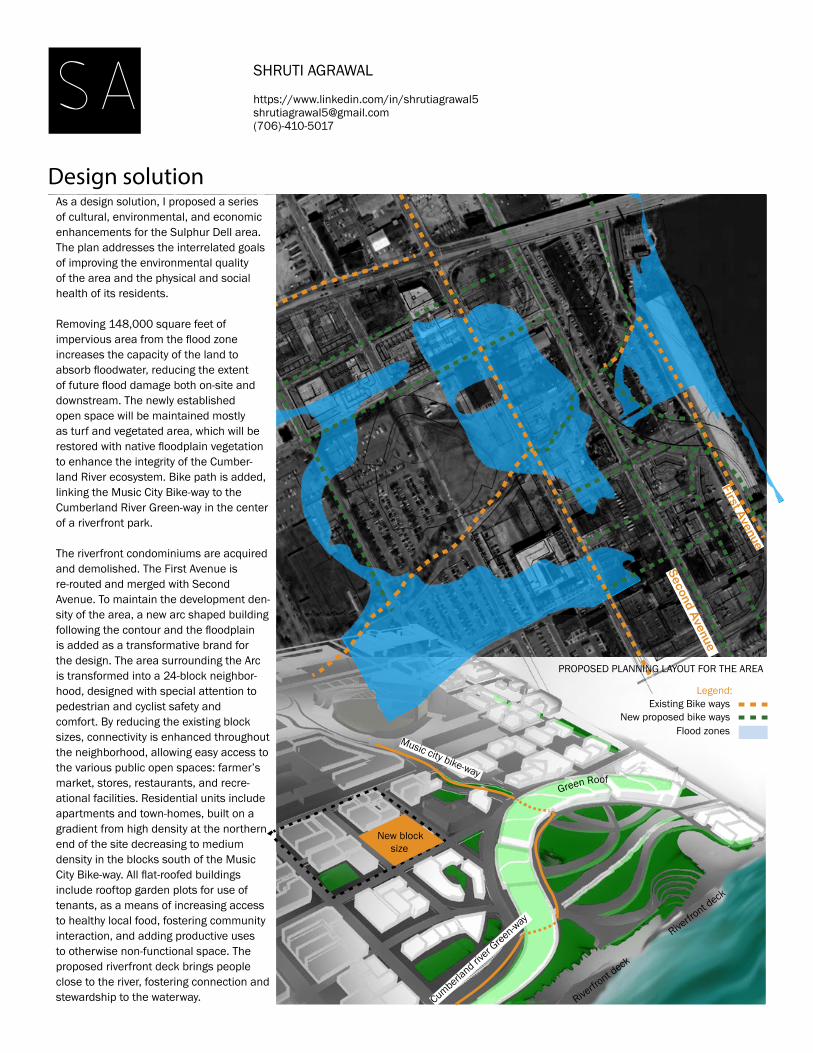
Design solutionAs a design solution, I proposed a series of cultural, environmental, and economic enhancements for the Sulphur Dell area. The plan addresses the interrelated goals of improving the environmental qualityof the area and the physical and social health of its residents.
Removing 148,000 square feet of impervious area from the flood zone increases the capacity of the land to absorb floodwater, reducing the extent of future flood damage both on-site and downstream. The newly established open space will be maintained mostly as turf and vegetated area, which will be restored with native floodplain vegetation to enhance the integrity of the Cumber-land River ecosystem. Bike path is added, linking the Music City Bike-way to the Cumberland River Green-way in the center of a riverfront park.
The riverfront condominiums are acquired and demolished. The First Avenue is re-routed and merged with Second Avenue. To maintain the development den-sity of the area, a new arc shaped building following the contour and the floodplain is added as a transformative brand for the design. The area surrounding the Arc is transformed into a 24-block neighbor-hood, designed with special attention to pedestrian and cyclist safety and comfort. By reducing the existing block sizes, connectivity is enhanced throughout the neighborhood, allowing easy access to the various public open spaces: farmer’s market, stores, restaurants, and recre-ational facilities. Residential units include apartments and town-homes, built on a gradient from high density at the northern end of the site decreasing to medium density in the blocks south of the Music City Bike-way. All flat-roofed buildings include rooftop garden plots for use of tenants, as a means of increasing access to healthy local food, fostering community interaction, and adding productive uses to otherwise non-functional space. The proposed riverfront deck brings people close to the river, fostering connection and stewardship to the waterway.
Music city bike-way
Cumberland riv
er Green-way
Legend:
New block size
Existing Bike waysNew proposed bike ways
Flood zones
Green Roof
Riverfro
nt deck
Riverfro
nt deck
PROPOSED PLANNING LAYOUT FOR THE AREA
First Avenue
Second A
venue

SA SHRUTI AGRAWAL
https://www.linkedin.com/in/shrutiagrawal5 [email protected](706)-410-5017
SKILLS |SOFTWARES: Physical Model Making, | Auto-CAD, 3ds Max, In-Design Hand Graphics Adobe Photoshop
SA
Stadium 1
HotelsPractice Courts
Club houseMedia RoomsPractice CourtsGym and Pool
Stadium 2
Stadium 3Administration/ Visitor center
SHRUTI AGRAWAL
https://www.linkedin.com/in/shrutiagrawal5 [email protected](706)-410-5017
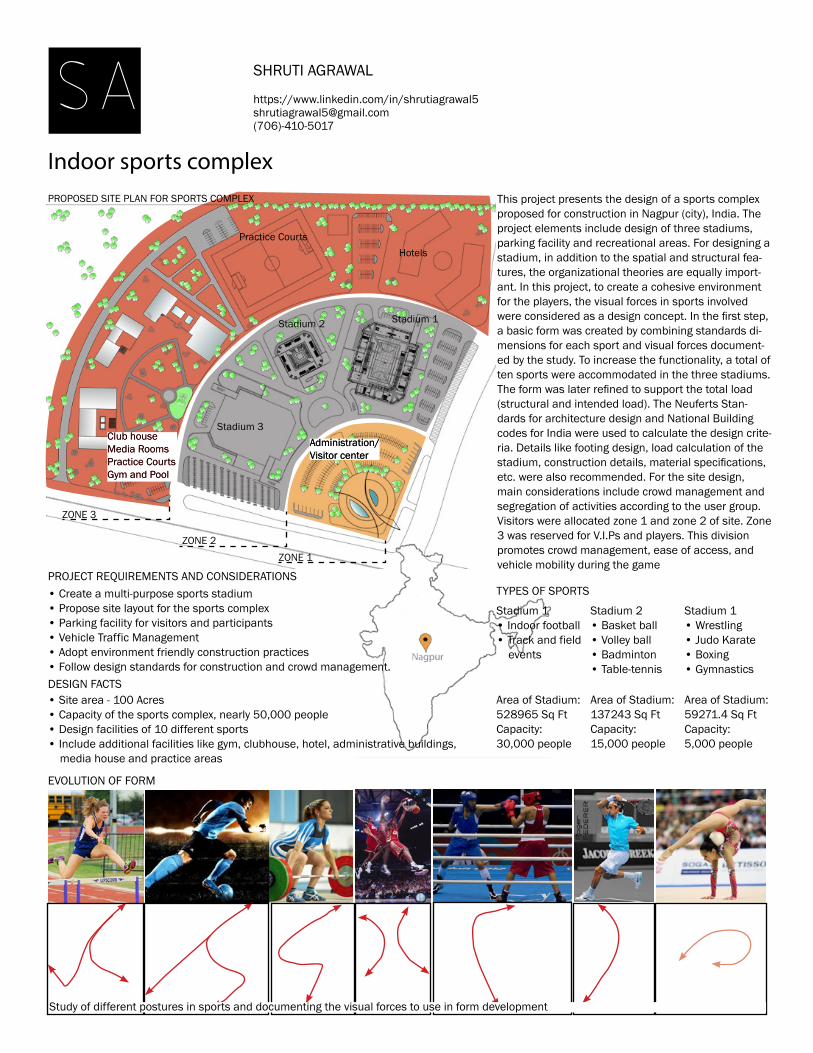
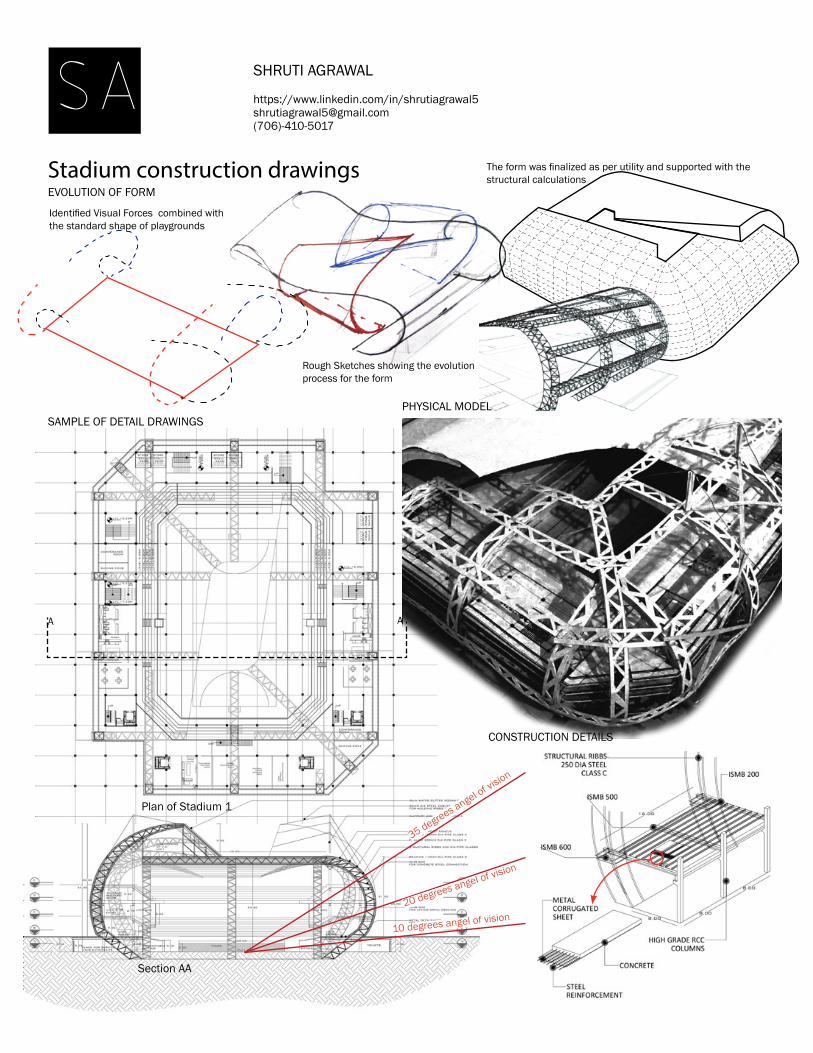
Indoor sports complexThis project presents the design of a sports complex proposed for construction in Nagpur (city), India. The project elements include design of three stadiums, parking facility and recreational areas. For designing a stadium, in addition to the spatial and structural fea-tures, the organizational theories are equally import-ant. In this project, to create a cohesive environment for the players, the visual forces in sports involved were considered as a design concept. In the first step, a basic form was created by combining standards di-mensions for each sport and visual forces document-ed by the study. To increase the functionality, a total of ten sports were accommodated in the three stadiums. The form was later refined to support the total load (structural and intended load). The Neuferts Stan-dards for architecture design and National Building codes for India were used to calculate the design crite-ria. Details like footing design, load calculation of the stadium, construction details, material specifications, etc. were also recommended. For the site design, main considerations include crowd management and segregation of activities according to the user group. Visitors were allocated zone 1 and zone 2 of site. Zone 3 was reserved for V.I.Ps and players. This division promotes crowd management, ease of access, and vehicle mobility during the game
Stadium 1• Indoor football• Track and field events
Area of Stadium:528965 Sq FtCapacity:30,000 people
Stadium 2• Basket ball• Volley ball• Badminton• Table-tennis
Area of Stadium:137243 Sq FtCapacity:15,000 people
Stadium 1• Wrestling• Judo Karate• Boxing• Gymnastics
Area of Stadium:59271.4 Sq FtCapacity:5,000 people
PROJECT REQUIREMENTS AND CONSIDERATIONS
DESIGN FACTS
EVOLUTION OF FORM
TYPES OF SPORTS• Create a multi-purpose sports stadium• Propose site layout for the sports complex• Parking facility for visitors and participants• Vehicle Traffic Management• Adopt environment friendly construction practices• Follow design standards for construction and crowd management.
• Site area - 100 Acres• Capacity of the sports complex, nearly 50,000 people• Design facilities of 10 different sports• Include additional facilities like gym, clubhouse, hotel, administrative buildings, media house and practice areas
PROPOSED SITE PLAN FOR SPORTS COMPLEX
Study of different postures in sports and documenting the visual forces to use in form development
Club houseMedia RoomsPractice CourtsGym and Pool
Administration/ Visitor center
ZONE 3
ZONE 2ZONE 1
SA SHRUTI AGRAWAL
https://www.linkedin.com/in/shrutiagrawal5 [email protected](706)-410-5017
Stadium construction drawingsEVOLUTION OF FORM
SAMPLE OF DETAIL DRAWINGSPHYSICAL MODEL
CONSTRUCTION DETAILS
Plan of Stadium 1
Section AA
Identified Visual Forces combined with the standard shape of playgrounds
Rough Sketches showing the evolution process for the form
The form was finalized as per utility and supported with the structural calculations
10 degrees angel of vision20 degrees angel of vision
35 degrees angel of vision
A A


![Thesis Agrawal[1]](https://img.pdfslide.us/doc/110x75/545abd35b1af9f39378b5eba/thesis-agrawal1.jpg)